Embed Size (px)
Citation preview

Bio Pharma Manufacturing in the Scottish Central BeltA cost/quality comparison(Based on information from the Financial Times fDi Benchmark tool – June 2011.)
Competitiveness of Scottish Central Belt
Value for Money
Overall Attractiveness
Quality of the Location
Annual Operating Costs
Quality Competitiveness
General Business Environment
Labour Availability and Quality
Presence of an Industrial Cluster
Infrastructure and Accessibility
Living Environment
Contents
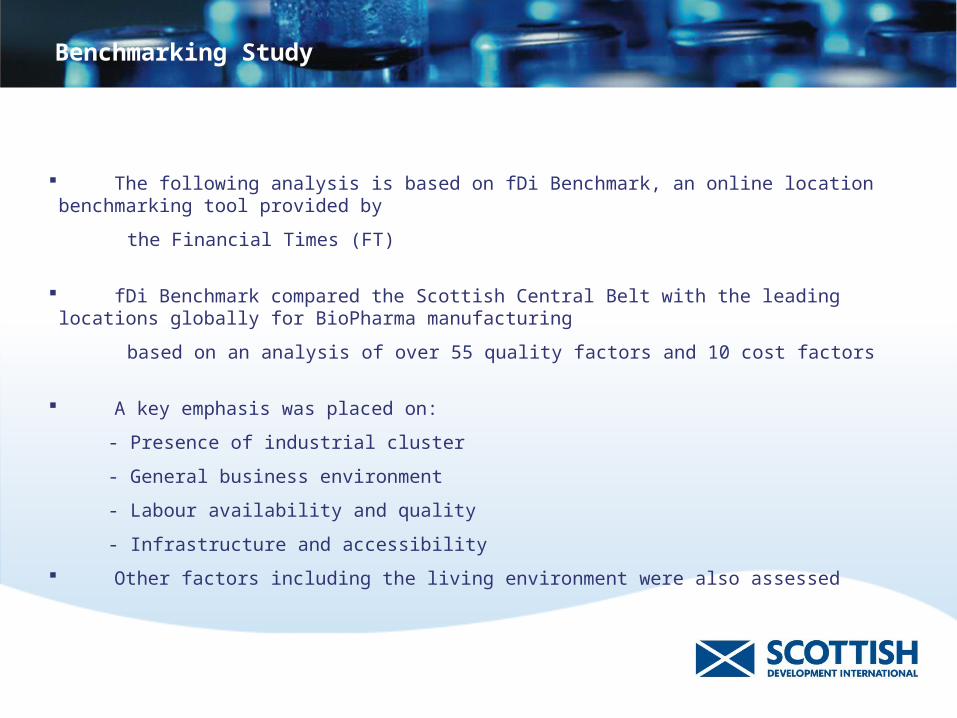
The following analysis is based on fDi Benchmark, an online location benchmarking tool provided by
the Financial Times (FT)
fDi Benchmark compared the Scottish Central Belt with the leading locations globally for BioPharma manufacturing
based on an analysis of over 55 quality factors and 10 cost factors
A key emphasis was placed on:
- Presence of industrial cluster
- General business environment
- Labour availability and quality
- Infrastructure and accessibility
Other factors including the living environment were also assessed
Benchmarking Study
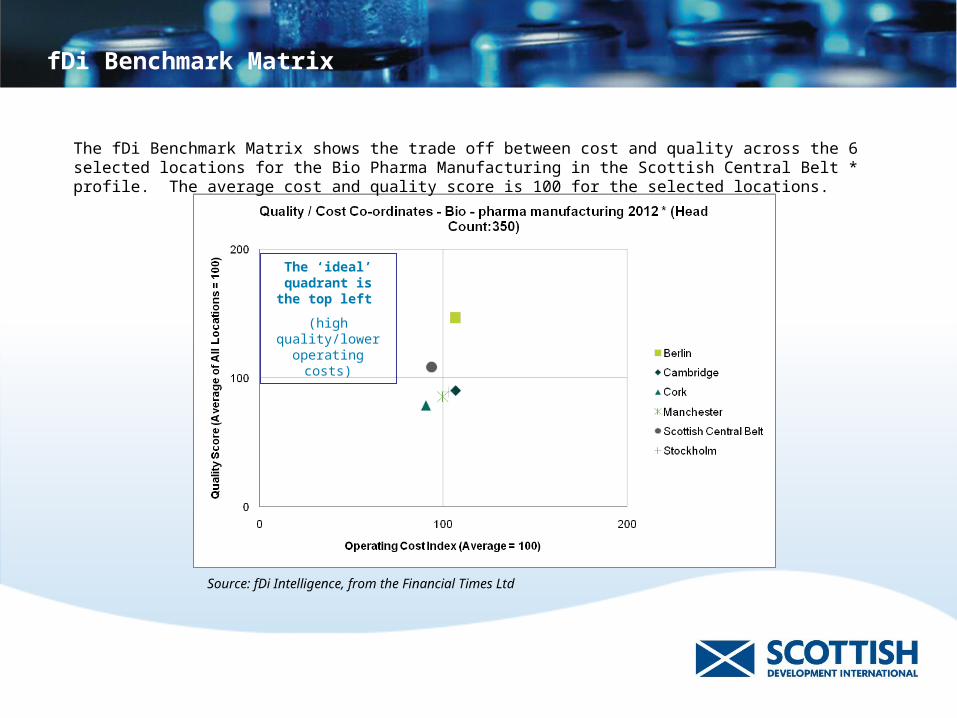
fDi Benchmark Matrix
The fDi Benchmark Matrix shows the trade off between cost and quality across the 6 selected locations for the Bio Pharma Manufacturing in the Scottish Central Belt * profile. The average cost and quality score is 100 for the selected locations.
The ‘ideal’ quadrant is the
top left
(high quality/lower operating costs)
Source: fDi Intelligence, from the Financial Times Ltd
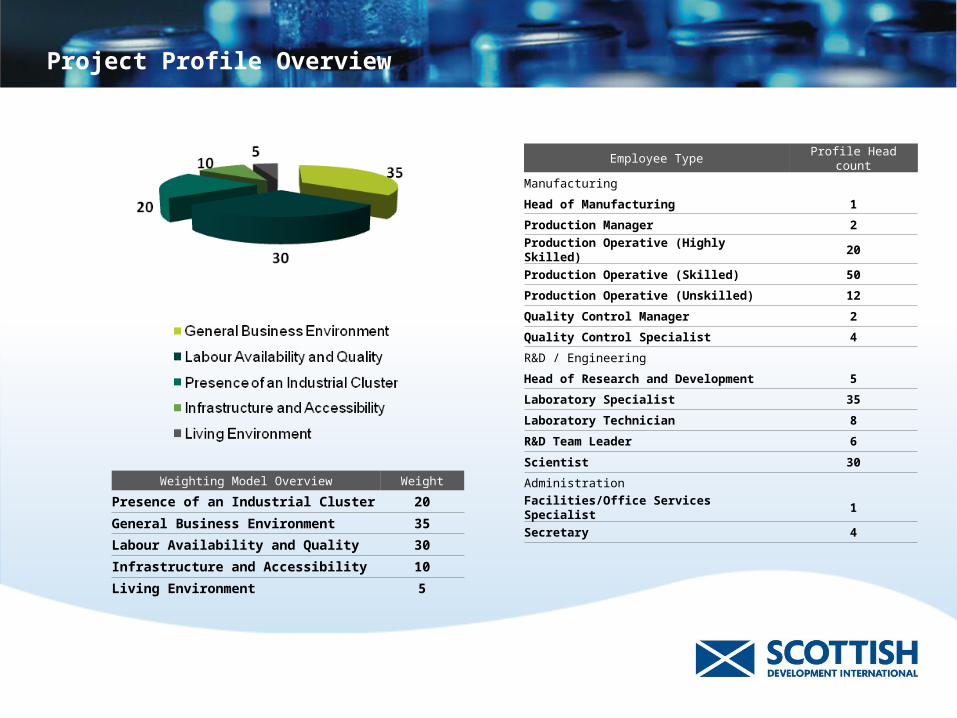
Project Profile Overview
Employee Type Profile Head count
Manufacturing
Head of Manufacturing 1
Production Manager 2
Production Operative (Highly Skilled) 20
Production Operative (Skilled) 50
Production Operative (Unskilled) 12
Quality Control Manager 2
Quality Control Specialist 4
R&D / Engineering
Head of Research and Development 5
Laboratory Specialist 35
Laboratory Technician 8
R&D Team Leader 6
Scientist 30
Administration
Facilities/Office Services Specialist 1
Secretary 4
Weighting Model Overview Weight
Presence of an Industrial Cluster 20
General Business Environment 35
Labour Availability and Quality 30
Infrastructure and Accessibility 10
Living Environment 5
fDi Benchmark Matrix
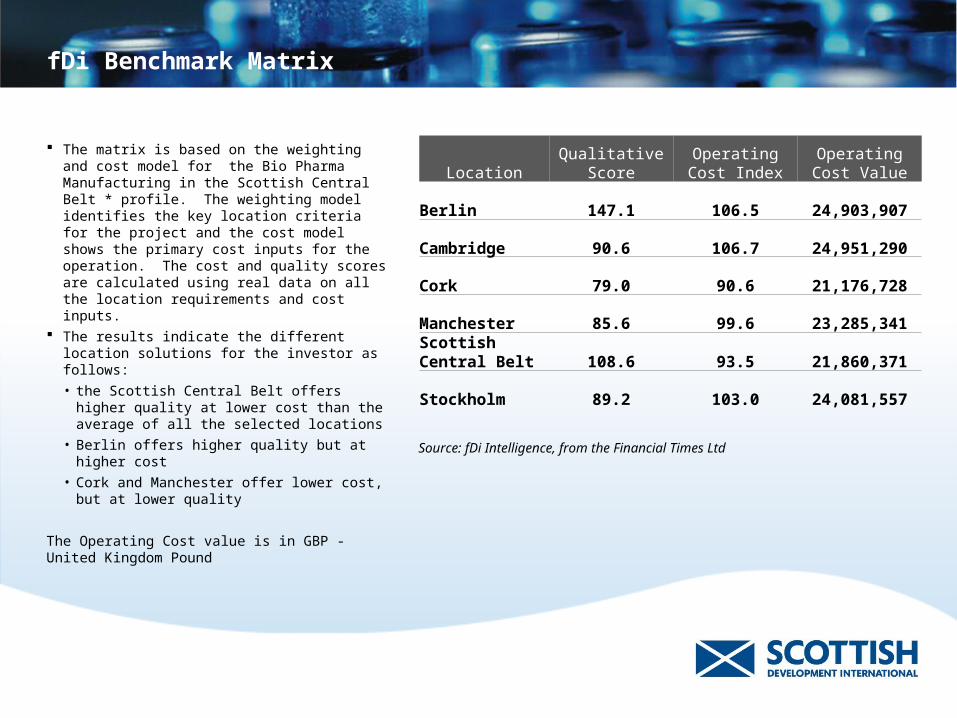
The matrix is based on the weighting and cost model for the Bio Pharma Manufacturing in the Scottish Central Belt * profile. The weighting model identifies the key location criteria for the project and the cost model shows the primary cost inputs for the operation. The cost and quality scores are calculated using real data on all the location requirements and cost inputs.
The results indicate the different location solutions for the investor as follows:
• the Scottish Central Belt offers higher quality at lower cost than the average of all the selected locations
• Berlin offers higher quality but at higher cost
• Cork and Manchester offer lower cost, but at lower quality
The Operating Cost value is in GBP - United Kingdom Pound
Location Qualitative ScoreOperating Cost
IndexOperating Cost
Value
Berlin 147.1 106.5 24,903,907
Cambridge 90.6 106.7 24,951,290
Cork 79.0 90.6 21,176,728
Manchester 85.6 99.6 23,285,341Scottish Central Belt 108.6 93.5 21,860,371
Stockholm 89.2 103.0 24,081,557
Source: fDi Intelligence, from the Financial Times Ltd
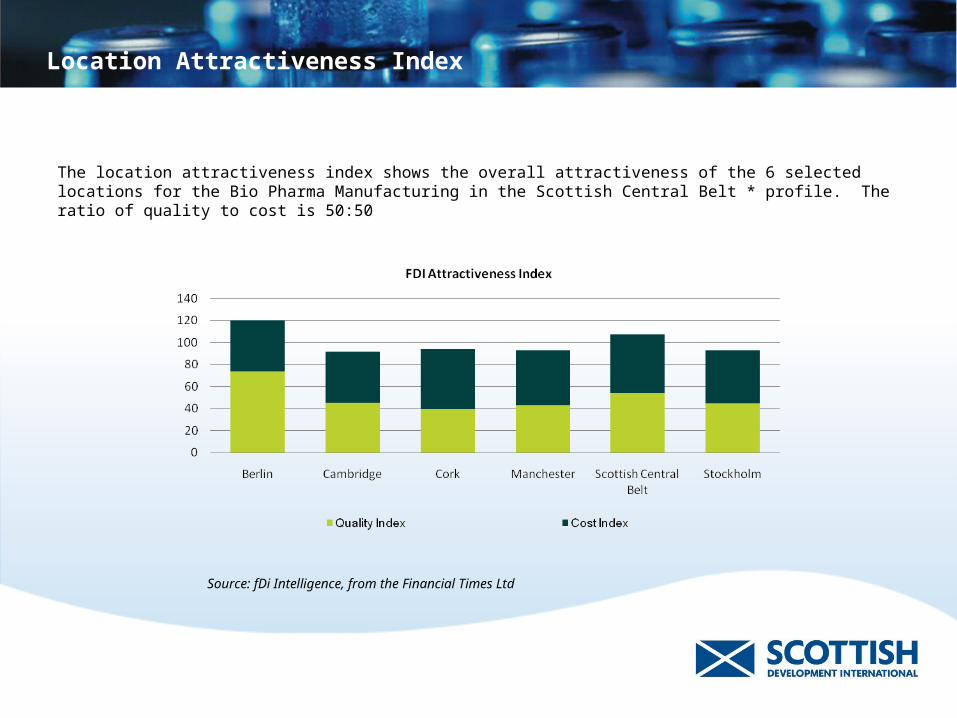
Location Attractiveness Index
The location attractiveness index shows the overall attractiveness of the 6 selected locations for the Bio Pharma Manufacturing in the Scottish Central Belt * profile. The ratio of quality to cost is 50:50
Source: fDi Intelligence, from the Financial Times Ltd
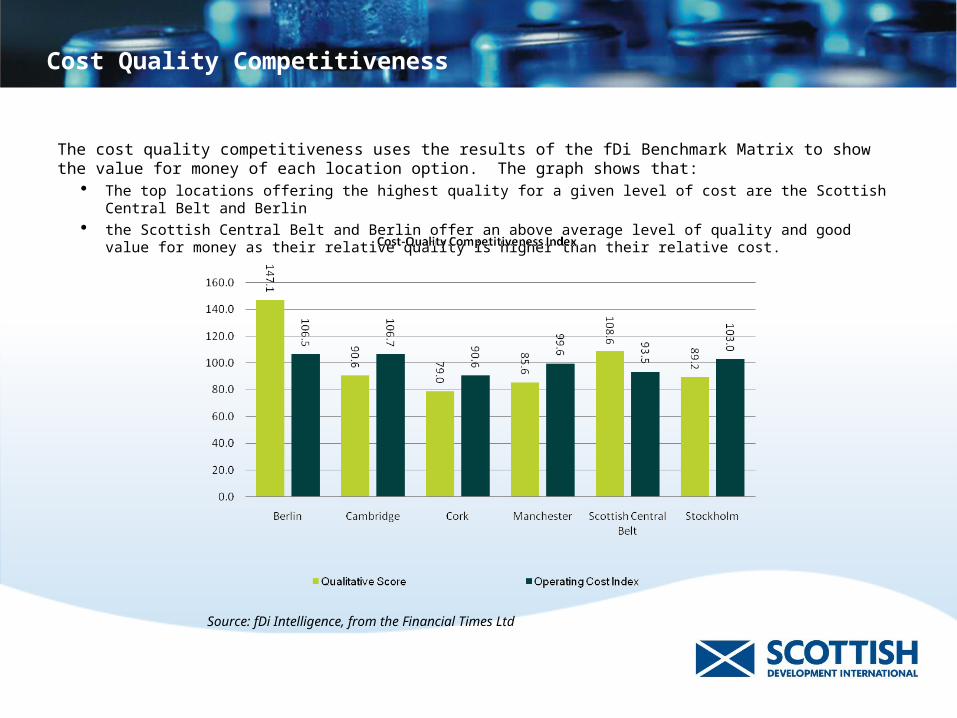
Cost Quality Competitiveness
The cost quality competitiveness uses the results of the fDi Benchmark Matrix to show the value for money of each location option. The graph shows that:
The top locations offering the highest quality for a given level of cost are the Scottish Central Belt and Berlin the Scottish Central Belt and Berlin offer an above average level of quality and good value for money as their relative
quality is higher than their relative cost.
Source: fDi Intelligence, from the Financial Times Ltd
Cost Competitiveness
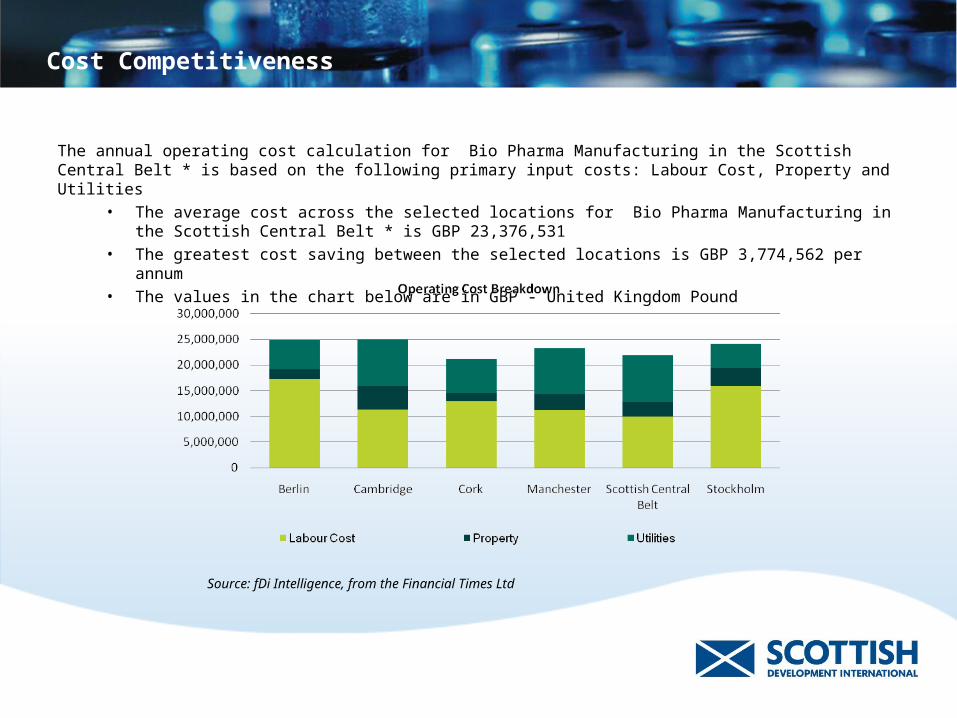
The annual operating cost calculation for Bio Pharma Manufacturing in the Scottish Central Belt * is based on the following primary input costs: Labour Cost, Property and Utilities
• The average cost across the selected locations for Bio Pharma Manufacturing in the Scottish Central Belt * is GBP 23,376,531
• The greatest cost saving between the selected locations is GBP 3,774,562 per annum• The values in the chart below are in GBP - United Kingdom Pound
Source: fDi Intelligence, from the Financial Times Ltd
Cost Competitiveness
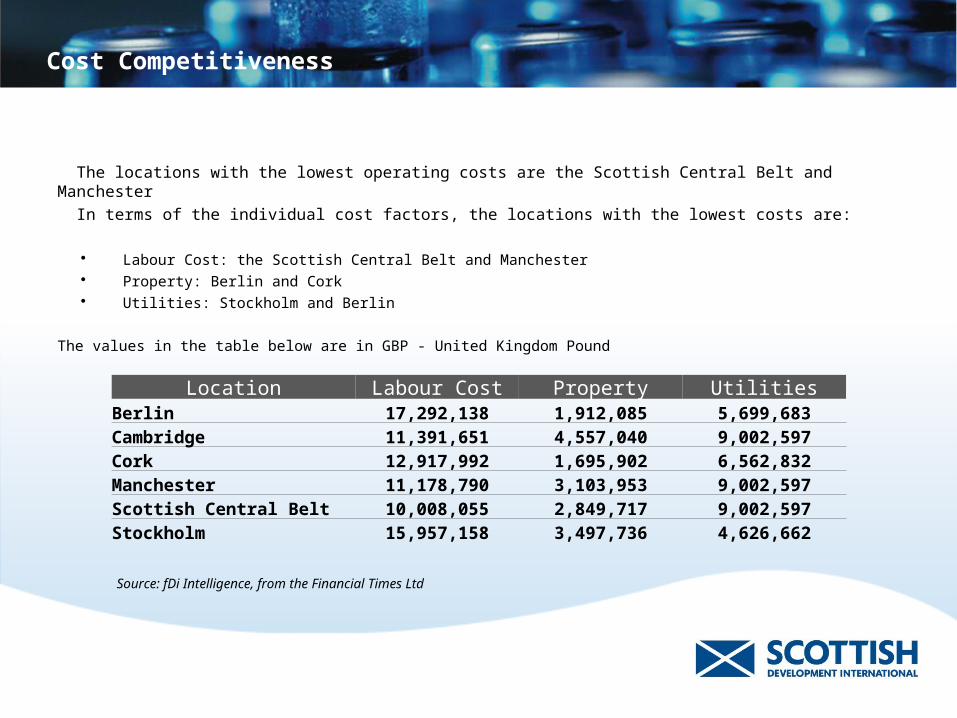
Location Labour Cost Property UtilitiesBerlin 17,292,138 1,912,085 5,699,683Cambridge 11,391,651 4,557,040 9,002,597Cork 12,917,992 1,695,902 6,562,832Manchester 11,178,790 3,103,953 9,002,597Scottish Central Belt 10,008,055 2,849,717 9,002,597Stockholm 15,957,158 3,497,736 4,626,662
The locations with the lowest operating costs are the Scottish Central Belt and Manchester
In terms of the individual cost factors, the locations with the lowest costs are:
Labour Cost: the Scottish Central Belt and Manchester Property: Berlin and Cork Utilities: Stockholm and Berlin
The values in the table below are in GBP - United Kingdom Pound
Source: fDi Intelligence, from the Financial Times Ltd
Quality Competitiveness
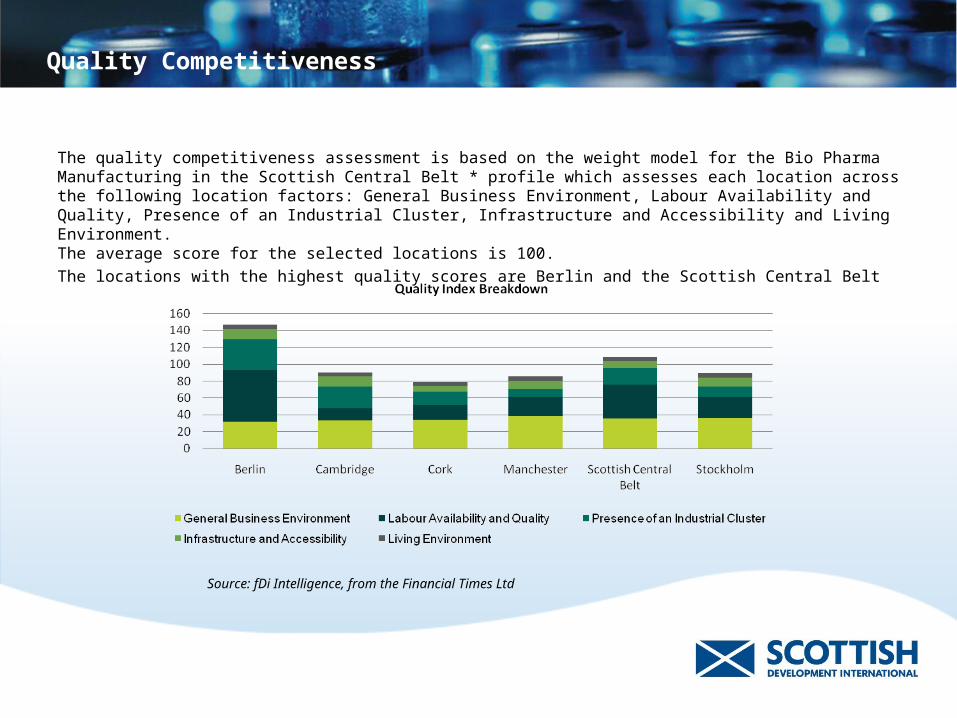
The quality competitiveness assessment is based on the weight model for the Bio Pharma Manufacturing in the Scottish Central Belt * profile which assesses each location across the following location factors: General Business Environment, Labour Availability and Quality, Presence of an Industrial Cluster, Infrastructure and Accessibility and Living Environment. The average score for the selected locations is 100.
The locations with the highest quality scores are Berlin and the Scottish Central Belt
Source: fDi Intelligence, from the Financial Times Ltd
Quality Competitiveness
LocationGeneral Business
Environment
Labour Availability and
QualityPresence of an
Industrial ClusterInfrastructure and
AccessibilityLiving
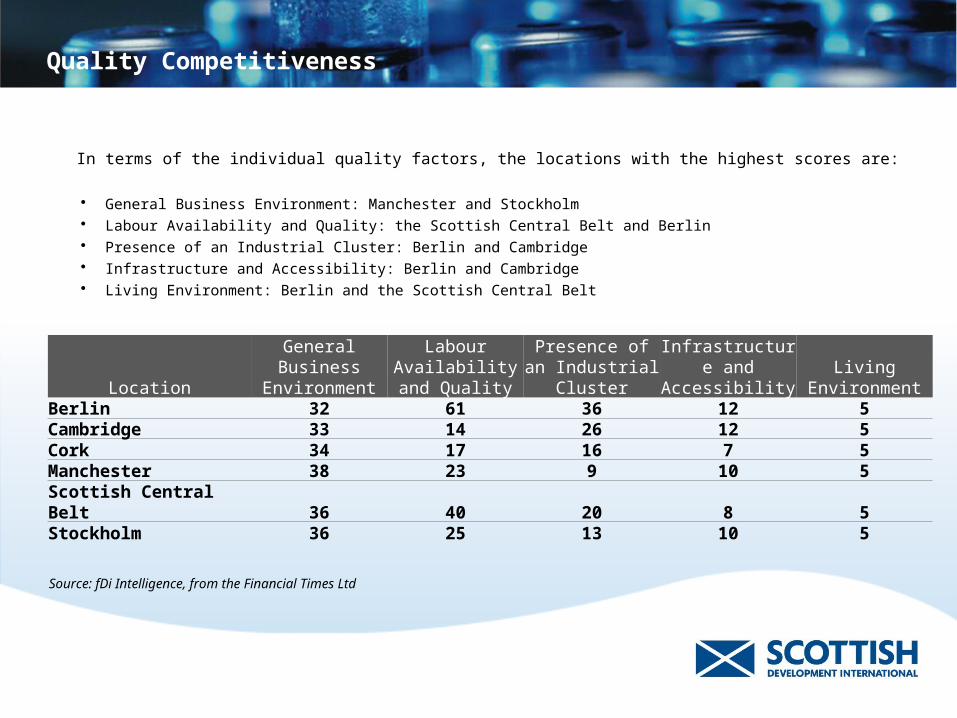
EnvironmentBerlin 32 61 36 12 5Cambridge 33 14 26 12 5Cork 34 17 16 7 5Manchester 38 23 9 10 5Scottish Central Belt 36 40 20 8 5Stockholm 36 25 13 10 5
In terms of the individual quality factors, the locations with the highest scores are:
General Business Environment: Manchester and Stockholm Labour Availability and Quality: the Scottish Central Belt and Berlin Presence of an Industrial Cluster: Berlin and Cambridge Infrastructure and Accessibility: Berlin and Cambridge Living Environment: Berlin and the Scottish Central Belt
Source: fDi Intelligence, from the Financial Times Ltd
General Business Environment
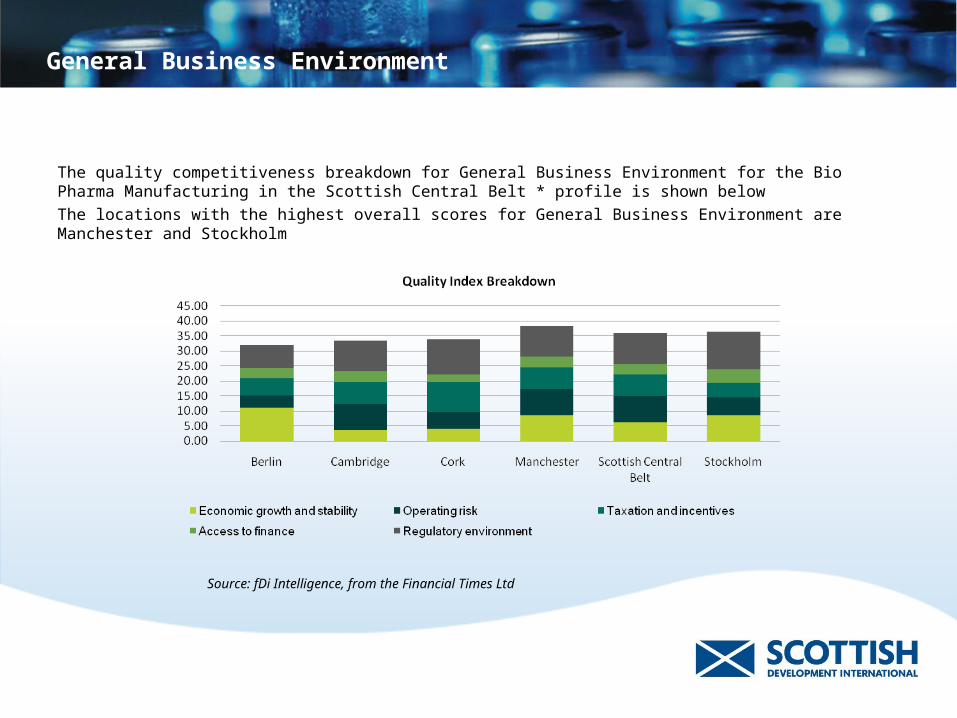
The quality competitiveness breakdown for General Business Environment for the Bio Pharma Manufacturing in the Scottish Central Belt * profile is shown below
The locations with the highest overall scores for General Business Environment are Manchester and Stockholm
Source: fDi Intelligence, from the Financial Times Ltd
General Business Environment
Location
Economic growth and stability
Operating risk
Taxation and
incentives
Access to finance
Regulatory environment
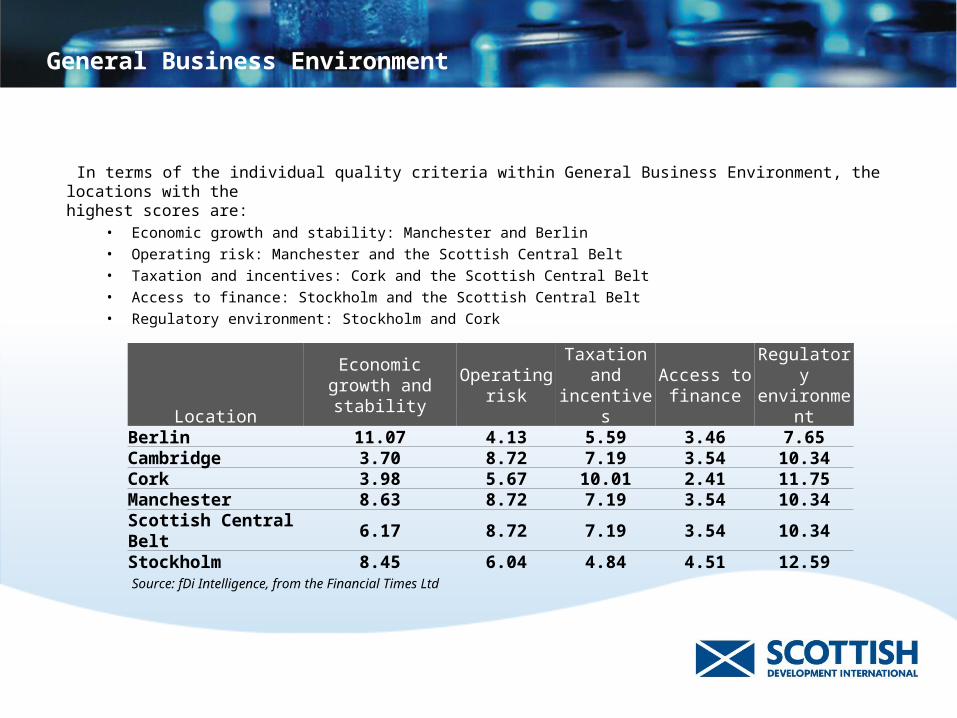
Berlin 11.07 4.13 5.59 3.46 7.65Cambridge 3.70 8.72 7.19 3.54 10.34Cork 3.98 5.67 10.01 2.41 11.75Manchester 8.63 8.72 7.19 3.54 10.34Scottish Central Belt 6.17 8.72 7.19 3.54 10.34Stockholm 8.45 6.04 4.84 4.51 12.59
In terms of the individual quality criteria within General Business Environment, the locations with the highest scores are:
• Economic growth and stability: Manchester and Berlin
• Operating risk: Manchester and the Scottish Central Belt
• Taxation and incentives: Cork and the Scottish Central Belt
• Access to finance: Stockholm and the Scottish Central Belt
• Regulatory environment: Stockholm and Cork
Source: fDi Intelligence, from the Financial Times Ltd
Labour Availability and Quality
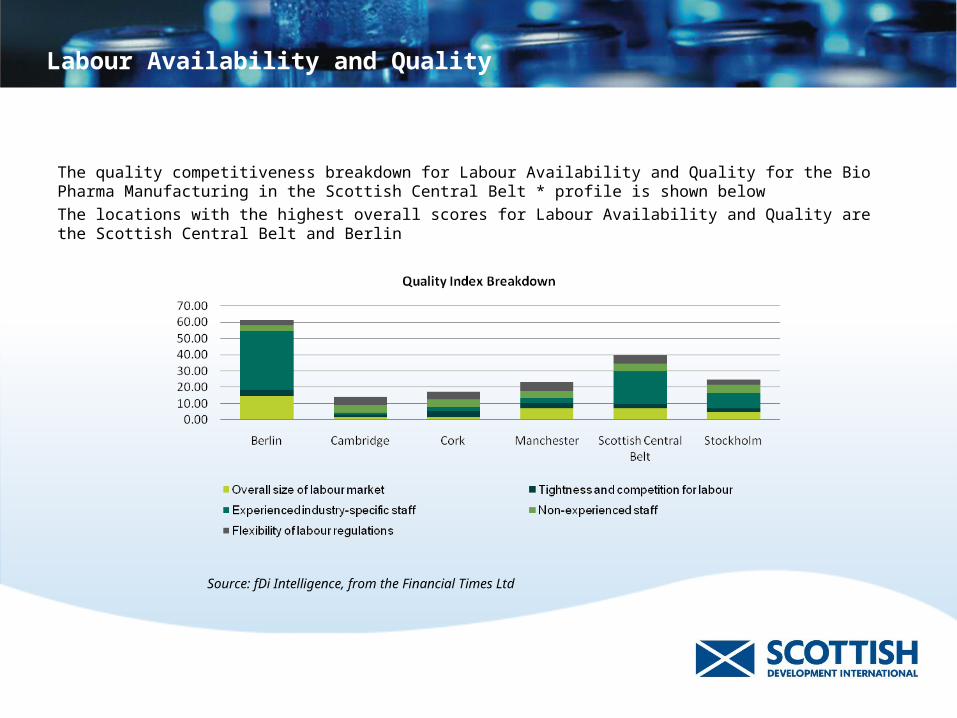
The quality competitiveness breakdown for Labour Availability and Quality for the Bio Pharma Manufacturing in the Scottish Central Belt * profile is shown below
The locations with the highest overall scores for Labour Availability and Quality are the Scottish Central Belt and Berlin
Source: fDi Intelligence, from the Financial Times Ltd
Labour Availability and Quality
LocationOverall size of labour market
Tightness and competition for
labour
Experienced industry-
specific staff
Non-experience
d staff
Flexibility of labour
regulations
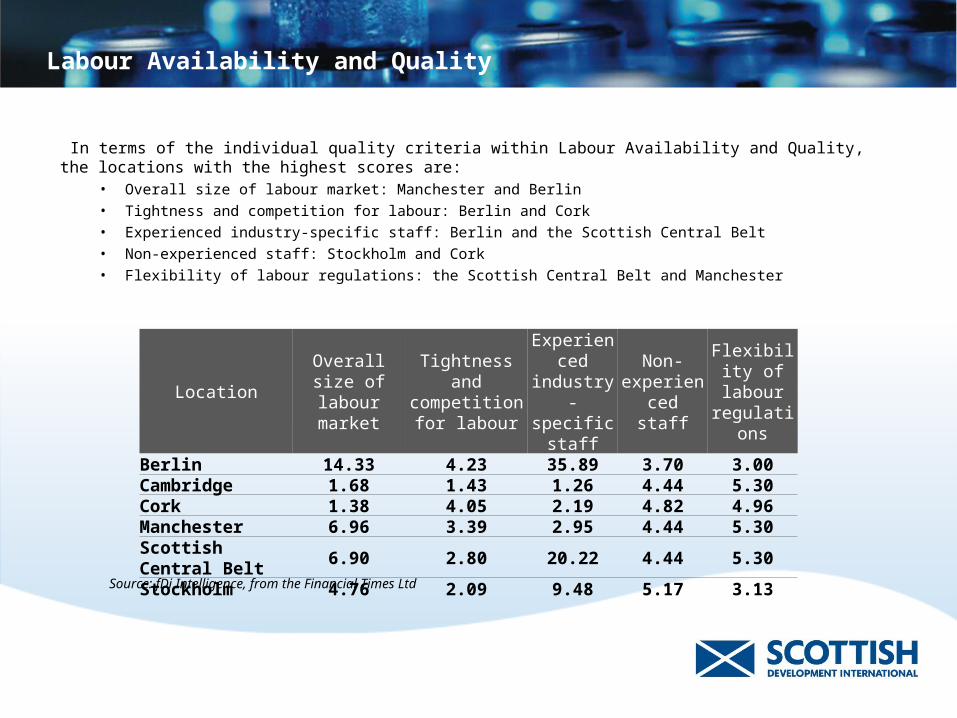
Berlin 14.33 4.23 35.89 3.70 3.00Cambridge 1.68 1.43 1.26 4.44 5.30Cork 1.38 4.05 2.19 4.82 4.96Manchester 6.96 3.39 2.95 4.44 5.30Scottish Central Belt
6.90 2.80 20.22 4.44 5.30
Stockholm 4.76 2.09 9.48 5.17 3.13
In terms of the individual quality criteria within Labour Availability and Quality, the locations with the highest scores are:
• Overall size of labour market: Manchester and Berlin
• Tightness and competition for labour: Berlin and Cork
• Experienced industry-specific staff: Berlin and the Scottish Central Belt
• Non-experienced staff: Stockholm and Cork
• Flexibility of labour regulations: the Scottish Central Belt and Manchester
Source: fDi Intelligence, from the Financial Times Ltd
Presence of an Industrial Cluster
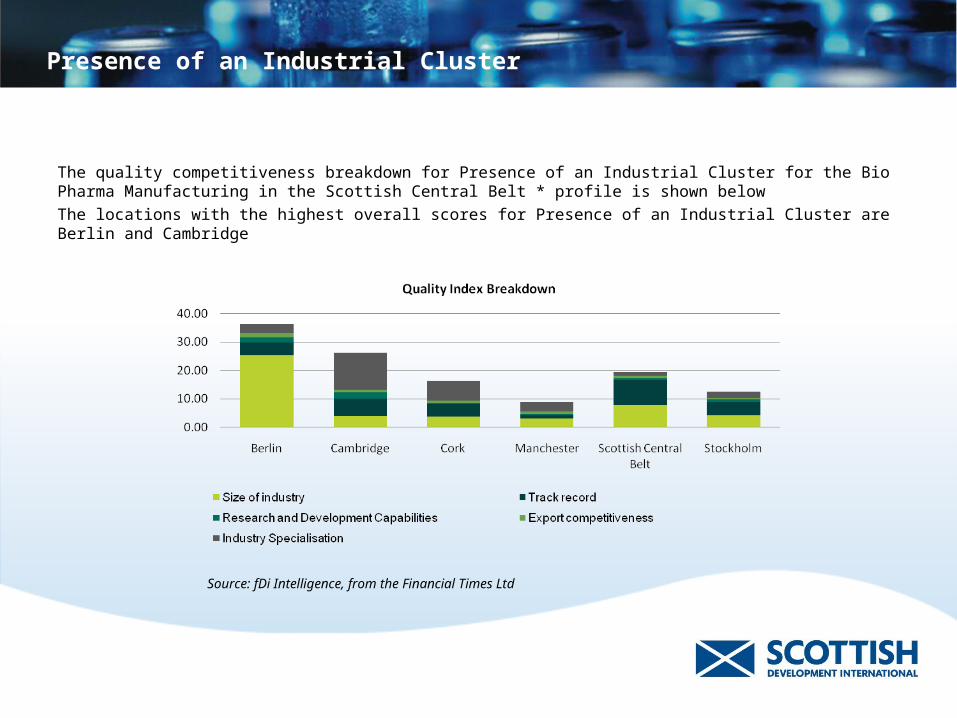
The quality competitiveness breakdown for Presence of an Industrial Cluster for the Bio Pharma Manufacturing in the Scottish Central Belt * profile is shown below
The locations with the highest overall scores for Presence of an Industrial Cluster are Berlin and Cambridge
Source: fDi Intelligence, from the Financial Times Ltd
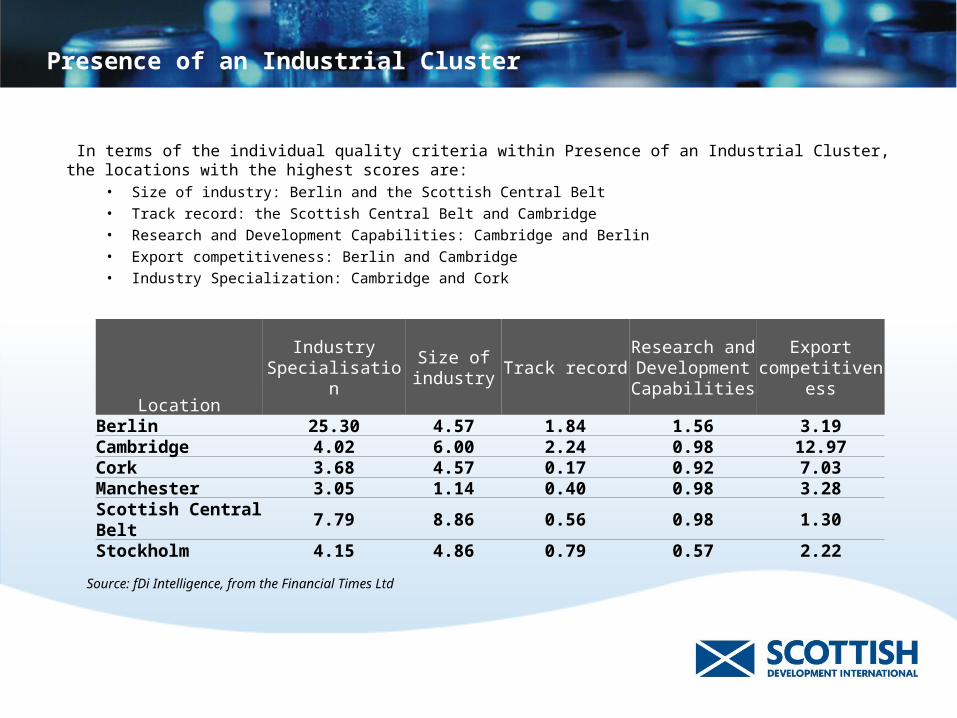
Presence of an Industrial Cluster
Location
Industry Specialisation
Size of industry
Track recordResearch and Development Capabilities
Export competitiveness
Berlin 25.30 4.57 1.84 1.56 3.19Cambridge 4.02 6.00 2.24 0.98 12.97Cork 3.68 4.57 0.17 0.92 7.03Manchester 3.05 1.14 0.40 0.98 3.28Scottish Central Belt
7.79 8.86 0.56 0.98 1.30
Stockholm 4.15 4.86 0.79 0.57 2.22
In terms of the individual quality criteria within Presence of an Industrial Cluster, the locations with the highest scores are:
• Size of industry: Berlin and the Scottish Central Belt
• Track record: the Scottish Central Belt and Cambridge
• Research and Development Capabilities: Cambridge and Berlin
• Export competitiveness: Berlin and Cambridge
• Industry Specialization: Cambridge and Cork
Source: fDi Intelligence, from the Financial Times Ltd
Infrastructure and Accessibility
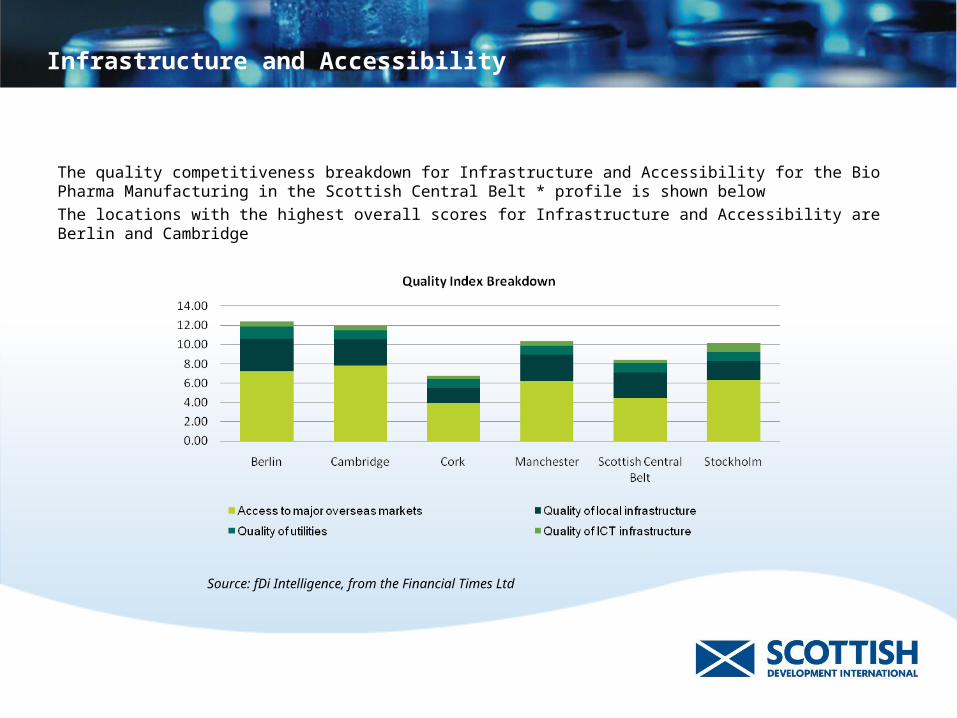
The quality competitiveness breakdown for Infrastructure and Accessibility for the Bio Pharma Manufacturing in the Scottish Central Belt * profile is shown below
The locations with the highest overall scores for Infrastructure and Accessibility are Berlin and Cambridge
Source: fDi Intelligence, from the Financial Times Ltd
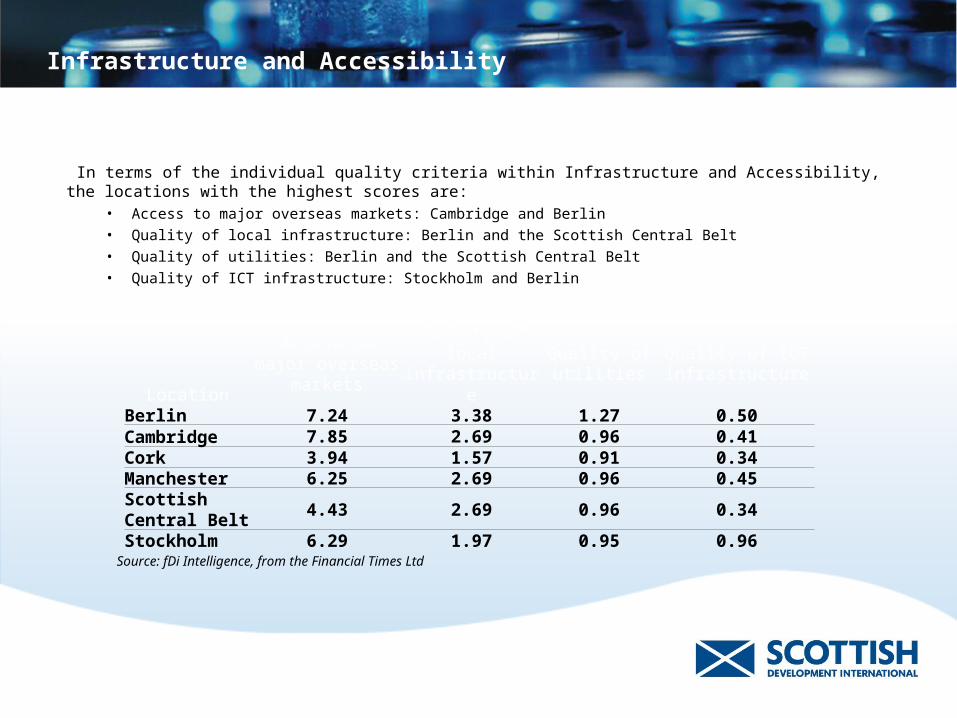
Infrastructure and Accessibility
LocationAccess to major
overseas marketsQuality of local infrastructure
Quality of utilities
Quality of ICT infrastructure
Berlin 7.24 3.38 1.27 0.50Cambridge 7.85 2.69 0.96 0.41Cork 3.94 1.57 0.91 0.34Manchester 6.25 2.69 0.96 0.45Scottish Central Belt
4.43 2.69 0.96 0.34
Stockholm 6.29 1.97 0.95 0.96
In terms of the individual quality criteria within Infrastructure and Accessibility, the locations with the highest scores are:
• Access to major overseas markets: Cambridge and Berlin
• Quality of local infrastructure: Berlin and the Scottish Central Belt
• Quality of utilities: Berlin and the Scottish Central Belt
• Quality of ICT infrastructure: Stockholm and Berlin
Source: fDi Intelligence, from the Financial Times Ltd
Living Environment
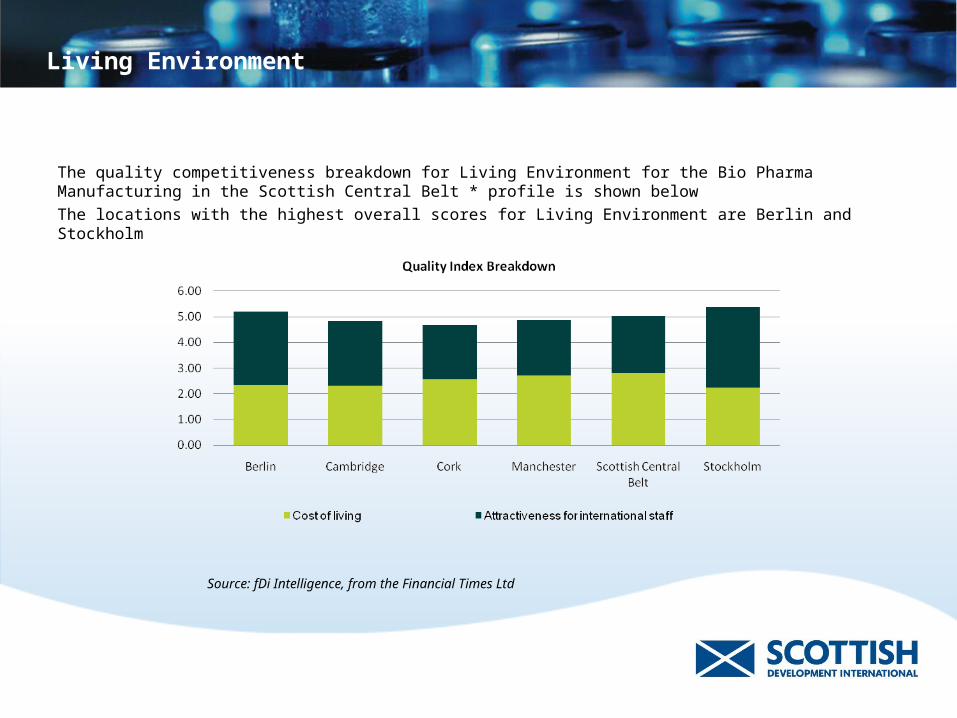
The quality competitiveness breakdown for Living Environment for the Bio Pharma Manufacturing in the Scottish Central Belt * profile is shown below
The locations with the highest overall scores for Living Environment are Berlin and Stockholm
Source: fDi Intelligence, from the Financial Times Ltd
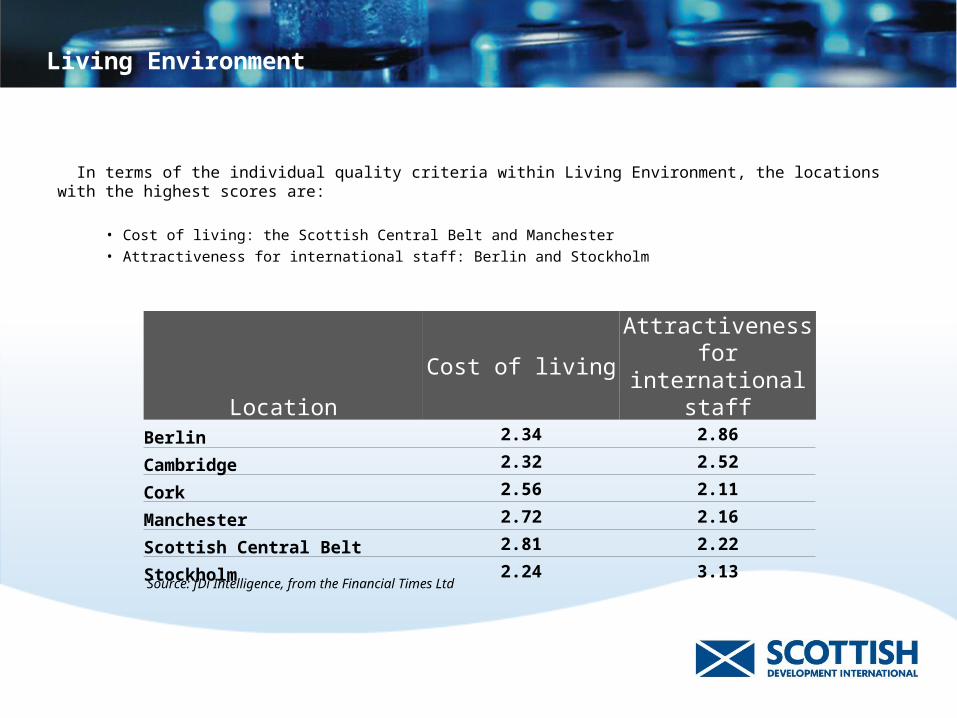
Living Environment
LocationCost of living
Attractiveness for international staff
Berlin 2.34 2.86
Cambridge 2.32 2.52
Cork 2.56 2.11
Manchester 2.72 2.16
Scottish Central Belt 2.81 2.22
Stockholm 2.24 3.13
In terms of the individual quality criteria within Living Environment, the locations with the highest scores are:
• Cost of living: the Scottish Central Belt and Manchester
• Attractiveness for international staff: Berlin and Stockholm
Source: fDi Intelligence, from the Financial Times Ltd

To realise the potential,please contact:
Scottish Development International150 Broomielaw, Atlantic Quay Glasgow G2 8LU Scotland, UK T +44 141 228 2828F +44 141 228 2089www.sdi.co.uk
Worldwide offices in: Americas, Europe, Middle East, Africa and Asia Pacific