Embed Size (px)
Citation preview
6-8
3-1
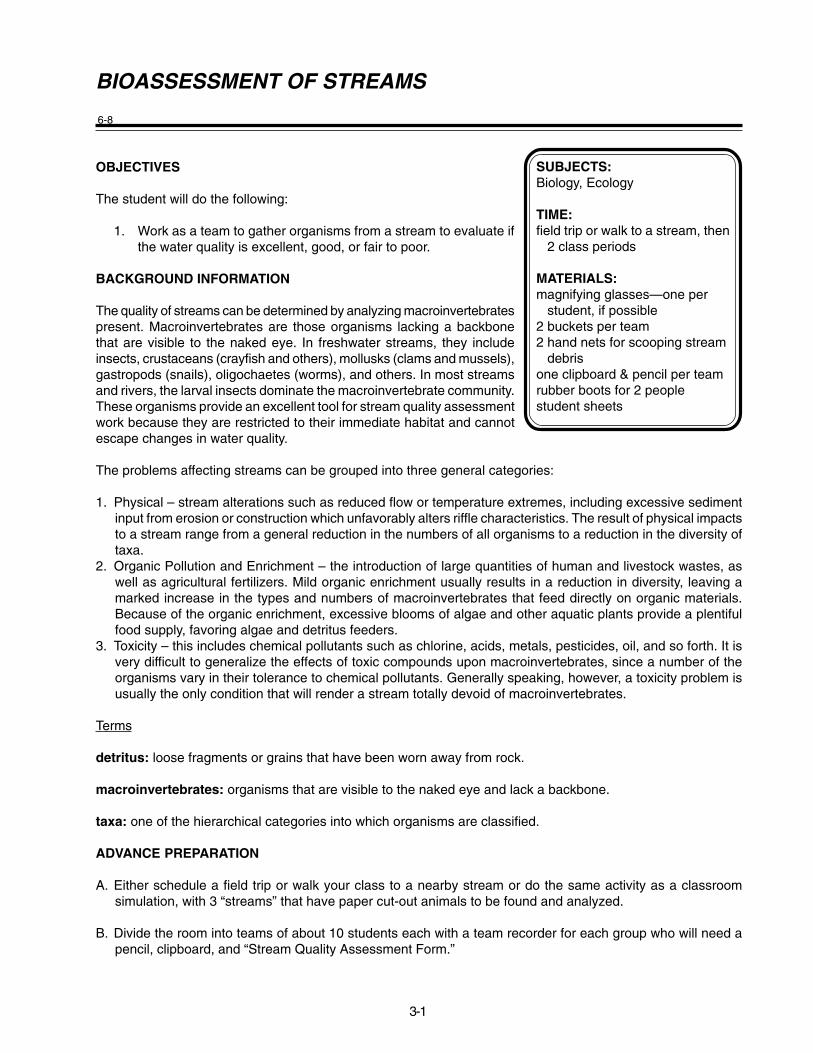
BIOASSESSMENT OF STREAMS
OBJECTIVES
The student will do the following:
1. Work as a team to gather organisms from a stream to evaluate ifthe water quality is excellent, good, or fair to poor.
BACKGROUND INFORMATION
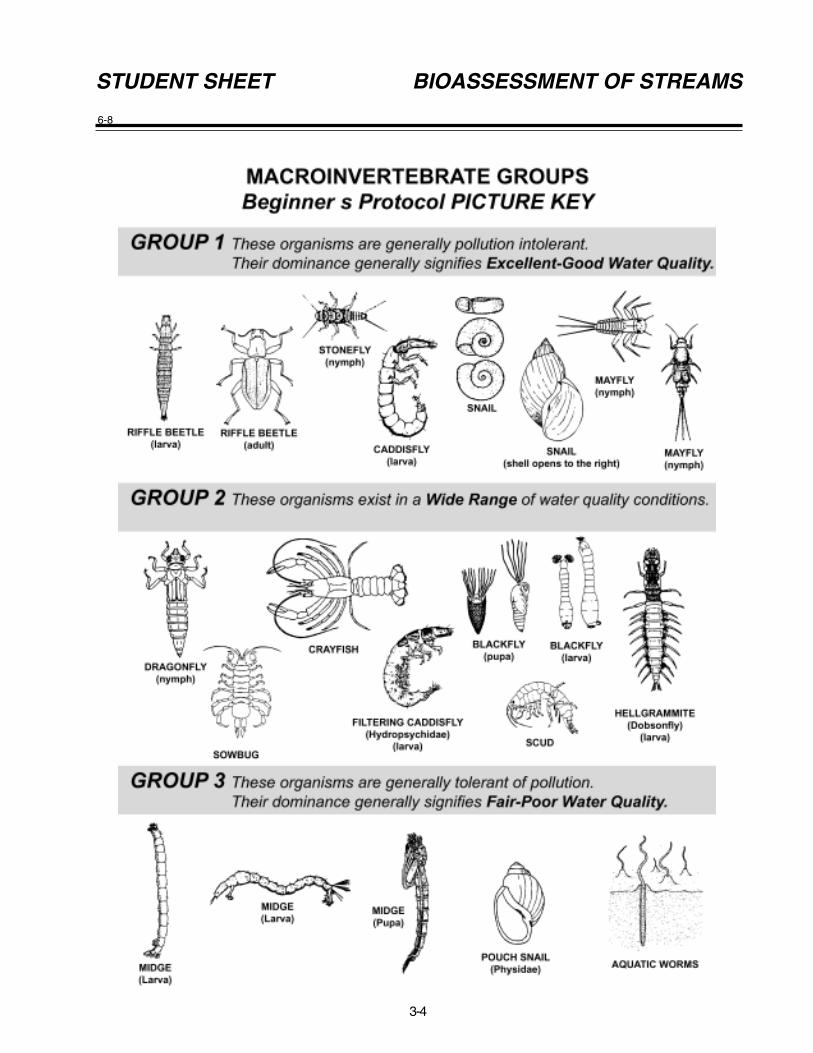
The quality of streams can be determined by analyzing macroinvertebratespresent. Macroinvertebrates are those organisms lacking a backbonethat are visible to the naked eye. In freshwater streams, they includeinsects, crustaceans (crayfish and others), mollusks (clams and mussels),gastropods (snails), oligochaetes (worms), and others. In most streamsand rivers, the larval insects dominate the macroinvertebrate community.These organisms provide an excellent tool for stream quality assessmentwork because they are restricted to their immediate habitat and cannotescape changes in water quality.
The problems affecting streams can be grouped into three general categories:
1. Physical – stream alterations such as reduced flow or temperature extremes, including excessive sedimentinput from erosion or construction which unfavorably alters riffle characteristics. The result of physical impactsto a stream range from a general reduction in the numbers of all organisms to a reduction in the diversity oftaxa.
2. Organic Pollution and Enrichment – the introduction of large quantities of human and livestock wastes, aswell as agricultural fertilizers. Mild organic enrichment usually results in a reduction in diversity, leaving amarked increase in the types and numbers of macroinvertebrates that feed directly on organic materials.Because of the organic enrichment, excessive blooms of algae and other aquatic plants provide a plentifulfood supply, favoring algae and detritus feeders.
3. Toxicity – this includes chemical pollutants such as chlorine, acids, metals, pesticides, oil, and so forth. It isvery difficult to generalize the effects of toxic compounds upon macroinvertebrates, since a number of theorganisms vary in their tolerance to chemical pollutants. Generally speaking, however, a toxicity problem isusually the only condition that will render a stream totally devoid of macroinvertebrates.
Terms
detritus: loose fragments or grains that have been worn away from rock.
macroinvertebrates: organisms that are visible to the naked eye and lack a backbone.
taxa: one of the hierarchical categories into which organisms are classified.
ADVANCE PREPARATION
A. Either schedule a field trip or walk your class to a nearby stream or do the same activity as a classroomsimulation, with 3 “streams” that have paper cut-out animals to be found and analyzed.
B. Divide the room into teams of about 10 students each with a team recorder for each group who will need apencil, clipboard, and “Stream Quality Assessment Form.”
SUBJECTS:Biology, Ecology
TIME:field trip or walk to a stream, then 2 class periods
MATERIALS:magnifying glasses—one per student, if possible2 buckets per team2 hand nets for scooping stream debrisone clipboard & pencil per teamrubber boots for 2 peoplestudent sheets
3-2
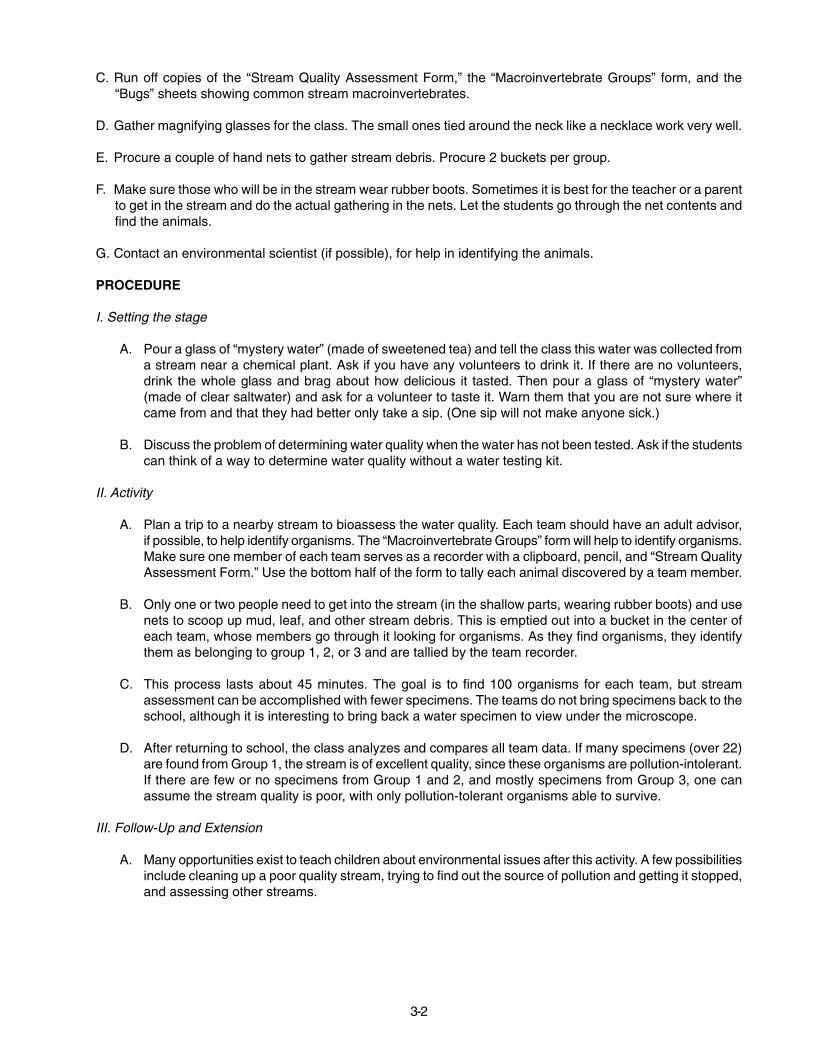
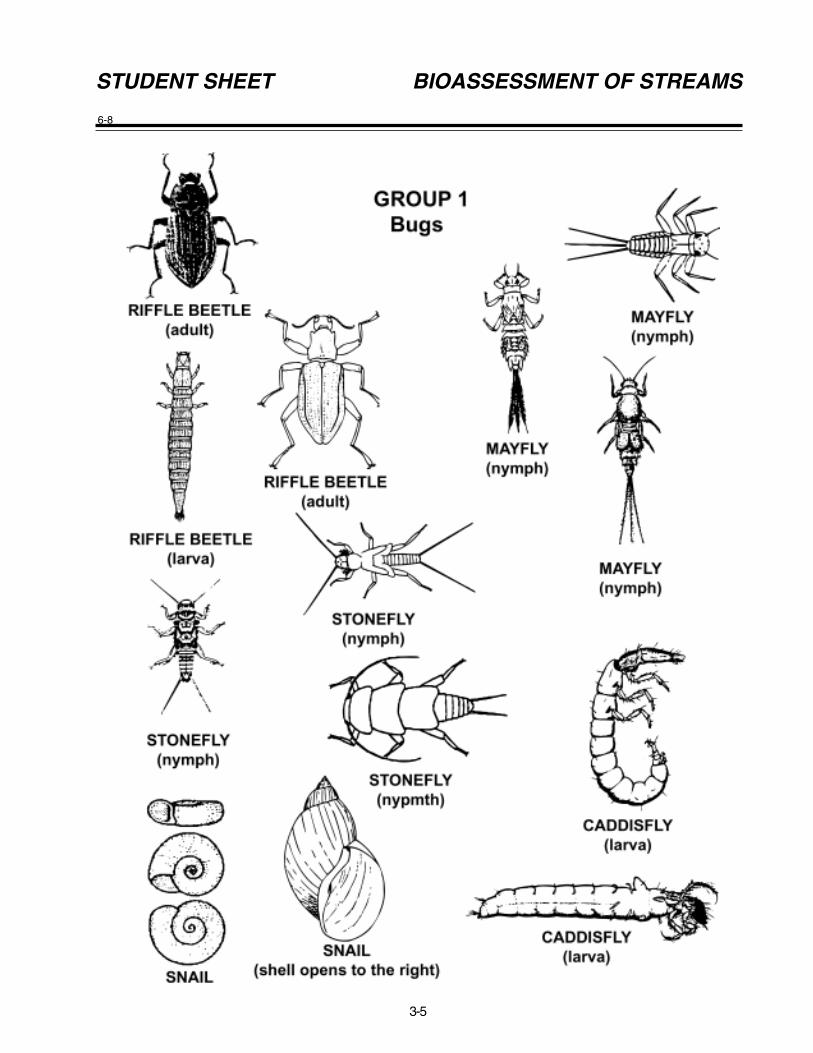
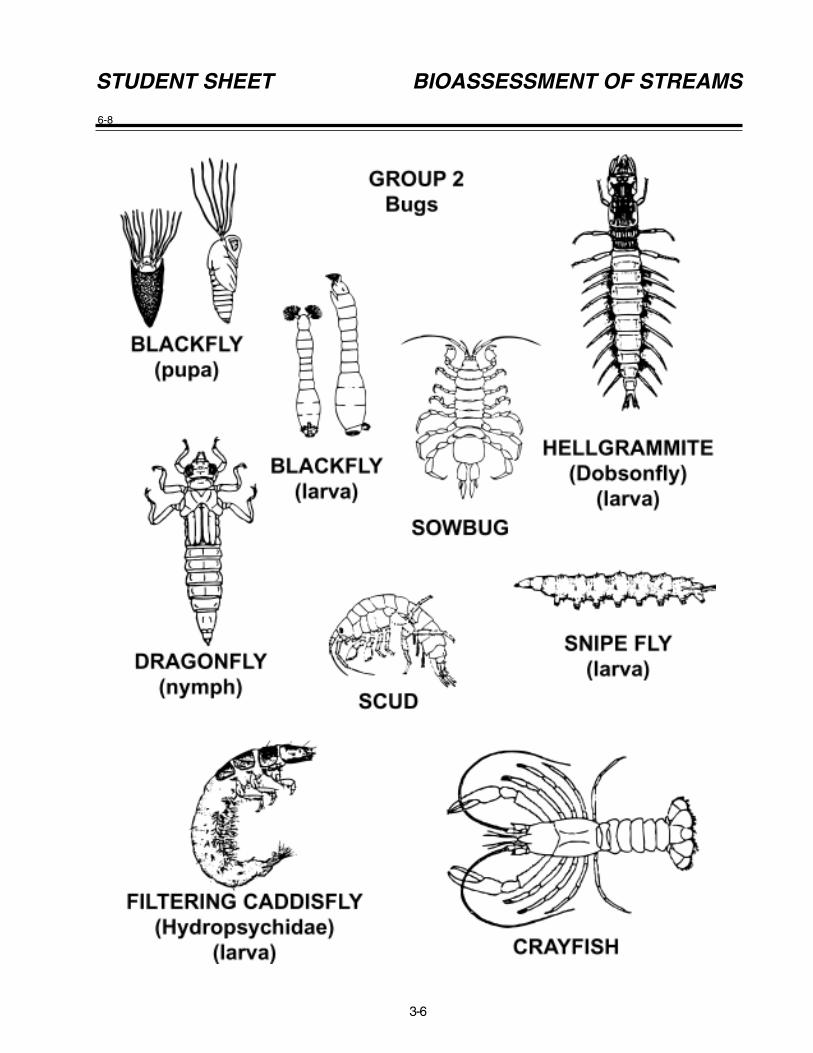
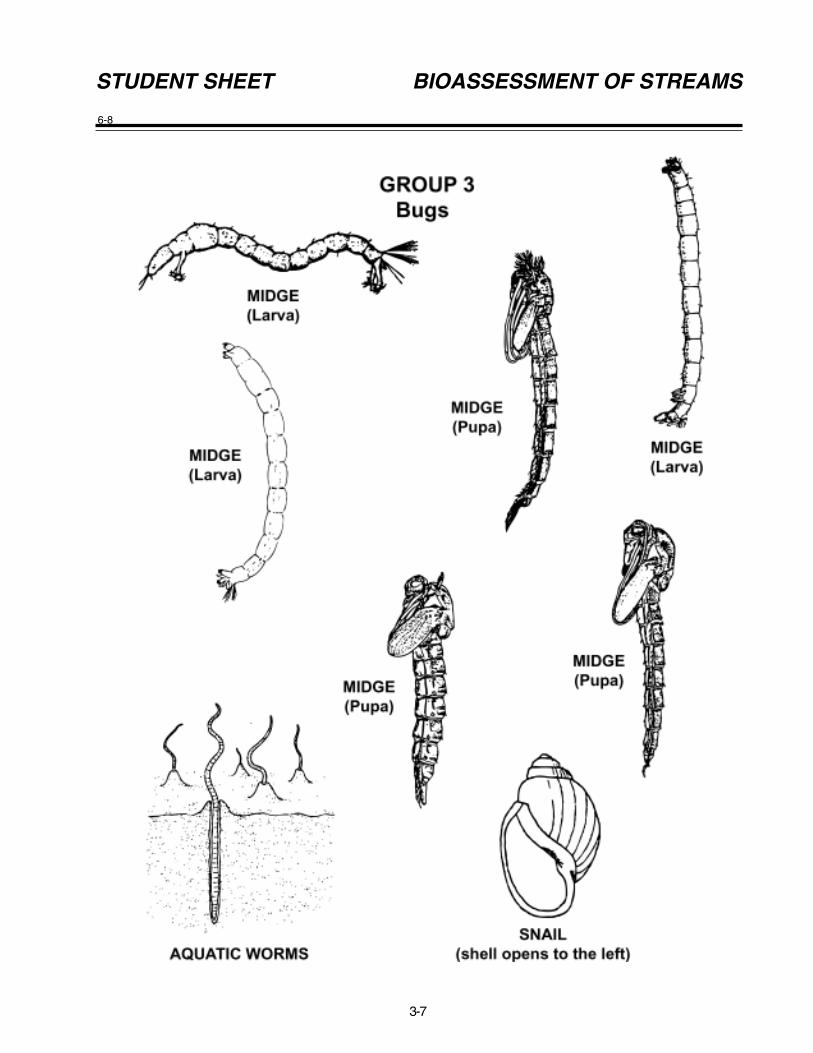
C. Run off copies of the “Stream Quality Assessment Form,” the “Macroinvertebrate Groups” form, and the“Bugs” sheets showing common stream macroinvertebrates.
D. Gather magnifying glasses for the class. The small ones tied around the neck like a necklace work very well.
E. Procure a couple of hand nets to gather stream debris. Procure 2 buckets per group.
F. Make sure those who will be in the stream wear rubber boots. Sometimes it is best for the teacher or a parentto get in the stream and do the actual gathering in the nets. Let the students go through the net contents andfind the animals.
G. Contact an environmental scientist (if possible), for help in identifying the animals.
PROCEDURE
I. Setting the stage
A. Pour a glass of “mystery water” (made of sweetened tea) and tell the class this water was collected froma stream near a chemical plant. Ask if you have any volunteers to drink it. If there are no volunteers,drink the whole glass and brag about how delicious it tasted. Then pour a glass of “mystery water”(made of clear saltwater) and ask for a volunteer to taste it. Warn them that you are not sure where itcame from and that they had better only take a sip. (One sip will not make anyone sick.)
B. Discuss the problem of determining water quality when the water has not been tested. Ask if the studentscan think of a way to determine water quality without a water testing kit.
II. Activity
A. Plan a trip to a nearby stream to bioassess the water quality. Each team should have an adult advisor,if possible, to help identify organisms. The “Macroinvertebrate Groups” form will help to identify organisms.Make sure one member of each team serves as a recorder with a clipboard, pencil, and “Stream QualityAssessment Form.” Use the bottom half of the form to tally each animal discovered by a team member.
B. Only one or two people need to get into the stream (in the shallow parts, wearing rubber boots) and usenets to scoop up mud, leaf, and other stream debris. This is emptied out into a bucket in the center ofeach team, whose members go through it looking for organisms. As they find organisms, they identifythem as belonging to group 1, 2, or 3 and are tallied by the team recorder.
C. This process lasts about 45 minutes. The goal is to find 100 organisms for each team, but streamassessment can be accomplished with fewer specimens. The teams do not bring specimens back to theschool, although it is interesting to bring back a water specimen to view under the microscope.
D. After returning to school, the class analyzes and compares all team data. If many specimens (over 22)are found from Group 1, the stream is of excellent quality, since these organisms are pollution-intolerant.If there are few or no specimens from Group 1 and 2, and mostly specimens from Group 3, one canassume the stream quality is poor, with only pollution-tolerant organisms able to survive.
III. Follow-Up and Extension
A. Many opportunities exist to teach children about environmental issues after this activity. A few possibilitiesinclude cleaning up a poor quality stream, trying to find out the source of pollution and getting it stopped,and assessing other streams.

3-3
RESOURCES
Kentucky Water Watch. Biological Stream Assessment: http://www.state.ky.us/nrepc/water/introtxt.html
State Water Watch Organizations.
6-8
3-4
STUDENT SHEET BIOASSESSMENT OF STREAMS
6-8
3-5
STUDENT SHEET BIOASSESSMENT OF STREAMS
6-8
3-6
STUDENT SHEET BIOASSESSMENT OF STREAMS
6-8
3-7
STUDENT SHEET BIOASSESSMENT OF STREAMS
6-8
3-8
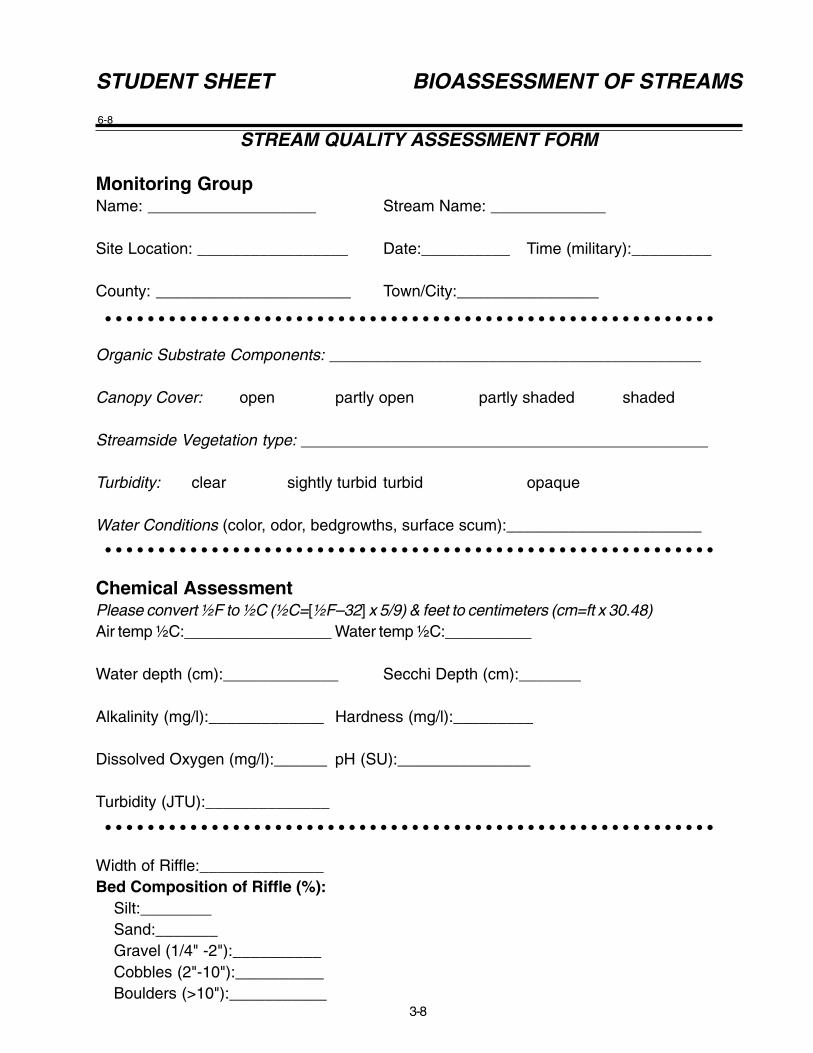
STREAM QUALITY ASSESSMENT FORM
Monitoring GroupName: ___________________ Stream Name: _____________
Site Location: _________________ Date:__________ Time (military):_________
County: ______________________ Town/City:________________
Organic Substrate Components: __________________________________________
Canopy Cover: open partly open partly shaded shaded
Streamside Vegetation type: ______________________________________________
Turbidity: clear sightly turbid turbid opaque
Water Conditions (color, odor, bedgrowths, surface scum):______________________
Chemical AssessmentPlease convert ½F to ½C (½C=[½F–32] x 5/9) & feet to centimeters (cm=ft x 30.48)Air temp ½C:_________________ Water temp ½C:__________
Water depth (cm):_____________ Secchi Depth (cm):_______
Alkalinity (mg/l):_____________ Hardness (mg/l):_________
Dissolved Oxygen (mg/l):______ pH (SU):_______________
Turbidity (JTU):______________
Width of Riffle:______________Bed Composition of Riffle (%):
Silt:________Sand:_______Gravel (1/4" -2"):__________Cobbles (2"-10"):__________Boulders (>10"):___________
○ ○ ○ ○ ○ ○ ○ ○ ○ ○ ○ ○ ○ ○ ○ ○ ○ ○ ○ ○ ○ ○ ○ ○ ○ ○ ○ ○ ○ ○ ○ ○ ○ ○ ○ ○ ○ ○ ○ ○ ○ ○ ○ ○ ○ ○ ○ ○ ○ ○ ○ ○ ○ ○ ○ ○ ○ ○
○ ○ ○ ○ ○ ○ ○ ○ ○ ○ ○ ○ ○ ○ ○ ○ ○ ○ ○ ○ ○ ○ ○ ○ ○ ○ ○ ○ ○ ○ ○ ○ ○ ○ ○ ○ ○ ○ ○ ○ ○ ○ ○ ○ ○ ○ ○ ○ ○ ○ ○ ○ ○ ○ ○ ○ ○ ○
○ ○ ○ ○ ○ ○ ○ ○ ○ ○ ○ ○ ○ ○ ○ ○ ○ ○ ○ ○ ○ ○ ○ ○ ○ ○ ○ ○ ○ ○ ○ ○ ○ ○ ○ ○ ○ ○ ○ ○ ○ ○ ○ ○ ○ ○ ○ ○ ○ ○ ○ ○ ○ ○ ○ ○ ○ ○
STUDENT SHEET BIOASSESSMENT OF STREAMS
6-8
3-9
CLEANING POINT SOURCE POLLUTION
OBJECTIVES
The student will do the following:
1. Estimate the amount of pollution in a water sample.
2. Remove pollution from water using different methods.
3. Measure the pollution removed and calculate the percentage ofpollution removed from each sample.
4. Analyze and discuss the most effective methods of cleaningpollution from water.
BACKGROUND INFORMATION
Point source pollution is pollution that is discharged from a single source,such as an oil tanker, water treatment plant, or a factory. Point source pollution is easily identified and can betraced to its source. It is often difficult to enforce cleanup of point source pollution, even when the source isidentified. Point source pollution can also come from septic-tank systems, storage facilities for polluted waste,petroleum products stored underground, and runoff from landowners.
Organic chemicals are products composed of hydrocarbons originally found in ancient plants. A petroleum product,such as oil, can be accidentally released into the environment when collisions of tankers occur, when ships runaground, when facilities leak, or when petroleum products are not disposed of properly.
Sewage, radioactive and hazardous metals, medical wastes and all manner of dissolved solids contribute heavilyto the pollution of our waterways. Of particular importance is mine waste because it is continuous, commerciallyimportant on a large scale, and involves pollution of water at several different points in processing. In coal minesin particular, sulfuric acid (H2S) is a problem. Coal is mineralized plant and animal matter that was not decomposedby microbes millions of years ago because it was in an oxygen-free environment. Without oxygen, microbesbreathed sulfates instead and reduced them to sulfuric acid. This reaction is very inefficient, so these microbeswere unable to decompose the carbon rich plant material. H2S is a natural and necessary part of coal deposits,but it is also a very strong acid. Poured onto soil, it causes aluminum and iron toxicity in crop plants and killsnitrogen fixing organisms, leading to crop deficiencies in nitrogen. The H2S that gets to the smelting stage ofprocessing becomes gaseous H2SO4, the main ingredient in acid rain. Many other harmful minerals are presentin the ores themselves so that even slurries of crushed rock may be harmful to the environment.
Many pieces of legislation have been put forth to eliminate point source pollution. The General Mining Law of1872 says that miners who pollute canals that settlers rely upon must pay reparations for the damages theyhave caused. The Refuse Act of 1899 required a federal permit for the dumping of anything into navigablewaters, and the Clean Water Act of 1972 regulated a new program of permits to replace the permits of the 1899law with stricter more efficient enforcement.
Nonpoint source pollution is pollution generated from diffuse sources rather than one specific, identifiable source.The primary contributors to nonpoint source pollution include urban runoff, agriculture, silviculture, storm water,livestock waste, and raw domestic wastes. It may include contaminants such as sediment, bacteria, oil and oil-related chemicals, pesticides, heavy metals, and other toxic substances. Heavy rainfall often increases nonpointsource pollution by washing sediment, chemicals, and other contaminants from fields, towns, and cities intosurface water areas and eventually into areas of possible groundwater recharge. Many federal, state, localagencies and groups have programs to help reduce nonpoint source pollution.
SUBJECTS:Chemistry, Ecology, Math
TIME:50 minutes
MATERIALS:clear plastic cupsmedicine dropperstrawspoonmotor oilwaterpaper towelsstudent sheet
3-10
Terms
point source pollution: pollution that can be traced to a single point source, such as a pipe or culvert (e.g.,industrial and wastewater treatment plant discharges).
nonpoint source pollution (NPS): pollution that cannot be traced to a single point, because it comes frommany individual places or a widespread area (Example: urban and agricultural runoff).
hydrocarbons: a very large group of chemical compounds consisting primarily of carbon and hydrogen. Thelargest source of hydrocarbons is petroleum (crude oil).
runoff: water (originating as precipitation) that flows across surfaces rather than soaking in; eventually enters awater body; may pick up and carry a variety of pollutants.
ADVANCE PREPARATION
A. Set up three stations consisting of three different procedures for removing oil from water. (Note: Oil may beadded to each container by the teacher or by each group. The quantity of oil should be determined bythe teacher. Each group must add the same amount of oil.)
B. Place the following materials at the designated station:
Station 1: Station 2 : Station 3:spoon straw medicine droppertwo clear plastic cups two clear plastic cups two clear plastic cupsstudent sheet student sheet student sheetpaper towels paper towel paper towelmotor oil motor oil motor oil
PROCEDURE
I. Setting the stage
A. Have students brainstorm the best ways to remove oil pollution from water. Have them research anddiscuss the oldest methods and compare them to newer methods used today.
B. Have students predict the most effective cleanup method of the three methods they will be using.
II. Activity
A. Station 1: You will have two minutes to perform the following activities:
1. Work with your group and estimate the pollution (oil) in each of the three samples. Enter yourfindings on the data table.
2. Have one member of the group use the spoon to try to remove all of the oil from the sample. Placethe oil in an empty plastic cup.
3. Measure the amount of oil removed and calculate the percentage of pollutant removed from thesample with the spoon (old technology). Divide the amount of oil removed by the amount of water.
4. List any spills on the data chart.
5. Mark down any instances of habitat disturbance, such as water being removed with the cleanup.
3-11
B. Station 2: You will have two minutes to perform the following activities:
1. Have another member of your group use the straw and try to remove all of the oil from the sample.Save the oil in an empty plastic cup.
2. Measure the amount of oil removed and calculate the percentage of pollutants removed from thesample with this newer technology (straw). Do not use your mouth! Divide the amount of oilremoved by the amount of water.
3. Mark down any spills on the data chart.
4. Mark down any instances of habitat disturbance, such as water being removed with the cleanup.
C. Station 3: You will have two minutes to perform the following activities:
1. Have another member of your group use the medicine dropper and try to remove all of the oil fromthe sample with the dropper (newer technology).
2. Measure the amount of oil removed and calculate the percentage of pollutant removed from thesample with the dropper. Divide the amount of oil removed by the amount of water.
3. Mark down any spills on the data chart.
4. Mark down any instances of habitat disturbance, such as water being removed with the cleanup.
D. Analyze the data collected from each group and discuss the most effective oil removal method. Brainstormhow cost-effective each method is on a global basis.
III. Follow-Up
A. Perform the same steps, but substitute various pollutants other than oil.
B. Have students research major oil spills in the world that are presently being cleaned and the methods bywhich they are being cleaned.
C. Have students discuss disposal alternatives for removed oil (Examples: burning, re-refining, coatingsurfaces for protection, use as fuel, etc.).
IV. Extensions
A. Secure a speaker from the Coast Guard or Environmental Protection Agency that has participated in acoastal cleanup.
B. Have students participate in a coastal cleanup, Earth Day activities, a clean campus organization, orother environmental activities.
RESOURCES
Arms, K. Environmental Science, Holt, Rinehart, and Winston, Austin, TX, 1996.
The Changing Definition of Point Source Pollution in the Clean Water Act of 1972: http://moby.ucdavis.edu/GAWS/161/2bravo/1.htm
Nonpoint Source Pollution: http://www.deq.state.la.us/owr/owrnps.html
6-8
3-12
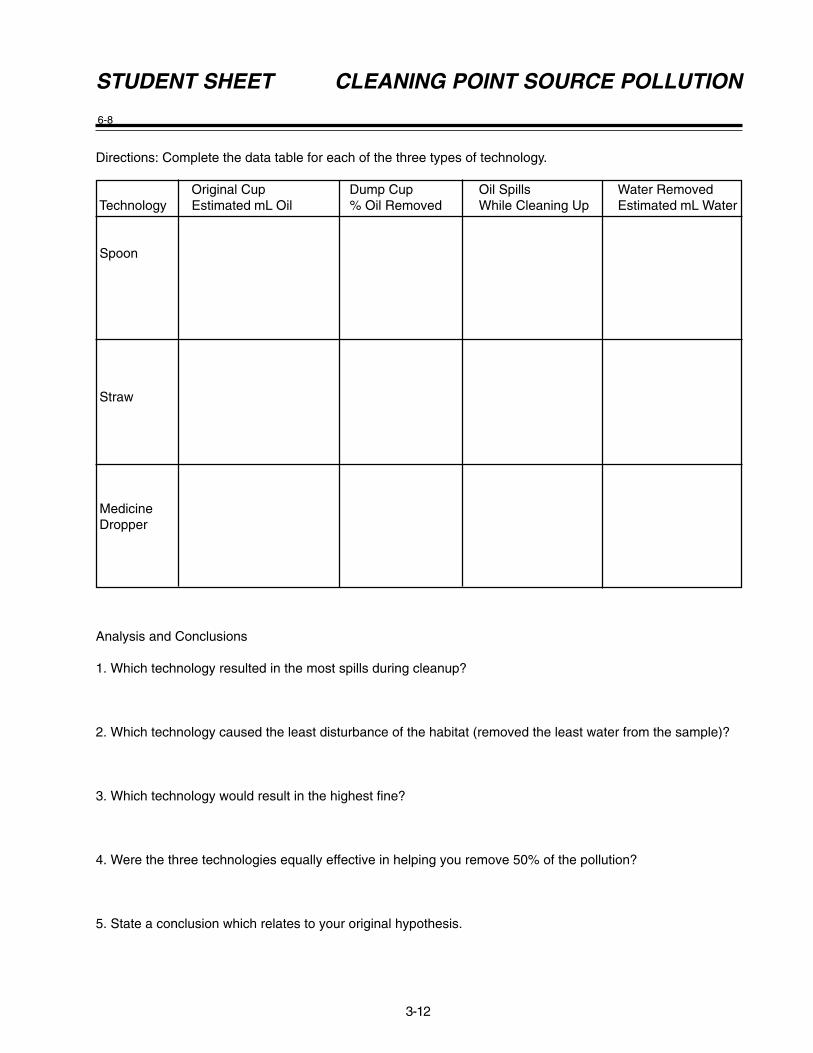
Directions: Complete the data table for each of the three types of technology.
Original Cup Dump Cup Oil Spills Water Removed Technology Estimated mL Oil % Oil Removed While Cleaning Up Estimated mL Water
Spoon
Straw
Medicine Dropper
Analysis and Conclusions
1. Which technology resulted in the most spills during cleanup?
2. Which technology caused the least disturbance of the habitat (removed the least water from the sample)?
3. Which technology would result in the highest fine?
4. Were the three technologies equally effective in helping you remove 50% of the pollution?
5. State a conclusion which relates to your original hypothesis.
STUDENT SHEET CLEANING POINT SOURCE POLLUTION
6-8
3-13
COLIFORM BACTERIA AND OYSTERS
OBJECTIVES
The student will do the following:
1. Explain why coliform tests are performed to aid in the protectionof oyster reefs.
2. List three common sources from which coliform bacteria enter abody of water such as a bay or estuary.
3. Perform an experiment to measure the amount of coliform bacteriain a water sample from different areas of bays and estuaries.
4. Define and interpret verbal materials concerning the vocabularyused in the terms list.
BACKGROUND INFORMATION
Oyster farming in coastal areas is a valuable activity. The collection,processing, transporting, and selling of these oysters provide an incomefor many people. As is the case with fisheries, state laws regulateoystering. These laws are designed to protect the health of the consumerand the size of the oyster population.
Oysters are common bivalves that live in shallow estuarine waters. Theirsoft body tissue is enclosed by a two-part shell which is held together bya strong hinge. The shell of an oyster is usually attached to another oysteror some other hard object, forming clumps of oysters. Large areas coveredwith these clumps are called oyster reefs.
Oysters take in oxygen from the water by pumping water through theirbodies and across their gills. During this process, tiny plants and animals are filtered from the water and areeaten by the oyster. The oyster cannot choose what is filtered from the water. Whatever is present in the wateris filtered and taken into the oyster. Thus, any toxins or harmful microbes in the water are likely to be present inthe oyster also.
State conservation, natural resources, and public health agencies are authorized to regulate the opening andclosing of the oyster reefs. An open oyster reef is one from which you can legally collect oysters. A closed reef isoff-limits to oyster collecting. Numerous tests and measurements are performed to provide information that willinfluence decisions to open or close the reefs. One of these tests measures the amount of a certain type ofbacteria called coliform bacteria. These indicator bacteria are commonly found in the intestinal tract of manyanimals, including humans. They aid in digesting many foods that animals cannot digest alone. When animalsdefecate, some of the coliform bacteria in the intestinal tract are also passed. Although coliforms are relativelyharmless, their quantity in the water is measured because it may be an indication that other harmful microbesare present. If these microbes are present in the water, they are probably also present in the oysters that live inthat water.
Sewage outfalls are the most common causes of increased coliform levels. Although many environmental factorsinfluence the closing of an oyster reef, an outfall located too close to a reef may be responsible for its permanentclosing. The decision of where to put a new sewage outfall is always an intensely debated issue. Sometimes itis difficult to utilize one resource without affecting or destroying another. People are continually seeking better
SUBJECTS:Art,Geography, Microbiology,Math,
TIME:50 minutes for experiments plusfour observation days
MATERIALS:film for camerawater samples from coastal areasmembrane filtration apparatushand-operated vacuum pumpMF-Endo broth in premeasured 2 mL ampuls (bio. supply co.)absorbent media pads and gridded membrane filters50- or 60-mm (about 2 inch) diameter petri dishes1 mL plastic pipettealcohol lampforcepssterile or dechlorinated tap watersterile glass or plastic petri dishes1 mL plastic pipetteEMB (eosin-methylene-blue)agar-agarMeans Option B test materialsstudent sheets
3-14
ways of using one resource without harming others.
In this activity, you will perform a test to measure the amount of coliform bacteria present in water samples takenfrom different areas. The tests actually used by state authorities are too difficult to be used in this case. Threequick and easy tests for measuring the amount of coliform are provided here.
Terms
bivalve: a mollusk that has two shells hinged together, such as the oyster, clam, or mussel.
coliforms: bacteria found in the intestinal tract of warm-blooded animals; used as indicators of fecal contaminationin water.
defecate: to void excrement or waste through the anus.
estuarine: of an area where a river empties into an ocean; of a bay, influenced by the ocean tides, which hasresulted in a mixture of saltwater and freshwater.
fishery: a place engaged in the occupation or industry of catching fish or taking seafood from bodies of water; aplace where such an industry is conducted.
microbe: a microorganism; a very tiny and often harmful plant or animal.
sewage outfall: the point of sewage discharge, often from a pipe into a body of water, in turn called the outfallarea.
ADVANCE PREPARATION
A. The teacher should be the one to collect appropriate water samples to be tested. Pictures should be taken ofthe various areas in which samples were collected. It is important that students can relate the samples toparticular areas along the bay.
B. Make sure that the body of water from which you collect the samples is not heavily polluted. You do not wantyour students working with a water sample with harmful toxins or bacteria.
C. A special lab session should be given to show and explain how to use alcohol lamps and hand-operatedvacuum pumps, as well as give instructions on how to sterilize equipment. Leave the lab set up for theexperiments the following day.
D. Ask students during the prior weeks to look in the newspapers and magazine for articles concerning theoyster season’s opening or closing.
PROCEDURE
I. Setting the stage
A. Pass out developed pictures of the different areas where the samples were taken. Ask students to try toidentify the particular areas in a nearby bay or estuary.
B. Post all the pictures of each particular area together on different bulletin boards or showboards. Leavethem out for students to look at during and after their experimenting.
C. Have an area map to plot the locations where samples were taken.
II. Activity
A. Light the alcohol lamp and sterilize the forceps by dipping them in alcohol and igniting by passing the tip
3-15
through the flame.
B. Use the sterilized forceps to place a white absorbent media pad into a petri dish. Break an ampul of MF-Endo medium and pour the contents onto the absorbent pad. Close the petri dish.
C. Resterilize the forceps in the flame. Then use it to place a gridded membrane filter on the filter funnel.Close the apparatus.
D. Pour about 100 mL (the amount does not affect the outcome) of sterile or chlorine-free tap water into thefunnel of the machine. The sterile water is used to dilute the test sample so coliforms (if present) will bedistributed evenly on the filter and, therefore, be easier to count.
E. Pipette one mL of the “test sample water” (river or bay water) into the funnel of the apparatus. Studentsshould not put the pipette to their mouths. The pipette will fill by capillary action if it is held verticallyin the water, or a pipette bulb may be used.
F. Cover the apparatus and swirl it to mix the sterile dilution water and the one-mL test sample water.
G. Attach the hand pump to the equipment and filter the water. Sterilize the forceps. Then remove the filterand set it into the petri dish on top of the MF-Endo saturated pad. Close the petri dish.
H. Store the dish upside down in a dark place at room temperature. (Petri dishes are incubated in aninverted position to prevent condensation or moisture from falling on bacterial colonies: It causes themto “run together.”)
I. Observe and describe the dishes each day for five days. Fill in the student data.
J. Counting the coliforms: Coliform colonies have a distinct metallic green sheen. Count only the obviouscoliform colonies.
III. Follow-Up
A. The following is another convenient way to test for the “quantitative” presence of coliform bacteria withoutusing an expensive membrane filtration kit.
1. Make up one or more sterile EMB agar-agar plates per group.
2. If you are using 100-mm sized petri dishes, pipette one mL of test sample (river or bay water)directly into the dish. Cover the dish and swirl the sample so the water covers as much agar aspossible.
3. Store the petri dish upside down in a warm dark place at room temperature.
4. The presence of metallic green colonies is a positive test for coliform bacteria. Count the coliformcolonies.
B. Due to crowding of the bacteria, it may be impossible to count all the colonies. Nevertheless, thisexperiment will give you a rough idea of the relative numbers of coliforms present in the water sample.Though relatively inaccurate, this procedure is fast, simple and very inexpensive. In addition, it requiresa minimum amount of equipment. Even if you don’t find coliforms, you will discover other kinds ofbacteria, which in itself is interesting. A third simplified plate technique exists. Contact Alabama WaterWatch for name, cost, and procedure.
C. Contact the local wastewater treatment plant. The plant operator might be willing to provide equipmentor split a sample to verify students’ results. The telephone and name can be gotten by calling the cityhall, township hall, or village hall.
3-16
IV. Extensions
A. Take additional pictures of the results from the experiment and place the colony pictures with the correctphotos taken from the different areas of the water you tested.
B. Have students correlate and graph the results of the experiments.
C. Students will then take the information and put it on the computer to send to their Conservation, NaturalResources, or Public Health agencies. Comparisons are requested from these departments.
RESOURCES
Biggs, A., Kapitka, C., and Lundgren, L., Biology: The Dynamics of Life, Glencoe, NT, 1995.
Cunningham, W. and Saigo, B., Environmental Science, Brown Publishers, Dubuque, IA, 1995.
6-8
3-17
Day 3 Date __________________________
1 2 3
Description Description Description
Day 2 Date __________________________
1 2 3
Description Description Description
Day 1 Date __________________________
Inoculate three dishes with water from (1) _____________, (2)_____________, and (3) _______________.
STUDENT SHEET COLIFORM BACTERIA AND OYSTERS
Directions:Label each of the three petri dishes with the source of the water used.Inoculate each dish with water, tape the lids on, and place it in a warm (not hot), dark place.Draw and describe what is observed each day on each dish by filling in the information below.
6-8
3-18
STUDENT SHEET COLIFORM BACTERIA AND OYSTERS
Day 3 Date __________________________
1 2 3
Description Description Description
Day 2 Date __________________________
1 2 3
Description Description Description
Day 1 Date __________________________
Inoculate three dishes with water from (1) _____________, (2)_____________, and (3) _______________.
6-8
3-19
ALGAE GROWTH
OBJECTIVES
The student will do the following:
1. Test the effects of common pollutants on algae growth in water.
2. Observe the growth of algae in a water sample.
BACKGROUND INFORMATION
Algae are simple plants. They generally do not have vascular tissue, andthey do not show the high level of organ differentiation of the familiar,more complex plants. Most algae are photoautotrophic, which meansthat they can make their own food materials through photosynthesis byusing sunlight, water, and carbon dioxide.
Algae are the chief food source for fish and for all other types of organismsthat live in the water. They also contribute substantially to the store ofoxygen on Earth. There are approximately 25,000 species of algae. Thesimplest algae consist of a single cell of protoplasm, a living jelly-likedrop. No larger than three microns, the size of a large bacterium, it isvisible only under a microscope. The most complex algae are the giant kelps of the ocean that may be 200 feet(60 meters) long.
Algae are found all over the Earth, in oceans, rivers, lakes, streams, ponds, and marshes. They sometimesaccumulate on the sides of glass aquariums. Algae are found on leaves, especially in the tropics and subtropics,and on wood and stones in all parts of the world. Some live in or on higher forms of plants and animals. Andsome exist in places where few living things are able to survive. One or two species capable of toleratingtemperatures of 176 degrees F (80 degrees C) dwell in and around hot springs. A small number live in the snowand ice of the Arctic and Antarctic regions.
Marine algae, such as the common seaweeds, are most noticeable on rocky coastlines. In northern temperateclimates, they form an almost continuous film over the rocks. In the tropics they are found on the floors oflagoons. They are associated with coral reefs and island atolls. A few saltwater species of green algae secretelimestone that contributes to reef formation. In freshwater, algae are not noticeable unless the water is polluted.
All algae contain the green pigment chlorophyll. This substance makes it possible for algae to performphotosynthesis. Other pigments also are present, giving different algae the distinct colors that are used as abasis of classification.
Algae are of special interest because they include the most primitive forms of plants. They have no true roots,stems, or leaves, and they do not produce flowers or seeds, as higher plants do. Yet all other groups of plantsmay have evolved from algae.
Algal blooms are a serious consequence of human activities effect upon the water quality and temperature.When massive amounts of algae literally overtake an area of water due to excessive nutrients, it is consideredan algal bloom. In addition to being unsightly and smelly, masses of blue-green algae can literally choke the lifeout of a lake or pond by depriving it of much needed oxygen. At first glance this may seem like something of aparadox: since blue-green algae undergo photosynthesis, they should produce more oxygen than they consume.However, after large concentrations of algae have built up, aerobic processes such as respiration and thedecomposition of dead algal cells becomes increasingly significant. Under extreme conditions, a eutrophic lake
SUBJECTS:Biology, Botany, Math
TIME:2 weeks
MATERIALS:1-L soda bottles with labelsdistilled waterthree types of laundry or
dishwashing detergents (twowith and one without
phosphate)lawn fertilizergraduated cylinderpond water samplesmicroscopestudent sheetsvarious algae
3-20
or pond may be left entirely devoid of fish.
Terms
algae: any of a large group of simple plants that contain chlorophyll; are not divisible into roots, stems andleaves; do not produce seeds; and include the seaweeds and related freshwater and land plants.
nonpoint source pollution (NPS): pollution that cannot be traced to a single point, because it comes frommany individual places or a widespread area (Example: urban and agricultural runoff).
non-vascular plant: a plant that does not have specialized tissue for transporting water, minerals, and food.
nitrates: used generically for materials containing this ion group made of nitrogen and oxygen (NO3
–); sourcesinclude animal wastes and some fertilizers; can seep into groundwater; linked to human health problems, including“blue baby” syndrome (methemoglobinemia).
phosphate: used generically for materials containing a phosphate group (PO4
3-); sources include some fertilizersand detergents; when wastewater containing phosphates is discharged into surface waters, these chemicals actas nutrient pollutants (causing overgrowth of aquatic plants).
ADVANCE PREPARATION
A. Collect soda bottles and place labels on them. Collect several water samples from ponds and other localsources.
1. Label the bottles “A,” “B,” “C,” “D,” and “E.”
B. List these figures and compute their corresponding percentages on the chalkboard: If we represent theEarth’s entire supply of water as 1,000 mL, then 28 mL represents the total freshwater supply and the remaining972 mL is saltwater that occurs primarily in oceans.
PROCEDURE
I. Setting the stage
A. Explain to the students the importance of unicellular algae to worldwide oxygen production. Have themobserve some examples of various algae both with a magnifying glass and under a microscope.
B. Display several detergent and fertilizer containers. Notice on the list of ingredients whether or not theycontain nitrates and phosphates and in what amounts.
II. Activities
A. Pour 900 mL distilled water into each of the five bottles.
1. Add 90 mL pond water to Bottle A.
2. Add 90 mL pond water and 15 mL detergent # 1 to Bottle B.
3. Add 90 mL pond water and 15 mL detergent # 2 to Bottle C.
4. Add 90 mL pond water and 15 mL detergent # 3 to Bottle D.
5. Add 90 mL pond water and 15 mL fertilizer to Bottle E.
B. Ask students to make predictions as to what they think will occur.
3-21
C. Set the uncovered bottles in a well-lighted place for about two weeks, ensuring that each bottle receivesan equal amount of light each day.
D. Have students compare and record their observations on the student sheet. Take note of any algaegrowth that they notice.
III. Follow-Up
A. Have the students write up the lab activity by completing the student sheet.
B. Have students list and draw several different types of algae that may be present.
C. Have students locate several different types of detergents used in their home and list the phosphate andnitrate content of each.
D. What are the environmental implications of algae blooms to lakes and streams? Which are most severelyaffected? Why?
IV. Extensions
A. Look up algae blooms that occur when fire algae reproduce rapidly. Have students investigate howthese blooms affect the animals in the water.
B. Have students go the supermarket and take notes on which detergents contain phosphates (list amount)and those that do not.
C. Contact a local nursery and find alternatives to processed fertilizers. How are they better for theenvironment?
D. Use a microscope to examine the microorganisms found in each bottle.
RESOURCES
Algal Bloom: http://pasture.ecn.purdue.edu/agen521/epadir/wetlands/algal_bloom.html
Introduction to Algae: http://www.botany.uwc.ac.za/presents/algae1/index.html
Compton’s New Media, Inc., Compton’s Interactive Encyclopedia, 1995.
6-8
3-22
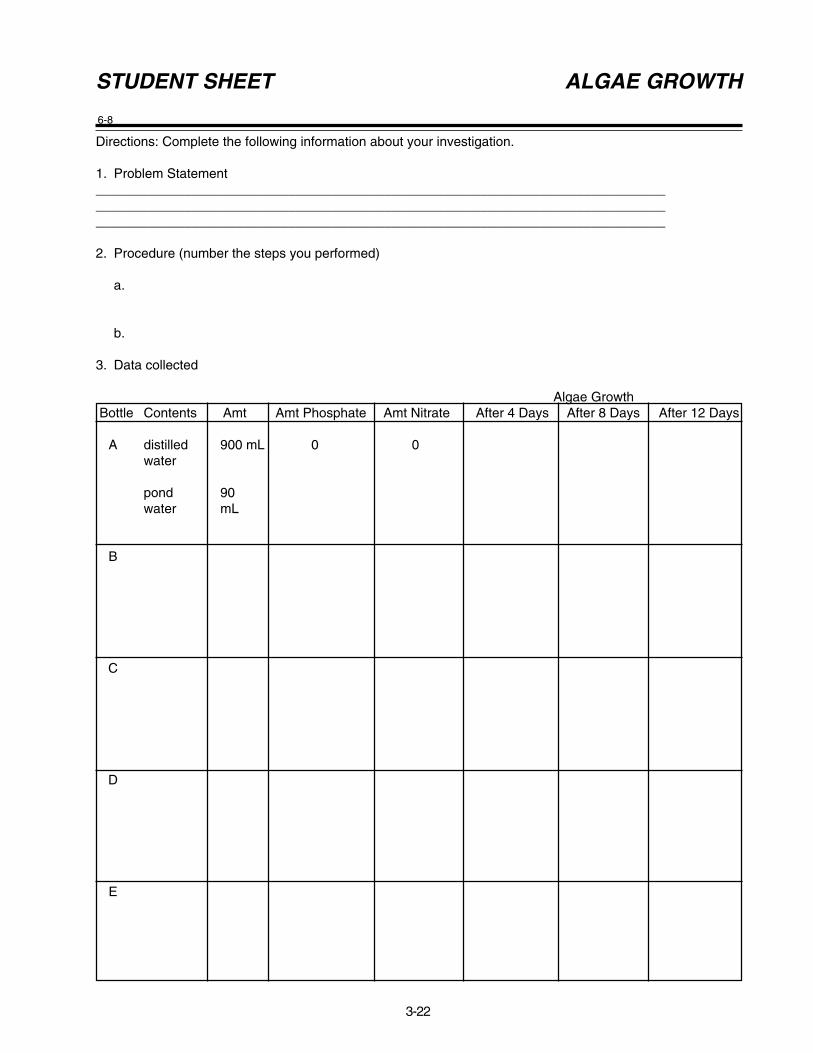
Directions: Complete the following information about your investigation.
1. Problem Statement_______________________________________________________________________________________________________________________________________________________________________________________________________________________________________
2. Procedure (number the steps you performed)
a.
b.
3. Data collected
Algae Growth Bottle Contents Amt Amt Phosphate Amt Nitrate After 4 Days After 8 Days After 12 Days
A distilled 900 mL 0 0water
pond 90water mL
B
C
D
E
STUDENT SHEET ALGAE GROWTH
6-8
3-23
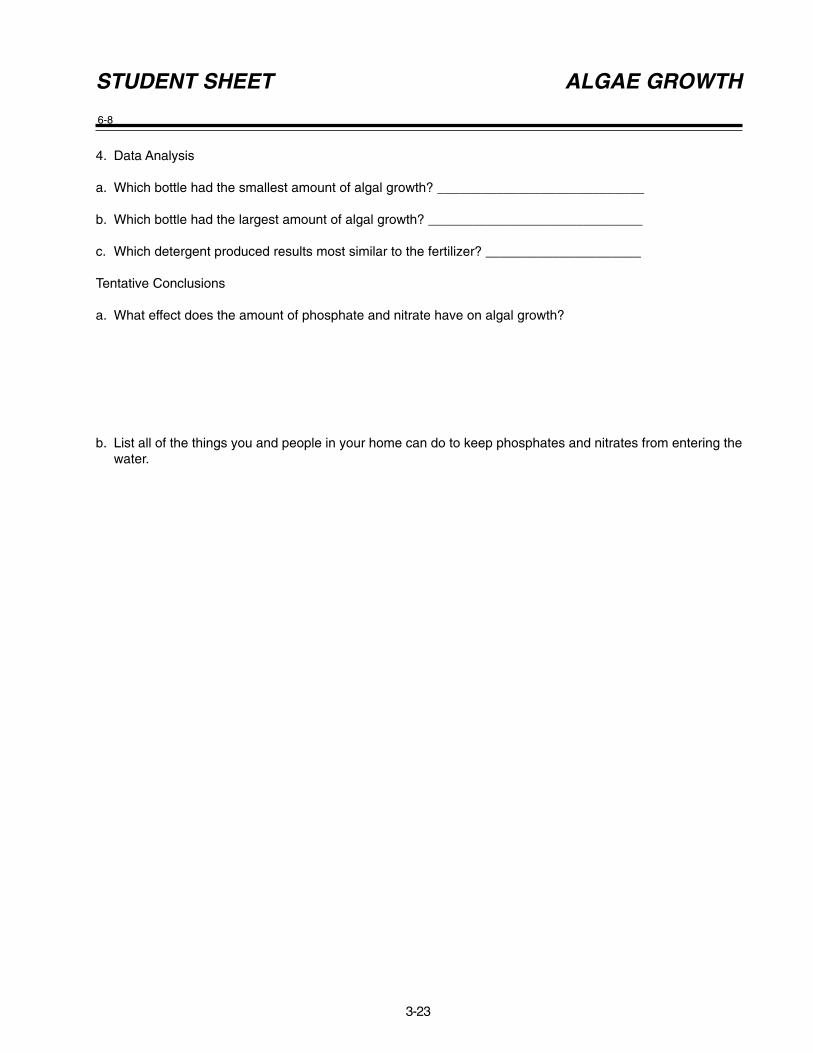
4. Data Analysis
a. Which bottle had the smallest amount of algal growth? ____________________________
b. Which bottle had the largest amount of algal growth? _____________________________
c. Which detergent produced results most similar to the fertilizer? _____________________
Tentative Conclusions
a. What effect does the amount of phosphate and nitrate have on algal growth?
b. List all of the things you and people in your home can do to keep phosphates and nitrates from entering thewater.
STUDENT SHEET ALGAE GROWTH

6-8
3-24
6-8
3-25
SMALL FRYE
OBJECTIVES
The student will do the following:
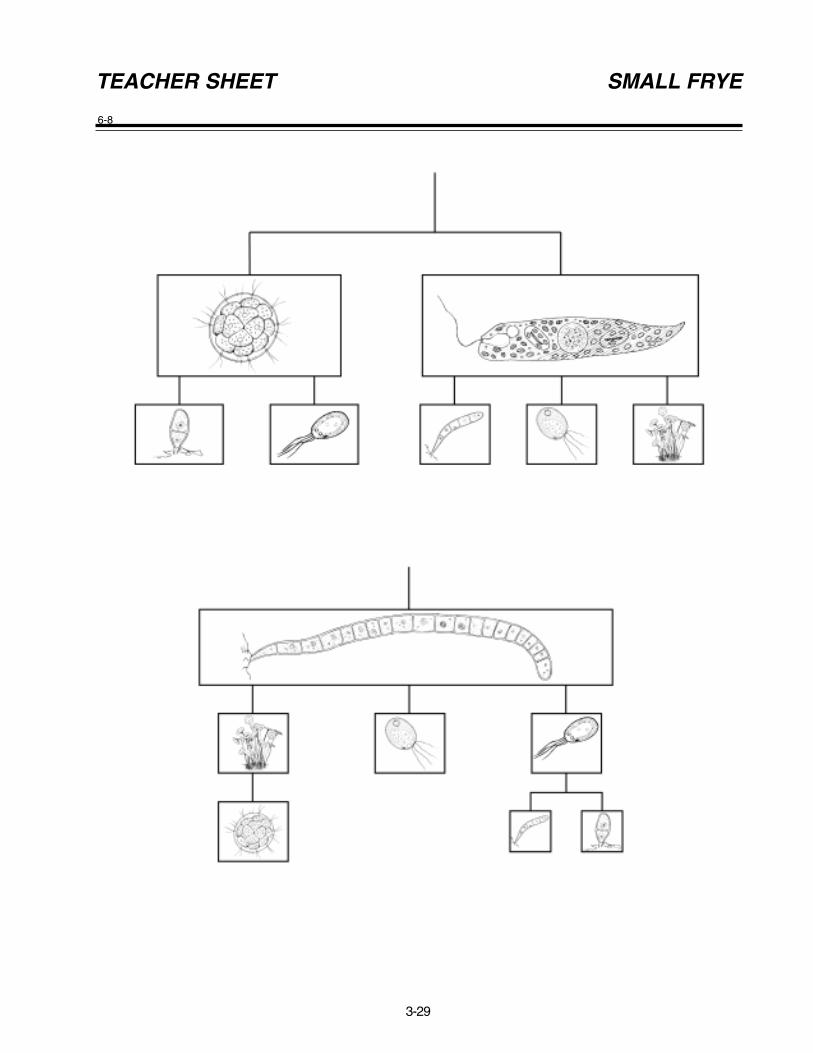
1. Identify various forms of microscopic life that live in water.
2. Compare the relationship of various aquatic plants and animals.
BACKGROUND INFORMATION
When Robert Hooke and Anton Van Leeuwenhoek, inventors of themicroscope, observed the small world of ponds and streams, they wereamazed to find life forms. It was obvious that thousands of small organismslived in water. Microorganisms, both plants and animals, are essential inthe food supplies of fish, aquatic birds, amphibians, and mammals—yes,even humans.
Microorganisms can be divided into the following categories:
Bacteria: Bacteria are single-cell microbes that grow in nearly everyenvironment on Earth. They are used to study diseases and produceantibiotics, to ferment foods, to make chemical solvents, and in manyother applications.
Protozoans: Protozoans are small single-cell microbes. They are frequently observed as actively movingorganisms when impure water is viewed under a microscope. Protozoans cause a number of widespread humanillnesses, such as malaria, and thus can present a threat to public health.
Algae: These are organisms that carry out photosynthesis in order to produce the energy they need to grow.
Fungi: These are well-known organisms, such as mushrooms and bread mold, that lack chlorophyll. Fungiusually derive food and energy from parasitic growth on dead organisms.
Viruses: Viruses are the smallest form of replicating microbes. Viruses are never free-living; they must enterliving cells in order to grow. Thus, they are considered by most microbiologists to be nonliving. There is aninfectious virus for almost every known kind of cell. Viruses are visible only with the most powerful microscopes,namely electron microscopes.
One way to eliminate microorganisms from water supplies is to add chlorine. Adding chlorine to drinking watervirtually eliminates waterborne diseases, such as cholera, by destroying these disease-causing microorganisms.
Microorganism's habitats may be as large as an ocean or smaller than a grain of sand. The ubiquity or extremeprevalence of microorganisms is due to the following characteristics and abilities:
1. Small size allows for easy dispersal.2. Energy conversion is not restricted to aerobic condition, they survive and thrive in anaerobic conditions
(without oxygen).3. Extreme metabolic versatility, they can utilize a broader range of nutrients than eukaryotes; unique ability to
fix atmospheric nitrogen.4. Tolerate unfavorable environmental conditions.
SUBJECTS: Art, Microbiology
TIME:2 class periods
MATERIALS:one gallon jar of pond water18 hand lensesone microscope for every team
of two studentspenspencils3 packs assorted colors of poster
paperkite string or fishing line75 plastic straws35 wire coat hangersteacher sheetstudent sheet
3-26
Terms
microorganisms: organisms too small to be seen with the unaided eye, including bacteria, protozoans, yeasts,viruses, and algae.
pond: an enclosed body of water usually smaller than a lake.
food web: the connections among everything organisms in a location eat and are in turn eaten by.
food chain: a succession of organisms in a community that constitutes a feeding order in which food energy istransferred from one organism to another as each consumes a lower member and in turn is preyed upon by ahigher member.
habitat: the arrangement of food, water, shelter, and space suitable to an organism’s needs.
ADVANCE PREPARATION
A. Introduce students to the term “microorganisms.” Ask them to list what they have heard, learned, or readabout these microorganisms.
B. Ask students to write a one-page essay of what life would be like if they were microscopic.
PROCEDURE
I. Setting the stage
A. Students will take a field trip to an environmental center or area in their neighboor or town to observe lifein a pond or view a video or film about pond life.
B. Have students share their observations with other members of the class, either orally or in writing.
II. Activity
A. The teacher will collect pond water samples and furnish each team with one tablespoon of the watersample. Samples are to be taken from within the container and not just at the surface. Students are toexamine the water with microscopes and hand lenses.
B. Students are to draw or make sketches of the microorganisms they observe.
C. After they have sketched several organisms, they are to select a favorite life form from which to constructa microorganism mobile.
III. Follow-Up
A. Invite a laboratory technician who works for a water or wastewater treatment plant that usesmicroorganisms to break down wastes into harmless substances.
B. Have the students collect samples of pond water from various ponds and observe the microorganisms.
IV. Extensions
A. Have a contest for the best constructed “Microorganism Mobile.”
B. Read aloud stories written by the students about their life as a microscopic organism.
C. Have pictures of common microorganisms that are found in pond water and have students identify theirsketches with the pictures.

3-27
RESOURCES
Aquatic Project Wild, 1987. P.O. Box 18060, Boulder, CO 80308-8060. (303) 444-2390.
Compton’s Interactive Encyclopedia. Compton’s NewMedia, Inc., 1994, 1995.
Eliminating Microbes from Water: http://c3.org/curriculum/bbc5.html
Life Science, Grade 7, Prentice Hall, 1991.
Microorganisms in Their Natural Environment: http://www.towson.edu/~wubah/miceco/natural_envts.html
6-8
3-28
STUDENT SHEET SMALL FRYE
Directions: Draw the organisms you observe in the pond water.
6-8
3-29
TEACHER SHEET SMALL FRYE

3-30
6-8
3-31
SURFACE FREEZING
OBJECTIVES
The student will do the following:
1. Create a moving picture of the circulation of water in a pondthawing after a winter freeze.
2. Explain the impact of surface freezing on the life of a pond.
BACKGROUND INFORMATION
The surface of a body of water receives adequate sunlight to sustain adiverse population of organisms. The region of water which receives thissunlight is known as the littoral zone. Autotropic organisms cannot,however, survive in zones inaccessible to sunlight. This zone, known asthe benthic zone, is host to other types of organisms called heterotrophs.In addition, organisms that die will sink to the bottom and decompose,replenishing the pond with nutrients.
As the air temperature decreases and falls below zero degrees Celsius, the freezing point of water, the surfacewater will begin to freeze. Sustained below-freezing temperatures will allow the pond or lake to maintain ablanket of ice at its surface. Life at the surface will decrease due to the lack of adequate sunlight, and competitionfor food will increase among heterotrophs. As the surface ice begins to melt in the springtime, this colder, denserwater will sink to the bottom. As it does, it creates a convection current in the pond which will carry the nutrientsresting on the bottom to other zones in the pond, including the littoral zone. After the surface ice has completelymelted, the littoral zone, as well as other zones, will once again contain a diverse population of life.
Terms
autotroph: an organism that can make its own food (usually using sunlight).
benthic zone: the lower region of a body of water including the bottom.
convection current: the transfer of heat by the mass movement of heated particles.
heterotroph: an organism that is not capable of making its own food.
littoral zone: region in a body of water that sunlight penetrates.
ADVANCE PREPARATION
A. Have each student bring an empty one- or two-liter plastic soda container.
B. Prepare colored ice cubes (blue in color).
C. Run off a student sheet for each student.
D. Remove the label and clean the inside of the container.
E. Cut off the top portion of the container.
SUBJECTS:Chemistry, Math
TIME:50 minutes
MATERIALS:clear plastic soda containerice cube trayswaterblue and yellow dyescissorscolored pencilsgraph paperstaplerstudent sheet
3-32
PROCEDURE
I. Setting the stage
A. Discuss the background information to be sure the students understand the terms.
B. Explain the behavior of water in its three states.
II. Activity
A. Gather the materials.
1. Fill the container three-fourths full with hot water.
2. Add a few drops of yellow dye to the container and let stand for several minutes or until the water isno longer circulating.
3. Place one colored ice cube in the container and observe.
4. Have students write down observations as the ice is melting.
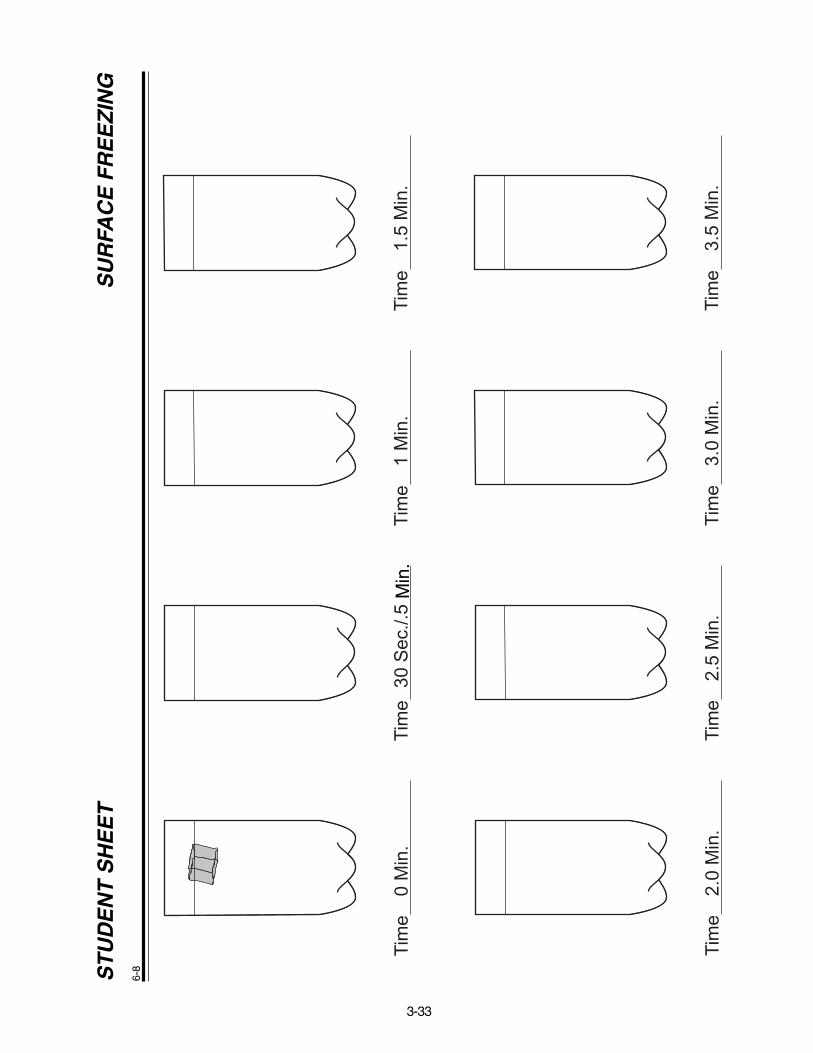
5. Have the students use the student sheet to make a precise drawing of the appearance of the containerevery 30 seconds until the ice has completely melted. (Be sure to instruct them to note the positionand size of the ice over time in their drawing, as well as the color of the water in the rest of thecontainer.)
6. Color the drawings with the proper colors and place the sheets in the proper sequence and stapletogether.
III. Follow-Up
A. Have the students observe the moving picture of their experiment and compare it to others in the class.Have them explain the similarities and differences between their results.
B. Have the students write up this activity in proper scientific form including a purpose, materials, procedure,results, and conclusion.
IV. Extension
A. Use real samples of pond water (obtaining both bottom sediments and water) and compare the quantityof organisms in each zone before and after melting a top layer. Use a microscope to observe and drawthe organisms and graph results.
RESOURCE
Robson, P. and Seller, M., Encyclopedia of Science Projects, Shooting Star Press Inc., New York, 1994.
3-33
Tim
e0
Min
.Ti
me
30 S
ec./.
5 Ti
me
1 M
in.
Tim
e1.
5 M
in.
Tim
e2.
0 M
in.
Tim
e2.
5 M
in.
Tim
e3.
0 M
in.
Tim
e3.
5 M
in.
ST
UD
EN
T S
HE
ET
S
UR
FAC
E F
RE
EZ
ING
Min
.
6-8

3-34
6-8
3-35
SURFACE TENSION
OBJECTIVES:
The students will do the following:
1. Explain the concept of surface tension.
2. Identify the process by which surface tension can be broken bythe addition of detergents.
BACKGROUND INFORMATION
The tendency of a liquid to form a relatively tough “skin” or film on itssurface is known as surface tension. Surface tension is caused by theattraction between the molecules of the liquid; it is surface tension thatcauses water molecules to stick together and to form droplets. The surfacetension that holds drops together makes it difficult for the water to penetrateor “wet” fabrics or skin; consequently, many soaps or detergents contain“wetting” agents designed to reduce surface tension and to increase fabric penetration by water.
If you could see molecules of water and how they act, you would notice that each water molecule electricallyattracts its neighbors. Each has two hydrogen atoms and one oxygen atom, H
20. The extraordinary stickiness of
water is due to the two hydrogen atoms, which are arranged on one side of the molecule and are attracted to theoxygen atoms of other nearby water molecules in a phenomenon known as “hydrogen bonding.” (If the moleculesof a liquid did not attract one another, then the constant thermal agitation of the molecules would cause the liquidto instantly boil or evaporate.)
Hydrogen atoms have single electrons which tend to spend a lot of their time “inside” the water molecule, towardthe oxygen atom, leaving their outsides naked, or positively charged. The oxygen atom has eight electrons, andoften a majority of them are around on the side away from the hydrogen atoms, making this face of the atomnegatively charged. Since opposite charges attract, it is no surprise that the hydrogen atoms of one watermolecule like to point toward the oxygen atoms of other molecules. Of course in the liquid state, the moleculeshave too much energy to become locked into a fixed pattern; nevertheless, the numerous temporary “hydrogenbonds” between molecules make water an extraordinarly sticky fluid.
Within the water, at least a few molecules away from the surface, every molecule is engaged in a tug of war withits neighbors on every side. For every “up” pull there is a “down” pull, and for every “left” pull there is a “right” pull,and so on, so that any given molecule feels no net force at all. At the surface things are different. There is no uppull for every down pull, since of course there is no liquid above the surface; thus the surface molecules tend tobe pulled back into the liquid. It takes work to pull a molecule up to the surface. If the surface is stretched - aswhen you blow up a bubble - it becomes larger in area, and more molecules are dragged from within the liquidto become part of this increased area. This “stretchy skin” effect is called surface tension. Surface tension playsan important role in the way liquids behave. If you fill a glass with water, you will be able to add water above therim of the glass because of surface tension.
You can float a paper clip on the surface of a glass of water. Before you try this you should know that it helps ifthe paper clip is a little greasy, so the water doesn’t stick to it. Place the paper clip on a fork and lower it slowlyonto the water. The paper clip is supported by the surface-tension skin of the water.
The water strider is an insect that hunts its prey on the surface of still water; it has widelyspaced feet rather like the pads of a lunar lander. The skin-like surface of the water is depressed under the waterstrider’s feet.
SUBJECTS:Chemistry, Language Arts,Physical Science
TIME:50 minutes
MATERIALS:petri dishcontainer of waterloop of threaddishwashing detergenttoothpickslist of vocabulary words for follow-
up activitystudent sheet
3-36
Terms
surface tension: the elastic-like force in a body, especially a liquid, tending to minimize, or constrict, the area ofthe surface.
polar: of or relating to a pole of a magnet.
adhesion: the molecular attraction exerted between the surfaces of bodies in contact.
cohesion: the force of attraction between the molecules in a mass.
polarity: the quality or condition inherent in a body that exhibits opposite properties or powers in opposite partsor directions or that exhibits contrasted properties or powers in contrasted parts or directions.
positive charge: of, being, or relating to electricity of a kind that is produced in a glass rod rubbed with silk.
negative charge: of, being, or relating to electricity of which the electron is the unit and which is produced in ahard rubber rod which has been rubbed with wool.
ADVANCE PREPARATION
A. Place petri dishes, containers of water, loops of thread, and small containers of detergents at each labstation.
B. Prepare the list of words for use in the follow-up activity.
PROCEDURE
I. Setting the stage
A. Students will perform the activity before it is discussed. This activity is best discussed after studentshave manipulated the thread in the water and observed the results.
B. Students are reminded to make careful observations about the loop of thread during each step of thisactivity.
II. Activity
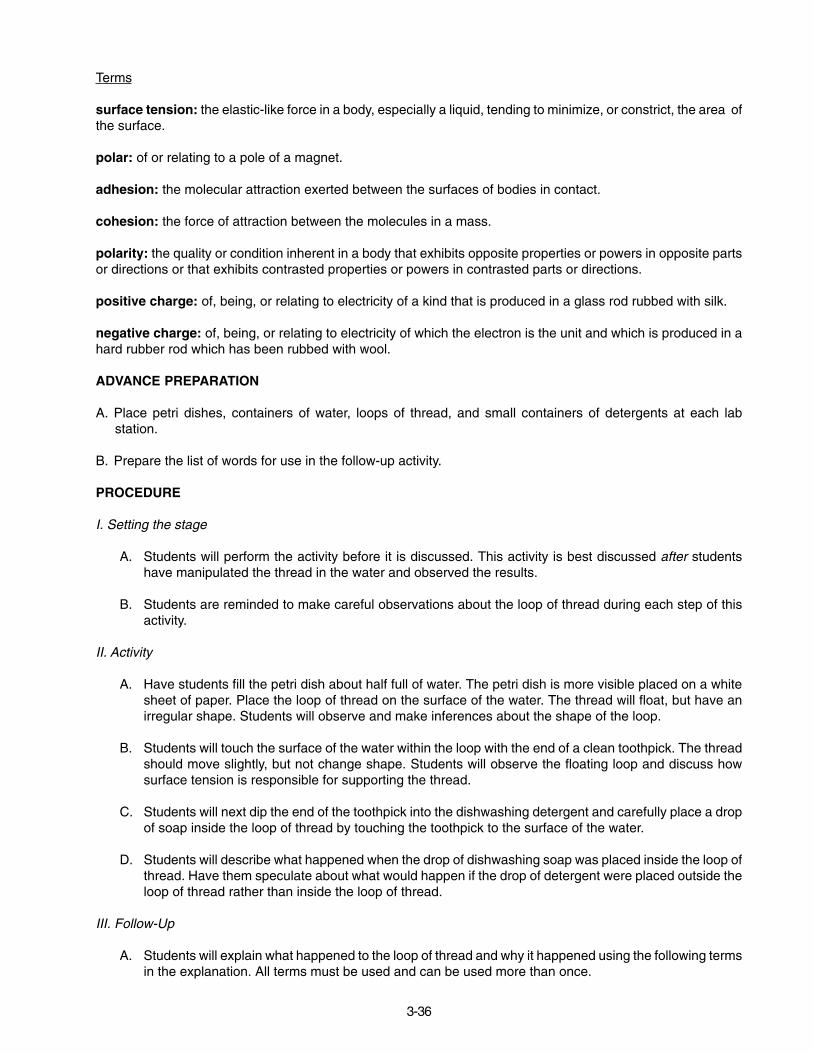
A. Have students fill the petri dish about half full of water. The petri dish is more visible placed on a whitesheet of paper. Place the loop of thread on the surface of the water. The thread will float, but have anirregular shape. Students will observe and make inferences about the shape of the loop.
B. Students will touch the surface of the water within the loop with the end of a clean toothpick. The threadshould move slightly, but not change shape. Students will observe the floating loop and discuss howsurface tension is responsible for supporting the thread.
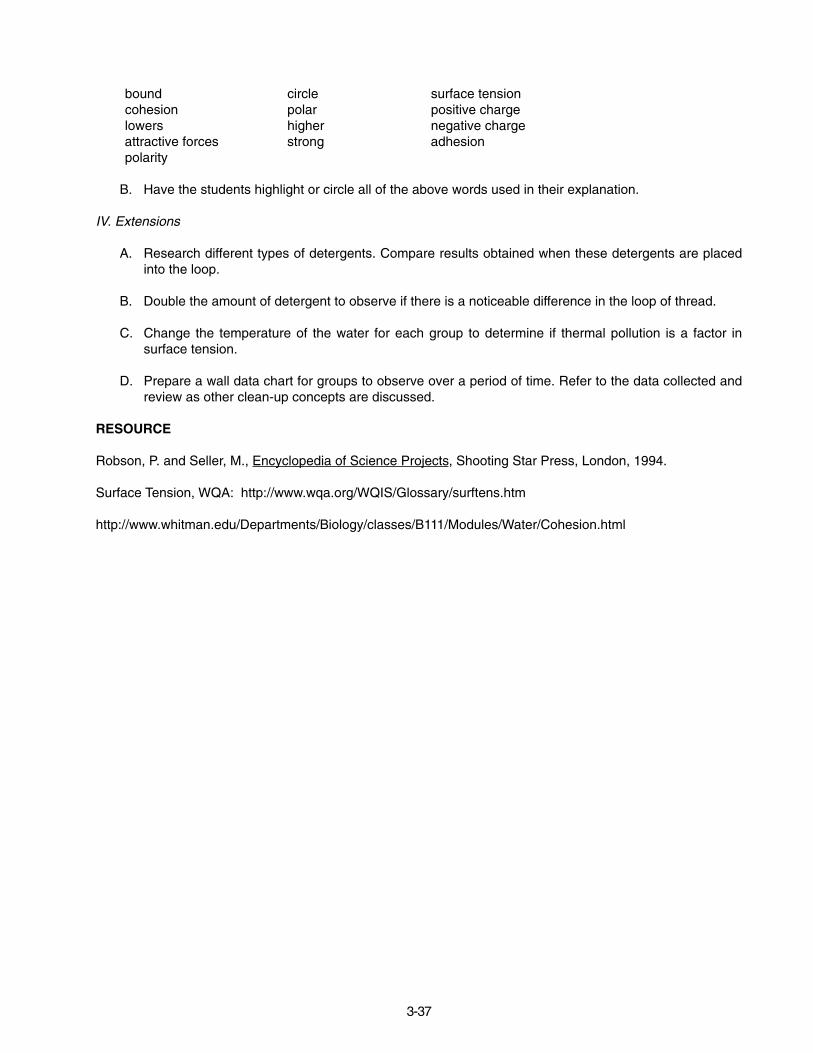
C. Students will next dip the end of the toothpick into the dishwashing detergent and carefully place a dropof soap inside the loop of thread by touching the toothpick to the surface of the water.
D. Students will describe what happened when the drop of dishwashing soap was placed inside the loop ofthread. Have them speculate about what would happen if the drop of detergent were placed outside theloop of thread rather than inside the loop of thread.
III. Follow-Up
A. Students will explain what happened to the loop of thread and why it happened using the following termsin the explanation. All terms must be used and can be used more than once.
3-37
bound circle surface tension cohesion polar positive charge lowers higher negative charge attractive forces strong adhesion polarity
B. Have the students highlight or circle all of the above words used in their explanation.
IV. Extensions
A. Research different types of detergents. Compare results obtained when these detergents are placedinto the loop.
B. Double the amount of detergent to observe if there is a noticeable difference in the loop of thread.
C. Change the temperature of the water for each group to determine if thermal pollution is a factor insurface tension.
D. Prepare a wall data chart for groups to observe over a period of time. Refer to the data collected andreview as other clean-up concepts are discussed.
RESOURCE
Robson, P. and Seller, M., Encyclopedia of Science Projects, Shooting Star Press, London, 1994.
Surface Tension, WQA: http://www.wqa.org/WQIS/Glossary/surftens.htm
http://www.whitman.edu/Departments/Biology/classes/B111/Modules/Water/Cohesion.html
6-8
3-38
Gently touch surface of water with a clean toothpick and observe
Place one drop of detergent inside the loop of thread and observe
Detergent
STUDENT SHEET SURFACE TENSION
6-8
3-39
RUNOFF
OBJECTIVES
The students will do the following:
1. Define surface water, runoff, drainage basin, permeable, andimpermeable.
2. Identify factors affecting runoff in a drainage basin.
3. Perform an experiment on drainage basins.
BACKGROUND INFORMATION
Water found above the ground is called surface water. That is because itis located or seen on the Earth’s surface. Oceans and rivers are examplesof natural surface water bodies. Most surface water bodies are natural;however, there are many bodies of surface water that are made artificially.
The area where water drains off the land into a river or lake is called adrainage basin. Water that drains off the land into the basin is calledrunoff. Many things determine the runoff in a drainage basin. Water movesslowly along flat land or a gently sloping hill. When the water movesmore slowly, it can evaporate or soak into the ground. A steep slope willcause water to flow more quickly into a surface water body. That is why drainage basins with steep slopes oftenflood.
Vegetation such as plants, trees, and grass help slow the water flowing through a basin. Trees and other plantsalso help to hold water on or above the ground. By doing so, they allow the water time to soak into the ground orto evaporate. Different kinds of soil have differing abilities to hold water. Water moves more quickly and easilythrough layers of sand and gravel than through clay. This is because clay is not as permeable as sand or gravel.Permeability is how fast water can flow through an object. Because clay particles fit tightly together, water doesnot flow through clay very easily. Clay is said to be impermeable. The next time it rains, watch what happens tothe water running off the sidewalk or street near your home, then watch the water that falls on ground coveredwith trees, grass, or other plants. Notice which type of surface has the faster-flowing water. Rainwater that runsoff a paved surface and does not soak into the ground is called storm water runoff. This water usually flows intothe nearest body of water.
Terms
surface water: precipitation that does not soak into the ground or return to the atmosphere by evaporation ortranspiration. It is stored in streams, lakes, rivers, ponds, wetlands, oceans, and reservoirs.
drainage basin: an area drained by a main river and its tributaries.
runoff: water (originating as precipitation) that flows across surfaces rather than soaking in; eventually enters awater body; may pick up and carry a variety of pollutants.
permeable: passable; allowing fluid to penetrate or pass through it.
impermeable: impassable; not permitting the passage of a fluid through it.
SUBJECT:Biology, Geology
TIME:1-2 class periods
MATERIALS:county map / state map of your areastudent notebooksplastic box or pan at least one foot
by two feetsandbox sand, enough to fill half
the boxtwo 250 mL cups65 mL chocolate syrupone 20 cm by 20 cm square of sod
or several smaller grass plugsa metric measuring cupwaterbucket or potteacher sheet
3-40
storm water runoff: surface water runoff that flows into storm sewers or surface waters.
ADVANCE PREPARATION
A. Study the background information so it may be presented to the class in an organized manner.
B. Write the vocabulary words on the board so the students may view the words that will be covered in thislesson.
C. Have materials ready for the experiment.
PROCEDURE
I. Setting the stage
A. Have materials set out on a table in the front of the room. Tell the students that they will be learningabout surface water and will be performing an interesting experiment.
II. Activity
A. Discuss the background information with the students.
B. Ask the following questions:
1. What is water above the ground called?
2. What makes water drain from one area to another?
3. What does permeable mean?
4. Through what soils does water move quickly?
5. Why does water move slowly through clay?
6. What does storm water runoff mean?
7. Name some examples of things storm water can pick up as it travels over land.
8. Where might storm water runoff go in rural areas?
C. Have the students perform the following experiment.
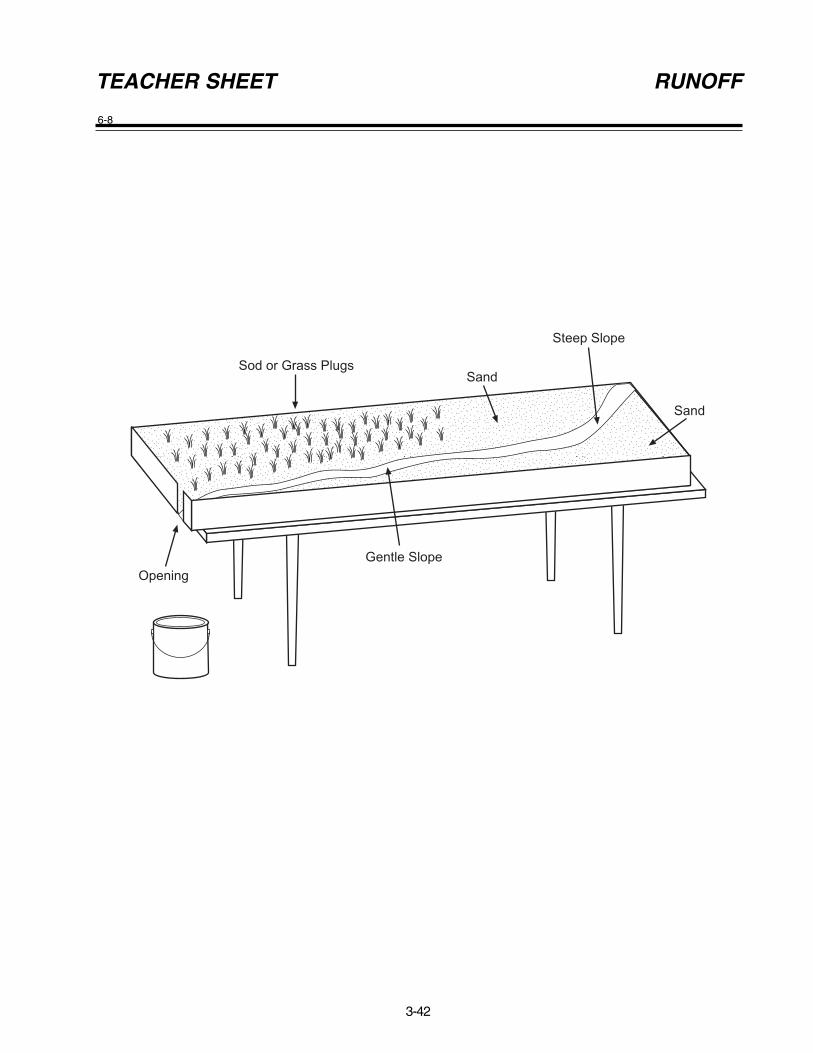
1. Fill the box or pan half full of sand. Diagonally, from the top corner of the box to the bottom corner,make a surface water (river) channel. Scoop sand from the middle of the box up onto the sides toform river banks. Make a steep slope on one side of the river and a gentle slope on the other side.
2. Place the sod square or several grass plugs on the side with a gentle slope. This represents wetlandsvegetation.
3. Place bucket or pot under opening.
4. Position one student on each side of the “river” holding the 8-ounce cups of water. These studentswill make it “rain” on the river. Very slowly and at the same time, have one student pour water on thesandy side, while the other pours water on the grassy area. Observe which runoff flows faster anddrains into the “river” first.
3-41
D. Repeat Step C, using 65 mL of chocolate syrup. The syrup represents storm water pollution. Observewhat happens.
E. Repeat Step C, again, pouring 125 mL of water on the syrup. Observe what happens.
F. Ask the following questions:
1. Which side of the river had the fastest runoff?
2. What effect did the grass or sod have on storm water runoff? On pollution?
3. Did you see anything in this experiment that would help you decide whether the sand is permeableor impermeable? If so, what?
4. List several things that determine the speed of runoff in a drainage basis.
III. Follow-Up
A. Have the students list examples of surface water bodies in their county and state. Let your students seehow many water bodies they can name before posting the maps.
B. Have the students determine where the school’s storm water runoff drains.
1. Are there steep or gentle slopes around the school yard?
2. What types of pollution would this storm water pick up as it drains from the school yard?
IV. Extensions
A. Ask students to find out the average rainfall for their city or county.
B. Have students bring in various types of soil and design their own experiments to test which soils arepermeable or impermeable.
C. Have students do research in the library to locate information on how to make a rain gauge.
1. Help students make their own rain gauges and have them keep track of rainfall amounts for onemonth in their waterways notebook.
2. Have them design a bar graph to show rainfall totals. Have students do this at home and thencompare their findings with others in their class. Sometimes it will rain on one side of the street andnot on the other.
D. Contact the local office of the Natural Resources Conservation Service (formerly known as the SoilConservation Service, or SCS) to request a guest speaker on the “soil profile” of your area. Ask the SCSrepresentative for more information and experiments on soil types.
RESOURCE
Johnson, C., Waterways: A Water Resource Curriculum, St. John’s River Management District, Jacksonville, FL,1991.
6-8
3-42
����������������yyyyyyyyyyyyyyyy
Sod or Grass PlugsSand
Steep Slope
Sand
Gentle SlopeOpening
TEACHER SHEET RUNOFF
6-8
3-43
THE SHRINKING ANTACID
OBJECTIVES
The student will do the following:
1. Define acid rain.
2. Explain what causes acid rain.
3. State various substances found in acid rain.
4. Describe the effects of vinegar on antacid tablets.
BACKGROUND INFORMATION
Normal rain has a pH of between 5.6 and 6.0, whereas acid rain has apH between 2.0 and 5.6. Acid rain leads to several detrimental effects inthe ecosystem. A very highly publicized problem is the effect of acid rainon trees. Conifers appear to be particularly affected, with needles dropping off and seedlings failing to producenew trees. The acid also reacts with many nutrients the trees need, such as calcium, magnesium, and potassium.The trees then starve, which makes them much more susceptible to other forms of damage, such as beingblown down or breaking under the weight of snow.
Acid rain also causes lakes and rivers to become acidic, causing fish populations to decline. Short-term increasesin acid levels kill many fish, but the greatest threat is from long-term increases. A long-term increase stops thefish from reproducing. The extra acid also frees toxic metals, especially aluminum, that were previously held inrocks. This metal can prevent fish from breathing. Single-celled plants and algae in lakes also suffer from increasedacid levels, with numbers dropping off quickly once the pH goes below 5. By the time the pH gets down to 4.5,almost no life is sustainable.
Many toxic metals are held in the ground in compounds. However, acid rain can break down some of thesecompounds, freeing the metals and washing them into water sources such as rivers. As the water becomesmore acidic, it can also react with lead and copper water pipes, contaminating drinking water supplies. Too muchcopper can cause diarrhea in young children and can damage livers and kidneys in adults and children.
Terms
acid rain (or acid precipitation): rain with a pH of less than 5.6; results from atmospheric moisture mixing withsulphur and nitrogen oxides emitted from burning fossil fuels or from volcanic activity; may cause damage tocrops, forests, wildlife habitats, aquatic life, as well as damage to buildings, monuments, and car finishes.
calcium carbonate: a powder occurring in nature in various forms, as calcite, chalk, and limestone, which isused in polishes and the manufacture of lime and cement.
pollutant: an impurity (contaminant) that causes an undesirable change in the physical, chemical, or biologicalcharacteristics of the air, water, or land that may be harmful to or affect the health, survival, or activities ofhumans or other living organisms.
pollution: contaminants in the air, water, or soil that cause harm to human health or the environment.
ADVANCE PREPARATION
A. Divide the class into groups of three.
SUBJECTS:Chemistry, Earth Science
TIME:20 minutes
MATERIALS: (for each group)small clear cupl tablespoonwhite vinegarantacid tablet containing calcium carbonatestudent sheets
3-44
B. Gather enough materials for each group.
PROCEDURE
I. Setting the stage
A. Show the students some calcium carbonate tablets.
B. Ask them to guess what they are.
C. Tell them what they are and explain to them that these substances are found in many different kinds ofrocks.
II. Activity
A. Give each group a cup with an antacid tablet in it.
B. Ask them to pour 15 mL vinegar over the antacid tablet.
C. Ask the students to observe the antacid and vinegar for about 5 minutes.
D. Tell the students to record the action between the vinegar and the antacid tablet.
E. Ask the students to answer the following questions:
1. What happened to the antacid tablet?
2. How can this experiment relate to the effects of acid rain in various areas?
3. What causes acid rain?
4. What measures can we take to prevent or stop acid rain?
5. Why is acid rain such an important topic to study?
III. Follow-Up
A. Ask the students to write a report on the effects of acid rain on the environment.
B. Ask the students to draw or cut out pictures from a magazine showing the effects of acid rain.
C. Ask the students to do research and write a paper about acid rain.
IV. Extensions
A. Have the students use other substances that will act on the antacid tablet.
B. Have the students research and plot various areas on a geographic map that have problems with acidrain.
RESOURCES
Tippens, Tobin, Instructional Strategies for Teaching Science, Macmillan, New York, 1994.
Cable, Charles, Dale Rice, Kenneth Walla, and Elaine Murray, Earth Science, Prentice Hall, New Jersey, 1991.
http://nis.accel.worc.k12.ma.us/www/projects/WeatherWeb/acidrain.html
6-8
3-45
Directions – Record your observations at the specified times and answer the questions.
Time Add 15 mL vinegar to antacid in cup
1 minute
1.5 minutes
2 minutes
2.5 minutes
3 minutes
3.5 minutes
4 minutes
4.5 minutes
5 minutes
STUDENT SHEET THE SHRINKING ANTACID
6-8
3-46
STUDENT SHEET THE SHRINKING ANTACID
1. What happened to the antacid tablet?
2. How can this experiment relate to the effects of acid rain in various areas?
3. What causes acid rain?
4. What measures can we take to prevent or stop acid rain?
3-47
USING TOPOGRAPHIC MAPS AND DATA TABLES TODETERMINE SURFACE WATER QUALITY
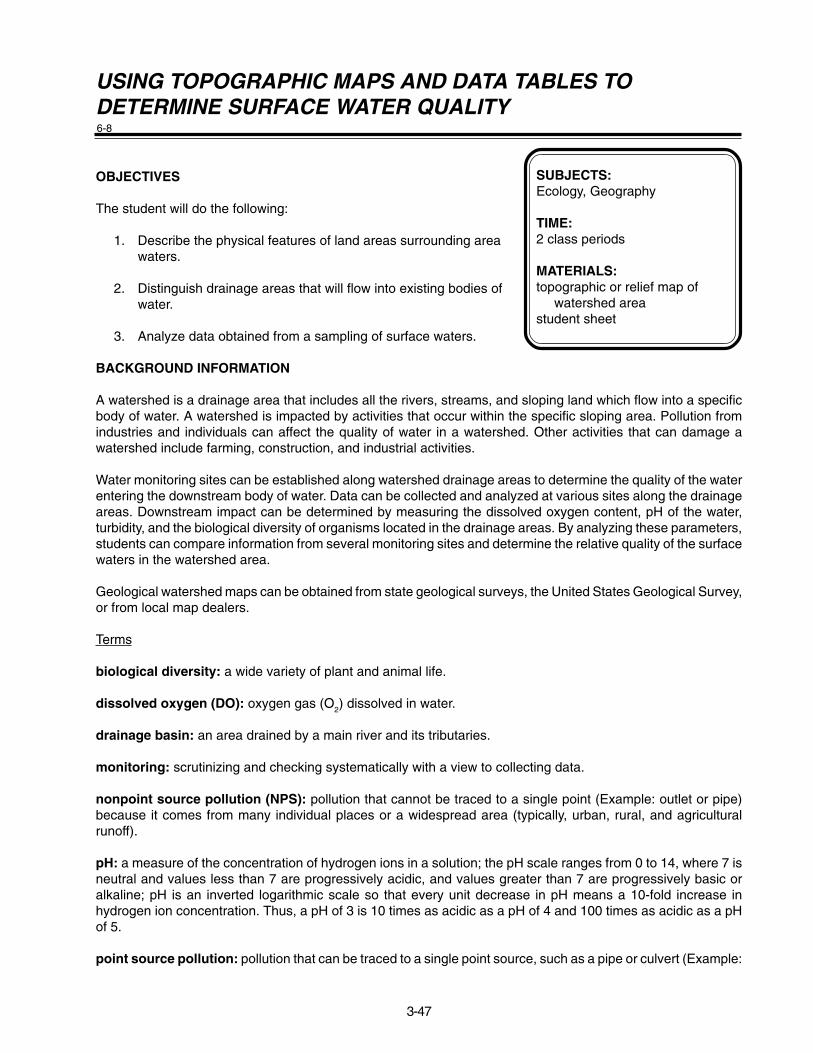
OBJECTIVES
The student will do the following:
1. Describe the physical features of land areas surrounding areawaters.
2. Distinguish drainage areas that will flow into existing bodies ofwater.
3. Analyze data obtained from a sampling of surface waters.
BACKGROUND INFORMATION
A watershed is a drainage area that includes all the rivers, streams, and sloping land which flow into a specificbody of water. A watershed is impacted by activities that occur within the specific sloping area. Pollution fromindustries and individuals can affect the quality of water in a watershed. Other activities that can damage awatershed include farming, construction, and industrial activities.
Water monitoring sites can be established along watershed drainage areas to determine the quality of the waterentering the downstream body of water. Data can be collected and analyzed at various sites along the drainageareas. Downstream impact can be determined by measuring the dissolved oxygen content, pH of the water,turbidity, and the biological diversity of organisms located in the drainage areas. By analyzing these parameters,students can compare information from several monitoring sites and determine the relative quality of the surfacewaters in the watershed area.
Geological watershed maps can be obtained from state geological surveys, the United States Geological Survey,or from local map dealers.
Terms
biological diversity: a wide variety of plant and animal life.
dissolved oxygen (DO): oxygen gas (O2) dissolved in water.
drainage basin: an area drained by a main river and its tributaries.
monitoring: scrutinizing and checking systematically with a view to collecting data.
nonpoint source pollution (NPS): pollution that cannot be traced to a single point (Example: outlet or pipe)because it comes from many individual places or a widespread area (typically, urban, rural, and agriculturalrunoff).
pH: a measure of the concentration of hydrogen ions in a solution; the pH scale ranges from 0 to 14, where 7 isneutral and values less than 7 are progressively acidic, and values greater than 7 are progressively basic oralkaline; pH is an inverted logarithmic scale so that every unit decrease in pH means a 10-fold increase inhydrogen ion concentration. Thus, a pH of 3 is 10 times as acidic as a pH of 4 and 100 times as acidic as a pHof 5.
point source pollution: pollution that can be traced to a single point source, such as a pipe or culvert (Example:
6-8
SUBJECTS:Ecology, Geography
TIME:2 class periods
MATERIALS:topographic or relief map of
watershed areastudent sheet
3-48
industrial and wastewater treatment plants, and certain storm water discharges).
topographic map: a map showing the relief features or surface configuration of an area, usually by means ofcontour lines.
turbidity: the cloudy or muddy appearance of a naturally clear liquid caused by the suspension of particulatematter.
watershed: land area from which water drains to a particular water body.
ADVANCE PREPARATION
I. Setting the stage
A. Display a topographic map of the local area and define the watershed area.
B. Discuss the major streams, rivers, and sloping areas indicated on the map.
C. Hypothesize the factors that could cause pollution problems in the drainage area of the watershed.
D. Prepare copies of the student sheet for each student.
II. Activity
A. Have the students use the student sheet to answer the questions about the streams located in thewatershed.
B. Have the students analyze the information, discuss possible contributing factors, and determine whatother types of investigations will be necessary.
III. Follow-Up
A. Have the students make visual observations of local streams and creeks and locate these on thewatershed map.
B. Display topographic maps of other watersheds in other areas. Ask the students to compare the size ofthe drainage areas.
IV. Extensions
A. Take a field trip to a local park located on the watershed.
B. Develop site monitoring groups for area streams and rivers.
C. Develop a resource file of organisms known to indicate biological diversity in local waters.
RESOURCES
United States Geological Survey (USGS) topographic map of local watershed.
Person, Jane L., Environmental Science: How the World Works and Your Place in It, Lebel Enterprises, Dallas,Texas, 1995.
6-8
3-49
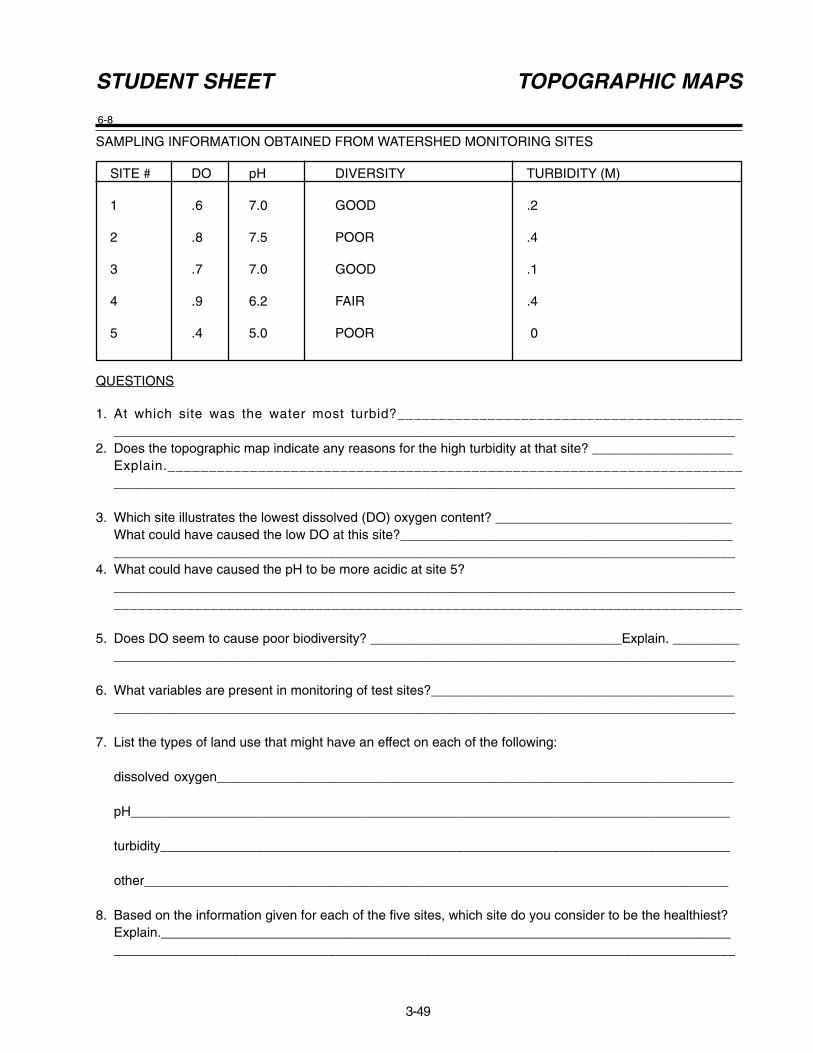
SAMPLING INFORMATION OBTAINED FROM WATERSHED MONITORING SITES
SITE # DO pH DIVERSITY TURBIDITY (M)
1 .6 7.0 GOOD .2
2 .8 7.5 POOR .4
3 .7 7.0 GOOD .1
4 .9 6.2 FAIR .4
5 .4 5.0 POOR 0
QUESTIONS
1. At which site was the water most turbid?______________________________________________________________________________________________________________________________
2. Does the topographic map indicate any reasons for the high turbidity at that site? ___________________Explain.__________________________________________________________________________________________________________________________________________________________
3. Which site illustrates the lowest dissolved (DO) oxygen content? ________________________________What could have caused the low DO at this site?_________________________________________________________________________________________________________________________________
4. What could have caused the pH to be more acidic at site 5?__________________________________________________________________________________________________________________________________________________________________
5. Does DO seem to cause poor biodiversity? __________________________________Explain. _____________________________________________________________________________________________
6. What variables are present in monitoring of test sites?_____________________________________________________________________________________________________________________________
7. List the types of land use that might have an effect on each of the following:
dissolved oxygen______________________________________________________________________
pH_________________________________________________________________________________
turbidity_____________________________________________________________________________
other_______________________________________________________________________________
8. Based on the information given for each of the five sites, which site do you consider to be the healthiest?Explain._________________________________________________________________________________________________________________________________________________________________
STUDENT SHEET TOPOGRAPHIC MAPS

6-8
3-50
6-8
3-51
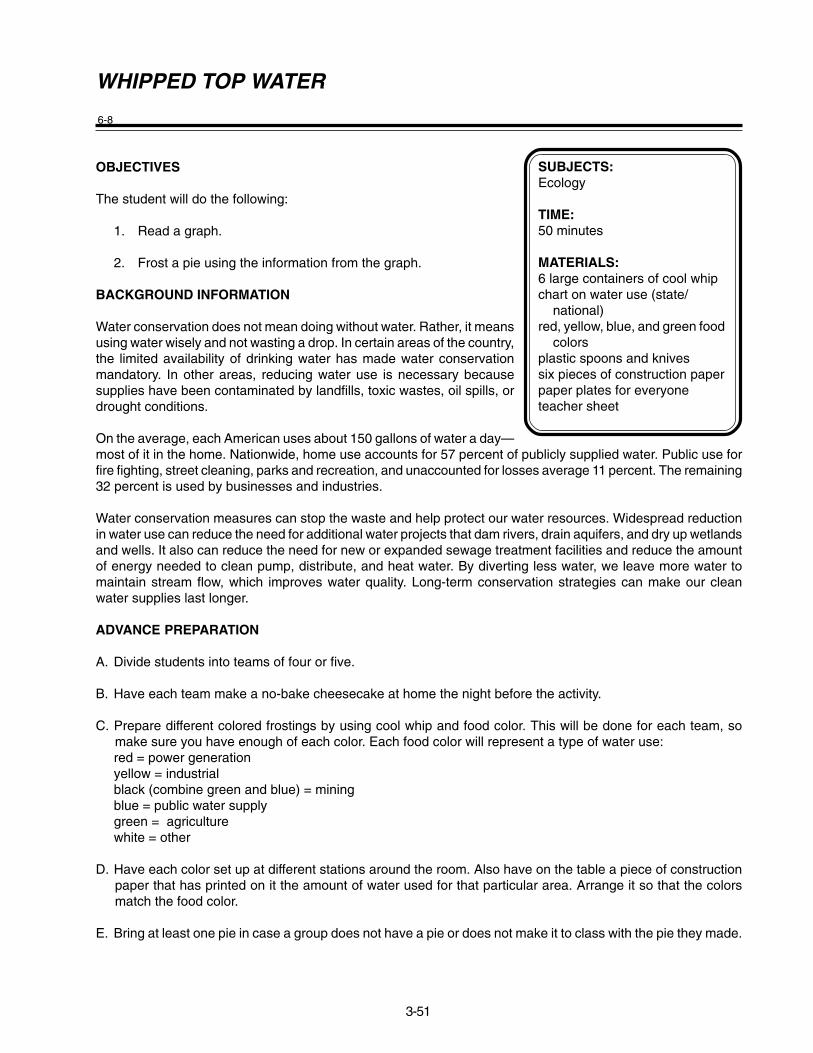
WHIPPED TOP WATER
OBJECTIVES
The student will do the following:
1. Read a graph.
2. Frost a pie using the information from the graph.
BACKGROUND INFORMATION
Water conservation does not mean doing without water. Rather, it meansusing water wisely and not wasting a drop. In certain areas of the country,the limited availability of drinking water has made water conservationmandatory. In other areas, reducing water use is necessary becausesupplies have been contaminated by landfills, toxic wastes, oil spills, ordrought conditions.
On the average, each American uses about 150 gallons of water a day—most of it in the home. Nationwide, home use accounts for 57 percent of publicly supplied water. Public use forfire fighting, street cleaning, parks and recreation, and unaccounted for losses average 11 percent. The remaining32 percent is used by businesses and industries.
Water conservation measures can stop the waste and help protect our water resources. Widespread reductionin water use can reduce the need for additional water projects that dam rivers, drain aquifers, and dry up wetlandsand wells. It also can reduce the need for new or expanded sewage treatment facilities and reduce the amountof energy needed to clean pump, distribute, and heat water. By diverting less water, we leave more water tomaintain stream flow, which improves water quality. Long-term conservation strategies can make our cleanwater supplies last longer.
ADVANCE PREPARATION
A. Divide students into teams of four or five.
B. Have each team make a no-bake cheesecake at home the night before the activity.
C. Prepare different colored frostings by using cool whip and food color. This will be done for each team, somake sure you have enough of each color. Each food color will represent a type of water use:red = power generationyellow = industrialblack (combine green and blue) = miningblue = public water supplygreen = agriculturewhite = other
D. Have each color set up at different stations around the room. Also have on the table a piece of constructionpaper that has printed on it the amount of water used for that particular area. Arrange it so that the colorsmatch the food color.
E. Bring at least one pie in case a group does not have a pie or does not make it to class with the pie they made.
SUBJECTS:Ecology
TIME:50 minutes
MATERIALS:6 large containers of cool whipchart on water use (state/ national)red, yellow, blue, and green food colorsplastic spoons and knivessix pieces of construction paperpaper plates for everyoneteacher sheet
3-52
PROCEDURE
I. Setting the stage
A. Explore the students’ knowledge on the subject prior to the lesson by asking questions such as:
1. How many of you use water?
2. List some ways you use water.
3. How is water used in our society and our environment?
B. Show the chart on water use. Discuss how the water is used. Stress the amount used in each area.
II. Activity
A. Show the students that different colored cool whip is located at different stations in the room. Eachcolored cool whip represents a water use. Example, agricultural uses are signified by the green coolwhip.
B. When they arrive at that station, they will frost that percent of their pie used for agriculture with the greencool whip. This will give them an idea of how much water is used for agriculture.
C. Then the students are to rotate to another station and top their pie with the correct amount of colored coolwhip represented on the chart.
III. Follow-Up
A. When finished, all pies should be decorated and the students may then reward themselves by eating apiece of their pie.
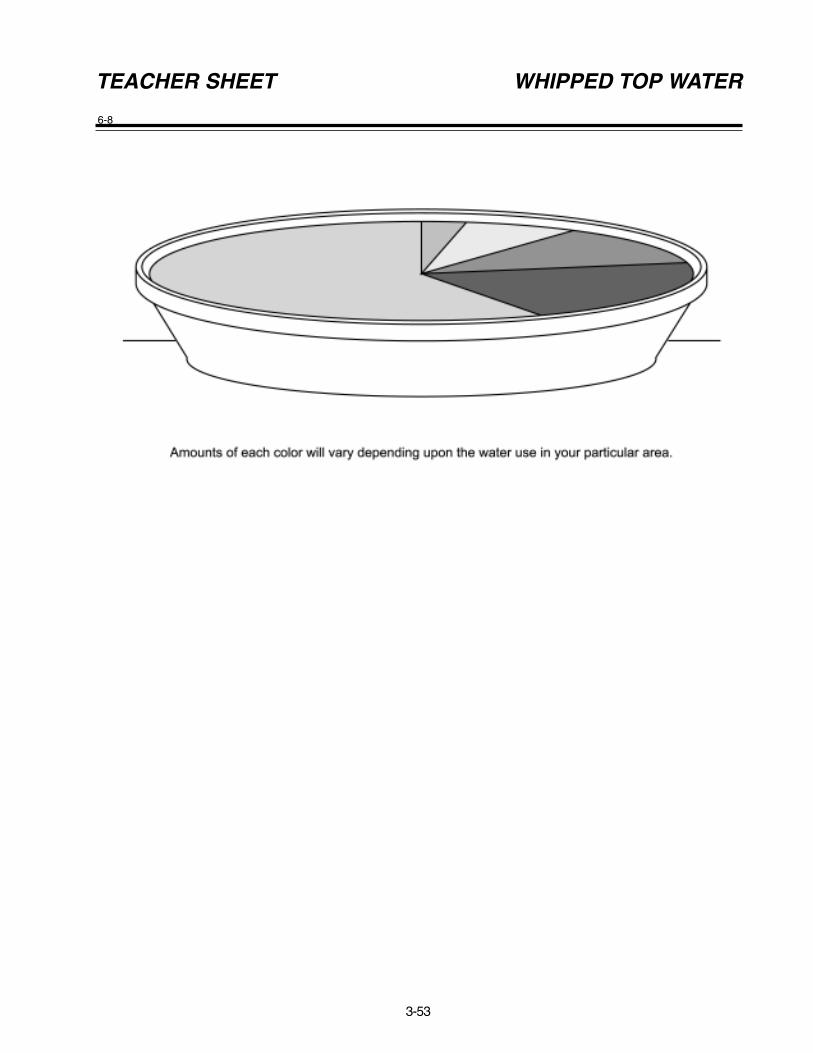
6-8
3-53
TEACHER SHEET WHIPPED TOP WATER

6-8
3-54
6-8
3-55
XERISCAPE - SEVEN STEPS TO WATER - WISE LANDSCAPING
OBJECTIVES
The student will do the following:
1. Define xeriscape and identify specific landscaping methods thatsupport xeriscape practices.
2. Differentiate between water conservation practices and standardlandscaping practices.
3. Survey xeriscape practices currently in use at home and initiatenew conservation practices indicated by the survey.
BACKGROUND INFORMATION
As increases in population and land development occur, the supply of usable water will continue to decreaseand will lead to greater restrictions of water use. In recent years, droughts in many areas of the United Stateshave forced residents to limit their use of water.
By using landscaping and horticultural techniques that reduce water use, many landowners can drasticallyreduce the overall need for water in landscaped areas. Xeriscape is the wise use of these strategies to minimizewater use, reduce maintenance, and produce more drought-resistant gardens and landscaped areas.
A Xeriscape-type landscape can reduce outdoor water consumption by as much as 50% without sacrificing thequality and beauty of a home environment. It is also an environmentally-sound landscape, requiring less fertilizerand fewer chemicals. A Xeriscape-type landscape is low maintenance - saving time, effort, and money. Anylandscape, whether newly-installed or well-established, can be made more water-efficient by implementing oneor more of the seven steps. A landscape does not have to be totally redesigned to save water. Significant watersavings can be realized simply by modifying the watering schedule, learning how and when to water, using themost efficient watering methods and learning about the different water needs of landscape plants.
There are several general principles that can be used in most home Xeriscape projects. These strategies includegrouping plants with similar water uses, reducing the amount of irrigated turfgrass areas, using sufficient amountsof organic material, using an efficient watering system, and managing landscapes to reduce water demand.
Xeriscape can conserve water and also produce attractive, low-maintenance landscaped areas. Each personcan make a difference in conserving water.
Terms
Xeriscape: the use of landscaping and horticultural strategies to minimize water use, reduce maintenance, andproduce more drought-resistant gardens and landscaped areas.
mulch: a protective covering of various substances, especially organic; placed around plants to preventevaporation of moisture and freezing of roots and to control weeds.
organic material: material derived from organic, or living, things; also, relating to or containing carbon compounds.
inorganic material: material derived from nonorganic, or nonliving, sources.
pruning: trimming or cutting off undesired or unnecessary twigs, branches, or roots from a tree, bush, or plant.
turfgrass: lawns
SUBJECTS:Botany, Ecology
TIME:3 class periods2 to 3 weeks for students to complete survey at home and design landscape
MATERIALS:teacher sheetsstudent sheets
3-56
drought: a lack of rain or water; a long period of dry weather.
topography: the detailed mapping or description of the features of a relatively small area, district, or locality; therelief features or surface configuration of an area.
landscaping: improving the natural beauty of a piece of land by planting or altering the contours of the ground.
ADVANCE PREPARATION
A. Make overheads or handouts of Teacher Sheets.
B. Prepare copies of Student Sheets for each student. Run copies back and front to get on one sheet.
C. Read the Water Conservation Fact Sheets on pages F - 27 & 28 to become familiar with the seven steps used in Xeriscape-type landscaping.
PROCEDURE
I. Setting the stage
A. Discuss what happens to plants when there is insufficient rain or drought conditions. Ask students whatrestrictions are often placed on water use during these times.
B. Ask students if they have noticed that often plants in people's yards sometimes look wilted but plants inwoods and fields do not. Discuss how native plants are adapted to a wider range of conditions thansome plants used in yards.
C. Introduce the term Xeriscape. Explain that it was derived by combining the Greek word "Xeros," meaningdry, with the word "landscape." Give students the definition of Xeriscape.
D. Discuss each of the seven steps of Xeriscape landscaping given in the Water Conservation Fact Sheet.List steps on the board and tell students they will be using these steps later in the activity.
Step 1 - Planning and Design Step 5 - Efficient IrrigationStep 2 - Soil Analysis Step 6 - Use of MulchesStep 3 - Appropriate Plant Selection Step 7 - Appropriate MaintenanceStep 4 - Practical Turf Areas
II. Activity
A. Pass out Student Sheet 1 - Landscape Symbols. Show Teacher Sheet 1 - Base Map and Site Analysis.Explain to students they are going to conduct a survey of their yards. If possible, pair students that liveclose together. If a student lives in an apartment, pair with a student who has a yard. The first step inXeriscape landscaping is to begin with a Base Map of the existing area and conduct a Site Analysis.Point out the features in Teacher Sheet 1 and make sure students understand the extent of theirassignment. You may want to call one student to the board to draw a base map of his or her yard.Explain that they will need to walk around the yard to get all the details. Use the landscape symbols toindicate the existing vegetation. Give students a couple days to complete this assignment.
B. Show Teacher Sheet 2 - Water Use Zones. Discuss why certain areas need more water than others andhow shade affects water use. Using their Site Analysis, have students determine water use zones oftheir yards. There are plant exceptions to each of these use zones. It is best to find out from a localnursery person or Extension Agent which plants fit these zones for your particular area. Generally,these guidelines can be followed: High - regular watering - some flower beds, turf grass in direct sun
Moderate - occasional watering - well established plants, plants in partial shade Low - natural rainfall - do not need watering except in extremely dry conditions, full shade, woody
ornamental trees, some turfgrasses.
3-57
C. Show Teacher Sheet 3 - Landscaped Water Use Zones. Ask students to describe the changes that havebeen made in the landscapes. Discuss the water use based on the "before" landscape as compared tothe "after" landscape. Discuss what factors (shade-tolerant ground cover, mulch, native trees and shrubs,less turfgrass) changed the water use zones.
D. Pass out Student Sheet 2 - Survey of a Landscaped Area. Students should use the checklist to determine the ways that Xeriscape is or can be used in their home landscaped areas to reduce the amount of water used. Give students a couple days to complete this assignment.
E. Show Teacher Sheet 4 - Professional Landscaping. Discuss what was done to change the landscape.Also note the change in water use zones. You may need to review the landscape symbols so studentsare familiar with each one. Explain to students they are going to "landscape" their yards using Xeriscapepractices and create a Master Plan for their yard. If students have yards that are already fully landscaped,pair with students whose yards are not landscaped. Remind students to include each Xeriscape Stepincluding their plan for Appropriate Maintenance in the future. Soil analyses can be done by your localcounty Extension office. You may want to check with your local office before you have a large number ofstudents sending in soil samples at the same time. Have students use their Base Map to create theirMaster Plan. Give students several days to complete this assignment.
F. Display completed plans in the room. You may want to have students "judge" the plans and award a Yard of the Month - type award for the plan that best adheres to Xeriscape principles and practices.
III. Follow-Up
A. Have the students take photographs of an area before it is xeriscaped and compare it to later photographs.
B. Have students keep a journal of differences in maintenance, weed control, pests, and diseases onplants, and the overall appearance of the site.
IV. Extensions
A. Invite speakers from landscaping associations or master gardners to speak to the class about xeriscape.
B. Have students develop a miniature Xeriscape terrarium that models the landscaped area at home.
C. Have students create a Xeriscape landscape plan for the school campus.
D. Have students observe other yard and business landscapes and determine if Xeriscape practices were followed.
RESOURCES
National Xeriscape Council, Inc., POB 767836, Roswell, GA 30076.
Water Ways: A Water Resource Curriculum. St. John’s Water Management District, Jacksonville, FL, 1991.
Xeriscape: A Guide to Developing a Water-wise Landscape, Cooperative Extension Service, University of Georgia, 1992.
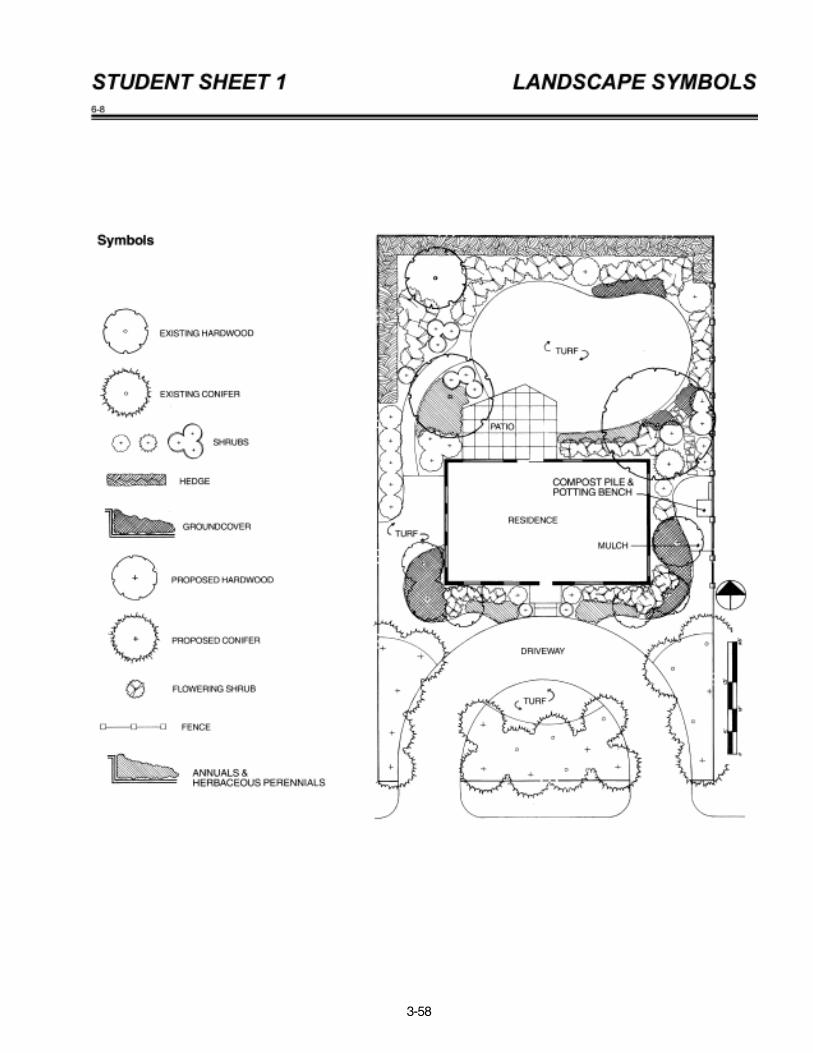
3-58
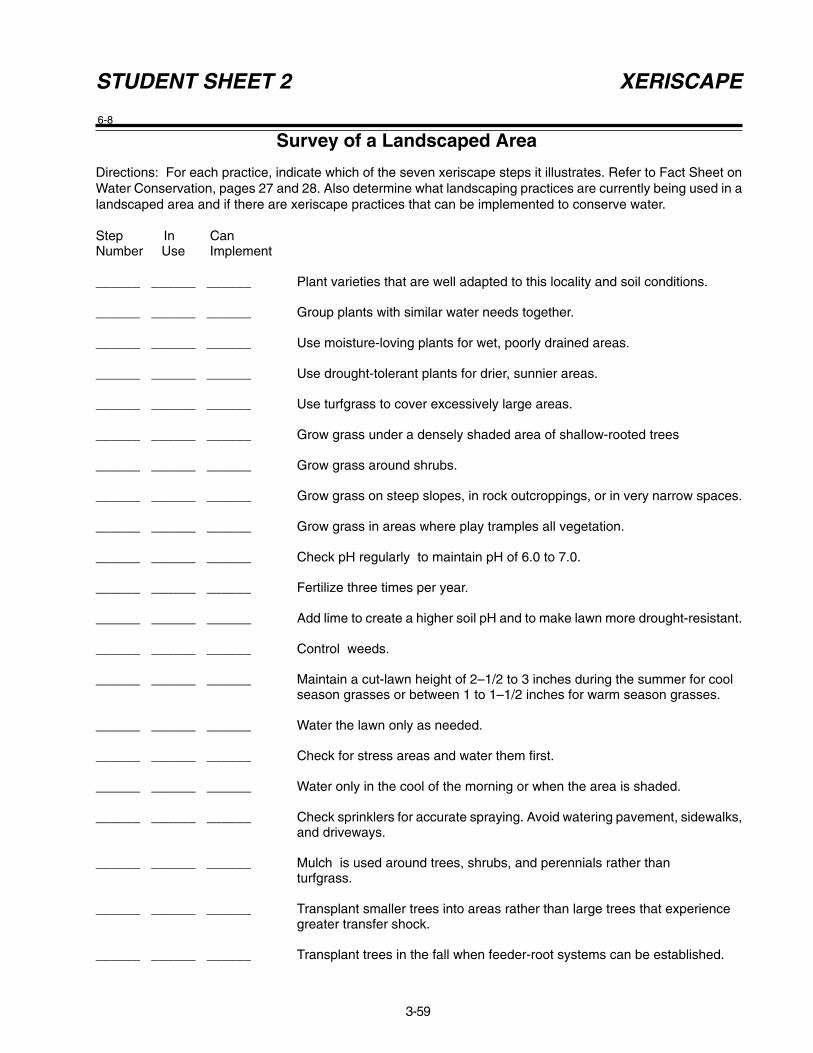
6-8
3-59
Survey of a Landscaped Area
Directions: For each practice, indicate which of the seven xeriscape steps it illustrates. Refer to Fact Sheet onWater Conservation, pages 27 and 28. Also determine what landscaping practices are currently being used in alandscaped area and if there are xeriscape practices that can be implemented to conserve water.
Step In CanNumber Use Implement
______ ______ ______ Plant varieties that are well adapted to this locality and soil conditions.
______ ______ ______ Group plants with similar water needs together.
______ ______ ______ Use moisture-loving plants for wet, poorly drained areas.
______ ______ ______ Use drought-tolerant plants for drier, sunnier areas.
______ ______ ______ Use turfgrass to cover excessively large areas.
______ ______ ______ Grow grass under a densely shaded area of shallow-rooted trees
______ ______ ______ Grow grass around shrubs.
______ ______ ______ Grow grass on steep slopes, in rock outcroppings, or in very narrow spaces.
______ ______ ______ Grow grass in areas where play tramples all vegetation.
______ ______ ______ Check pH regularly to maintain pH of 6.0 to 7.0.
______ ______ ______ Fertilize three times per year.
______ ______ ______ Add lime to create a higher soil pH and to make lawn more drought-resistant.
______ ______ ______ Control weeds.
______ ______ ______ Maintain a cut-lawn height of 2–1/2 to 3 inches during the summer for coolseason grasses or between 1 to 1–1/2 inches for warm season grasses.
______ ______ ______ Water the lawn only as needed.
______ ______ ______ Check for stress areas and water them first.
______ ______ ______ Water only in the cool of the morning or when the area is shaded.
______ ______ ______ Check sprinklers for accurate spraying. Avoid watering pavement, sidewalks,and driveways.
______ ______ ______ Mulch is used around trees, shrubs, and perennials rather thanturfgrass.
______ ______ ______ Transplant smaller trees into areas rather than large trees that experiencegreater transfer shock.
______ ______ ______ Transplant trees in the fall when feeder-root systems can be established.
STUDENT SHEET 2 XERISCAPE
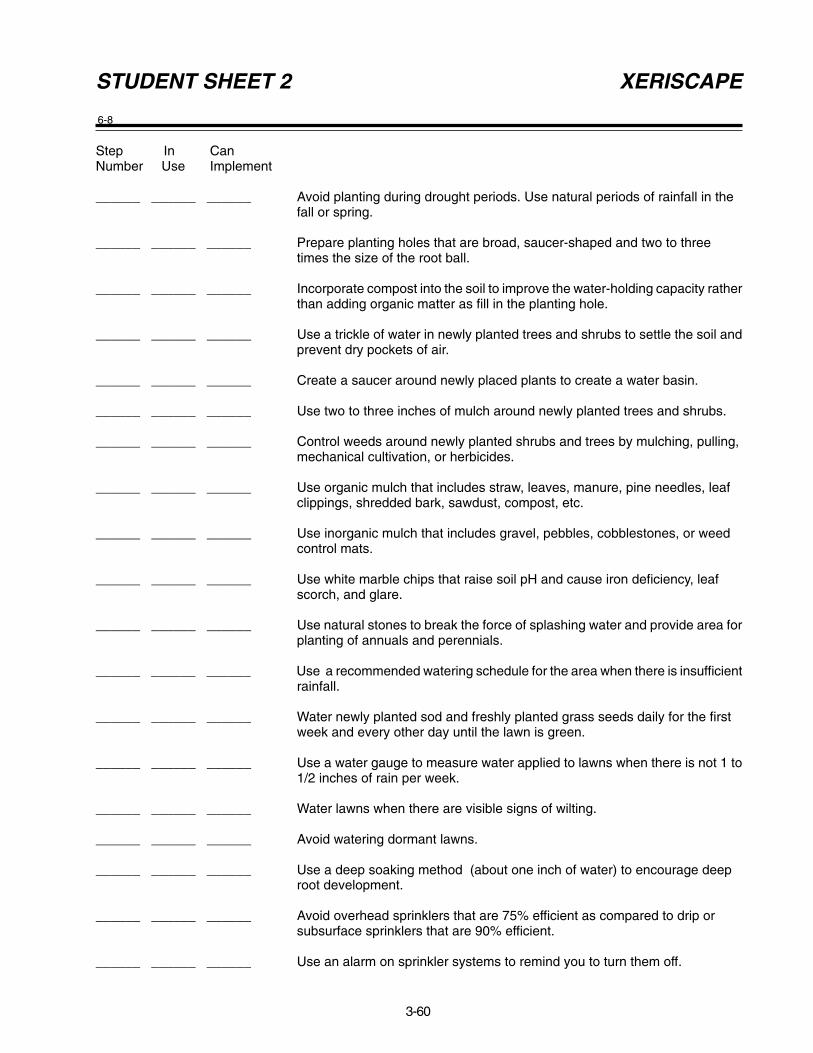
6-8
3-60
Step In CanNumber Use Implement
______ ______ ______ Avoid planting during drought periods. Use natural periods of rainfall in thefall or spring.
______ ______ ______ Prepare planting holes that are broad, saucer-shaped and two to threetimes the size of the root ball.
______ ______ ______ Incorporate compost into the soil to improve the water-holding capacity ratherthan adding organic matter as fill in the planting hole.
______ ______ ______ Use a trickle of water in newly planted trees and shrubs to settle the soil andprevent dry pockets of air.
______ ______ ______ Create a saucer around newly placed plants to create a water basin.
______ ______ ______ Use two to three inches of mulch around newly planted trees and shrubs.
______ ______ ______ Control weeds around newly planted shrubs and trees by mulching, pulling,mechanical cultivation, or herbicides.
______ ______ ______ Use organic mulch that includes straw, leaves, manure, pine needles, leafclippings, shredded bark, sawdust, compost, etc.
______ ______ ______ Use inorganic mulch that includes gravel, pebbles, cobblestones, or weedcontrol mats.
______ ______ ______ Use white marble chips that raise soil pH and cause iron deficiency, leafscorch, and glare.
______ ______ ______ Use natural stones to break the force of splashing water and provide area forplanting of annuals and perennials.
______ ______ ______ Use a recommended watering schedule for the area when there is insufficientrainfall.
______ ______ ______ Water newly planted sod and freshly planted grass seeds daily for the firstweek and every other day until the lawn is green.
______ ______ ______ Use a water gauge to measure water applied to lawns when there is not 1 to1/2 inches of rain per week.
______ ______ ______ Water lawns when there are visible signs of wilting.
______ ______ ______ Avoid watering dormant lawns.
______ ______ ______ Use a deep soaking method (about one inch of water) to encourage deeproot development.
______ ______ ______ Avoid overhead sprinklers that are 75% efficient as compared to drip orsubsurface sprinklers that are 90% efficient.
______ ______ ______ Use an alarm on sprinkler systems to remind you to turn them off.
STUDENT SHEET 2 XERISCAPE
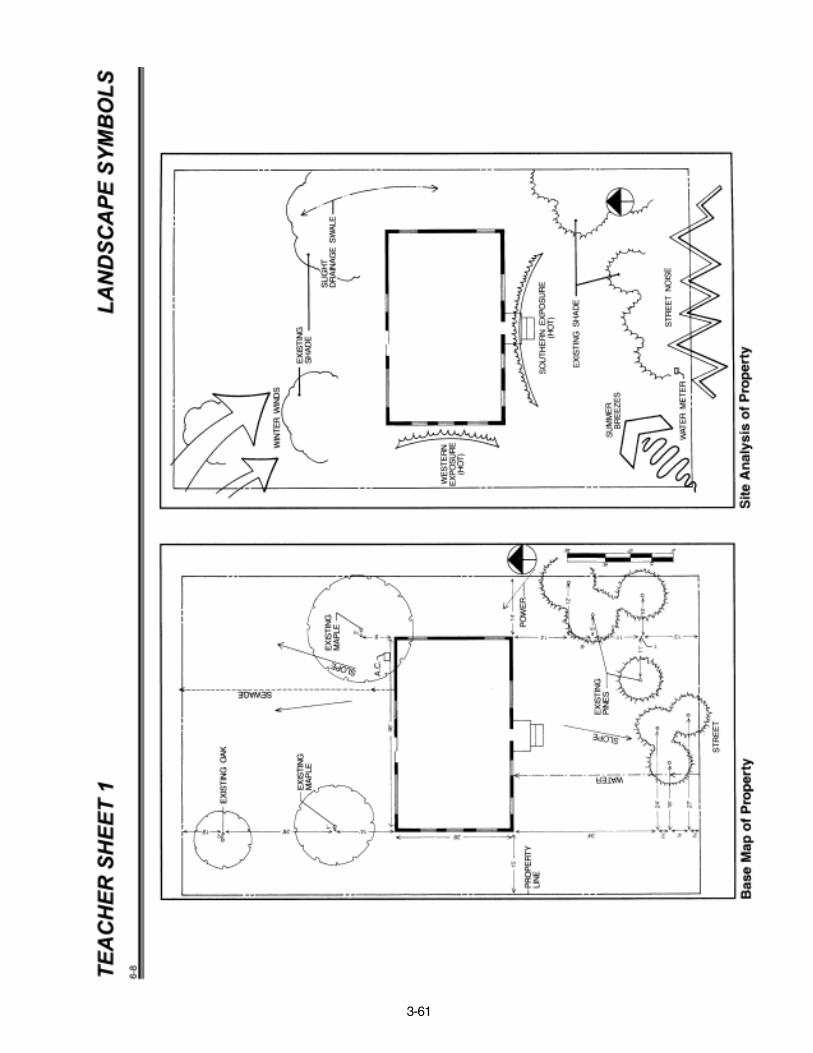
3-61
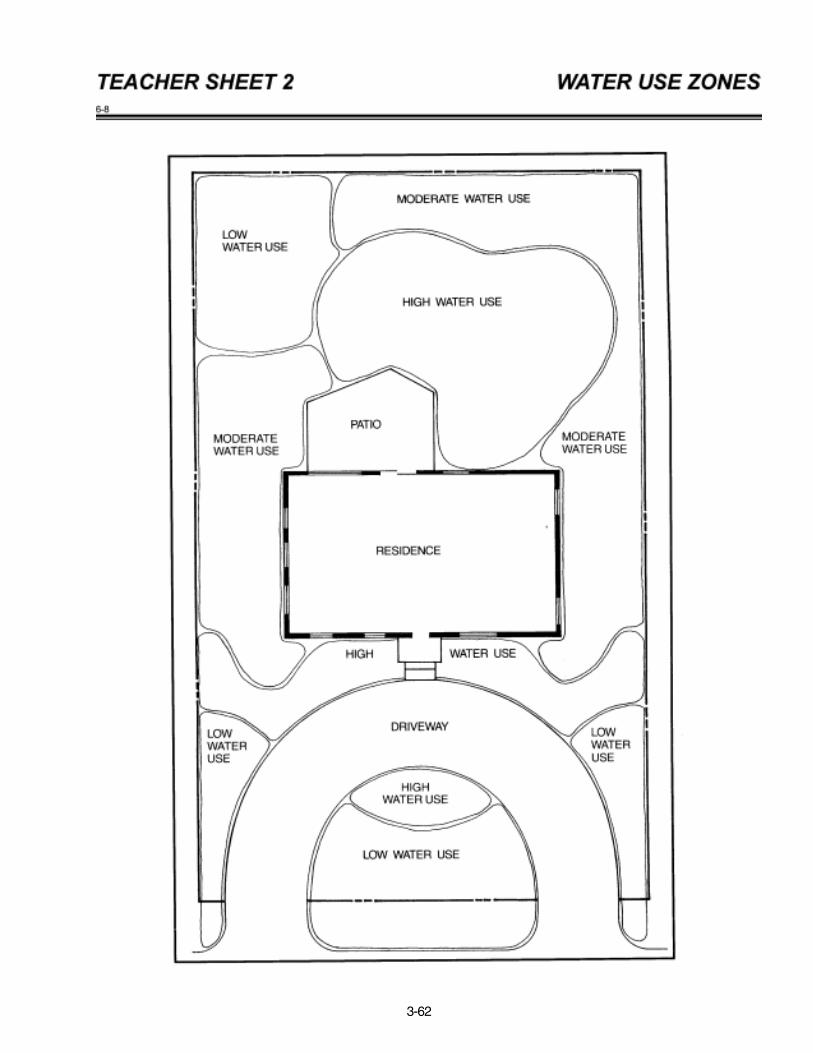
3-62
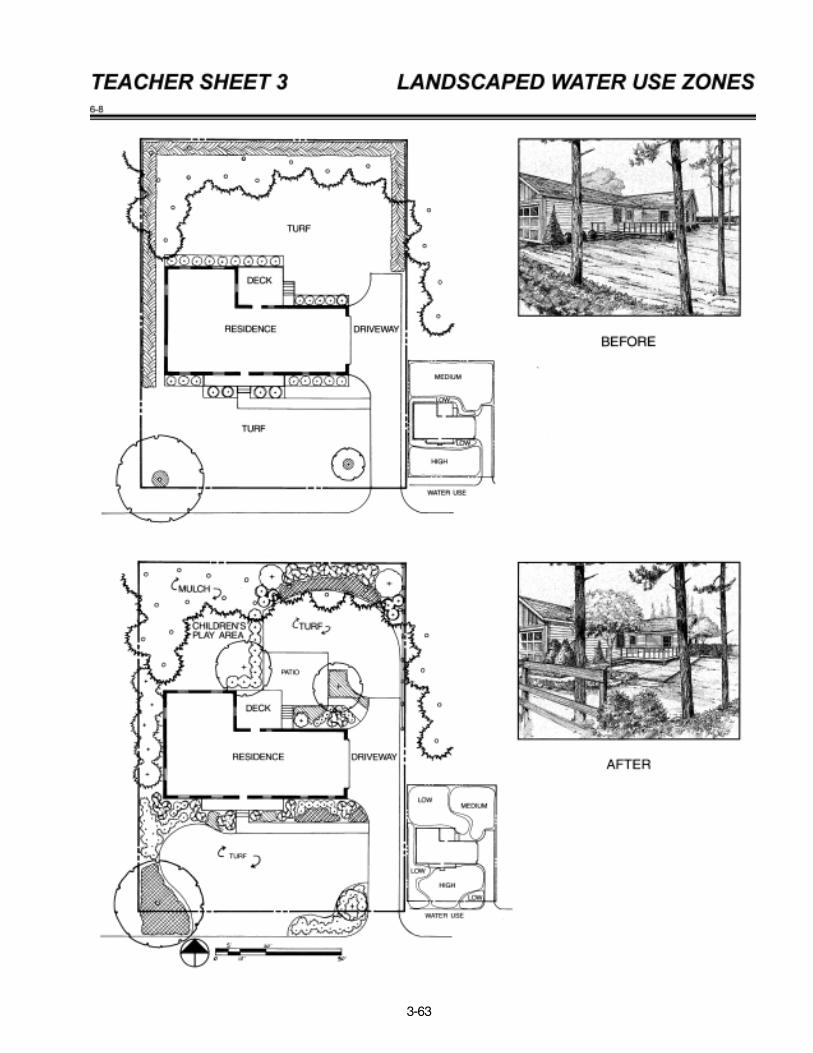
3-63
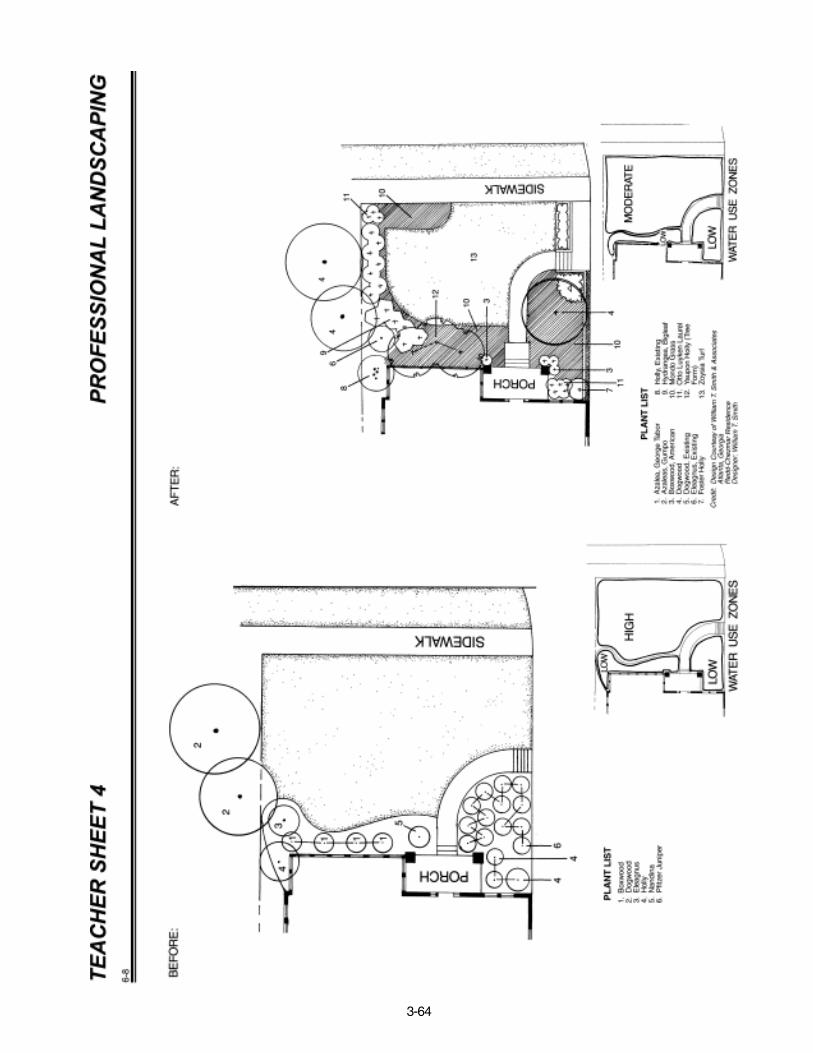
3-64