Embed Size (px)
Citation preview
Biochemical and Biophysical Characterization of a Prephenate Dehydrogenase from the
Hyperthermophilic Bacterium Aquifex aeolicus
Julie Bonvin
A Thesis
In
The Department
Of
Chemistry and Biochemistry
Presented in Partial Fulfillment of the Requirements
for the Degree of Doctor of Philosophy at
Concordia University
Montreal, Quebec, Canada
August 2008
© Julie Bonvin. 2008
1*1 Library and Archives Canada
Published Heritage Branch
395 Wellington Street Ottawa ON K1A0N4 Canada
Bibliotheque et Archives Canada
Direction du Patrimoine de I'edition
395, rue Wellington Ottawa ON K1A0N4 Canada
Your file Votre reference ISBN: 978-0-494-45651-4 Our file Notre reference ISBN: 978-0-494-45651-4
NOTICE: The author has granted a nonexclusive license allowing Library and Archives Canada to reproduce, publish, archive, preserve, conserve, communicate to the public by telecommunication or on the Internet, loan, distribute and sell theses worldwide, for commercial or noncommercial purposes, in microform, paper, electronic and/or any other formats.
AVIS: L'auteur a accorde une licence non exclusive permettant a la Bibliotheque et Archives Canada de reproduire, publier, archiver, sauvegarder, conserver, transmettre au public par telecommunication ou par Plntemet, prefer, distribuer et vendre des theses partout dans le monde, a des fins commerciales ou autres, sur support microforme, papier, electronique et/ou autres formats.
The author retains copyright ownership and moral rights in this thesis. Neither the thesis nor substantial extracts from it may be printed or otherwise reproduced without the author's permission.
L'auteur conserve la propriete du droit d'auteur et des droits moraux qui protege cette these. Ni la these ni des extraits substantiels de celle-ci ne doivent etre imprimes ou autrement reproduits sans son autorisation.
In compliance with the Canadian Privacy Act some supporting forms may have been removed from this thesis.
Conformement a la loi canadienne sur la protection de la vie privee, quelques formulaires secondaires ont ete enleves de cette these.
While these forms may be included in the document page count, their removal does not represent any loss of content from the thesis.
Canada
Bien que ces formulaires aient inclus dans la pagination, il n'y aura aucun contenu manquant.
Abstract
Biochemical and Biophysical Characterization of a Prephenate Dehydrogenase from the
Hyperthermophilic Bacterium Aquifex aeolicus
Julie Bonvin. Ph. D.
Prephenate dehydrogenase is a key enzyme from the TyrA protein family
responsible for catalyzing the NAD^-dependent oxidative decarboxylation of prephenate
to hydroxylphenylpyruvate, one of the terminal steps in the biosynthesis of tyrosine
(Tyr). To gain structural and biophysical information on this protein, PD from the
thermophilic bacterium Aquifex aeolicus was expressed as a His-tagged protein in
Escherichia coli and was purified by nickel affinity chromatography. The enzyme is
susceptible to proteolysis at the N-terminal region of the protein and the exact site of
cleavage was determined by mass spectrometry. Crystallography trials on several N-
terminally truncated variants performed by our collaborators at the University of Toronto
indicated that only the PD variant missing the first 19 amino acids (A19PD) yielded
quality diffraction crystals. The biochemical and biophysical properties of the full-length
PD were compared to A19PD also expressed recombinantly in E. coli. The enzyme
functions as a cyclohexadienyl dehydrogenase, accepting prephenate (effectively) and L-
arogenate (poorly) as substrates. Both forms of the enzyme are thermally stable and show
maximal activity only at high temperatures, although A19PD is less stable but more
active than the full-length protein. Low concentrations of the denaturant guanidinium
hydrochloride (Gdn-HCl) activate the activity of A19PD, but at higher concentrations
activity is lost concomitant with a multi-state pathway of denaturation which proceeds
iii
through unfolding of the dimer. oligomerization. then unfolding of monomers.
Measurements of steady-state fluorescence intensity and its quenching by acrylamide in
the presence of Gdn-HCl suggest that of the two tryptophan (Trp) residues per monomer,
one is buried in a hydrophobic pocket and does not become solvent exposed until the
protein unfolds, while the less buried Trp is at the active site. These findings are in
accordance with the crystal structure of A19PD.
Site-directed mutagenesis and steady-state kinetic analyses of variant proteins
were used to probe the roles of conserved residues. In accord with the crystal structure of
the enzyme bound with NAD+ plus product and product analogues, His 147 acted as a
catalytic hydrogen bond acceptor while Ser216 was responsible for coordinating NAD
and Hisl47 to facilitate hydride transfer. Arg250 and His217 were responsible for
binding prephenate in the active site. Additionally and most importantly, His217 in A.
aeolicus PD and the homologous residue in E. coli CM-PD (His257) was shown to be
critical for inhibition of activity by Tyr. Two assays were developed to assess Tyr
binding to wild-type and variant enzymes. Our results are placed in context of crystal
structures of PD bound with Tyr and indicate how TyrA proteins can accept
hydroxyphenylpuruvate and Tyr in the active site of the enzyme.
IV
Acknowledgements
First. I would like to thank my thesis supervisor. Dr. Joanne Turnbull (Jojo). for her
dedication to my training, her support and patience throughout all these years. ] also want
to thank her for always pushing me. sometimes really hard, to meet her high scientific
standards, which 1 hope to adhere in my future scientific career. 1 thank the members of
my Research Committee. Drs. M.J. Kornblatt and P. Joyce, for their help and suggestions
during my Ph. D. studies. I want to thank all the members of the TurnbulFs lab
encountered during these years and a lot of other graduate students from our department
and from other departments (Zack, Michaela, Steve. Maggy. Cathy, Ernesto. Jason...). A
special thank to John (mon petit bazo), who was first a classmate, then a colleague and
who finally became an exceptional friend. He was always present when 1 needed him,
and Vm sure always will. I sincerely want to acknowledge the never-ending presence and
the incredible laziness of Mushu, my loved cat, who spent my entire Ph. D. laying down
on the myriad of publications spread on my floor. He probably became the most
intelligent cat, but he is so humble that he does not show it: we should all think about it.
Special thanks for my friends from France (Anne, Van (la vieille), Dam and Yo) who had
the patience to wait for me to come back, after all those years. To You, "Pouet-Pouet",
my love, who left this life a little bit too early. Finally, I want to thank all my family:
Alexandre, Dany et Guy, for their love, support and encouragement.
v
Table of Contents
List of Figures xi
List of Tables xiv
List of Abbreviations xv
Contribution of Authors xviii
Chapter 1 1
General Introduction
1.0 AROMATIC AMINO ACID BIOSYNTHESIS 2
1.1 ALTERNATE BIOSYNTHETIC ROUTES TO TYROSINE AND
PHENYLALANINE 10
1.2 TYRA PROTEIN FAMILY 12
1.3 THE BIFUNCTIONAL E. COL1 ENZYME, CM-PD: THE STRUCTURAL
RELATIONSHIP BETWEEN THE TWO ACTIVITIES 14
1.4 CHORISMATE MUTASE MECHANISM 17
1.5 PREPHENATE DEHYDROGENASE MECHANISM AND ITS INHIBITION BY
TYROSINE 22
1.6 AROGENATE DEHYDROGENASES 28
1.7 REGULATION BY FEEDBACK INHIBITION 30
1.8 ALLOSTERIC REGULATION 30
1.9 THE MODEL CHOSEN: AQUIFEXAEOLICUS PD 32
vi
] JO SCOPE AND ORGANIZATION OF THESIS 38
Chapter 2 40
Purification and Biophysical Properties of Full-Length PD and the
Crystallizable Variant A19PD
2.0 INTRODUCTION 41
2.1 EXPERIMENTAL PROCEDURES 42
2.1.1 Materials 42
2.1.2 Production and Purification of Recombinant PD and Al 9PD of A. aeolicus.. 43
2.1.3 SDS-Polyacrylamide Gel Electrophoresis 45
2.1.4 Determination of Enzyme Activity and Protein Concentration 45
2.1.5 Molecular Weight Determination 46
2.1.5.1 Mass Spectrometry 46
2.1.5.1.1 Determination of Subunit Molecular Weights 46
2.1.5.1.2 Matrix-Assisted Laser Desorption/Ionization Mass Spectrometry
Analysis of Tryptic Generated Peptides from A. aeolicus PD 47
2.1.5.2 Analytical Ultracentrifugation 49
2.1.5.3 Analytical Size Exclusion Chromatography 50
2.1.6 Denaturation Studies 51
2.1.6.1 Circular Dichroism 51
2.1.6.2 Steady-State Fluorescence 52
2.1.6.3 ANS Fluorescence Experiments 53
2.1.7 Determination of Dissociation Constants for Substrates 53
2.1.8 Fluorescence Quenching 54
2.2 RESULTS 56
2.2.1 Protein Purification and Subunit Composition of Full-Length PD 56
2.2.2 Purification and Monomer Molecular Weight Determination of A19PD 64
vn
2.2.3 Native Molecular Weight 70
2.2.4 Thermal Stability 72
2.2.5 Denaturation Studies with Gdn-HCI 75
2.2.6 Quenching of Fluorescence Emission: Assessment of Trp Accessibility 84
2.3 DISCUSSION 92
Chapter 3 104
Kinetic Characterization of WT and Variant Proteins from Aquifex aeolicus PD
3.0 INTRODUCTION 105
3.1 EXPERIMENTAL PROCEDURES 107
3.1.1 Materials 107
3.1.2 Preparation of Solutions of 4-hydroxyphenylpyruvate and
Hydroxyphenylpropionate 108
3.1.3 Source of Variants A19PD of A. aeolicus 109
3.1.4 Expression and Purification of Recombinant and Variant Enzymes ] 10
3.1.5 Determination of Enzyme Activity and Protein Concentration 110
3.1.6 Effect of Temperature on Dehydrogenase Activity of A. aeolicus PD. Al 9PD
and E. coli CM-PD 112
3.1.7 Effects of pH, NaCl and Divalent Metal Ions on the PD Activity 112
3.1.8 Steady-State Velocity Patterns of the A. aeolicus PD-Catalyzed Reaction... 113
3.1.9 pH-dependence of the Dehydrogenase-Catalyzed Reaction 114
3.1.10 Determination of K& for Prephenate of Serl26Ala and Hisl47Asn A19PD
Variants 115
3.2 RESULTS 115
3.2.1 Determination of the Kinetic Parameters of the Reaction Catalyzed by A.
aeolicus PD and A19PD at 30, 55 and 80°C 115
V l l l
3.2.2 Effects of pR Salt and Divalent Metal Ions on A19PD Activity 122
3.2.3 Studies of the Initial Velocity and Product/Product Analogue Inhibition of PD
from A. aeolicus 122
3.2.4 pH-dependency of the A. aeolicus A19PD-Catalyzed Reaction 125
3.3 DISCUSSION 133
Chapter 4 148
Investigation of the Mechanism of Feedback Inhibition by L-Tyr
4.0 INTRODUCTION 149
4.1 EXPERIMENTAL PROCEDURES 149
4.1.1 Materials 151
4.1.2 Source of Enzymes 152
4.1.3 Effect of L-Tyr on PD Activity of WT and variants of E. coli and A. aeolicus
enzymes 152
4.1.4 Monitoring L-[3.5-JH]Tyrosine Binding in the Presence and the Absence of
Ligands 153
4.1.5 Monitoring ANS Fluorescence Emission in the Presence and the Absence of
Ligands 154
4.1.6 Determination of Molecular Weight in the Presence and the Absence of
Ligands 155
4.1.6.1 Analytical Size Exclusion Chromatography 155
4.1.6.2 Analytical Ultracentrifugation 155
4.1.7 Modeling of the E. coli CM-PD Monomer 156
4.2 RESULTS 156
4.2.1 Effects of Tyr on PD Activity at Different Temperatures 156
4.2.2 Effects of L-Tyr on the PD Activity of WT Enzymes and Variants from A.
aeolicus A19PD and £ coli CM-PD 161
IX
4.2.3 Binding of L-Tyr to the WT and Variant Enzymes Assessed by Radiolabeling
Experiments 167
4.2.4 ANS Binding Experiments 168
4.2.5 Molecular Weight of WT and Variant Proteins in the Presence and Absence of
Ligands 169
4.3 DISCUSSION 174
x
List of Figures
Figure 1.1: The shikimate pathway 3
Figure 1.2: Aromatic amino acid biosynthesis in E. coli via the "common pathway"
6
Figure 1.3: L-Trp biosynthesis 7
Figure 1.4: L-Tyr and L-Phe biosynthesis via the arogenate route 11
Figure 1.5: Rearrangement of chorismate through a transition-state complex 18
Figure 1.6: Ribbon diagram representations of the AroQ and AroH folds 20
Figure 1.7: Schematic diagram of the crystal structure of the active site of yeast
chorismate mutase and E. coli "mini-mutase" complexed with ewJo-oxabicyclic diacid
21
Figure 1.8: Proposed mechanism for the prephenate dehydrogenase catalyzed reaction
25
Figure 1.9: Multiple sequence alignment of TyrA proteins 26
Figure 1.10: Structure of ,4. aeolicus A19PD. 34
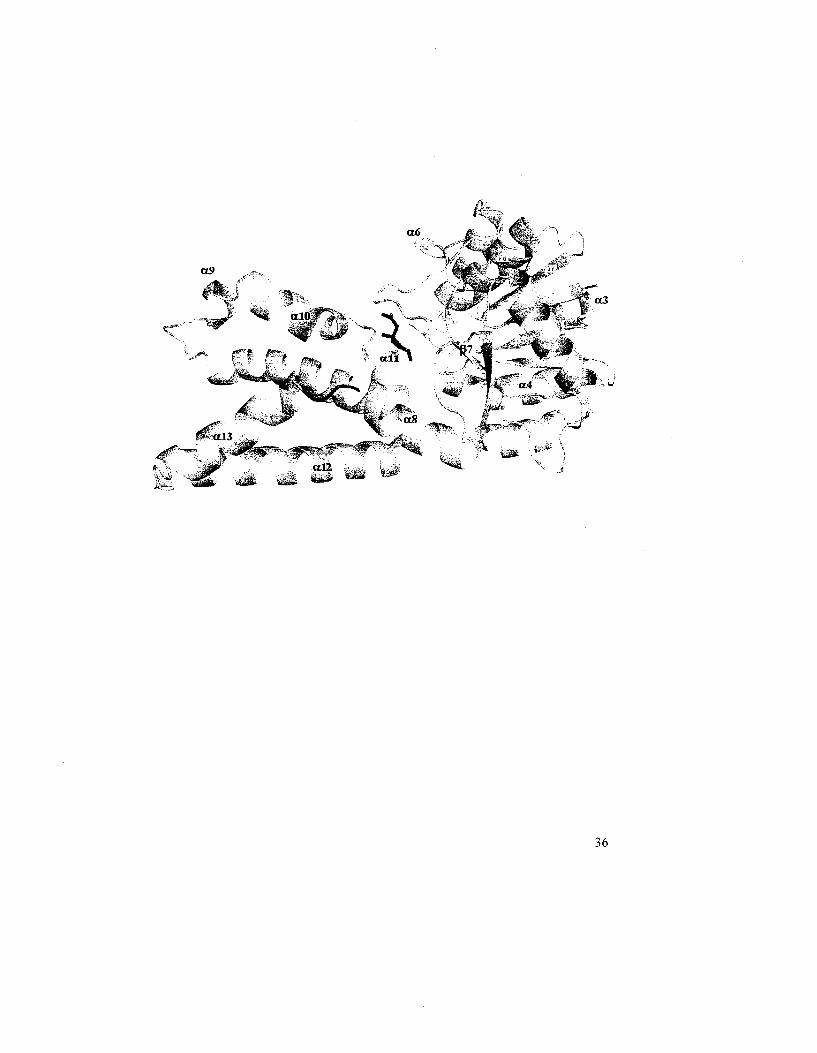
Figure 1.11: Cartoon diagram representation of the structure of one monomer of A.
aeolicus Al 9PD in complex with NATX 35
Figure 1.12: Selected active site residues of Aquifex aeolicus A19PD in complex with
NAD" 37
Figure 2.1: SDS-polyacrylamide gel electrophoresis of purified A aeolicus PD 57
Figure 2.2: Schematic representation of the organization of the expression/cloning region
of pET-15b vector containing A aeolicus tyrA 59
Figure 2.3: Deconvoluted electrospray ionization mass spectra of PD 61
Figure 2.4: Sequence coverage obtained by MALDI analysis of peptides generated by
tryptic digestion of thrombin-treated A. aeolicus PD 66
Figure 2.5: SDS-polyacrylamide gel electrophoresis of purified A. aeolicus Al 9PD 67
Figure 2.6: Electrospray ionization mass spectra of intact A. aeolicus thrombin -treated
A19PD 69
XI
Figure 2.7: Far-UV CD spectra of E. coli and A. aeolicus enzymes 73
Figure 2.8: Thermal denaturation monitored by CD spectroscopy at 222 nm 74
Figure 2.9: The effect of Gdn-HCl on CD signal of A. aeolicus Al 9PD 76
Figure 2.10: The effect of Gdn-HCl on enzyme activity of A. aeolicus A19PD 78
Figure 2.11: Fluorescence emission spectra of A19PD 79
Figure 2.12: Selected fluorescence emission spectra of A19PD during Gdn-HCl-induced
unfolding 80
Figure 2.13: Overlay of the effect of Gdn-HCl on intrinsic fluorescence. CD signal, and
enzyme activity of A. aeolicus Al 9PD 82
Figure 2.14: Gdn-HCl-induced unfolding of PD monitored by Fast Protein Liquid
Chromatography 83
Figure 2.15: Emission spectra of ANS in the presence of A19PD at different Gdn-HCl
concentrations 85
Figure 2.16: Stern-Volmer analysis of A aeolicus A19PD fluorescence quenching by
acrylamide 86
Figure 2.17: Emission fluorescence spectra of A19PD in the presence and absence of
prephenate and NAD" 89
Figure 2.18: Changes in fluorescence intensity of A19PDupon binding NAD" or
prephenate 90
Figure 2.19: Space filled model of A. aeolicus A19PD 102
Figure 2.20: A. aeolicus Al 9PD active site 103
Figure 3.1: Irreversible thermal inactivation of A. aeolicus PD and Al 9PD 121
Figure 3.2: Effect of temperature on PD activity of A. aeolicus 123
Figure 3.3: Variation of initial velocity of A. aeolicus PD reaction as a function of the
concentration of prephenate (A) and NAD+ (B) 125
Figure 3.4: Variation with pH of log V/K and log V for reaction catalyzed by A19PD 128
Figure 3.5: Fluorescence emission spectra of Hisl47Asn and Serl26Ala^. aeolicus
Al 9PD variants in the presence of increasing concentrations of prephenate 133
xn
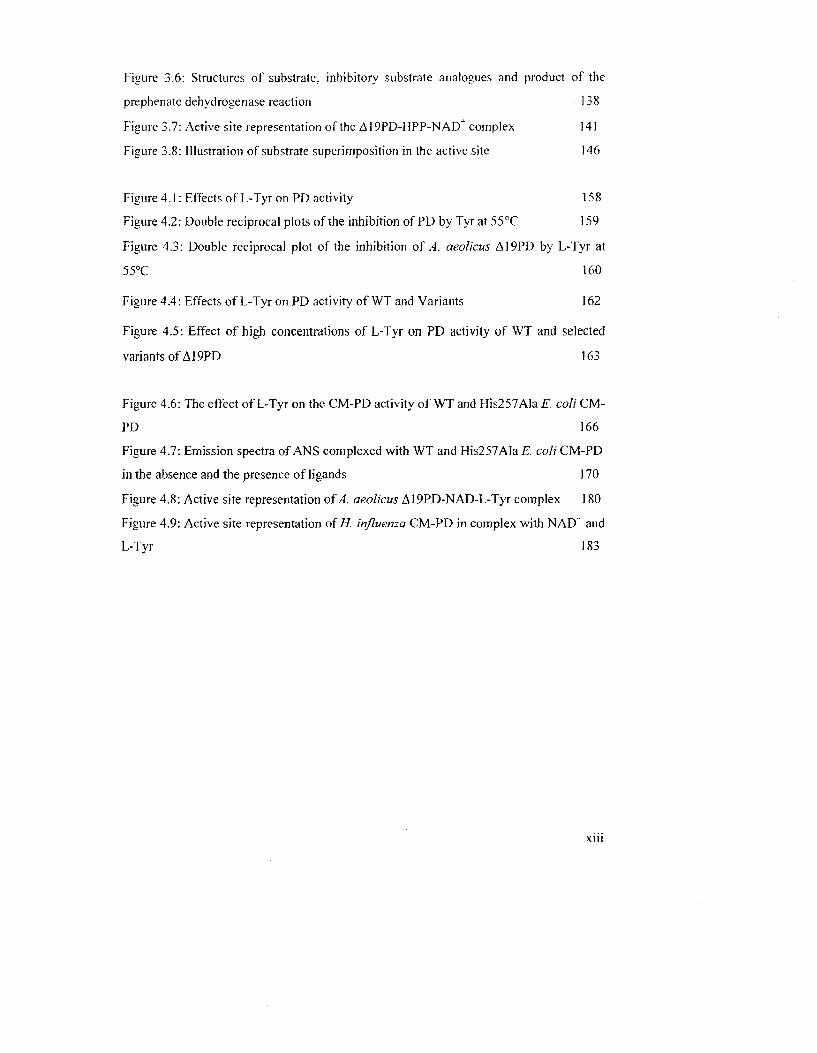
Figure 3.6: Structures of substrate, inhibitory substrate analogues and product of the
prephenate dehydrogenase reaction 138
Figure 3.7: Active site representation of the A19PD-HPP-NAD" complex 141
Figure 3.8: Illustration of substrate superimposition in the active site 146
Figure 4.1: Effects of L-Tyr on PD activity 158
Figure 4.2: Double reciprocal plots of the inhibition of PD by Tyr at 55°C 159
Figure 4.3: Double reciprocal plot of the inhibition of A. aeolicus A19PD by L-Tyr at
55°C 160
Figure 4.4: Effects of L-Tyr on PD activity of WT and Variants 162
Figure 4.5: Effect of high concentrations of L-Tyr on PD activity of WT and selected
variants of A19PD 16 J
Figure 4.6: The effect of L-Tyr on the CM-PD activity of WT and His257Ala E. coli CM-
PD 166
Figure 4.7: Emission spectra of ANS complexed with WT and His257AIa E. coli CM-PD
in the absence and the presence of ligands 170
Figure 4.8: Active site representation of A. aeolicus Al 9PD-NAD-L-Tyr complex 180
Figure 4.9: Active site representation of//, influenza CM-PD in complex with NAD" and
L-Tyr 183
xin
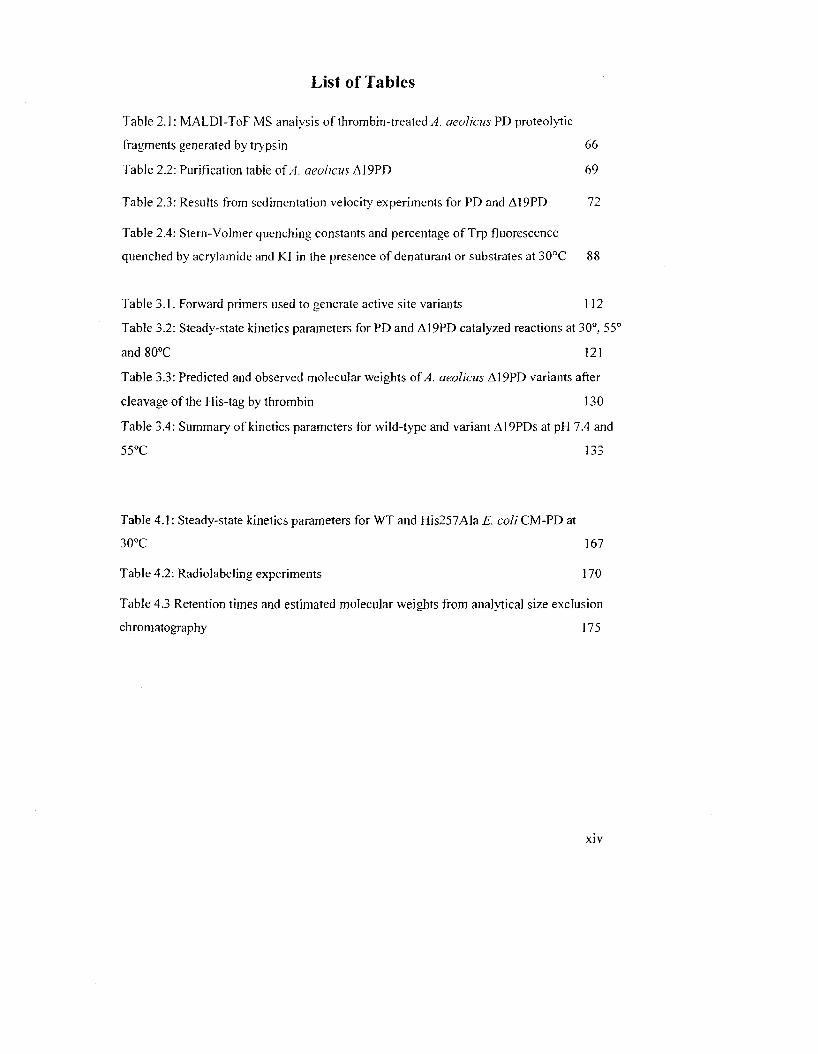
List of Tables
Table 2.1: MALDI-ToF MS analysis of thrombin-treated^. aeolicus PD proteolytic
fragments generated by trypsin 66
Table 2.2: Purification table of A. aeolicus Al 9PD 69
Table 2.3: Results from sedimentation velocity experiments for PD and A19PD 72
Table 2.4: Stem-Volmer quenching constants and percentage of Trp fluorescence
quenched by acrylamide and Kl in the presence of denaturant or substrates at 30°C 88
Table 3.1. Forward primers used to generate active site variants 112
Table 3.2: Steady-state kinetics parameters for PD and A19PD catalyzed reactions at 30°. 55°
and80°C 121
Table 3.3: Predicted and observed molecular weights of A. aeolicus A19PD variants after
cleavage of the His-tag by thrombin 130
Table 3.4: Summary of kinetics parameters for wild-type and variant A19PDs at pH 7.4 and
55°C 133
Table 4.1: Steady-state kinetics parameters for WT and His257Ala E. coli CM-PD at
30°C 167
Table 4.2: Radiolabeling experiments 170
Table 4.3 Retention times and estimated molecular weights from analytical size exclusion
chromatography 175
x iv
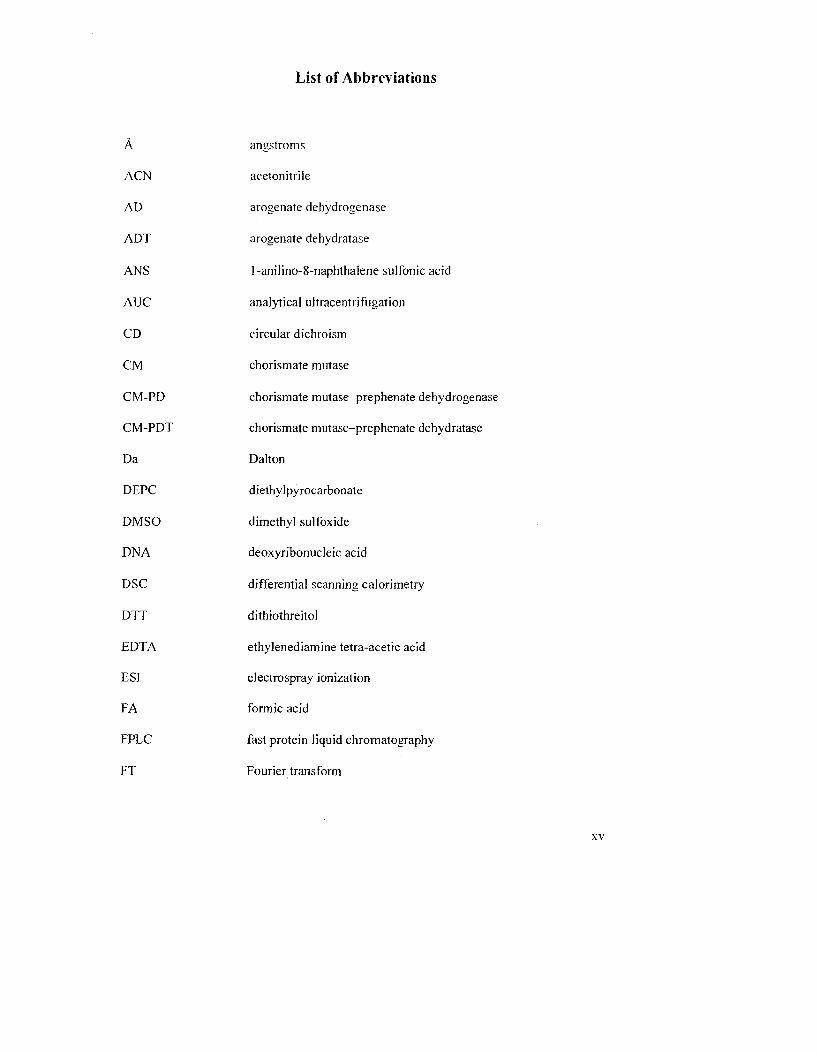
List of Abbreviations
A
ACN
AD
ADT
ANS
AUC
CD
CM
CM-PD
CM-PDT
Da
DEPC
DMSO
DNA
DSC
DTT
EDTA
ESI
FA
FPLC
FT
angstroms
acetonitrile
arogenate dehydrogenase
arogenate dehydratase
l-anilino-8-naphthalene sulfonic acid
analytical ultracentrifugation
circular dichroism
chorismate mutase
chorismate mutase-prephenate dehydrogenase
chorismate mutase-prephenate dehydratase
Dalton
diethylpyrocarbonate
dimethyl sulfoxide
deoxyribonucleic acid
differential scanning calorimetry
dithiothreitol
ethylenediamine tetra-acetic acid
electrospray ionization
formic acid
fast protein liquid chromatography
Fourier transform
xv
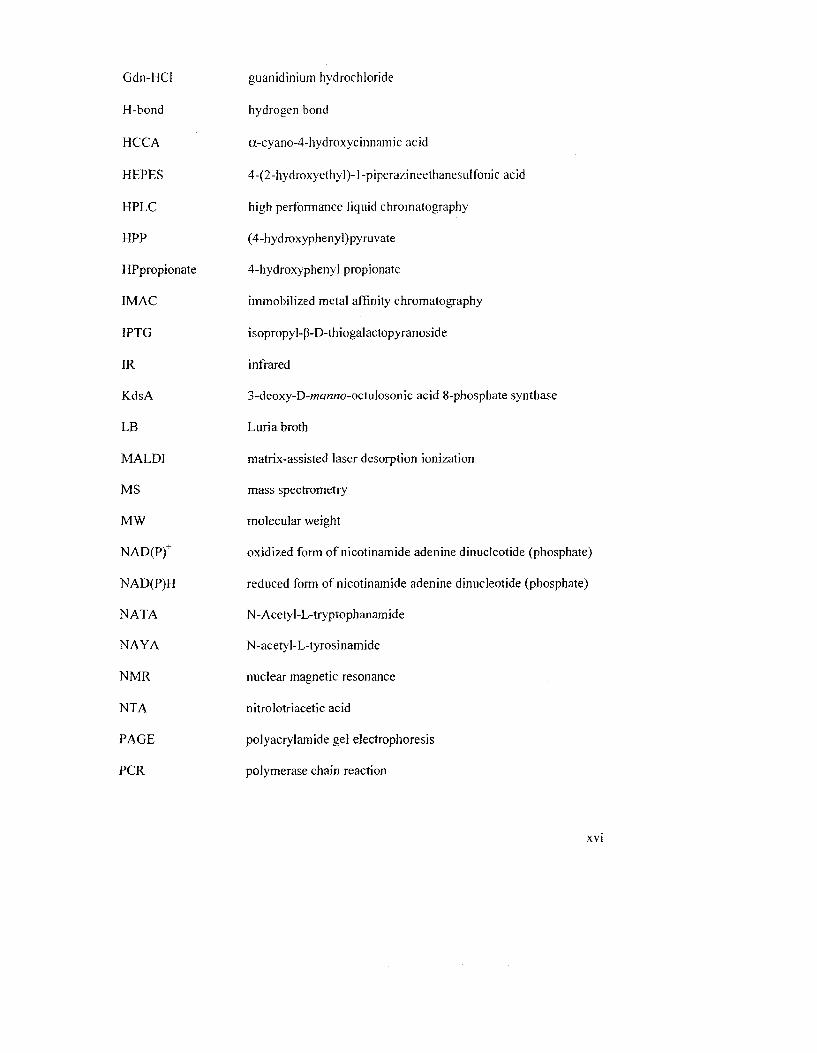
Gdn-HG guanidinium hydrochloride
H-bond hydrogen bond
HCCA a-cyano-4-hydroxycinnamic acid
HEPES 4-(2-hydroxyethyl)-]-piperazineethanesulfonic acid
HPLC high performance liquid chromatography
HPP (4-hydroxyphenyl)pyruvate
HPpropionate 4-hydroxypheny] propionate
IMAC immobilized metal affinity chromatography
IPTG isopropyl-fJ-D-thiogalactopyranoside
IR infrared
KdsA 3-deoxy-D-mottwo-octulosonic acid 8-phosphate synthase
LB Luria broth
MALDI matrix-assisted laser desorption ionization
MS mass spectrometry
MW molecular weight
NAD(P)+ oxidized form of nicotinamide adenine dinucleotide (phosphate)
NAD(P)H reduced form of nicotinamide adenine dinucleotide (phosphate)
NATA N-Acetyl-L-tryptophanamide
NAYA N-acetyl-L-tyrosinamide
NMR nuclear magnetic resonance
NTA nitrolotriacetic acid
PAGE polyacrylamide gel electrophoresis
PCR polymerase chain reaction
xvi
PD
PDT
PMSF
PRE
TCEP
TFA
Tris
SDS
U
UV
VT
prephenate dehydrogenase
prephenate dehydratase
phenylmethylsulfonyl fluoride
prephenate
tri(2-carboxyethyl)phosphine hydrochloride
trifluoroacetic acid
tris(hydroxymethyl)aminomethane
sodium dodecylsulfate
units
ultra violet
variable temperature
XVIJ
Contributions of Authors
Most of the work presented in Chapters 2 and 3 are published in Protein Science
(J. Bonvin. R. Aponte. M Marcantonio, S. Singh. D. Christendat and J.L. Turnbull, 2006,
15:14] 7-1432. sup. mat. 1 -4) or have been recently submitted to the Journal of Biological
Chemistry (W. Sun. D. Shahinas, J. Bonvin. W. Hou, J. Turnbull and D. Christendat).
Chapter 2 constitutes my experimental input to the publication in Protein Science. 1
performed all the experiments, helped write the paper and reformatted its contents to
highlight my contributions. R. Aponte worked out a purification scheme for the full-
length A. aeolicus PD enzyme, examined its thermal stability and supplied the
preliminary kinetic parameters of the enzyme at one temperature. M. Marcantonio,
honours undergraduate student, conducted the first CD experiments on A19PD. I repeated
the work and incorporated any additional unpublished findings into Chapter 2. Chapter 3
constitutes my experimental input to a manuscript that has been submitted to JBC.
However, plasmid DNA for A19PD WT. Hisl47Asn, Glul53Ala, Serl26Ala, Asp247Ala
was supplied by W. Sun while W. Hou supplied the plasmid DNA forR250Q and H217N
and the kinetic values for the R250Q variant. All of the crystallographic work (including
interpretation) was contributed by the Christendat lab; J. Turnbull helped with the
interpretation. ] wrote this chapter. For Chapter 4, J. Manioudakis supplied the His257Ala
protein and kinetic parameters of the enzyme. T. Lee performed initial Tyr inhibition
studies on His247Ala. ] repeated these experiments and performed all other experiments
in the chapter, provided interpretation of the data and wrote the chapter (manuscript in
preparation).
xviii
Chapter 1
General Introduction
1
1.0 AROMATIC AMINO ACID BIOSYNTHESIS
The aromatic amino acids. L-tyrosine (Tyr). L-tryptophan (Trp) and L-
phenylalanine (Phe) are of critical importance for the growth and maintenance of all
living organisms. These amino acids act both as products and precursors. In the former
case, they can be used for protein synthesis, whereas in the latter case, they can be
substrates for enzymes in the downstream pathways. They also produce aromatic
metabolites which are involved in primary biological processes, making them
indispensable for survival. This includes compounds such as flavonoids (7), quinones (2,
3), cyanogenic glycosides (4) and alkaloids (5, 6). In archae, eubacteria, plants and fungi,
the three aromatic amino acids are synthesized via the shikimate pathway. This pathway,
which links the metabolism of carbohydrates to the biosynthesis of aromatic compounds,
was elucidated mainly through the work of Davis (7) and Sprinson (<?). It encompasses
seven metabolic steps initiated by the condensation of erythrose-4-phosphate and
phosphoenol-pyruvate to give a 7-carbon compound, 3-deoxy-D-tfra6z'wo-heprulosonate
7-phosphate (DAHP) (Fig. 1.1). This step is catalyzed by the highly regulated 3-deoxy-
D-araWno-heptuIosonate 7-phosphate synthases (DAHP synthases) of which there are
three isoenzyme forms: DAHP synthase (Phe), (Trp) and (Tyr) (9, 10). Each form is
classified according to the amino acid which serves as a feedback inhibitor. The pathway
ends with the synthesis of the branch point intermediate of the pathway, chorismate,
which serves in turn not only as a precursor for the biosynthesis of the three aromatic
amino acids, but also a number of other aromatic compounds such as vitamins, quinones
or folates (77, 12).
2
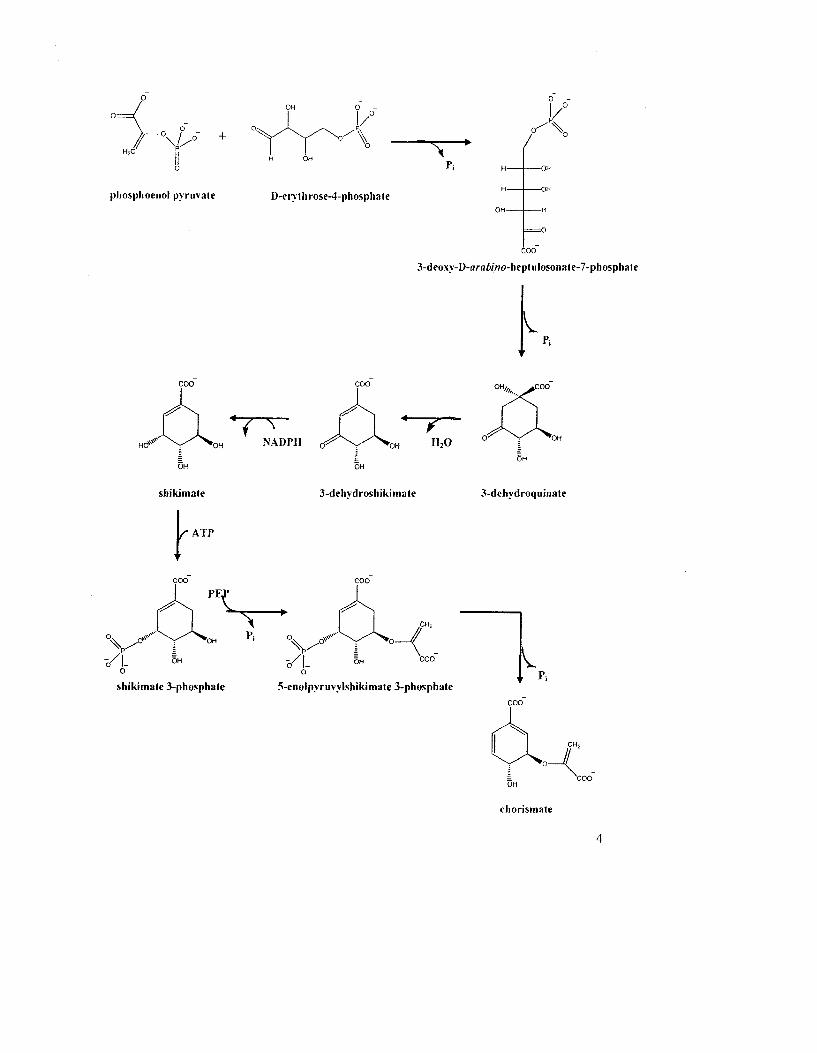
Figure 1.1: The shikimate pathway. The shikimate pathway consists of seven enzyme-
catalyzed steps. Metabolites symbols: DHAP. 3-deoxy-D-ara&r>7oheptulosonate 7-
phosphate; DHQ, 3-dehydroquinate; SH, shikimate; EPSP, 5-enoIpyruvateshikimate 3-
phosphate and CHO. chorismate.
H7C I,
phosphoenol pyruvate
H OH
D-erythrose-4-phosphate
T^ A
Pi
H -
O H -
3-deox_v-D-flrflWno-heptulosonate-7-phosphate
L
OH'li _>COO
T HO*V " y "»OH
OH
NADPH
shikimate
W T P
3-dehvdroshikimate 3-dehydroquinale
v*
JEP
T Pi
Yl -/I o
• ° <
,CH2
shikimate 3-phosphate 5-enolpyruvyIshikimate 3-phosphate
^ Pi
OH
chorismate
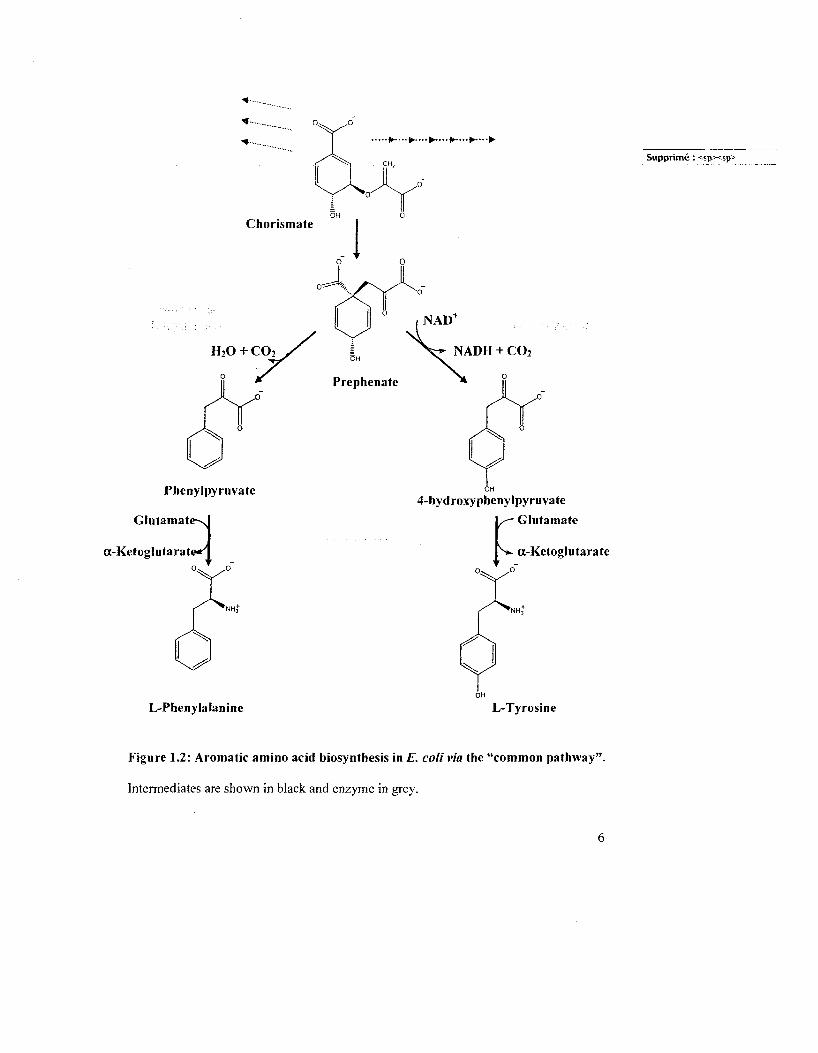
Chorismate is then converted to L-Tyr or L-Phe via the "common pathway" (Fig. 1.2). In
this pathway, chorismate undergoes a Claisen rearrangement to prephenate. catalyzed by
chorismate mutase (CM), then prephenate is either oxidatively decarboxylated by the
NADT-dependent prephenate dehydrogenase (PD) to form /7-hydroxyphenylpyruvate
(HPP) or is dehydrated and decarboxylated by prephenate dehydratase (PDT) to
phenylpyruvate (PP). These aromatic precursors are then transaminated appropriately to
either L-Tyr or L- Phe. The biosynthesis of the third amino acid. L-Trp. also originates
from chorismate but involves six steps from a separate pathway (Fig. 1.3). The first two
and last two reactions are catalyzed by enzyme complexes, namely the anthranilate
synthase-phosphoribosyl transferase complex and the tryptophan synthase complex,
respectively.
Both the shikimate and the "common" pathways are not present in mammals,
consequently, these enzymes are attractive targets for the design of inhibitors which can
act as herbicides, fungicides and antimicrobial agents (75, 14). One of the best known
examples is the herbicide, glyphosate (Roundup®), which inhibits 5-ewo/pyruvyl
shikimate 3-phosphate synthase {15). Moreover, these enzymes are well recognized in
bioengineering as targets for aromatic amino acid and secondary metabolites production
(16). The use of metabolic engineering to produce Phe and Trp has gained considerable
attention due to the commercial value of these aromatic amino acids (and their synthetic
intermediates) in the food, pharmaceutical and agricultural industries. For example, the
Trp biosynthetic pathway has been exploited in E. coli for the production of aromatic
compounds such as bio-indigo (17, 18) and shikimic acid (19): Trp is also used as
5
Phenylpyruvate
Glutamate-U
a-Ketoglutarate-H
4-hyd roxy phenylpyruvate - Glutamate
^»- a-Ketoglutarate
Supprime: <spxsp>
L-Phenylalanine L-Tyrosine
Figure 1.2: Aromatic amino acid biosynthesis in E. colivia the "common pathway''
Intermediates are shown in black and enzyme in grey.
6
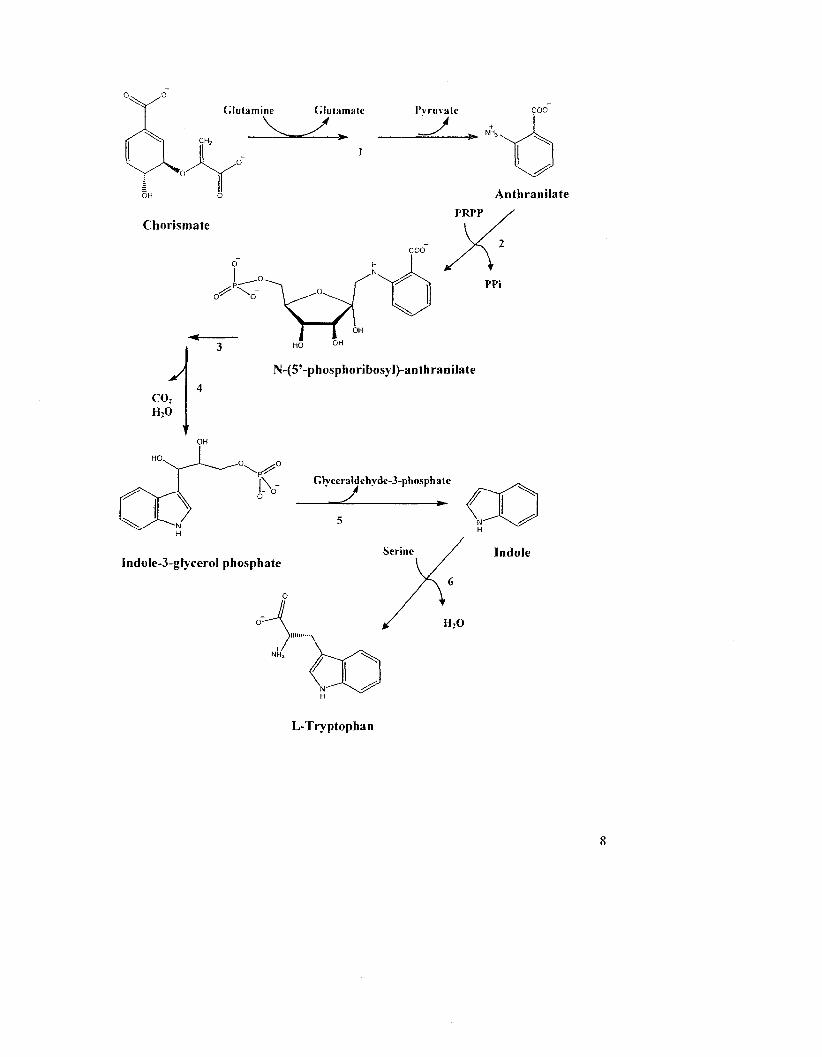
Figure 1.3: Tryptophan biosynthesis. The pathway consists of six enzyme-catalyzed
steps. 1, anthranilate synthase, 2, anthranilate phosphoribosyltransferase. 3,
phosphoribosylanthranilate isomerase, 4, indole-3-glyceroI-phosphate synthase. 5-6,
tryptophan synthase enzyme complex. PRPP: 5-phosphoribosyI-a-pyrophosphate
7
X/° Glutamine Glutamate Pyruvate
Anthranilate
PRPP Chorismate
o ^ \ " PPi
A co2 H 2 0
N-(5'-phosphoribosyI)-anthraniIate
i \ _ Glveeraldehvde-3-phosphate
Indole-3-gIyceroI phosphate
L-Tryptophan
an animal feed. Similarly. Phe is one of the major constituents of the sweetner aspartame,
also known as NutraSweet® (20). In the past. Tyr was supplied mainly by chemical
synthesis and protein hydrolysis since only small volume applications were required.
More recently however. Tyr has been identified as a valuable precursor in the synthesis
of melanin (21), anti-Parkinson ?s drugs L-dopa (22, 23) and 3,4-dihydroxyphenyl-L-
alanine (19) and biodegradable polymers (24). In order to support the demands for large
scale production of Tyr and intermediates in the common pathway, strategies to
manipulate its biosynthetic route are now being explored (25, 26). Hence, there is
considerable interest in understanding the catalytic mechanism and modes of regulation
of aromatic amino acid-producing enzymes in a number of organisms.
The aromatic amino acid biosynthesis pathway is regulated at both the genetic and
protein level. Many of the genes encoding the biosynthetic enzymes for aromatic amino
acids are organized in operons. The operons are regulated by three regulatory genes tyrR,
trpR or pheR. The protein products of these genes combine with the appropriate amino
acid co-repressor, resulting in the formation of complexes that bind at the operator loci.
Additional regulation is achieved through attenuation at the level of charged tRNA(s)
(27), although, the major form of control is achieved through feedback inhibition by Phe,
Tyr or Trp of enzymes at the start (DHAP synthase) and at the branch point in the
biosynthetic pathways leading to these products. Interestingly, bacterial enzymes are
controlled mainly by feedback inhibition while in higher plants regulation occurs at the
genetic level and physiological feedback inhibition is absent (28). Accordingly, research
efforts are now being directed towards engineering strains of organisms that lack tyrR
and/or are resistant to feedback inhibition in order to modulate Tyr production (29).
9
1.1 ALTERNATE BIOSVNTHETIC ROUTES TO TYROSINE AND
PHENYLALANINE
We have outlined previously how L-Tyr and L-Phe can be synthesized from HPP
and PP, respectively (Fig. 1.2). However, an alternate pathway to Tyr and Phe production
exists that utilizes L-arogenate as an intermediate (Fig. 1.4). L-arogenate possesses many
of the same structural features as prephenate but it is a cyclohexadienyl amino acid: an
alanyl group replaces the pyruvyl side chain at C-l. In the arogenate route, prephenate is
first transaminated into L-arogenate which then is converted to L-Tyr or L-Phe by
arogenate dehydrogenase (AD) or arogenate dehydratase (ADT). The arogenate pathway
was discovered in cyanobacteria by Stenmark e1 al.{30) about 40 years ago. While kinetic
assays failed to reveal prephenate dehydrogenase activity (30), they noted the
consumption of an amino acid in addition to prephenate. This finding signified that
transamination could occur prior to decarboxylation. Stenmark and coworkers then went
on to isolate the novel dehydrogenase and named the aromatic compound pretyrosine.
Only when it was discovered that pretyrosine could be a precursor of L-Phe was it
renamed L-arogenate (37).
The ubiquitous combination of the two routes, the HPP/PP and the arogenate
routes, results in widespread diversity in the biosynthesis of Tyr and Phe. In most plants
and some bacteria (ie. cyanobacteria) both Tyr and Phe are synthesized using the
arogenate pathway, while in E. coli and yeast, this pathway is reportedly absent (32-36).
In cyanobacteria and several other microorganisms such as Brevibacterium flavum, the
arogenate pathway is used to produce Tyr while Phe is synthesized from PP (35, 37).
10
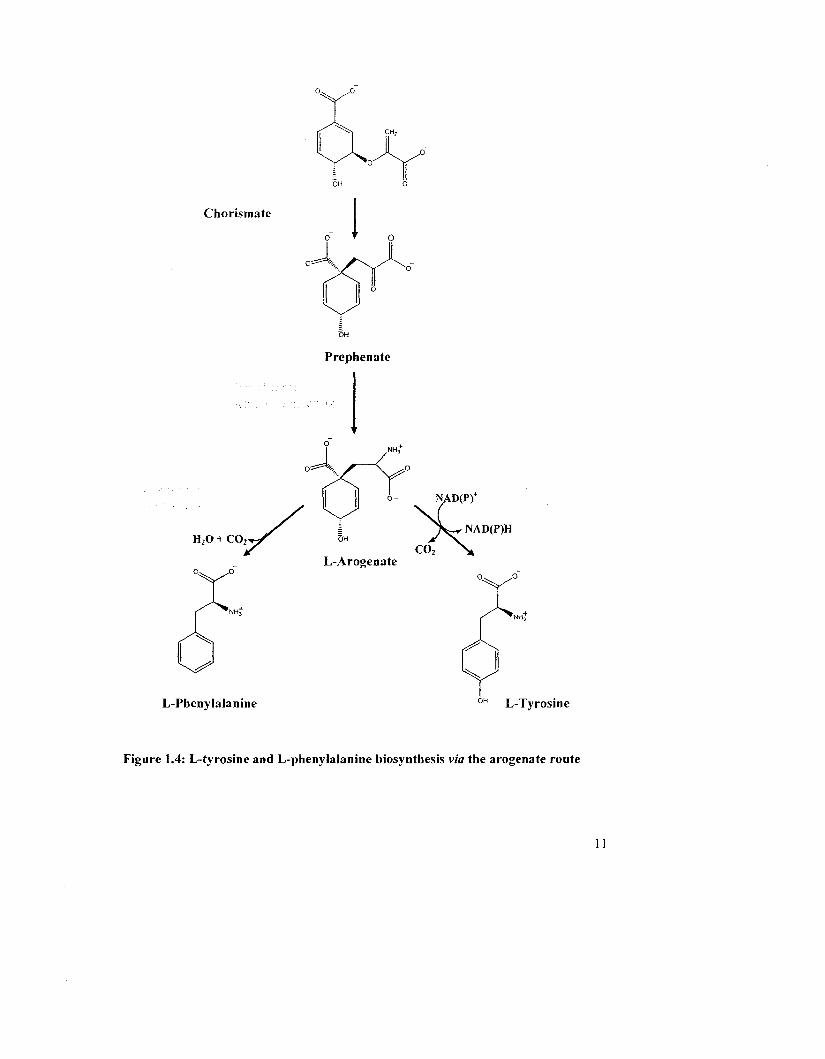
Chorismate
Prephenate
H20 + C02
L-Arogenate
L-Phenylalanine L-Tyrosine
Figure 1.4: L-tyrosine and L-phenylalanine biosynthesis via the arogenate route
1]
In other bacterial species, such as Zymomonas mobilis and Pseudomonas aeruginosa, the
HPP and L-arogenate routes coexist (38, 39). Distinct enzyme combinations allow for
considerable regulatory control over the type and amount of end products that accumulate
in a pathway. For example in plants, arogenate is the sole branch point for the
biosynthesis of Tyr and Phe, hence ADs must be "accurately" regulated to balance the
flux of intermediates between these aromatic end products. Phe and its myriad of
secondary metabolites are of great importance for plant survival. When required, 30% of
the carbon fixed during photosynthesis is shunted to Phe for the synthesis of
phenylpropanoids such as lignins, hydroxycinnamic amides, flavonoid phytoalexins, and
pigments; much less carbon is incorporated into the production of Tyr. AD in plants is
very sensitive to feed feedback inhibition by Tyr (40, 41) whereas ADT is stimulated by
Tyr (42). In contrast, in Synechocyslis where Tyr is synthesized by the arogenate route,
AD is not at a branch point since Phe is synthesized via the PP route (32-35).
Accordingly, AD from this organism is reported to be less sensitive to Tyr (43).
1.2 TYRA PROTEIN FAMILY
The TyrA protein family is dedicated to Tyr biosynthesis and consists of
homologous dehydrogenases that are classified into three categories depending upon their
specificities for the cyclohexadienyl substrate; prephenate dehydrogenases are specific
for prephenate, arogenate dehydrogenases (AD) for L-arogenate and cyclohexadienyl
dehydrogenases can accept both substrates. In addition to their specificity for the
cyclohexadienyl substrate, these dehydrogenases may be specific for NAD+ or NADP+ or
may use both (36). Absolute specificity for prephenate tends to be accompanied by
12
absolute specificity for NAD and the reverse relationship is also observed, whereby
absolute specificity for L-arogenate is usually accompanied by absolute specificity for
NADP* (44, 45).
In all three domains of life, these proteins catalyze an irreversible oxidative step
in Tyr biosynthesis. They share a catalytic core region of about 30 kDa and maintain a
common scaffold of fundamental reaction chemistry (46). Many exist as monofunctional
enzymes, but some are linked to other enzymes or fused to regulatory domain(s). To cite
several examples, TyrA from Z mobilis, N. gonorrhoeae or Synechocystis sp. are
structurally the simplest proteins belonging to the TyrA family; they contain only a core
catalytic domain (36). Interestingly, TyrA from Z mobilis is insensitive to feedback
inhibition. In the enteric lineage (ie. E. coli, H. influenza. P. agglomerans) however, tyrA
is fused with aroO (encoding chorismate mutase). Additionally, the aroF gene encoding
enolpyruvylshikimate-3-P synthase is fused to tyrA in at least two clades of Bacteria such
as Ps. stutzeri, P. aeruginosa and Burkholderia pseudomallei. Song et al. reported that in
a single organism, Rhodobacter sphaeroides, tyrA is fused to hisH\, which encodes an
aromatic aminotransferase (47). Other examples are cited by Sun et al. (48). Another type
of fusion partner found in several other organisms are regulatory domains. For example,
the well-characterized TyrA from B. subtilis possesses a carboxy-terminal fusion domain
denoted ATC, after the first letters of three of the proteins possessing this domain
(Aspartate kinase-Chorismate mutase-TyrA), which is capable of binding small
regulatory molecules. In Archaea, a putative regulatory domain. REG, has been identified
(47).
13
The TyrA protein family has been extensively studied in a
phylogenetic/bioinformatics context (two excellent review has been very recently
published by Jensen and co-workers (36, 45)). While enzymes from a variety or
organisms have been (tentatively) classified in terms of their substrate specificity and
mode of regulation through in silico analyses, only a few TyrA proteins have been
purified and characterized. These include arogenate dehydrogenases from Synechocystis
sp. (36) and A. thaliana (40, 49), two cyclohexadienyl dehydrogenases (from Z. mobilis
and Ps. stutzeri) and the genetically engineered monofunctional PDs from E. coli (50)
and E. herbicola (51). Extensive biochemical and biophysical studies have been
conducted only on the bifunctional E. coli enzyme CM-PD (52, 53) however, the findings
of which have provided valuable insight into the catalytic mechanism of the PD enzyme.
1.3 THE BIFUNCTIONAL E. COLI ENZYME, CM-PD: THE STRUCTURAL
RELATIONSHIP BETWEEN THE TWO ACTIVITIES
In E. coli the pathway for Tyr biosynthesis involves two sequential reactions
catalyzed by the bifunctional enzyme chorismate mutase-prephenate dehydrogenase
(CM-PD) (54, 55) known as the T-protein. L-Tyr, the end product of the pathway is a
feedback inhibitor of both the mutase and dehydrogenase activities (54).
Solution studies indicate that the E. coli enzyme is homodimeric with a molecular
weight of about 84 kDa (56, 57). The enzyme is considered bifunctional however, since
both activities are associated with each of the polypeptide chains. Primary sequence
alignment of CM-PD with the bifunctional enzyme CM-PDT leading to L-Phe indicates
that of the 373 residues per monomer, the N-terminal 100 residues encode the mutase
14
domain while the remaining 273 residues are responsible for the dehydrogenase activity
(58). The structural organization of the sites which catalyze the two activities within the
bifunctional enzyme has not been firmly established.
Evidence supporting a unique site combining both activities comes from studies
on the enzyme from Aerobacter aerogenes and E. coli. Subjecting the enzyme to a
variety of treatments such as urea, heat, extreme pH. limited proteolysis (59, 60) or
cysteine-modifying agents (56, 61) has led to the coordinate loss of both activities.
Furthermore, inactivation by alkylation of both activities was prevented by prephenate,
NAD", and NAD+ plus L-Tyr (56, 61). Further evidence stems from the results of studies
of the inhibition of both activities with compounds that are clearly analogues of either
chorismate or prephenate; these analogues bound with equal affinity to inhibit both CM
and PD activities (62). Additionally, prephenate binds with similar affinity to the enzyme
when acting as a substrate of the dehydrogenase reaction or as an inhibitor of the mutase
reaction (59). Lastly, kinetic studies show that the two reactions are catalyzed with
comparable turnover number (63).
There is also evidence in favor of two distinct sites or of specific residues
involved in catalyzing each of the two reactions. The two enzymes display markedly
different pH rate profiles (64) and both activities are inhibited to different degrees by L-
Tyr (56, 65) and by the dicarboxylic acid malonic acid and several of its derivatives (56).
Additionally, site-specific inhibitory compounds have been identified. A putative
transition-state analog (era/o-oxabicyclic diacid) of CM has been shown to competitively
inhibit the mutase reaction without affecting dehydrogenase activity (56), while trans-
2,3-pleiadanedicarboxylic acid reportedly inhibited PD without impairing the mutase
15
activity (66). This hypothesis has been supported by Christendat and Turnbull (67) whose
peptide mass mapping experiments revealed the selective modification of mutase or
dehydrogenase residues. Additionally, they demonstrated through site-directed
mutagenesis studies that an amino acid substitution introduced in the CM domain
(Lys37Gln) could totally eliminate mutase activity without affecting the dehydrogenase
activity (52). Similarly, substitutions in the PD portion of the enzyme abolished only
dehydrogenase activity (Hisl97Asn) (52) orprephenate binding (Arg294Asn) (53).
Kinetic evidence also supports the idea that if the enzyme possesses two active
sites, they must be in close proximity or in some way structurally dependent. Results of
the inhibition of the enzyme by malonate or citrate by Christopherson (62) indicated that
the binding of either analogue with prephenate was mutually exclusive but that malonate
(or citrate) and chorismate could be on the enzyme at the same time, thus suggestive of
overlapping active sites. Some prephenate from chorismate is converted directly to HPP,
as would be expected if prephenate was channeled from one active site to the other (68).
Lastly, further mutagenesis studies in the Turnbull lab have identified protein variants
whose single substitutions (Lysl78Arg. Hisl89Asn. Cys215Ala. Arg286Ala) impaired
both CM and PD activities (52, 67).
There have been efforts to separate the activities of the T-protein into discrete
monofunctional domains. Jensen and coworkers initially reported the successful
expression of a PD derived from E. herbicola CM-PD. but only when a large portion of
the mutase domain remained intact (69). More recent work by Ganem and colleagues
(50) and by our lab (Bonvin, unpublished data) showed that independently expressed CM
and PD domains of the E. coli enzyme have reduced activity and are highly unstable or
16
insoluble, highlighting the structural interrelationship of the different regions of the
polypeptide chain. In contrast, the related bifunctional enzyme CM-PDT involved in Phe
biosynthesis, has been shown to possess two distinct non-interacting catalytic sites (70-
72) and a separate inhibitory Phe binding domain (the ATC domain) at the C-terminal
portion of each polypeptide (73). All of these domains found within CM-PDT can be
separately expressed and are fully functional (70, 74). Additionally, Zhang et al.
genetically linked the genes encoding the CM and Phe binding domains (75). Kinetic
analysis of the fusion protein showed that Phe activated CM activity (although did not
inhibit as expected), indicating nevertheless that allosteric control could be transmitted
through the domain contacts.
1.4 CHORISMATE MUTASE MECHANISM
CM catalyzes the only pericyclic Claisen rearrangement reaction reported in
nature (76). While the reaction can occur in the absence of the enzyme, the mutase
accelerates the reaction by over a million-fold (77, 78) Both the uncatalyzed (79, 80) and
enzyme catalyzed rearrangements (77, 81, 82) are thought to proceed via a chair-like
transition state following selection of chorismaters less stable diaxial form.
17
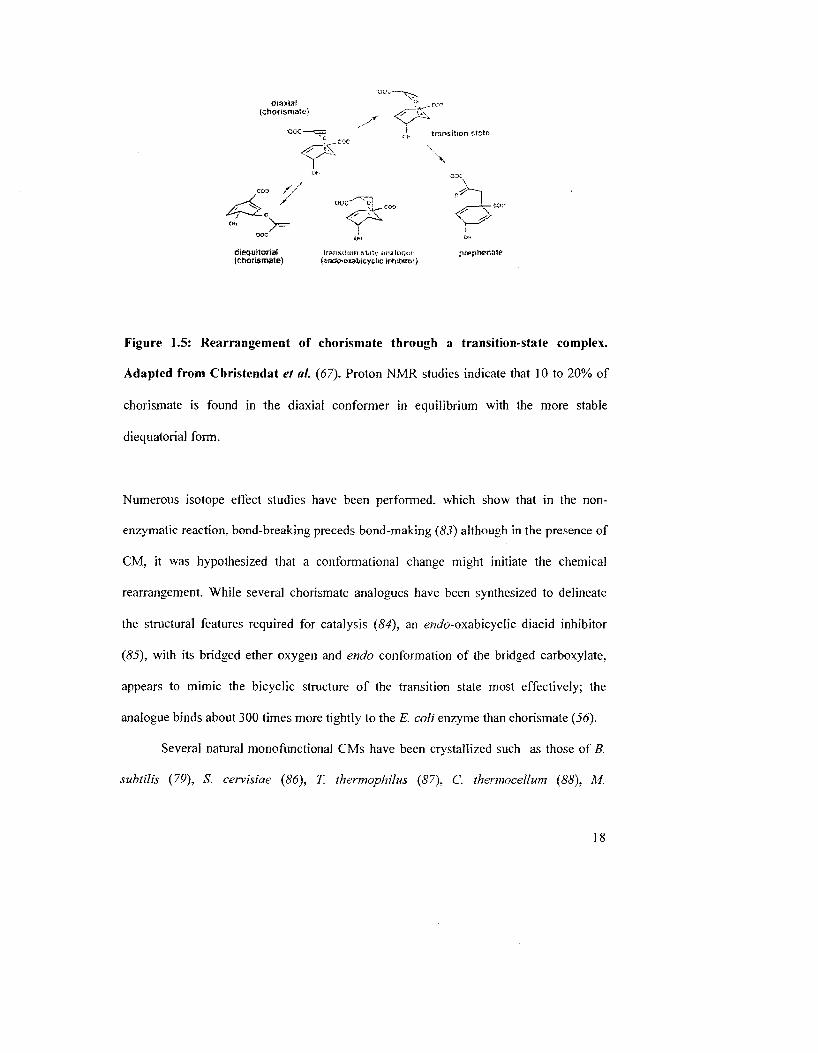
dtequitorial Irsnssisnnstil'c&nakimsr prepftcfl31e (chorisnwte) (endp-oKititcyetic inhttHtor}
Figure 1.5: Rearrangement of chorismate through a transition-state complex.
Adapted from Christendat et ah (67). Proton NMR studies indicate that 10 to 20% of
chorismate is found in the diaxial conformer in equilibrium with the more stable
diequatorial form.
Numerous isotope effect studies have been performed, which show that in the non-
enzymatic reaction, bond-breaking preceds bond-making (83) although in the presence of
CM, it was hypothesized that a conformational change might initiate the chemical
rearrangement. While several chorismate analogues have been synthesized to delineate
the structural features required for catalysis (84), an ewc/o-oxabicyclic diacid inhibitor
(85), with its bridged ether oxygen and endo conformation of the bridged carboxylate,
appears to mimic the bicyclic structure of the transition state most effectively; the
analogue binds about 300 times more tightly to the E. coli enzyme than chorismate (56).
Several natural monofunctional CMs have been crystallized such as those of B.
subtilis (79), S. cervisiae (86), T. thermophilics (87), C. thermocellum (88), M.
18
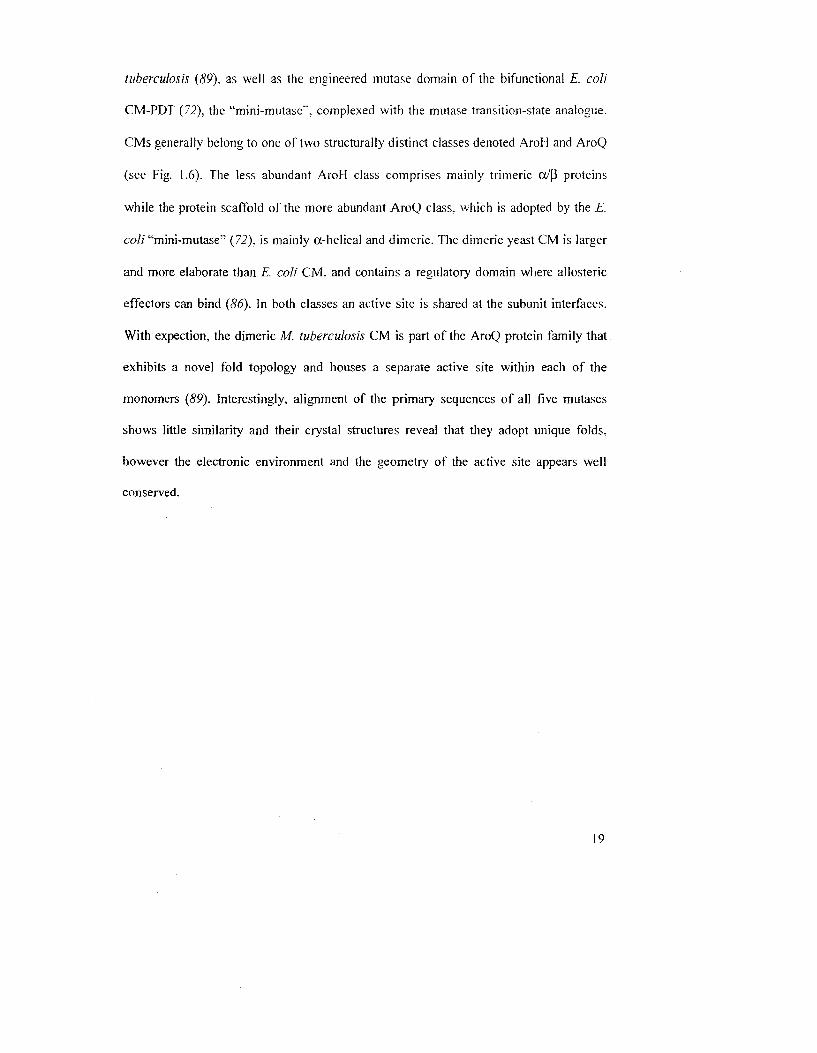
tuberculosis (89). as well as the engineered mutase domain of the bifunctional E. coli
CM-PDT (72), the "mini-mutase". complexed with the mutase transition-state analogue.
CMs generally belong to one of two structurally distinct classes denoted AroH and AroQ
(see Fig. 1.6). The less abundant AroH class comprises mainly trimeric aJfi proteins
while the protein scaffold of the more abundant AroQ class, which is adopted by the E.
coli "mini-mutase" (72). is mainly a-helical and dimeric. The dimeric yeast CM is larger
and more elaborate than E. coli CM. and contains a regulatory domain where allosteric
effectors can bind (86). In both classes an active site is shared at the subunit interfaces.
With expection, the dimeric M. tuberculosis CM is part of the AroQ protein family that
exhibits a novel fold topology and houses a separate active site within each of the
monomers (89). Interestingly, alignment of the primary sequences of all five mutases
shows little similarity and their crystal structures reveal that they adopt unique folds,
however the electronic environment and the geometry of the active site appears well
conserved.
19
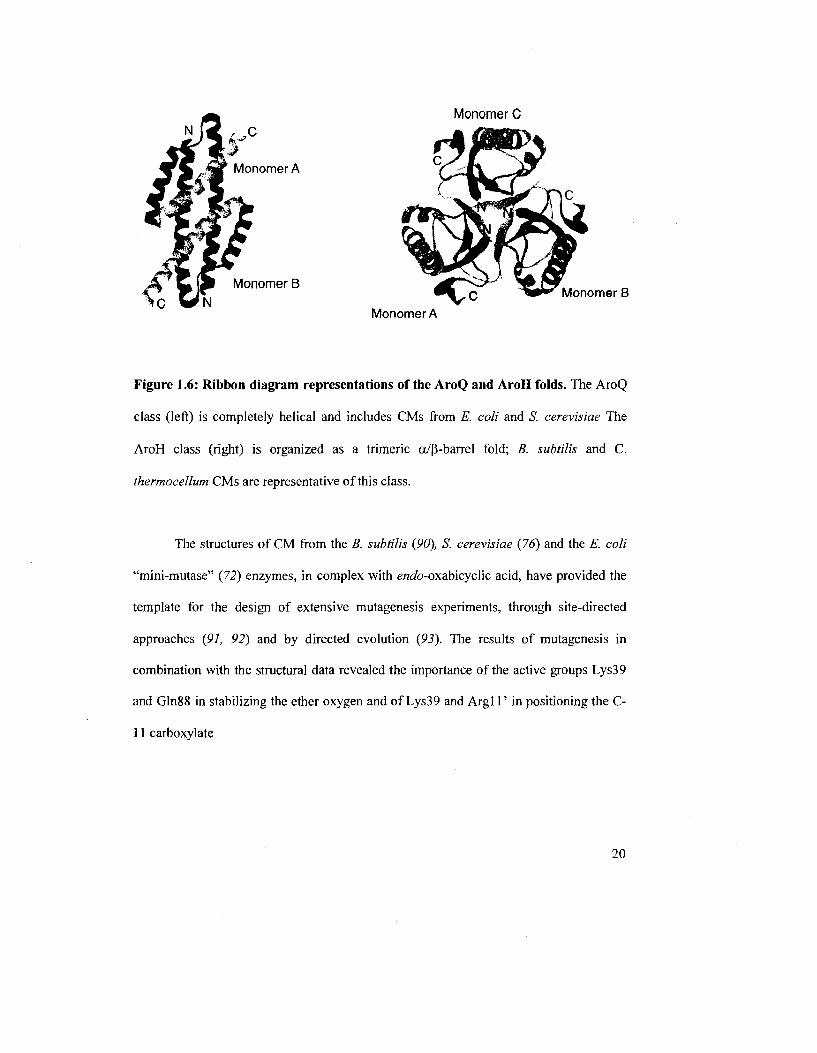
Figure 1.6: Ribbon diagram representations of the AroQ and AroH folds. The AroQ
class (left) is completely helical and includes CMs from E. coli and S. cerevisiae The
AroH class (right) is organized as a trimeric a/p-barrel fold; B. subtilis and C.
thermocellum CMs are representative of this class.
The structures of CM from the B. subtilis (90), S. cerevisiae (76) and the E. coli
"mini-mutase" (72) enzymes, in complex with erccfo-oxabicyclic acid, have provided the
template for the design of extensive mutagenesis experiments, through site-directed
approaches (91, 92) and by directed evolution (93). The results of mutagenesis in
combination with the structural data revealed the importance of the active groups Lys39
and Gln88 in stabilizing the ether oxygen and of Lys39 and Argl 1' in positioning the C-
11 carboxylate
20
Arg28 H /Arg26 N ' Arg157
Asp48 Glu48
Asn1&4 ° *v Gln88 Glu86
\ GIU52 6lu50 6lu198
Ser82 Thr2«
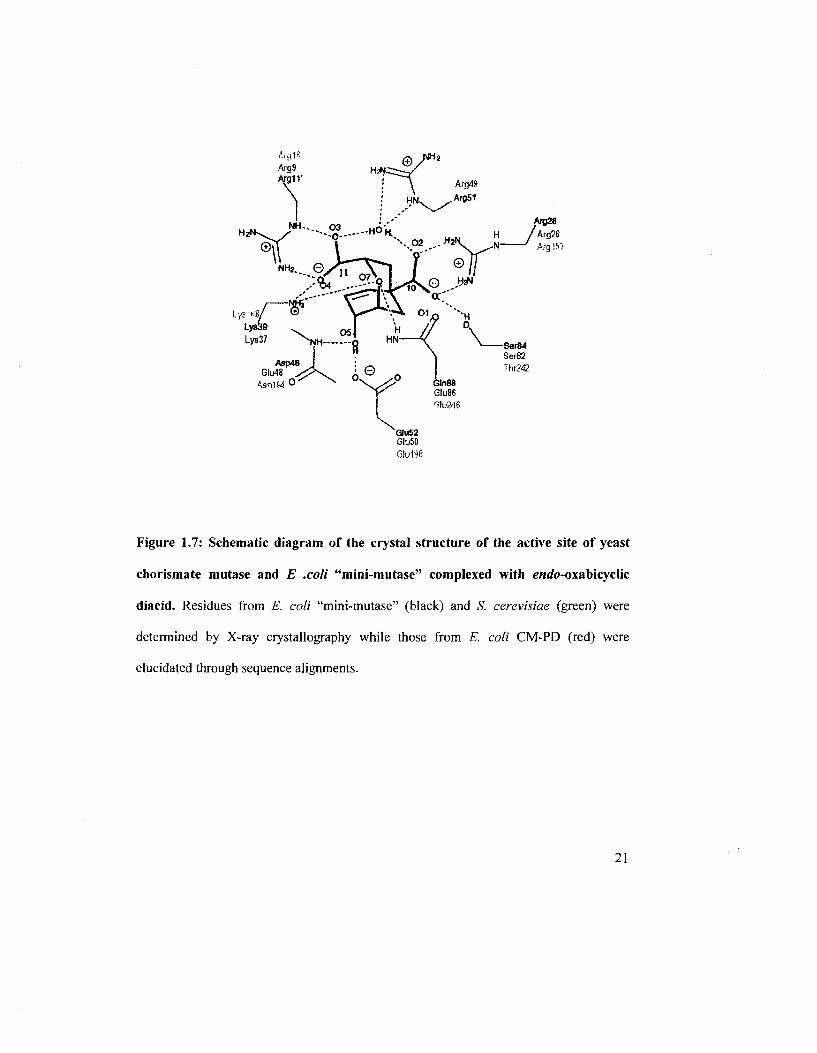
Figure 1.7: Schematic diagram of the crystal structure of the active site of yeast
chorismate mutase and E .coli "mini-mutase" complexed with ewtfo-oxabicyclic
diacid. Residues from E. coli "mini-mutase" (black) and S. cerevisiae (green) were
determined by X-ray crystallography while those from E. coli CM-PD (red) were
elucidated through sequence alignments.
21
group in the highly charged region of the active site (Fig. 1.7). Undeniably Lys39 (Lys37
in E. coli CM-PD) is the key cationic residue. The activity of the mutase reaction from E.
coli CM-PD is very pH dependent, indicating the participation of three groups (two
protonated and one deprotonated) in substrate binding and/or catalysis; Lys37 may be one
of these residues, poised to protonate the ether oxygen of chorismate in the transition
state of the reaction(6/). Additionally. pH-dependent activity profiles described for a
variant (Gln88Glu) of the mini-mutase and for wild-type CM from yeast (contains GIu at
position 246) indicated the importance of a protonated side chain at this position. There
have been a number of chemical mechanisms proposed for the CM-catalyzed reactions:
acid/base catalysis, a nucleophile-assisted dissociative mechanism (80), and transition
state stabilization through conformational trapping. As expected, the catalytic mechanism
of the CM-catalyzed reaction continues to be under intense study.
1.5 PREPHENATE DEHYDROGENASE MECHANISM AND ITS INHIBITION
BY L-TYROSINE
The oxidative decarboxylation of prephenate to HPP in the presence of the
cofactor NAD" is catalyzed by prephenate dehydrogenase. Since the subsequent product
of this reaction is aromatic, this reaction is essentially irreversible. The non-enzymatic
reaction has not been observed, nevertheless, under acidic conditions, prephenate can
rapidly undergo decarboxylation to give phenylpyruvate. The acid-assisted
decarboxylation occurs via a stepwise mechanism; protonation of the hydroxyl group of
the prephenate Jeads to the formation of a resonance stabilized carbonium ion with
subsequent decarboxylation. By contrast in the enzyme-catalyzed reaction,
22
decarboxylation and hydride transfer are concomitant (94). This mechanism was revealed
through isotope effect studies performed by Hermes e1 al. (94). Using the substrate
analogue deoxoprephenate. deuterated at C-4, they observed an isotope effect for the
hydride transfer to NAD~ (94). Furthermore, using the natural abundance of ljC in the
substrate, they observed a carbon isotope effect for the cleavage of the C-C bond between
the cyclohexadiene ring and the ring carboxylate. Interestingly, the carbon isotope effect
obtained with the deuterium versus the hydrogen at position C-4 was smaller than with
the natural ,3C indicating that both the deuterium and the 1jC isotope effects are in the
same transition state; that is. deuterium made the IjC-sensitive step more rate-limiting by
slowing it down (94).
It has been determined by the analysis of initial velocity patterns using steady-
state kinetic techniques that the E. coli PD reaction follows a sequential mechanism(57).
Furthermore, product and dead-end inhibition studies have established that PD conforms
to a rapid-equilibrium, random kinetic mechanism with two dead end complexes,
enzyme-NADH-prephenate and enzyme-NAD-hydroxyphenylpyruvate (63). Isotope
trapping with the enzyme-NAD"1 complex suggested that catalysis is the rate-limiting step
since only a small proportion of the enzyme was trapped as [l4C]NADH (63). Similar
reaction mechanism has been reported for CM-PD from A. aerogenes (95).
The pH dependence of the log VEt of the PD-catalyzed reaction showed that a
single ionizing group (pK 6.5) was titrating in the rate profile and it had to be
deprotonated for maximum activity (64). In contrast, the log(T/K)prephenate pH profile
displayed, in addition to the deprotonated group, a second ionizing group with a pK
value of about 8.4 which must be protonated for maximum activity. This group was not
23
observed in the V profile and since prephenate does not possess a group titrating in this
region, they proposed that this enzyme residue was involved in prephenate binding (64).
Similar results for the ( //Qprephenaie profile were obtained by Hermes el al. (94), who also
identified through temperature and solvent perturbation studies that the deprotonated
catalytic group was likely a histidine.
Studies by Christendat and Turnbull. using the results of sequence alignments,
site-directed mutagenesis and pH-rate profiles, identified the conserved Hisl97 as an
essential catalytic residue. Replacement of the histidine by an asparagine reduced the
dehydrogenase activity 5 orders of magnitude (52). Furthermore, the Hisl97Asn
substitution rendered the log V profile pH-independent suggesting that Hisl97 might be
the residue titrating in the acid limb that is essential for catalysis (52) or that the
substitution had resulted in the change of the rate-determining step of the reaction.
Hisl97 acts as an hydrogen bond acceptor and is believed to polarize the 4-hydroxyl
group of prephenate, lowering the activation barrier to facilitate decarboxylation and
hydride transfer of prephenate to NAD+ (52). The two chemical steps occur
simultaneously, driven by the aromatic nature of the product and also because the ring
carboxylate is likely near and/or in a hydrophobic pocket promoting decarboxylation
(53).
Although attempts to identify the the prephenate binding residue with a pK value
of about 8.4 have failed, Christendat and Turnbull noted Arg294 was critical for
prephenate binding as suggested by the 120-fold increase in Km for prephenate for an
Arg294Qln variant (53). From their inhibition studies, they proposed that Arg294
24
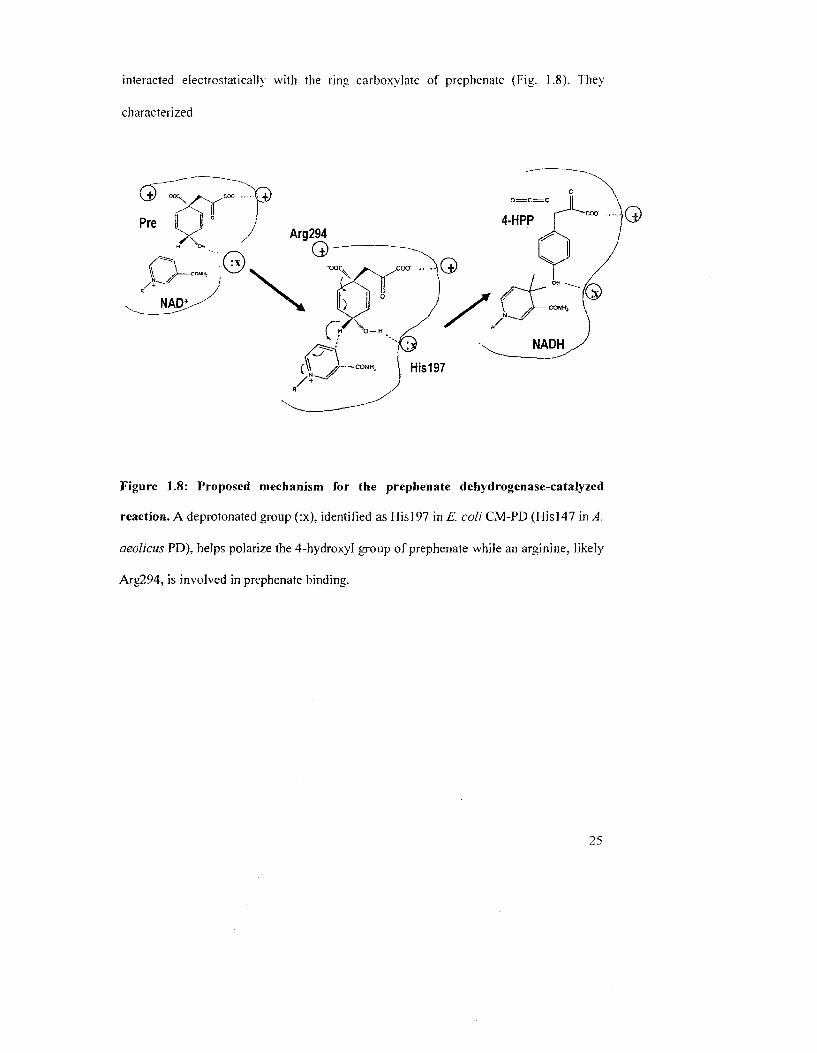
interacted electrostatically with the ring carboxylate of prephenate (Fig. 1.8). They
characterized
Figure 1.8: Proposed mechanism for the prephenate dehydrogenase-catalyzed
reaction. A deprotonated group (:x). identified as Hisl97 in E. coli CM-PD (Hisl47 in A.
aeolicus PD). helps polarize the 4-hydroxyl group of prephenate while an arginine, likely
Arg294. is involved in prephenate binding.
25
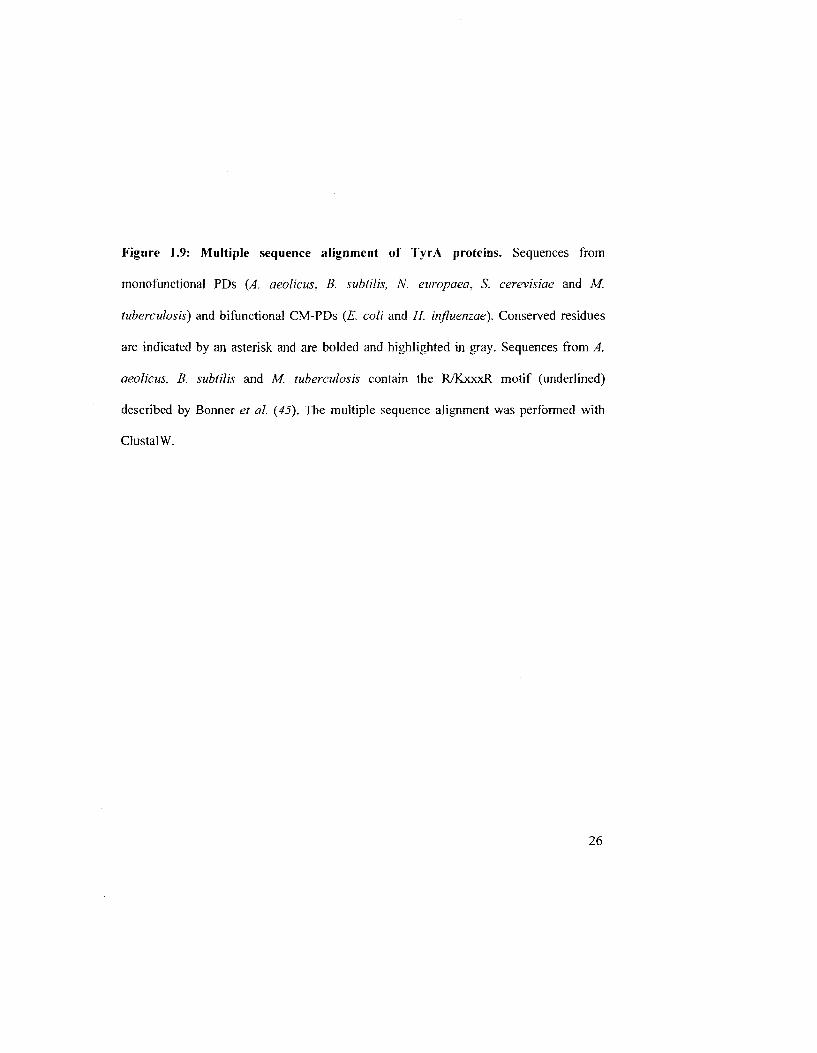
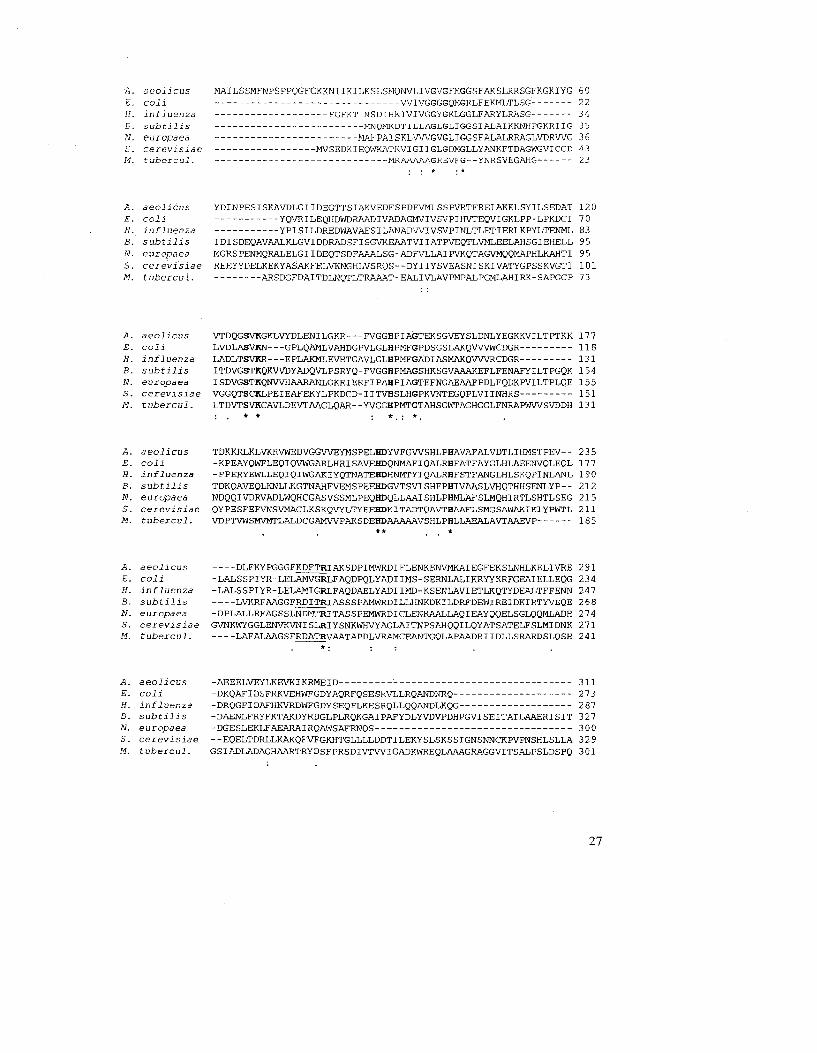
Figure 1.9: Multiple sequence alignment of TyrA proteins. Sequences from
monofunctional PDs (A. aeolicus, B. subtilis, N. enropaea, S. cerevisiae and M.
tuberculosis) and Afunctional CM-PDs (E. coli and H. influenzae). Conserved residues
are indicated by an asterisk and are bolded and highlighted in gray. Sequences from A.
aeolicus, B. subtilis and M. tuberculosis contain the R/KxxxR motif (underlined)
described by Bonner et al. (45). The multiple sequence alignment was performed with
ClustalW.
26
aeolicus MAILSSMFNPSPPOGFCKKNIIKILKSLSMQNVLIVGVGFMGGSFAKSLRRSGFKGKIYG 60 coli WIVGGGGQMGRLFEKMLTLSG 22 influenza FGFKTINSDIHKIVIVGGYGKLGGLFARYLRASG 34 subtil is MNQMKDTILLAGLGLIGGSIALAIKKNHPGKRIIG 35 europaea MAFPAISKLVWGVGL1GGSFALALRRAGLVDRWG 36 cerevisiae MVSEDKIEQWKATKVIGIIGLGDMGLLYANKFTDAGWGVICCD 4 3 tubercul. MRAAAAAGREVFG- -YNRSVEGAHG 23
A. E. H. B. N. S. M.
aeolicus coli influenza subtilis europaea cerevisiae tubercul.
YDINPESISKAVDLGIIDEGTTSIAKVEDFSPDFVMLSSPVRTFREIAKKLSYILSEDAT 120 YQVRILEQHDWDRAADIVADAGMVIVSVPIHVTEQVIGKLPP-LPKDCI 70 YPISILDREDWAVAESILANADWIVSVPINLTLETIERLKPYLTENML 83
IDISDEOAVAALKLGVIDDRADSFISGVKEAATVIIATPVEQTLVMLEELAHSGIEHELL 95 MGRSPENMQRALELGIIDEQTSDFAAALSG-ADFVLLAIPVKQTAGVMQQMAPHLKAHTI 95 REEYYDELKEKYASAKFELVKNGHLVSRQS- -DYIIYSVEASNISKIVATYGPSSKVGTI 101
ARSDGFDAITDLNQTLTRAAAT-EALIVLAVPMPALPGMLAHIRK-SAPGCP 73
A. E. H. B. N. S. M.
aeolicus coli influenza subtilis europaea cerevisiae tubercul.
VTDQGSVKGKLVYDLENILGKR FVGGHPIAGTEKSGVEYSLDNLYEGKKVILTPTKK 177 LVDLASVKN GPLQAMLVAHDGPVLGLHPMFGPDSGSLAKQ\AAWCDGR 118 LADLTSVKR EPLAKMLEVHTGAVLGLHPMFGADIASMAKQVWRCDGR 131 ITDVGSTKQKWDYADQVLPSRYQ-FVGGHPMAGSHKSGVAAAKEFLFENAFY1LTPGQK 154 ISDVGSTKQIWVHAARANLGKRIERFIPAHPIAGTEFNGAEAAFPDLFQDKPVILTPLQE 155 VGGQTSCKLPEIEAFEKYLPKDCD-11TVHSLHGPKVNTEGQPLVIINHRS 151 LTDVTSVKCAVLDEVTAAGLQAR--YVGGHPMTGTAHSGWTAGHGGLFNRAPWVVSVDDH 131
* * * • *
A. E. H. B. N. S. M.
aeolicus coli influenza subtilis europaea cerevisiae tubercul.
TDKKRLKLVKRVWEDVGGWEYMSPELHDYVFGWSHLPHAVAFALVDTL1HMSTPEV- - 235 -KPEAYQWFLEQIQVWGARLHRISAVEHDQNMAFIQALRHFATFAYGLHLAEENVQLEQL 177 -FPERYEWLLEQIQIWGAKIYQTNATEHDHNMTYIQAJLRHFSTFANGLHLSKQPINLANL 190 TDKQAVEQLKNLLKGTNAHFVEMSPEEHDGVTSVISHFPHIVAASLVHQTHHSENLYP- - 212 NDQQ1VDRVADLWQHCGASVSSMLPEQHDQLLAAISHLPHMLAFSLMQHIRTLSHTLSEG 215 QYPESFEFVNSVMACLKSKQVYLTYEEHDKITADTQAVTHAAFLSMGSAWAKIKIYPWTL 211 VDPTVWSMVMTLALDCGAMWPAKSDEHDAAAAAVSHLPHLLAEALAVTAAEVP 185
** *
A. aeolicus DLFKYPGGGFKDFTRIAKSDPIMWRDIFLENKENVMKAIEGFEKSLNHLKELIVRE 291 E. coli -LALSSPIYR-LELAMVGRLFAQDPQLYADIIMS-SERNLALIKRYYKRFGEAIELLEQG 234 H. influenza -LALSSPIYR-LELAMIGRLFAQDAELYADIIMD-KSENLAVIETLKQTYDEALTFFENN 247 B. subtilis LVKRFAAGGFRDITRIASSSPAMWRDILLHNKDKILDRFDEWIREIDKIRTYVEQE 268 W. europaea -DPLALLRFAGSSLNDMTRITASSPEMWRDICLENRAALLAQIEAYQQELSGLQQMLADH 274 S. cerevisiae GVNKWYGGLENVKVNISLR1YSNKWHVYAGLAITNPSAHQQILQYATSATELFSLMIDNK 271 M. tubercul. LAFALAAGSFRDATRVAATAPDLVRAMCEANTGQLAPAADRIIDLLSRARDSLQSH 241
A. aeolicus -AEEELVEYLKEVK1KRMEID 311 E. coli -DKQAFIDSFRKVEHWFGDYAQRFQSESRVLLRQANDNRQ 273 H. influenza -DRQGFIDAFHKVTtDWFGDYSEQFLKESRQLLQQANDLKQG 287 B. subtilis -DAENLFRYFKTAKDYRDGLPLRQKGA1PAFYDLYVDVPDHPGVISEITAILAAERISIT 327 W. europaea -DGESLEKLFAEARAIRQAWSAFRNQS 300 S. cerevisiae --EQELTDRLLKAKQFVFGKHTGLLLLDDTILEKYSLSKSSIGNSNNCKPVPNSHLSLLA 329 M. tubercul. GSIADLADAGHAARTRYDSFPRSDIVTWIGADKWREQLAAAGRAGGVITSALPSLDSPQ 301
27
several substrate analogues, all lacking the ring carboxylate group at C-l relative to
prephenate. and found that the dissociation constant obtained with Arg294Gln for these
substrate analogues were similar to those found with wild-type enzyme. Multiple
sequence alignment with a number of prephenate dehydrogenase shows these residues are
conserved as well as others (Fig. 1.9).
Any structural information for TyrA proteins was unavailable until very recently.
In 2006 Christendat and coworkers (48) solved the first crystal structure of a TyrA
protein, a monofunctional prephenate dehydrogenase from the hyperthermophilic
bacterium Aquifex aeolicus. The structure of this enzyme in complex with NAD+ has
provided valuable insight into the location of the conserved residues in the active site. As
expected. Hisl47, the residue analogous to Hisl97 in the E. coli enzyme, was positioned
adjacent to NAD" and prephenate (the latter substrate modeled in the active site) to
participate in catalysis. Similarly, Arg250, the residue homologous to Arg294 in the E.
coli enzyme, was placed in the highly charged environment within in the active site of the
enzyme, but the electron map density of this side chain was too poorly ordered to
ascertain the residue's exact position. {48).
1.6 AROGENATE DEHYDROGENASES
In most plants, cyanobacteria, algae and several other microorganisms, both Tyr
and Phe are synthesized from a common precursor, L-arogenate, via the arogenate route.
As previously mentioned, in this pathway, prephenate is first converted to L-arogenate by
a prephenate transaminase, then an arogenate dehydratase (ADT) or arogenate
dehydrogenase (AD) converts L-arogenate into Phe or Tyr, respectively. Depending upon
28
the organism. ADs may be specific for NAD . NADP" or use both as co-factors(3<5). For
the past 30 years, a large number of ADs have been studied and most work focused on
substrates and cofactors specificities (32, 33, 40, 49, 96-98). feedback inhibition (97, 98).
evolutionary perspective (47, 99) but only a few mechanistic studies were reported.
Recently. Legrand et al. published the crystal structure of AD from Synechocystis
sp.. complexed with its co-factor NADP" and with the substrate. L-arogenate. modeled in
the active site (43). Examination of the crystal structure revealed that Synechocystis sp..
AD and Aquifex aeolicus PD possess similar quaternary structure; both enzymes are
homodimeric with each monomer housing a nucleotide binding domain and a
dimerization domain (see Fig. 1.10). Furthermore, analysis of the PD and AD active sites
reveals that functionally important residues are conserved. For example, the catalytic
histidine. His 147 in PD. and the important binding group. Arg250 in PD, are equivalently
positioned in both structures. Moreover, the serine residues which are shown in modeled
structures to bind to the C4-hydroxyl group of the cyclohexadienyl substrate are also
spatially conserved. Other common active site residues include Glyl51. Thrl52, His205.
Ser213. and His214 (numbering corresponds to the PD structure). The conservation of
key functionally important residues indicates that L-arogenate may bind to the AD active
site in a similar manner to that of prephenate in PD. In addition, analysis of sequence
alignments of ADs shows that an Asp residue at position 138 (E. coli numbering) is a
reliable indicator for NAD" specificity since NADP" is repelled by the negative charge of
Asp. The Asn at the corresponding position in other ADs likely indicates NADP
specificity as demonstrated by Bonner et al. (36).
29
1.7 REGULATION BV FEEDBACK INHIBITION
TyrA proteins influence the flux of metabolites between Tyr and Phe; hence, the
activities of these enzymes must be very well regulated. End-product inhibition of PD
and AD provides major regulatory control in Tyr biosynthesis but the mechanism
involved is still unclear. Some kinetic studies on E. coli CM-PD suggest that L-Tyr, the
end product of the pathway, and HPP. the direct product of the PD reaction, act as
competitive inhibitors with respect to prephenate {100): other studies suggest the
presence of a distinct allosteric site for L-Tyr to interact (10]). It is clearly documented in
the E. coli enzyme that L-Tyr enhances the cooperativity between subunits in the binding
of prephenate (100). Biophysical investigations have led to the interpretation that this
enzyme interconverts from an active dimer to an inactive tetramer upon the binding of L-
Tyr plus NAD+ (65). Additionally, the effects of L-Tyr are dependent on the enzyme's
interactions with NAD and vice-versa. Recent work by Song et al. (44) P. aeruginosa
have shown that some bacteria possess a C-terminal fusion domain. Aspartate kinase-
Chorismate mutase-TyrA (ACT domain), that is responsible for the binding of the end
product of the pathway. This domain exists in the monofunctional PD from B. subtilis as
well as in the Afunctional CM-PDT from E. coli, but it is not found in E. coli CM-PD
(73), although recent work by Stephanopoulos and Luktke-Eversloh (102) suggests that
two residues located at the C-terminus off. coli CM-PD are involved in Tyr inhibition.
1.8 ALLOSTERIC REGULATION
Allosteric enzymes are widely distributed in living organisms and their
interactions are important in many biological processes. The term allosteiy derived from
30
the Greek albs, '"others", and stereos, "shape" and it is hypothesized that direct control
of protein function through allosteric regulation is usually achieved via conformational
changes of a given protein structure induced by the binding of an effector at another site
than the orthosteric site. The conformational changes are transmitted through the bulk of
the protein to the catalytic site and modulate the rate of the reaction with the substrate: as
a consequence the v vs. S plot is no longer hyperbolic but sigmoidal. For the past fifty
years, allosteric enzymes have captivated many famous researchers and have been
extensively studied. ]n 1965, Monod and coworkers reviewed a dozen of allosteric
enzymes and suggested that allostery control in proteins displays cooperative functional
behavior along with feedback inhibition (103). Most of allosteric enzymes are oligomeric
and are often found at key branch point in metabolism pathways. The Monod. Wyman
and Changeux concerted model (103) (MWC model) was applied to understand kinetic
results obtained with hemoglobin, aspartate transcarbamylase (ATCase), threonine
desaminase and many other well known enzymes. In this model, binding of the effector
brings about the change in all protein subunits. By contrast, Koshland, Nemethy and
Filmer (104) invoked a sequential (KNF model) rather than a concerted model, whereby a
conformational change in one subunit does not necessarily induce a change in other
subunits. Each subunit is allowed to change its tertiary structure on substrate binding
permitting alteration of the chemical activities of its neighbors. In both theories, the
enzyme subunits exist in a tense or relaxed conformation.
In the past, drug discovery scientists have focused on identifying compounds that
interact directly with the orthosteric site to activate or block the enzyme of interest. This
simplistic approach was significantly helped by computer assisted drug-design and has
31
resulted in excellent drugs, however those active site-directed compounds may not offer
the selectivity required and could lead to undesirable side effects. Currently,
pharmaceutical companies are focussing on allosteric sites since they offer the
opportunities for discovering new drugs for enzymes for which designing an active site
directed drug has been challenging. Furthermore, allosteric modulators are thought to be
less harmful! since they are less likely to produce dangerous side effects.
As previously mentioned, kinetic studies on E. coli CM-PD suggest that the
enzyme is allosterically inhibited by Tyr. although the exact mechanism of inhibition
remains unclear (101). Hence, understanding the effects of Tyr on TyrA enzymes would
help delineate the mode by which allosteric regulation is achieved and add to the body of
knowledge which is being gathered on these fascinating enzymes.
1.9 THE MODEL CHOSEN: AQUJFEXAEOLICUS PD
Aquifex aeolicus was isolated from the thermal vents in Yellowstone National
Park and the entire genome was sequenced by Deckert et al. (105). This organism
belongs to the Aquificaceae which represent the most deeply branching family within the
Bacterial domain and is one of the earliest diverging bacteria known. A. aeolicus is a
microaerophilic, hydrogen-oxidizing, obligate chernolitbautotroph (obtains its energy
from inorganic compounds) organism. Organic substrates such as sugar, amino acids or
meat extract cannot be used by A. aeolicus for its growth. As previously pointed out by
Aponte (106). no gene for a monofunctional CM was identified, but a putative tyrA
encoding a 311 residue PD was recognized. Additionally, the genome revealed the
existence ofzpheA gene encoding for a CM-PDT. Interestingly, tyrA from A. aeolicus is
32
found as an orphan gene since, contrary to the E. coli tyrA gene, it is not part of an
operon. Sequence alignment of A. aeolicus PD and the PD domain of the Afunctional E.
coli CM-PD revealed only about 18% sequence homology. Nevertheless, all residues
which have been identified to be important for binding and/or catalysis in E. coli CM-PD
are conserved in A. aeolicus PD (Fig. 1.9).
To date, all the efforts to obtain a three-dimensional structure of E. coli CM-PD
have failed. Additionally, there had been no reported structure of any TyrA protein
although, a host of monofunctional CMs have been successfully crystallized and their
structures have been solved. The peculiar intrinsic physical properties of thermophilic
enzymes (highly charged surface {107-109)) and increased packing density (109, 110) are
known to render them better candidates for crystallization studies. Hence, our lab and our
collaborators from U. of Toronto selected the monofunctional PD from the
hyperthermophilic bacterium A. aeolicus to perform our biochemical, biophysical and
crystallographic studies. An N-terminally deleted A19PD liganded with its cosubstrate
NAD , yielded diffraction quality crystal and the three-dimensional structure was solved
to a resolution of 1.9 A (48). As depicted in Figure 3.10, the enzyme is homodimeric.
Each monomer consists of a N-terminal domain, containing a Rossman fold and a C-
terminal domain believed to participate in the dimerization (48) (Fig. 1.11). The X-ray
structure revealed that the active site is at the located at the inter domain cleft of the two
domains and that residues from both subunits contribute to a complete active site.
J J
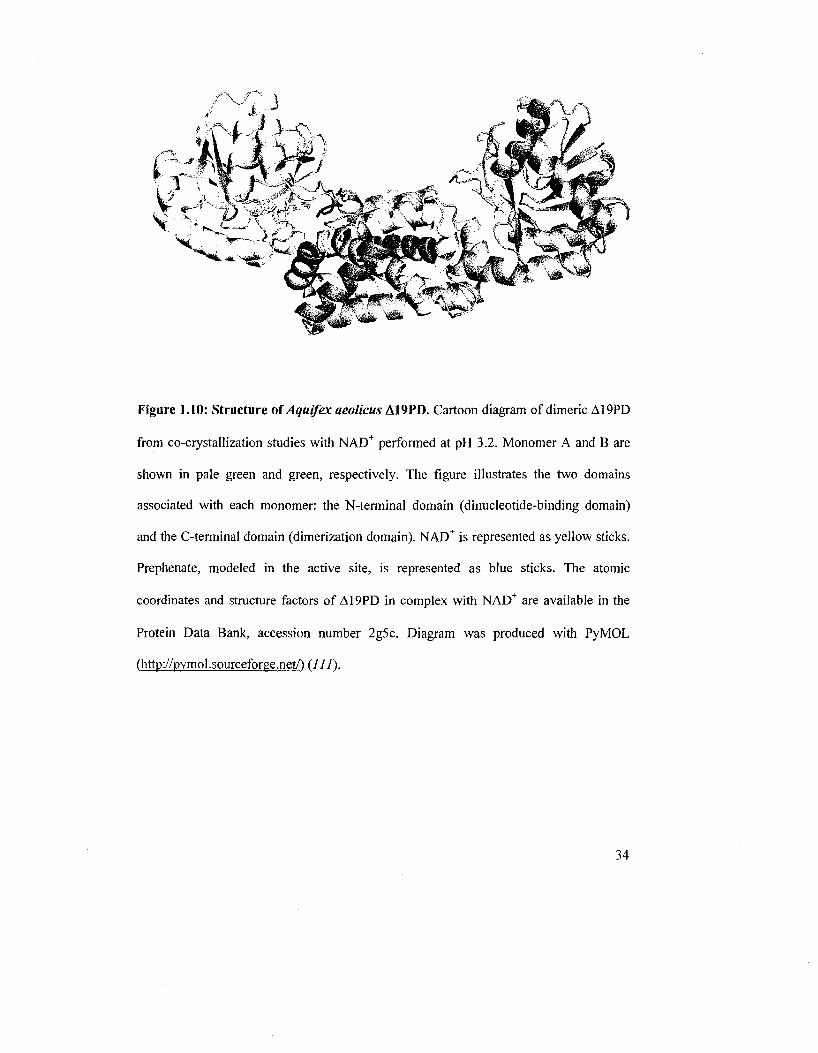
Figure 1.10: Structure of Aquifex aeolicus A19PD. Cartoon diagram of dimeric A19PD
from co-crystallization studies with NAD+ performed at pH 3.2. Monomer A and B are
shown in pale green and green, respectively. The figure illustrates the two domains
associated with each monomer: the N-terminal domain (dinucleotide-binding domain)
and the C-terminal domain (dimerization domain). NAD+ is represented as yellow sticks.
Prephenate, modeled in the active site, is represented as blue sticks. The atomic
coordinates and structure factors of A19PD in complex with NAD+ are available in the
Protein Data Bank, accession number 2g5c. Diagram was produced with PyMOL
(http://pymol .sourceforge.net/) {111).
34
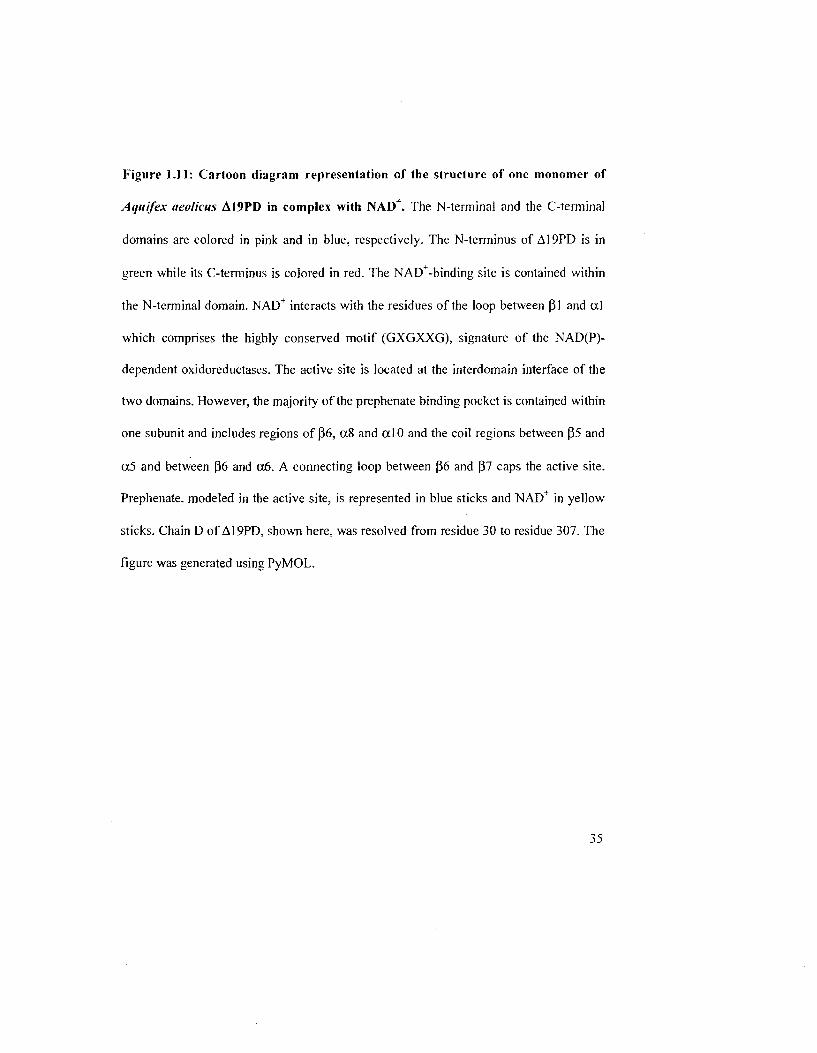
Figure 1.11: Cartoon diagram representation of the structure of one monomer of
Aquifex aeolicus A19PD in complex with NAD+. The N-terminal and the C-terminal
domains are colored in pink and in blue, respectively. The N-terminus of A19PD is in
green while its C-terminus is colored in red. The NAD+-binding site is contained within
the N-terminal domain. NAD interacts with the residues of the loop between pi and al
which comprises the highly conserved motif (GXGXXG), signature of the NAD(P)-
dependent oxidoreductases. The active site is located at the interdomain interface of the
two domains. However, the majority of the prephenate binding pocket is contained within
one subunit and includes regions of 06, a8 and a l 0 and the coil regions between 05 and
oc5 and between p6 and oc6. A connecting loop between P6 and P7 caps the active site.
Prephenate, modeled in the active site, is represented in blue sticks and NAD+ in yellow
sticks. Chain D of A19PD, shown here, was resolved from residue 30 to residue 307. The
figure was generated using PyMOL.
35
36
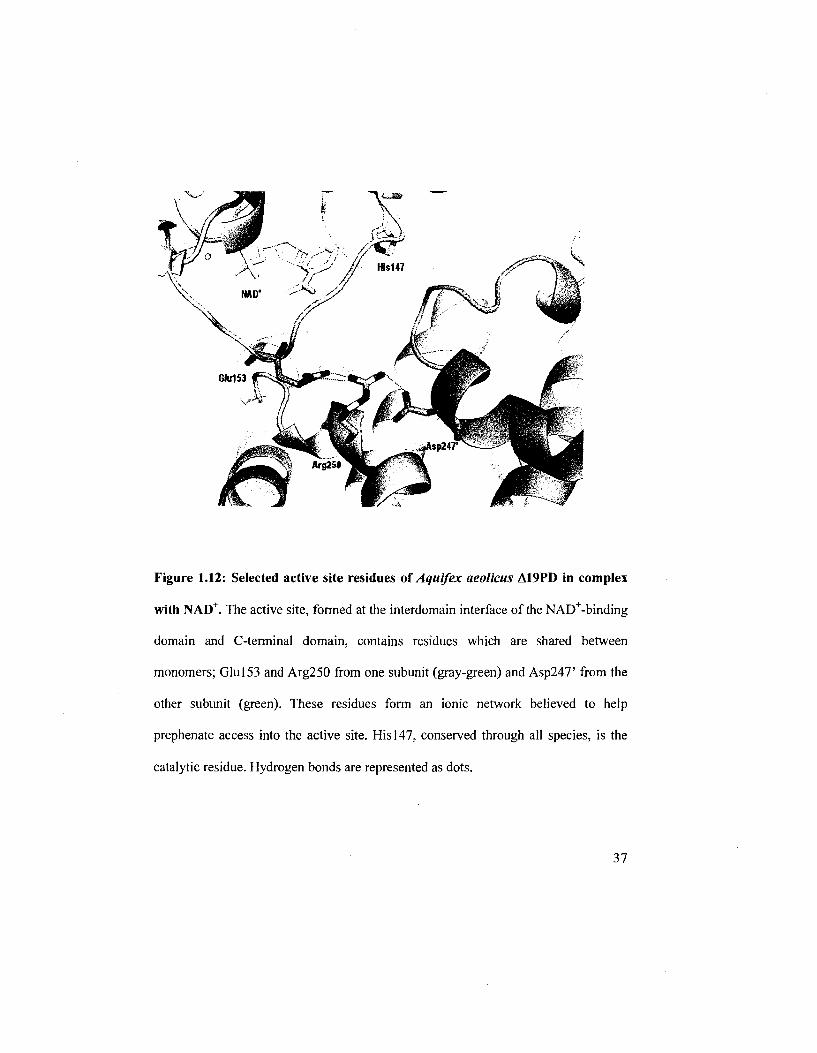
Figure 1.12: Selected active site residues of Aquifex aeolicus A19PD in complex
with NAD+. The active site, formed at the interdomain interface of the NAD+-binding
domain and C-terminal domain, contains residues which are shared between
monomers; Glul53 and Arg250 from one subunit (gray-green) and Asp247' from the
other subunit (green). These residues form an ionic network believed to help
prephenate access into the active site. His 147, conserved through all species, is the
catalytic residue. Hydrogen bonds are represented as dots.
37
1.10 SCOPE AND ORGANIZATION OF THESIS
In chapter two, full-length PD and an N-terminally truncated protein variant
(A19PD) expressed recombinantly in E. coli, were purified to homogeneity with Ni-NTA
affinity chromatography. Circular dichroism and fluorescence spectroscopies were
employed to assess the stability of A19PD to Gdn-HCl denaturation. and together with
size exclusion chromatography, allowed elucidation of the pathway of unfolding in the
presence of the denaturant. Additionally, the quenching of intrinsic fluorescence emission
was used to gain structural insight into the environment of two Trp residues in the
protein. Concomitant with these biophysical studies, A19PD in complex with NAD+
yielded crystals that diffracted to a high resolution and our results are correlated with this
structure. This chapter also demonstrated the benefits of mass spectrometry in identifying
proteolytic fragments of PD which facilitated the construction of the crystallizable form
of the enzyme. A19PD.
In chapter three, the temperature dependence of the reactions catalyzed by PD and
A19PD were assessed as well as their ability to utilize L-arogenate as a substrate.
Additionally, the importance of putative active site residues involved in the catalytic
mechanism of A19PD was assigned from the results of the kinetic analysis of site-
directed variants. Our findings are correlated with the most recent structure of A19PD in
complex with NAD+ plus HPP (manuscript submitted).
In chapter four, the inhibition of wild-type and variant forms of A19PD by L-Tyr
was examined. This is achieved using kinetic analysis, thermodynamic radiolabeled Tyr
binding experiments and fluorescence spectroscopy using anilino-naphtalene sulfonic
38
acid (ANS) as a probe of conformational changes induced by ligand binding. Our
findings for the recombinant PDs from A. aeolicus are compared with results obtained
with the bifunctional CM-PD from E. coll. We identified a residue which is critical for
feedback inhibition by L-Tyr for both TyrA proteins. Additionally, our results are
interpreted in light of the crystal structure of A. aeolicus A19PD in complex with NAD"
plus L-Tyr as well as a structure of E. coli PD modeled from a structural template of H.
influenza PD.
39
Chapter 2
Purification and Biophysical Properties of Full-Length PD and
the Crystallizable Variant A19PD
40
2.0 INTRODUCTION
In previous studies. PD from Aquifex aeolicus was expressed in Escherichia coli
with a removable N-terminal hexa-His tag by cloning of the tyrA gene into a pET-15b
expression vector. The fusion protein was then purified by nickel affinity
chromatography. Results of the overexpression, purification and the preliminary
biophysical and kinetic characterization of PD have been reported by Aponte (J06). Both
Aponte and our collaborator D. Christendat noted unexpectantly that the His-tagged
monomer purified as full-length and shortened forms. Aponte proposed that the truncated
form of the enzyme resulted from an in-vivo N-terminal proteolytic cleavage as judged by
SDS-PAGE analysis of fractions eluting from the Ni-NTA affinity column, although the
exact site of cleavage was never firmly established. The biochemical or structural
relevance of the proteolysis was not clear at this time. The behavior of the full-length PD
on Ni-affinity and size exclusion resins indicated that the recombinant protein could form
dimers in solution. Aponte also established that PD was resistant to chemical
denaturation, however, the strength of the dimer interaction or the pathway of unfolding
was never investigated fully.
In this chapter we report the development of a reliable protocol for ESI-MS
analysis of PD and its degradation products which allowed the exact identification of the
proteolytic cleavage site at the protein's N-terminal region. The overexpression and
purification of A19PD, an N-terminal deletion construct, are described and its biophysical
properties are compared with those of wild-type PD. We show that A19PD is very
resistant to thermal and chemical denaturation and have established the pathway of
unfolding of A19PD as directed by the chemical denaturant guanidine hydrochloride
41
(Gdn-HCl). Lastly. A19PD yields diffraction quality crystals. Thus, in this chapter our
biophysical findings are correlated with those of the recently solved crystal structure of
the enzyme(48). Material in this chapter has been published in Protein Science {112).
2.1 EXPERIMENTAL PROCEDURES
2.1.1 Materials
Prephenate (sodium salt) was obtained as previously described by Dudzinski and
Morrison (113) while chorismate (free acid) was isolated from Klebsiella pneumonia
(114). Thrombin and NAD+ were obtained from Roche. High purity of the substrates was
confirmed by either mass spectrometry or NMR. Concentrations of stock substrate
solutions were determined using published extinction coefficients (115) and/or enzymatic
end-point analysis. N-Acetyl-L-tryptophanamide (NATA), N-acetyl-L-tyrosinamide
(NAYA) and 1 -anilino-8-naphthalene sulfonic acid (ANS) were purchased from Sigma,
and concentrations of stock solutions were determined spectrophotometrically (116). All
acids and organic solvents for mass spectrometry were HPLC grade. Trifluoroacetic acid
(TFA) and a-cyano-4-hydroxycinnamic acid (HCCA) were obtained from Sigma. CJ8
ZipTip cartridges were from Millipore Corp. Trypsin powder, for in-solution tryptic
digestion, was sequencing grade modified and was purchased from Roche. Ni-NTA or
Superflow™ chromatography resin was supplied by Qiagen; a binding capacity of 7.5 mg
of hexa-His protein/mL of resin was assumed. Dialysis membrane (12-14 K cutoff) was
from Spectrapor and ultrafiltration units (30 K or 10 K cutoff) were obtained from
Amicon and were washed according to manufacturers instructions. All other chemical
reagents were obtained commercially and were of the highest quality available.
42
E. coli strains DH5a (Life Technologies Inc.) [supE44 AlacU169 (4>80 lacZ
AM 15) hsdR17 recAl endAl gyrA96 thi-1 relAl] and BL21(DE3) Gold (Stratagene) [F
dcirf Hte ompT hsdS(re' ITIB") gal X (DE3) endA Tetr] were used for plasmid production
and for protein expression, respectively. The expression plasmid (A19PD) encoding
residues 20-311 of the A. aeolicus VF5 PDH protein (girl 52 82445) and a hexa-histidine
tag at the N-terminus were prepared as described elsewhere (117). Dr. A. Edwards at the
Ontario Cancer Institute, University of Toronto, kindly donated the helper plasmid
pMagik encoding three rare tRNAs (AGG and AGA for Arg, ATA for He). Recombinant
E. coli CM-PD was expressed and purified as described elsewhere (53) and was
generously provided by J. Manioudakis.
2.1.2 Production and Purification of Recombinant PD and A19PD of A. aeolicus
Recombinant A. aeolicus PD and A19PD were overexpressed in E. coli
BL21(DE3) Gold cells and purified according to the protocol of Aponte (106) but with
minor modifications. Briefly, E. coli BL21(DE3) Gold cells harbouring pMagik and the
expression plasmid (pRA-PD-3 or pA19PD) were grown in 50 mL of LB medium
supplemented with 100 ug/mL ampicillin and 50 ug/mL kanamycin at 30°C for 15 h with
shaking, and diluted into 1.5 L of the same medium. After growth to an OD&oo of 0.6. 0.4
mM 1-thio-f3-D-ga]actopyranoside was added. The cells were incubated further with
shaking for an additional 5 h at room temperature and then overnight at 18°C. Cells were
harvested by centrifugation and resuspended in 15 mL/L culture of ice-cold buffer A (50
mM Tris(hydroxymethyl)aminomethane hydrochloride (Tris-HCl), 0.5 M NaCl, 5%
glycerol (v/v) at pH 7.5) supplemented with 5 mM imidazole. Complete™ (Roche
43
protease inhibitor cocktail, one tablet per 50 mL suspension). 1 mM benzamidine. and 0.5
mM phenylmethyl sulfony] fluoride (PMSF). The cells were disrupted by two passages
through a Thermo Specrronic French Press at 18,000 psi (instead of one cited by Aponte
(106)). with additional benzamidine added after the first passage. Insoluble material was
removed by centrifugation at ]00,000g for 40 min at 4°C. The cell-free extract was
incubated in an 85°C water bath for 10 min and centrifuged again, and the supernatant
was directly applied to a 15 mL Superflow™ Ni-NTA column (Qiagen) at a flow rate of
1 mL/min equilibrated with buffer A containing 5 mM imidazole. Nickel resin was
washed extensively with 400 mL of buffer A containing 30 mM imidazole (three times
the volume used by Aponte (106)) and bound protein was eluted with buffer A containing
300 mM imidazole. Fractions were supplemented with 1 mM EDTA and 0.5 mM
dithiothreitol (DTT). Those containing PD activity were pooled, and thrombin was added
at a final proteinrthrombin ratio of 1000:1 (w/w). To increase efficiency of thrombin, the
sample was first dialyzed (Spectrapore, 12 K cutoff) for 2 h at room temperature, then
overnight at 4°C against buffer A with 0.5 mM Tris(2-carboxyethyl) phosphine
hydrochloride (TCEP-HC1). The sample was reapplied onto the Ni-NTA column. In the
initial experiment, unbound PD was then rechromatographed on a 1 mL Hi-Trap
benzamidine FF column (Amersham Bioscience) to remove any trace amounts of
thrombin. However, this addition step afforded no advantage and was later omitted. PD
was concentrated to 2-10 mg/mL (Amicon Ultra-15), and stored at -86°C in buffer A
containing 5 mM DTT (storage buffer) and 1 mM benzamidine. A19PD was purified as
described for PD, except thiol reducing agents were omitted in the purification procedure.
PD and A19PD were detected in fractions by enzymatic assay and SDS-15% PAGE with
44
Coomassie Blue staining. Both forms of the enzyme were further purified by size
exclusion chromatography (section 2.1.5.3) prior to spectroscopic studies.
2.1.3 SDS-Polyacrylamide Gel Electrophoresis
Denaturing SDS-PAGE was performed with either a 12% or 15% polyacrylamide
gel following the method of Laemmli {118). Protein samples were diluted 1:2 (v/v) into 2
times SDS sample loading buffer (1.5 M Tris-HCL 4% SDS, 20% glycerol (v/v), 0.002%
Bromophenol Blue, pH 6.8) and incubated in a boiling water bath to 3 min then kept on
ice 2 min prior to loading on a gel. The gel was electrophoresed at 80 V as samples
migrated through the stacking gel. and then the voltage was increased to 180 to 200 V as
the samples migrated to the resolving gel. Electrophoresis continued until the
Bromophenol Blue tracking dye migrated off the resolving gel. Bio-Rad broad range
molecular weight proteins standards were used to estimate the molecular weight of
proteins in the samples. Protein was visualized by staining the gel with Coomassie
Brilliant Blue R-250.
2.1.4 Determination of Enzyme Activity and Protein Concentration
The oxidative decarboxylation of prephenate in the presence of NAD was
followed at 340 nm as described by Turnbull e1 al. {119). The reactions (total volume 1
mL) were monitored continuously by using a Varian Cary 50 spectrophotometer
equipped with a thermostated cuvette holder.
Standard activity assay for^l aeolicus PD and A19PD was measured at 55°C in a
reaction buffer of 50 mM HEPES, 150 mM NaCl, (pH 7.5), at saturating concentrations
45
of NAD" (2 mM) and prephenate (1 mM). Buffer was incubated at 55°C (2 min).
followed by the addition of an appropriate amount of enzyme (2 min) and NAD (30 s).
and then the reaction was initiated with prephenate. At each step, components were
mixed by inversion of the cuvette. All substrates were at room temperature prior to their
addition. E. coli CM-PD activity was assayed as described previously (119).
Reaction rates were calculated from the linear portion of the progress curve using
the software supplied by the spectrophotometer. Values of steady-state kinetic parameters
kcax and Km were obtained by fitting initial velocity data to the appropriate rate equations
using nonlinear least-squares analysis provided by Grafit Software version 5.0 (Erathicus
Software) or the programs of Cleland (120) (see also Chapter 3). Substrate saturation
curves were fitted using the Michaelis-Menten equation. Specific activity was calculated
from the amount of enzyme required for the conversion of 1 u.mol of product per minute
permg of protein at the desired temperature.
Protein concentration was estimated using the Bio-Rad Protein Assay Kit (Bio-
Rad Laboratories) with bovine serum albumin (Sigma) as a standard.
2.1.5 Molecular Weight Determination
2.1.5.1 Mass Spectrometry
2.1.5.1.1 Determination of Subunit Molecular Weights
Subunit molecular weight of PD and A19PD was determined by electrospray
ionizing mass spectrometry (ESI-MS). Sample preparation was adapted by J.
Manioudakis from a protocol for the analysis of membrane-associated proteins (121). An
aliquot of 100 uL of enzyme (50 to 100 (Ig) in storage buffer was resuspended with 300
46
(iL of methanol and 100 (JL of chloroform. The sample was gently vortexed. then 200 (iL
of MilliQ water was added and the solution was vortexed again. The sample was
centrifuged for 2 min at 14.000g, the top layer (methanol/water) was discarded and the
protein precipitate (above chloroform layer) was washed twice with at least 300 jiL of
methanol, centrifuging each time after washing and decanting the aqueous layer. The
resulting precipitate was solubilized by vortexing in 0.5-1 mL of a solution of 30%
methanol and 0.2% formic acid (FA) (v/v). The solution was centrifuged immediately
prior to injection. Analysis was carried out on a Waters Micromass Q-ToF-2 mass
spectrometer operating in positive-ion mode following direct infusion of samples into the
Z-spray ion source. Instrument parameters were as follows: source block temperature.
80°C; capillary voltage, 3.6 kV; cone voltage, 45 V; ToF 9.1 kV; MC, 2.1 kV. Data
analysis and deconvolution were performed using MassLynx 4.0 software (Waters
Micromass). Calibration of the instrument was checked with [Glu]-fibrinopeptide B (MW
1570.5) (Sigma). Mass shifts of ± 2 mass units for PD are within the expected
experimental error.
2.1.5.1.2 Matrix-Assisted Laser Desorption/lonization Mass Spectrometry Analysis
of Tryptic Generated Peptides from A. aeolicus PD
In-solution tryptic digestion: An aliquot of thrombin-treated PD (5 mg/mL in
storage buffer) was buffer exchanged with a NAP-5 column in 50 mM ammonium
bicarbonate at pH 7.4 and concentrated to 5 mg/mL using a Millipore ultracentrifugation
filter device (30 K cutoff). Trypsin was added to the sample to a final protease to protein
ratio of 1:20 (w/w). Samples were incubated 16 h at 37°C and the reaction was stopped
47
by addition of 50 |iL of 1 M HCI. Desalting of the samples was performed using reverse
phase C]g Millipore ZipTip® tips (ZipTipcis)- ZipTipcis was pre-equilibrated with 60%
acetonitrile (ACN) and 0.1% trifluoroacetic acid (TFA) (v/v) and washed three times
with 5% ACN/0.1% TFA (v/v). The diluted sample was drawn into the tip to allow
peptide binding, and the resin was washed five times (-50 uJL total volume) with 5%
ACN/0.1% TFA. The peptides were eluted from the ZipTipcis ' n a wash of 1.5 uL of
60% ACN/0.1% TFA. A saturated matrix solution was prepared in 40% ACN/0.1% TFA.
One p.L of the desalted protein solution was mixed with 1 (J.L of HCCA matrix and then 1
flL of the mixture was deposited on the sample probe. Samples were dried at room
temperature prior to MS analysis.
In-gel tryptic digestion: Purified PD (before thrombin treatment) was dialyzed
overnight (10 K cutoff) at 4°C against storage buffer with trypsin (20:1. w/w). An aliquot
(~15 \lg) of the protein sample resulting from the overnight digestion was resolved by
SDS-PAGE and visualized by Coomassie Blue staining. The band containing the protein
of interest was excised from the gel and destained completely with 50% ACN in 25 mM
NH4HCO3. The excised gel pieces were cut into smaller particles (<1 mm"), placed in
eppendorf tubes, washed with several aliquots of 100 uL of ACN and dried completely in
a SpeedVac at room temperature. Gel particles were rehydrated with 25 uL of 0.5 ng/uL
trypsin in a solution of 25 mM NH4HCO3. The gel pieces were covered by 30 uL of 25
mM NH4HCO3 to keep them immersed throughout the digestion. Protein was digested for
16 h at 37°C then the reactions were stopped by adding 5 uL of 5% TFA. Tubes were
shaken gently for 10 min, centrifuged to remove debris and the liquid was collected. The
48
supernatants were diluted, desalted and concentrated using Cig ZipTips (see below) and
subjected to MALD1-MS analysis as described in the previous paragraph.
Sample analysis: Analysis was carried out on a MALDl-ToF mass spectrometer
(Micromass Manchester. England) with a flight tube length of 1.0 m (linear mode)
equipped with a N2 UV laser (337 nm wavelength) and was set to deliver pulses at a rate
of 5 Hz, with 25 shots per scan for linear mode. Peptides were analyzed in positive ion
mode with a pulse voltage varying from 1800 to 2000 V. Theoretical maximum
resolution in reflectron and linear modes is 10 000 and 100, respectively. Each spectrum
represents the average of a minimum of 10 scans. MALDI-ToF-MS spectra were
analyzed using the MassLynx 4.0 software (Waters Micromass). Calibration of the
instrument was checked using a peptide mix containing angiotensin 1 (MW 1296.5),
renin (MW 1759.0) and adrenocorticotropic hormone (MW 2465.7).
2.1.5.2 Analytical Ultracentrifugation
Native molecular weight and shape of PD and A19PD were determined by
sedimentation velocity experiments performed at 30°C in a Beckman XL-1 analytical
ultracentrifuge and an An60Ti rotor using absorbance detection. Purified thrombin-
cleaved enzymes were exchanged into a buffer containing 50 mM potassium phosphate
buffer, 0.3 M NaCl and 0.5 mM TCEP (pH 7.5) using a NAP-5 size exclusion column
(Amersham), diluted in the same buffer to give a final OD280 of 0.65 (PD) and 0.97
(A19PD), and loaded into 1.2 cm path-length double sector charcoal-filled epon
centerpieces. Samples were spun at 35,000 rpm and 30°C for 10 h. Absorbance (280 nm)
was collected in continuous mode with a step size of 0.005 cm and five replicate readings
49

at each point. Values for the sedimentation coefficient (s) and an average molar mass
were calculated from the velocity and shape of the sedimenting boundary by fitting the
time-dependent concentration profiles calculated with the Lamm equation {122) to the
measured data. Calculations were performed on 200 scans for each protein using the
program Sedfit (Sedfit). The program Sednterp {123) was used to calculate buffer density
and the protein partial specific volume (1.0153 and 0.74. respectively, at 20°C, neglecting
contributions due to TCEP) and to normalize the obtained sedimentation coefficient
values in water at 20°C, S2o.w
2.1.5.3 Analytical Size Exclusion Chromatography
The native molecular weight of A. aeolicus PD and A19PD was determined at
ambient temperature by a Pharmacia Akta FPLC system fitted with a Superdex G-200
column (HR 10/30. Pharmacia). Chromatography was performed with mobile phases
containing 50 mM potassium phosphate, 150 mM NaCl (pH 7.5) at a flow rate of 0.75
mL/min and injection volume of 500 p.L. Elution was monitored at 256, 280 and 290 nm,
and fractions (1 mL each) were assayed for enzyme activity. Bio-Rad gel filtration
protein standards included vitamin B12 (1.35 kDa), equine myoglobin (17 kDa), chicken
ovalbumin (44 kDa), bovine y-globulin (158 kDa) and thyroglobulin (670 kDa). Void
volume and total bed volume were evaluated with Blue Dextran and DTT, respectively.
When further purification was required prior to spectroscopic analysis, A19PD and PD
were subject to gel filtration chromatography as described above. When chromatography
was conducted in the presence of Gdn-HCl-containing buffers, PD or protein standards
(0.1 mg/mL) were incubated for 20 h at ambient temperature in a buffer of 50 mM
50
potassium phosphate. 150 mM NaCl and various Gdn-HCl concentrations (pH 7.5). and
then isocratically separated in the same buffer at a flow rate of 0.4 mL/min.
2.1.6 Denaturation Studies
2.1.6.1 Circular Dichroism
Far-UV CD spectra of PD. A19PD and CM-PD (21 \iM and 18 |iM monomer,
respectively) were recorded on a Jasco-710 spectropolarimeter in either a 0.05-cm or 0.1-
cm path-length circular cell connected to a thermostated circulating water bath. Protein
was exchanged into 50 mM potassium phosphate, 75 mM NaCl (pH 7.5) (PPS buffer),
using a NAP-5 column and then diluted to the appropriate concentration in the same
buffer. For studies with CM-PD, 25% glycerol (v/v) was added to the buffer. Spectra
were recorded at 25°C by averaging 10 wavelength scans from 260 to 200 run (1 nm
bandwidth) in 0.2-nm steps at a rate of 50 nm/min, and 0.25 s response. The ellipticity at
222 nm (1 nm bandwidth) was measured from 25 to 95°C by using the instrument
software controlled temperature ramping program and the following parameters: AT of
20°C/h, 0.2°C step resolution, and 1 s response.
Equilibrium denaturation of A19PD induced by Gdn-HCl was followed by
measuring the ellipticity of the sample at 222 nm in a 0.1-cm path-length cell at 30°C.
Samples at each Gdn-HCl concentration were obtained by mixing PPS and 8 M Gdn-HCl
in PPS (pH 7.5) in the appropriate ratio and adding enzyme to 2.8 |XM. Samples (1 mL)
were equilibrated at ambient temperature for 20 h in capped Eppendorf tubes, and then
ellipticities were measured from 210 to 230 nm using the instrument parameters listed
above. The values at 222 nm (average of five readings) were corrected for background
51
signal from the buffer. The accurate concentration of 8 M Gdn-HCl in PPS was
calculated from its refractive index {124).
2.1.6.2 Steady-State Fluorescence
Gdn-HCl-induced unfolding of A19PD was followed by fluorescence at 30°C
using an Aminco Bowman Series 2 Luminescence Spectrometer equipped with a
temperature-controlled cell holder. Excitation wavelengths were set to 280 nm or 295 nm,
and emission scans were recorded from 300 to 400 nm. Excitation and emission slits
were set to 4 run. Measurements were performed in PPS buffer (reaction volume 2 mL)
using a 1 cm x 1 cm cuvette. Incubation of A19PD (3 |iM monomer) in Gdn-HCl-
containing PPS were performed as outlined for CD experiments. Fluorescence intensities
were compared with that of a solution containing NATA (6 |iM) and NAYA (30 fiM)
having the same concentration of Trp and Tyr as the protein solution. Emission spectra
were corrected for buffer blank and for the inner filter effect {125) using the equation 2.1:
Fcorr=Fobs x anti]og[(Aex+Aem)/2] (2.1)
Fobs and FcorT represent observed fluorescence intensities and those corrected for the inner
filter effect respectively. Absorbance readings (A), (cell plus sample blanked on air),
were determined both at excitation (ex) and emission (em) wavelengths.
To determine if denaturation was reversible, 30 jiM A19PD in 0 M, 3 M and 5 M
Gdn-HCl were incubated for 20 h at room temperature. An aliquot of the denatured
sample was then diluted 10-fold then incubated at room temperature for 2 h. Fluorescence
52
spectra and enzyme activities were recorded for each sample and compared to a protein
incubated for the same time in the absence of denaturant. Measurements at 20. 24 and 36
h gave the same values.
2.1.6.3 ANS Fluorescence Experiments
A19PD (3 jiM monomer) prepared in different concentrations of PPS-buffered
Gdn-HCl (as described above) were incubated with 30 uM 1-anilino-8-naphthalene
sulfonic acid (ANS) in the dark at 30°C. The total reaction volume was 2 mL.
Fluorescence emission spectra were recorded from 400 to 600 nm with excitation at 370
nm and using bandwidths of 4 nm using an Aminco Bowman Series 2 Luminescence
Spectrometer equipped with a temperature-controlled cell holder. The net fluorescence
enhancement due to ANS binding to the protein was obtained by subtracting appropriate
blank spectra of ANS in the corresponding denaturation buffer and corrected for inner
filter effects as described above. ANS did not alter enzyme activity.
2.1.7 Determination of Dissociation Constants for Substrates
Values for the dissociation of NAD" or prephenate from the complex with Al 9PD
were determined at 30°C by monitoring the quenching of protein intrinsic fluorescence.
Excitation and emission wavelengths were set at 295 nm and 333 nm respectively, with
bandwidths of 4 nm. Enzyme. NAD", and prephenate were prepared in PPS buffer.
Titrations were performed by the progressive addition of NAD+ (0.2-20 jiM) or
prephenate (2-480 u,M) to PPS (2 mL) containing 0.24 n.M or 1.6 |iM monomer. Samples
were mixed by gentle inversion and the reaction was allowed to equilibrate for 2 min
53
prior to recording measurements. The fluorescence data were corrected for inner filter
effects, as well as for dilution and background fluorescence. A dissociation constant was
determined by fitting the data to the Michaelis-Menten equation or the quadratic equation
(]26) (Equation 2.2) using Grafit 5.0:
AF=AF,T)(([I1]+[£i]+^dH([i]t+[£I]+^d)2-4[I,][£.])05)/(2[i?,]) (2.2)
AFis the difference in fluorescence intensities in presence and absence of the titrant, AFm
is the maximum change in fluorescence intensity, [I,] is the total concentration of titrant,
[£,] is the total enzyme concentration and K$ is the dissociation constant.
2.1.8 Fluorescence Quenching
The titration of A19PD with acrylamide and KI were performed at 30°C in PPS
buffer. Excitation and emission wavelengths were set at 295 run and 340. respectively,
with bandwidths of 4 nm each. Sodium thiosulfate (100 u,M) was added to solutions of
Kl to prevent I3" formation, which interferes with Trp fluorescence. Defined amounts of
quencher (2-5 U.L) were added from a stock of 5.0 M to a 2 mL (3 (iM monomer) protein
solution. Acrylamide and Kl did not significantly inhibit enzyme activity (<5% loss of
activity) at the amounts used in the quenching experiments. To determine if substrates
protected against quenching, 3 |iM monomer was incubated either with NAD+ or
prephenate (also in PPS) prior to the addition of acrylamide or KI. The effect of Gdn-HCl
on fluorescence quenching was examined at 30°C by the addition of acrylamide to a
reaction mixture containing 3 (J.M monomer and 0-6 M Gdn-HCl in PPS. Samples were
54
incubated for 20 h at room temperature prior to measurements. Emission spectra
represented the average of three scans (2 nm/s). and were corrected for background and
protein dilution, and when appropriate, the inner filter effect (125).
Fluorescence quenching data were analyzed by the Stern-Volmer equation 2.3
where static quenching is neglected (127):
F0/F=l+Ksv[Q] (2.3)
F0 and F are the fluorescence intensities in the absence and presence of the quencher,
respectively; [Q] is the concentration of the quencher; and Ksv is the collisional Stern-
Volmer constant, which is a direct measure of the quenching efficiency. In a protein
containing multiple Trp residues, the presence of different classes of Trp residues is
reflected by a downward curvature in the Stern-Volmer plot. The fraction of total
fluorophore accessible to the quencher in a heterogeneous system was determined using
equation 2.4. a modified Stern-Volmer plot (127):
F0/(F0-F) = 1 //, + 1 /[Q]Kofa (2.4)
KQ is the modified quenching constant and fa is the fraction of the initial fluorescence
accessible to the quencher. Values for KQ andfa can be determined from a plot of FJ(F0-
F) versus 1/[Q].
55
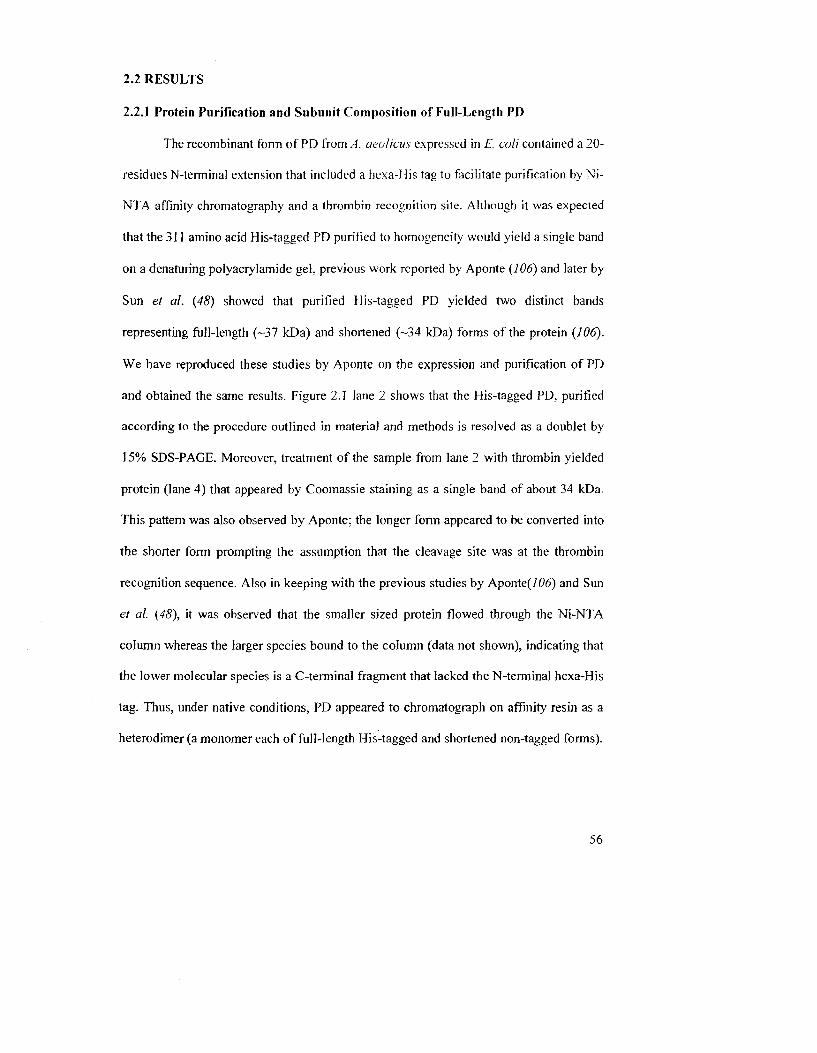
2.2 RESULTS
2.2.1 Protein Purification and Subunit Composition of Full-Length PD
The recombinant form of PD from A. aeolicus expressed in E. coli contained a 20-
residues N-terminal extension that included a hexa-His tag to facilitate purification by Ni-
NTA affinity chromatography and a thrombin recognition site. Although it was expected
that the 311 amino acid His-tagged PD purified to homogeneity would yield a single band
on a denaturing polyacrylamide gel. previous work reported by Aponte (JOS) and later by
Sun et al. (48) showed that purified His-tagged PD yielded two distinct bands
representing full-length (-37 kDa) and shortened (-34 kDa) forms of the protein (106).
We have reproduced these studies by Aponte on the expression and purification of PD
and obtained the same results. Figure 2.1 lane 2 shows that the His-tagged PD, purified
according to the procedure outlined in material and methods is resolved as a doublet by
15% SDS-PAGE. Moreover, treatment of the sample from lane 2 with thrombin yielded
protein (lane 4) that appeared by Coomassie staining as a single band of about 34 kDa.
This pattern was also observed by Aponte: the longer form appeared to be converted into
the shorter form prompting the assumption that the cleavage site was at the thrombin
recognition sequence. Also in keeping with the previous studies by Aponte(706) and Sun
et al. (48), it was observed that the smaller sized protein flowed through the Ni-NTA
column whereas the larger species bound to the column (data not shown), indicating that
the lower molecular species is a C-terminal fragment that lacked the N-terminal hexa-His
tag. Thus, under native conditions, PD appeared to chromatograph on affinity resin as a
heterodimer (a monomer each of full-length His-tagged and shortened non-tagged forms).
56
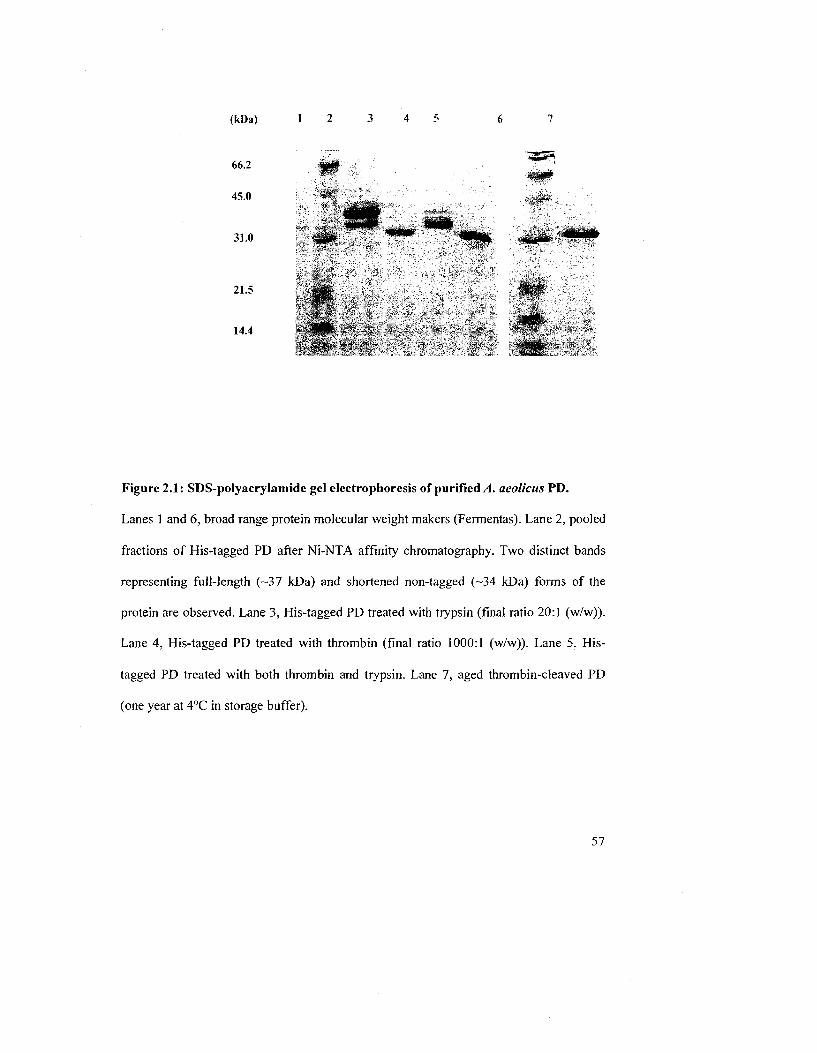
(kDa) 1 2 3 4 5 6 7
Figure 2.1: SDS-poIyacrylamide gel electrophoresis of purified A. aeolicus PD.
Lanes 1 and 6, broad range protein molecular weight makers (Fermentas). Lane 2, pooled
fractions of His-tagged PD after Ni-NTA affinity chromatography. Two distinct bands
representing full-length (—37 kDa) and shortened non-tagged (—34 kDa) forms of the
protein are observed. Lane 3, His-tagged PD treated with trypsin (final ratio 20:1 (w/w)).
Lane 4, His-tagged PD treated with thrombin (final ratio 1000:1 (w/w)). Lane 5. His-
tagged PD treated with both thrombin and trypsin. Lane 7, aged thrombin-cleaved PD
(one year at 4°C in storage buffer).
57
Interestingly, treatment of either full-length or thrombin-treated PD with the protease
trypsin (lanes 3 and 5, respectively) or prolonged storage of the protein at 4°C (lane 7)
resulted in further cleavage of the monomer to a 32 kDa fragment as judged by SDS-
PAGE analysis.
Development of a reliable protocol for ES1-MS analysis of PD confirmed the
identity of each protein. In addition, the results supported the idea that the shortened form
was produced by cleavage at the N-terminal region of PD. Figure 2.2 shows a schematic
representation of the expression and primary sequence of PD. For clarity, amino acids are
numbered for PD from 1-311, beginning with PD's authentic Met as annotated from the
database; the residues of the tag are not numbered. For heterodimeric PD, analysis
showed that the His-tagged subunit was post-translationally modified as it lacked the first
Met at the tag's N-terminus (expected [M+H+], 36 881.6 Da; observed, 36 880.5 Da).
The smaller 34 kDa subunit commenced at Ser5 in PD (expected [M+H+], 34 419.9 Da;
observed, 34 419.5 Da) and indicated that the shortened form was generated by cleavage
at a site downstream of the thrombin recognition site. As expected results for the purified
thrombin-treated PD verified cleavage at the thrombin recognition site, between Arg and
Gly within the N-terminal tag (expected [M+H+], 35 130.8 Da; observed, 35 130.6 Da)
(Fig. 2.3 A). The sample also contained the 34 kDa product as a minor species (-15%)
(Fig. 2.3 B). In summary, the shortened form of the recombinant PD was not produced by
cleavage at the thrombin recognition site as suggested by Aponte {106), nor was it
produced by translation starting at positions 1, 7, 30, 38 or 41 of PD (the latter two would
result in truncation of the NAD4-binding domain). Moreover, none of the peaks resolved
58
Thrombin recognition and cleavage site
Start methionine from pET-15b vector
His-tag
T7 promoter M lac operator rbs hMGSS HKHh'HH LVPRGSH Prephenate
Dehydrogenase
Treatment with thrombin
10 15 20 25 311
MGSS HHHHHH LVPR GSHMAILSSMFNPSPPQGFCKKNIIKILKSLSM KRMEID
Figure 2.2: Schematic representation of the organization of the expression/cloning
region of pET-15b vector containing A aeolicus tyrA. Amino acids are numbered from
1 to 311, starting at PD's authentic methionine. Amino acids from the tag are not
numbered.
59
by ESI- MS matched mass values predicted for cleavage within the protein's C-terminal
region.
We found that purified thrombin-treated PD (1-10 mg/mL) remained stable and
fully active when stored at -86°C. As mentioned previously however, the enzyme was
susceptible to further N-terminal degradation if kept for extended periods of time at 4°C,
or if purified in the absence of insufficient amounts of protease inhibitors. For example,
when either His-tagged or thrombin-cleaved PD stored at 4°C for one year was subjected
to ESI-MS, a major single peak was observed at 32 313 Da. ES1-MS data for His-tagged
PD is shown Figure 2.3 C while SDS-PAGE analysis of the same sample is shown Figure
2.1 lane 7. This peak matched the mass predicted for a shortened protein resulting from
the proteolytic cleavage at the N-terminus of the recombinant PD at Lys23 (expected
[M+H+], 32 315.4 Da; observed, 32 313.0 Da). Additionally, SDS-PAGE analysis of
purified PD treated with trypsin (Figure 2.1 lanes 3 and 5) revealed further cleavage at
the protein's N-terminal region, although ESI-MS analysis on this stable fragment was
not performed to confirm the exact site of cleavage.
Additional evidence strengthening our hypothesis of a truncation at the N-
terminal region of PD comes from the results of MALDl-ToF-MS analysis of in-solution
and in-gel tryptic digestions. Table 2.1 summarizes the calculated masses of the peptides
from in-silico digestion of PD along with the peptides observed by MALDl-ToF-MS
analysis. It is worth noting that these experiments were conducted prior to ESI-MS
60
Figure 2.3: Deconvolved electrospray ionization mass spectra of PD (A) intact A.
aeolicm thrombin-treated PD, expected [M+H+] of 35 130 Da. (B) Minor species of a
shortened form of PD; observed [M+H ] of 34 419 Da. (C) A year-old sample of His-
tagged PD showing a major peak at [M+H+] of 32 313 Da and corresponding to a
cleavage at Lys23. The enzymes (2-5 ^M monomer) were prepared as described in
section 2.1.5.1.1 then resuspended in 0.5-1 mL of a solution of 30% methanol/0.2%
formic acid (v/v) immediately prior to direct injection.
61
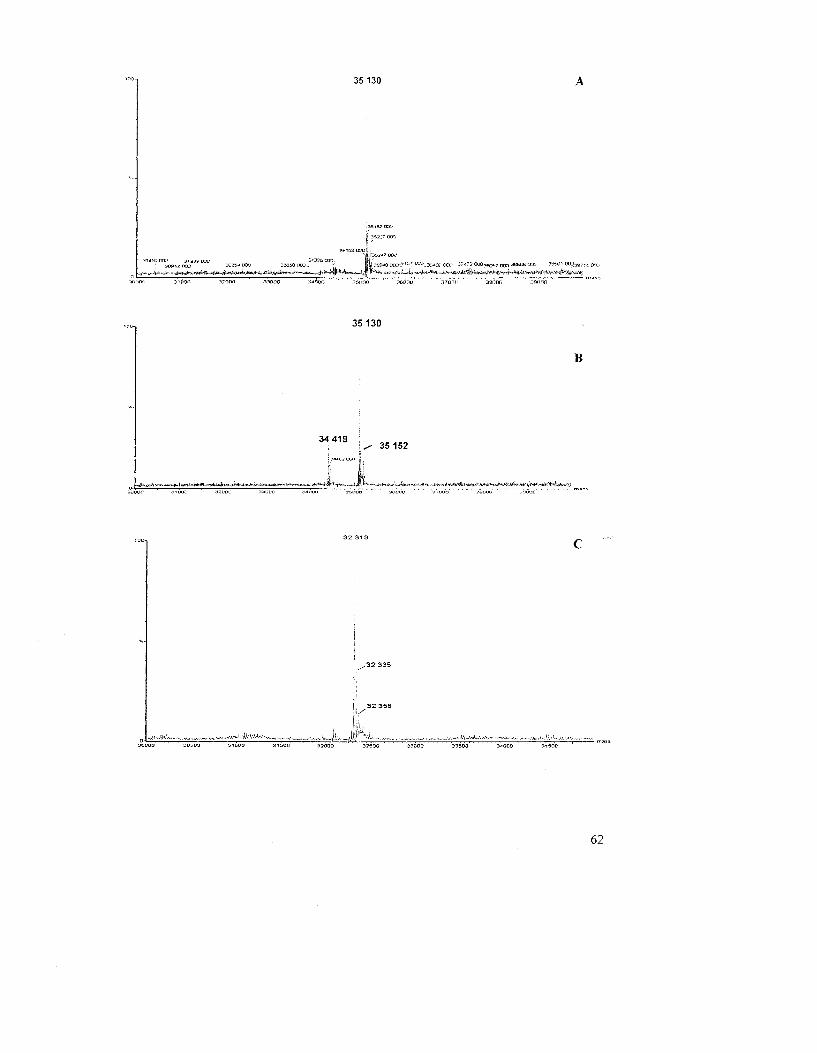
35 130
S W * COO " " ? T 3 ^ 000 g 309^0 aa^v'-f 'XXy.,X-£07 COP 37A72 C O O ^ ^ ; pnn 366CE 000 2 ^ * " ^ 3 9 7 : i
35 130
B
34 419 35 152
•-^17^.- .—*-J».
„ » u i i ! i a j . * v _ IR .P
62
analysis of the protein during which time the development of a reliable protocol for direct
injection was underway.
The combined results from in-gel and insolation tryptic digestion resulted in 73%
coverage for thrombin-treated PD. with 13 peptides detected out of the 17 that would be
theoretically generated by trypsin activity with no miscleavages. Using HCCA as the
matrix, the detection range of the MALD1 cannot resolve fragments with high or low
molecular weights (above 5 kDa and below 700 Da. respectively). Additionally worth
noting, the high percentage coverage could only be obtained by analyzing multiple
samples of PD. each trial yielding about 10-20% sequence coverage but presumably
exposing different regions of the protein.
As shown in Figure 2.4, the predicted C-terminal fragments were detected but
none of the peptides belonging to the N-terminal region were observed, confirming that
the truncation might have occurred between residues 1-30. Surprisingly, MALDI-ToF-
MS analysis of several insolution tryptic digests failed to reveal the fragment comprising
PD's amino acid 1-21 (see Table 2.1). Additionally, residues 192-242 were not detected.
Presumably, this large peptide fragment could not be resolved using the HCCA matrix. A
similar although not identical pattern was also reported by Christendaf s lab (48); only
peptides commencing at position 61 in the primary sequence could be identified. Based
on the findings from MALDI-ToF-MS and the results from secondary structure
prediction, six protein variants lacking the first 19, 25, 28, 36, 52 and 55 amino acids
were constructed and expressed by Christendat and coworkers for crystallography trials
(numbered here from PD's Met starting site) and one of them, A19PD, yielded crystals
diffracting to a high resolution (48).
63
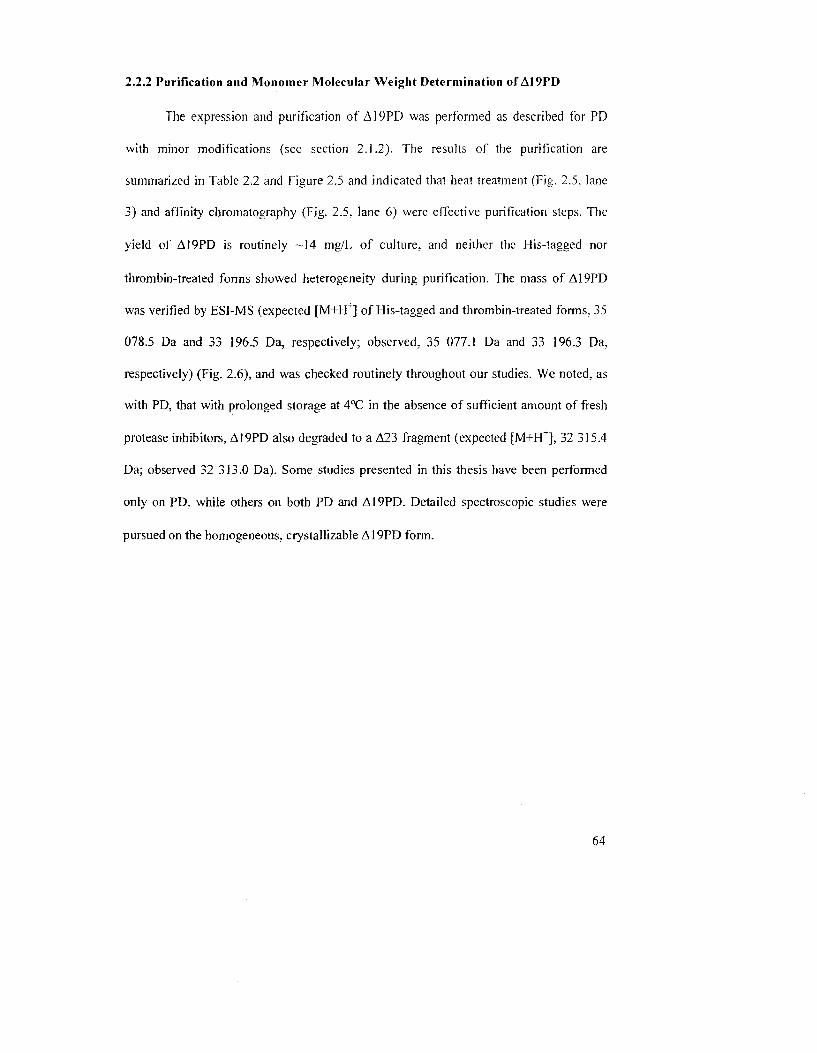
2.2.2 Purification and Monomer Molecular Weight Determination of A19PD
The expression and purification of A19PD was performed as described for PD
with minor modifications (see section 2.].2). The results of the purification are
summarized in Table 2.2 and Figure 2.5 and indicated that heat treatment (Fig. 2.5. lane
3) and affinity chromatography (Fig. 2.5, lane 6) were effective purification steps. The
yield of A19PD is routinely -14 mg/L of culture, and neither the His-tagged nor
thrombin-treated forms showed heterogeneity during purification. The mass of A19PD
was verified by ESI-MS (expected [M+TT] of His-tagged and thrombin-treated forms. 35
078.5 Da and 33 196.5 Da, respectively; observed, 35 077.1 Da and 33 196.3 Da,
respectively) (Fig. 2.6), and was checked routinely throughout our studies. We noted, as
with PD, that with prolonged storage at 4°C in the absence of sufficient amount of fresh
protease inhibitors, A19PD also degraded to a A23 fragment (expected [M+PT], 32 315.4
Da; observed 32 313.0 Da). Some studies presented in this thesis have been performed
only on PD, while others on both PD and A19PD. Detailed spectroscopic studies were
pursued on the homogeneous, crystallizable A19PD form.
64
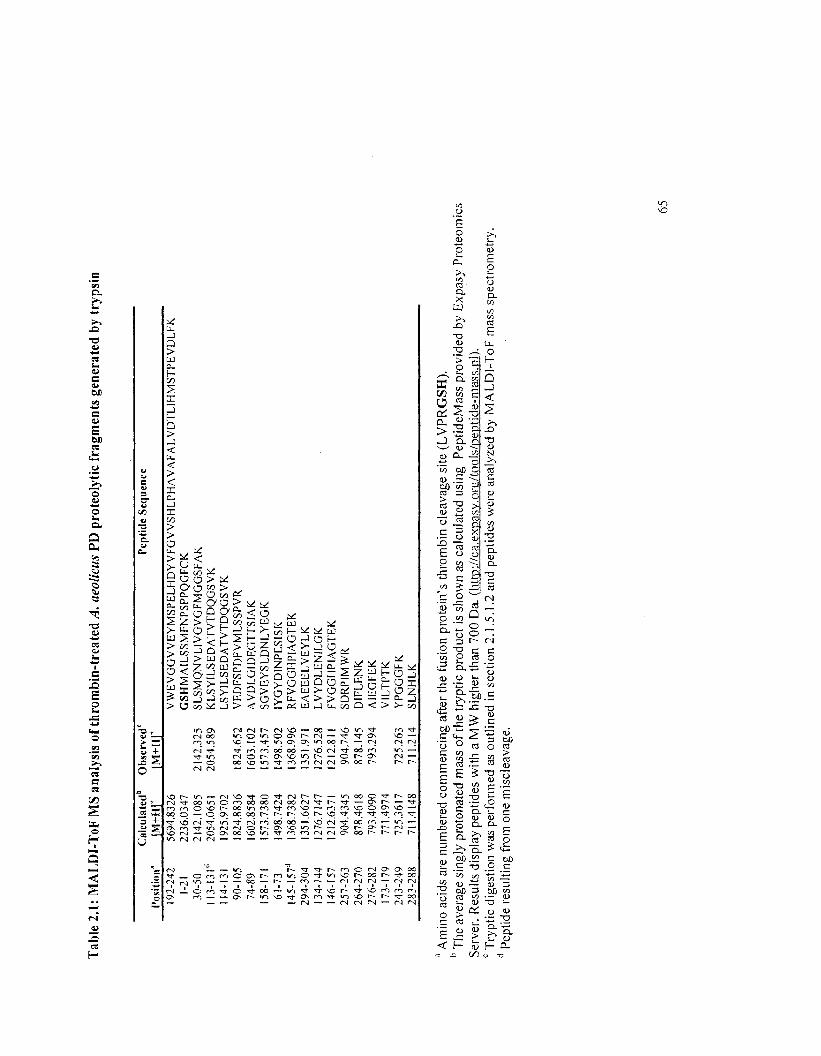
Tab
le 2
.1:
MA
LD
I-T
oF M
S an
alys
is o
f th
rom
bin-
trea
ted
A. a
eolic
us P
D p
rote
olyt
ic f
ragm
ents
gen
erat
ed b
y tr
ypsi
n
Posi
tion"
19
2-24
2 1-
21
30-5
0 1
f 3-
131rf
114-
131
90-1
05
74-8
9 15
8-17
1 61
-73
145-
157"
29
4-30
4 13
4-14
4 14
6-15
7 25
7-26
3 26
4-27
0 27
6-28
2 17
3-17
9 24
3-24
9 28
3-28
8
Cal
cula
ted11
|M+H
|+
5694
.832
6 22
36.0
347
2142
.108
5 20
54.0
651
1925
.970
2 18
24.8
836
1602
.858
4 15
73.7
380
1498
.742
4 13
68.7
382
1351
.662
7 12
76.7
147
1212
.637
1 90
4.43
45
878.
4618
79
3.40
90
771.
4974
72
5.36
17
711.
4148
Obs
erve
d'
iM+n
r
2142
.325
20
54.5
89
1824
.652
16
03.1
02
1573
.457
14
98.5
02
1368
.996
13
51.9
71
1276
.528
12
12,8
11
904.
746
878.
145
793.
294
725.
263
711.
214
Pept
ide
Sequ
ence
VW
EV
GG
VV
EY
MSP
EL
HD
YV
FGV
VSH
LPH
AV
AFA
LV
DT
LIH
MST
PEV
DL
FK
GSH
MA
ILSS
MFN
PSPP
QG
FCK
SL
SMQ
NV
LIV
GV
GFM
GG
SFA
K
KL
SYIL
SED
AT
VT
DQ
GSV
K
LSY
ILSE
DA
TV
TD
QG
SVK
V
ED
FSPD
FVM
LSS
PVR
A
VD
LG
IDE
GT
TSI
AK
SG
VE
YSI
DN
LY
EG
K
IYG
YD
INPE
SISK
R
FVG
GH
PIA
GT
EK
E
AE
EE
LV
EY
LK
L
VY
DL
EN
ILG
K
FVG
GH
PIA
GT
EK
SD
RPI
MW
R
DIF
LE
NK
A
IEG
FEK
V
ILT
PTK
Y
PGG
GFK
SL
NH
LK
a Am
ino
acid
s ar
e nu
mbe
red
com
men
cing
afte
r th
e fu
sion
prot
ein'
s th
rom
bin
clea
vage
site
(L
VPR
GSH
).
1 The
ave
rage
sin
gly
prot
onat
ed m
ass
of th
e tr
yptic
pro
duct
is
show
n as
cal
cula
ted
usin
g Pe
ptid
eMas
s pr
ovid
ed b
y E
xpas
y Pr
oteo
mic
s Se
rver
. R
esul
ts d
ispl
ay p
eptid
es w
ith a
MW
hig
her
than
700
Da.
("h
ttp://
ca.e
xpas
v.or
g/to
ols/
pept
ide-
mas
s.pl
").
c Try
ptic
dig
estio
n w
as p
erfo
rmed
as
outli
ned
in s
ectio
n 2.
1.5.
1.2
and
pept
ides
wer
e an
alyz
ed b
y M
AL
DI-
ToF
mas
s sp
ectr
omet
ry.
cl P
eptid
e re
sulti
ng f
rom
one
mis
clea
vage
.
65
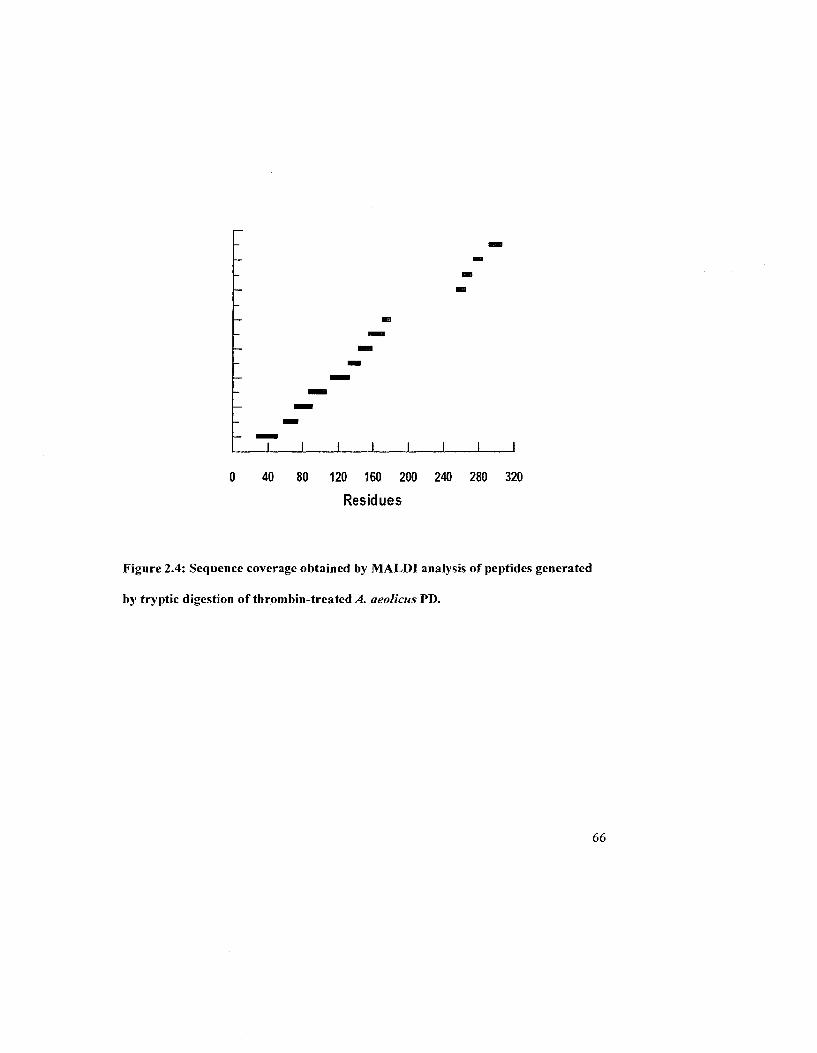
I I I I I I I I I
0 40 80 120 160 200 240 280 320
Residues
Figure 2.4: Sequence coverage obtained by MALDI analysis of peptides generated
by tryptic digestion of thrombin-treated A aeolicus PD.
66
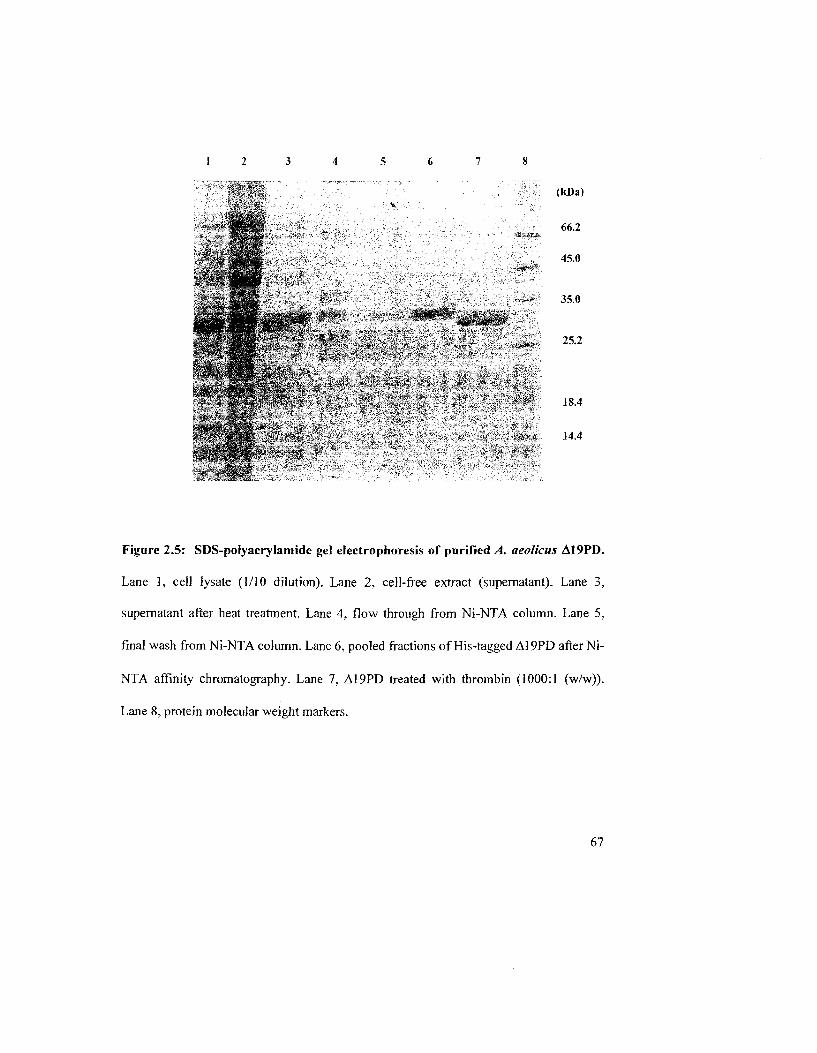
1 2 3 4 5 6 7 8
(kDa)
M i i f •ytf'a I P X
if
r .- f1"
-y,K
66.2
45.0
35.0
25.2
J 8.4
14.4 ' i f ^ "**•
Figure 2.5: SDS-poIyacrylamide gel electrophoresis of purified A. aeolicus A19PD.
Lane 1, cell lysate (1/10 dilution). Lane 2, cell-free extract (supernatant). Lane 3,
supernatant after heat treatment. Lane 4, flow through from Ni-NTA column. Lane 5.
final wash from Ni-NTA column. Lane 6. pooled fractions of His-tagged A19PD after Ni-
NTA affinity chromatography. Lane 7. A19PD treated with thrombin (1000:1 (w/w)).
Lane 8, protein molecular weight markers.
67
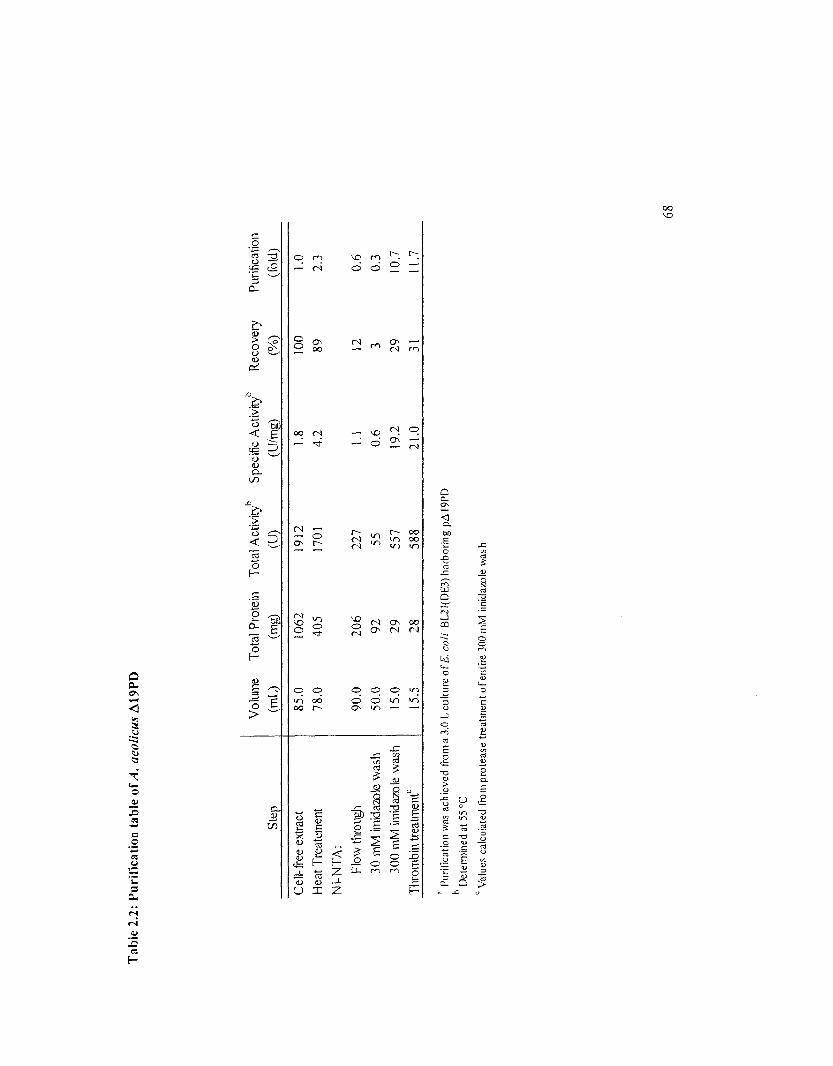
Tab
le 2
.2:
Pur
ific
atio
n ta
ble
of A
. ae
olic
us A
19P
D
Step
Cel
l-fr
ee e
xtra
ct
Hea
t T
reat
emen
t
Ni-
NT
A:
Flow
thro
ugh
30 m
M im
idaz
ole
was
h
300
mM
imid
azol
e w
ash
Thr
ombi
n tre
atm
ent0
Vol
ume
(mL
)
Tot
al P
rote
in
(mg)
Tot
al A
ctiv
ity'
(U)
Spec
ific
Act
ivity
(U/m
g)
Rec
over
y
(%)
Purif
icat
ion
(fol
d)
85.0
78.0
90.0
50.0
15.0
15.5
1062
40
5
206
92
29
28
1912
1701
227
55
557
588
1.8
4.2 1.1
0.6
19.2
21.0
100
89
12
3 29
31
1.0
2.3
0.6
0.3
10.7
11.7
Purif
icat
ion
was
ach
ieve
d fro
m a
3.0
L c
ultu
re o
f£ c
oll
BL2
I(DE3
) har
bori
ng p
A I
9PD
Det
erm
ined
at 5
5 °C
c V
alue
s ca
lcul
ated
fro
m p
rote
ase
trea
tmen
t of
ent
ire 3
00 m
M im
idaz
ole
was
h
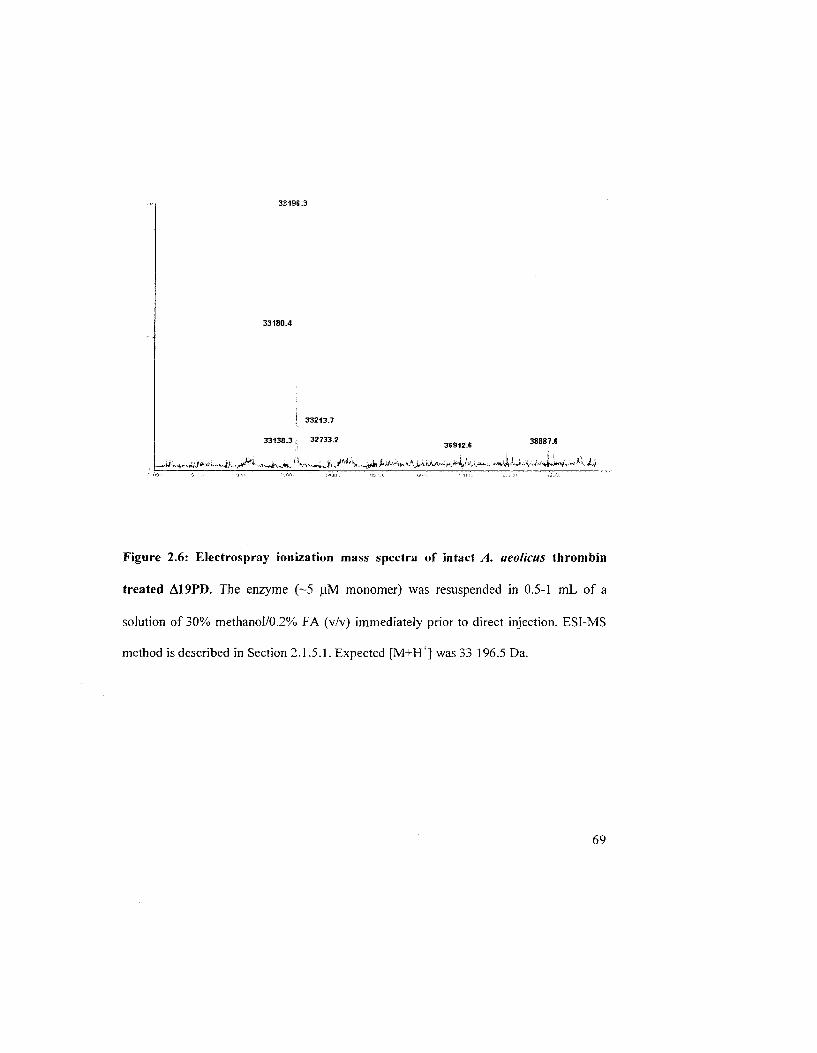
33196-3
33180.4
| 33213.7
33138.3! 32733.2 ^ ^ 38887.*
Figure 2.6: Electrospray ionization mass spectra of intact A. aeolicus thrombin
treated A19PD. The enzyme (~5 ]iM monomer) was resuspended in 0.5-1 mL of a
solution of 30% methanol/0.2% FA (v/v) immediately prior to direct injection. ES1-MS
method is described in Section 2.1.5.1. Expected [M+JHT] was 33 196.5 Da.
69
2.2.3 Native Molecular Weight
Analysis of PD and A19PD by size exclusion FPLC from 0.1 to 2 mg/mL yielded
values of 54 kDa and 52 kDa. respectively (Appendix 2A). These values were less than
those predicted for dimeric forms. -70 kDa and ~66 kDa. However, masses calculated
from the primary sequence more closely matched those obtained using sedimentation
velocity analytical ultracentrifugation. Average molecular masses of proteins and
sedimentation coefficients corrected to 20°C in water are summarized in Table 2.3. Data
obtained for PD with both FPLC and AUC are in good agreement with Aponte's previous
findings {106). Our results were consistent with the thermophilic PDs being dimeric in
solution but more compact than the commercially available globular proteins used to
calibrate size exclusion columns (J28). Occasionally our PD and A19PD preparations
contained a catalytically active oligomer of-160 kDa (less than 10% of the sample peak
on FPLC). which could be detected in the sedimentation velocity analyses (see Appendix
2B). For PD we attributed this oligomer, in part, to disulfide linked subunits (there is one
cysteine/monomer). Heterogeneity was removed by size exclusion chromatography prior
to spectroscopic analysis.
70
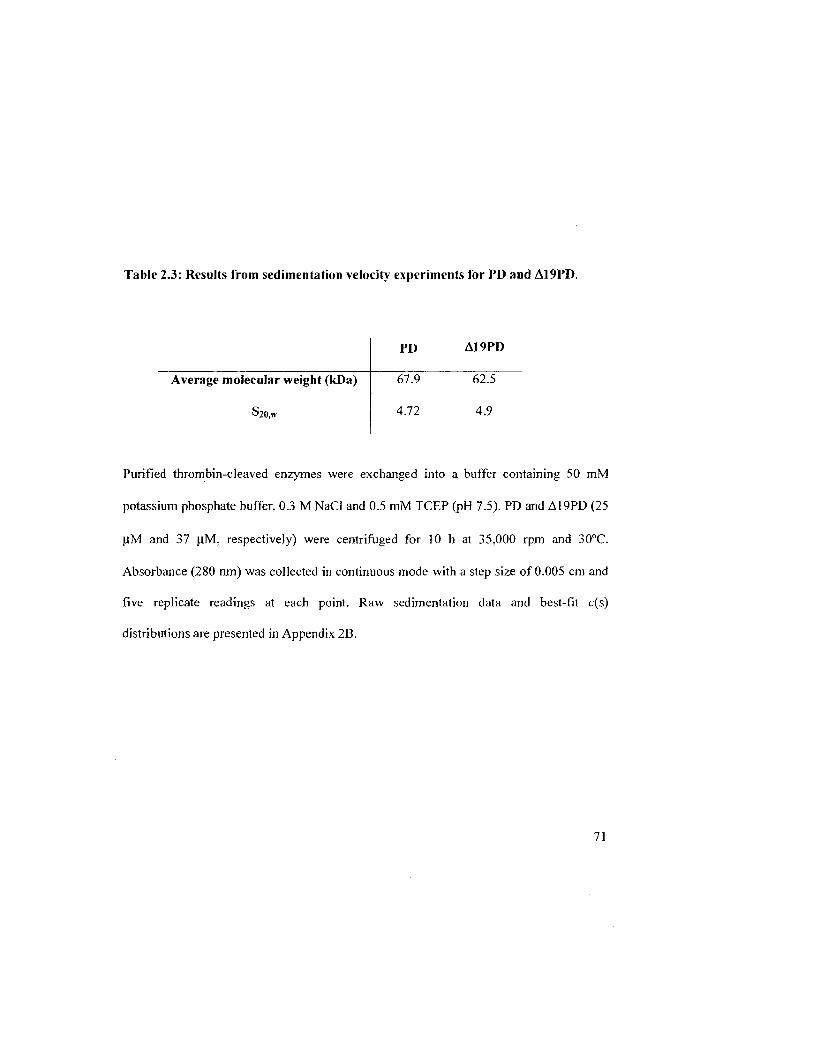
Table 2.3: Results from sedimentation velocity experiments for PD and AI9PD.
Average molecular weight (kDa)
S20,w
PD A19PD
67.9 62.5
4.72 4.9
Purified thrombin-cleaved enzymes were exchanged into a buffer containing 50 raM
potassium phosphate buffer, 0.3 M NaCl and 0.5 mM TCEP (pH 7.5). PD and A19PD (25
pjvl and 37 \iM, respectively) were centrifuged for 10 h at 35.000 rpm and 30°C.
Absorbance (280 ran) was collected in continuous mode with a step size of 0.005 cm and
five replicate readings at each point. Raw sedimentation data and best-fit c(s)
distributions are presented in Appendix 2B.
71
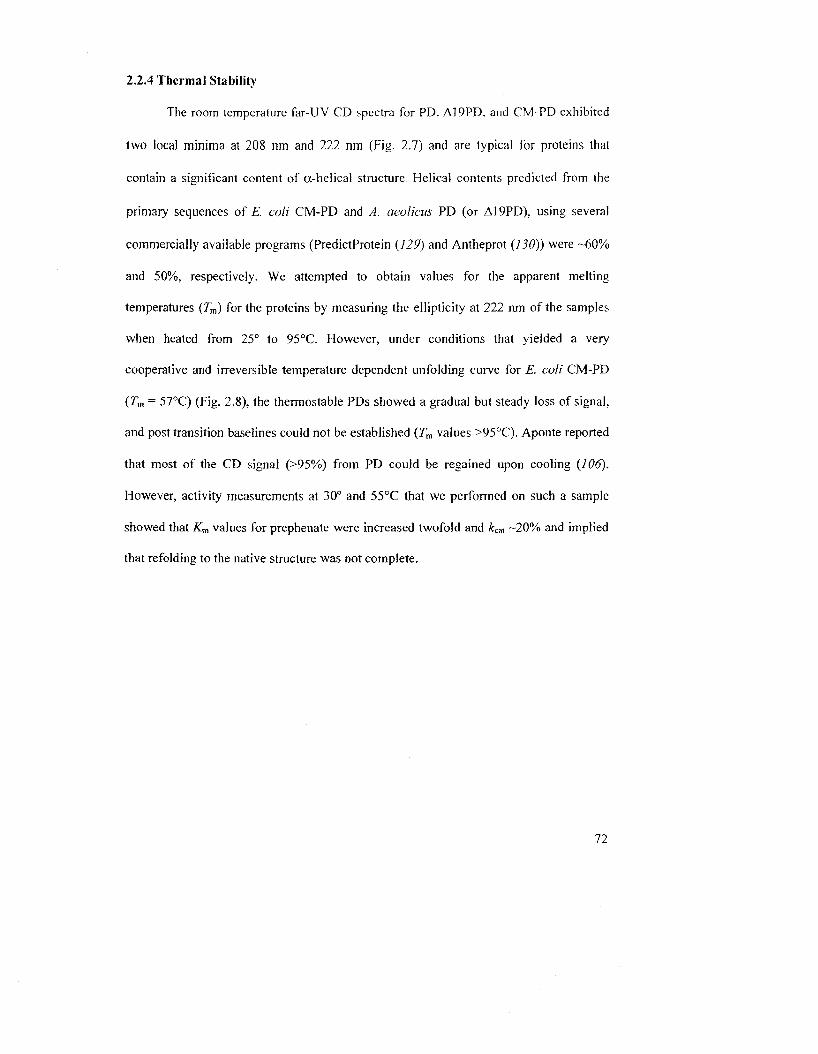
2.2.4 Thermal Stability
The room temperature far-UV CD spectra for PD. A19PD. and CM-PD exhibited
two local minima at 208 nm and 222 nm (Fig. 2.7) and are typical for proteins that
contain a significant content of ot-helical structure Helical contents predicted from the
primary sequences off . coli CM-PD and A. aeolicus PD (or A19PD). using several
commercially available programs (PredictProtein (129) and Antheprot (130)) were -60%
and 50%, respectively. We attempted to obtain values for the apparent melting
temperatures (Tm) for the proteins by measuring the ellipticity at 222 nm of the samples
when heated from 25° to 95°C. However, under conditions that yielded a very
cooperative and irreversible temperature dependent unfolding curve for E. coli CM-PD
(Tm = 57°C) (Fig. 2.8). the thermostable PDs showed a gradual but steady loss of signal,
and post transition baselines could not be established (Tm values >95°C). Aponte reported
that most of the CD signal (>95%) from PD could be regained upon cooling (106).
However, activity measurements at 30° and 55°C that we performed on such a sample
showed that Km values for prephenate were increased twofold and k^, -20% and implied
that refolding to the native structure was not complete.
72
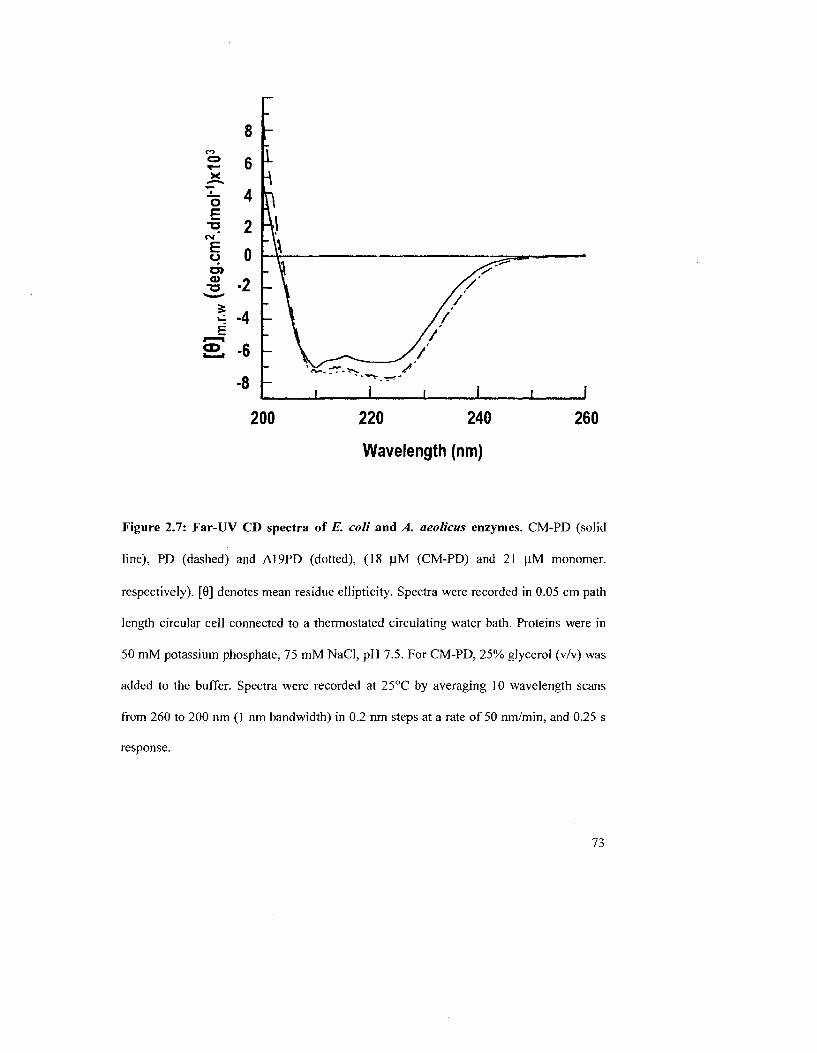
200 220 240
Wavelength (nm)
260
Figure 2.7: Far-UV CD spectra of E. coli and A. aeolicus enzymes. CM-PD (solid
line), PD (dashed) and A19PD (dotted), (18 nM (CM-PD) and 21 p.M monomer,
respectively). [9] denotes mean residue ellipticity. Spectra were recorded in 0.05 cm path
length circular cell connected to a thermostated circulating water bath. Proteins were in
50 mM potassium phosphate, 75 mM NaCl, pH 7.5. For CM-PD, 25% glycerol (v/v) was
added to the buffer. Spectra were recorded at 25°C by averaging 10 wavelength scans
from 260 to 200 nm (1 nm bandwidth) in 0.2 run steps at a rate of 50 nm/min, and 0.25 s
response.
73
-20
©
g> -40
-60 L
j L J L
40 60 80
Temperature (°C)
Figure 2.8: Thermal denaturations monitored by CD spectroscopy at 222 nm.
Thermal denaturations with 0.75 mg/mL of CM-PD (solid line), PD (dashed) and A19PD
(dotted) were carried out by following the ellipticity at 222 nm from 25 to 95°C under the
same conditions except that for CM-PD, buffer was supplemented with 25% (v/v)
glycerol.
74
2.2.5 Denaturation Studies with Gdn-HCl
The stability of A19PD was further addressed by monitoring Gdn-HCl-induced
protein unfolding using the CD signal at 222 nm as a probe of a-helical secondary
structure and using Trp fluorescence as a probe of tertian' structure. Gdn-HCl was
selected as the denaturant after noting that PD did not fully unfold in urea, even at
concentrations up to 10 M. as observed by Aponte (106).
As shown in Figure 2.9A. the intensity of the CD signal diminished with
increasing concentration of Gdn-HCl. When the data was plotted as percent fraction
folded as a function of denaturant concentration (Fig. 2.9B), a multistate transition was
observed with a distinct plateau between 3 and 4 M Gdn-HCl. and a sharp decrease in
fraction folded from 4 to 5 M denaturant. A value for the midpoint in the transition from
folded to unfolded conformation (D1/2) of 4.8 M was estimated from the plot.
Dehydrogenase specific activity increased 220% at 0.5 M Gdn-HCl but was markedly
reduced by 3 M denaturant (Fig. 2.10). The presence of 0.5 M Gdn-HCl also had inverse
effects on the affinity for prephenate and NAD+, causing a fourfold increase in Km for
prephenate (to 154 ^M) and a twofold reduction for NAD" (to 21 u\M). relative to the
values in the absence of Gdn-HCl (41 uJVf and 53 U.M, respectively). The increase in
specific activity in the presence of 0.5 M Gdn-HCl did not overcome the decrease in
affinity for prephenate.
75
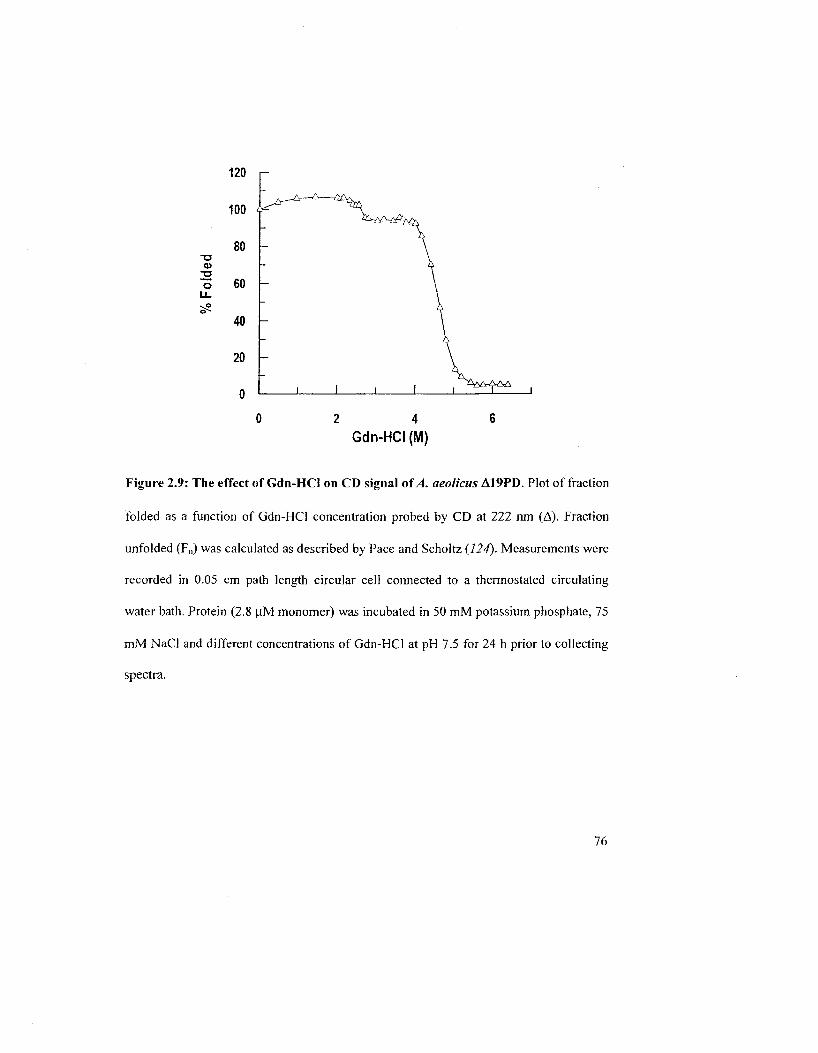
2 4 Gdn-HCI (M)
Figure 2.9: The effect of Gdn-HCI on CD signal of A aeolicus A19PD. Plot of fraction
folded as a function of Gdn-HCI concentration probed by CD at 222 ran (A). Fraction
unfolded (Fu) was calculated as described by Pace and Scholtz {124). Measurements were
recorded in 0.05 cm path length circular cell connected to a thermostated circulating
water bath. Protein (2.8 p:M monomer) was incubated in 50 mM potassium phosphate, 75
mM NaCl and different concentrations of Gdn-HCI at pH 7.5 for 24 h prior to collecting
spectra.
76
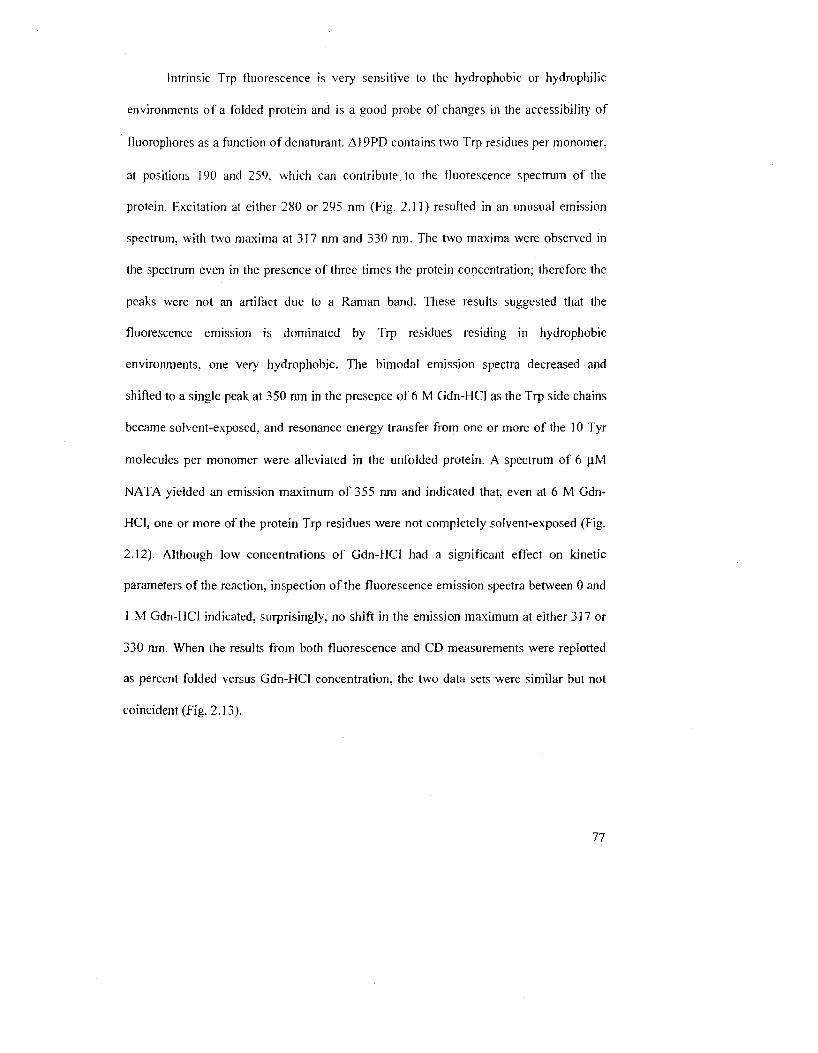
Intrinsic Trp fluorescence is very sensitive to the hydrophobic or hydrophilic
environments of a folded protein and is a good probe of changes in the accessibility of
fluorophores as a function of denarurant. A19PD contains two Trp residues per monomer,
at positions 190 and 259. which can contribute to the fluorescence spectrum of the
protein. Excitation at either 280 or 295 nm (Fig. 2.11) resulted in an unusual emission
spectrum, with two maxima at 317 nm and 330 nm. The two maxima were observed in
the spectrum even in the presence of three times the protein concentration: therefore the
peaks were not an artifact due to a Raman band. These results suggested that the
fluorescence emission is dominated by Trp residues residing in hydrophobic
environments, one very hydrophobic. The bimodal emission spectra decreased and
shifted to a single peak at 350 nm in the presence of 6 M Gdn-HCl as the Trp side chains
became solvent-exposed, and resonance energy transfer from one or more of the 10 Tyr
molecules per monomer were alleviated in the unfolded protein. A spectrum of 6 pJVI
NATA yielded an emission maximum of 355 nm and indicated that, even at 6 M Gdn-
HCl, one or more of the protein Trp residues were not completely solvent-exposed (Fig.
2.12). Although low concentrations of Gdn-HCl had a significant effect on kinetic
parameters of the reaction, inspection of the fluorescence emission spectra between 0 and
1 M Gdn-HCl indicated, surprisingly, no shift in the emission maximum at either 317 or
330 nm. When the results from both fluorescence and CD measurements were replotted
as percent folded versus Gdn-HCl concentration, the two data sets were similar but not
coincident (Fig. 2.13).
77
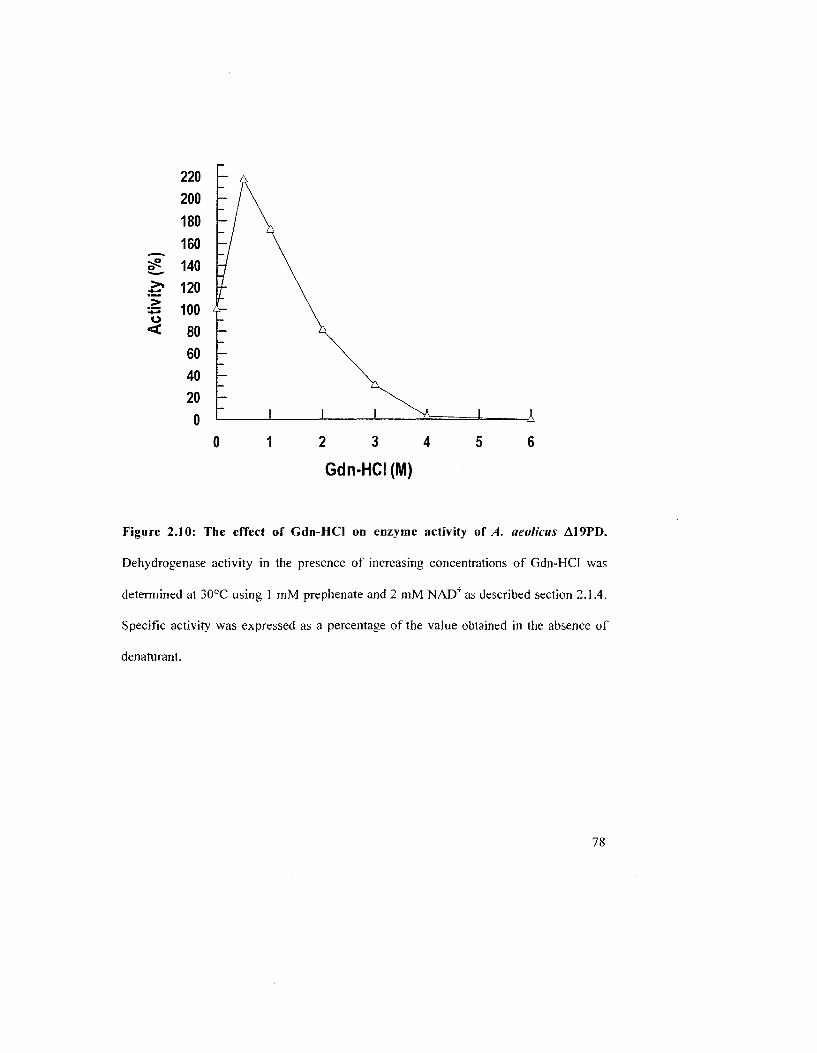
<
2 3 4
Gdn-HCI(M)
Figure 2J0: The effect of Gdn-HCl on enzyme activity of A. aeolicus A19PD.
Dehydrogenase activity in the presence of increasing concentrations of Gdn-HCI was
determined at 30°C using 1 mM prephenate and 2 mM NADT as described section 2.1.4.
Specific activity was expressed as a percentage of the value obtained in the absence of
denaturant.
78
400
350 3
3~ >>
• * - *
a> •** e d> o
cen
(A
o
Flu
300
250
200
150
100
/
- / - / - / /
50
300 320 340 360
Wavelength (nm)
380 400
Figure 2.11: Fluorescence emission spectra of A19PD. Excitation wavelength was set
at 280 nm (solid line) or 295 nm (dashed line). Emission spectra of 2.8 \lM monomer
A19PD in 50 mM potassium phosphate. 75 mM NaCl at pH 7.5 were recorded from 300
to 400 nm in a 3 mL cuvette. Both emission and excitation bandwidths were set at 4 nm.
Fluorescence intensity is shown in arbitrary units (a.u.)
79
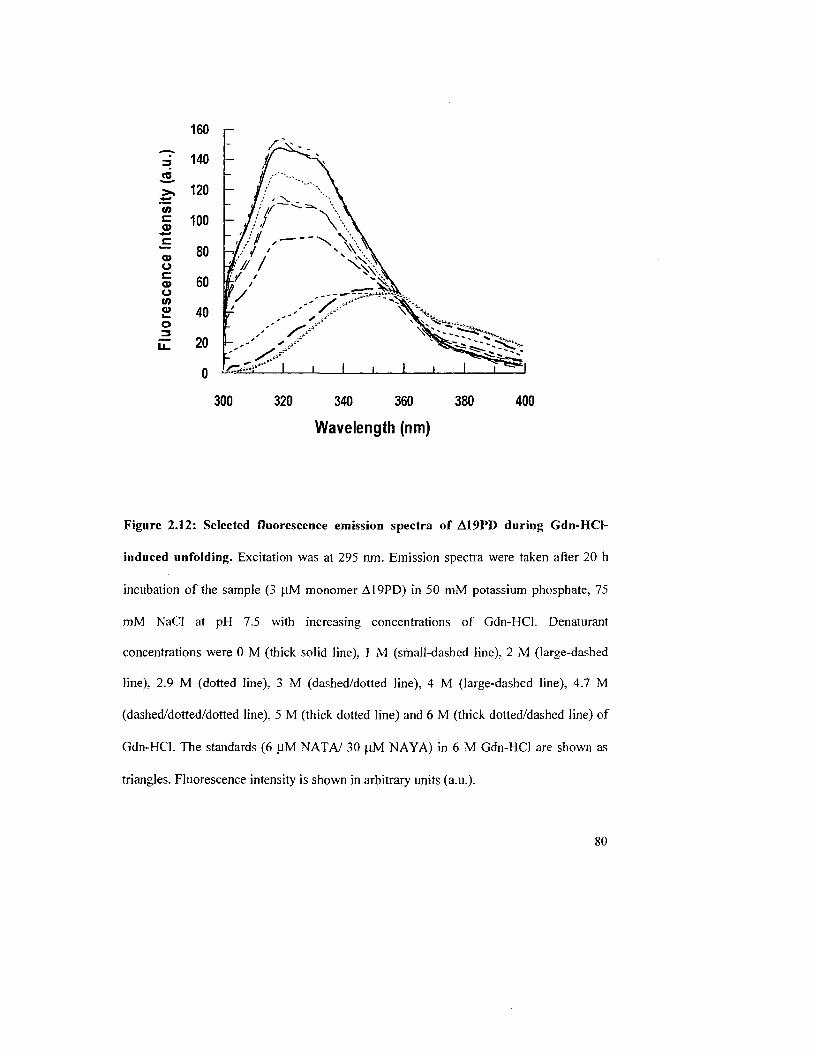
300 320 340 360 380 400
Wavelength (nm)
Figure 2.12: Selected fluorescence emission spectra of A19PD during Gdn-HCl-
induced unfolding. Excitation was at 295 nm. Emission spectra were taken after 20 h
incubation of the sample (3 |iM monomer A19PD) in 50 mM potassium phosphate. 75
mM NaCl at pH 7.5 with increasing concentrations of Gdn-HCl. Denaturant
concentrations were 0 M (thick solid line). 1 M (small-dashed line), 2 M (large-dashed
line), 2.9 M (dotted line), 3 M (dashed/dotted line), 4 M (large-dashed line), 4.7 M
(dashed/dotted/dotted line), 5 M (thick dotted line) and 6 M (thick dotted/dashed line) of
Gdn-HCl. The standards (6 n.M NATA/ 30 iM NAYA) in 6 M Gdn-HCl are shown as
triangles. Fluorescence intensity is shown in arbitrary units (a.u.).
80
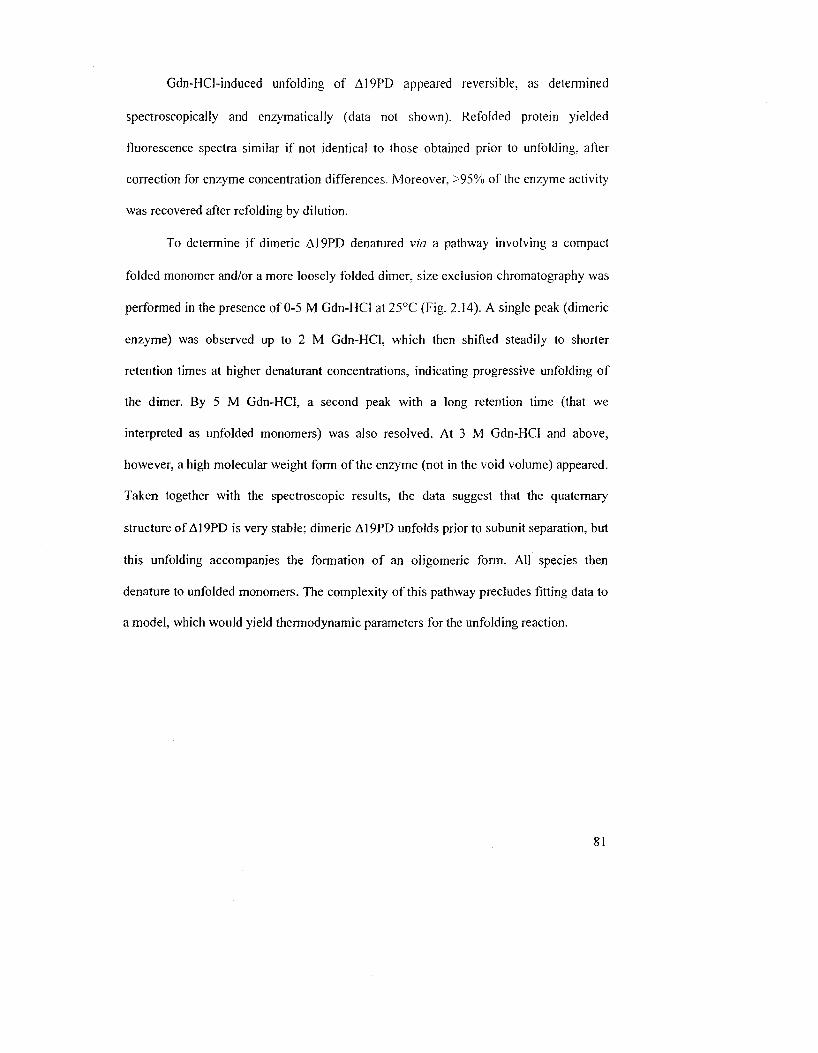
Gdn-HCl-induced unfolding of A19PD appeared reversible, as determined
spectroscopically and enzymatically (data not shown). Refolded protein yielded
fluorescence spectra similar if not identical to those obtained prior to unfolding, after
correction for enzyme concentration differences. Moreover. >95% of the enzyme activity
was recovered after refolding by dilution.
To determine if dimeric AI9PD denatured via a pathway involving a compact
folded monomer and/or a more loosely folded dimer, size exclusion chromatography was
performed in the presence of 0-5 M Gdn-HCl at 25°C (Fig. 2.14). A single peak (dimeric
enzyme) was observed up to 2 M Gdn-HCl. which then shifted steadily to shorter
retention times at higher denaturant concentrations, indicating progressive unfolding of
the dimer. By 5 M Gdn-HCl, a second peak with a long retention time (that we
interpreted as unfolded monomers) was also resolved. At 3 M Gdn-HCl and above,
however, a high molecular weight form of the enzyme (not in the void volume) appeared.
Taken together with the spectroscopic results, the data suggest that the quaternary
structure of A19PD is very stable: dimeric A19PD unfolds prior to subunit separation, but
this unfolding accompanies the formation of an oligomeric form. All species then
denature to unfolded monomers. The complexity of this pathway precludes fitting data to
a model, which would yield thermodynamic parameters for the unfolding reaction.
81
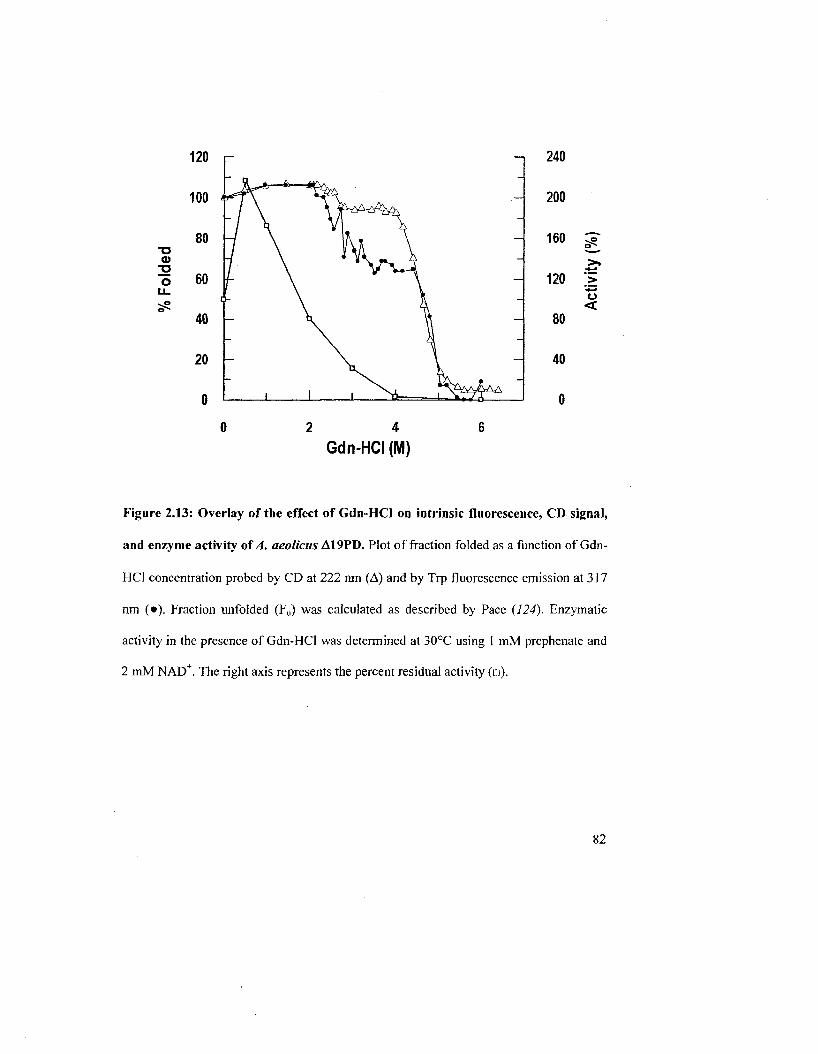
120 i -
T3
o
2 4 Gdn-HCI (M)
240
onn
160
120
80
40
0
(%)
Act
ivity
Figure 2.13: Overlay of the effect of Gdn-HCI on intrinsic fluorescence, CD signal,
and enzyme activity of A. aeolicus A19PD. Plot of fraction folded as a function of Gdn-
HCI concentration probed by CD at 222 nm (A) and by Trp fluorescence emission at 317
nm (•). Fraction unfolded (Fu) was calculated as described by Pace (124). Enzymatic
activity in the presence of Gdn-HCI was determined at 30°C using 1 mM prephenate and
2 mM NAD+. The right axis represents the percent residual activity (o).
82
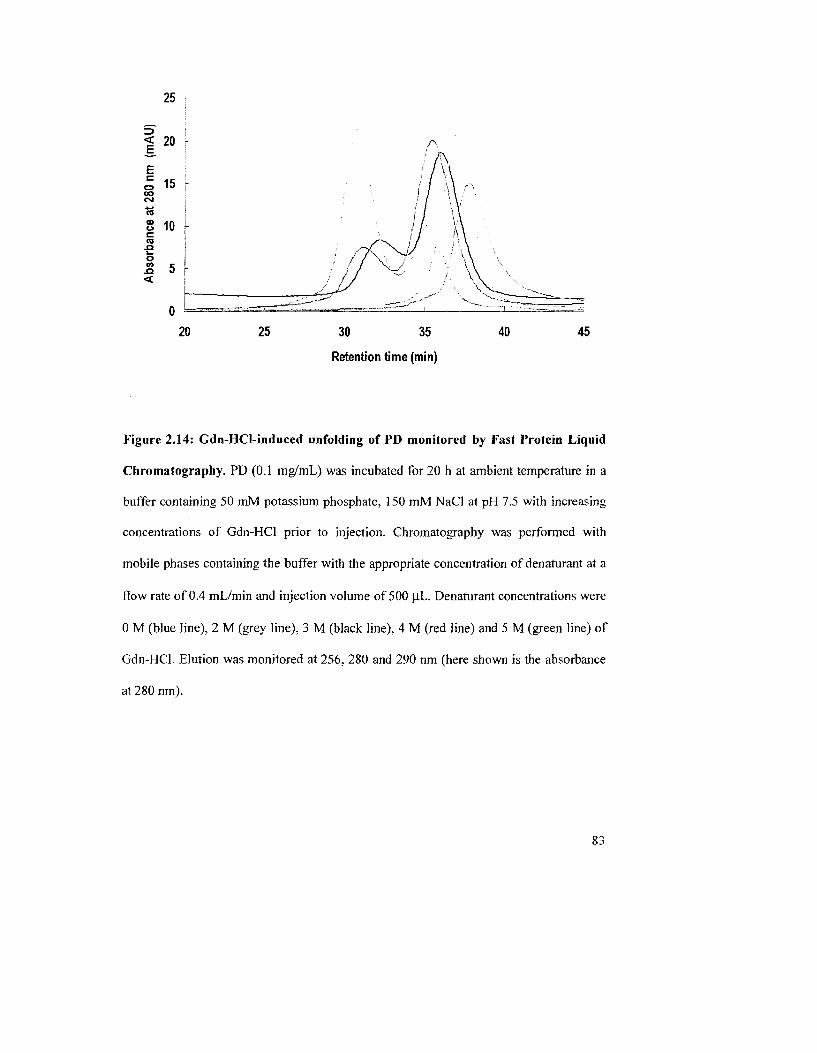
25
20 25 30 35
Retention time (min)
40 45
Figure 2.14: Gdn-HCl-induced unfolding of PD monitored by Fast Protein Liquid
Chromatography. PD (0.1 mg/mL) was incubated for 20 h at ambient temperature in a
buffer containing 50 mM potassium phosphate, 150 mM NaCl at pH 7.5 with increasing
concentrations of Gdn-HCI prior to injection. Chromatography was performed with
mobile phases containing the buffer with the appropriate concentration of denaturant at a
flow rate of 0.4 mL/min and injection volume of 500 uL. Denaturant concentrations were
0 M (blue line), 2 M (grey line), 3 M (black line), 4 M (red line) and 5 M (green line) of
Gdn-HCI. Elution was monitored at 256, 280 and 290 nm (here shown is the absorbance
at 280 nm).
83
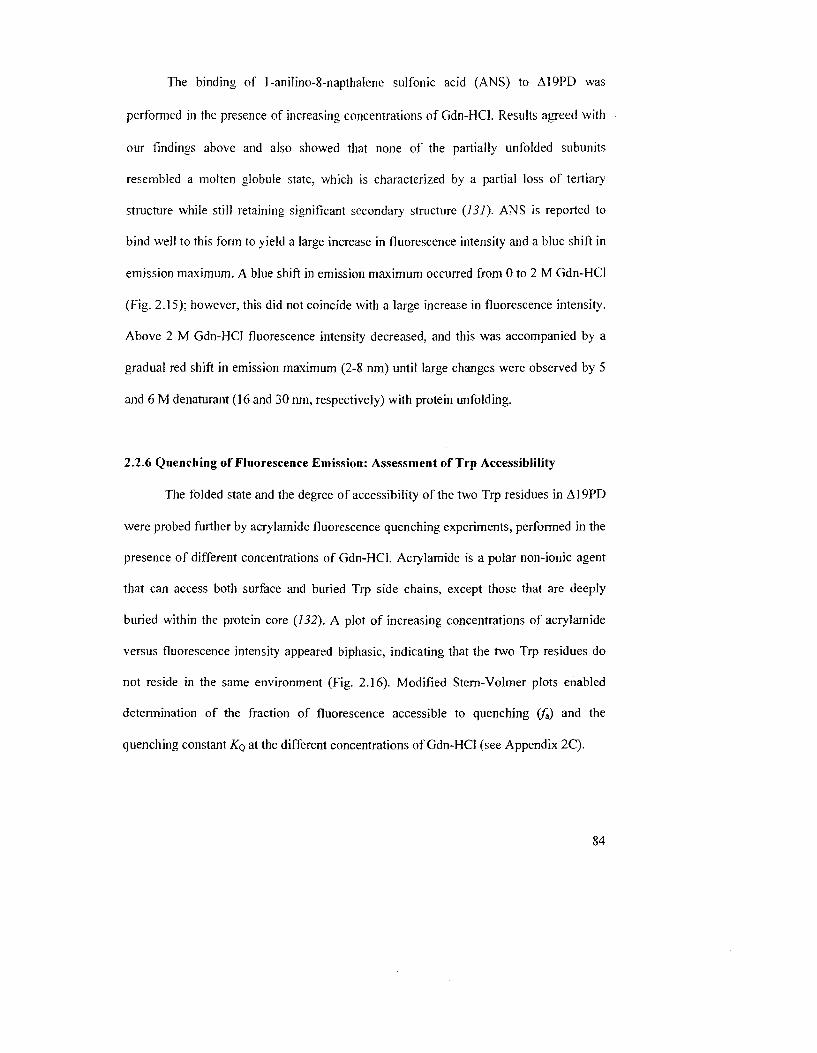
The binding of ]-anilino-8-napthalene sulfonic acid (ANS) to A19PD was
performed in the presence of increasing concentrations of Gdn-HCl. Results agreed with
our findings above and also showed that none of the partially unfolded subunits
resembled a molten globule state, which is characterized by a partial loss of tertiary
structure while still retaining significant secondary structure {131). ANS is reported to
bind well to this form to yield a large increase in fluorescence intensity and a blue shift in
emission maximum. A blue shift in emission maximum occurred from 0 to 2 M Gdn-HCl
(Fig. 2.15): however, this did not coincide with a large increase in fluorescence intensity.
Above 2 M Gdn-HCl fluorescence intensity decreased, and this was accompanied by a
gradual red shift in emission maximum (2-8 nm) until large changes were observed by 5
and 6 M denaturant (16 and 30 run, respectively) with protein unfolding.
2.2.6 Quenching of Fluorescence Emission: Assessment of Trp Accessibility
The folded state and the degree of accessibility of the two Trp residues in A19PD
were probed further by acrylamide fluorescence quenching experiments, performed in the
presence of different concentrations of Gdn-HCl. Acrylamide is a polar non-ionic agent
that can access both surface and buried Trp side chains, except those that are deeply
buried within the protein core (132). A plot of increasing concentrations of acrylamide
versus fluorescence intensity appeared biphasic, indicating that the two Trp residues do
not reside in the same environment (Fig. 2.16). Modified Stern-Volmer plots enabled
determination of the fraction of fluorescence accessible to quenching (fa) and the
quenching constant KQ at the different concentrations of Gdn-HCl (see Appendix 2C).
84
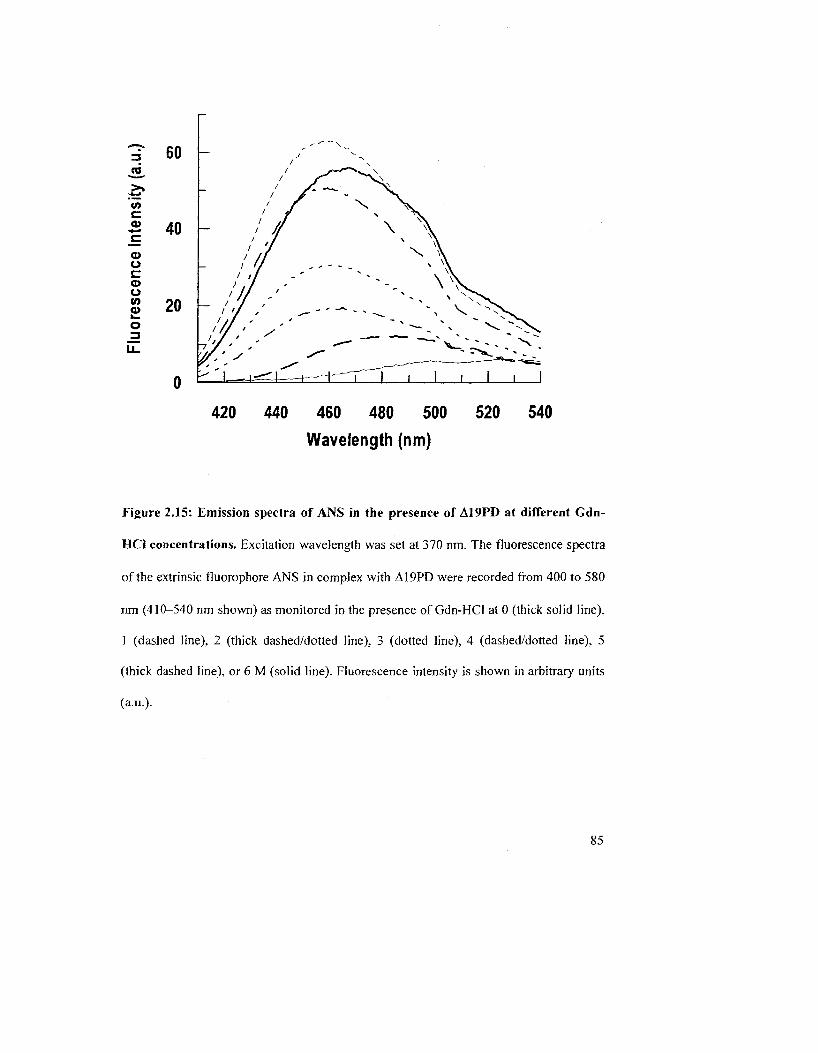
420 440 460 480 500 520 540
Wavelength (nm)
Figure 2.15: Emission spectra of ANS in the presence of A19PD at different Gdn-
HCI concentrations. Excitation wavelength was set at 370 nm. The fluorescence spectra
of the extrinsic fluorophore ANS in complex with A19PD were recorded from 400 to 580
nm (410-540 nm shown) as monitored in the presence of Gdn-HCl at 0 (thick solid line),
1 (dashed line). 2 (thick dashed/dotted line). 3 (dotted line), 4 (dashed/dotted line), 5
(thick dashed line), or 6 M (solid line). Fluorescence intensity is shown in arbitrary units
(a.u.).
85
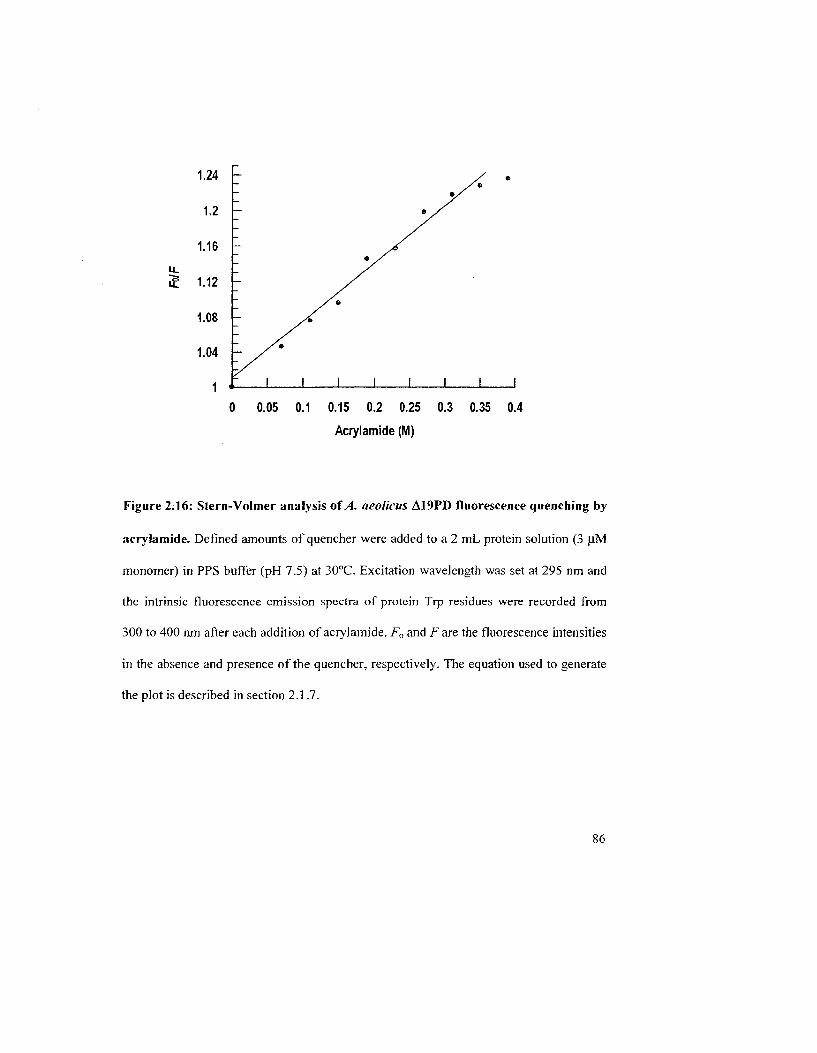
0 0.05 0.1 0.15 0.2 0.25 0.3 0.35 0.4
Acrylamide (M)
Figure 2.16: Stern-Volmer analysis of A. aeolicus A19PD fluorescence quenching by
acrylamide. Defined amounts of quencher were added to a 2 mL protein solution (3 uM
monomer) in PPS buffer (pH 7.5) at 30°C. Excitation wavelength was set at 295 nm and
the intrinsic fluorescence emission spectra of protein Trp residues were recorded from
300 to 400 nm after each addition of acrylamide. F0 and Fare the fluorescence intensities
in the absence and presence of the quencher, respectively. The equation used to generate
the plot is described in section 2.1.7.
86
Table 2.4: Stern-Volmer quenching constants and percentage of Trp fluorescence
quenched by acrylamide and KI in the presence of denaturant or substrates at 30°C.
Gdn-HCI (M) KQ (M ') fa (%)
0
1
2
3
4
6
Substrate
0.68(0.125)
0.99
0.94
1.23
1.55
7.34
tfQ(M-')
0.48 (0.05)
0.4
0.4
0.4
0.5
0.98
/a (%)
0.5uMNAD+ 0.71 0.45
300 HM Pre 0.135 0.06
Acrylamide and KI concentrations were varied from 0-0.35 M. Values for
constants for KI are shown in parentheses. NATA (6 pJVl) was used as a control and gave
a KQ value of 13.6 M"1 and zf3 of 1 with acrylamide. When 5 u\M NAD+ was added to the
sample, afa of 0 was obtained using acrylamide as a quencher.
87
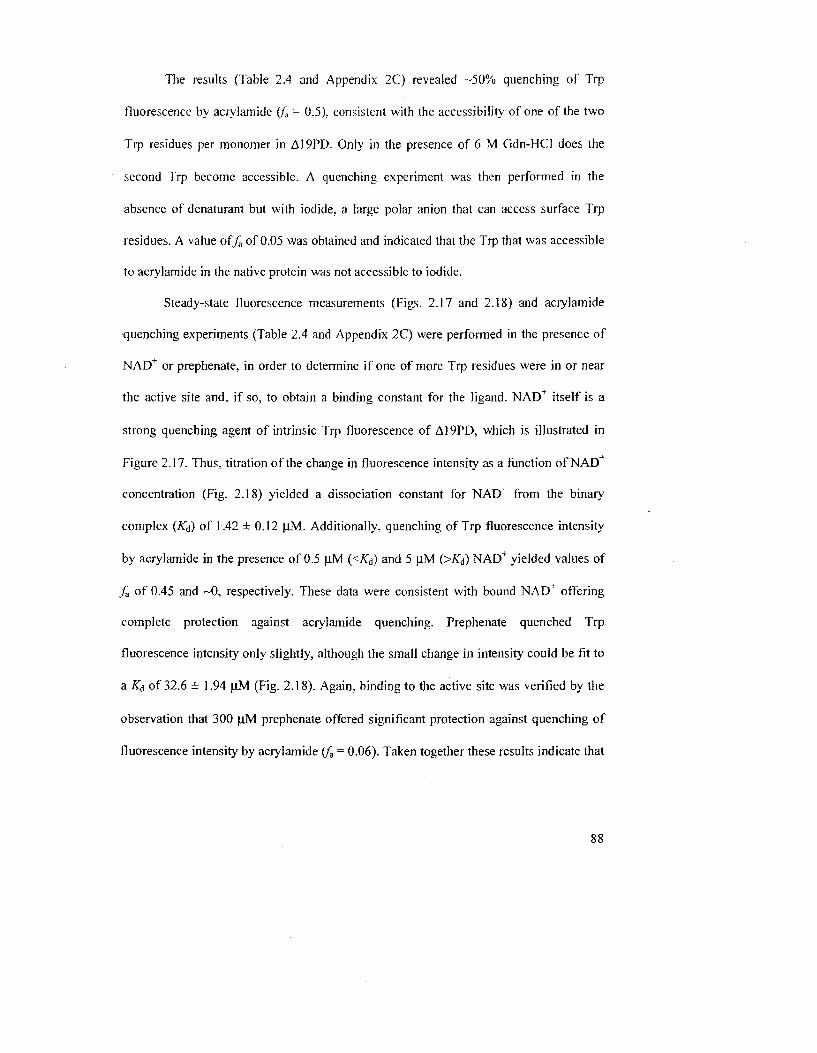
The results (Table 2.4 and Appendix 2C) revealed -50% quenching of Trp
fluorescence by acrylamide (fa = 0.5). consistent with the accessibility of one of the two
Trp residues per monomer in A19PD. Only in the presence of 6 M Gdn-HCl does the
second Trp become accessible. A quenching experiment was then performed in the
absence of denaturant but with iodide, a large polar anion that can access surface Trp
residues. A value of/, of 0.05 was obtained and indicated that the Trp that was accessible
to acrylamide in the native protein was not accessible to iodide.
Steady-state fluorescence measurements (Figs. 2.17 and 2.18) and acrylamide
quenching experiments (Table 2.4 and Appendix 2C) were performed in the presence of
NAD+ or prephenate, in order to determine if one of more Trp residues were in or near
the active site and, if so, to obtain a binding constant for the ligand. NAD itself is a
strong quenching agent of intrinsic Trp fluorescence of A19PD, which is illustrated in
Figure 2.17. Thus, titration of the change in fluorescence intensity as a function of NAD
concentration (Fig. 2.18) yielded a dissociation constant for NAD^ from the binary
complex {Ka) of 1.42 ± 0.12 jiM. Additionally, quenching of Trp fluorescence intensity
by acrylamide in the presence of 0.5 |iM {<KA) and 5 njvl {>Ka) NADT yielded values of
fa of 0.45 and ~0, respectively. These data were consistent with bound NAD+ offering
complete protection against acrylamide quenching. Prephenate quenched Trp
fluorescence intensity only slightly, although the small change in intensity could be fit to
a Kd of 32.6 ± 1.94 njvl (Fig. 2.18). Again, binding to the active site was verified by the
observation that 300 (jM prephenate offered significant protection against quenching of
fluorescence intensity by acrylamide (fa = 0.06). Taken together these results indicate that
88
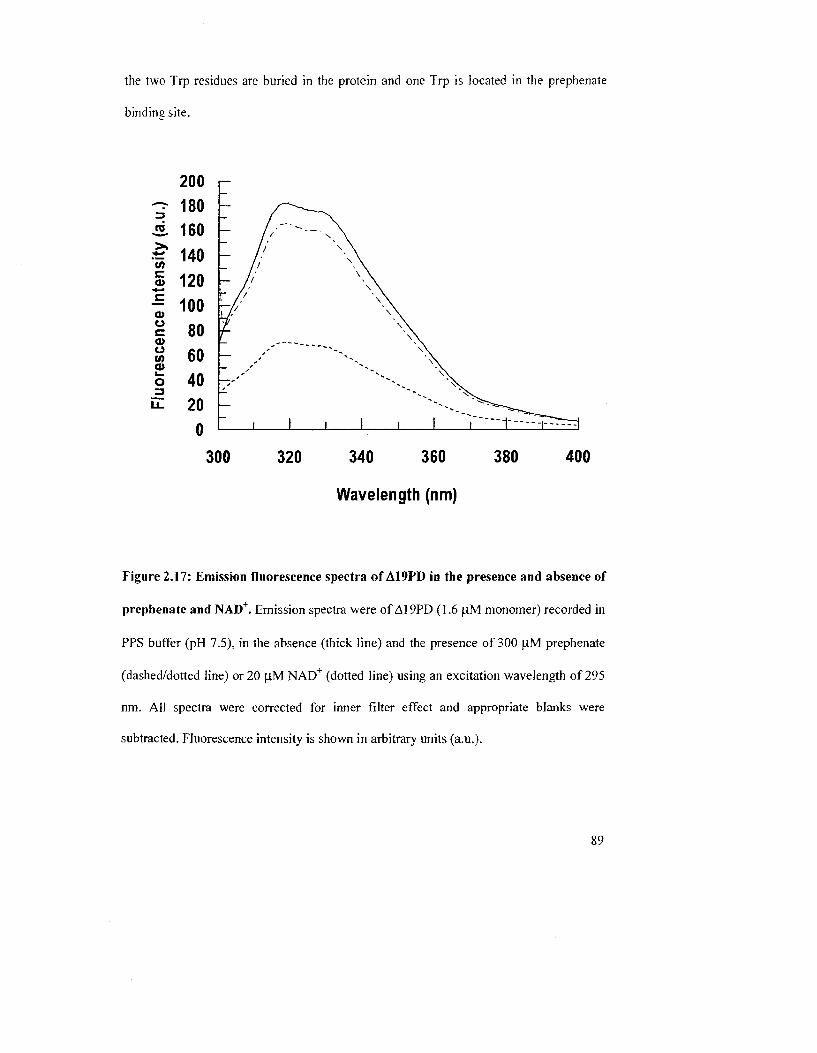
the two Tip residues are buried in the protein and one Trp is located in the prephenate
binding site.
3
sJS-
ity
0) c 0) **-» _c Q) O
0) o CO 0) 1_
o =3 LL
180
160
140
120
100
80
60
40
20
0
300 320 340 360 380 400
Wavelength (nm)
Figure 2.17: Emission fluorescence spectra of A19PD in the presence and absence of
prephenate and NAD+. Emission spectra were of Al 9PD (] .6 (J.M monomer) recorded in
PPS buffer (pH 7.5), in the absence (thick line) and the presence of 300 |iM prephenate
(dashed/dotted line) or 20 pjvl NAD+ (dotted line) using an excitation wavelength of 295
nm. All spectra were corrected for inner filter effect and appropriate blanks were
subtracted. Fluorescence intensity is shown in arbitrary units (a.u.).
89
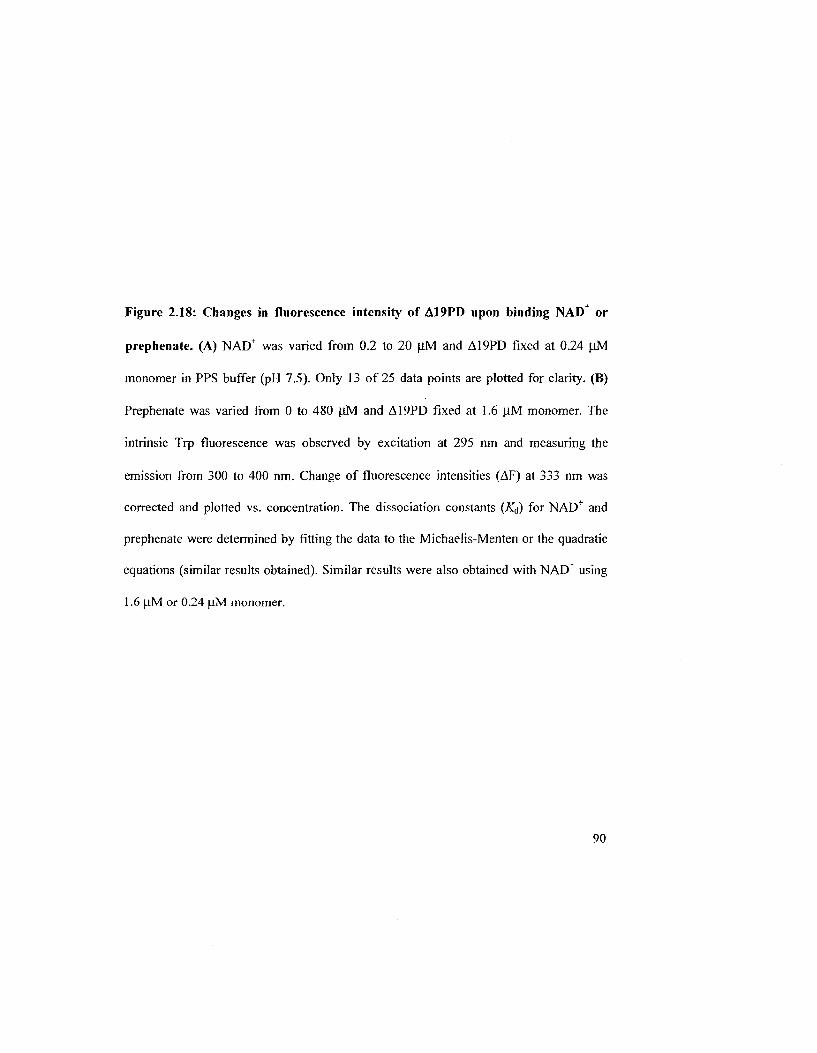
Figure 2.18: Changes in fluorescence intensity of A19PD upon binding NAD+ or
prephenate. (A) NAD+ was varied from 0.2 to 20 |ilM and A19PD fixed at 0.24 [lM
monomer in PPS buffer (pH 7.5). Only 13 of 25 data points are plotted for clarity. (B)
Prephenate was varied from 0 to 480 pjvl and A19PD fixed at 1.6 (tM monomer. The
intrinsic Trp fluorescence was observed by excitation at 295 nm and measuring the
emission from 300 to 400 nm. Change of fluorescence intensities (AF) at 333 nm was
corrected and plotted vs. concentration. The dissociation constants (Ka) for NAD+ and
prephenate were determined by fitting the data to the Michaelis-Menten or the quadratic
equations (similar results obtained). Similar results were also obtained with NAD+ using
1.6 pJVI or 0.24 u,M monomer.
90
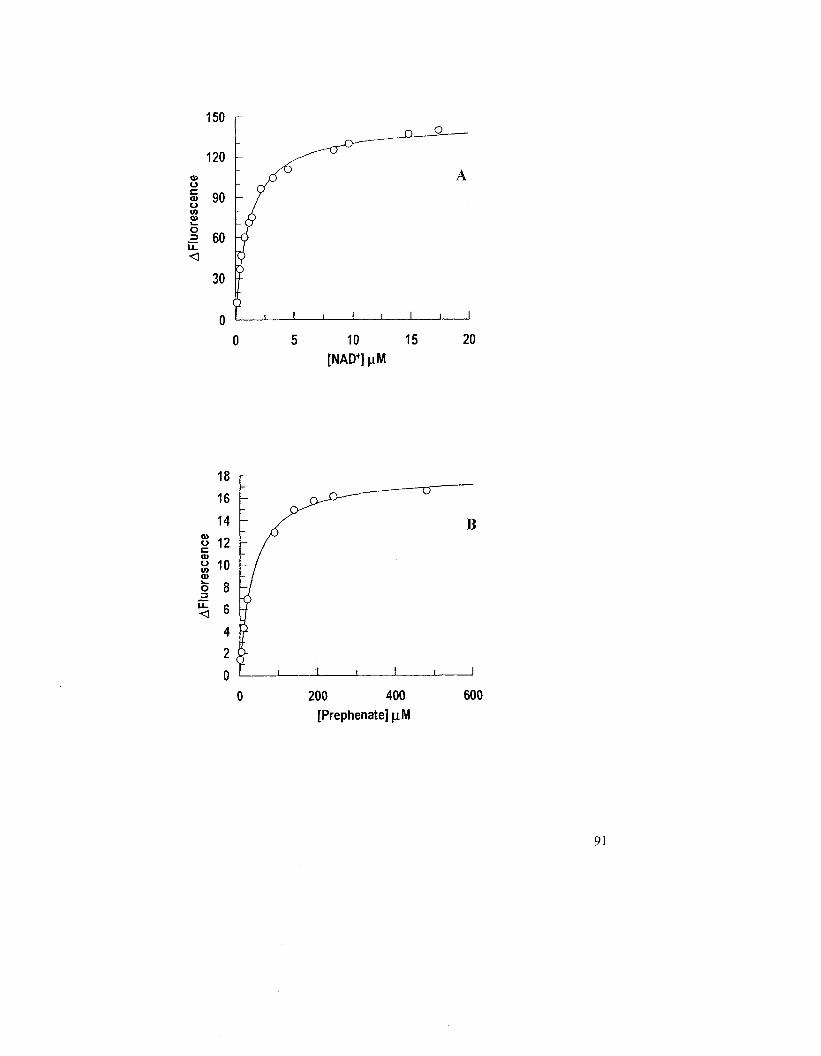
AF
Iuor
esce
nce
OM
^C
IC
OO
MJ
if
fl
O)
©
I—lO
CM
—f
VI—
I A
|—
I—|—
I—|—
1—|—
I—|
1—|
N3
—•.
©
TJ
©
(D
T
O zr
<D
3 QJ
(0
7z
©
©
©
W
^Flu
ores
cenc
e
NJ
l_
o
2.3 DISCUSSION
This chapter reports the biophysical characterization of recombinantly expressed
PD and A19PD. the N-termina]]y deleted variant of PD. from the hyperthermophilic
bacterium A. aeolicus. During the completion of these experiments, the crystal structure
of A19PD in complex with its cosubstrate NAD"1 was refined to 1.9 A resolution(^S),
yielding the first reported structure for a TyrA protein from any organism. Our
biophysical findings, now published in Protein Science(l 12) will be discussed in light of
this crystal structure as both bodies of work were prepared as companion papers.
Identification of stable domains ofPD
PD from A. aeolicus was heterologously expressed in E. coli as a fusion protein
with a 20-residue N-terminal extension that included a hexa-His tag to facilitate
purification by Ni-NTA affinity chromatography and a thrombin recognition site to allow
removal of the tag. In agreement with the studies by Aponte (7 06) and later by Sun et al.
(48) SDS-PAGE analysis of dimeric His-tagged PD as monitored during the course of
protein purification revealed two distinct species, a doublet comprising a full-length form
and shortened form resulting from an N-terminal cleavage. Aponte {106) proposed that
cleavage may have occurred in the absence of exogenously supplied thrombin by the
action of cellular proteases such as protein I] or protein Fa at the thrombin recognition
sequence (LVPRGS) within the fusion protein's tag (106). ES1-MS analysis of the
shortened form isolated in the present study however, revealed that the site of proteolysis
was instead downstream from the thrombin recognition site between Leu4 and Ser5 in the
TyrA sequence (Fig. 2.2). Additionally, it was shown that full-length PD could be
92
cleaved further, at Lys23 to an even smaller fragment of ~32 kDa when stored for an
extended period at 4°C or treated with trypsin —an outcome which also plagued the
variant Al 9PD. Thus, our findings are in agreement with those of Sun et al. (48) who
observed the same stable fragment by SDS-PAGE analysis following limited tryptic
digestion of PD. although they attributed the shortened form detected during protein
purification to this species as well. The insensitivity of the 32 kDa polypeptide to
complete tryptic digestion (Figure 2.1. and Sun et al. (48)) indicated that the residual
domain was likely tightly folded and its protease recognition motifs are not easily
accessible.
MALDl-ToF MS analyses of in-solution and in-gel tryptic digests of PD are also
consistent with the observation of an N-terminal deletion. The relatively high sequence
coverage afforded by our study (73%, Table 2.1) allowed assignment of the protease
susceptible region between residues 18 and 26 (numbered from PD's predicted start site).
We propose that cleavage by trypsin or by non-specific proteolysis could occur if
residues at the N-terminal region of PD are exposed and/or within regions of secondary
structure that adopt a mostly random conformation. As supporting evidence. Appendix
2D shows that the first 30 amino acids are confined to a polypeptide region predicted to
be rich in loops/unordered structure and. more importantly, precedes a structurally
conserved nucleotide binding motif (GXGXXG) commencing at amino acid 37.
Alternatively, as the N-terminus of PD expressed in the native organism has not been
demonstrated directly, it is possible that the authentic start site that can translate
functional protein is actually located further downstream (i.e. Met30) than that annotated
in the database. If so, the sensitive proteolytic targets might belong to an unstructured N-
93
terminal extension of PD. As expected, full-length PD did not yield quality diffraction
crystals no doubt because of its unstructured flexible N-terminal region. Nevertheless the
engineered A19PD. a construct which lacked the first 19 residues, yielded crystals
diffracting to a high resolution and was shown to be fully active. The later finding proved
serendipitous as purified variants A25PD and A28PD did not produce well ordered
crystals (48).
In-solution tryptic treatment of PD did not result in a complete digestion of the
protein as shown by SDS-PAGE analysis agreeing with results found by Christendat (48).
Better sequence coverage was obtained for both our group and Christendat's group when
using in-gel tryptic digestion (48) reported that but we failed to resolve the fragment
corresponding to residues 192-242. This fragment (>5 kDa) would likely be resolved
using sinapinic acid as a matrix for MALDI-MS analysis.
The architecture ofTyrA proteins: the importance of the dimer
Aponte reported earlier that A. aeolicus PD is dimeric (106). It is not surprising
then that an N-terminal deletion construct A19PD is also dimeric in its native state. This
conclusion, drawn from the results of sedimentation velocity centrifugation and size
exclusion chromatography (Table 2.3). agrees with the quaternary structure established
by solution studies for other purified monofunctional TyrA proteins, including arogenate
dehydrogenase from Synechocyslis (36), cyclohexadienyl dehydrogenases from P.
stutzeri (46), Z mobilis (39) and the genetically engineered monofunctional PDs from E.
coli (50) and E. herbicola (51). This arrangement is in contrast to that of E. coli CM-PDT
for which it has been established through gel filtration experiments of independently
94
expressed domains that dimerization is only through adjacent subunits within the mutase
portion of this bifunctional enzyme (70).
Our solution studies are in keeping with the crystal structure of dimeric A19PD
complexed with NAD (Chapter 1, Fig. 1.10). Each A19PD monomer consists of an N-
terminal domain which comprises the a/p dinucleotide-binding domain (represented by a
Rossman fold) and a novel a-helical C-terminal domain which is involved in subunit
dimerization (Chapter 1. Fig. 1.11). Quaternary structure is a biological necessity if the
active site of the enzyme comprises residues contributed by adjacent monomers. Indeed,
the crystal structure shows that the active site associated with each monomer is formed at
the interdomain cleft of the NAD -binding domain and C-terminal domain and contains
residues which are shared between monomers (Fig. 2.12). The dimerization domain is
held by criss-cross and pair-wise interactions of helical pairs from the C-terminal domain
(48). This configuration has also been reported for AD from Synechocystis, a structure
whose protein in complex with NADP+ was published shortly after that of PD. Although
the primary sequence of the two enzymes are significantly different (only 27% identity),
and their crystal growth conditions unique (AD was crystallized at neutral pH while PD
was crystallized at pH 3.2 and represents a catalytically inactive form of the enzyme (data
not shown)), their overall global architecture is remarkably similar (See Figure 3,
Legrand et al .{43)) and likely common amongst all TyrA proteins.
The pathway of unfolding
The crystal structure of A19PD reveals that the dimerization interface is supported mainly
by hydrophobic interactions between monomers (Chapter 1, Fig. 1.10). The helical pair
95
formed by helices a8 and a8 : found at the core of the dimer interface is highly buried
and provides most of the these hydrophobic contacts (48). Accordingly, the results of
tryptic digests of PD as analyzed by MALDl-ToF MS could be interpreted in light of this
structural feature. Our inability to resolve the fragment corresponding to residues 192-
242 is in keeping with the observation that these residues are located on helix Cc8 of each
monomer and at the core of the dimer interface (48) rendering them inaccessible to
proteases.
The site of dimerization should contribute greatly to the stability of the dimer.
Accordingly, Gdn-HCl-induced denaturation commences with the unfolding of the dimer
as monitored by the noncoincidence of changes in tertiary and secondary structure (Fig.
2.13) and by size exclusion chromatography (Fig. 2.14) performed in the presence of
increasing concentrations of denarurant. This pathway of unfolding is in contrast to that
reported for many other dimeric enzymes, for example enolase (133), for which
dissociation of the dimer precedes denaturation. Interestingly, E. coli CM-PD is also
predicted to contain an a-helical rich dimerization domain within the C-terminal region
of the protein (PredictProtein (129)) (Appendix 2D) and has been reported previously to
unfold significantly before dissociation into monomers (53). Results in the present study
suggest that the a-helical structure of A19PD is very stable to Gdn-HCl denaturation; A/2
of 4.8 M is about twice that reported for E. coli CM-PD under similar conditions (53).
However, size exclusion chromatography revealed that this increased stabilization stems
from, in part, retention of PD's secondary structure as an oligomeric species at the higher
concentrations of denarurant (Figure 2.14). No stability studies have been reported for
mesophilic monofunctional PDs. For comparison, however, a report contrasting
96
monofunctional CMs from E. coli and from the thermophilic archae Methanococctis
jannaschii (both of which are highly a-helical) also showed that the dimeric proteins
unfolded substantially before dissociation into unfolded monomers in the presence of
Gdn-HCl (134). Thermophilic CM, with a D]l2 of -4.8 M. was calculated to be more
stable than the mesophilic protein by ~5 kcal/mol, by fitting coincident CD and
fluorescence data to a 2-state model.
Even low concentrations of chemical denaturant cause marked changes in protein
structure. It has been reported that thermophilic enzymes display a very low catalytic rate
at ambient temperatures due to insufficient flexibility in their active sites (135). Addition
of low concentrations of Gdn-HCl to A19PD resulted in over a twofold increase in
specific activity at ambient temperature (Figure 2.10), and a fourfold increase in Km for
prephenate, perhaps due to increased flexibility at the active site. Similar results have
been reported for other thermophilic enzymes upon the addition of low concentrations of
urea or Gdn-HCl (136-141). Moreover, changes in protein conformation within the
hydrophobic NAD+-binding pocket of PD, induced by low denaturant concentrations, can
be illustrated by the coincidence of a decrease in Km for NAD+ with an increase binding
of the amphiphilic dye ANS (Figure 2.15); it has been reported previously that ANS has
affinity for such nucleotide-binding sites (142, 143).
A. aeolicus PD is thermally stable
When considering A. aeolicus' classification as a hyperthermophiiic bacterium
(144), it is not surprising then that the melting temperatures (Tm) of PD and A19PD were
greater than 100°C as deduced by CD spectropolarimetry. Even the addition of 3 M Gd-
97
HC1 to the enzyme preparation, during variable temperature (VT) CD experiments did
not lower the Tm value (data not shown), as the presence of the denaturant likely
promoted protein aggregation (Figure 2.14), precluding a cooperative thermal transition
at a lower temperature. However. Aponte reported a Tm value of 108°C in the absence of
denaturant for PD using variable pressure-capillary differential scanning calorimetry
(DSC) {106}. For comparison, an apparent Tm of 57°C was obtained for E. coli CM-PD
{106). Differences in 7^ values of the same magnitude have also been reported using
DSC for a hyperthermophilic archaeal acylphosphatase from Pyrococcus horikoshii
versus its mesophilic counterparts {135). Of note, the Tm obtained for CM-PD by DSC
was in agreement with values of ~56CC determined by VT-CD measurements reported in
this study and ~57°C by VT-Fourier transformed infrared (VT-FTIR) spectroscopy {106),
even though the experimental conditions were markedly different.
What is the basis for the thermal stability of A. aeolicusl Analysis of many
thermophilic proteins and their corresponding mesophilic homologues have highlighted
such differences as enhanced packing, additional salt bridges and hydrogen bonds or a
better arrangement of ionic interactions, abbreviated loops, and restriction of
conformational freedom introduced by proline residues {145, 146). However, a more
recent analysis of structures and sequences of several hyperthermostable proteins indicate
that some proteins employ a "structure-based" mechanism for thermostabilization; they
are significantly more compact and hydrophobic than their mesophilic homologs, and
come from organisms such as hyperthermophilic archaea that originated in an extreme
environment. In contrast, other proteins use a "sequence-based" mechanism; instead of
showing significant structural differences from mesophile, they show a defined number
98
of strong interactions, such as ion-pair or H-bonding networks. These protein come from
mesophilic organisms that later recolonized hot environment (109). Their ultimate
strategy depends on evolutionary history of the organism. A. aeolicus is unusual in that it
is a deeply branched hyperthermophilic bacterium, separated from the rest of bacteria
kingdom at early stages of evolution and located closer to archaea.
An extensive analysis of proteins from hyperthermophilic and mesophilic
organisms showed that a larger proportion of charged versus polar (uncharged) amino
acids is a signature of many hyperthermophilic organisms (108, 145, 146). Moreover, the
proportion of solvent accessible charged residues at the protein surface markedly
increased at the expense of polar residues. A. aeolicus PD houses a significantly higher
proportion of lysine and glutamate residues (10.6% and 8%, respectively) than found in
the PD portion of is. coli CM-PD (3.7% and 5.9%. respectively, for example). In fact, the
crystal structure of A19PD complexed with NAD+ (48) reveals a large ionic network
formed by Glu275, Glu278 and Lys285 from one subunit and the same residues from the
other subunit, a structural feature which Christendat and coworkers speculate may
contribute to the thermostability of the enzyme. Other parameters noted with elevated
thermostability and thermal activity of proteins are an increased number of strategically
located proline residues, as seen CM from T. thermophilics (87). or a number of leucine to
isoleucine substitutions, noted for M. jannaschii CM (134). However, sequence analysis
of A. aeolicus PD does not appear to support these strategies. Interestingly, our
sedimentation velocity data from AUC yield a low frictional coefficient of 1.22 for A.
aeolicus PD suggestive of a compact protein core. Moreover, VT-FTIR results (106)
support this observation in showing slow H/D exchange at high temperatures, which
99
would have likely continued well past 95CC degrees except for instrument limitations. It
would be interesting to speculate that A. aeolicus PD might have adopted elements of
"sequenced-based" (ion pairs. H-bonding) and "structure-based" (packing) mechanisms
for its thermostabilization of PD (109).
Quenching of fluorescence emission corroborates crystallographic data
Results from fluorescence experiments have provided important structural
information concerning A. aeolicus PD prior to the availability of crystallographic data.
Now our findings can be interpreted in terms of the structure of A19PD complexed with
NAD+ (48). although it should be considered that the conformation of the free protein
may be different than in its liganded state. Trpl90, on helix-7, is part of a fr-ai-fig motif
which is appended to the central P-sheet of the NAD'-binding site, and its side chain is
buried in the core of the main Rossman fold. Trp259, on helix-] 1 in the C-terminal
domain, is one of several residues lining the wall of the prephenate binding pocket in the
shared active site, and is -16 A from Trpl90. Neither Trp259 nor Tip] 90 are surface-
exposed within the dimer (Fig. 2.19). in keeping with the substantially blue-shifted
emission maxima relative to Trp free in solution and their inaccessibility to quenching by
KI. Of the two, Trpl90 is completely buried and is not accessible to quenching by
acrylamide. Furthermore, Gdn-HCl-induced oligomerization may prevent Trp 190 from
becoming solvent-accessible until substantia] protein unfolding at 6 M denaturant (Table
2.4). As expected, catalytically relevant portions of prephenate and NAD+ are in close
proximity. The side chain of Trp259 is within 5 A of either substrate, and that of Trp] 90
about ~8 A and ]2 A from NAD" and prephenate. respectively (Fig. 2.20). Accordingly,
100
changes in fluorescence intensity emission occur with the binding of either NAD" or
prephenate to the free enzyme. This characteristic has allowed the calculation of
dissociation constants of substrates from the enzyme-substrate binary complex, the
importance of which will be discussed in Chapter 3. It is likely that the binding of either
substrate can prevent quenching of Trp259 emission by acrylamide. Deciphering the
contributions of individual Trp residues awaits analysis of site-directed variants.
In the next chapter, we will explore further the effects of temperature on enzyme
function and have extended our structure-function studies to the active site of the enzyme.
Key targets for site-directed mutagenesis were identified using the crystal structure as a
guide, as well as the results from biophysical studies presented above and from sequence
alignments of several mono- and Afunctional TyrA proteins. Our studies will show that
kinetic and biophysical characterization of these variant proteins help to establish the
importance of selected residues in PDTs catalytic mechanism (binding or catalysis) or/and
in the mode of regulation by L-Tyr.
101
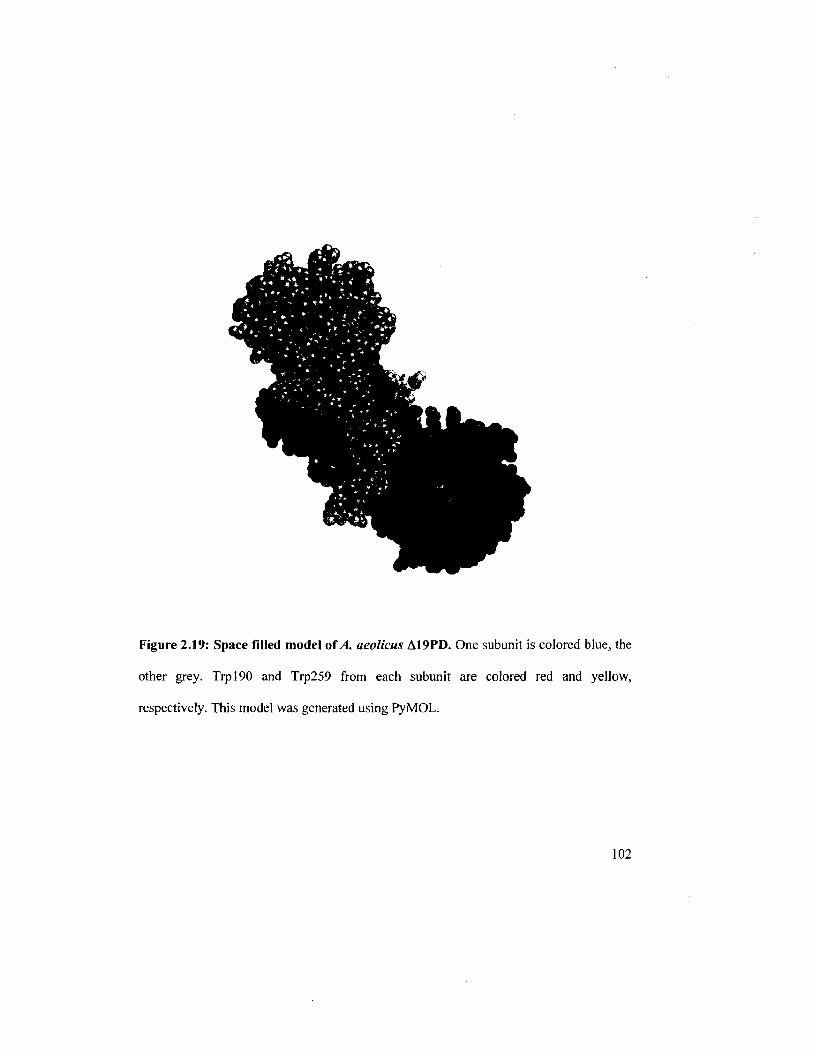
Figure 2.19: Space filled model of A. aeolicus A19PD. One subunit is colored blue, the
other grey. Trpl90 and Trp259 from each subunit are colored red and yellow,
respectively. This model was generated using PyMOL.
102
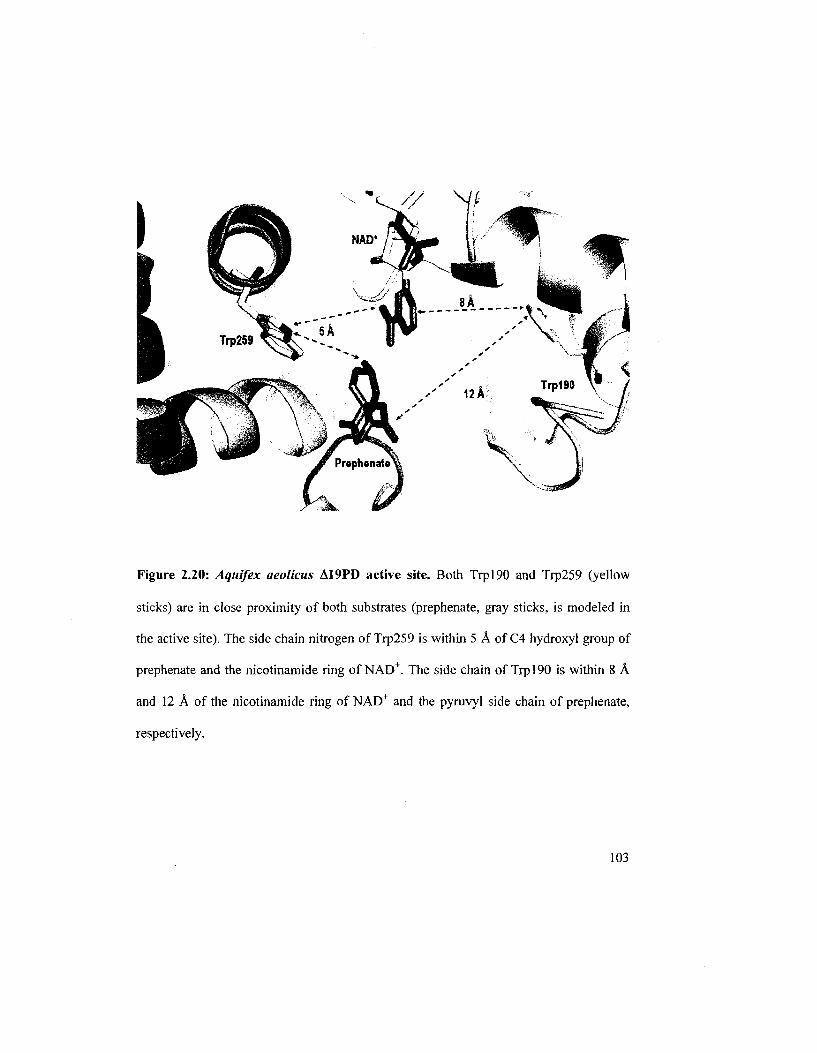
Figure 2.20: Aquifex aeolicus A19PD active site. Both Trpl90 and Trp259 (yellow
sticks) are in close proximity of both substrates (prephenate, gray sticks, is modeled in
the active site). The side chain nitrogen of Trp259 is within 5 A of C4 hydroxyl group of
prephenate and the nicotinamide ring of NAD+. The side chain of Trpl90 is within 8 A
and 12 A of the nicotinamide ring of NAD+ and the pyruvyl side chain of prephenate,
respectively.
103
Chapter 3
Kinetic Characterization of WT and Variant PDs
from Aquifex aeolicus
104
3.0 INTRODUCTION
Only few monofunctional TyrA proteins have been characterized in the purified
form. These include dehydrogenases from Zymomonas mobilis (39). Pseudomonas (46,
147). Synechocystis sp. PCC 6803 (36). Arabidopsis thaliana (49) and Neisseria
gonorrhoeae (99). These studies have centered mainly on delineation of their substrate
specificity, as some utilize both L-arogenate and prephenate as a substrate while others
use only L-arogenate or only prephenate. However, biochemical analyses of PD from E.
coli CM-PD have provided the basic framework for understanding the molecular
mechanism of the TyrA enzymes (52, 53). Initial velocity, product and dead-end
inhibition studies and isotope trapping studies have established that the kinetic
mechanism of E. coli PD conforms to a rapid equilibrium, random kinetic mechanism
with catalysis as the rate-limiting step (63). Similar kinetic mechanisms have been
proposed for ADs from A. thaliana (40) and Synechocystis sp. (43). although through the
analysis of less rigorous experiments. In contrast, a steady-state random kinetic
mechanism, with preferred order (L-arogenate binding first) has also been suggested for
AD from Synechocystis sp. by Bonner et al. (36). A model for the catalytic mechanism of
the E. coli PD activity has been put forward (refer to Fig. 1.8) based on the results of pH
profiles and inhibition studies on wild-type and variant proteins (52, 53). Briefly, the
guanidino group of Arg294 interacts electrostatically with the ring carboxylate of
prephenate in the enzyme-NAD+ binary complex, while Hisl97, the key catalytic group
of the reaction, polarizes the 4-hydroxyl group of prephenate by lowering the activation
barrier to assist hydride transfer to NAD+ and concomitant decarboxylation (53).
105
The structures of PD from Aquifex aeolicus (48) and AD from Synechocystis sp.
(43) have been reported, both proteins in complex with their preferred nucleotide
cosubstrate and modeled with the appropriate cyclohexadienyl substrate in the active site.
Analyses of these structures have provided positional information on the conserved
histidine and arginine residues, although in some cases contradict the findings of the
solution studies on the E. coli enzyme. The results of structural analysis must be
corroborated by solution studies on site-specific variants on PD from A. aeolicus and
Synechocystis. The structure of A. aeolicus PD has also led to the identification of other
active site residues, that might play important mechanistic roles, most notably Serl26,
which Sun et al. proposes promotes catalysis by orienting the catalytic histidine and the
nicotinamide moiety of NAD+ in their most catalytically efficient conformations (48).
Moreover, these authors proposed that access to the active site is regulated by a gated
mechanism, which involved an ionic network consisting of Glul53-Arg250-Asp247' of
which both Arg and Glu residues are conserved amongst all species. There is a pressing
need to obtain structural data with prephenate or prephenate analogues bound in the
active site as the full complement of interactions between prephenate and TyrA proteins
are still largely unknown,
Preliminarily kinetic studies of PD from A. aeolicus have been reported by R.
Aponte (106). We have extended Aponte's work in this present chapter and report the
kinetic parameters of the reaction catalyzed by A19PD, the crystallizable form of the
enzyme. We have established whether the enzyme from A. aeolicus can utilize L-
arogenate as a substrate in addition to prephenate and we compare the variation of the
kinetic parameters with temperature for both the Al 9 and full-length forms of PD.
106
Another goal of this study was to investigate the role of active site residues as a
step towards further understanding of the PD-catalyzed reaction. Accordingly, our
collaborators have carried out cocrystallization studies of A. aeolicus A19PD-NAD in
complex with HPP, with 4-hydroxyphenylpropionate (HPpropionate). a product
analogue, and with Tyr (manuscript submitted). Structures were solved at neutral pH and
at a resolution of 2.15 A. 2.25 A and 2 A, respectively. These three-dimensional
structures of A19PD have served as guides to target active site residues, which we
consider important for the PD mechanism. We have investigated the role of Serl26,
Hisl47. Glul53. His217. Asp247 and Arg250 through the kinetic analysis of site-directed
variants correlated with structural analysis of the cocrystal complexes.
3.1 EXPERIMENTAL PROCEDURES
3.1.1 Materials
Prephenate and chorismate were obtained as outlined section 2.1.1 while L-
arogenate (barium salt) was a generous gift from Dr. C. Bonner. NAD+ and NADP+ (free
acid) were obtained from Roche. Hydroxyphenylpropionate and 4-hydroxyphenylpyruvic
acid were from Sigma. High purity of the substrates was confirmed by either mass
spectrometry or NMR. Concentrations of stock substrate solutions were determined using
published extinction coefficients (115) and/or enzymatic end-point analysis. All other
chemical reagents were obtained commercially and were of the highest quality available.
Reagents and enzymes for molecular biology were provided by Stratagene, New England
Biolabs, and Promega. E. coli strains DH5a (Life Technologies Inc.) and BL21(DE3)
Gold (Stratagene) were used for plasmid production and for protein expression,
107
respectively. All relevant portions of constructed plasmids were confirmed by DNA
sequencing through the facilities at Bio S & T, (Montreal, Canada). Recombinant E. coli
CM-PD was generously provided by J. Manioudakis (refer to section 2.1.1).
3.1.2 Preparation of a Stock Solution of 4-Hydroxyphenylpyruvate
Solution of the keto form of 4-hydroxyphenylpyruvate was prepared as described
by Lindblad et al. {148) but with slight modifications. Briefly, a solution of 0.1 M of 4-
hydroxyphenylpyruvic acid in methanol was purified by shaking with activated charcoal.
The solution was filtered through a 0.22 u_m syringe filter (Millipore). An equal volume
of ] M potassium hydroxide (KOH) in methanol was added to the solution, and then
supplemented with activated charcoal. The solution was kept on ice with gentle stirring
for 30 min then filtered again. The filtrate was left to crystallize for 4 h on ice. The
resulting crystals were washed four times with 2 mL methanol then dried overnight at
4°C in a dessicator in vacuo over P2O5. The crystals were resuspended in 50 mM HEPES,
150 mM NaCl at pH 7.5 (reaction buffer). When the crystals were dissolved in the
reaction buffer, an ultra-violet spectrum of the keto form of 4-hydroxyphenylpyruvate
and the concentration of the solution were obtained (£276™= 2 mM"1. cm"1) (149). A stock
solution of HPPropionate was prepared in 50 mM HEPES, 150 mM NaCl at pH 7.5
(reaction buffer) just prior to use and its concentration was determined
spectrophotometrically.
108
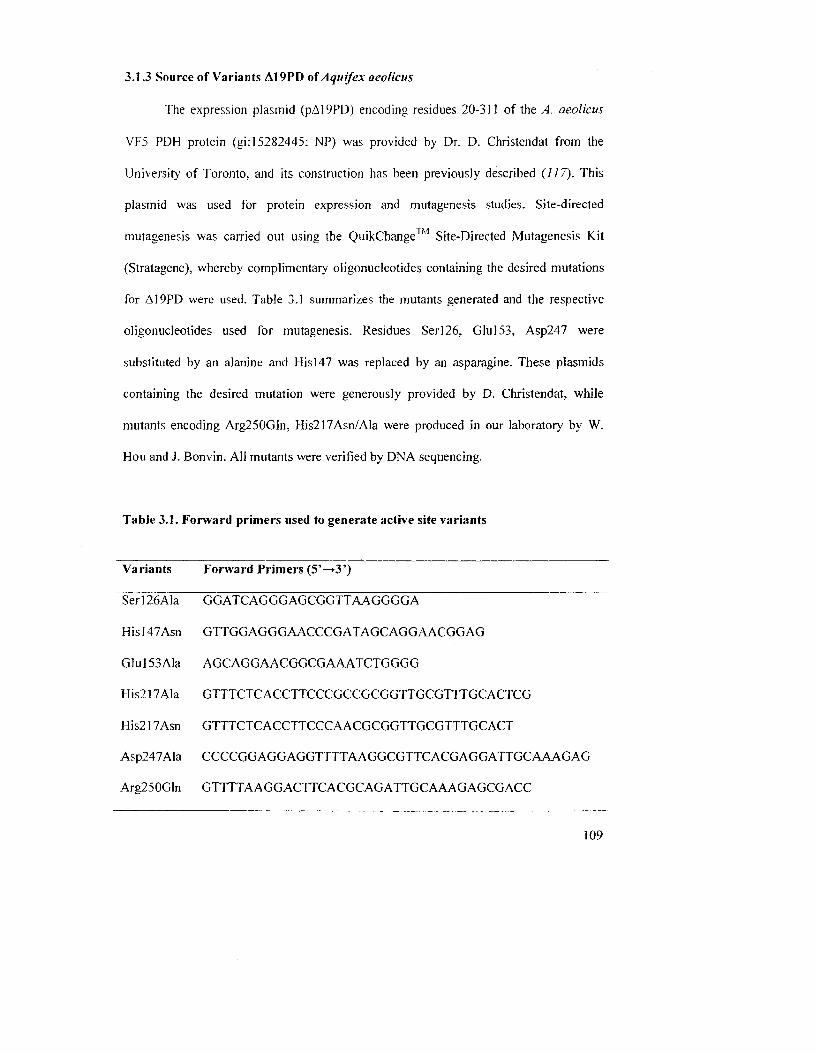
3.1.3 Source of Variants Al 9PD of Aquifex aeolicus
The expression plasmid (pA19PD) encoding residues 20-311 of the A. aeolicus
VF5 PDH protein (gi: 15282445: NP) was provided by Dr. D. Christendat from the
University of Toronto, and its construction has been previously described (777). This
plasmid was used for protein expression and mutagenesis studies. Site-directed
mutagenesis was carried out using the QuikChange™ Site-Directed Mutagenesis Kit
(Stratagene), whereby complimentary oligonucleotides containing the desired mutations
for A19PD were used. Table 3.1 summarizes the mutants generated and the respective
oligonucleotides used for mutagenesis. Residues Serl26, Glul53, Asp247 were
substituted by an alanine and Hisl47 was replaced by an asparagine. These plasmids
containing the desired mutation were generously provided by D. Christendat, while
mutants encoding Arg250Gln, His217Asn/Ala were produced in our laboratory by W.
Hou and J. Bonvin. All mutants were verified by DNA sequencing.
Table 3.1. Forward primers used to generate active site variants
Variants Forward Primers (5'—>3')
Serl26Ala GGATCAGGGAGCGGTTAAGGGGA
Hisl47Asn GTTGGAGGGAACCCGATAGCAGGAACGGAG
Glul53Ala AGCAGGAACGGCGAAATCTGGGG
His217Ala GTTTCTCACCTTCCCGCCGCGGTTGCGTTTGCACTCG
His217Asn GTTTCTCACCTTCCCAACGCGGTTGCGTTTGCACT
Asp247Ala CCCCGGAGGAGGTTTTAAGGCGTTCACGAGGATTGCAAAGAG
Arg250Gln GTTTTAAGGACTTCACGCAGATTGCAAAGAGCGACC
109
3.1.4 Expression and Purification of Recombinant and Variant Enzymes
Recombinant A. aeolicm PD and A19PD (-10 U/mg and 27 U/mg respectively)
were expressed and purified as described section 2.1.2. Variant proteins were expressed
as for A19PD and were purified as described section 2.1.2 with slight modifications. The
heat step was omitted to minimize possible thermally induced denaturation of variant
proteins. Samples loaded onto a 15 mL Superflow™ Ni-NTA column were washed with
at least 400 mL of buffer A containing 30 mM imidazole. The eluate was analysed
spectrophotometrically at OD280 and by Bio-Rad Protein Assay Kit (Bio-Rad
Laboratories) to confirm that all undesired proteins were removed from the column.
Bound protein was eluted with buffer A containing 300 mM imidazole and the remaining
steps of purification and storage of the enzymes were as described in section 2.1.2. All
protein purification steps were carried out at 4°C. Purified proteins were examined by
SDS-PAGE to monitor any proteolysis of the protein variants during purification. The
exact masses of variant proteins from A. aeolicus A19PD were confirmed by ESI-MS
analysis and samples were prepared and analyzed as described in section 2.1.5.1.1
3.1.5 Determination of Enzyme Activity and Protein Concentration
The oxidative decarboxylation of prephenate or L-arogenate in the presence of
NAD^ was followed at 340 nm as outlined in section 2.1.4, while the conversion of
chorismate to prephenate was monitored at 274 nm (119). The reactions (total volume 1.0
mL) were monitored continuously by using a Varian Cary 50 spectrophotometer,
equipped with a thermostated cuvette holder. When performed at 30°C and 55°C, the
standard activity assays were performed as outlined in section 2.1.4. For assays
110
performed at 80°C and 95°C. the preincubation times for the enzyme and NAD were
reduced to I min and 15 s. respectively.
Steady-state kinetic parameters ka, and Km were calculated at 30°C. 55°C and
80°C for the WT enzyme from the initial rates using a minimum.of six substrate
concentrations ranging from one-half up to at least 7-fold Km. Concentrations of
prephenate (seven times Km) and NAD" (2 mM) were present when used as the fixed
substrate. Protein ranged from 1 to 30 |ig. Reactions with L-arogenate were initiated with
enzyme after preincubation of reaction buffer and substrates at the desired temperature
for 2 min. Values of steady-state kinetic parameters k^, and Km were obtained by fitting
initial velocity data to the appropriate rate equations as outlined section 2.1.4.
Turnover numbers were calculated using subunit molecular weights (kDa) of
37.01 (full-length PD), 35.13 (thrombin-cleaved PD), 36.88 (heterodimeric PD), and
33.19 (A19PD) and the corresponding molecular weight for each variant proteins,
assuming one active site per monomer.
Enzyme half-life was determined by incubating enzyme (1 mg/mL in assay
buffer) in capped Eppendorf tubes at 95 °C and 70°C {A. aeolicus PD and A19PD) or at
40°C (E. coli CM-PD). For CM-PD, buffer was supplemented with 25% glycerol (v/v).
Samples were removed at different time intervals, cooled on ice, centrifuged for 5 min,
and residual activity of the supernatant was determined by the standard assay at 55°C
(PD) or 30°C (CM-PD). Protein concentration was determined after centrifugation in
order to calculate specific activities.
Protein concentration was estimated using the Bio-Rad Protein Assay Kit (Bio-
Rad Laboratories) with bovine serum albumin (Sigma) as a standard.
I l l
3.1.6 Effect of Temperature on Dehydrogenase Activity of A. aeolicus PD, A19PD
and E. coli CM-PD
Assays were performed in the standard reaction mixture using 2.5 tol 5 ug/mL of
A. aeolicus PD or A19PD, and reaction rates were recorded from 30°C to 95°C with 1
mM prephenate and 2 mM NAD^. E. coli CM-PD was examined between ] 7°C and 56°C
in 3-component buffer (pH 7.5) containing ] mM DTT. ) mM prephenate and 2 mM
NAD+. From the data, Arrhenius plots were obtained; activation energy (E3) values were
calculated from the slop and kca, deduced by linear extrapolation using the following
equation:
*=A * exp(-£a/RT) (3.1)
where k is the rate constant, £a is the activation energy (kJ-mof'), R is the universal gas
constant (8.314 x 10"3 kJ.moP'.K"1) and T is the temperature in Kelvin. Activity
measurements and spectra] scans performed on 50, 500 and 1000 uM samples of
prephenate and NAD+, heat-treated for up to 5 min, verified that there was not significant
decomposition of the substrates (~2% at 95°C) during recording of initial rates.
3.1.7 Effects of pH, NaCl and Divalent Metal Ions on the PD Activity
The effect of NaCl on the PD activity was monitored using 10 solutions of 2X
reaction buffer containing increasing concentrations of salt (0-2 M). The pH of each
buffer was checked and adjusted to pH 7.5 with NaOH as necessary. Reactions were
performed at 55°C as described in section 3.1.4, but with both substrates added in the
112
second step at fixed concentrations of 4 mM NAD and 0.8 mM prephenate. The reaction
was initiated with 10 ug of A19PD.
The pH optimum for A. aeolicus PD and A19PD activities was determined at
55°C by measuring specific activity between pH 3.2 and 9.8. Assays were performed in a
3-component buffer system of 0.05 M 2-morpholinoethanesuIfonic acid (MES). 0.05 N-
ethylmorpholine (NEM). 0.1 M diethanolamine containing 0.15 M NaCl. NAD+ and
prephenate concentrations were kept fixed at 4 mM and 0.8 mM. respectively.
The effect of divalent metal ions on the PD activity for both A. aeolicus PD and
A19PD was measured at 55°C as outlined section 2.1.4 using either EDTA (0-1 mM),
MgCh and ZnCb (0-25 mM) or 2 mM C0CI2 NAD+ and prephenate concentrations were
kept fixed at 4 mM and 0.8 mM, respectively.
3.1.8 Steady-State Velocity Patterns of the A. aeolicus PD-Catalyzed Reaction
Variation of initial velocity of A. aeolicus PD reaction as a function of the
concentration of prephenate and NAD+ was investigated. Initial rates were recorded at
55°C in a reaction buffer of 50 mM HEPES, 150 mM NaCl, (pH 7.5) as outlined section
2.1.4. Prephenate was varied from 49-493 \iM at fixed concentrations of NAD+ of 35, 70.
140 and 350 uM. Similarly, NAD+ was varied from 30-495 p.M at fixed concentrations of
prephenate of: 49, 102, 145 and 495 (iM. Experimental conditions for D19PD are
described in Appendix 3E. The data were fit to the equation describing a sequential
kinetic mechanism, v = VAB/(KizKb + KzB + KbA + AB), to yield values for V the
maximum velocity, Ka and K\,, the Michaelis constants for the substrates A and B, and K™
is the dissociation constant from the enzyme-A complex.
113
Initial velocities recorded in the presence of HPP and HPpropionate were
measured at 55°C in reaction buffer as previously described in section 2.1.4. Prephenate
was varied from one-half to 5 x Km at fixed concentrations of HPP (107. 535 and 1070
pJVJ) or HPpropionate (250? 500 and 1000 U.M). NAD~ was kept constant at 2 mM.
The data were plotted in double reciprocal and were fitted to the equations to
obtain values for inhibition constants using the computer program Cleland (120). The
model of inhibition (competitive or non-competitive) was established by identifying
which equation gave the lowest standard error of kinetic constants.
3.1.9 pH-dependence of the Dehydrogenase-Catalyzed Reaction
The activity of A19PD was recorded at 55°C over the pH range from 6.08 to 9.79
in a buffer containing 25 mM HEPES, 25 mM 3-(N-morphoIino)propanesulfonic acid
(MES). 25 mM Tris-HCl with 150 mM NaCl. The concentration of NAD+ was kept fixed
at 4 mM while prephenate was varied from 28 U.M to 840 jiM. For the data set at pH
6.08, prephenate concentrations were varied from 560 uM to 5.6 mM. The pH of the
assay mixture was determined at 55°C before and after the reaction using a Fisher
Scientific accumet® 15 pH meter standardized with appropriate reference standard
buffers.
The kinetic data were fitted to the appropriate equations using the computer
programs of Cleland or Grafit Software version 5.0 (Erathicus Software) as described
section 2.1.4. Values for the maximum velocity (V), the Michaelis constant (K), and the
apparent first-order rate constant for the interaction of enzyme and substrate (V/K) were
deduced from the plots. For the determination of V/K values, the concentration of the
114
fixed substrate was saturating at the pH of the assay. The variation of the values of V and
V/K as a function of pH was fitted to the log form of eqs 3.2 and 3.3 as described by
Christendat et al. (53):
y = CI{\+HIKf) (3.2)
y=C/(l+ HIKA + KQ/H) (3.3)
Where y represents the value of V or V/K at a particular pH value, C is the pH-
independent value of the parameter, H is the hydrogen ion concentration, and KA and B
are acid dissociation constants for groups on the enzyme or substrate:
3.1.10 Determination of KA for Prephenate of Serl26Ala and Hisl47Asn A19PD
Variants
Values for the dissociation of prephenate from its complex with Serl26Ala and
Hisl47Asn A19PD were determined at 30°C by monitoring the quenching of protein
intrinsic fluorescence as described in section 2.1.7. Titrations were performed by the
progressive addition of prephenate (0-700 p;M and 0-200 (J.M for Serl26Ala and
Hisl47Asn, respectively) to PPS buffer (2 mL) containing 0.3 fiM monomer.
3.2 RESULTS
3.2.1 Determination of the Kinetic Parameters of the Reaction Catalyzed by A.
aeolicus PD and A19PD at 30, 55 and 80°C.
115
Enzyme assays with purified PD and A19PD confirmed expectations that tyrA
specifies an NAD"-dependent prephenate dehydrogenase. The enzymes followed
Michaelis-Menten kinetics, although substrate inhibition was noted at very high
concentrations of prephenate (but not NAD+). The kinetic parameters for the PD reaction
for both enzymes at three different temperatures are shown in Table 3.2. Values obtained
at 55°C for &cat and Km for PD agreed with previous findings (106). Values of kcs\/Km
increased only ~7- to ] 0-fold between 30° and 80°C; the dramatic increase in kcaX (-30-
fold) was offset by a decrease in the apparent binding affinity for substrates. For the most
part. PD and A19PD were equally effective catalysts, as indicated by comparison of
kca/Km values. However, N-terminal extensions appeared to cause small but reproducible
effects on the values for kinetic parameters; both the &cat and Km for prephenate for
A19PD were twice that for PD, notably at 80°C. The purified enzymes did not possess
CM activity when assayed at 55°C with 1 mM chorismate, nor were the activities
inhibited by the mutase transition state analogue, eWo-oxabicyclic diacid (120 U.M), or
by 1 mM chorismate when assayed with 0.1 mM prephenate and 2 mM NAD+ (data not
shown).
Preliminary studies indicated that A19PD did not efficiently utilize L-arogenate
(NAD as a cosubstrate), primarily due to a poor affinity for this substrate (Table 3.2).
Values of kcax/Km with L-arogenate increased with temperature, but were reduced ~2.5
orders of magnitude compared to those with prephenate. E. coli CM-PD (300 u.g) did not
yield a measurable reaction rate at 30°C in the presence of 44 mM L-arogenate and 4 mM
NAD+. This finding is in contrast to the detectable, albeit poor rates reported for E. coli
CM-PD with racemic or L-arogenate {101, 150). In the present study, negligible rates
116
(<0.5%) were obtained for either enzyme using NADP" (1 mM) as a cosubstrate with
prephenate (0.5 mM) or L-arogenate (44 mM).
The activities of PD and A19PD appeared to decrease exponentially with time
(Fig. 3.1) and yielded half-lives at 95°C of 2 h and 55 min; respectively. Both proteins,
however, retained full activity even after 20 h at 70°C. By comparison, E. coli CM-PD
exhibited a half-life of 6 min at 40°C (Appendix 3A). Our values are within the range
reported for other proteins isolated from thermophilic organisms {151-153), although
results are dependent on protein concentration and buffer components.
117
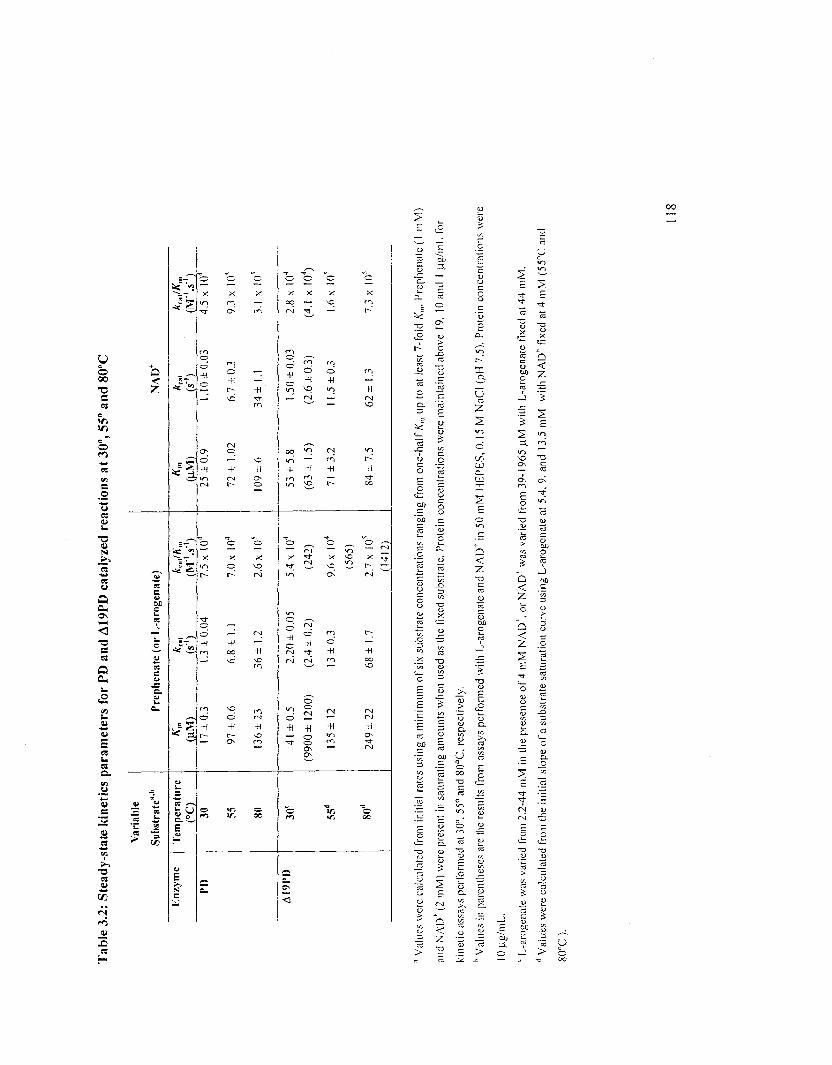
Tab
le 3
.2:
Stea
dy-s
tate
kin
etic
s pa
ram
eter
s fo
r PD
and
A19
PD c
atal
yzed
rea
ctio
ns a
t 30"
, 55°
and
80"
C
En
zym
e
PI)
AI9
PI)
Var
iabl
e
Subs
trat
e"-1'
Tem
per
atu
re
CO
30
55
80
3<)c
55"
80"
Pre
ph
enat
e (o
r L
-aro
gcn
ate)
(HM
) (/
')
(M"'
.s"')
17 ±
0.3
1.3 ±
0.04
7
.5x
10
'
97 ±
0.6
6.8
±1.
1 7.
0x10
"
136
±2
3 36
±1.
2 2.
6 xl
()5
41 ±
0.5
2.20
±0.
05
5.4
x 10
4
(990
0 ±
1200
) (2
.4 ±
0.2)
(2
42)
135
±1
2 13
±0.
3 9.
6x10
"
(565
)
249
±2
2 68
± 1
.7
2.7
x K
)' (1
412)
NA
D*
Km
k m
l k c
JKm
(HM
) (/
')
(M-'.
s"')
25 ±
0.9
1.10
±0.
03
4.5
x 10
4
72 ±
1.0
2 6.
7 ±
0.3
9.3
x 10
4
109
±6
34 ±
1.1
3.
1 x
!0'
53 ±
5.8
1.
50 ±
0.03
2.
8 x
104
(63
±1.
5)
(2.6
±0.
3)
(4.1
x!0
4)
71 ±
3.2
11.5
±0.
3 1.6
x 1
05
84 ±
7.5
62 ±
1.3
7,
3 x
I05
n Val
ues
wer
e ca
lcul
ated
fro
m i
nitia
l ra
tes
usin
g a
min
imum
of
six
subs
trat
e co
ncen
trat
ions
ran
ging
fro
m o
ne-h
alf
£„,
up t
o at
lea
st 7
-fol
d K
„,.
Pre
phen
ate
(1 m
M)
and
NA
D1' (
2 m
M)
wer
e pr
esen
t in
sat
urat
ing
amou
nts
whe
n us
ed a
s th
e fi
xed
subs
trat
e. P
rote
in c
once
ntra
tion
s w
ere
mai
ntai
ned
abov
e 19
. 10
and
I
pg
/mL
fo
r
kine
tic
assa
ys p
erfo
rmed
at
30°.
55"
and
80°
C,
resp
ecti
vely
.
h Val
ues
in p
aren
thes
es a
re t
he r
esul
ts f
rom
ass
ays
perf
orm
ed w
ith
L-a
roge
nate
and
NA
D1' i
n 50
mM
IIE
PE
S,
0.15
M N
aCI
(pH
7.5
). P
rote
in c
once
ntra
tion
s w
ere
10 |i
g/m
L.
c L-a
roge
nale
was
var
ied
from
2.2
-44
mM
in
the
pres
ence
of
4 m
M N
AD
\ or
NA
Dh w
as v
arie
d fr
om 3
9-19
65 U
.M w
ith
L-a
roge
nate
fix
ed a
t 44
mM
.
'' V
alue
s w
ere
calc
ulat
ed f
rom
the
ini
tial
slo
pe o
f a
subs
trat
e sa
tura
tion
cur
ve u
sing
L-a
roge
nate
at
5.4,
9,
and
13.5
mM
w
ith
NA
D*
fixe
d at
4 m
M (
55°C
and
SO
X )
.
118
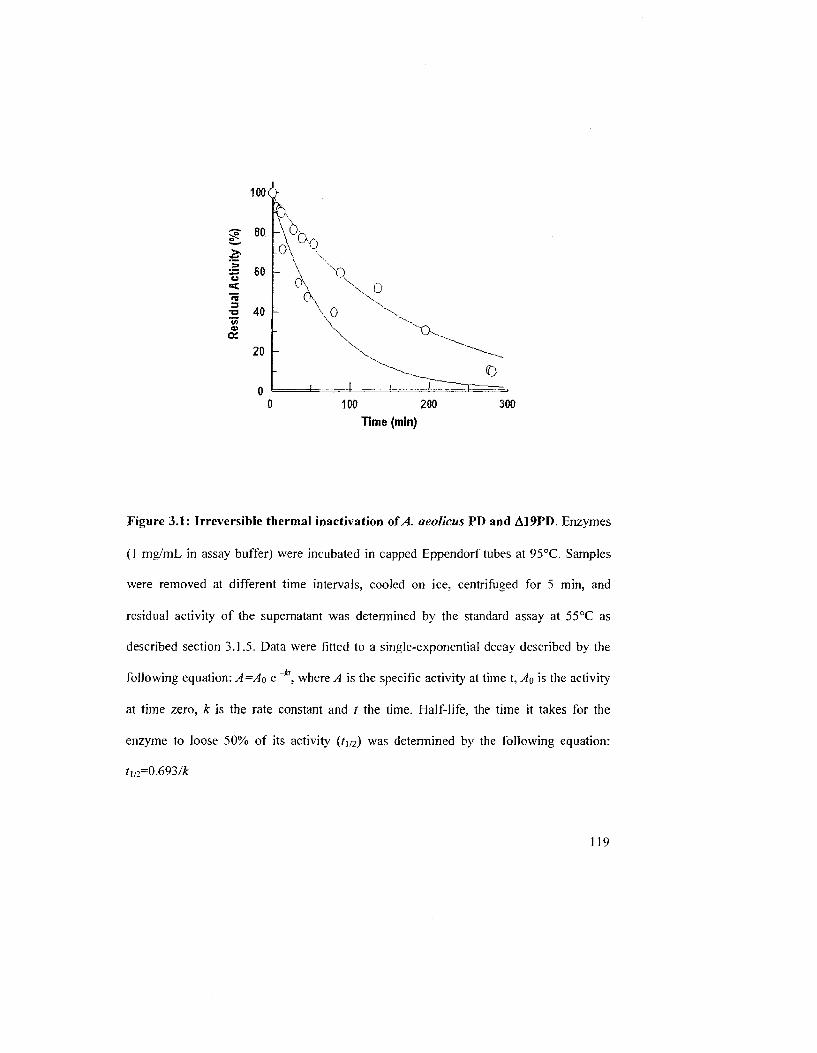
100 200 Time (min)
Figure 3.1: Irreversible thermal inactivation of A. aeolicus PD and A19PD. Enzymes
(1 mg/mL in assay buffer) were incubated in capped Eppendorf tubes at 95°C. Samples
were removed at different time intervals, cooled on ice, centrifuged for 5 min, and
residual activity of the supernatant was determined by the standard assay at 55°C as
described section 3.1.5. Data were fitted to a single-exponential decay described by the
following equation: A=Ao e ~ . where A is the specific activity at time t, AQ is the activity
at time zero, k is the rate constant and t the time. Half-life, the time it takes for the
enzyme to loose 50% of its activity (/)/2) was determined by the following equation:
tm=0.693/k
119
Both PD and Al 9PD were very sluggish enzymes at temperatures below 45°C and
yielded a temperature optimum of ~95°C (PD shown in Fig. 3.2). This is near the
physiological optimum growth temperature of the organism (105). An Arrhenius plot for
PD was linear between 30° and 85°C. indicating a single rate-limiting step with an
activation energy (Ea) of 61.8 kcal/mol (Inset in Fig. 3.2). An activation energy (£a) of
47.4 kJ/mol between 17-56°C was estimated and a &cat of 88.3 s"1 at 63°C was obtained.
A19PD also yielded a linear plot and its parameters are given in Fig. 3.2. Interestingly,
when PD activities of either enzyme were determined using low protein concentrations
(<10 pg/mL) and at lower assay temperatures (30°C and 55CC), progress curves were
punctuated by a significant lag (30 s) before initial velocities were attained. This lag was
observed whether enzyme was preincubated with either substrate, or the reaction was
initiated with enzyme. This observation could suggest that the enzyme undergoes a
conformational change after 30 s in presence of both substrates. The lag was minimized
by increasing the protein concentration or conducting assays at high temperatures, and
was somewhat reduced by adding 0.2 mg/mL bovine serum albumin. Interestingly, no lag
was observed when L-arogenate was the substrate, although product (Tyr) inhibition was
apparent.
120
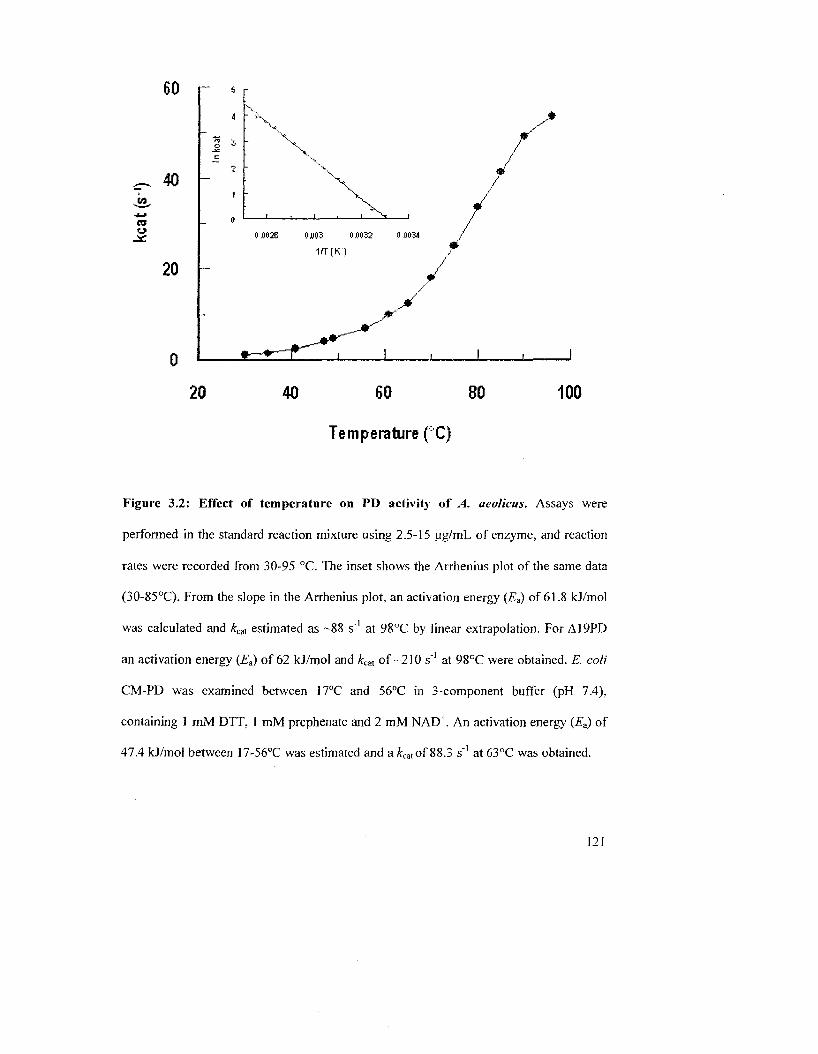
60
~ 40 •M*
CO
o
20
20
0OT25 0X>03 0J)0S OOTC*
1fT(K)
40 60 80
Temperature (C)
100
Figure 3.2: Effect of temperature on PD activity of A. aeolicus. Assays were
performed in the standard reaction mixture using 2.5-15 ug/mL of enzyme, and reaction
rates were recorded from 30-95 °C. The inset shows the Arrhenius plot of the same data
(30-85°C). From the slope in the Arrhenius plot, an activation energy (E3) of 61.8 kJ/mol
was calculated and £cal estimated as -88 s"1 at 98°C by linear extrapolation. For A19PD
an activation energy (£a) of 62 kJ/mol and £ca, of-210 s"1 at 98°C were obtained. E. coli
CM-PD was examined between 17°C and 56°C in 3-component buffer (pH 7.4),
containing 1 mM DTT. 1 mM prephenate and 2 mM NAD+. An activation energy {Ea) of
47.4 kJ/mol between 17-56°C was estimated and a Acatof 88.3 s"1 at 63°C was obtained.
121
3.2.2 Effects of pH, Salt and Divalent Metal Ions on the PD Activity
PD and A19PD demonstrated high specific activity within a very narrow pH
range. The optimal pH was 7.5 at 55°C (Appendix 3B) when tested between pH 3.2-9.8.
using the 3-component buffer system together with 0.8 mM prephenate and 4 mM NAD
as outlined in section 3.1.7.
The enzymes were most active when assayed in buffer containing 100-250 mM
NaCl; 48% of maximal activity was observed at 2 M NaCl (Appendix 3CJ. The proteins
precipitated slightly when stored in the absence of salt. Hence, a concentration of 75 mM
NaCl or above and a pH of 7.5 were adopted for all buffers used in enzyme purification
and for all spectroscopic and enzymatic measurements. Reaction rates of purified PD
recorded at 55°C were identical whether using 50 mM potassium phosphate. 50 mM
HEPES, or the 3-component buffer system (all buffers contained 0.15 M NaCl).
No effect on enzymatic activity was observed upon the addition of EDTA (1
mM), MgCb and ZnCb (25 mM) to standard reaction mixtures at 55°C. However, the
enzymes were weakly inhibited by cobalt, decreasing to a limiting value of 65% of the
maximal activity at 0.1 mM CoCl? (Appendix 3D).
3.2.3 Studies of the Initial Velocity and Product/Product Analogue Inhibition on PD
from A. aeolicus
Initial velocity patterns constructed for PD at 55°C with either prephenate or
NAD as the variable substrate over the concentration range examined, yielded plots that
intersected to the left of the v axis (Figs. 3.3 A and B). Kinetic parameters obtained from
122
Figure 3.3: Variation of initial velocity of A. aeolicus PD reaction as a function of the
concentration of prephenate (A) and NAD (B). In (A) prephenate was varied from 49-
493 uM at fixed concentrations of NAD+of: 35 (•), 70 (•), 140 (A) and 350 (•) pjvl. In
(B) NAD+ was varied from 30-495 uJV] at fixed concentrations of prephenate of: 49 (•),
102 (•), 145 (A) and 495 (•) (iM. The data were fit to the equation describing a
sequential kinetic mechanism, v = VABI(KzKb + K&B + KbA + AB), to generate the lines
shown in the figure, v is the initial velocity, V is the maximum velocity, A and B are
concentrations of reactants, Ka and Kb are Michaelis constants for A and B, and Ku is the
dissociation constant from the binary complex. The following kinetic parameters when
prephenate was the variable substrate, were calculated as 92 s' (V), 105.3 ± 13.14 (Ka),
66.6 ± 8.95 uM (Kb), 129.8 ± 30.6 nM(Kia). Results for A19PD are shown in Appendix
3E.
123
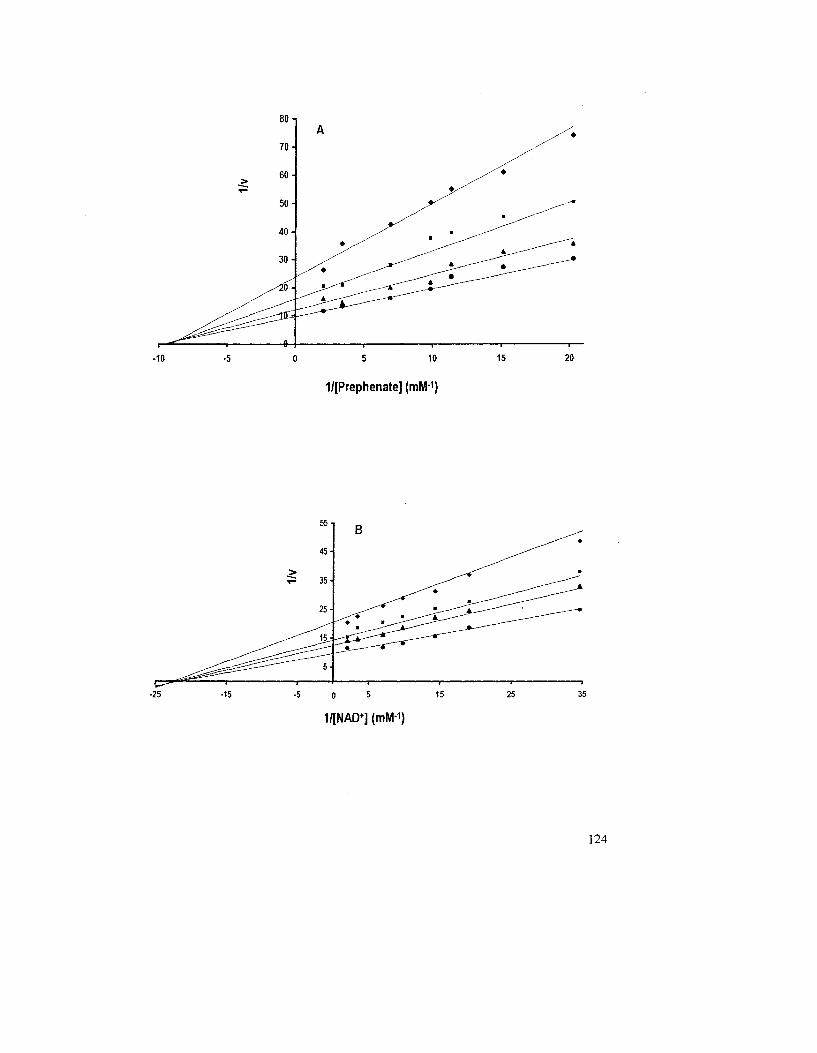
-10 -5 0 5 10 15 20
1/[Prephenate] (mM1)
-25 -15 -5 0 5 15 25 35
1/[NAD+] (mM-1)
124
the fit of these data were in reasonable agreement with those obtained using the
Michaelis-Menten equation (see Table 3.2). These results are consistent with a sequential
kinetic mechanism resulting from the formation of the ternary complex before product
release. Furthermore, over a concentration range of substrates which reportedly yielded
concave upward kinetic plots for the PD activity of E. colt CM-PD {119), the initial
velocity patterns for the A. aeolicus PD-catalyzed reaction were linear. Similar results
were also obtained for A19PD and kinetic parameters are provided in the figure legend
(see Appendix 3E).
Both HPP and HPPropionate. the immediate product of the reaction and a product
analogue, respectively, (see structures in Fig. 3.6) behaved as linear competitive
inhibitors with respect to prephenate for the A19PD-catalyzed reaction under the
experimental conditions described in section 3. The inhibition plots and the values for the
inhibition constants {KK) are shown in Appendix 3F. Values for the Km for prephenate
calculated from these data sets are also shown in Table 3.2 and were in agreement with
values obtained in Table in Appendix 3F.
3.2.4 pH-dependency of the Al 9PD-Catalyzed Reaction
The pH dependency of VIEX and F/ prephenaie£t of the A19PD-catalyzed reaction
was established over a range of pH values from 6.08 to 9.79 at 55°C, by varying the
prephenate concentration at a fixed, high concentration of NAD+ (see section 3.1.9).
Analysis of the results indicates that the VIE, rate profile differs than VIKp^ph^^E
profile. The V/KEt profile is bell-shaped with limiting slopes of -1 on both acid and
alkaline sides (Fig. 3.4). Fitting of the data yielded pK values of 6.51± 0.15 and 9.57 ±
125
0.17 which are comparable than those found for the dehydrogenase reaction of £ coli
CM-PD (64). Results from the VE, rate profile indicate that a single ionizing group with a
pK of 6.5 must be deprotonated for catalysis and/or product release.
126
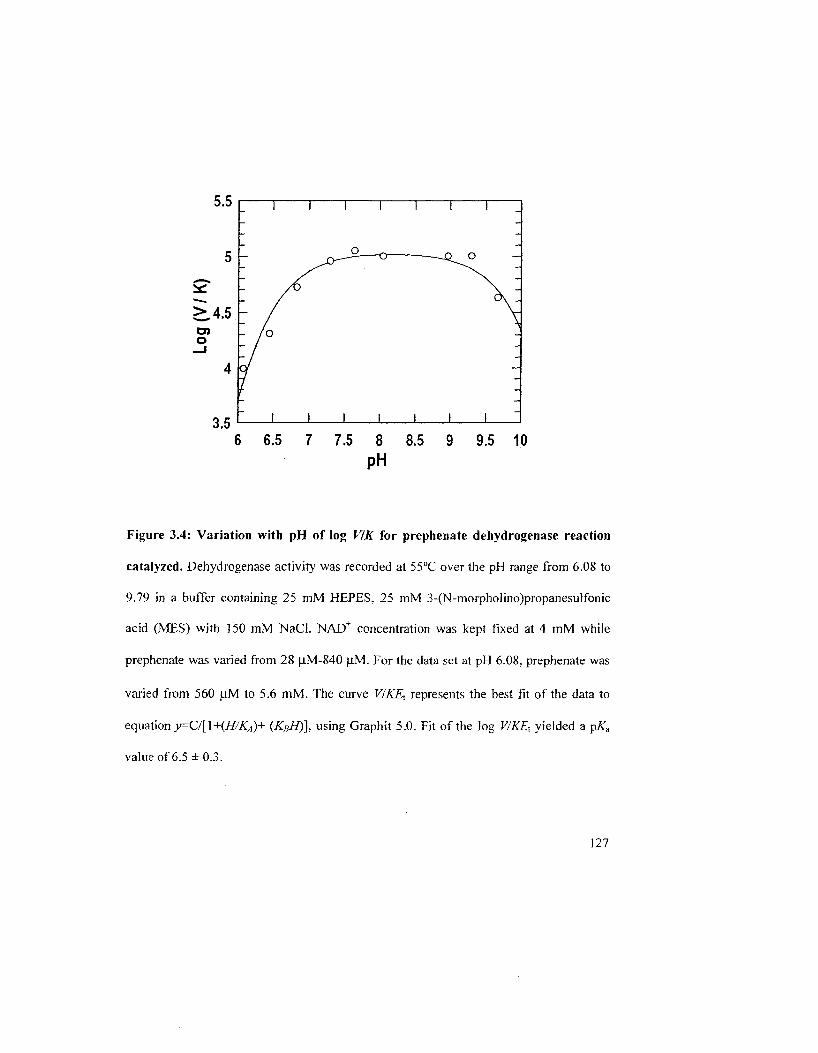
Figure 3.4: Variation with pH of log VIK for prephenate dehydrogenase reaction
catalyzed. Dehydrogenase activity was recorded at 55°C over the pH range from 6.08 to
9.79 in a buffer containing 25 raM HEPES, 25 mM 3-(N-morpholino)propanesulfonic
acid (MES) with 150 mM NaCl. NAD+ concentration was kept fixed at 4 mM while
prephenate was varied from 28 |iM-840 |iM. For the data set at pH 6.08, prephenate was
varied from 560 jiM to 5.6 mM. The curve V/KE represents the best fit of the data to
equation y=C/[\+(H/KA)+ (KBH)l using Graphit 5.0. Fit of the log V/KE, yielded a pKa
value of 6.5 ± 0.3.
127
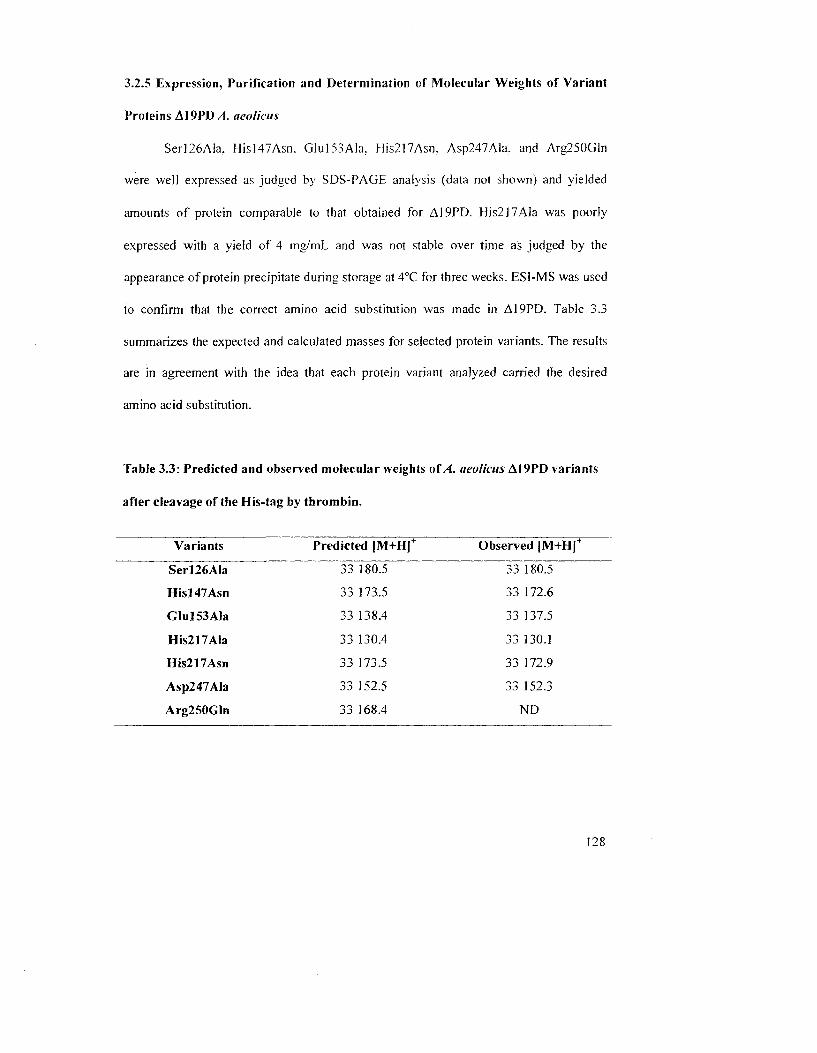
3.2.5 Expression, Purification and Determination of Molecular Weights of Variant
Proteins Al 9PD A. aeolicus
Serl26Ala. His]47Asn. Glul53Ala. His217Asn, Asp247Ala. and Arg250Gln
were well expressed as judged by SDS-PAGE analysis (data not shown) and yielded
amounts of protein comparable to that obtained for A19PD. His217Ala was poorly
expressed with a yield of 4 mg/mL and was not stable over time as judged by the
appearance of protein precipitate during storage at 4°C for three weeks. ES1-MS was used
to confirm that the correct amino acid substitution was made in A19PD. Table 3.3
summarizes the expected and calculated masses for selected protein variants. The results
are in agreement with the idea that each protein variant analyzed carried the desired
amino acid substitution.
Table 3.3: Predicted and observed molecular weights of A. aeolicus A19PD variants
after cleavage of the His-tag by thrombin.
Variants Predicted |M+HJ+ Observed [M+H]+
Serl26Ala 33 180.5 33 180.5
Hisl47Asn 33 173.5 33 172.6
Glul53Ala 33 138.4 33 137.5
His217Ala 33 130.4 33 130.1
His217Asn 33 173.5 33 172.9
Asp247Ala 33 152.5 33 152.3
Arg250Gln 33 168.4 ND
128
3.2.6 Determination of Kinetic Parameters of the Protein Variants
]n the crystal structure of A19PD-NAD" complex (48). both Asp247 and Glul53
are near the prephenate binding site and are shown to be interacting with Arg250. In
order to determine the importance of Asp247: and Glul53 in the mechanism, the two
aforementioned residues were substituted to alanine residues, eliminating the potential for
ionic interactions. Their kinetic parameters (Km and kat) are in Table 3.4. Glul53Ala and
Asp247Ala substitutions resulted in a 5- and 2-fold decrease in kat, respectively, but did
not markedly affect prephenate binding as judged by their Km values. The substitution of
Arg250 by a glutamine resulted in a 10-fold increase in Km for prephenate. while the
enzyme's affinity for NAD+ and its turnover rate were almost unchanged. This result is
consistent with Arg250 being important for prephenate binding.
To evaluate Serl26's participation in the reaction mechanism, this residue was
replaced by an alanine to eliminate the coordinated effect of His! 47 and NAD+ observed
in the crystal structure^). The kinetic parameters of the Serl26Ala-catalyzed reaction
were determined. The turnover number of the reaction catalyzed by Serl26Ala was
reduced by ~12-fold. The enzyme also exhibited a 10-fold increase in the Km value for
prephenate (Table 3.4), although the Km for NAD+ was only slightly elevated.
Substitution of His 147 to an asparagine in A. aeolicus A19PD resulted in a variant that
was essentially inactive, however, by adding a large amount of enzyme, a reaction rate
could be determined and values for ka{ and Km were calculated. The value for Km for
prephenate was similar to that of wild-type enzyme however, the turnover number was
reduced by over three orders of magnitude. This verified the importance of Hisl47 in
catalysis. Values for kcsl appeared pH independent when activity measurements were
129
recorded in the presence of 850 jag of enzyme. 2 mM NAD' and 600 ^M prephenate. At
pH 6.2 and pH 7.2 kcat values were identical, at ~3 x 10"" s~\ A thermodynamic
measurement for the binding of prephenate to unliganded Hisl47Asn was recorded to
corroborate the Km value for prephenate. Result from titration of the change in
fluorescence intensity as a function of prephenate concentration yielded a K$ value of 22
± 1.4 U.M at 30°C which is comparable with the Km value of A19PD (-41 nJVl) also
determined at 30°C. To test the reliability of our fluorescence assay, we determined the
dissociation constant of Serl26Ala. A K& value of 336 ± 11 jiM (Fig. 3.5) was obtained
for Serl26Ala variant protein which is comparable to its Km value at 30°C (-300 |lM,
data not shown).
130
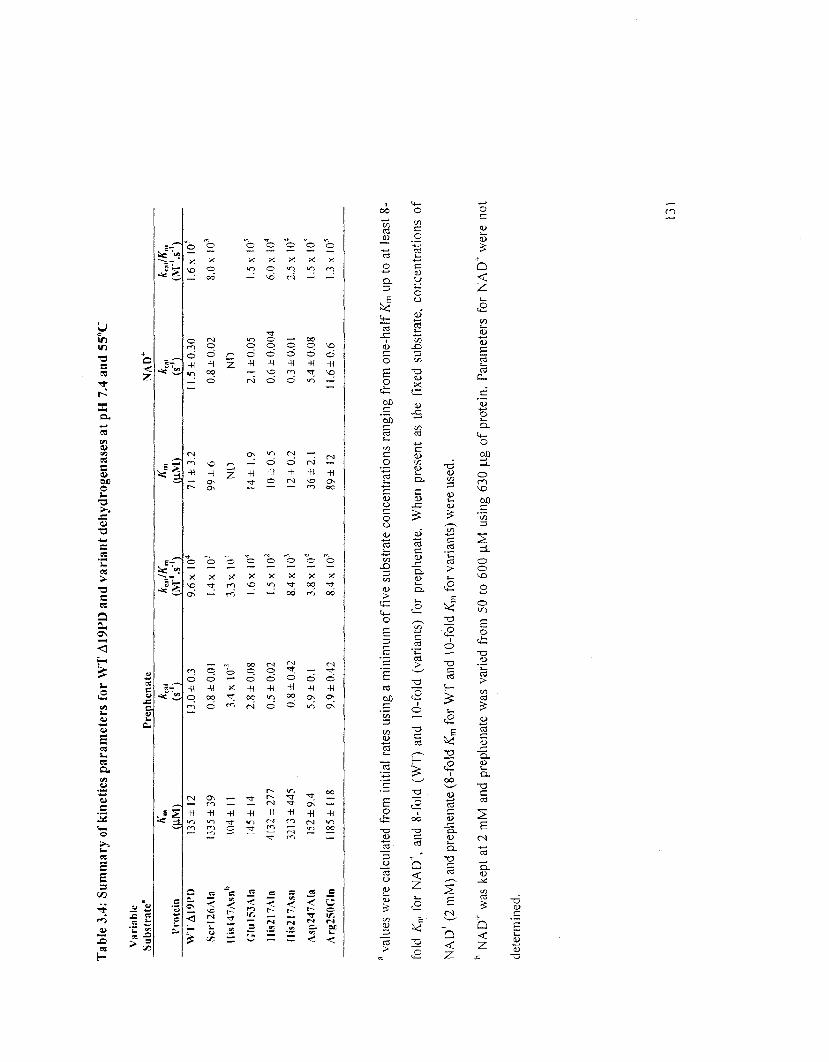
Tab
le 3
.4:
Sum
mar
y of
kin
etic
s pa
ram
eter
s fo
r W
T A
19PD
and
var
iant
deh
ydro
gena
ses
at p
H 7
.4 a
nd 5
5"C
Var
iabl
e S
ubst
rate
"
Prot
ein
WT
A19
PD
Ser
l26A
la
Ilis
l47A
snb
Glu
l53A
la
llis2
17A
la
llis
2l7A
sn
Asp
247A
la
Arg
250G
ln
Km
(U
M)
135
± 12
1335
± 3
9
104
± II
145
± 14
4132
± 2
77
3213
± 4
45
152
±9.
4
1185
± 1
18
Pre
phcn
ate
"cat
I3.0
±0.
3
0.8
±0.
01
3.4
x 10
°
2.8
±0.
08
0.5
±0.
02
0.8
±0.
42
5.9
±0
.l
9.9
±0.
42
"cn
l'"
m
(M'V
) 9.
6 x
104
I.4x
103
3.3
x 10
'
1.6 x
10"
l.5x
I0
2
8.4
x 10
-'
3.8x
I04
8.4
x I0
'1
(UM
) 71
±3.
2
99 ±
6
ND
I4±
1.9
10±
0.5
!2±
0.2
36 ±
2.1
89±
12
NA
D+
"cat
11.5
±0.
30
0.8
±0.
02
ND
2.1
±0.
05
0.6
±0.
004
0.3
±0.
01
5.4
±0.
08
11.6
±0.
6
*ca
t'«
m
(M"'
.s"'
) 1.6
x 1
0s
8.0
x I0
'1
1.5 x
I05
6.0.
x I0
4
2.5
x 10
"
1.5 x
I05
1.3 x
I05
a val
ues
wer
e ca
lcul
ated
fro
m i
nitia
l ra
tes
usin
g a
min
imum
of
five
sub
stra
te c
once
ntra
tions
ran
ging
fro
m o
ne-h
alf
Km u
p to
at
leas
t 8-
Ibld
Km f
or N
AD
+, an
d 8-
fold
(W
T)
and
10-fo
ld (
vari
ants
) fo
r pr
ephe
nate
. W
hen
pres
ent
as t
he f
ixed
sub
stra
te,
conc
entr
atio
ns o
f
NA
D'1"
(2 in
M)
and
prep
hena
te (8
-fol
d K
m f
or W
T a
nd 1
0-fo
ld K
m f
or v
aria
nts)
wer
e us
ed.
h NA
D1 w
as k
ept
at 2
inM
and
pre
phen
ate
was
var
ied
from
50
to 6
00 \
xM u
sing
630
|J.g
of
prot
ein.
Par
amet
ers
for
NA
D^
wer
e no
t
dete
rmin
ed.
131
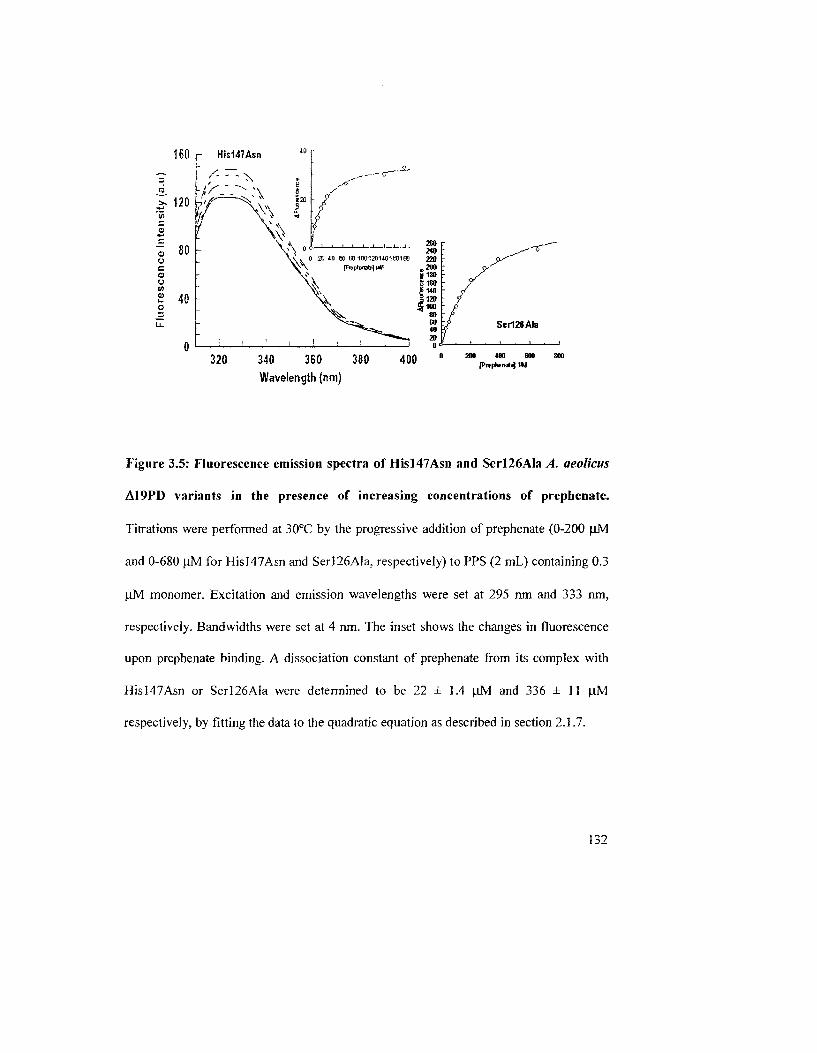
340 360 380
Wavelength (nm)
260 240 220
,.200 ji180 S1BO JJ140 J 120 £ 1 0 0
SO GO 40 20
n £
\ / 'J
I '1 r ,
^r~~~
Scr126Ala
J 1 i 1 i I
400 200 400 GOO |Prtphtr>3l<J m
Figure 3.5: Fluorescence emission spectra of Hisl47Asn and Ser]26Ala A aeolicus
A19PD variants in the presence of increasing concentrations of prephenate.
Titrations were performed at 30°C by the progressive addition of prephenate (0-200 uJVf
and 0-680 (J.M for Hisl47Asn and Serl26Ala, respectively) to PPS (2 mL) containing 0.3
\\M monomer. Excitation and emission wavelengths were set at 295 nm and 333 nm,
respectively. Bandwidths were set at 4 nm. The inset shows the changes in fluorescence
upon prephenate binding. A dissociation constant of prephenate from its complex with
Hisl47Asn or Serl26Ala were determined to be 22 ± 1.4 \sM and 336 ± 11 U.M
respectively, by fitting the data to the quadratic equation as described in section 2.1.7.
132
Replacement of the conserved histidine at position 217 by either an alanine or an
asparagine led to dramatic change in kinetic parameters. The Michaelis constants for
His2I7Ala and His217Asn were increased by 40- and 30-fold, respectively (see Table
3.4). Thus, these results strongly suggest that this residue is important for prephenate
binding. In addition, decrease of the ka\ values by 10 to 20-fold indicate that His217 was
also important for catalysis.
3.3 DISCUSSION
The heterologously expressed TyrA protein from the hyperthermophilic bacterium
A. aeolicus functions in vitro as an NAD+-dependent cyclohexadienyl dehydrogenase, but
very poorly. Hence, its annotation as a PD in this report is to reflect the much preferred
substrate, prephenate. Those TyrA proteins that effectively utilize both L-arogenate and
prephenate, such as from Ps. stutzeri {46), Z. mobilis (39) and Ps. aeruginosa (147), do
so with values of kQJKm for L-arogenate and prephenate that are within an order of
magnitude of one another.
In addition to being more resistant to heat denaturation than their mesophilic
counterparts, thermophilic enzymes generally exhibit low activity at ambient
temperatures and higher activity at elevated temperatures (154). A. aeolicus PD fulfills
these criteria as its maximal activity is achieved at 95°C or higher, with a 33-fold increase
in kax relative to that at 30°C, a half-life at 95°C of ~2 h and an estimated Tm value of
about 108°C (106). PD, to our knowledge, is the most thermal stable enzyme from A.
aeolicus reported to date. In contrast, significantly lower temperature optima (155) and
only moderate half-lives at 40°C have been found for E. coli CM-PD (Appendix 3A) and
for other TyrA proteins (36, 46, 147). The half-life of AJ9PD is about half that of PD. at
95CC indicating that A19PD is globally more unstable or "looser". This is surprising, as
the results from the protein purification, gel filtration, and secondary structure prediction
(Chapter 2 in the present study) and those of tryptic proteolysis of PD yielding a
crystallizable domain (Chapter 2 in this study and Sun et al. (48)). together, are consistent
with PD adopting a compact structure with a floppy N-terminal region. In further support,
the kinetic parameters of PD and A19PD-catalyzed reactions are similar but not identical,
particularly at the high temperatures (Table 3.2). The N-terminal region appears to
provide some structural benefits, although its role is not apparent from the crystal
structure; the N-terminal residues A19PD (denoted 20-29 in PD) are unordered (they
display weak electron densities in the crystal structure) and far removed from the central
core of the active site (48). They immediately precede the structurally important
GXGXXG motif of the NAD+ binding domain however (Appendix 2D), so perhaps small
structural perturbations transmitted to the active site are magnified at the higher
temperatures. Increased flexibility has been proposed to account for the changes in
kinetic parameters of the enzyme in the presence of low concentrations of Gdn-HCI
(Chapter 2); this same mechanism likely accounts for the small but reproducible
differences in kinetic parameters between PD and A19PD.
It is well known that metal ions play an important role in maintaining stable and
active enzymes. It has already been reported that some thermophilic and
hyperthermophilic enzymes contain metal ions that are absent in their mesophilic
homologs (156, 157). In general extremozymes possess unusual properties at solvent-
exposed surface areas which increase stability; they often require higher salt
134
concentrations than mesophilic enzymes to be fully active. In agreement, maximum
catalytic activity was achieved with concentrations of NaCl or KC1 concentrations
between 100-250 mM suggesting that A. aeolicus PD activity is sensitive to the ionic
strength of the medium. Presence of salt might increase the enzyme flexibility rendering
it more active. The crystal structure did not reveal the presence of bound metal (48), nor
is PD predicted to require metals for catalysis or structure. Accordingly, addition of the
chelating agent EDTA or divalent metal ions Mg2+ and Zn ^ did not alter the
dehydrogenase activity. Interestingly, slight inhibition was observed in the presence of
Co2+.
The intersecting initial velocity patterns obtained at 55°C for .4. aeolicus PD (Fig.
3.3), and changes in tryptophan fluorescence noted at 30°C from the combination of
NAD+ or prephenate with A19PD (section 2.2.5, Figs. 2.18 A and B), indicate that the
reaction follows a sequential kinetic mechanism with substrates adding to the enzyme in
either order. However, the possibility exists that substrate binding may not be in rapid
equilibrium. In such a mechanism, the Michaelis constants for substrates (Km) are true
dissociation constants of substrates (JO) and should yield the same value. Our finding that
the K& for NAD' (~1.4 uJvl) determined thermodynamically is over an order of magnitude
lower than the kinetically derived Km value (~25 U.M), suggests that a step other than
catalysis may be rate-limiting, at least at temperatures lower than optimum for the
enzyme. The results would also be consistent with NAD+ binding in an altered
conformation to the enzyme under our experimental conditions. In support of either case,
a significant lag in attaining linear initial velocity conditions was noted at the lower
temperatures, and is consistent with a slow conformational change upon the binding of
135
substrates. Surprisingly, the Arrhenius plot showed no break at temperatures between 30°
and 85°C. which would typically indicate a change in the rate-limiting step (J58).
Although a rapid equilibrium random kinetic mechanism has been reported for CM-PD
from E. coli (63) and A. aerogenes (95). and AD from A. thaliana (40). a steady-state
random mechanism, but with a preferred order for L-arogenate binding first, has been
proposed for the monofunctional AD from Synechocystis (36).
Hypotheses concerning the kinetic mechanism have also been formulated based
on recently available structural data. Al 9PD has been cocrystallized at pH 7.5 with NAD"
and with NAD+ plus prephenate, HPProprionate or with L-Tyr. (The presence of HPP in
the structure indicates that prephenate was enzymatically converted to HPP during the co-
crystallization studies). Christendat and colleagues noted that although two molecules of
NAD were associated with the enzyme (one on each monomer), only one molecule of
the product or product analogue was identified per dimer. This could result if substrate
binding and product release were ordered with NAD+ binding first and NADH released
last, or if the binding of prephenate to one monomer inhibited its binding to the second
monomer. Our solution studies do not support an ordered kinetic mechanism
hypothesized from the crystallographic data for several reasons. First, an ordered
mechanism as described above is contrary to our thermodynamic binding studies on
A19PD which indicate that prephenate can bind to the free enzyme (Chapter 2). Both the
prephenate and NAD' binding pockets appear independently accessible as judged by the
structures of liganded protein(Chapter 1, Figure 1.10) although the possibility does exist
that prephenate may block access to the NAD^ binding pocket in the unliganded enzyme.
Regrettably, there is no structurally data available for the apoenzyme; NAD+ binding
136
appears to promote protein crystallization. Second, the initial velocity patterns obtained at
55°C were linear indicating that the binding of prephenate (or NAD') to each monomer
of the dimer is independent of one other (Chapter 2). A full understanding of this kinetic
mechanism awaits the results from comprehensive product and dead-end inhibition
studies at different temperatures including one close to the optimum for the enzyme.
Additionally, experiments will be conducted using microcalorimetry or equilibrium
dialysis methods which are designed to address the stoichiometry of binding of either
substrate to the free enzyme and to HPP with the enzyme-NAD complex.
In this chapter we have also endeavored to clarify the roles of selected active site
residues of A. aeolicus through kinetic and biophysical analysis of protein variants.
Additionally, we have compared our findings with previous mutagenesis results and have
correlated these with the current structures of the enzyme—mainly that of A19PD-NAD'
alone and in complex with the immediate product HPP. There are some notable
differences between the structures of prephenate and HPP; HPP is aromatic rather than a
cyclohexadiene and lacks the ring carboxyl group associated with prephenate. However,
HPP acts as a linear competitive inhibitor with respect to prephenate and binds to the
enzyme NAD+ complex with the same apparent affinity as does prephenate (Appendix
3F) so interactions between HPP and active site residues in PD should closely reflect
those with prephenate. Of the six residues chosen for mutagenesis studies, Serl26,
Hisl47 and Arg250 are conserved in the sequences all TyrA proteins identified to date
while Glul53,His217 and Asp247 show moderate to high conservation (Fig. 1.9).
137
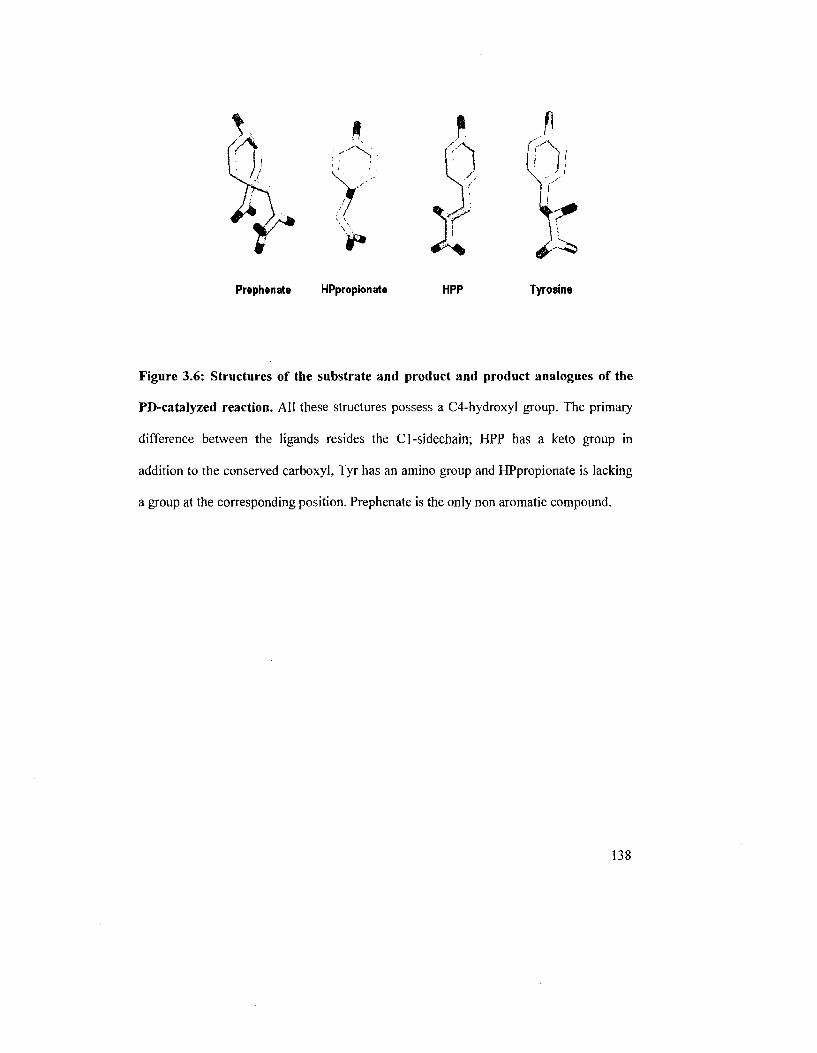
Prephenate HPpropionate HPP Tyrosine
Figure 3.6: Structures of the substrate and product and product analogues of the
PD-catalyzed reaction. AH these structures possess a C4-hydroxyl group. The primary
difference between the ligands resides the Cl-sidechain; HPP has a keto group in
addition to the conserved carboxyl, Tyr has an amino group and HPpropionate is lacking
a group at the corresponding position. Prephenate is the only non aromatic compound.
138
As shown in Figure 3.7 the imidazole ring of His 147 interacts with the C-4
hydroxy! of HPP and participates in a hydrogen bonding network between Serl26.
Ser213 and a bound water molecule (WAT 1). Additionally. C4 of the ligand resides
within 2.5 A from the Nl portion of the nicotinamide ring of NAD4. These interactions
support the kinetic data from E. coli CM-PD (52) which identifies the invariant Hisl97
(corresponding to the A. aeolicus Hisl47) as a key catalytic group.
The results for the pH dependence of VEl/Kpiephemte and VEt reaction catalyzed by
A19PD indicated that a single ionizing group with a p Ta value of about 6.5 was
deprotonated for catalysis while a second group with a pZa of about 9.5 was protonated
and likely involved in binding prephenate to the enzyme-NAD+ complex. As our results
are consistent with the pH activity profiles observed for E. coli CM-PD (52), we assigned
this deprotonated group to Hisl47. Kinetic analysis was also performed on the A.
aeolicus PD variant Hisl47Asn to confirm its role solely in catalysis. Hisl47Asn is
essentially inactive, but binds prephenate with an apparent affinity similar to that of the
wild-type enzyme, as determined by its kinetic parameters (Table 3.4), and as determined
by thermodynamic measurements which monitor the quenching of tryptophan
fluorescence emission by prephenate yielding a true dissociation constant (Fig. 2.18).
Additionally, we showed that the activity of the variant was pH independent thus
permitting assignment of this titrating group to His 147. Together, our findings further
support the catalytic function of His] 47 in directly polarizing the C4-hydroxyl group of
prephenate or perhaps helping the bound water molecule to carry out this function to
facilitate hydride transfer from prephenate to NAD+. In the crystal structure of AD from
139
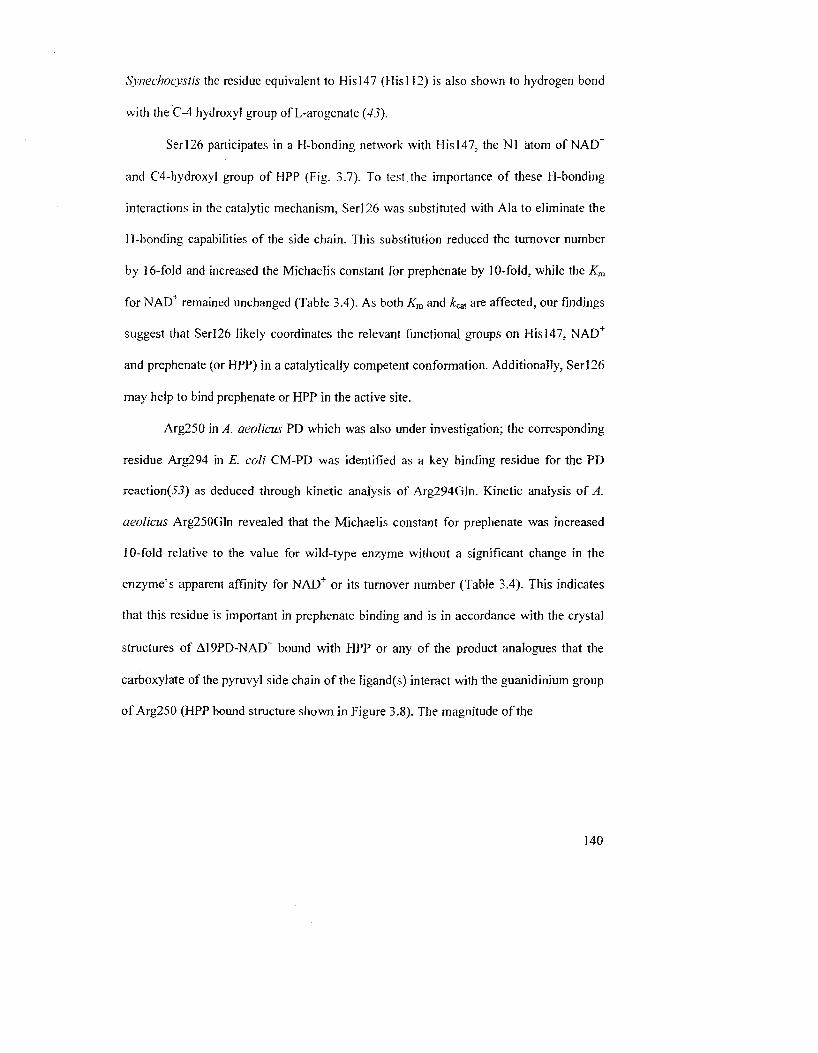
Synechocystis the residue equivalent to Hisl47 (His 112) is also shown to hydrogen bond
with the C-4 hydroxyl group of L-arogenate (43).
Serl26 participates in a H-bonding network with His 147, the Nl atom of NAD"
and C4-hydroxyl group of HPP (Fig. 3.7). To test the importance of these H-bonding
interactions in the catalytic mechanism, Serl26 was substituted with Ala to eliminate the
H-bonding capabilities of the side chain. This substitution reduced the turnover number
by 16-fold and increased the Michaelis constant for prephenate by 10-fold, while the Km
for NAD+ remained unchanged (Table 3.4). As both Km and £cat are affected, our findings
suggest that Serl26 likely coordinates the relevant functional groups on His 147, NAD+
and prephenate (or HPP) in a catalytically competent conformation. Additionally, Serl26
may help to bind prephenate or HPP in the active site.
Arg250 in A. aeolicus PD which was also under investigation; the corresponding
residue Arg294 in E. coli CM-PD was identified as a key binding residue for the PD
reaction(55) as deduced through kinetic analysis of Arg294Gln. Kinetic analysis of A.
aeolicus Arg250Gln revealed that the Michaelis constant for prephenate was increased
10-fold relative to the value for wild-type enzyme without a significant change in the
enzyme's apparent affinity for NAD+ or its turnover number (Table 3.4). This indicates
that this residue is important in prephenate binding and is in accordance with the crystal
structures of A19PD-NAD+ bound with HPP or any of the product analogues that the
carboxylate of the pyruvyl side chain of the ligand(s) interact with the guanidinium group
of Arg250 (HPP bound structure shown in Figure 3.8). The magnitude of the
140
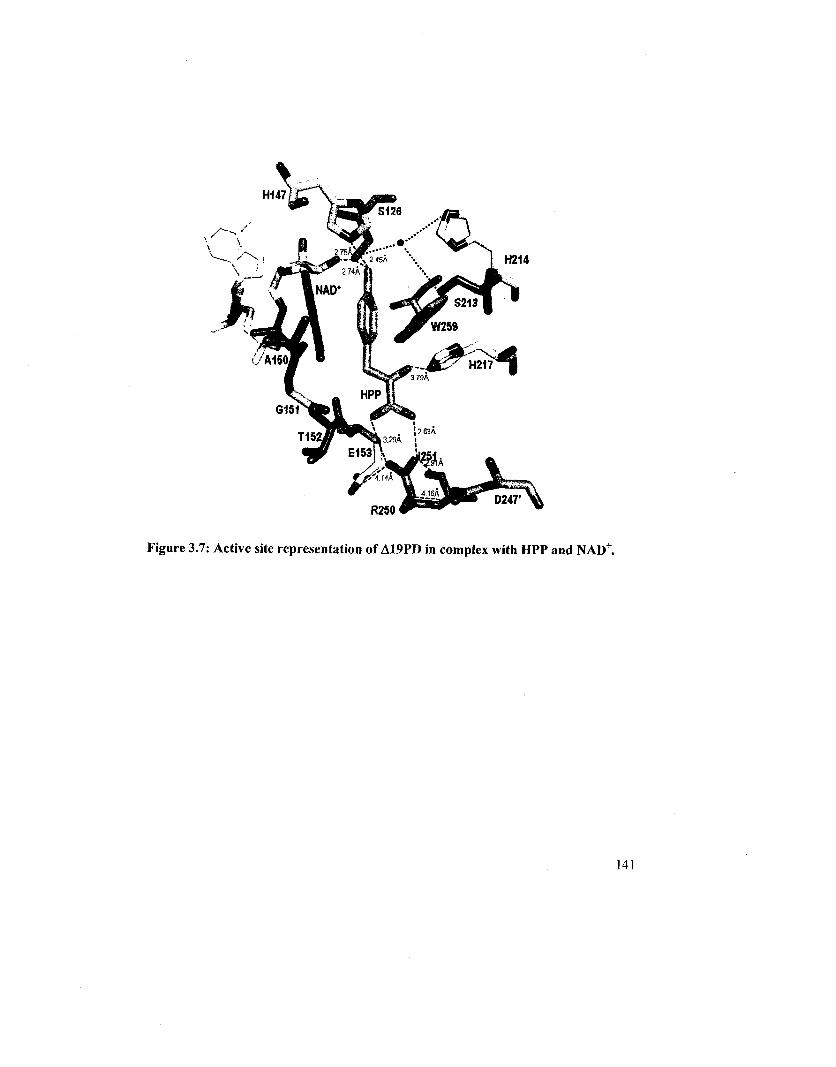
R250'
Figure 3.7: Active site representation of A19PD in complex with HPP and NAD+.
141
apparent binding affinity (~].4 kcal/mol or a H-bond) however, is lower than expected
for the loss of an ionic interaction in this relatively buried active site. It may be that for
this variant, a water molecule or perhaps another cationic residue such as Lys246 which
occupies a position close to the side chain pyruvyl group, can fulfill this role (see Figure
5 in Sun et al. (48)). By comparison with previous findings on the E. coli Arg294Gln
enzyme, the Km for prephenate was an order of magnitude higher than we observed for
Arg250Gln from A. aeolicus suggesting a variation in the active site architecture between
the two proteins. (Note that the E. coli enzyme lacks the equivalent residue of Lys246 in
this binding motif (see Figure 1.9 in Chapter 1, motif R/KxxxR as described by Bonner et
al. (45)). Additionally, studies examining the binding of product and product analogues
to wild-type and Arg294Gln CM-PD suggested that prephenate interacts with the ring
carboxylate (53), a finding which is not supported by these current crystal structures.
Coordinated with its role in prephenate binding, the crystal structure of the
enzyme-NAD4 complex shows that Arg250 is involved in an ionic network with Glul53
from one subunit and with Asp247' from the adjacent monomer. These residues are
located on the loop region between 06 and ct6, and on the alO and alO' helices that
collectively cap the active site and shift in conformation upon the binding of HPP. Sun et
al. describes this triad as a "gate" that modulates substrate access to the active site (48).
The most notable shift occurs in the loop located between P6 and a6 (residues 149-156),
a region which defines the hydrophobic region, a wall, of the active site. Glyl51 shifts
2.46 - 3.36 A away from this pocket upon ligand binding to avoid a steric clash between
it and the side chain of HPP or product analogues, bringing Glul53 along with it.
Additionally, the side chain of Arg250 is shifted 1.25 A closer to the active site pocket.
142
Thus Arg250 and Glu]53 adopt different positions in the unliganded and bound
structures while Asp247 maintains interactions with Arg250 in both states (Chapter 3,
Fig. 3.8).
To probe these ionic interactions on substrate binding. Glul53 and Asp247 were
individually changed to alanine residues. These substitutions effectively eliminate the
ionic interactions between these residues and we predicted that these should have an
effect on the kinetic parameters of the reaction, notably prephenate binding. The
Glul53Ala and Asp247Ala substitutions reduced the turnover rate by 5-fold and 2-fold,
respectively, although they did not have a marked affect on the Michaelis constants for
prephenate (Table 3.4). These effects on kca\ are not large, and might reflect small
differences in the electronic environment associated with these residues, or small
perturbations in the position of catalytically important residues. In both of these variants
the Michaelis constant for NAD+ is significantly lowered; such an effect has also been
observed for wild-type enzyme in the presence of low concentrations of guanidine-HCl
(112), and highlights the sensitivity of the active site to its environment.
If the Michaelis constant was considered as a true dissociation constant then its
value would depend on the "on" and "off; rate constants of prephenate from the enzyme
As ko,t is reduced in the variants but not Km, it may be that the release of product from the
enzyme (reflected in the kat term) and substrate association are reduced equally by the
amino acid substitutions. As such, these diffusion processes would be subject to the
effects of a viscogens and could be tested. These types of experiments have been
performed for the chorismate mutase reaction from B. subtilis {159). Additionally, a
series of double mutants and a triple mutants could be generated and the variants
143
expressed and characterized in order to test the additivity of the changes in the kinetic
parameters.
The structure of the A19PD-N AD~-HPP complex shows that the imidazole group
of His217 along with the main chain carbonyl of Gly243 makes important interactions
with the keto group on the pyruvyl side chain of the ligand (Fig. 3.7). Thus it was
predicted that substitutions of His217 to either alanine or asparagine would produce
significant changes in the kinetic parameters for the A19PD-cataIyzed reaction. The
Michaelis constant for prephenate was increased by 40-fold and 30-fold for His217Ala
and His217Asn respectively thus indicating the importance of His217 in prephenate
binding. However these substitutions also coincided with a 10 to 20-fold decrease in &ca,
thus indicating that this interaction with the keto group of the substrate may assist in
positioning prephenate in a catalytically competent conformation. Alternatively, the
His217Ala and His217Asn substitutions might have perturbed the structure of the active
site, presumably due to the disruption of the hydrophobic stacking of His217 with the
neighbouring Trp259 and Ile251. Evidence for this latter statement comes from stability
studies with Gdn-HCI (W. Hou, unpublished) which indicate that the variant His217Ala
is less stable than WT enzyme. Additionally, the Km for NAD+ was lowered by 7-fold for
both variants (Table 3.4), a characteristic that is noted with a few other variants and with
the addition of Gdn-HCI. As mentioned previously, these results are in keeping with
structural perturbations of the active site which might allow for altered or non-productive
binding of NAD+.
Christendat and coworkers have further illustrated the importance of His217 in
maintaining ligand conformation. Superimposition of the crystal structures of the
144
enzyme-NAD" complex bound with HPP or HPpropionate clearly shows that the
propanoyl side chains are not superimposable: the HPpropionate side chain is shifted
more, by 2 A. towards His217 (Fig. 3.8). HPpropionate, lacks the side chain keto group
and as such cannot participate in the hydrogen bonding interaction with His217 and the
carbonyl of Gly243. One would predict then that binding energy contributed by the
interaction of the keto group with its H-bonding partners would be significant. The
differences in K\ values (Table in Appendix 3F), which describe the binding of HPP and
HPpropionate to A19PD-NAD+ complex, is relatively small, however, about 4-fold or a
AG of-0.8 kcal/mol; a comparable AG value (~1.5 kcal/mol) was calculated for the same
interaction in E. coir CM-PD (53).
Christendat and coworkers (unpublished) have compared structures of NADP
bound AD from Synechocystis and NAD" bound PD from A. aeolicus and have modeled
in HPP in AD's active site. They noted that the active site of AD is more open and
accessible, relative to that of PD; cclO and the fj6-a6 loop region, which comprise the base
and wall of the pocket, respectively, are shifted -3.1-6.5 A away from the active site.
Nevertheless, from the modeling studies they show that L-arogenate can interact with
Ser92, Hisl 12 and Arg217, which correspond to Serl26, Hisl47 and Arg250 in A19PD.
This proposed interaction with Arg217 contradicts Legrand et al. {160) who have
suggested that this arginine is too far from the active site pocket to play a role in substrate
binding. The most notably difference in the active site of AD is the presence of a large
145
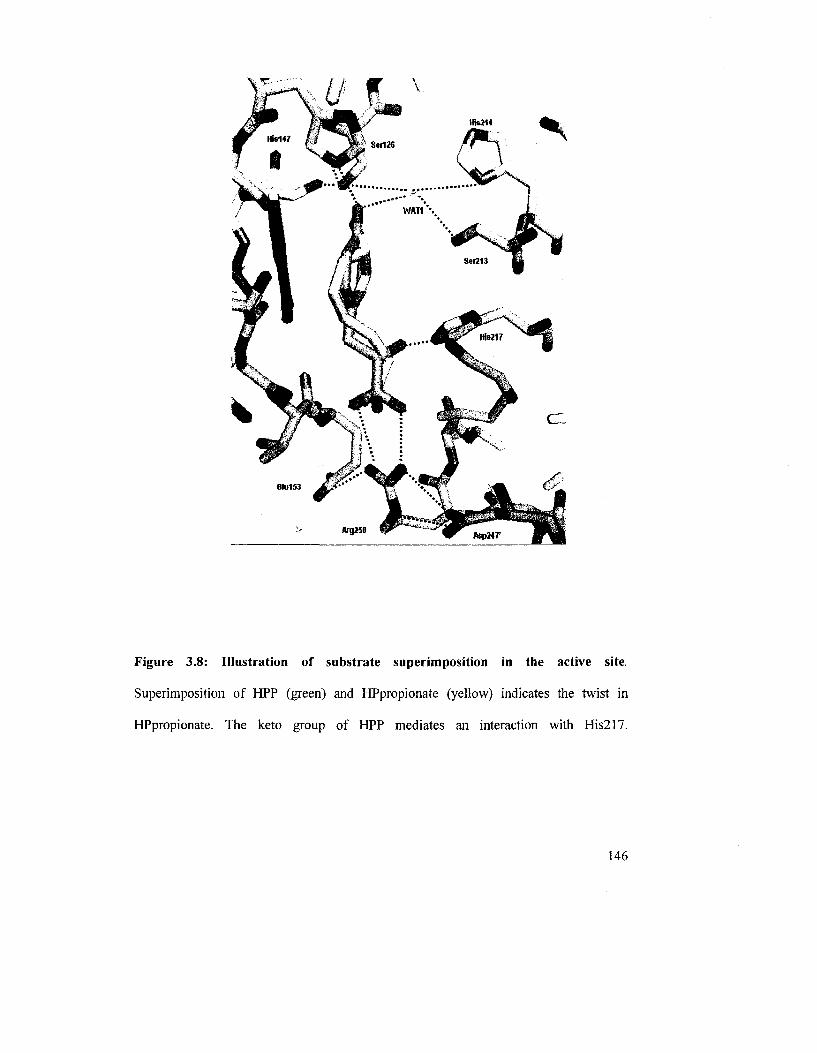
Figure 3.8: Illustration of substrate superimposition in the active site.
Superimposition of HPP (green) and HPpropionate (yellow) indicates the twist in
HPpropionate. The keto group of HPP mediates an interaction with His217.
146
pocket results from the absence of bulk}' Trp and His residues (Trp259 and His217 in
PD). These missing residues likely help bind prephenate. Additionally. Legrand el a!.
(43) has identified a series of hydrophobic side chains near the ring carboxylate of L-
arogenate modeled into the AD active site that Cleland and others (94) have speculated
may promote its decarboxylation. This structural feature would be in keeping with
solution studies on E. coli CM-PD using heavy atom isotope effects which show
decarboxylation and hydride transfer are concomitant reactions (94). As this structural
feature has not been readily identified in the model of prephenate modeled with A.
aeolicus PD (48) it may be that the thermophilic enzyme follows a different catalytic
mechanism in this regard. Further mechanistic studies will include site-directed
mutagenesis on AD from Synechocystis in our laboratory.
147
Chapter 4
Investigation of the Mechanism of Feedback Inhibition by L-Tyrosine
148
4.0 INTRODUCTION
Within the metabolic pathways dictated by TyrA proteins. L-Tyr can function as a
direct product product of a reaction (as with dehydrogenases which use L-arogenate as a
substrate) or can act as an end product of a pathway. In many cases. L-Tyr is reported to
compete directly with the substrate at the active site, be it prephenate or L-arogenate.
These inhibition studies include those performed on the bi functional PD from E. coli (65,
100), E. herbicola (51) and on the monofunctional B. subtilis PD (767). Additionally,
Bonner et al. suggested that L-Tyr act as a competitive inhibitor with respect to L-
arogenate in AD from Synechocystis (36) while Legrand et al. reported that the same
enzyme was insensitive to feedback inhibition by Tyr (43). Interestingly, some TyrA
proteins such as Z. mobilis, N. europaea, N. gonorrhoeae or Acidovorax facilis are not
sensitive at all to Tyr inhibition (39, 45).
The E. coli Afunctional enzyme has received considerable attention since Tyr
modulates both the mutase and the dehydrogenase activities (56). This enzyme also
exhibits kinetics suggestive of positive cooperativity in the binding of prephenate in the
PD-catalyzed reaction and that this cooperativiry is enhanced in the presence of L-Tyr.
Several models have been proposed for the mechanism of allosteric inhibition by L-Tyr.
One mode] has been proposed derived from sedimentation velocity and equilibrium
experiments that indicate the enzyme can undergo an allosteric transformation from
dimer to tetramer; L-Tyr binding preferentially to the inactive tetramer but at the same
site that prephenate can bind. In contrast, Christopherson (100) and TurnbuII et al. (101)
have proposed through fitting of kinetic models for inhibition, the effects of L-Tyr are
manifested through tertiary structural changes transmitted through the dimer without any
149
changes in quaternary structure. Thus the binding of L-Tyr to one subunit positively
influences the binding of L-Tyr to the second subunit. Turnbull suggested that L-Tyr
must illicit its effects however, by binding to a separate allosteric site since L-arogenate
is a very poor substrate in the E. coli PD-catalyzed reaction.
The residues involved in the interaction between TyrA proteins and L-Tyr are
largely unknown. Using a directed evolution approach Liiktke-Eversloh and
Stephanopoulos (102) introduced random mutations in the E. coli tyrA gene by error-
prone PCR (nucleotide analogue mutagenesis) then selected for growth on media
containing a Tyr analogue m-fluoro-DL-Tyr. They identified, for the first time, Tyr-
insensitive variants. Sequencing of the tyrA gene of the feedback-inhibition-resistant
variants revealed that the residues Tyr263, Ala354 and Phe357 of E. coli CM-PD were
likely involved in the mechanism of Tyr inhibition. The structural significance of these
results are unclear.
In this chapter, we have extended Aponte's work, investigating the effect of L-Tyr
on A. aeolicus PD and A19PD activities over a broad range of temperatures. Protein
variants from A. aeolicus AI9PD characterized in the previous chapter and one variant
from E. coli CM-PD were assayed for Tyr inhibition to determine which of the residues
might be involved in the inhbition. To monitor the binding of L-Tyr by thermodynamic
methods, two rapid assays were developed. Analytical size exclusion chromatography
and analytical ultracentrifugation were performed to determine whether or not the
binding of Tyr is accompanied by quaternary structural changes as reported for the WT
E. coli enzyme.
150
To gain more insight into the catalytic and regulatory mechanism of the E. coli
enzyme, our results will be interpreted in the context of of the crystal structure of A19PD
in complex with NAD+ and L-Tyr reported by our collaborators, and additionally of a
genetically engineered monofunctional PD from H. influenzae CM-PD also in complex
with NAD* plus L-Tyr (unpublished structure by JCSG, www.jcsg.org). As a primilary
study, the monomeric structure of the PD domain of E. coli CM-PD was modeled using
as a template the liganded form of the dimeric PD domain of H. influenza. These two
dehydrogenase-containing domains share a sequence identity of only 55% but residues
shown to be important for the activity of the E. coli enzyme are all conserved. Important
groups involved in Tyr inhibition were identified.
4.1 EXPERIMENTAL PROCEDURES
4.1.1 Materials
Prephenate (sodium salt) was obtained as previously described by Dudzinski and
Morrison (7/5). L-tyrosine was obtained from ICN while NAD+ (Grade I) was from
Roche. 1-anilino-naphatlene sulfonic acid (ANS) was purchased from Sigma. High purity
of the substrates was confirmed by either mass spectrometry or NMR. Concentrations of
stock substrate solutions were determined using published extinction coefficients (115)
and/or enzymatic end-point analysis. All other chemical reagents were obtained
commercially and were of the highest quality available.
151
4.1.2 Source of Enzymes
Purified thrombin-treated A. aeolicus PD, A19PD and Serl26AIa. Glul53Ala.
His217Ala Asp247Ala and Arg250Gln variants were expressed and purified as described
in sections 2.1.3 and 3.1.3. respectively, and stored at -20°C at a concentration >3 mg/mL
in storage buffer. Plasmid DNA of pVIVl {tyrA in pSE380) carrying the mutation
encoding His257Ala was prepared by D. Christendat(J2). E. coli CM-PD (-30 U/mg)
and His257Ala CM-PD variant were expressed and purified by J. Manioudakis as
previously described (53). CM-PD enzymes were stored at -86°C at a concentration > 2
mg/mL in 0.1 M N-ethylmorpholine (pH 7.5), 1 mM EDTA, 20% (v/v) glycerol, 5 mM
DTT.
4.1.3 Effect of L-Tyr on PD Activity of WT and variants of E. coli and A. aeolicus
enzymes
Standard activity assays fox A. aeolicus PD and A19PD were measured at 30, 55
and 80°C as described previously (section 2.1.4). Standard assays for the mutase and
dehydrogenase activities E. coli CM-PD were performed at 30°C as previously described
(53). CM activity is usually monitored by following the disappearance of chorismate at
273 run. The effect of L-Tyr on mutase activity however, was measured in the presence
of NAD (required to help Tyr bind) and at 290 run (due to the high absorbance of Tyr at
280 nm) and by taking into the account the contribution of NADH and HPP at 340 nm.
The initial rates were calculated as described by Heyde and Morrison (95).
Inhibition by Tyr (0-1 mM) on the dehydrogenase activity of PD and A19PD was
recorded at 30, 55 and 80°C using concentrations of 2 mM NAD+ and ~4 x Km for
152
prephenate. Tyr inhibition on A. aeolicus PD and A19PD activity were also monitored
with prephenate as the variable substrate keeping NAD" fixed, and with increasing
concentrations of L-Tyr (see figure legends for details). When appropriate, the Hill
coefficient was obtained from the slope of a plot of log[v/(Fmax - v)] versus Jog
[substrate], using values of v (initial velocity) between 10% and 90% Fmax (maximum
velocity).
The different variants of A. aeolicus A19PD were screened for inhibition by Tyr
(0-1 mM) at 55°C. using concentrations of 2 mM NAD+ and ~4 x Km for prephenate for
each enzyme, except for His217AIa and Arg250Gln, where prephenate concentrations
were kept at ~2 x Km for prephenate and the variants were assayed up to 8 mM L-Tyr.
For the mesophiiic E. coli WT and His257Ala CM-PDs, assays in the presence of Tyr (0-
0.8 mM) were performed at 30°C using concentrations of 2 mM NAD+ and ~4 x Km for
prephenate or chorismate for each enzyme.
4.1.4 Monitoring L-[3,5-3H]Tyrosine Binding in the Presence and the Absence of
Ligands
The ability of WT and variant proteins from E. coli CM-PD and A. aeolicus
A19PD to bind L-Tyr was assessed by radiolabeling experiments. MicroSpin™ G-50
Columns (Amersham Biosciences) were equilibrated in 25 mM Tris (pH 7.4). 75 mM
NaCI, (25 mM NaCl for CM-PD and His257Ala), 1 mM DTT and 2 mM NAD+. Proteins
were buffer exchanged using a NAP M 5 column (Amersham Biosciences) in the same
buffer and concentrated using Ultrafree® -0.5 Centrifugal Filter Device (Millipore). Each
protein (~2 wJVl monomer) was incubated with the same molar ratio of L-[3,5-
153

"HJTyrosine (53.0 mCi/mmol. Amersham Biosciences). The entire reaction volume (36
uL) was then gently transferred to the center of a MicroSpin G-50 Column. Proteins
were eluted by spinning the columns at 2000g for 1 min at room temperature. Then, the
resin was gently washed 4 times with 36 |iL of cold buffer by the same means, careful to
deliver the sample and washes to the center of the column. Elution fraction and washes
were collected and JO U.L aliquots were added to 4 mL of scintillation fluid (ICN).
Radioactivity was monitored using a 1414 WinSpectral liquid scintillator counter
(Wallac). Protein concentration of each fraction was estimated using the Bio-Rad Protein
Assay Kit (Bio-Rad laboratories) using Bovine Serum Albumin (Sigma) as a standard.
Control experiments were done as described above using BSA (ICN).
4.1.5 Monitoring ANS Fluorescence Emission in the Presence and the Absence of
Ligands
The binding of ligand (L-Tyr and/or NAD+) was followed by fluorescence at 30°C
using an Aminco Series 2 Luminescence Spectrometer equipped with a thermostated
holder connected to a circulating water bath. WT CM-PD, A19PD and their respective
variants His257Ala and His214Ala (2 p.M monomer each) prepared with the different
ligands and were incubated with 50 U.M l-anilino-8-naphtalene sulfonic acid (ANS) in
the dark at 30°C in either 50 mM potassium phosphate, 75 mM NaCl (pH 7.5) for the A.
aeolicus enzymes or 50 mM potassium phosphate and 1 mM DTT (pH 7.5) for the E. coli
enzymes. The ANS/protein mixture contained either no ligand. 0.5 mM NAD+, 1 mM
Tyr or 0.5 mM NAD+/1 mM Tyr, all in their respective buffers. Measurements were
performed using a 1 cm path-length cuvette (reaction volume 2 mL). Excitation
154
wavelength was set at 370 nm and emission spectra were recorded from 400 to 600 nm
with bandwidths of 4 nm each. Fluorescence spectra were obtained by subtracting the
appropriate blank and were corrected for inner filter effect(/25).
4.1.6 Determination of Molecular Weight in the Presence and the Absence of
Ligands
4.1.6.1 Analytical Size Exclusion Chromatography
The native molecular weights of A. aeolicus A19PD and E. coli CM-PD and
selected mutants were determined in the absence and presence of 0.5 mM NAD" and 1
raM L-Tyr at ambient temperature by a Pharmacia Akta FPLC system fitted with a
Superdex G-200 column (HR ] 0/30, Pharmacia). Chromatography was performed with
mobile phases containing PPS (pH 7.5) for A. aeolicus A19PD and 50 mM potassium
phosphate, 25 mM NaCl (pH 7.5) and 1 mM DTT for the E. coli enzymes, with and
without ligands. Flow rate was set at 0.75 mL/min and injection volume was 500 pJL.
Elution was monitored at 290, 300 and 310 nm, and fractions (1 mL) were assayed for
enzyme activity and inhibition by L-Tyr. Bio-Rad gel filtration protein standards included
vitamin Bn (1.35 kDa), equine myoglobin (17 kDa), chicken ovalbumin (44 kDa), bovine
y-globulin (158 kDa), thyroglobulin (670 kDa). Void volume and total bed volume were
evaluated with Blue Dextran and DTT, respectively.
4.1.6.2 Analytical Ultracentrifugation
Native molecular weight of A19PD in the absence and the presence of 1 mM L-
Tyr/NAD+ was investigated by sedimentation velocity experiments. Samples were
155
prepared as outlined in section 2.1.5.2 and the sedimentation data were acquired with the
interference optical scanning system of the Beckman XL-I analytical ultracentrifuge.
Values for the sedimentation coefficient (s) and an average molar mass were calculated
as previously described (see section 2.1.5.2).
4.1.7 Modeling of the PD domain ofE. coli CM-PD
Modeller 9v3 was used to model the monomeric PD domain of CM-PD against
the known structure of//, influenzae CM-PD (PDB access code 2pv7). A structure-based
alignment of E. coli CM-PD with the H. influenzae protein was obtained using the
FFAS03 server (http://ffas.ljcrf.edu/ffas-cei-cgi/ffas.pl). The FFAS03-generated
alignment was used as input for Modeller 9v3. which generated a 3 D model of E. coli
PD on this input.
4.2 RESULTS
4.2.1 Effects of Tyr on PD Activity at Different Temperatures
Inhibition studies were performed on both A. aeolicus PD and A19PD at 30. 55
and 80°C using varying amounts of L-Tyr (0-1.0 mM) at fixed concentrations of
prephenate and NAD+. PD was inhibited up to 60% by 1 mM L-Tyr (Figure 4.1), when
assayed at 30°C or 55°C in the presence of 2 mM NAD+ and at a prephenate
concentration 4 x Km at each temperature. This value increased to 90% inhibition at 80°C.
which is similar to the pattern for E. coli CM-PD at 30°C obtained using similar ratios of
substrate concentration to Km(56). These trends were also noted for A19PD, although the
degree of inhibition was lower. When the data were plotted as specific activity as a
156
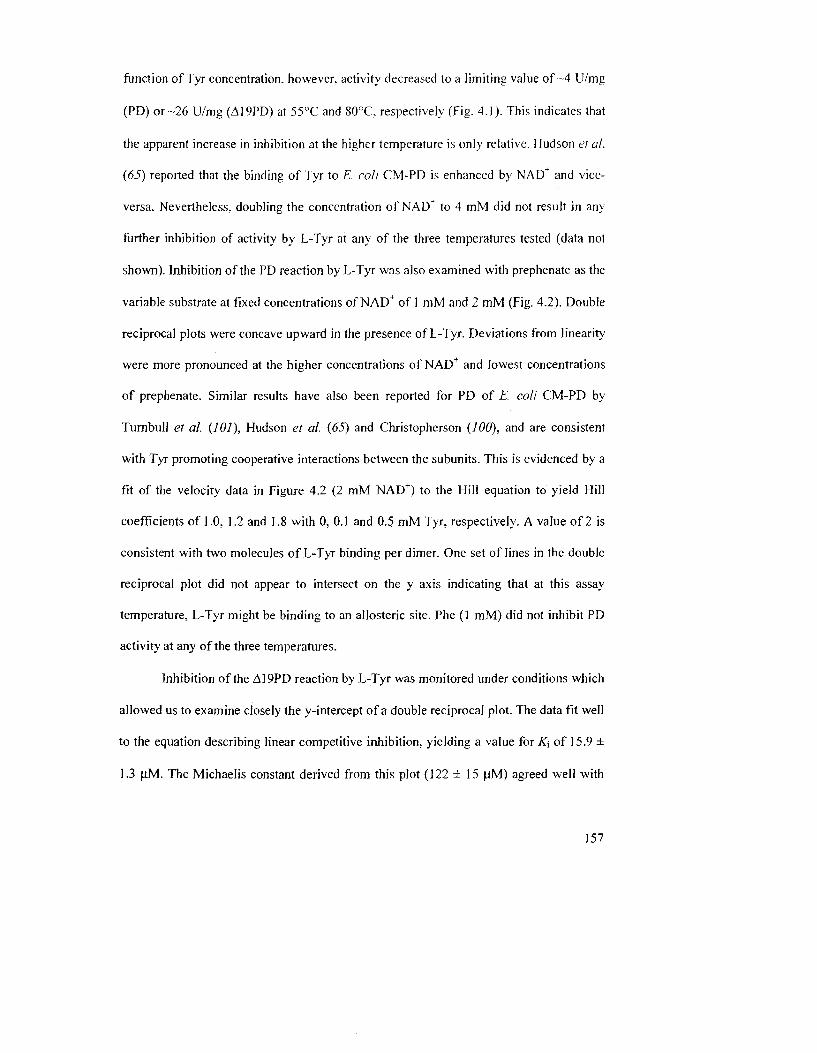
function of Tyr concentration, however, activity decreased to a limiting value of ~4 U/mg
(PD) or -26 U/mg (A19PD) at 55°C and 80°C. respectively (Fig. 4.1). This indicates that
the apparent increase in inhibition at the higher temperature is only relative. Hudson ei al.
(65) reported that the binding of Tyr to E. coli CM-PD is enhanced by NAD+ and vice-
versa. Nevertheless, doubling the concentration of NAD+ to 4 mM did not result in any
further inhibition of activity by L-Tyr at any of the three temperatures tested (data not
shown). Inhibition of the PD reaction by L-Tyr was also examined with prephenate as the
variable substrate at fixed concentrations of NAD+ of 1 mM and 2 mM (Fig. 4.2). Double
reciprocal plots were concave upward in the presence of L-Tyr. Deviations from linearity
were more pronounced at the higher concentrations of NAD+ and lowest concentrations
of prephenate. Similar results have also been reported for PD of E. coli CM-PD by
Turnbull et al. (101), Hudson et al. (65) and Christopherson (100), and are consistent
with Tyr promoting cooperative interactions between the subunits. This is evidenced by a
fit of the velocity data in Figure 4.2 (2 mM NAD+) to the Hill equation to yield Hill
coefficients of 1.0. 1.2 and 1.8 with 0. 0.1 and 0.5 mM Tyr. respectively. A value of 2 is
consistent with two molecules of L-Tyr binding per dimer. One set of lines in the double
reciprocal plot did not appear to intersect on the y axis indicating that at this assay
temperature, L-Tyr might be binding to an allosteric site. Phe (] mM) did not inhibit PD
activity at any of the three temperatures.
Inhibition of the A19PD reaction by L-Tyr was monitored under conditions which
allowed us to examine closely the y-intercept of a double reciprocal plot. The data fit well
to the equation describing linear competitive inhibition, yielding a value for K\ of 15.9 ±
1.3 jtM. The Michaelis constant derived from this plot (122 ± 15 |^M) agreed well with
157

the value given in Table 3.2. It is noteworthy that the double reciprocal plots generated
for A19PD also displayed some non-linear behaviour at the highest concentration of L-
Tyr (0.2 mM) and the lowest concentration of prephenate.
0 0.2 0.4 0.6 0.8 1
Tyrosine (mM)
Figure 4.1: Effects of Tyr on PD activity. Inhibition of dehydrogenase activity of A.
aeolicus PD (squares). A19PD (small squares, broken lines) and E. coli CM-PD (circles)
by Tyr. Reactions with PD and A19PD were performed at 30 (0). 55 (D) and 80°C (•)
using ~4 x Km for prephenate for each temperature and NAD+ was fixed at 2 mM. The pH
of the buffer was adjusted to the desired values at 55°C and 80°C. Data for CM-PD were
obtained at 30°C in the presence of 160 u;M prephenate. Assays were performed as
described in section 4.1.3
158
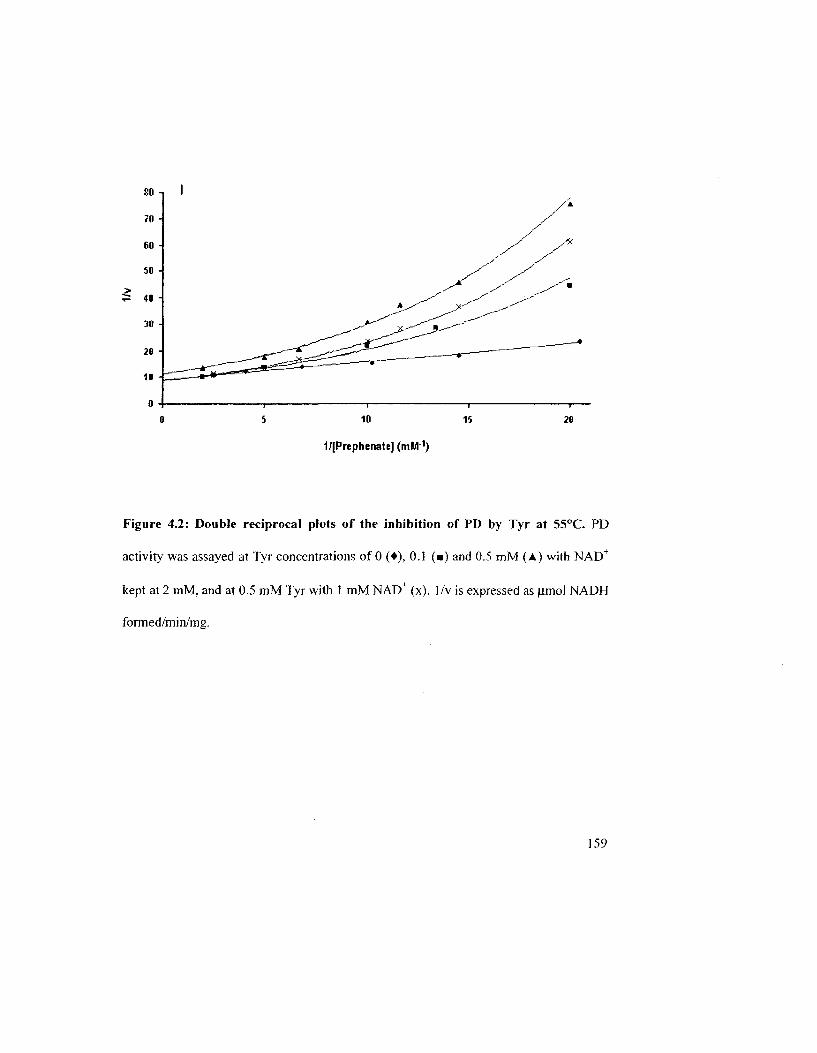
10 15
1/[PrephenateJ (mM1)
Figure 4.2: Double reciprocal plots of the inhibition of PD by Tyr at 55°C. PD
activity was assayed at Tyr concentrations of 0 (•). O.l (•) and 0.5 mM (A) with NAD+
kept at 2 mM. and at 0.5 mM Tyr with l mM NAD* (x). l/v is expressed as (imol NADH
formed/min/mg.
159
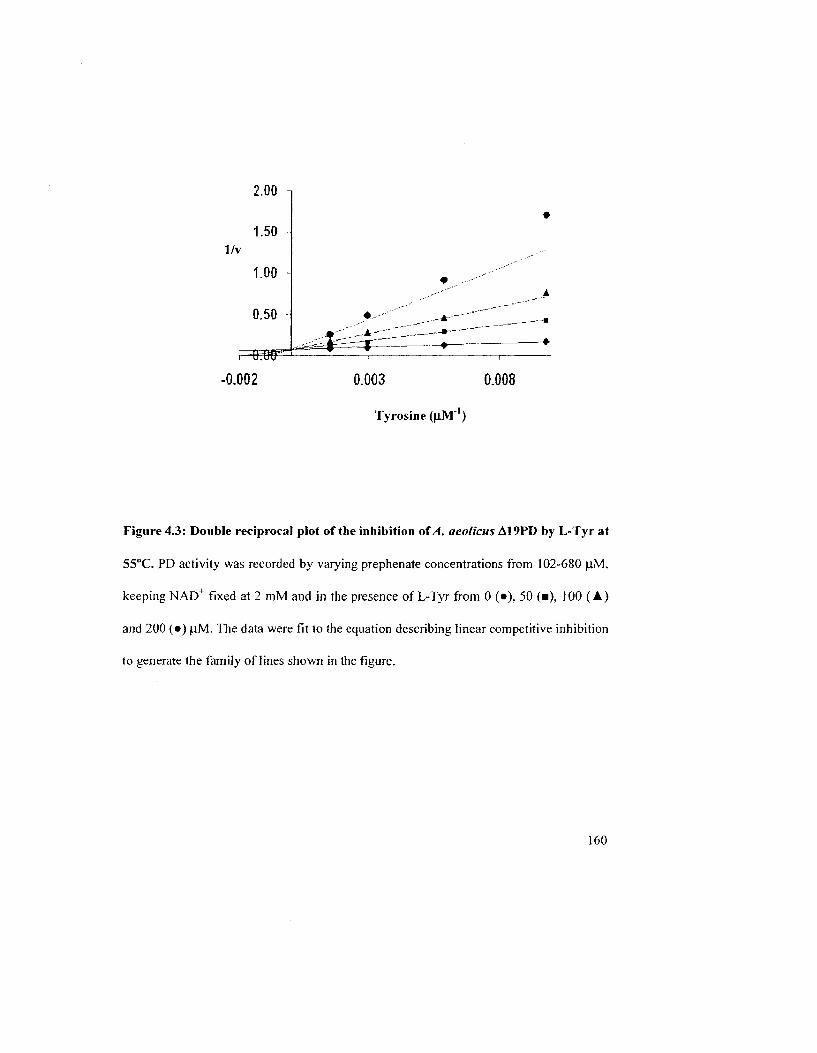
2.00 n
1.50 -1/v
1.00 -
0.50 -
i uTUu
•
• ,...---"'
...••" "C——^"jm^—^ -^'-X^—T ~~~~~ - - *—— • •
! t
-0.002 0.003 0.008
Tyrosine (uJVT1)
Figure 4.3: Double reciprocal plot of the inhibition of A. aeolicus A19PD by L-Tyr at
55°C. PD activity was recorded by varying prephenate concentrations from 102-680 jiM,
keeping NAD+ fixed at 2 mM and in the presence of L-Tyr from 0 (•), 50 (•), 100 (A)
and 200 (•) |i]Vl. The data were fit to the equation describing linear competitive inhibition
to generate the family of lines shown in the figure.
160
4.2.2 Effects of L-Tyr on the PD Activity of WT Enzymes and Variants from A.
aeolkus Al 9PD and E. coli CM-PD
Aquifex aeolicus enzymes
The PD activity of WT and variant E. coli and A. aeolicus enzymes were examined in the
presence of increasing concentration of L-Tyr and the results are shown in Figures 4.3.
4.5 and 4.6. As previously shown, the activity of A19PD appears only partially inhibited,
up to about 70% by 1 mM Tyr at 55°C. Under the same experimental conditions, the
activity of the variants Serl26Ala. Asp247Ala and Glul53Ala were also inhibited by L-
Tyr, however with the ranking of WT = Serl26Ala < Glul53Ala « Asp246Ala (at the
higher Tyr concentrations). The most striking result is that His217Ala activity is not
inhibited at all by L-Tyr. Extending the Tyr concentration up to 8 mM produced the same
results (see Figure 4.4). The effect of L-Tyr on Arg250Gln activity was also tested,
revealing that this variant is clearly less sensitive to feedback inhibition by Tyr than the
WT protein. His217Ala or Arg250Gln displayed Km values for NAD+ that were
comparable to WT enzyme (see Chapter 3 Table 3.4), hence the feedback resistance was
not due to poor binding of the cofactor.
161
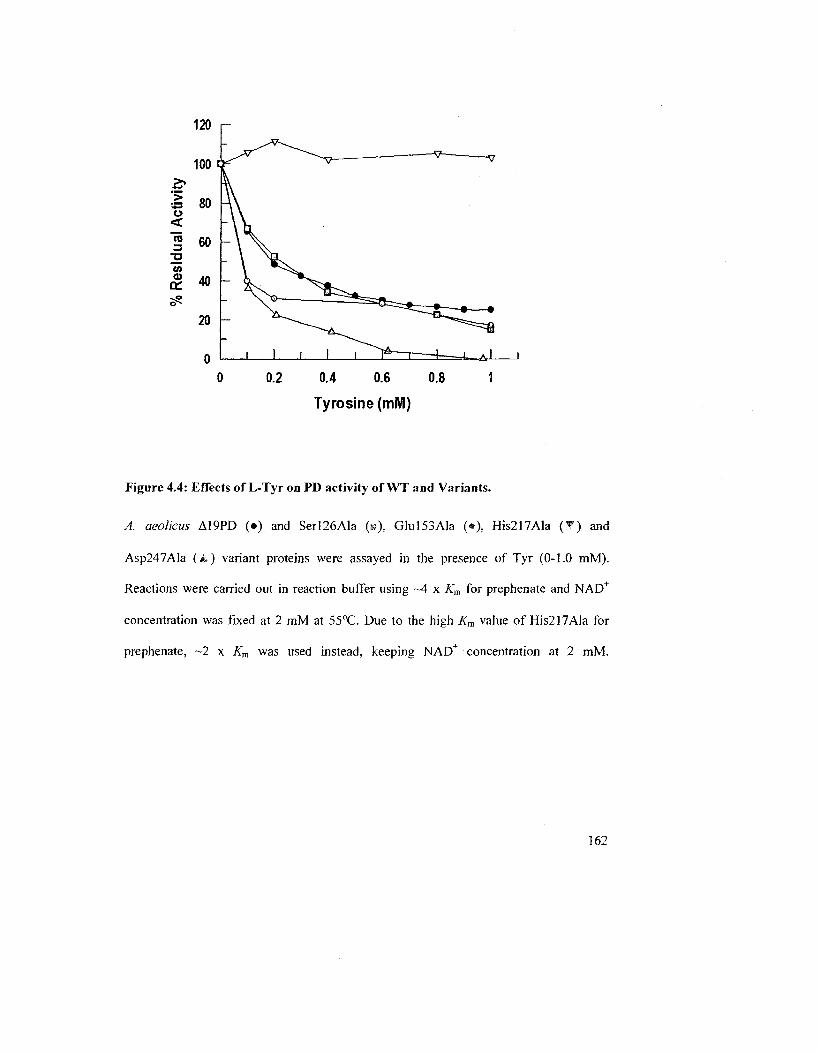
120 r
Figure 4.4: Effects of L-Tyr on PD activity of WT and Variants.
A. aeolicus A19PD (•) and Serl26Ala (m% Glul53Ala (*), His217Ala ( • ) and
Asp247Ala (A) variant proteins were assayed in the presence of Tyr (0-1.0 mM).
Reactions were carried out in reaction buffer using ~4 x Km for prephenate and NAD+
concentration was fixed at 2 mM at 55°C. Due to the high Km value of His217Ala for
prephenate, ~2 x Km was used instead, keeping NAD+ concentration at 2 mM.
162
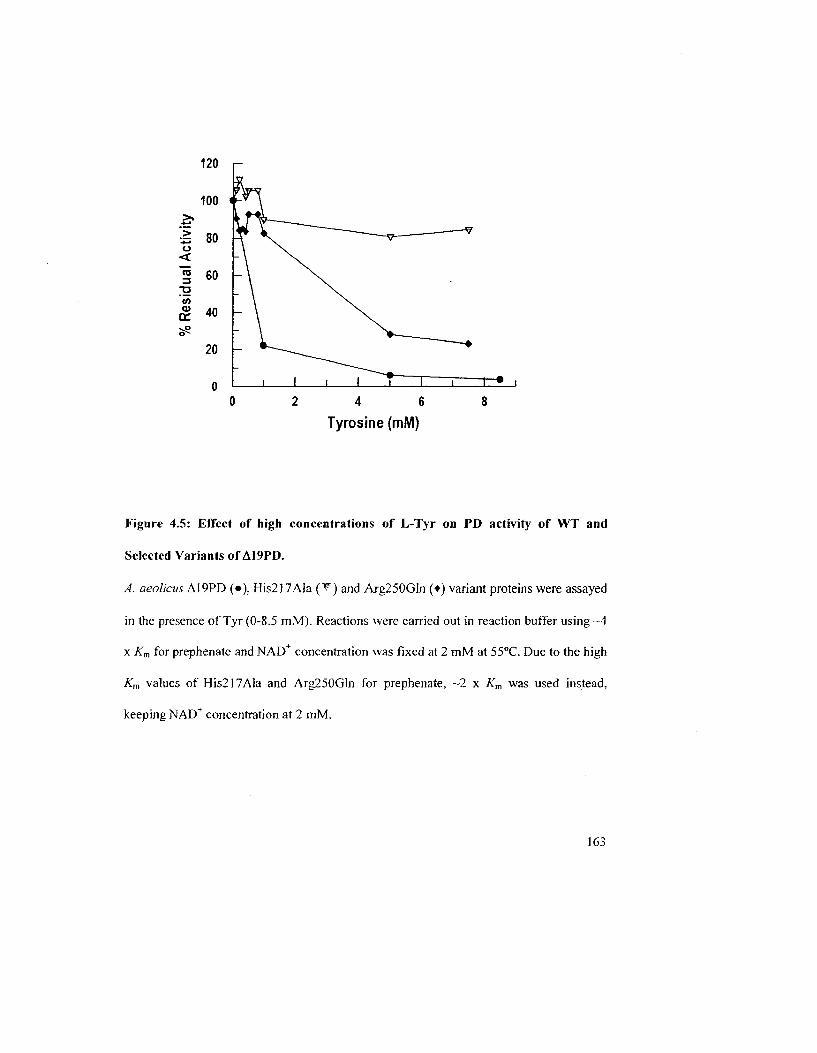
120
ioo 4-'
£ 80 o <
"» a> a:
60
40
20
2 4 6
Tyrosine (mM)
Figure 4.5: Effect of high concentrations of L-Tyr on PD activity of WT and
Selected Variants of A19PD.
A. aeolicus A19PD (•). His217Ala (V) and Arg250Gln (•) variant proteins were assayed
in the presence of Tyr (0-8.5 mM). Reactions were carried out in reaction buffer using ~4
x Km for prephenate and NAD+ concentration was fixed at 2 mM at 55°C. Due to the high
Km values of His217Ala and Arg250Gln for prephenate, ~2 x Km was used instead,
keeping NAD+ concentration at 2 mM.
163
E. coli enzymes
The effect of L-Tyr on the CM and PD activities off. coli CM-PD and His257Ala was
also investigated. Under the experimental conditions given in the text, both mutase and
dehydrogenase activities were inhibited by L-Tyr to the same extent, and hence contrasts
previous reports that PD was more sensitive to inhibition than CM (101). His257Ala
exhibited kinetic parameters for the PD reaction in the absence of L-Tyr that were
comparable to the values obtained for WT enzyme, although kcaX/Km value for the mutase
reaction was reduced by over an order of magnitude by the mutation (see Table 4.1).
Under conditions that yielded almost complete inhibition of WT CM-PD activities, the
variant was insensitive to the effects of L-Tyr. These results are in agreement with
previous work done in our lab by T. Lee.
164
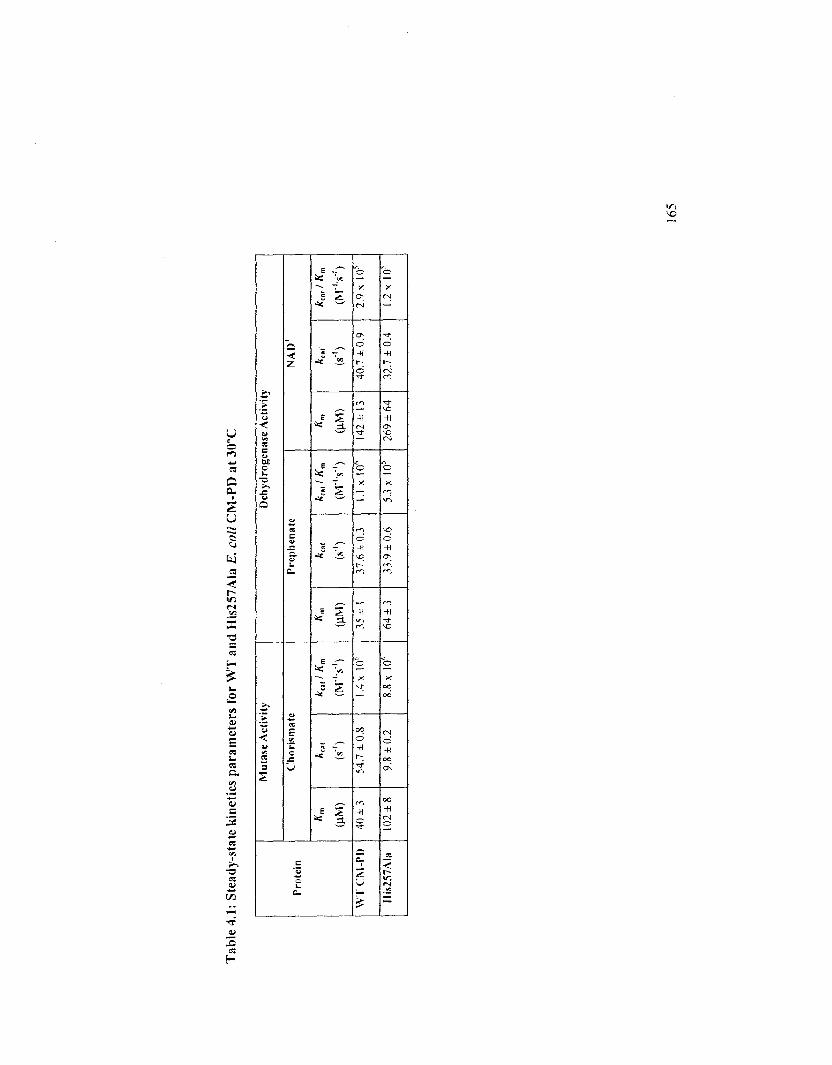
Tab
le 4
.1:
Stea
dy-s
tate
kin
etic
s pa
ram
eter
s fo
r W
T a
nd H
is25
7Ala
E. c
oli C
M-P
D a
t 30
°C
Prot
ein
WT
CM
-PI)
llis2
57A
la
Mut
asc
Act
ivity
Cho
rism
atc
OlM
)
40 ±
3
102
±8
"cat
54.7
±0
.8
9.8
±0
.2
"cat
'
"m
(M"V
)
1.4
x I0
6
8.8
x 10
*
Deh
ydro
gen
ase
Act
ivit
y
Prc
ph
enat
c
35 ±
1
64 ±
3
37.6
± 0
.3
33.9
± 0
.6
(IV
r'V
1)
I.I x
10"
5.3
x I0
5
NA
D+
Km
(M.M
)
142
± 13
269
± 64
"cat
40.7
±0
.9
32.7
± 0
.4
Aca
l /
Km
(M-'
s-1)
2.9
x 10
-
1.2
x 10
'
165
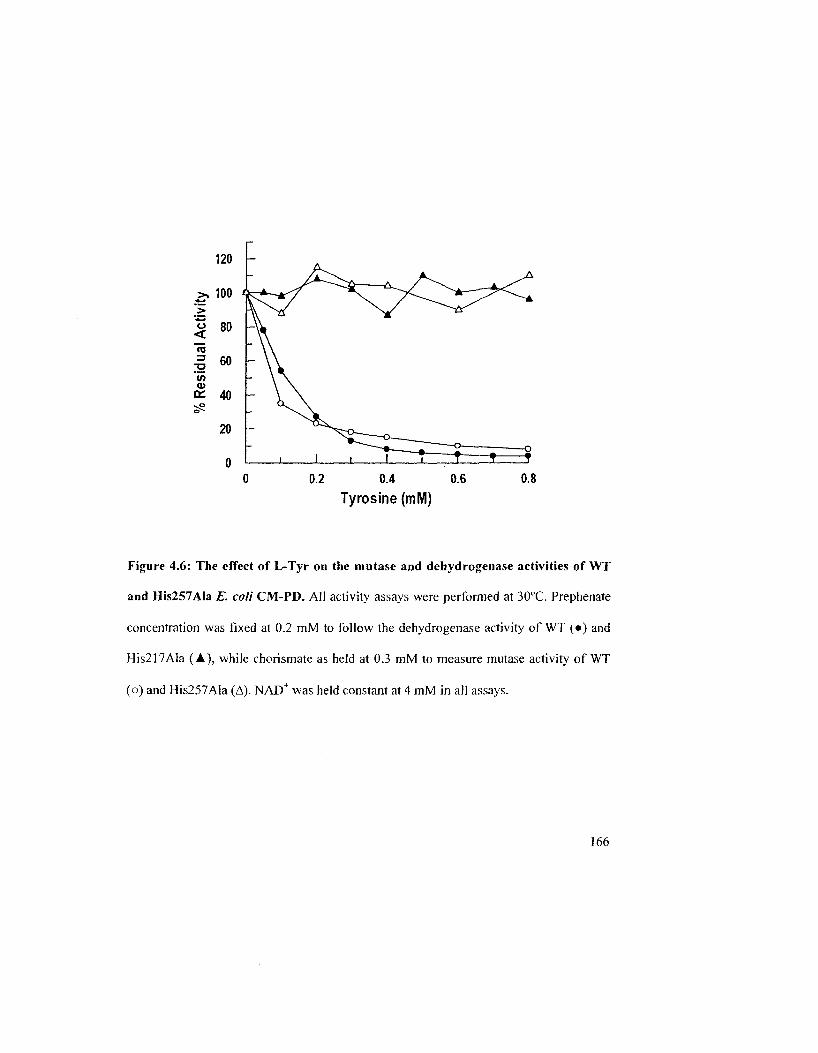
Tyrosine (mM)
Figure 4.6: The effect of L-Tyr on the mutase and dehydrogenase activities of WT
and His257Ala E. coli CM-PD. All activity assays were performed at 30°C. Prephenate
concentration was fixed at 0.2 mM to follow the dehydrogenase activity of WT (•) and
His217Ala (A), while chorismate as held at 0.3 mM to measure mutase activity of WT
(o) and His257Ala (A). NAD+ was held constant at 4 mM in all assays.
166
4.2.3 Binding of L-Tyr to the WT and Variant Enzymes Assessed by Radiolabeling
Experiments
We have established a qualitative method to rapidly monitor L-Tyr binding. This
method follows the elution pattern of a radiolabeled small molecule as it passes through
a size exclusion column. Briefly, if the radiolabeled Tyr (small molecule) binds to a
protein (large molecule) then it will travel faster through size exclusion media, whereas
unbound Tyr is more easily trapped within the beads of the column media and the elution
of the radiolabel is retarded. The eluate is assayed during different time periods for
radioactivity (scintillation counting) and protein content (Bio-Rad protein assay) as the
column is washed in order to detect the presence of a protein-ligand complex. In the
experiments presented here, the binding of L-[3.5-;>H]Tyrosine to A. aeolicus A19PD or
E. coli CM-PD (1:1 molar ratio) was monitored as these species traveled through
MicroSpin™ G-50 size exclusion columns. NAD (2 mM) was present in all solutions
since NAD+ has been reported previously to promote Tyr binding^). The results are
presented in Table 4.2. WT protein (either E. coli CM-PD or A. aeolicus A19PD) co-
eluted with radiolabel in the first fraction signifying that these proteins could bind L-Tyr.
In contrast, results for the variant proteins (either His257Ala CM-PD or His217Ala
A19PD) showed that the highest amount of radioactivity was associated with the protein-
free fraction, indicating that these variants did not bind Tyr or possessed a much weaker
affinity for the ligand compared to their wild-type counterparts. A control experiment
was performed with BSA (a protein that does not bind Tyr) which clearly shows
167
radioactivity in the latter fractions. A similar result was obtained when the experiment
was performed in the absence of protein (data not shown).
Table 4.2: Radiolabelling experiments3.
BSA WTCM-PD His257Ala
Fractions
Elution
Wash 1
Wash II
cpm
301
1014
2729
OD595nro
0.395
0.0092
0.0027
cpm
9512
942
3143
OD595„m
0.295
0.0053
0.0028
cpm
195
2701
2528
OD595„„,
0.306
0.0087
0.0017
WTA19PD His217Ala
Fractions
Elution
Wash I
Wash II
cpm
1693
889
1127
OD59,m
0.185
0.007
-
cpm
90
718
1059
OD595nm
0.197
0.0051
-
"Radiolabelling experiments were carried out as described in section 4.1.4. BSA was used as a control in both experiments. brepresents counts per minute Represents the absorbance obtained at 595 nm from the mixture of an aliquot (10 uL) of collected fraction with 1 mL of Bradford reagent allowing protein content determination.
4.2.4 ANS Binding Experiments
A fluorimetric assay was developed to monitor Tyr binding and/or conformational
changes which may occur upon the interaction of L-Tyr with WT and His257Ala E. coli
CM-PD and the corresponding A19PD enzymes of A. aeolicus. The fluorescent dye 1-
anilinonaphtalene-8-suIphonic acid (ANS) has been widely used to study protein
conformational changes. The assay is based on the intrinsic increase in ANS fluorescence
quantum yield upon noncovalent binding to hydrophobic region of proteins(76~2). ANS is
also reported to bind to pockets of charged residues within proteins to illicit similar
168
effects. Upon addition of NAD+ to all the proteins the fluorescence intensities decreased
(Fig. 4.7). consistent with a conformational change that reduces either the hydrophobic
surface area or alters the surface charge distribution of the proteins, or with the
displacement of ANS by NAD+ since the dye has been reported to bind at nucleotide-
binding sites(742, 141). Upon the addition of Tyr in the presence of NAD+. the
fluorescence intensity for WT CM-PD E. coli and A. aeolicus A19PD decreased further
which signifie s Tyr binding. Interestingly, His257Ala of E. coli CM-PD and His217Ala
A19PD of A. aeolicus, whose activities were not inhibited by Tyr, exhibited only very
small changes in ANS fluorescence intensity in the presence of Tyr and/or NAD
(Figures 4.7).
4.2.5 Molecular Weight of WT and Variant Proteins in the Presence and Absence of
Ligands
To determine if inhibition by L-Tyr is accompanied by tetramer formation as
previously noted for CM-PD((5J), size exclusion FPLC was performed at ambient
temperature with a mobile phase containing 0.5 mM NAD+ and 1 mM L-Tyr, and the
results were compared with those in the absence of ligands. This assay was performed on
WT and variant E. coli CM-PDs and A. aeolicus PDs (50-60 u;M monomer). The
mobilities of the standards were essentially identical in the presence and absence of
ligands (data not shown). In the presence of 1 mM L-Tyr and 0.5 mM NAD+, WT CM-
PD underwent a shift in retention time corresponding to a
169
Figure 4.7: Emission spectra of ANS complexed with WT and His257AIa E. coli
CM-PD in the absence and the presence of Hgands.
For each spectrum, 2 pM monomer and 50 pM ANS were mixed together with (—) no
ligand, ( - ) 1 mM Tyr, ( ) 0.5 mM NAD\ ( - ) 1 mM Tyr/0.5 mM NAD+ in 50 mM
potassium phosphate, 75 mM NaCl (pH 7.5) buffer. (—) is the spectrum of 50 uM ANS/1
mM Tyr/0.5 mM NAD+ without enzyme in the same buffer. Excitation was set at 370 nm
and fluorescence spectra were recorded from 400 to 600 nm. Emission spectra were
corrected from for background and for inner filter effects when appropriate (125).
170
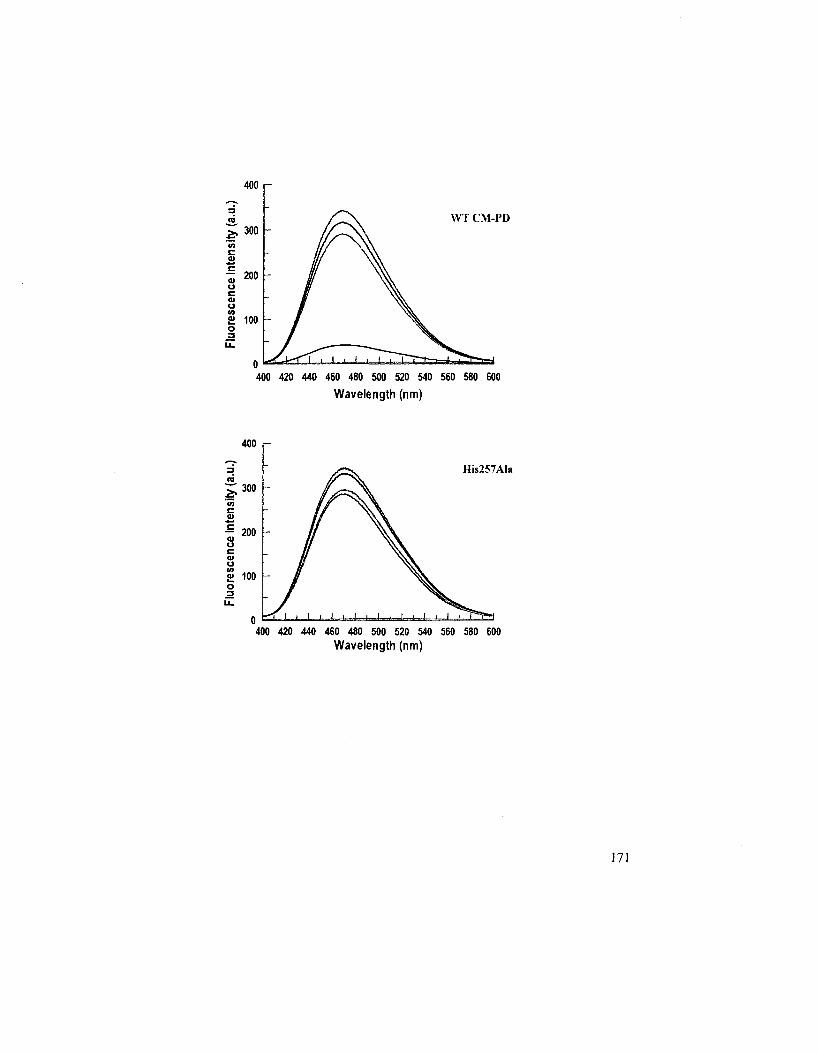
400 _ d ni ^ 300 CO c £ c - 200 u c O) u to 2> 100 o J3 u.
n
"~
_
— al
J^<r
WT CM-PD
400 420 440 460 480 500 520 540 560 580 600
Wavelength (nm)
His257AIa
400 420 440 460 480 500 520 540 560 580 600 Wavelength (nm)
171
molecular weight increase from 89 kDa (no ligands) to 174 kDa (with ligands). indicating
tetramer formation. This result coincides with previously reported data (65).
Interestingly, in the presence of both Tyr and NAD". His257Ala CM-PD eluted mainly as
a dimer: the estimated molecular weight increased from 74 kDa to only 99 kDa. Some
tetrameric species (in rapid equilibrium with the dimer) may be present, promoted by the
binding of NAD" as previously reported for the E. coli enzyme (65). Neither PD (54 kDa)
nor A19PD (52 kDa) showed altered retention times when ligands were present (Table
4.3), confirming the previous report by Aponte(/(?<5). Further analysis of A. aeolicus PD
using interference sedimentation velocity experiments yielded sedimentation coefficient
values for the enzyme that were similar in the absence and presence of L-Tyr plus NAD4
thus indicating that PD remained dimeric (data not shown).
172
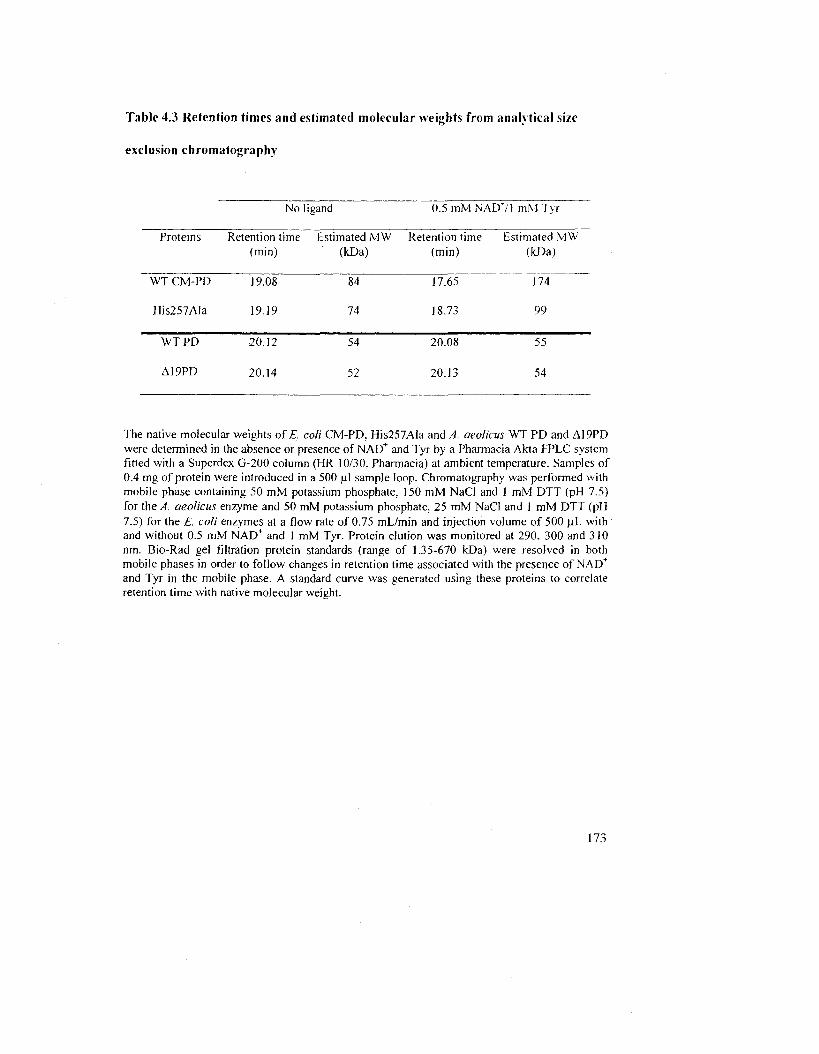
Table 4.3 Retention times and estimated molecular weights from analytical size
exclusion chromatography
No ligand 0.5 mM NAD71 mM Tyr
Proteins
WT CM-PD
His257Ala
WTPD
A19PD
Retention time (min)
19.08
19.19
20.12
20.14
Esti mated MW (kDa)
84
74
54
52
Retention time (min)
17.65
18.73
20.08
20.13
Estimated MW (kDa)
174
99
55
54
The native molecular weights of E. coll CM-PD. His257Ala and A. aeolicus WT PD and A19PD were determined in the absence or presence of NAD+ and Tyr by a Pharmacia Akta FPLC system fitted with a Superdex G-200 column (HR 10/30. Pharmacia) at ambient temperature. Samples of 0.4 mg of protein were introduced in a 500 ul sample loop. Chromatography was performed with mobile phase containing 50 mM potassium phosphate. 150 mM NaCl and 1 mM DTT (pH 7.5) for the A. aeolicus enzyme and 50 mM potassium phosphate. 25 mM NaCl and 1 mM DTT (pH 7.5) for the K coli enzymes at a flow rate of 0.75 mL/min and injection volume of 500 (iL with and without 0.5 mM NAD+ and 1 mM Tyr. Protein elution was monitored at 290. 300 and 310 nm. Bio-Rad gel filtration protein standards (range of 1.35-670 kDa) were resolved in both mobile phases in order to follow changes in retention time associated with the presence of NAD+
and Tyr in the mobile phase. A standard curve was generated using these proteins to correlate retention time with native molecular weight.
173
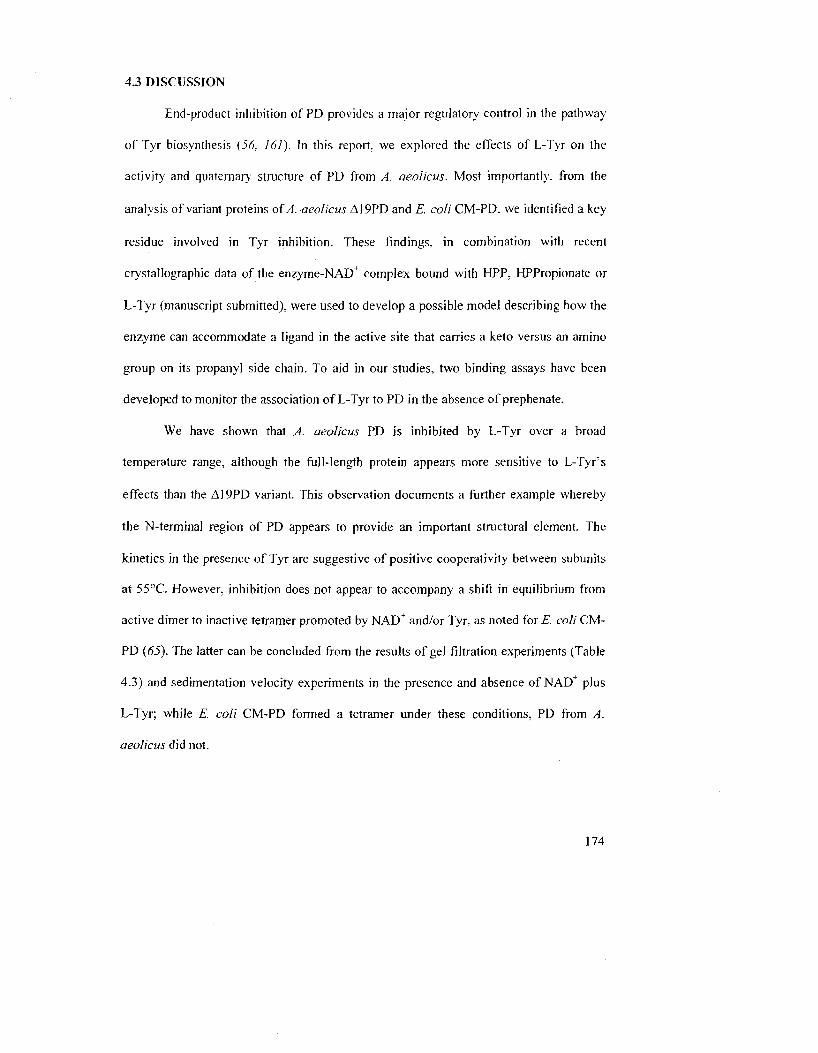
4.3 DISCUSSION
End-product inhibition of PD provides a major regulatory control in the pathway
of Tyr biosynthesis (56, 161). In this report, we explored the effects of L-Tyr on the
activity and quaternary structure of PD from A. aeolicus. Most importantly, from the
analysis of variant proteins of A. aeolicus A19PD and E. coli CM-PD. we identified a key
residue involved in Tyr inhibition. These findings, in combination with recent
crystallographic data of the enzyme-NAD+ complex bound with HPP, HPPropionate or
L-Tyr (manuscript submitted), were used to develop a possible model describing how the
enzyme can accommodate a ligand in the active site that carries a keto versus an amino
group on its propanyl side chain. To aid in our studies, two binding assays have been
developed to monitor the association of L-Tyr to PD in the absence of prephenate.
We have shown that A. aeolicus PD is inhibited by L-Tyr over a broad
temperature range, although the full-length protein appears more sensitive to L-Tyrs
effects than the Al 9PD variant. This observation documents a further example whereby
the N-terminal region of PD appears to provide an important structural element. The
kinetics in the presence of Tyr are suggestive of positive cooperativity between subunits
at 55°C. However, inhibition does not appear to accompany a shift in equilibrium from
active dimer to inactive tetramer promoted by NAD+ and/or Tyr. as noted for E. coli CM-
PD (65). The latter can be concluded from the results of gel filtration experiments (Table
4.3) and sedimentation velocity experiments in the presence and absence of NAD+ plus
L-Tyr: while E. coli CM-PD formed a tetramer under these conditions, PD from A.
aeolicus did not.
174
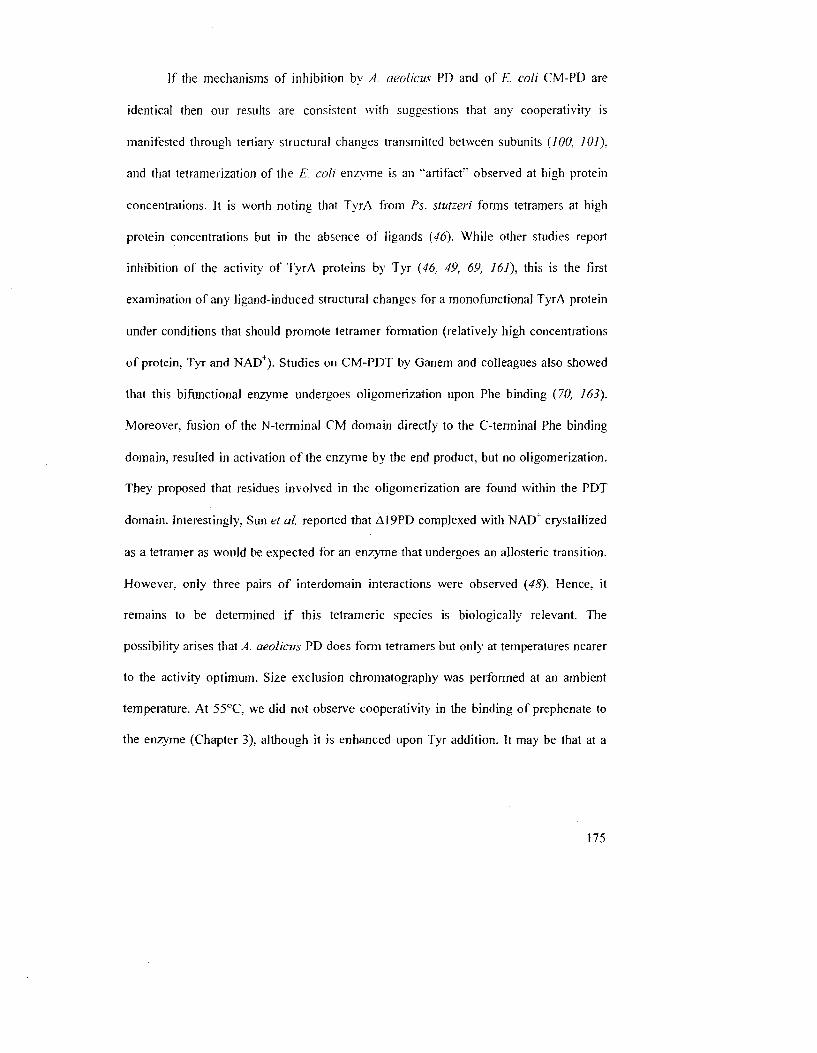
]f the mechanisms of inhibition by A. aeolicus PD and of E. coli CM-PD are
identical then our results are consistent with suggestions that any cooperativity is
manifested through tertian' structural changes transmitted between subunits (100, 101),
and that tetramerization of the E. coli enzyme is an "artifact" observed at high protein
concentrations. It is worth noting that TyrA from Ps. stutzeri forms tetramers at high
protein concentrations but in the absence of ligands (46). While other studies report
inhibition of the activity of TyrA proteins by Tyr (46, 49, 69, 161), this is the first
examination of any h'gand-induced structural changes for a mono functional TyrA protein
under conditions that should promote tetramer formation (relatively high concentrations
of protein, Tyr and NAD+). Studies on CM-PDT by Ganem and colleagues also showed
that this bifunctional enzyme undergoes oligomerization upon Phe binding (70, 163).
Moreover, fusion of the N-terminal CM domain directly to the C-terminal Phe binding
domain, resulted in activation of the enzyme by the end product, but no oligomerization.
They proposed that residues involved in the oligomerization are found within the PDT
domain. Interestingly, Sun et al. reported that A19PD complexed with NAD" crystallized
as a tetramer as would be expected for an enzyme that undergoes an allosteric transition.
However, only three pairs of interdomain interactions were observed (48). Hence, it
remains to be determined if this tetrameric species is biologically relevant. The
possibility arises that A. aeolicus PD does form tetramers but only at temperatures nearer
to the activity optimum. Size exclusion chromatography was performed at an ambient
temperature. At 55°C, we did not observe cooperativity in the binding of prephenate to
the enzyme (Chapter 3), although it is enhanced upon Tyr addition. It may be that at a
175
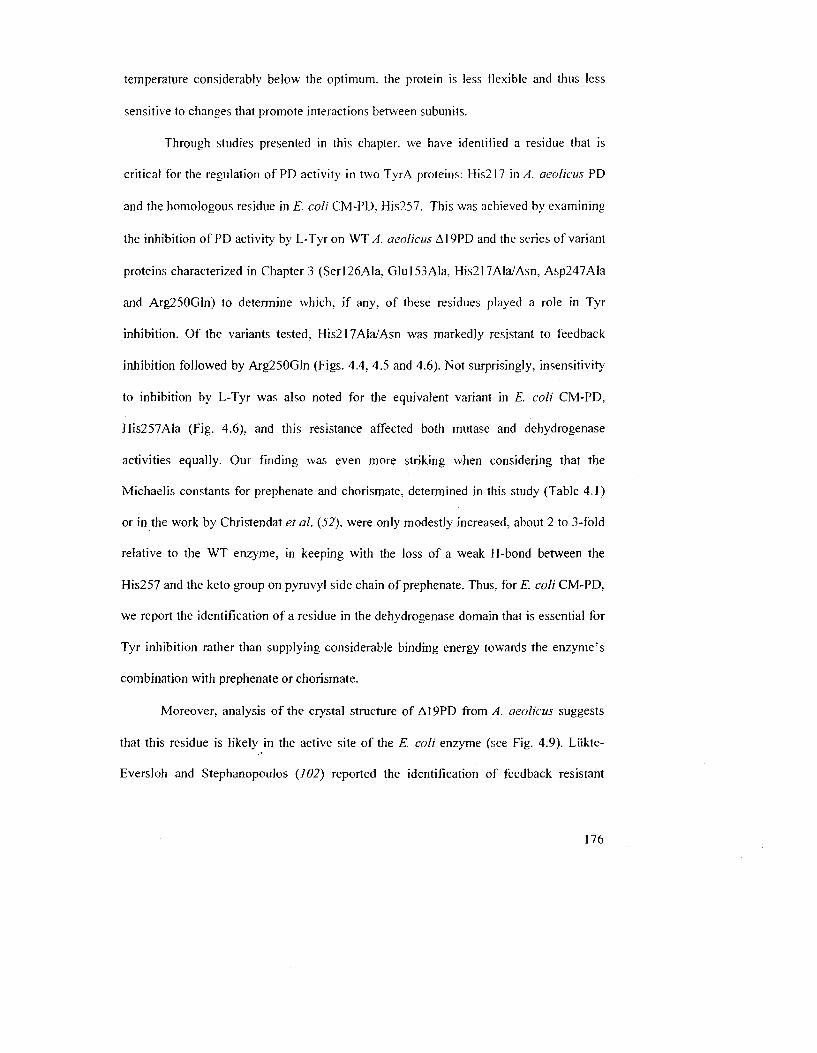
temperature considerably below the optimum, the protein is less flexible and thus less
sensitive to changes that promote interactions between subunits.
Through studies presented in this chapter, we have identified a residue that is
critical for the regulation of PD activity in two TyrA proteins: His217 in A. aeolicus PD
and the homologous residue in E. coli CM-PD, His257. This was achieved by examining
the inhibition of PD activity by L-Tyr on WT A. aeolicus A19PD and the series of variant
proteins characterized in Chapter 3 (Serl26Ala, Glul53Ala, His217Ala/Asn, Asp247Ala
and Arg250Gln) to determine which, if any. of these residues played a role in Tyr
inhibition. Of the variants tested, His217Ala/Asn was markedly resistant to feedback
inhibition followed by Arg250Gln (Figs. 4.4, 4.5 and 4.6). Not surprisingly, insensitivity
to inhibition by L-Tyr was also noted for the equivalent variant in E coli CM-PD,
His257Ala (Fig. 4.6), and this resistance affected both mutase and dehydrogenase
activities equally. Our finding was even more striking when considering that the
Michaelis constants for prephenate and chorismate, determined in this study (Table 4.1)
or in the work by Christendat et al. (52), were only modestly increased, about 2 to 3-fold
relative to the WT enzyme, in keeping with the loss of a weak H-bond between the
His257 and the keto group on pyruvyl side chain of prephenate. Thus, for E. coli CM-PD,
we report the identification of a residue in the dehydrogenase domain that is essential for
Tyr inhibition rather than supplying considerable binding energy towards the enzyme's
combination with prephenate or chorismate.
Moreover, analysis of the crystal structure of A19PD from A. aeolicus suggests
that this residue is likely in the active site of the E. coli enzyme (see Fig. 4.9). Liikte-
Eversloh and StephanopouJos {102} reported the identification of feedback resistant
176
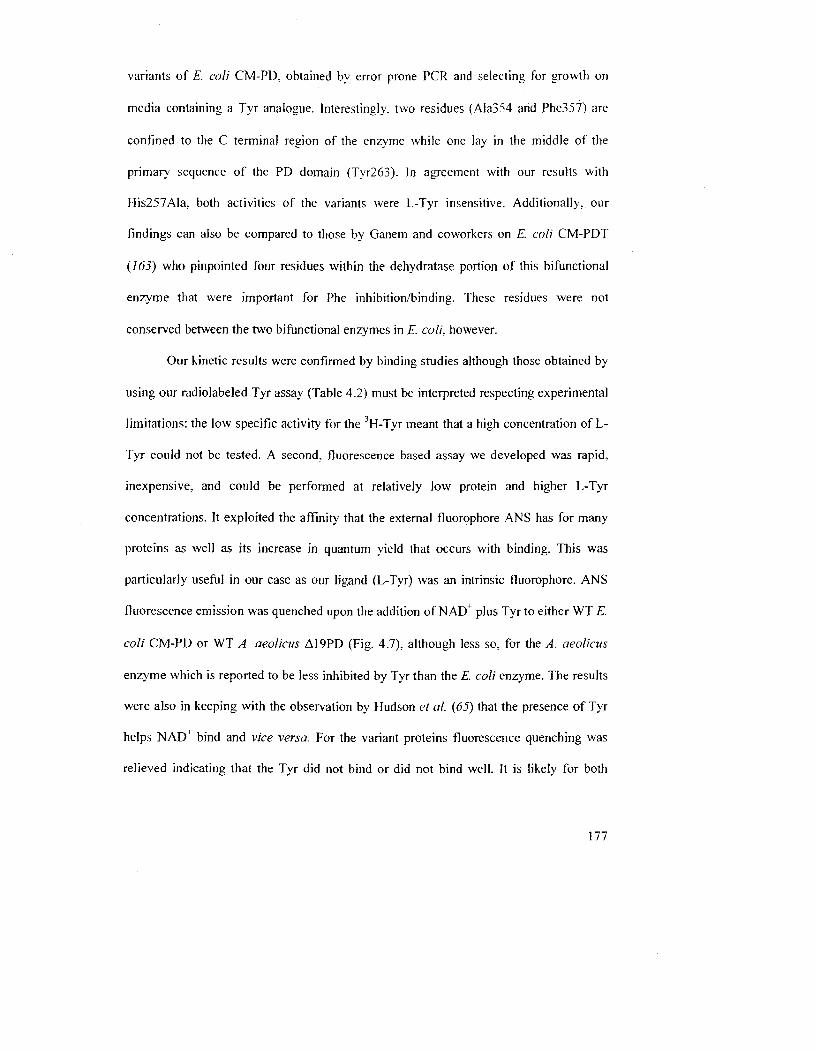
variants of E. coli CM-PD. obtained by error prone PCR and selecting for growth on
media containing a Tyr analogue. Interestingly, two residues (AIa354 and Phe357) are
confined to the C terminal region of the enzyme while one lay in the middle of the
primary sequence of the PD domain (Tyr263). In agreement with our results with
His257AIa. both activities of the variants were L-Tyr insensitive. Additionally, our
findings can also be compared to those by Ganem and coworkers on E. coli CM-PDT
(163) who pinpointed four residues within the dehydratase portion of this bifunctional
enzyme that were important for Phe inhibition/binding. These residues were not
conserved between the two bifunctional enzymes in E. coli, however.
Our kinetic results were confirmed by binding studies although those obtained by
using our radiolabeled Tyr assay (Table 4.2) must be interpreted respecting experimental
limitations: the low specific activity for the 3H-Tyr meant that a high concentration of L-
Tyr could not be tested. A second, fluorescence based assay we developed was rapid,
inexpensive, and could be performed at relatively low protein and higher L-Tyr
concentrations. It exploited the affinity that the external fluorophore ANS has for many
proteins as well as its increase in quantum yield that occurs with binding. This was
particularly useful in our case as our ligand (L-Tyr) was an intrinsic fluorophore. ANS
fluorescence emission was quenched upon the addition of NAD4 plus Tyr to either WT E.
coli CM-PD or WT A. aeolicus A19PD (Fig. 4.7). although less so, for the A. aeolicus
enzyme which is reported to be less inhibited by Tyr than the E. coli enzyme. The results
were also in keeping with the observation by Hudson et al. (65) that the presence of Tyr
helps NAD bind and vice versa. For the variant proteins fluorescence quenching was
relieved indicating that the Tyr did not bind or did not bind well. It is likely for both
177
proteins that ANS was binding to the sites where either NAD4 and/or Tyr combine as it
has been reported that ANS binds to nucleotide binding sites (22, 23). The quenching of
ANS fluorescence emission upon the addition of NAD+ plus L-Tyr to WT E. coli CM-PD
(Fig. 4.7) could be interpreted in part, due to the oligomerization of the enzyme as surface
hydrophobic sites became inaccessible for the binding of ANS. It is well documented that
ANS can bind to such patches and additionally, it has been noted empirically that E. coli
CM-PD likely possesses a very hydrophobic surface. Although not performed in this
study, we could have readily determined Ki values for Tyr s and NAD+rs interaction with
WT enzyme and and for variants whose affinity for the Iigands were not too poor.
The crystal structure of A19PD from A. aeolicus co-crystallized with NAD+ and
L-Tyr shows without ambiguity that L-Tyr binds in the active site (Fig. 4.8). This is not
surprising given that A. aeolicus PD can utilize L-arogenate as a substrate yielding L-Tyr
as the product of the oxidative decarboxylation. Tyr's side chain carboxylate interacts
with the guanidinium group of Arg, an interaction which should be significantly
weakened with this Gin substitution. Our solutions studies (Fig. 4.4) are in agreement
with the crystal structure which show that the activity of this variant is less inhibited by
L-Tyr than the activity of WT enzyme. By contrast the Serl26's hydroxy! group appears
not to be involved in inhibition by Tyr even though it has been implicated in the binding
of HPP through the same interactions as that of Tyr. Two residues at the "entry way" to
the active site (Glul53 and Asp247') were also tested and found to be more sensitive to
the effects of L-Tyr than WT enzyme; possible reasons for these results require more
analysis.
178
Under the assay conditions described, our kinetic data are also consistent with a model
whereby L-Tyr binds at the active site of Al 9PD. A value for the dissociation of Tyr from
the enzyme-NAD complex, at about 16 U.M. This value is within the range (10-100 uM)
reported by fitting kinetic data to models whereby L-Tyr competes at the active site, or at
an allosteric site (56. 65, 100). The Kt value is about 8-fold lower than the Michaelis
constant for prephenate suggesting that the end product inhibitor combines more tightly
to the enzyme than does prephenate. The kinetic data also reveal concave upward kinetics
for the binding of L-Tyr (Fig. 4.2). A model consistent with this feature in addition to
competitive inhibition would have L-Tyr and prephenate simply competing with each
other for binding to the active site, with L-Tyr binding with positive cooperativity. Fitting
initial velocity data for the inhibition of PD of CM-PD, Christopherson (100) proposed a
similar model but which included positive cooperative effects for the binding of
prephenate as well. It is worth noting that the crystal structure of A19PD shows only one
Tyr binding per monomer. Thus, the solution studies and the crystal structure are not in
total agreement. Additionally, steady-state kinetic mechanisms can also yield concave
upward double reciprocal plots (164). Thus, a more thorough analysis of these types of
complex initial velocity patterns, along with the analysis of initial velocity patterns in the
presence of HPP and L-Tyr must be undertaken.
179
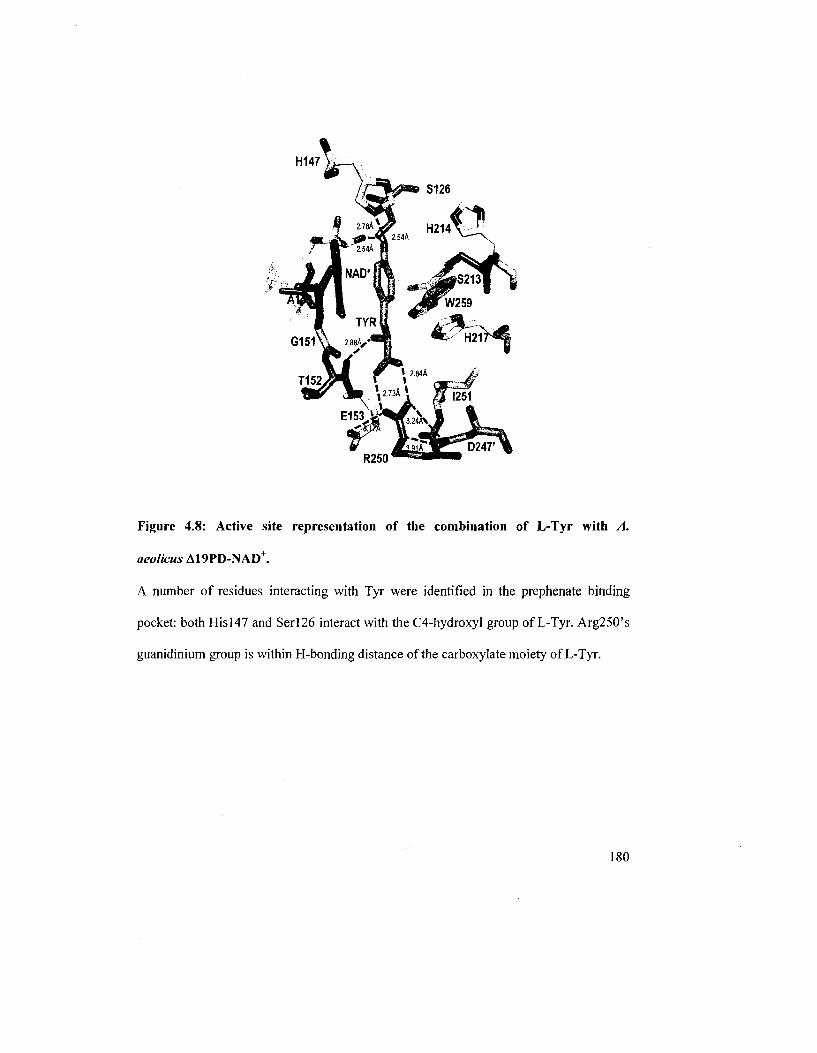
Figure 4.8: Active site representation of the combination of L-Tyr with A.
aeolkus A19PD-NAD+.
A number of residues interacting with Tyr were identified in the prephenate binding
pocket: both His 147 and Serl26 interact with the C4-hydroxyI group of L-Tyr. Arg250's
guanidinium group is within H-bonding distance of the carboxylate moiety of L-Tyr.
180
The crystal structure of the enzyme bound with L-Tyr or HPP reveals that the
amino group of L-Tyr interacts with the main chain carbony] of Thrl52 but the side chain
keto group of HPP interacts with the imidazole of His217 (Fig. 4.8 and Chapter 3, Fig.
3.7). For this structural change, which would appear to confer ligand specificity.
Christendat and coworkers speculated that the side chain of His217 must be in the
protonated state. While the interaction of a keto group with a protonated imidazole is
favoured, an amino group on the same position of the ligand would produce a repulsive
effect and therefore direct the interaction of Tyr's amino group away from His217
towards the main chain carbonyl group of Thrl52. Replacing His217 with Ala/Asn
eliminates this repulsive effect and Tyr is no longer directed towards the carbonyl of
Thrl52. We attempted to conduct pH rate profiles of His217Ala to determine if the
protonated group (pK 9.5) whose ionization is observed in the pH profile for WT A) 9PD
is that of His217. Regrettably, His217Ala was prone to precipitation at high pH values
however, and its activity could not be confidently monitored.
Are the interactions that hold prephenate and/or L-Tyr in the active site the same
as for E. coli CM-PD or other PDs? The crystal structure of an engineered
monofunctional PD from H. influenza bound with NAD+ and L-Tyr (unpublished) again
places L-Tyr in the active site of the enzyme (Fig. 4.9). This enzyme is dimeric and binds
two molecules of NAD+ and two of L-Tyr per dimer. Additionally, many of the residues
located within A19PD's active site are also found in that of//, influenza PD (see Fig 4.9
and description in figure legend). Of interest, Tyr at position 306 replaces Trp259 in A.
aeolicus PD: this residue is shown to interact directly with the amino group of L-Tyr. We
181
are currently modeling the PD domain of E. coli CM-PD using as a template the structure
of PD from H. influenza. Regrettably, a loop region (amino acids 111-119) in the
modeled E. coli PD monomer adopts a conformation that is distinct from that of the same
loop found in the H. influenza PD dimer (residues 141-149). Thus, a dimeric E. coli PD
cannot be readily reconstructedn(Appendix 4A). Interestingly residues that Liikte-
Eversloh and Stephanopoulos {102) propose are the important for generating feedback
resistance in E. coli CM-PD are at the C-terminal end of the protein, which appears
distant from the active site. It may be that the C-terminal end of the protein adopts a
different orientation in the bifucntional CM-PD of E. coli and H. influenza. We have
commenced peptide mapping and site-directed mutagenesis studies on the E. coli enzyme
based on the new available structures.
182
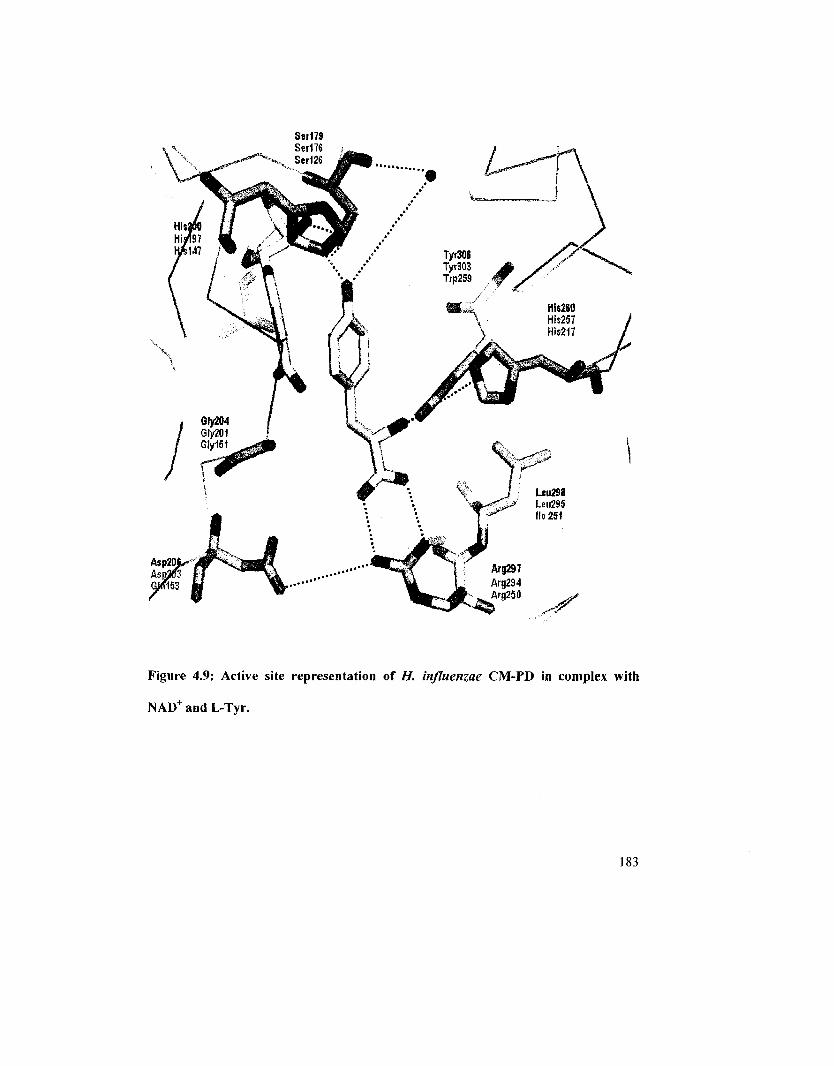
Ser179 Ser176 Ser126
Asp2M^"
mm
Figure 4.9: Active site representation of H. influenzae CM-PD in complex with
NAD+ and L-Tyr.
183
References
1. Kaneko. M . Hwang. E. ].. Ohnishi. Y.. and Horinoucbi. S. (2003) J Ind Microbiol
Biolechnol 30, 456-461.
2. Rescigno, A.. Rinaldi, A. C . and Sanjust. E. (] 998) Biochem Pharmacol 56,
1089-1096.
3. Meganathan; R. (2001) FEMS Microbiol Lett 203,131-139.
4. Moller, B. L., and Conn, E. E. (1979) J Biol Chem 254. 8575-8583.
5. Memelink, J. (2004) Nat Biotechnol 22,1526-1527.
6. Frick, S., and Kutchan, T. M. (1999) Plant J17,329-339.
7. Davis, B. D. (1955) Adv Enzymol Relat Subj Biochem 16,247-312.
8. Sprinson, B. D. (1961) Adv Carbohydrate Chem 15,235-270.
9. Brown, K. D.. and Doy, C. H. (1966) Biochim Biophys Acta 118,157-172.
10. Smith, L. C , Ravel, J. M., Lax, S. R., and Shive, W. (1962) J Biol Chem 1962,
3566-3570.
11. Dayan, J.; and Sprinson, D. B. (197 ]) Biochem J108,1174-1180.
12. Ahmad, S., and Jensen, R. A. (1988) FEMS Microbiol Lett 52, 109-116.
13. Coggins, J. R., Abell, C . Evans, L. B., Frederickson, M., Robinson, D. A.,
Roszak, A. W., and Lapthorn, A. P. (2003) Biochem Soc Tram 31, 548-552.
14. Haslam, E. (1974) The Shikimate Pathway, Whiley. New York.
15. Steinrucken, H. C , and Amrhein, N. (1980) Biochem Biophys Res Commmun 94,
1207-1212.
16. Herrmann, K. M. (1995) Plant Physiol 107, 7-12.
17. Berry, A., Dodge, T. C , Pepsin, M.. and Weyler, W. (2002) J Ind Microbiol
Biotechnol 28, 127-133.
18. Schmid, J. W., Mauch, K., Reuss, M., Gilles, E. D., and Kremling, A. (2004)
MetabEng 6, 364-377.
19. Kramer, M., Bongaerts, J., Bovenberg, R., Kremer, S., Muller, U., Orf, S..
Wubbolts, M , and Raeven, L. (2003) Metab Eng 5,277-283.
20. Grinter. N. J. (1998) ChemTech 28. 33-37.
184
21. Cabrera-Valladares. N.. Martinez. A., Pinero. S.. Lagunas-Mufioz. V. H., Tinoco.
R.. de Anda, R.. Vazquez-Duhalt. R.. Bolivar. F.. and Gosset, G. (2006) Enzyme
and Microbial Technology 38. 772-779.
22. Seetharam. G.. and Saville, B. (2002) Enzyme and Microbial Technology 3L 747-
753.
23. Ikram, U.-H.. and AIL S. (2002) Curr Microbiol 45. 88-93.
24. Bourke, S. L., and Kohn, J. (2003) Adv Drug Deliv Rev 55, 447-466.
25. Patnaik, R.. Zolandz, R. R.. Green. D. A., and Kraynie. D. F. (2008) Bioteclmol
Bioeng 99,74]-7 52.
26. Rippert, P., Scimemi, C., Dubald. M., and Matringe, M. (2004) Plant Physiol 134.
92-100.
27. Yanofsky,C. (1988) J Biol Chem 263, 609-612.
28. Herrmann, K. M., and Weaver, L. M. (1999) Annu Rev Plant Physio Plant Mol
Biol 50,473-503.
29. Chavez-Bejar, M. I., Lara. A. R., Lopez, H.. Hernandez-Chavez. G., Martinez. A.,
Ramirez, O. T., Bolivar, F., and Gosset, G. (2008) Appl Environ Microbiol 74,
3284-3290.
30. Stenmark, S. L., Pierson, D. L., Glover, G. 1., and Jensen, R. A. (1974) Nature
247, 290-292.
31. Zamir, L. O., Jensen, R. A., Arison, B., Douglas, A., Albers-Schonberg, G., and
Bowen, J. R. (1980) J Am Chem Soc 102,4499-4504.
32. Mayer, E., Waldner-Sander, S., Keller, B., Keller, E., and Lingens, F. (1985)
FEBSLett 179,208-212.
33. Keller, B., Keller, E., and Lingens, F. (1985) Biol Chem HoppeSeyler 366.
34. Hall, G. C , Flick, M. B., Gherna, R. L., and Jensen, R. A. (1982) JBacteriol 149,
65-78.
35. Fazel, A. M., and Jensen, R. A. (1979) J Bacteriol 138, 805-815.
36. Bonner, C. A., Jensen, R. A., Gander, J. E., and Keyhani, N. O. (2004) Biochem J
382,279-29}.
37. Fazel, A. M., Bowen, J. R.. and Jensen. R. A. (1980) Proc Natl Acad Sci USA
77, 1270-1273.
185
38. Pate]. N.. Pierson. D. L.. and Jensen. R. A. (}917)JBiol Chem 252. 5839-5846.
39. Zhao. G.. Xia, T.. Ingram. L. O.. and Jensen. R. A. (1993) Eur J Biochem 212.
157-165.
40. Rippert. P.. and Matringe. M. (2002) Eur J Biochem 269, 4753-4761.
41. Rippert. P.. and Matringe. M. (2002) Plant Mol Biol 48, 361-8.
42. Siehl, D. L.. and Conn: E. E. (1998) Arch Biochem Biophys 260, 822-829.
43. Legrand, P., Dumas. R.. Seux. M., Rippert. P.. Ravelli, R., Ferrer, J.-L., and
Matringe, M. (2006) Structure 14.161-116.
44. Song, J., Bonner, C. A., Wolinsky, M., and Jensen, R. A. (2005) BMC Biol 3. 1 -
30.
45. Bonner, C. A., Disz, T., Hwang, K., Song, J., Vonstein, V., Overbeek, R., and
Jensen, R. A. (2008) Microbiol Mol Biol Rev 72, 13-53.
46. Xie, G., Bonner, C. A., and Jensen, R. A. (2000) Comp Biochem Physiol C
Toxicol Pharmacol 125, 65-83.
47. Song, J., Bonner, C. A., Wolinsky, M., and Jensen, R. A. (2005) BMC Biol 3, 13.
48. Sun, W., Singh, S., Zhang, R., Turnbull, J. L., and Christendat, D. (2006) J Biol
Chem 281, 12919-12928.
49. Rippert, P , and Matringe, M. (2002) Plant Mol Biol 48. 361-368.
50. Chen, S., Vincent, S., Wilson, D. B., and Ganem, B. (2003) Eur J Biochem 270,
757-763.
51. Xia, T., Zhao, G., Fischer, R. S., and Jensen, R. A. (1992) J Gen Microbiol 138,
1309-1316.
52. Christendat, D., Saridakis, V. C , and Turnbull, J. L. (1998) Biochemistry 37,
15703-15712.
53. Christendat, D., and Turnbull, J. L. (1999) Biochemistry 38, 4782-4793.
54. Koch, G. L., Shaw, D. C, and Gibson, F. (1971) Biochim Biophys Acta 229, 795-
804.
55. Cotton, R. G., and Gibson, F. (1965) Biochim Biophys Acta 100, 76-88.
56. Turnbull, J., and Morrison, J. F. (J990) Biochemistry 29, 10255-10261.
57. Sampathkumar, P., and Morrison, J. F. (1982) Biochim Biophys Acta 702, 204-
211.
186
58. Hudson, G. S.. and Davidson. B. E. (1984) JMol Biol 180.1023-1051.
59. Heyde, E. (1979) Biochemistiy 18,2766-2775.
60. Koch. G. L.. Shaw. D. C . and Gibson. F. (1972) Biochim Biophys Acta 258, 719-
730.
61. Hudson, G. S.. Wong, V.. and Davidson, B. E. (1984) Biochemistry 23, 6240-
6249.
62. Christopherson. R. 1., Heyde, E., and Morrison, J. F. (] 983) Biochemistiy 22.
1650-1656.
63. Sampathkumar, P., and Morrison, J. (1982) Biochim Biophys Acta 702,212-219.
64. Turnbull, J., Cleland. W. W., and Morrison. J. F. (1991) Biochemistry 30,1111-
7782.
65. Hudson, G. S., Howlett, G. J., and Davidson, B. E. (1983) J Biol Chem 258, 3114-
3120.
66. Vincent, S., Chen, S., Wilson, D. B., and Ganem, B. (2002) BioorgMed Chem
Lett 72,929-931.
67. Christendat, D., and Turnbull, J. (1996) Biochemistiy 35,4468-4479.
68. Duggleby, R. G., Sneddon, M. K., and Morrison, J. F. (1978) Biochemistry 17,
1548-1554.
69. Xia, T., Zhao, G., and Jensen, R. A. (1992) Appl Environ Microbiol 58,2792-
2798.
70. Zhang, S., Pohnert, G., Kongsaeree, P., Wilson, D. B., Clardy, J., and Ganem, B.
(1998) J Biol Chem 273, 6248-6253.
71. Stewart, J , Wilson, D. B., and Ganem, B. (1990) J Am Chem Soc 112, 4582-
4584.
72. Lee, A. Y., Stewart, J. D., Clardy, J., and Ganem, B. (1995) Chem Biol 2, 195-
203.
73. Chipman, D. M., and Shaanan, B. (2001) Curr Opin Struct Biol 11, 694-700.
74. Pohnert, G., Zhang, S., Husain, A., Wilson, D. B., and Ganem, B. (1999)
Biochemistry 38, 12212-12217.
75. Zhang, S., Wilson, D. B., and Ganem, B. (2003) BioorgMed Chem 11,3)09-
3114.
187
76. Strater, N., Schnappauf. G.. Braus. G.. and Lipscomb. W. N. (1997) Structure 5.
1437-1452.
77. Andrews, P. R.: Smith. G. D., and Young, I. G. (1973) Biochemistry 12. 3492-
3498.
78. Gorisch, H., and Lingens, F. (1974) Biochemistry 13. 3790-3794.
79. Copley, S. D., and Knowles, J. R. (19&7) J Am Chem Soc 109, 5008-5013.
80. Guilford, W. J.. Copley, S. D., and Knowles, J. R. (1987) J Am Chem Soc 109,
5013-5019.
81. Andrews. P. R., and Heyde, E. (1979) J Theor Biol 78, 393-403.
82. Sogo, S. G., Widlanski, T. S., Hoare, J. H., Grimshaw, C. E., Bertchold, G. A.,
and Knowles, J. R. (1984) J Am Chem Soc 106,2701-2703.
83. Ma, J., Zheng, X.. Schnappauf. G., Braus, G., Karplus, M., and Lipscomb, W. N.
(1998) Proc Natl Acad Sci USA 25, 14640-14645.
84. Andrews, P. R., Cain, E. N., Rizzardo, E., and Smith, G. D. (1977) Biochemistry
16, 4848-4852.
85. Bartlett, P. A., Nakagawa, Y., Johnson, C. R., Reich, S. H., and Luis, A. (1988) J
Org Chem 53, 3195-3210.
86. Xue, Y., Lipscomb, W. N., Graf, R., Schnappauf, G., and Braus, G. (1994) Proc
Natl Acad Sci USA 91, 10814-10818.
87. Helmstaedt, K., Heinrich, G., Merkl, R., and Braus, G. H. (2004) Arch Microbiol
181, 195-203.
88. Xu, H., Yang, C , Chen, L., Kataeva, I. A., Tempel, W., Lee, D., Habel, J. E.,
Nguyen, D., Pflugrath, J. W., Ferrara, J. D., Arendall, W. B. r., Richardson, J. S.,
Richardson, D. C , Liu, Z. J., Newton, M. G., Rose, J. B., and Wang, B. C. (2005)
Acta Crystallogr D Biol Crystallogr. 61,960-966.
89. Okvist, ML, Dey, R, Sasso, S., Grahan, E., Kast, P., and KrengeL U. (2006) JMol
Biol 357,1483-1499.
90. Chook, Y. M., Ke, H., and Lipscomb, W. N. (1993) Proc Natl Acad Sci U S A 90,
8600-8603.
91. Zhang, S.. Kongsaeree, P., Clardy, J., Wilson, D. B., and Ganem, B. (1996)
Bioorg Med Chem ¥,1015-1020.
188
92. Liu. D. R., Cload. S. T.. Pastor, R. M.. and Schultz, P. G. (] 996) J Am Chem Soc
118, 1789-1790.
93. Vamvaca, K., Butz, M., Walter. K. U.r Taylor. S. V.. and Hilvert. D. (2005)
Protein Sci 14,2103-2114.
94. Hermes, J. D., Tipton, P. A., Fisher. M. A., O'Leary. M. H., Morrison, J. F., and
Cleland, W. W. (1984) Biochemistry 23, 6263-6275.
95. Heyde, E., and Morrison, J. F. (1978) Biochemistry 17, 1573-1580.
96. Bonner, C. A., and Jensen, R. A. (1987) Methods Enzymol 142. 488-494.
97. Byng, G. S., Whitaker, R. J., Shapiro, C. L.. and Jensen, R. A. (1981) Mol Cell
Biol 7,426-38.
98. Hund, H. K., Bar, G., and Lingens, F. (1989) ZNaturforsch [C] 44, 797-801.
99. Subramaniam, P., Bhatnagar, R., Hooper, A., and Jensen, R. A. (1994) Microbiol
140, 4582-4584.
100. Christopherson, R. I., and Morrison, J. F. (1985) Biochemistry 24,1116-1121.
101. TurnbuH, J., Morrison, J. F., and Cleland, W. W. (1991) Biochemistty 30, 7783-
7788.
102. Liitke-Eversloh, T., and Stephanopoulos, G. (2005) Appl Environ Microbiol 71,
7224-7228.
103. Monod, J., Wyman, J., and Changeux, J. P. (1965) J Mol Biol 12, 88-118.
104. Koshland, D. E. J., Nemetby, G., and Filmer, D. (1966) Biochemistry 5,365-385.
105. Deckert, G., Warren, P. V., Gaasterland, T., Young, W. G., Lenox, A. L.,
Graham, D. E., Overbeek, R., Snead, M. A., Keller, M., Aujay, M., Huber, R.,
Feldman, R. A., J.M., S., Olsen, G. J., and Swanson, R. V. (1998) Nature 392,
353-358.
106. Aponte, R. A. (2003), Overexpression, Purification and Preliminary
Characterization of Prephenate Dehydrogenase from the Hyperthermophilic
Bacterium Aquifex aeolicus, Concordia University, Montreal, QC, Canada, M. Sc.
107. Fukuchi, S., and Nishikawa, K. (2001) J Mol Biol 309, 835-843.
108. Cambillau, C , and Claverie, J. (2000) J Biol Chem 275, 32383-32386.
109. Berezovsky, 1. N., and Shakhnovich, E. I. (2005) Proc Natl Acad Sci 102, 12742-
12747.
189
] 10. Querol. E., Perez-Pons, J., and Mozo-Villaria, A. (1996) Prot Eng 9,265-271.
111. DeLano, W. L. (2002) The PyMOL Molecular Graphics System, San Carlos. C A.
112. Bonvin. J.. Aponte. R. A.. Marcantonio, M.. Singh. S.. Christendat, D.. and
Turnbull, J. L. (2006) Protein Sci 75. 1417-1432.
113. Dudzinski, P. K... and Morrison. J. F. (1976) Preparative Biochemistry and
Biotechnology 6, 113-121.
114. Rieger, C. E., and Turnbull, J. (1996) Prep Biochem Biotechnol 26, 67-76.
115. Dawson, C. M. R., Elliott, C. D.. Elliott, H. W.. and Jones, M. K. (1986) Data for
Biochemical Research, 3rd ed., Oxford Science Publications, Clarendon Press.
116. Edelhoch, H. (1967) Biochemistry 6, 1948-1954.
117. Christendat, D., Saridakis, V. C, Dharamsi, A., Bochkarev, A., Pai, E. F.,
Arrowsmith, C. EL and Edwards, A. M. (2000) J Biol Chem 75,24608-24612.
118. Laemmli, U. K. (1970) Nature227,680-685.
119. Tumbull, J., Cleland, W. W., and Morrison, J. F. (1990) Biochemistry 29, 10245-
10254.
120. Cleland, W. W. (1979) Methods Enzymol 87, 103-138.
121. Weinglass, A. B., Whitelegge, J. P., Verner, G. E., Faull, K. F., and Kaback, H. R.
(2003) EMBO J22,1497-1477.
122. Lamm, O. (1929) Ark Mat Astr Fys 2IB, 1 -4.
123. Laue, T. M., Senear, D. F., Eaton, S. F., and Ross, J. B. A. (1992) (Chemistry, R.
S. o., Ed.) pp pp.90-125, Cambridge.
124. Pace, C. N., and Scholtz, J. M. (1998) in Protein Structure: A Pratical Approach
(Creighton, T. E., Ed.) pp 299-321, Oxford University Press, New York.
125. Lakowicz, J. R. (1999) Principles of Fluorescence Spectroscopy, Kluwer
Academic/Plenum, New York.
126. Engel, P. C. (1996) Enzymology, Bio Scientific Publishers, Oxford, UK.
127. Lehrer, S. S. (1971) Biochemistry 10, 3254-3263.
128. Jaenicke, R. (2000) Proc Natl Acad Sci USA 97,2962-4.
129. Rost, B., Yachdav, G., and Liu. J. (2004) Nucleic Acids Res 32 Web Server issue,
W32I-W-326.
190
130. Deleage. G.. Combet. C . Blanchet. C . and Geourjon. C. (200]) Comput Biol Med
57,259-267.
131. Ptitsyn. O. B. (1995) Adv Protein Chem 47, 83-229.
132. Eftink. M. R.. and Ghiron, C. A. (1981) Anal Biochem 114, 706-709.
133. Kornblatt. M. J., and Hui Bon Hoa, G. (1987) Arch Biochem Biophys 252.277-
283.
134. MacBeath, G., Kast, P., and Hilvert, D. (1998) Biochemist™ 31', 10062-10073.
135. Cheung, Y. Y.. Lam, S. Y., Chu, W. K., Allen, M. D.: Bycroft, M.. and Wong, K.
B. (2005) Biochemistry 44,4601-4611.
136. Inui, T., Ohkubo, T., Urade, Y., and Hayaishi, O. (1999) Biochem Biophys Res
Commmun 266, 641 -646.
137. Kujo, C , and Oshima, T. (1998) Appl Environ Microbiol 64, 2152-2157.
138. Natrayanasami, R., Nishimura, J. S., McMilllan, K., Roman. L. J., Shea, T. M.,
Robida, A. M., Horowitz, P. M., and Masters, B. B. M. (1997) Nitric Oxide 1, 39-
49.
139. Zhang, H. J., Sheng, X. R., Pan, X. M., and Zhou, J. M. (1997) Biochem Biophys
Res Commmun 238,382-386.
140. Thomas, T. M., and Scopes, R. K. (1998) Biochem J 330. 1087-1095.
141. Zoldac. G., Sut'ak, R., Antalik, M., Sprinzl, M., and Sedlak, E. (2003) Eur J
Biochem 270, 4887-4897.
142. McLaughlin, A. C. (1974) J Biol Chem 249, 1445-1452.
143. Cox, M. J., Davis, C. A., Chan, C , Jourden, M. J., Jorjorian, A. D., Brym, M. J.,
Snider, M. J., Borders, C. L., and Edmiston, P. L. (2003) Biochemistry 42, 1863-
1871.
144. Huber, R., Wilharm, T., Huber, D., Trincone, A., Burggraf, S., Konig, H., Rachel,
R., Rockinger, 1., Fricke, H., and Stetter, K. O. (1992) System Appl Microbiol 15,
340-351.
145. Vogt, G., Woell, S., and Argos, P. (1997) JMol Biol 269, 631-643.
146. Szilagyi, A., and Zavodszky, P. (2000) Struct FoldDes 8,483-504.
147. Xia,T.H., and Jensen, R. A. (1990) J Biol Chem 265,20033-20036.
191
148. Lindblad, B.. Lindstedt. G., Lindstedt. S.. and Rundgren. M. (\977).J Biol Chem
252,5073-5084.
] 49. Knox. W. E., and Pitt. B. M. (1957) J Biol Chem 225. 675-688.
150. Ahmad. S., and Jensen, R. A. (19S7) FEBS Lett 216. 133-9.
151. Duewel. H. S., Sheflyan. G. Y., and Woodard. R. W. (] 999) Biochem Biophys Res
Commun 263, 346-51.
152. Hansen. T., Urbanke, C, Leppanen, V. M., Goldman, A.. Brandenburg, K., and
Schafer, G. (1999) Arch Biochem Biophys 363.135-147.
153. Park, T. H., Choi, K. W., Park, C. S., Lee, S. B., Hang, H. Y.. Shon, K. J., Park, J.
S., and Cha, J. (2005) Appl Microbiol Biotechnol 5, 1 -12.
154. Zuber, H., and Friedman, S. M. (1978) Biochemistry ofThermophily, Academic
Press. New York.
155. Turnbull, J. (1988), Australian National University, Canberra.
156. Fujii. T., Hata, Y., Oozeki, M., Moriyama, H., Wakagi, T., Tanaka, N., and
Oshima, T. (1997) Biochemistiy 36, 1505-1513.
157. Teplyakov, A. V., Kuranova, I. P., Harutyunyan, E. H., Vainshtein, C . Frommel,
W. E., Hohne, W. E., and Wilson, K. S. (1990) JMol Biol 214, 261-279.
158. Buchanan, C. L., Connaris, H., Danson, M. J., Reeve, C. D., and Hough, D. W.
(1999) Biochem J 343, 563-570.
159. Mattei, P., Kast, P., and Hilvert, D. (1999) Eur J Biochem 261,25-32.
160. Legrand, P., Dumas, R.. Seux, M., Rippert, P., Ravelli, R., Ferrer, J. L.. and
Matringe, M. (2006) Structure 14, 767-76.
161. Champney, W. S., and Jensen, R. A. (1970) JBacteriol 104,351 -359.
162. Stryer, L. (1965) J Mol Biol 13, 482-495.
163. Zhang, S., Wilson, D. B., and Ganem, B. (2000) Biochemistry 39,4722-4728.
164. Segel, l.H. (1993) Enzyme Kinetics: Behavior and Analysis of Rapid Equilibrium
and Steady-State Enzyme Systems.
192
Appendix 2A
Determination of the native molecular weights of A. aeolicus PD and A19PD by
analytical size exclusion chromatography. (A) FPLC tracings of 150 (ig of A19PD
(solid line) or PD (dotted line) chromatographed on a Pharmacia Akta FPLC system
fitted with a Superdex G-200 column (HR 10/30, Pharmacia). Chromatography was
performed with mobile phase containing 50 mM potassium phosphate, 150 mM NaCl
(pH 7.5) at a flow rate of 0.75 mL/min and injection volume of 500 uL. Elution was
monitored at 254, 280 and 290 ran, and fractions (1 mL) were assayed for enzyme
activity (here is shown AJW). The arrows show the elution time corresponding to each
protein of the Bio-Rad gel filtration protein standards including vitamin B )2 (1.35 kDa),
equine myoglobin (17 kDa), chicken ovalbumin (44 kDa). bovine y-globulin (158 kDa)
and thyroglobulin (670 kDa). (B) Logarithm of protein standard molecular weights and
their respective retention times were used to generate a calibration curve to estimate A.
aeolicus PD (red dot) and A19PD (green dot) molecular weights.
193
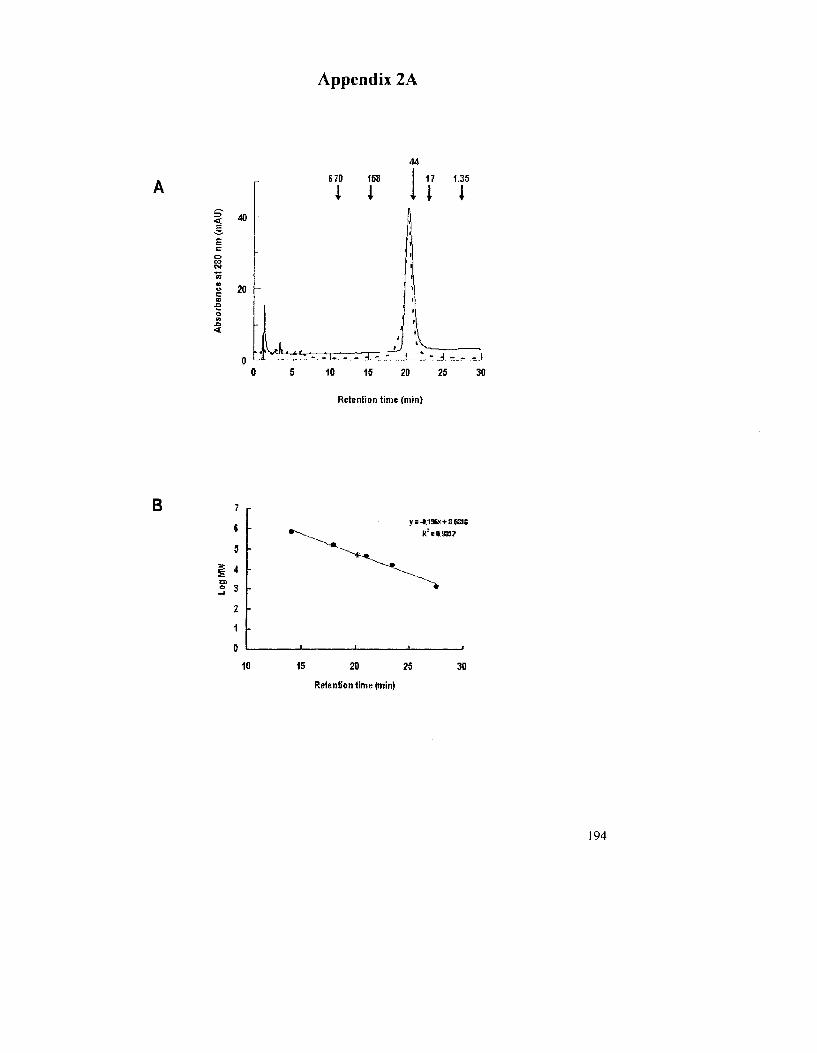
Appendix 2A
44
< E
40
20
\Ai.ftt.._
670 158
I 1
rrrr
17 1.35
10 15 20 25
Retention time (min)
30
B 7
6
5
i «
: t 0
Y = -0.196x+SL68JS
10 15 20 25
Retention time (min)
30
194
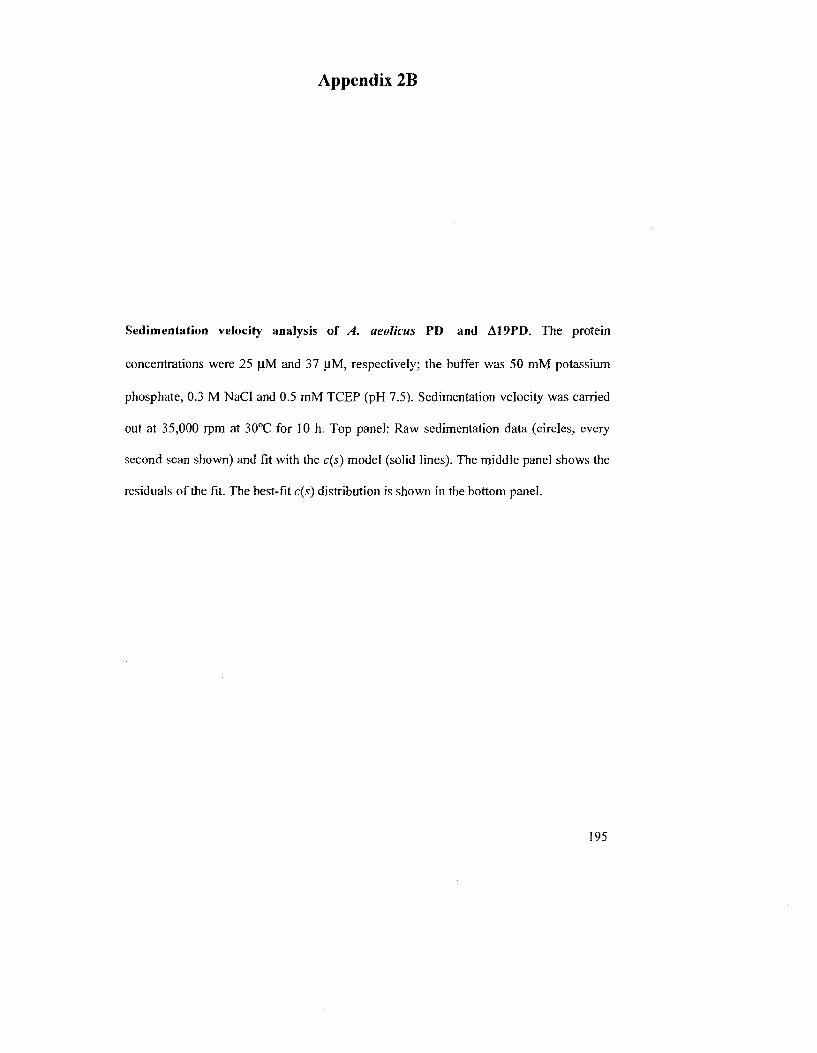
Appendix 2B
Sedimentation velocity analysis of A. aeolicus PD and A19PD. The protein
concentrations were 25 |iM and 37 U.M, respectively; the buffer was 50 mM potassium
phosphate, 0.3 M NaCl and 0.5 mM TCEP (pH 7.5). Sedimentation velocity was carried
out at 35,000 rpm at 30°C for 10 h. Top panel: Raw sedimentation data (circles, every
second scan shown) and fit with the c(s) model (solid lines). The middle panel shows the
residuals of the fit. The best-fit c(s) distribution is shown in the bottom panel.
195
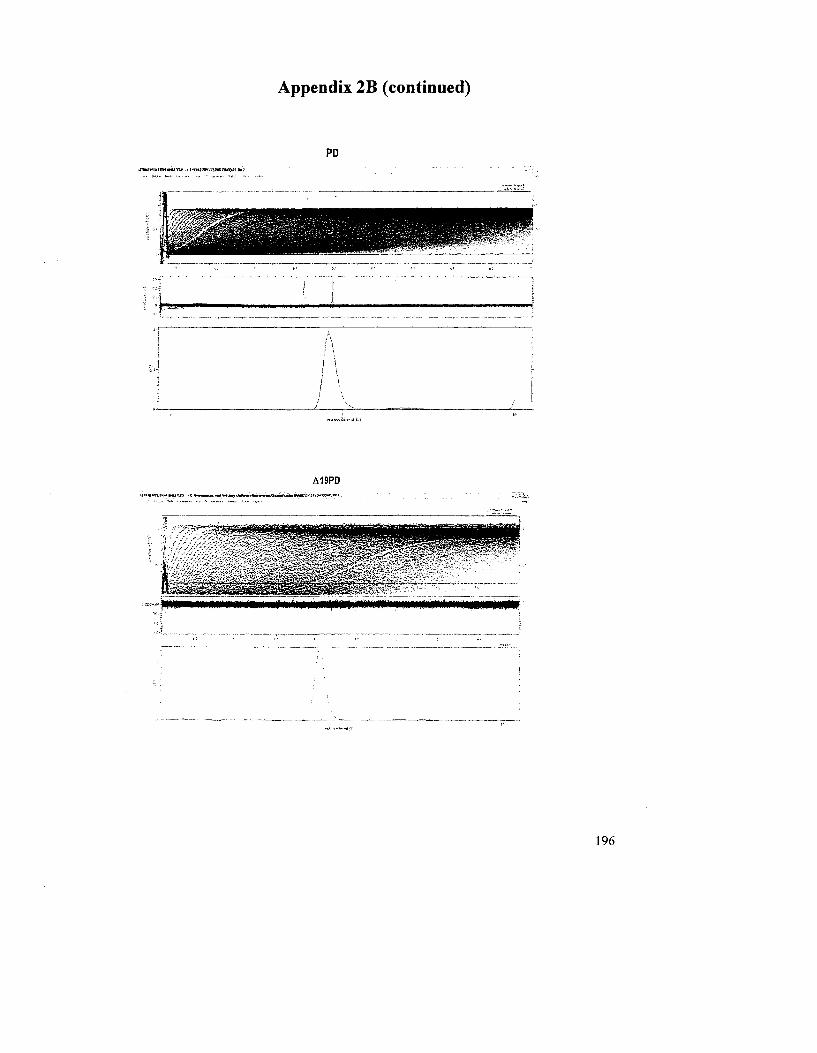
Appendix 2B (continued)
ilKMl*l»IinMWU11U> . l-WJMMtSW)>VIX»:<tJt/U..
PD
A19PD
^s&ISif^c-
196
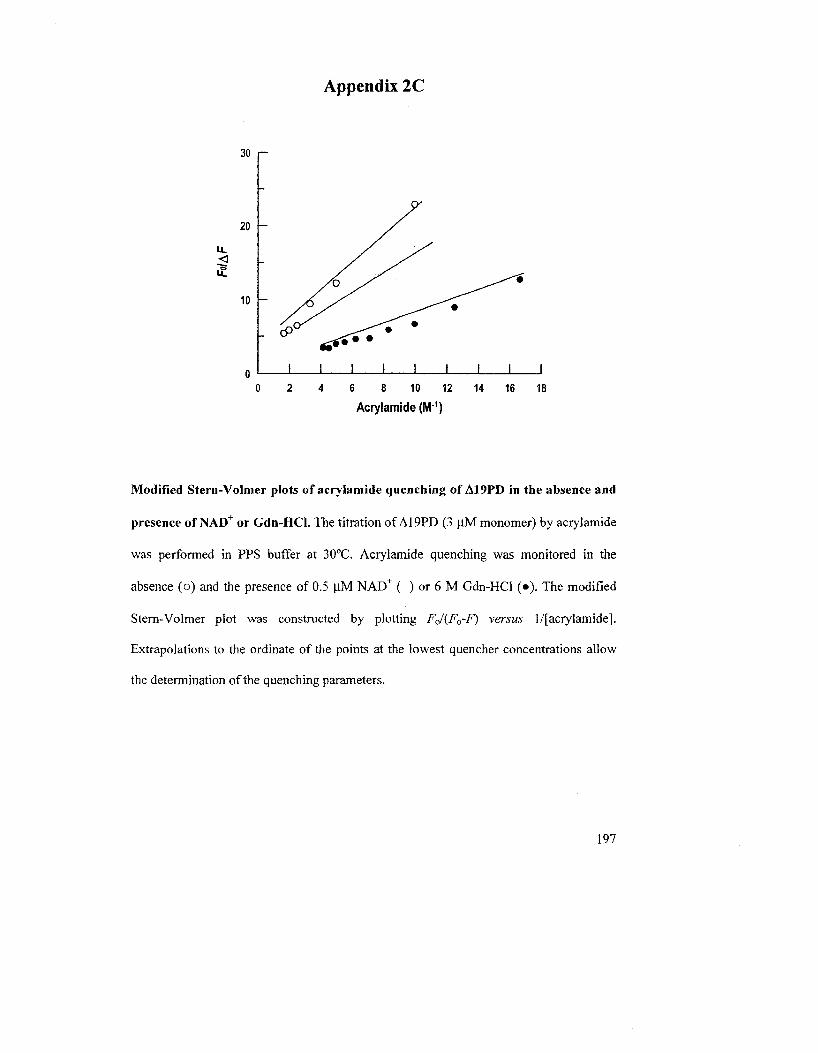
Appendix 2C
30
20
u. <
10
0 0 2 4 6 8 10 12 14 16 18
Acrylamide (M"1)
Modified Stern-Volmer plots of acrylamide quenching of A19PD in the absence and
presence of NAD+ or Gdn-HCl. The titration of A19PD (3 uM monomer) by acrylamide
was performed in PPS buffer at 30°C. Acrylamide quenching was monitored in the
absence (o) and the presence of 0.5 |lM NAD+ ( ) or 6 M Gdn-HCl (•). The modified
Stern-Volmer plot was constructed by plotting F0/(F0-F) versus 1/[acrylamide].
Extrapolations to the ordinate of the points at the lowest quencher concentrations allow
the determination of the quenching parameters.
J I 1 1 I I I I I
197
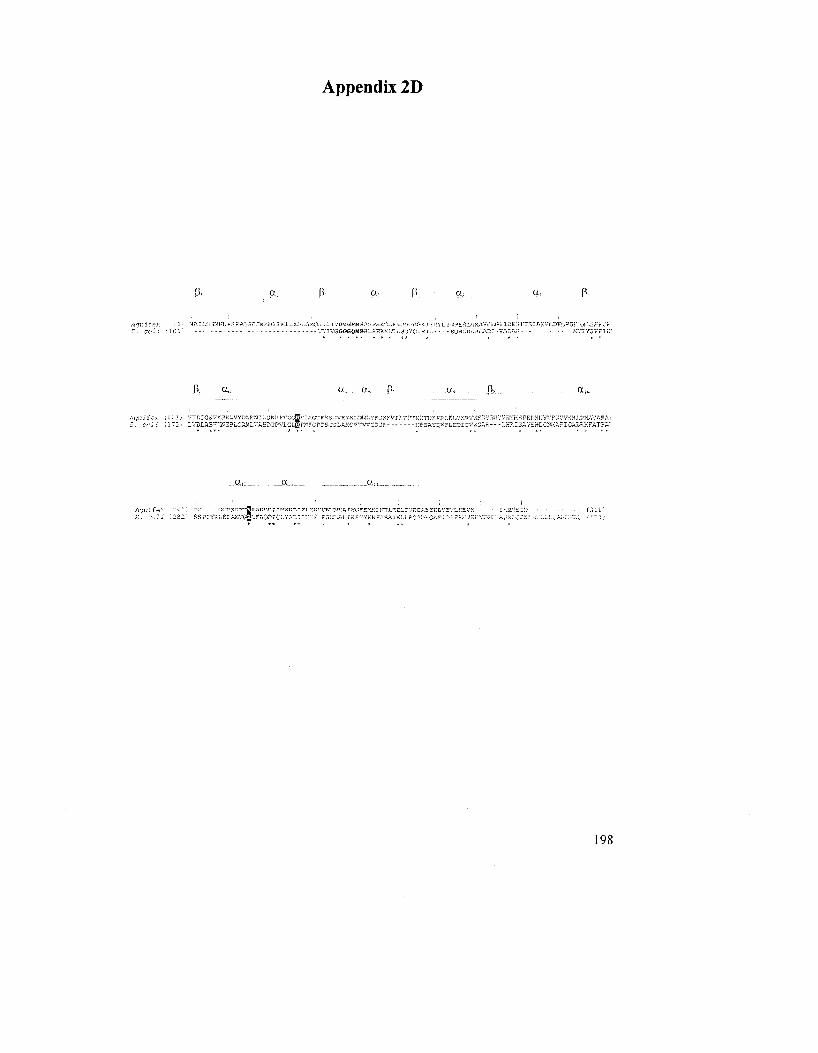
Appendix 2D
T-IAILSSr-iKKt^s^'Sr^KXrai
P.- a,. a; a, P-
: ]T2i lV3IA5~E3?L^»CVi5IGF' . , lClSFJI75PjS5SI , tSC'- '~ '^-3C:-S •:F=Ai~K?l,Eg-Ic-.1.-;AF.-- -LKSrsAVEaECS'^riQatRKFATF.
;.;' :^t^} Sr;prViv;,£i_A;-!VG§i-";LO~?C:.vAn:rr:':A *:;;:^Ar:r^vY>:K-^^:F;u.*o~">:^r:::^'F>'7E:{
198
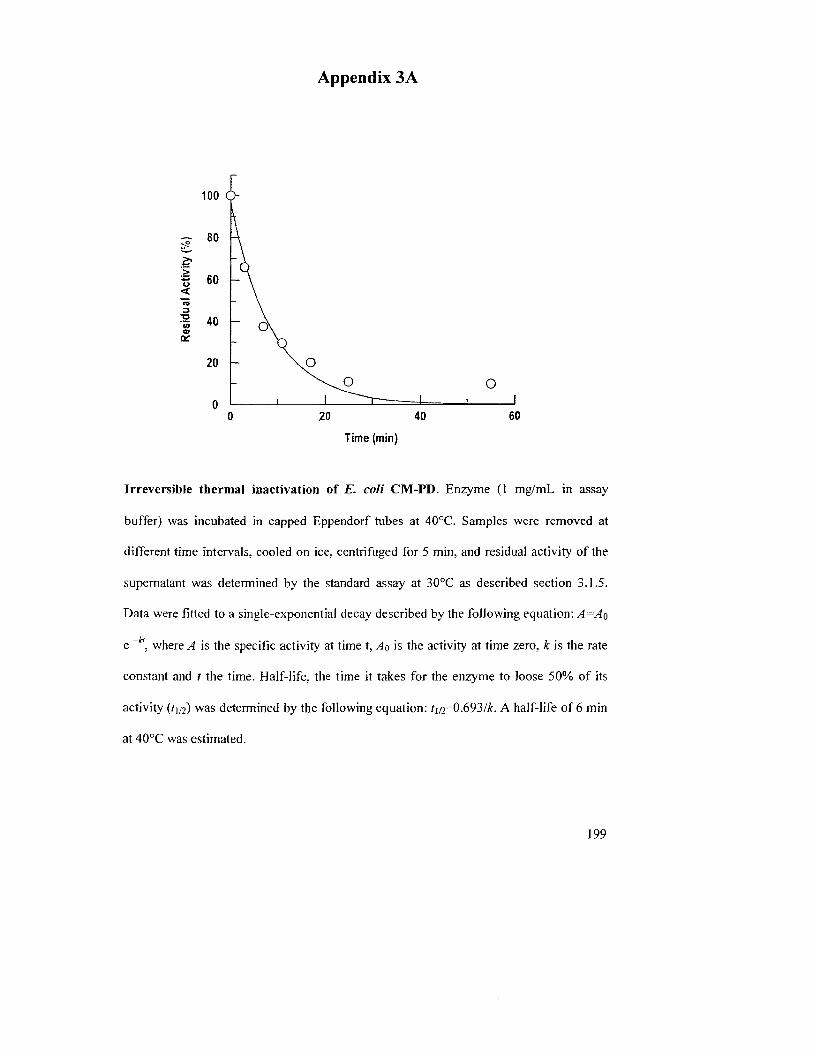
Appendix 3A
°\ \o
\^o o I ^ 1 ' I
0 20 40 60
Time (min)
Irreversible thermal inactivation of E. coli CM-PD. Enzyme (1 mg/mL in assay
buffer) was incubated in capped Eppendorf tubes at 40°C. Samples were removed at
different time intervals, cooled on ice. centrifuged for 5 min, and residua] activity of the
supernatant was determined by the standard assay at 30°C as described section 3.1.5.
Data were fitted to a single-exponential decay described by the following equation: A =AQ
e ~ . where A is the specific activity at time t, Ao is the activity at time zero, k is the rate
constant and t the time. Half-life, the time it takes for the enzyme to loose 50% of its
activity (t]/2) was determined by the following equation: t\a=0.693/k. A half-life of 6 min
at 40°C was estimated.
199
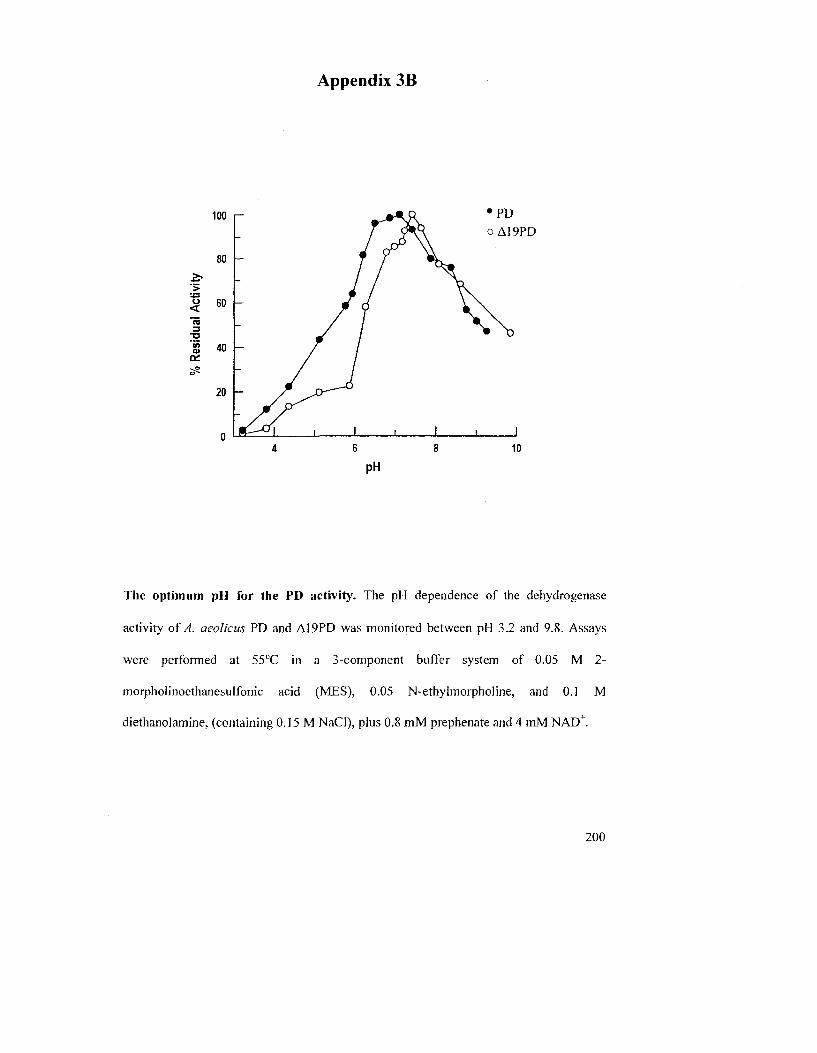
Appendix 3B
pH
The optimum pH for the PD activity. The pH dependence of the dehydrogenase
activity of A. aeolicus PD and A19PD was monitored between pH 3.2 and 9.8. Assays
were performed at 55°C in a 3-component buffer system of 0.05 M 2-
morpholinoethanesulfonic acid (MES), 0.05 N-ethylmorpholine, and 0.1 M
diethanolamine, (containing 0.15 M NaCl), plus 0.8 mM prephenate and 4 raM NAD+.
200
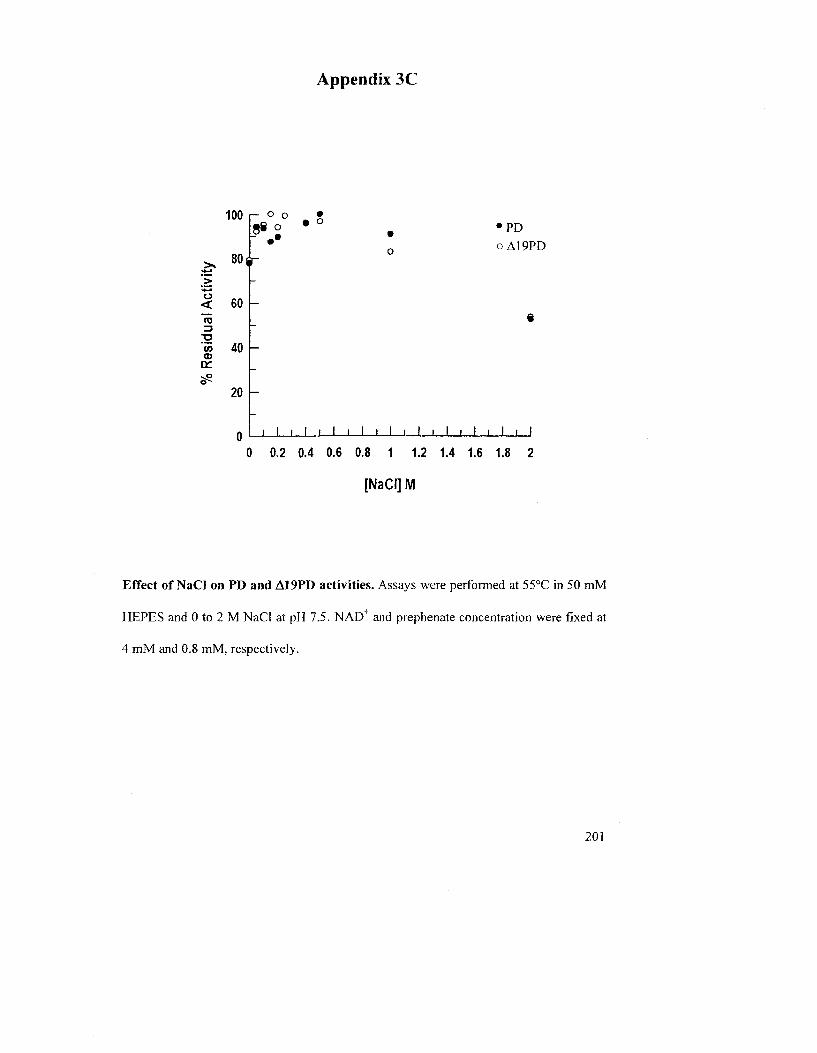
Appendix 3C
100
"> "o <
"w <u
80 i -
60
40 h
20 h
- o o • 88 o » °
o
• P D oA19PD
• I i I i I i I t I i » i [ I I J _ J
0 0.2 0.4 0.6 0.8 1 1.2 1.4 1.6 1.8 2
[NaCI] M
Effect of NaCI on PD and AI9PD activities. Assays were performed at 55°C in 50 mM
HEPES and 0 to 2 M NaCI at pH 7.5. NADT and prephenate concentration were fixed at
4 mM and 0.8 mM, respectively.
201
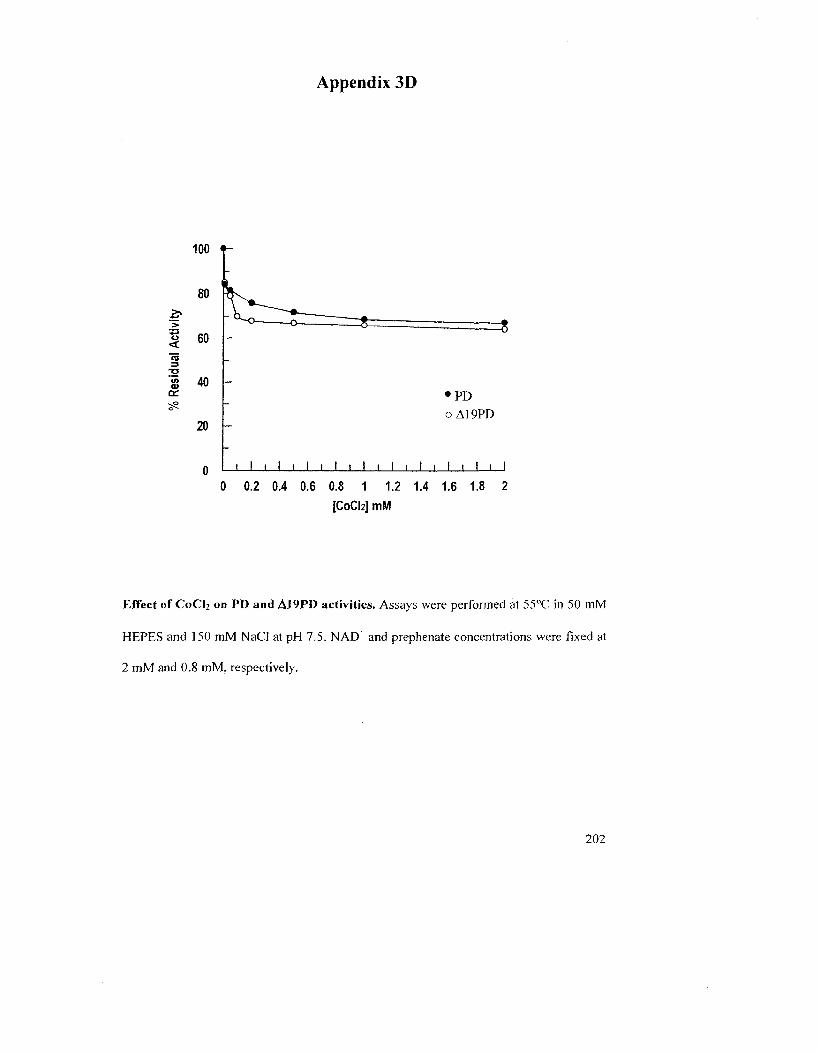
Appendix 3D
100 f -
-2*
u <
<u or
60
40
20 h
• P D oA19PD
0 i i I i I i I i I i I i I i t • I i I i I
0 0.2 0.4 0.6 0.8 1 1.2 1.4 1.6 1.8 2
[C0CI2] mM
Effect of CoCI2 on PD and A19PD activities. Assays were performed at 55°C in 50 mM
HEPES and 150 mM NaCl at pH 7.5. NAD+ and prephenate concentrations were fixed at
2 mM and 0.8 mM. respectively.
202
Appendix 3E
Variation of initial velocity of A. aeolicus A19PD reaction as a function of the
concentration of prephenate (A) and NAD (B). In (A) Prephenate was varied from 72-
396 pM at fixed concentrations of NAD+ of: 57 (A), 115 and (x) 140 (•) yM. In (B)
NAD+ was varied from 54-430 U.M at fixed concentrations of prephenate of: 43 (x), 108
(•) and 216 (A) pJVl. The data were fit to the equation describing a sequential kinetic
mechanism, v = VAB/(KiJCi, + KaB + K\4 + AB), to generate the lines shown in the figure,
v is the initial velocity, V is the maximum velocity, A and B are concentrations of
reactants, Ka and Kb are Michaelis constants for A and B, and Km is the dissociation
constant from the binary complex. The following kinetic parameters when prephenate
was the variable, were calculated as 12.1 s'1 (V), 146.3 ± 11.5 (Ka), 82.3 ± 7.1 pjvl (Kb).
137.8 ±22.1 \lM(Kia).
203
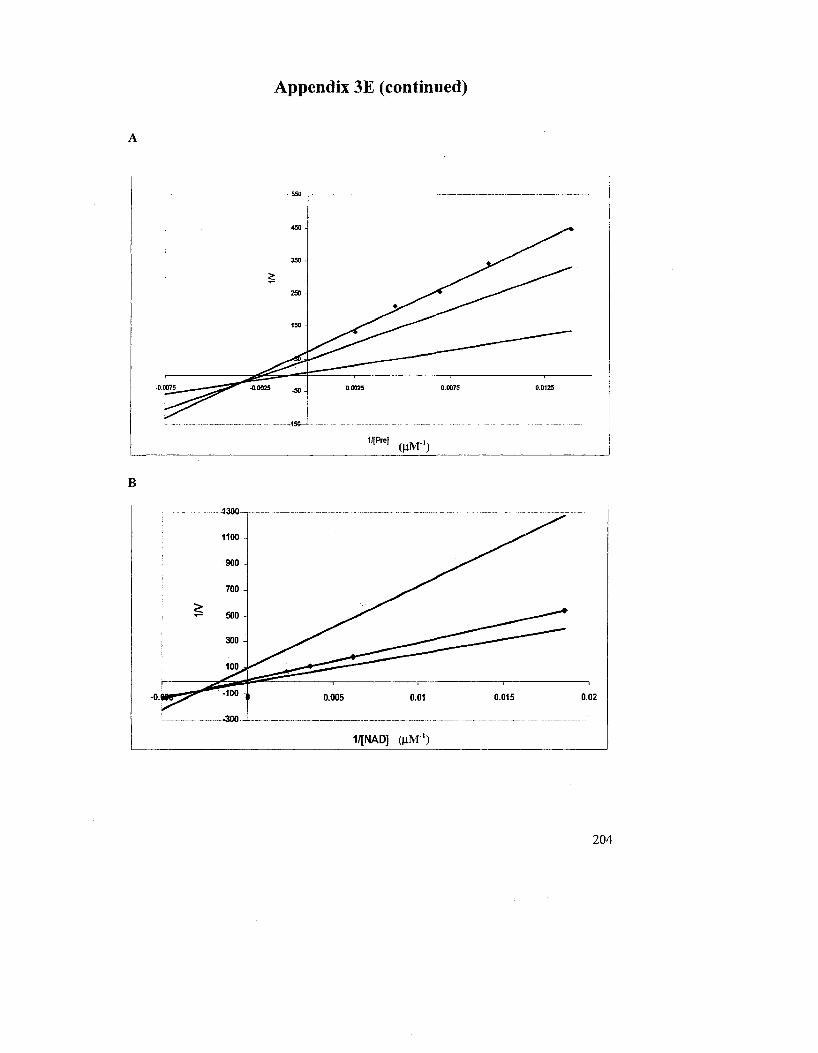
Appendix 3E (continued)
A
1/[NAD] (nM1)
204
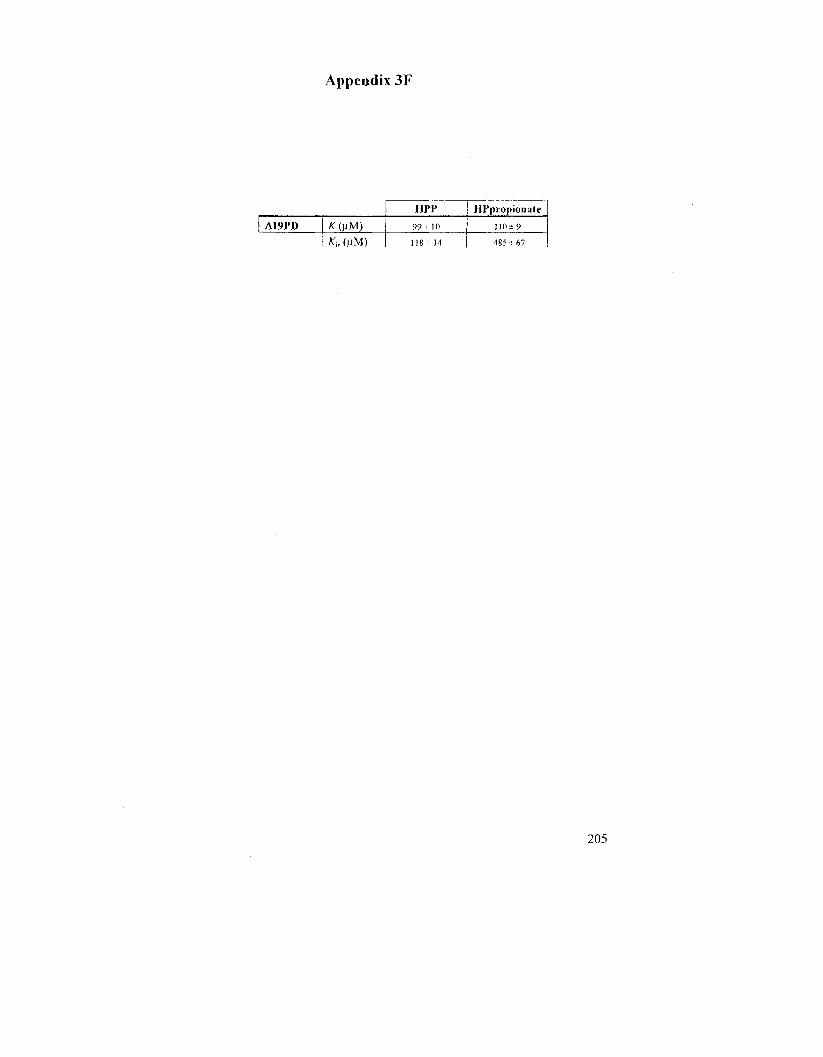
Appendix 3F
A19PD K(\iM)
K,s (MM)
HPP
99 ± 10
1 1 8 ^ 1 4
HPpropionate
] I 0 ± 9
485 ± 67
205
Appendix 4A
Comparison between the architecture of H. influenzae and the modeled E. coli PD
portion of CM-PD. (A) Cartoon representation of the monomer of the PD portion of
CM-PD from H. influenzae in complex with its cosubstrate NAD (blue sticks) and L-Tyr
(yellow stick) (PDB access code, 2pv7). The monomer consists of 12 a-helices and P-
sheets. The N-terminal domain contains a Rossman fold characteristic of nucleotide
binding site. The C-terminal is highly a-helical and participates in the dimerization
domain. (B) Three-dimensional structure representation of PD domain of £ coli CM-PD
modeled against H. influenzae CM-PD. The loop between (35 and P6 in the model is
positioned differently than in the H. influenzae PD enzyme, preventing modeling of the
dimer. Model and pictures were generated using Modeller 9v3 and PyMOL, respectively.
206
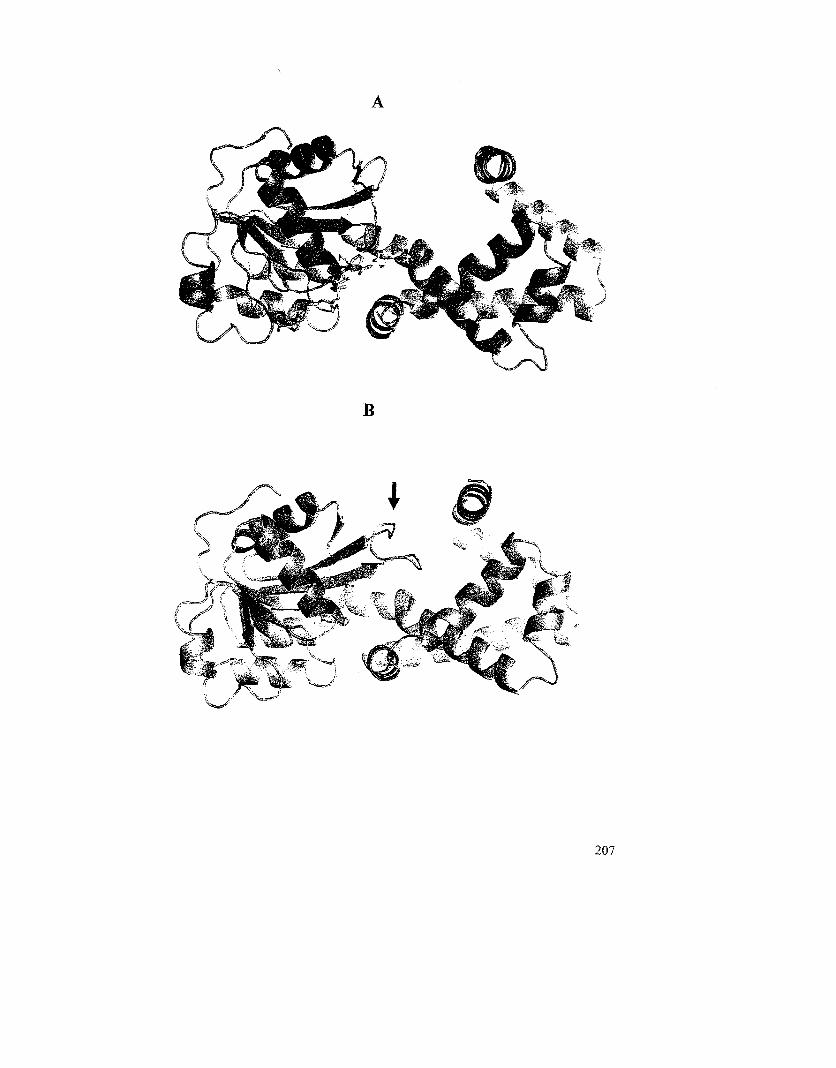
B
• ^ = B ^ "
207