Embed Size (px)
Citation preview
Investor Relations
Supplementary information
Second Quarter 2014
- 1 -
SpareBank 1 SMN 7467 Trondheim
Chief Executive, CEO Finn Haugan
For further information, please contact Kjell Fordal, Executive Director Finance Division tel +47 905 41 672
e-mail: [email protected]
Switchboard tel +47 07300
Address SpareBank 1 SMN, Postboks 4796 Sluppen, 7467 Trondheim
Visiting address: Søndre gate 4, 7011 Trondheim
Information on the Internet
SpareBank 1 SMN’s home page www.smn.no
Hugin-Online www.huginonline.no
ECC information in general www.egenkapitalbevis.no
Financial Calendar 2014
2nd quarter 2014 13 August 2014
3rd quarter 2014 30 October 2014
- 2 -
Contents 1. SpareBank 1 SMN overview ........................................................ - 3 -
1.1. Financial highlights .................................................................... - 3 -
1.2. Business description ................................................................... - 4 -
1.3. Credit ratings ............................................................................ - 6 - 1.4. Equity capital certificate (MING) .................................................. - 7 -
2. Financial results ....................................................................... - 10 -
2.1. Main figures ......................................................................... - 10 -
2.2. Net interest income ............................................................... - 11 -
2.3. Commission income .............................................................. - 14 -
2.4. Operating expenses ............................................................... - 15 -
3. Loans to customers .................................................................. - 18 -
3.1. Distribution of loans by industry ............................................. - 18 -
3.2. Risk profile and write-downs ................................................... - 19 -
4. Capital Adequacy ...................................................................... - 24 -
5. Funding .................................................................................... - 27 -
6. Financial results ....................................................................... - 29 -
7. Segment information ................................................................ - 32 -
7.1. Extract from income statement ............................................... - 32 -
7.2. Retail Market ........................................................................ - 34 -
7.3. SME .................................................................................... - 36 -
7.4. Corporate ............................................................................ - 38 -
7.6. Markets ............................................................................... - 40 -
7.7. Subsidiaries.......................................................................... - 42 -
8. Development last ten years ..................................................... - 44 -
- 3 -
1. SpareBank 1 SMN overview
1.1. Financial highlights
First half 2014 (Consolidated figures. Figures in parentheses refer to the same period of 2013 unless
otherwise stated).
Profit before tax and inv. held for sale: NOK 1,165m (782m)
Net profit: NOK 963m (606m)
Return on equity: 16.8 per cent (11.9 per cent)
12-month growth in lending: 5.1 per cent (8.4 per cent)
12-month growth in deposits: 7.4 per cent (7.3 per cent)
Loan losses: NOK 32m (38m)
Common equity tier 1 ratio: 11.4 per cent (10.3 per cent) Earnings per EC: NOK 4.77 (2.99)
Second quarter 2014
Profit before tax and inv. held for sale: NOK 568m (391m)
Net profit: NOK 464m (285m)
Return on equity: 16.0 per cent (11.1 per cent)
Loan losses: NOK 15m (21m) Earnings per EC: NOK 2.29 (1.43)

- 4 -
1.2. Business description
SpareBank 1 SMN is Mid-Norway’s largest bank with assets totalling NOK 118.8 billion at the
end of June 2014. Head office is in Trondheim and the Group employs 1,167 FTEs.
SpareBank 1 SMN is organized in four business areas:
Overall organization
- 5 -
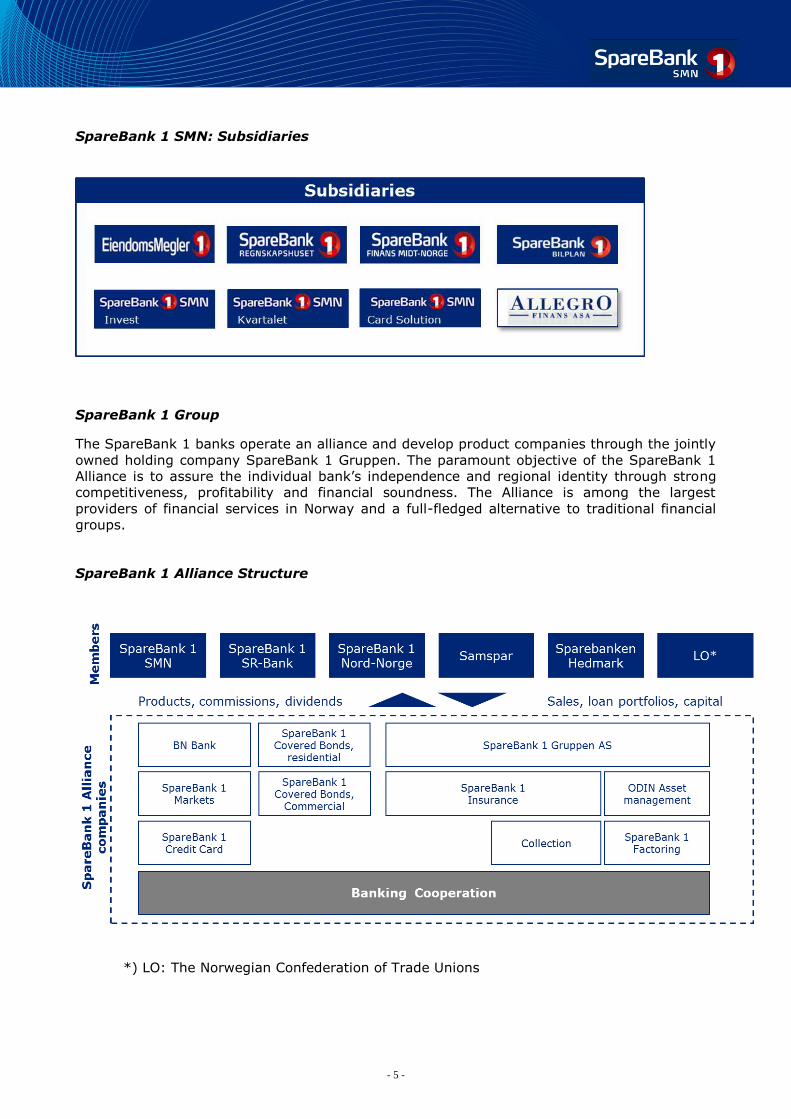
SpareBank 1 SMN: Subsidiaries
SpareBank 1 Group
The SpareBank 1 banks operate an alliance and develop product companies through the jointly
owned holding company SpareBank 1 Gruppen. The paramount objective of the SpareBank 1
Alliance is to assure the individual bank’s independence and regional identity through strong
competitiveness, profitability and financial soundness. The Alliance is among the largest
providers of financial services in Norway and a full-fledged alternative to traditional financial
groups.
SpareBank 1 Alliance Structure
*) LO: The Norwegian Confederation of Trade Unions
- 6 -
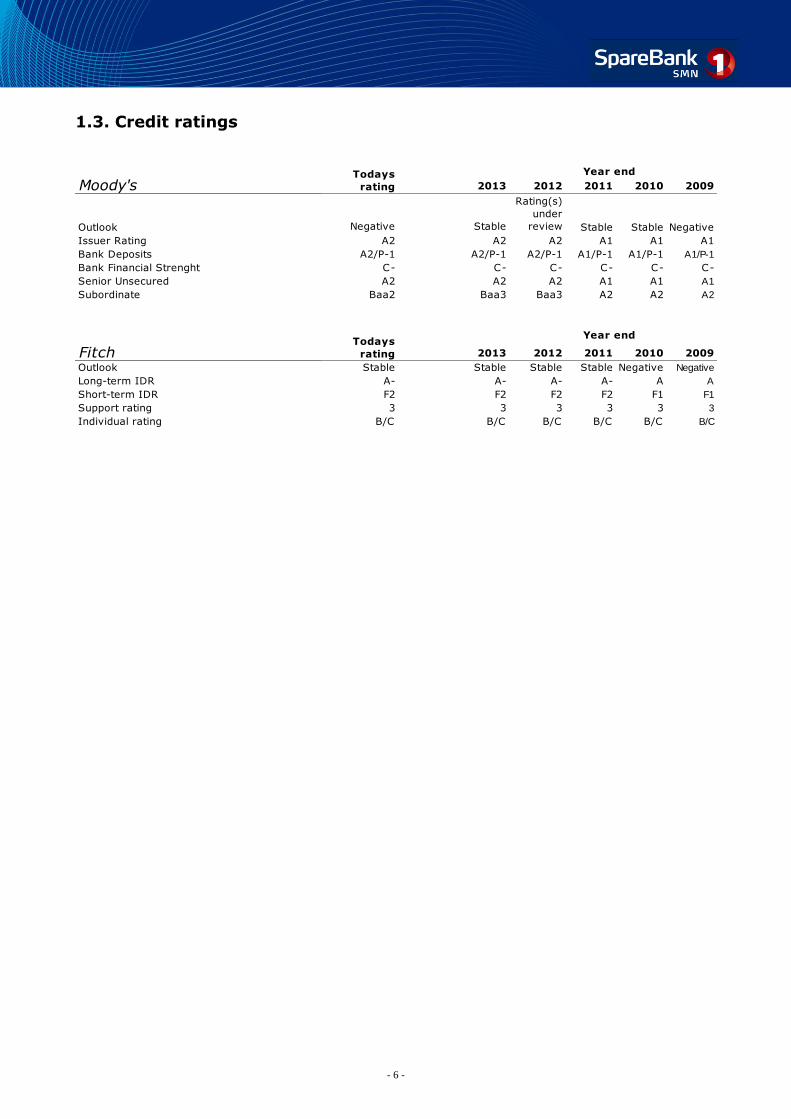
1.3. Credit ratings
Moody's 2013 2012 2011 2010 2009
Outlook Negative Stable
Rating(s)
under
review Stable Stable Negative
Issuer Rating A2 A2 A2 A1 A1 A1
Bank Deposits A2/P-1 A2/P-1 A2/P-1 A1/P-1 A1/P-1 A1/P-1
Bank Financial Strenght C- C- C- C- C- C-
Senior Unsecured A2 A2 A2 A1 A1 A1
Subordinate Baa2 Baa3 Baa3 A2 A2 A2
Fitch 2013 2012 2011 2010 2009
Outlook Stable Stable Stable Stable Negative Negative
Long-term IDR A- A- A- A- A A
Short-term IDR F2 F2 F2 F2 F1 F1
Support rating 3 3 3 3 3 3
Individual rating B/C B/C B/C B/C B/C B/C
Todays
rating
Todays
rating
Year end
Year end
- 7 -
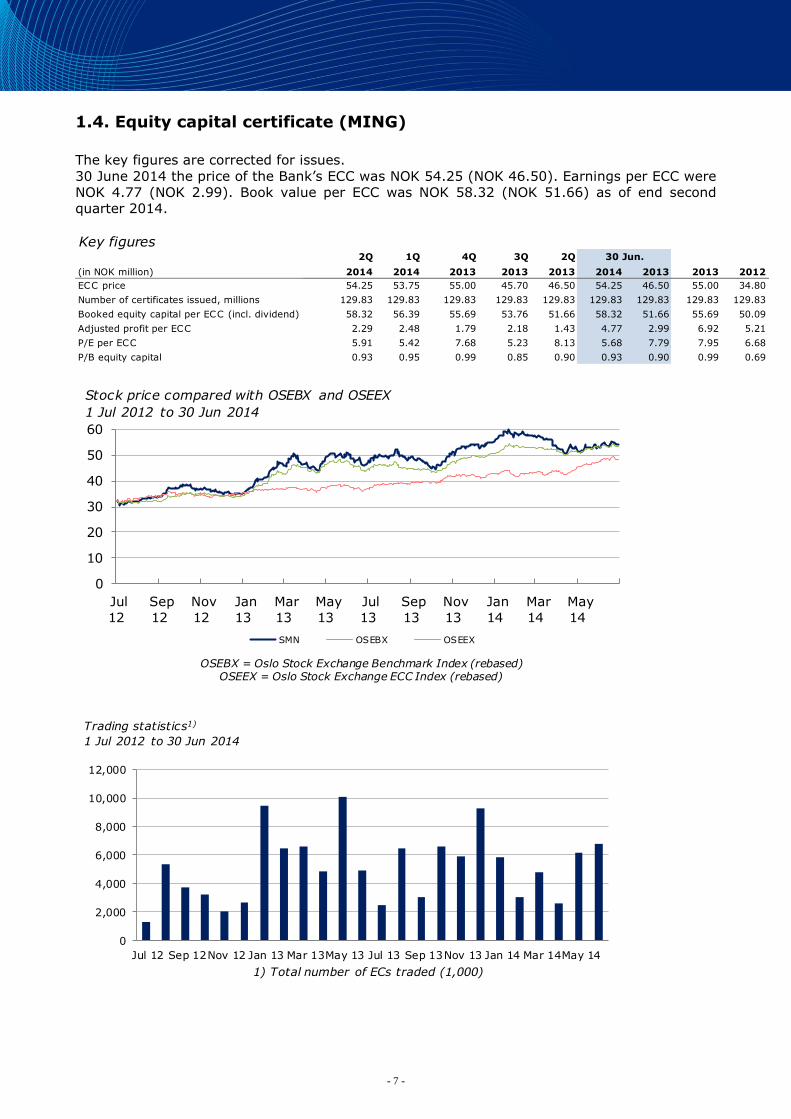
1.4. Equity capital certificate (MING)
The key figures are corrected for issues.
30 June 2014 the price of the Bank’s ECC was NOK 54.25 (NOK 46.50). Earnings per ECC were
NOK 4.77 (NOK 2.99). Book value per ECC was NOK 58.32 (NOK 51.66) as of end second
quarter 2014.
Key figures2Q 1Q 4Q 3Q 2Q
(in NOK million) 2014 2014 2013 2013 2013 2014 2013 2013 2012
ECC price 54.25 53.75 55.00 45.70 46.50 54.25 46.50 55.00 34.80
Number of certificates issued, millions 129.83 129.83 129.83 129.83 129.83 129.83 129.83 129.83 129.83
Booked equity capital per ECC (incl. dividend) 58.32 56.39 55.69 53.76 51.66 58.32 51.66 55.69 50.09
Adjusted profit per ECC 2.29 2.48 1.79 2.18 1.43 4.77 2.99 6.92 5.21
P/E per ECC 5.91 5.42 7.68 5.23 8.13 5.68 7.79 7.95 6.68
P/B equity capital 0.93 0.95 0.99 0.85 0.90 0.93 0.90 0.99 0.69
30 Jun.
0
10
20
30
40
50
60
Jul
12
Sep
12
Nov
12
Jan
13
Mar
13
May
13
Jul
13
Sep
13
Nov
13
Jan
14
Mar
14
May
14
SMN OSEBX OSEEX
Stock price compared with OSEBX and OSEEX
1 Jul 2012 to 30 Jun 2014
OSEBX = Oslo Stock Exchange Benchmark Index (rebased)OSEEX = Oslo Stock Exchange ECC Index (rebased)
0
2,000
4,000
6,000
8,000
10,000
12,000
Jul 12 Sep 12 Nov 12 Jan 13 Mar 13 May 13 Jul 13 Sep 13 Nov 13 Jan 14 Mar 14 May 14
Trading statistics1)
1 Jul 2012 to 30 Jun 2014
1) Total number of ECs traded (1,000)
- 8 -
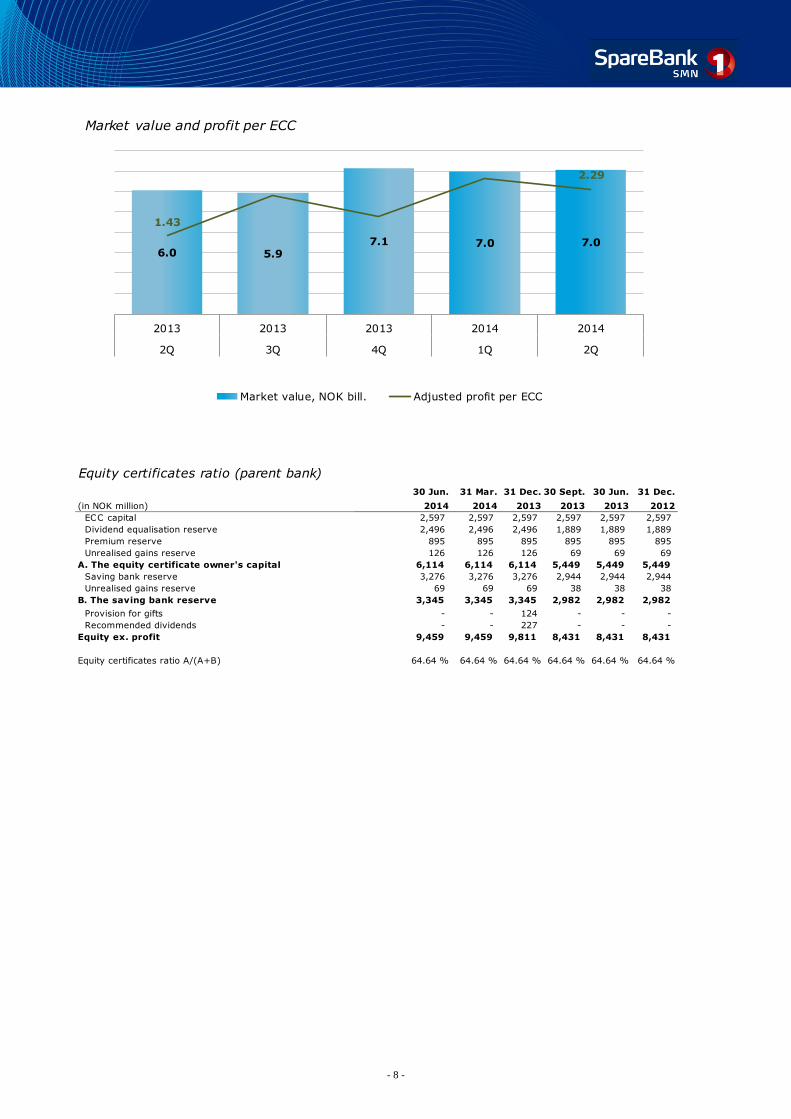
7.07.07.15.96.0
2.29
1.43
0.00
0.50
1.00
1.50
2.00
2.50
3.00
-
1000.0
2000.0
3000.0
4000.0
5000.0
6000.0
7000.0
8000.0
20142014201320132013
2Q1Q4Q3Q2Q
Market value and profit per ECC
Market value, NOK bill. Adjusted profit per ECC
Equity certificates ratio (parent bank)
30 Jun. 31 Mar. 31 Dec. 30 Sept. 30 Jun. 31 Dec.
(in NOK million) 2014 2014 2013 2013 2013 2012
ECC capital 2,597 2,597 2,597 2,597 2,597 2,597
Dividend equalisation reserve 2,496 2,496 2,496 1,889 1,889 1,889
Premium reserve 895 895 895 895 895 895
Unrealised gains reserve 126 126 126 69 69 69
A. The equity certificate owner's capital 6,114 6,114 6,114 5,449 5,449 5,449
Saving bank reserve 3,276 3,276 3,276 2,944 2,944 2,944
Unrealised gains reserve 69 69 69 38 38 38
B. The saving bank reserve 3,345 3,345 3,345 2,982 2,982 2,982
Provision for gifts - - 124 - - -
Recommended dividends - - 227 - - -
Equity ex. profit 9,459 9,459 9,811 8,431 8,431 8,431
Equity certificates ratio A/(A+B) 64.64 % 64.64 % 64.64 % 64.64 % 64.64 % 64.64 %
- 9 -
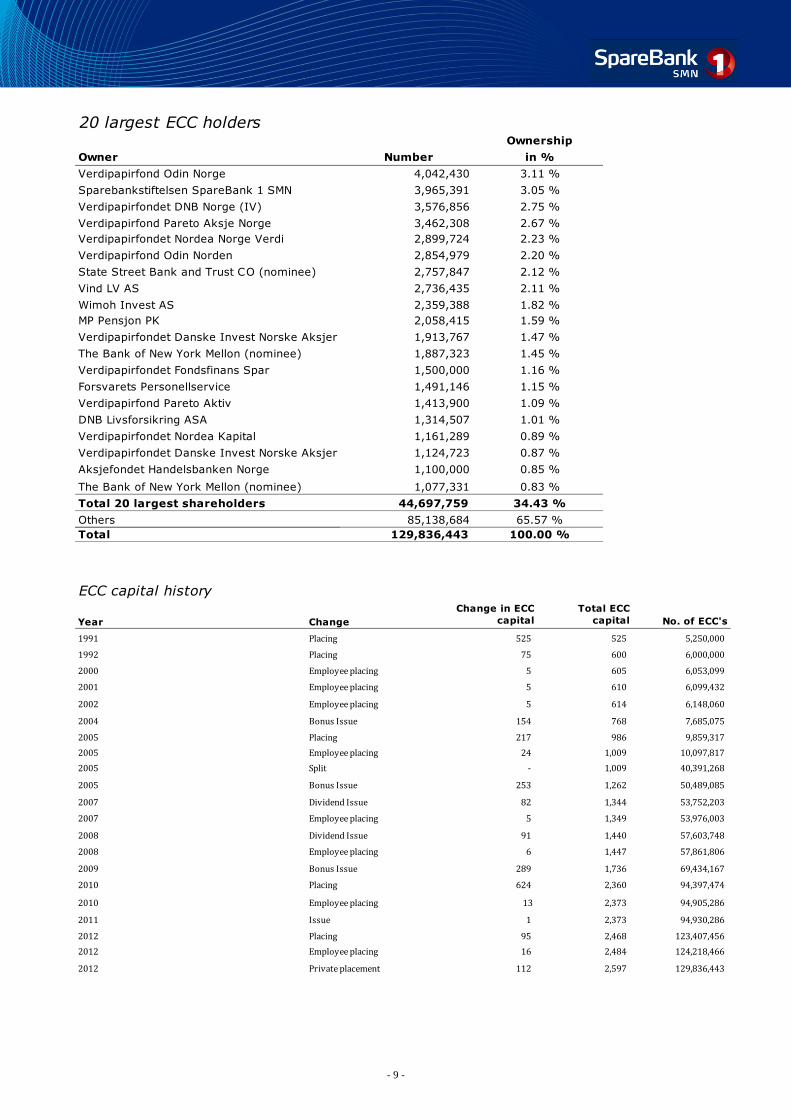
20 largest ECC holders
Owner
Verdipapirfond Odin Norge
Sparebankstiftelsen SpareBank 1 SMN
Verdipapirfondet DNB Norge (IV)
Verdipapirfond Pareto Aksje Norge
Verdipapirfondet Nordea Norge Verdi
Verdipapirfond Odin Norden
State Street Bank and Trust CO (nominee)
Vind LV AS
Wimoh Invest AS
MP Pensjon PK
Verdipapirfondet Danske Invest Norske Aksjer Inst. II
The Bank of New York Mellon (nominee)
Verdipapirfondet Fondsfinans Spar
Forsvarets Personellservice
Verdipapirfond Pareto Aktiv
DNB Livsforsikring ASA
Verdipapirfondet Nordea Kapital
Verdipapirfondet Danske Invest Norske Aksjer Instit. I
Aksjefondet Handelsbanken Norge
The Bank of New York Mellon (nominee)
Total 20 largest shareholders
Others
Total
1,500,000
1,491,146
100.00 %
0.87 %
0.85 %
0.83 %
34.43 %
65.57 %
1.16 %
1.15 %
1.09 %
1.01 %
0.89 %
1,100,000
1,077,331
44,697,759
85,138,684
129,836,443
1,314,507
1,413,900
1,161,289
1,124,723
2,058,415
1,913,767
1,887,323
2,899,724
2,854,979
2,757,847
2,736,435
2,359,388
Number
4,042,430
3,965,391
3,576,856
3,462,308
3.11 %
3.05 %
2.75 %
2.67 %
Ownership
in %
2.11 %
1.82 %
1.59 %
1.47 %
1.45 %
2.23 %
2.20 %
2.12 %
ECC capital history
Year Change
1991 Placing
1992 Placing
2000 Employee placing
2001 Employee placing
2002 Employee placing
2004 Bonus Issue
2005 Placing
2005 Employee placing
2005 Split
2005 Bonus Issue
2007 Dividend Issue
2007 Employee placing
2008 Dividend Issue
2008 Employee placing
2009 Bonus Issue
2010 Placing
2010 Employee placing
2011 Issue
2012 Placing
2012 Employee placing
2012 Private placement 112
123,407,456
124,218,466
2,468
2,484
95
16
5
5
154
91
-
253
82
2,373
614
94,930,286
217
1,344
94,905,286
94,397,474
50,489,085
40,391,268
624 2,360
13 2,373
69,434,167
53,752,203
1,736
57,603,748
57,861,806 1,447 6
289
1,349 53,976,003
1,262
5
1
6,053,099
600
605
75
129,836,443 2,597
6,148,060
1,440
1,009
Change in ECC
capital No. of ECC's
1,009 24
Total ECC
capital
10,097,817
6,099,432
7,685,075
9,859,317
610
768
986
525 5,250,000 525
5
6,000,000
- 10 -
2. Financial results Accounting principles SpareBank 1 SMN prepares and presents its quarterly accounts in compliance with the Stock Exchange Regulations, Stock Exchange Rules and International Financial Reporting Standards (IFRS), including IAS 34, Interim Financial Reporting. As from 2007 the company accounts are also prepared and presented under IFRS. This entails that investments in associates and subsidiaries are recognised using the cost method. For this reason results recorded by associates and subsidiaries are not included in the parent bank's accounts. Further, the Group has in this quarterly report mainly used the same accounting principles and calculation methods as in the latest annual report and accounts [Exceptions, see Note 1 – Accounting Principles in the Quarterly Report]. The quarterly accounts do not include all the information required in a complete set of annual financial statements and should be read in conjunction with the annual accounts for 2013.
2.1. Main figures
2Q 1Q 4Q 3Q 2Q
(in NOK million) 2014 2014 2013 2013 2013 2014 2013 2013 2012
Net interest 430 412 436 434 403 843 746 1,616 1,477
Commission income and other income 394 385 382 367 396 780 713 1,463 1,139
Net return on financial investments 201 257 156 135 49 459 211 502 451
Total income 1,026 1,055 974 937 849 2,081 1,670 3,580 3,067
Total operating expenses 443 441 465 406 436 884 850 1,722 1,654
Result before losses 583 614 508 530 413 1,197 820 1,859 1,414
Loss on loans, guarantees etc. 15 17 32 30 21 32 38 101 58
Result before tax 568 597 476 501 391 1,165 782 1,758 1,355
Tax charge 103 99 110 98 102 202 179 388 295
Results investments held for sale, after tax -1 1 -4 31 -4 0 3 30 16
Net profit 464 500 361 433 285 963 606 1,400 1,077
30 Jun.
Balance sheet - condensed30 Jun. 31 Mar. 31 Dec. 30 Sept. 30 Jun. 31 Dec.
Balance (in NOK million) 2014 2014 2013 2013 2013 2012
Total assets 118,758 111,609 115,360 111,977 113,190 107,919
Average total assets (quarterly) 115,184 113,485 113,668 112,583 111,979 105,372
Gross loans to customers * 114,561 111,560 112,038 110,237 108,968 104,909
Deposits from customers 59,408 54,736 56,074 53,423 55,294 52,252
Total equity capital 11,780 11,389 11,242 10,863 10,439 10,082
* Loans to customers includes SpareBank 1 Boligkreditt and SpareBank 1 Næringskreditt
Key figures 2Q 1Q 4Q 3Q 2Q
2014 2014 2013 2013 2013 2014 2013 2013 2012
Return on equity 16.0 % 17.7 % 13.1 % 16.3 % 11.1 % 16.8 % 11.9 % 13.3 % 11.7 %
Common Equity Tier 1 ratio 11.4 % 11.1 % 11.1 % 10.7 % 10.3 % 11.4 % 10.3 % 11.1 % 10.0 %
Cost/income ratio group 43 % 42 % 48 % 43 % 51 % 42 % 51 % 48 % 54 %
Growth in loans incl Boligkreditt and
Næringskreditt last 12 months 5.1 % 4.4 % 6.8 % 6.7 % 8.4 % 5.1 % 8.4 % 6.8 % 10.2 %
Growth in deposits last 12 months 7.4 % 4.1 % 7.3 % 5.1 % 7.3 % 7.4 % 7.3 % 7.3 % 9.2 %
Deposits-to-loan ratio 70 % 69 % 70 % 67 % 70 % 70 % 70 % 70 % 70 %
Impairment losses ratio 0.05 % 0.06 % 0.12 % 0.11 % 0.08 % 0.06 % 0.07 % 0.09 % 0.06 %
Non-performing commitm. as % of gross loans 0.29 % 0.24 % 0.34 % 0.35 % 0.38 % 0.29 % 0.38 % 0.34 % 0.36 %
ECC price 54.25 53.75 55.00 45.70 46.50 54.25 46.50 55.00 34.80
Booked equity capital per ECC (incl. dividend) 58.32 56.39 55.69 53.76 51.66 58.32 51.66 55.69 50.09
Adjusted profit per ECC 2.29 2.48 1.79 2.18 1.43 4.77 2.99 6.92 5.21
30 Jun.
- 11 -
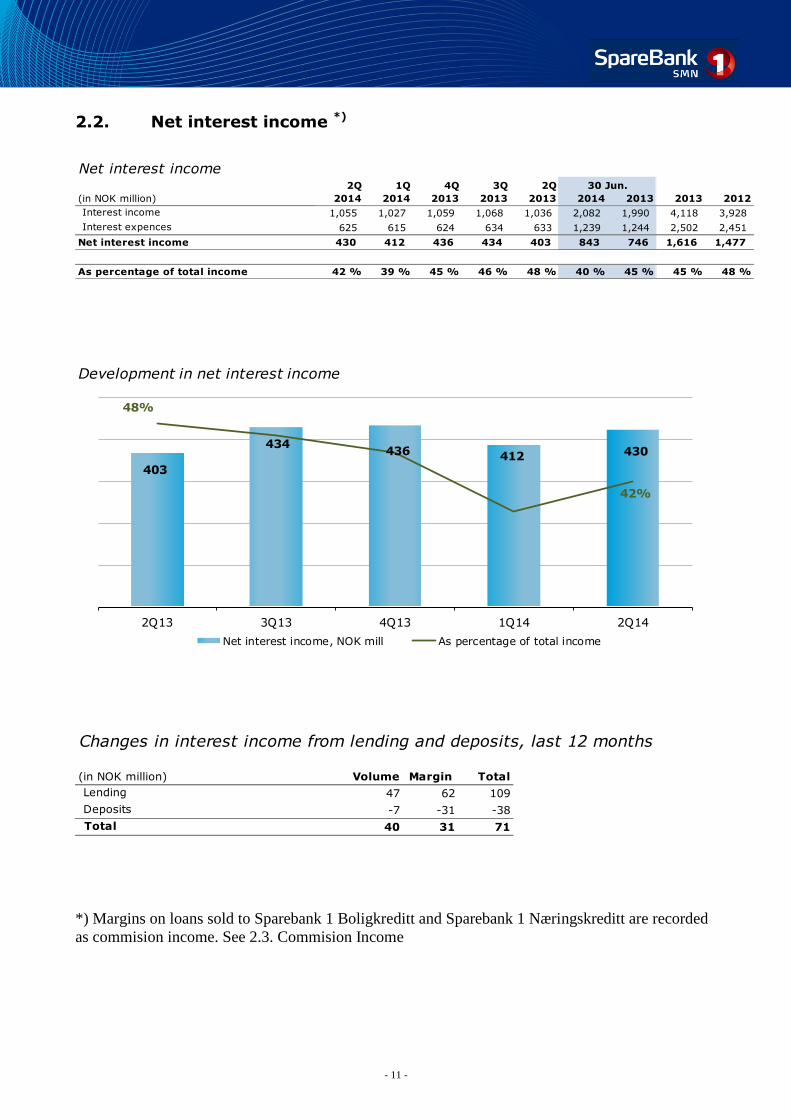
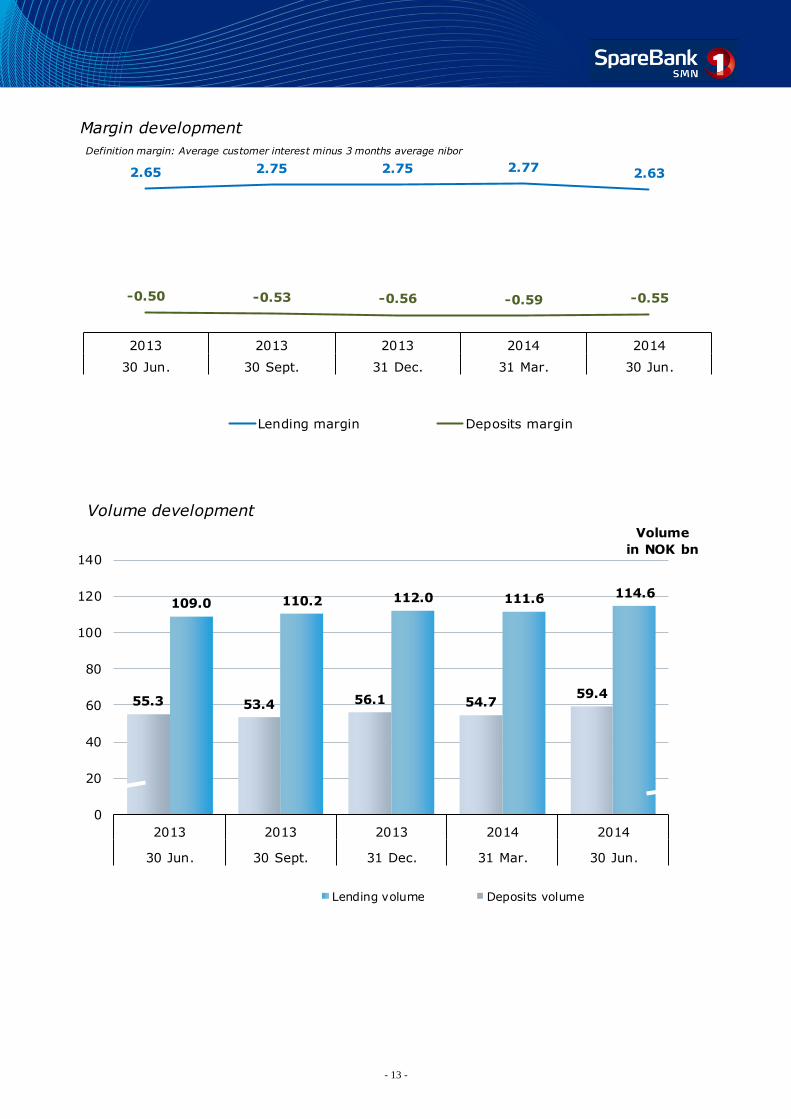
2.2. Net interest income *)
Net interest income2Q 1Q 4Q 3Q 2Q
(in NOK million) 2014 2014 2013 2013 2013 2014 2013 2013 2012
Interest income 1,055 1,027 1,059 1,068 1,036 2,082 1,990 4,118 3,928
Interest expences 625 615 624 634 633 1,239 1,244 2,502 2,451
Net interest income 430 412 436 434 403 843 746 1,616 1,477
As percentage of total income 42 % 39 % 45 % 46 % 48 % 40 % 45 % 45 % 48 %
30 Jun.
403
434436 412 430
48%
42%
30.0 %
32.0 %
34.0 %
36.0 %
38.0 %
40.0 %
42.0 %
44.0 %
46.0 %
48.0 %
50.0 %
220
270
320
370
420
470
2Q13 3Q13 4Q13 1Q14 2Q14
Development in net interest income
Net interest income, NOK mill As percentage of total income
Changes in interest income from lending and deposits, last 12 months
(in NOK million) Volume Margin Total
Lending 47 62 109
Deposits -7 -31 -38
Total 40 31 71
*) Margins on loans sold to Sparebank 1 Boligkreditt and Sparebank 1 Næringskreditt are recorded
as commision income. See 2.3. Commision Income
- 12 -
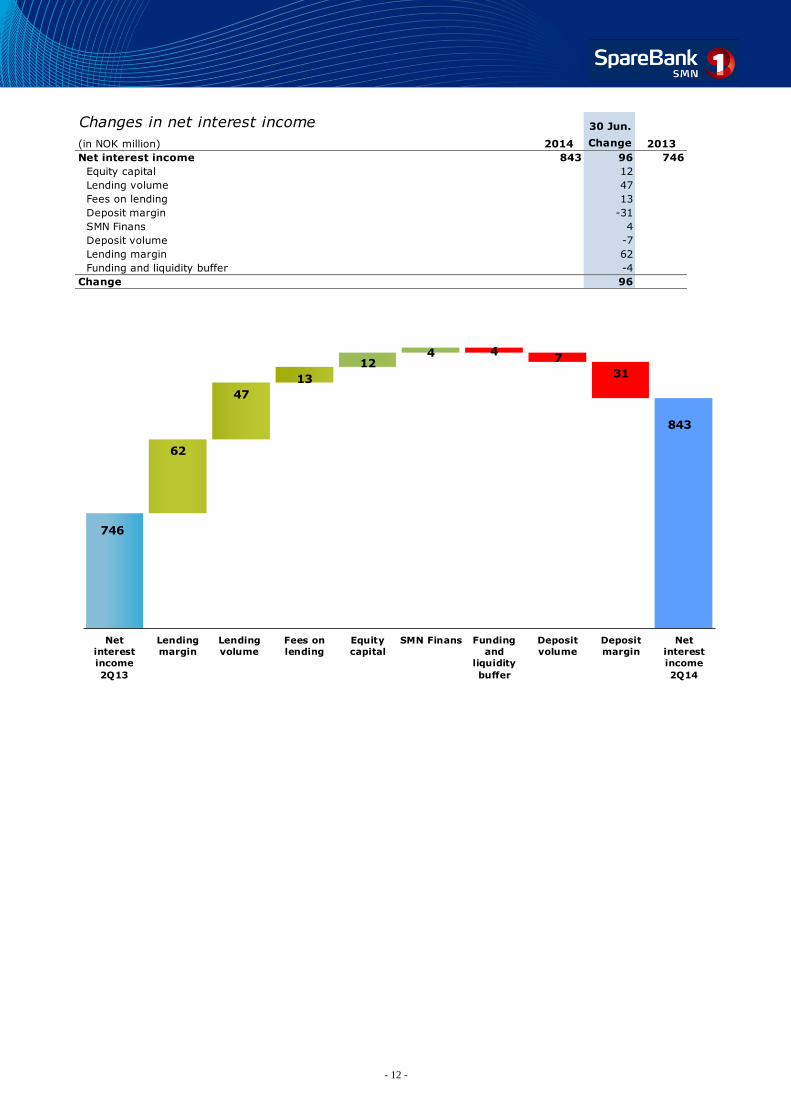
Changes in net interest income 30 Jun.
(in NOK million) 2014 Change 2013
Net interest income 843 96 746
Equity capital 12
Lending volume 47
Fees on lending 13
Deposit margin -31
SMN Finans 4
Deposit volume -7
Lending margin 62
Funding and liquidity buffer -4
Change 96
746
62
47
13
124 4
7
31
Net
interest
income
2Q13
Lending
margin
Lending
volume
Fees on
lending
Equity
capital
SMN Finans Funding
and
liquidity
buffer
Deposit
volume
Deposit
margin
Net
interest
income
2Q14
843
- 13 -
2.632.772.752.752.65
-0.55-0.59-0.56-0.53-0.50
20142014201320132013
30 Jun.31 Mar.31 Dec.30 Sept.30 Jun.
Margin development
Lending margin Deposits margin
Definition margin: Average customer interest minus 3 months average nibor
114.6111.6112.0110.2109.0
59.454.756.153.455.3
0
20
40
60
80
100
120
140
20142014201320132013
30 Jun.31 Mar.31 Dec.30 Sept.30 Jun.
Volume
in NOK bn
Volume development
Lending volume Deposits volume
- 14 -
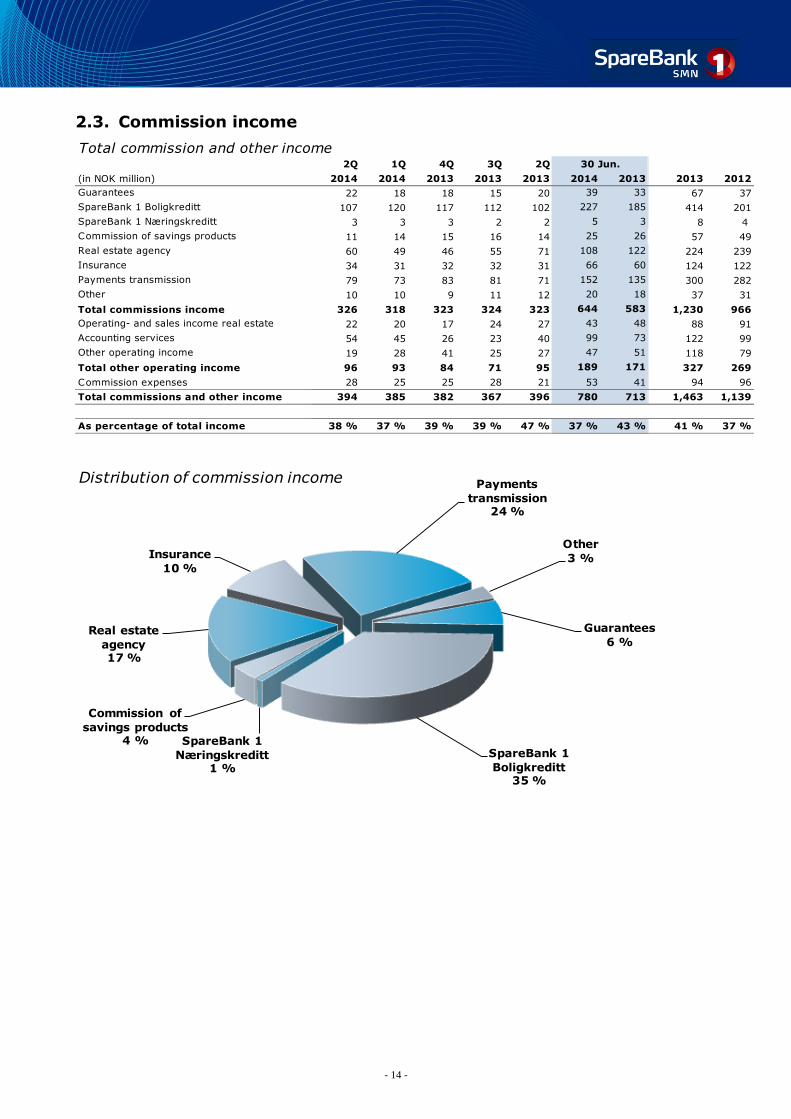
2.3. Commission income
Total commission and other income2Q 1Q 4Q 3Q 2Q
(in NOK million) 2014 2014 2013 2013 2013 2014 2013 2013 2012
Guarantees 22 18 18 15 20 39 33 67 37
SpareBank 1 Boligkreditt 107 120 117 112 102 227 185 414 201
SpareBank 1 Næringskreditt 3 3 3 2 2 5 3 8 4
Commission of savings products 11 14 15 16 14 25 26 57 49
Real estate agency 60 49 46 55 71 108 122 224 239
Insurance 34 31 32 32 31 66 60 124 122
Payments transmission 79 73 83 81 71 152 135 300 282
Other 10 10 9 11 12 20 18 37 31
Total commissions income 326 318 323 324 323 644 583 1,230 966
Operating- and sales income real estate 22 20 17 24 27 43 48 88 91
Accounting services 54 45 26 23 40 99 73 122 99
Other operating income 19 28 41 25 27 47 51 118 79
Total other operating income 96 93 84 71 95 189 171 327 269
Commission expenses 28 25 25 28 21 53 41 94 96
Total commissions and other income 394 385 382 367 396 780 713 1,463 1,139
As percentage of total income 38 % 37 % 39 % 39 % 47 % 37 % 43 % 41 % 37 %
30 Jun.
Guarantees
6 %
SpareBank 1
Boligkreditt35 %
SpareBank 1
Næringskreditt1 %
Commission of
savings products4 %
Real estate
agency17 %
Insurance
10 %
Payments
transmission 24 %
Other
3 %
Distribution of commission income
- 15 -
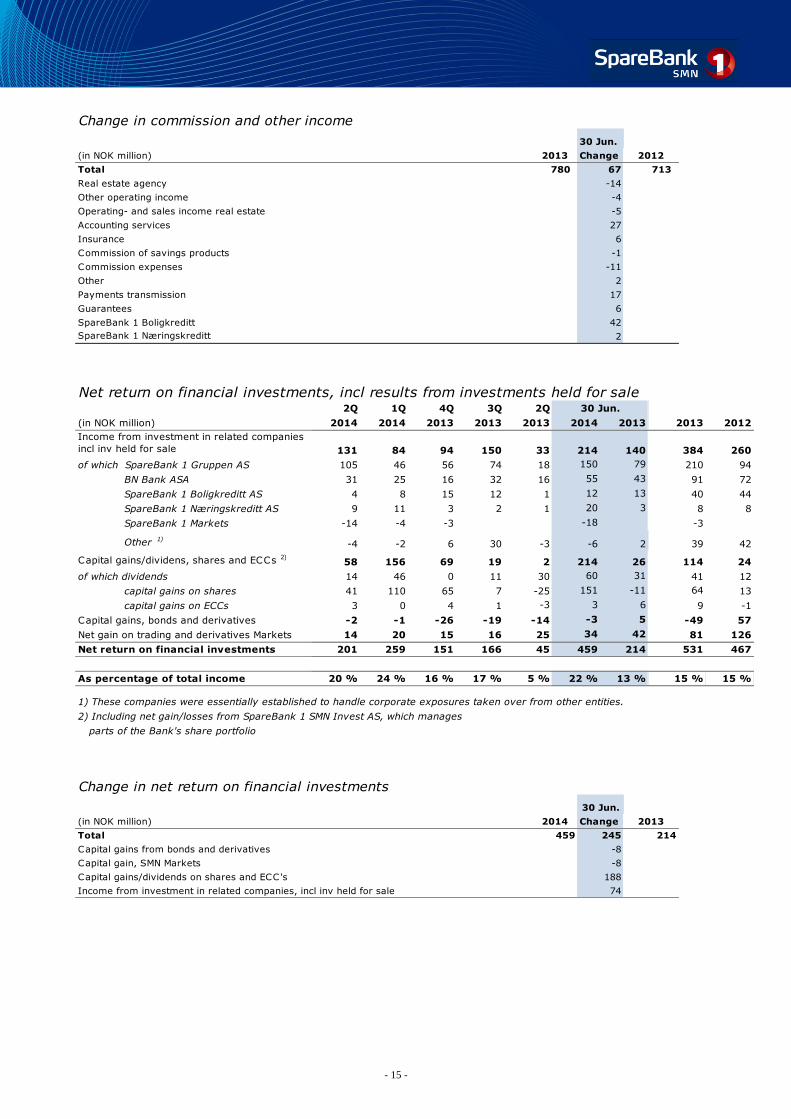
Change in commission and other income
30 Jun.
(in NOK million) 2013 Change 2012
Total 780 67 713
Real estate agency -14
Other operating income -4
Operating- and sales income real estate -5
Accounting services 27
Insurance 6
Commission of savings products -1
Commission expenses -11
Other 2
Payments transmission 17
Guarantees 6
SpareBank 1 Boligkreditt 42
SpareBank 1 Næringskreditt 2
Net return on financial investments, incl results from investments held for sale
2Q 1Q 4Q 3Q 2Q
(in NOK million) 2014 2014 2013 2013 2013 2014 2013 2013 2012
Income from investment in related companies
incl inv held for sale 131 84 94 150 33 214 140 384 260
of which SpareBank 1 Gruppen AS 105 46 56 74 18 150 79 210 94
BN Bank ASA 31 25 16 32 16 55 43 91 72
SpareBank 1 Boligkreditt AS 4 8 15 12 1 12 13 40 44
SpareBank 1 Næringskreditt AS 9 11 3 2 1 20 3 8 8
SpareBank 1 Markets -14 -4 -3 -18 -3
Other 1)-4 -2 6 30 -3 -6 2 39 42
Capital gains/dividens, shares and ECCs 2)58 156 69 19 2 214 26 114 24
of which dividends 14 46 0 11 30 60 31 41 12
capital gains on shares 41 110 65 7 -25 151 -11 64 13
capital gains on ECCs 3 0 4 1 -3 3 6 9 -1
Capital gains, bonds and derivatives -2 -1 -26 -19 -14 -3 5 -49 57
Net gain on trading and derivatives Markets 14 20 15 16 25 34 42 81 126
Net return on financial investments 201 259 151 166 45 459 214 531 467
As percentage of total income 20 % 24 % 16 % 17 % 5 % 22 % 13 % 15 % 15 %
1) These companies were essentially established to handle corporate exposures taken over from other entities.
2) Including net gain/losses from SpareBank 1 SMN Invest AS, which manages
parts of the Bank's share portfolio
30 Jun.
Change in net return on financial investments
30 Jun.
(in NOK million) 2014 Change 2013
Total 459 245 214
Capital gains from bonds and derivatives -8
Capital gain, SMN Markets -8
Capital gains/dividends on shares and ECC's 188
Income from investment in related companies, incl inv held for sale 74
- 16 -
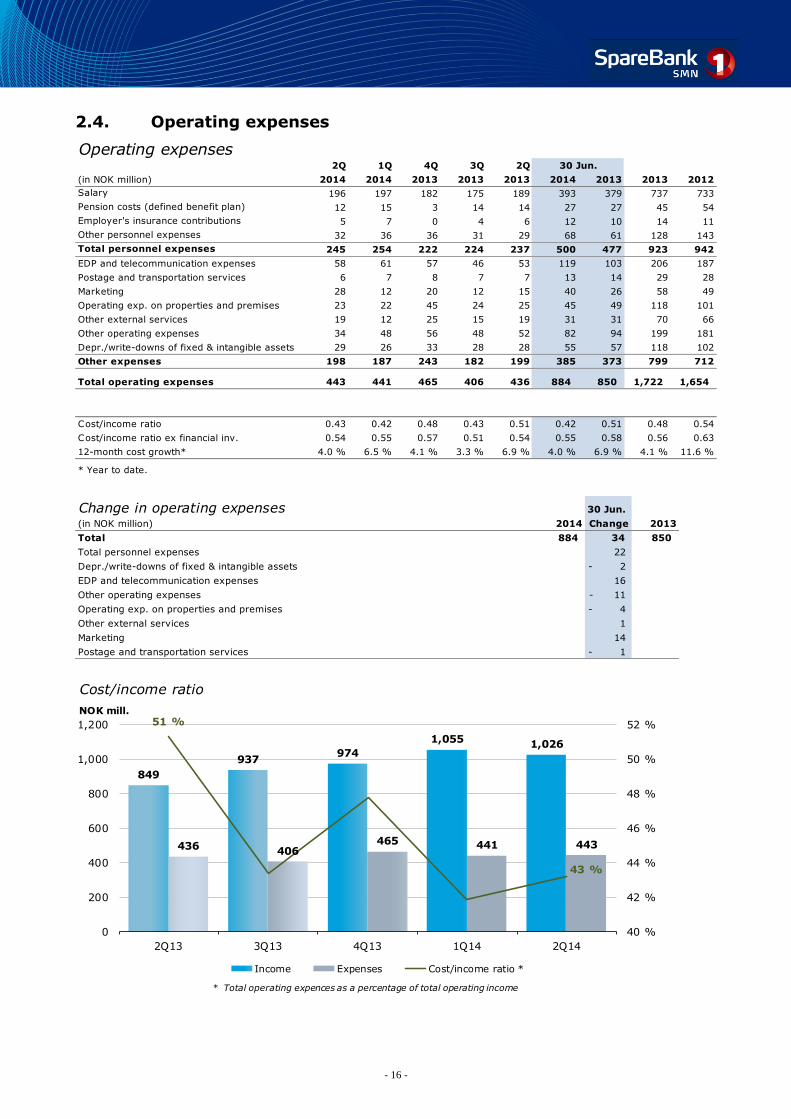
2.4. Operating expenses
Operating expenses2Q 1Q 4Q 3Q 2Q
(in NOK million) 2014 2014 2013 2013 2013 2014 2013 2013 2012
Salary 196 197 182 175 189 393 379 737 733
Pension costs (defined benefit plan) 12 15 3 14 14 27 27 45 54
Employer's insurance contributions 5 7 0 4 6 12 10 14 11
Other personnel expenses 32 36 36 31 29 68 61 128 143
Total personnel expenses 245 254 222 224 237 500 477 923 942
EDP and telecommunication expenses 58 61 57 46 53 119 103 206 187
Postage and transportation services 6 7 8 7 7 13 14 29 28
Marketing 28 12 20 12 15 40 26 58 49
Operating exp. on properties and premises 23 22 45 24 25 45 49 118 101
Other external services 19 12 25 15 19 31 31 70 66
Other operating expenses 34 48 56 48 52 82 94 199 181
Depr./write-downs of fixed & intangible assets 29 26 33 28 28 55 57 118 102
Other expenses 198 187 243 182 199 385 373 799 712
Total operating expenses 443 441 465 406 436 884 850 1,722 1,654
Cost/income ratio 0.43 0.42 0.48 0.43 0.51 0.42 0.51 0.48 0.54
Cost/income ratio ex financial inv. 0.54 0.55 0.57 0.51 0.54 0.55 0.58 0.56 0.63
12-month cost growth* 4.0 % 6.5 % 4.1 % 3.3 % 6.9 % 4.0 % 6.9 % 4.1 % 11.6 %
* Year to date.
30 Jun.
Change in operating expenses 30 Jun.
(in NOK million) 2014 Change 2013
Total 884 34 850
Total personnel expenses 22
Depr./write-downs of fixed & intangible assets 2-
EDP and telecommunication expenses 16
Other operating expenses 11-
Operating exp. on properties and premises 4-
Other external services 1
Marketing 14
Postage and transportation services 1-
849
937974
1,055 1,026
436406
465 441 443
51 %
43 %
40 %
42 %
44 %
46 %
48 %
50 %
52 %
0
200
400
600
800
1,000
1,200
2Q13 3Q13 4Q13 1Q14 2Q14
NOK mill.
Cost/income ratio
Income Expenses Cost/income ratio *
* Total operating expences as a percentage of total operating income
- 17 -
Developement of employees
Employees in employment 2Q 2014 2013 2012 2011 2010
Retail market 385 422 374 392 378
Corporate market 123 104 199 187 172
SpareBank 1 SMN Markets 31 34 42 40 33
Business operations and development 162 138 120 112 128
Management and staff 60 59 59 55 53
Parent bank 761 757 793 786 764
EiendomsMegler 1 Midt-Norge AS 188 192 177 159 148
Allegro Finans AS 10 9 10 9 10
SpareBank 1 Finans Midt-Norge AS 33 33 29 41 41
SpareBank 1 Regnskapshuset SMN AS 154 148 108 98 68
SpareBank 1 Kvartalet and other 20 19 18 4 4
Total 1,167 1,159 1,135 1,098 1,035 The bank is reorganised as from 1 January 2013. Further adjustments are made in 2014. Figures for person-years worked in 2013 and 2014 are therefore not comparable with historical figures.
764 786 793 757 761
148159 177
192 188
68
98108 148 154
41
4129
33 33
14
1328
28 30
2010 2011 2012 2013 2Q 2014
Employees in employment
Parent bank EiendomsMegler 1 Midt-Norge AS
SpareBank 1 Regnskapshuset SMN AS SpareBank 1 Finans Midt-Norge AS
Other
- 18 -
3. Loans to customers
3.1. Distribution of loans by industry
Distribution of loans by industry30 Jun. 31 Mar. 31 Dec. 30 Sept. 30 Jun. 31 Dec.
(in NOK million) 2014 2014 2013 2013 2013 2012
Agriculture/forestry/fisheries/hunting 6,552 6,351 6,359 6,210 6,025 6,129
Fish farming 1,497 1,621 2,463 2,479 2,175 2,447
Manufacturing and mining 2,056 2,030 2,142 2,145 2,435 2,349
Construction, power and water supply 3,201 3,105 3,207 3,525 3,571 3,504
Retail trade, hotels and restaurants 2,473 2,375 2,442 2,464 2,694 2,804
Maritime sector 4,961 5,099 5,402 5,347 5,561 5,739
Comercial Real Estate 12,622 12,016 12,118 11,978 12,052 11,710
Business services 3,954 3,889 3,867 3,636 3,687 3,258
Transport and other services provision 2,701 2,685 2,706 2,899 2,737 2,364
Public administration 220 293 423 252 195 215
Other sectors 3,075 2,566 2,395 1,952 1,989 1,801
Gross loans in corporate market 43,312 42,030 43,523 42,887 43,123 42,322
Retail customers 71,249 69,530 68,515 67,350 65,846 62,587
Gross loans incl. Boligkr. and Næringskr. 114,561 111,560 112,038 110,237 108,968 104,909
- Adv. of this Boligkreditt 28,128 30,961 30,514 29,502 29,382 29,348
- Adv. of this Næringskreditt 1,227 1,233 1,221 892 611 618
Gross loans in balance sheet 85,206 79,366 80,303 79,842 78,976 74,943
Share of loans, corporate market 38 % 38 % 39 % 39 % 40 % 40 %
Share of loans, retail market 62 % 62 % 61 % 61 % 60 % 60 %
Agriculture/forestry/fisheries/hunting
6 %
Fish farming
1 %
Manufacturing
and mining2 %
Construction,
power and water supply
3 %
Retail trade,
hotels and restaurants
2 %
Maritime sector
4 %
Comercial Real
Estate11 %
Business services
3 %
Transport and
other services provision
2 %
Other sectors
3 %
Retail customers
62 %
Distribution of loans by industry
- 19 -
3.2. Risk profile and write-downs
21.6
28.331.3
13.612.1
9.38.3
3.32.0
0.2 0.3
A B C D E F G H I J K
NOK billion
Actual risk profil, Exposure At Default
Risk classification in SpareBank 1 SMN
Risk class Low High
A 0.01 0.10 AAA - A3
B 0.10 0.25 Baa1 - Baa2
C 0.25 0.50 Baa3
D 0.50 0.75 Ba1
E 0.75 1.25 Ba2
F 1.25 2.50
G 2.50 5.00 Ba2 - B1
H 5.00 10.00 B1 - B2
I 10.00 99.99 B3 - caa3
J Default
K Written down
Risk class A represents the lowest risk and class K the highest risk.
* Probability of default
PD* in percent Corresponding
ratingclass at
Moody's
Write-downs on loans and guarantees
2Q 1Q 4Q 3Q 2Q
(in NOK million) 2014 2014 2013 2013 2013 2014 2013 2013 2012
Increase in and new individual write-downs 3 0 5 15 11 3 10 29 -28
Reassessments and recoveries -12 -17 -28 -15 -10 -28 -29 -71 -81
Total individual write-downs 15 17 32 30 21 32 38 101 53
Change in group write-downs on loans 0 0 0 0 0 0 0 0 5
Write-downs on loans and guarantees 15 17 32 30 21 32 38 101 58
As % of gross loans incl. Boligkreditt 0.05 % 0.06 % 0.12 % 0.11 % 0.08 % 0.06 % 0.07 % 0.09 % 0.06 %
30 Jun.
- 20 -
Loss on loans by segment2Q 1Q 4Q 3Q 2Q
(in NOK million) 2014 2014 2013 2013 2013 2014 2013 2013
Retail 0 1 1 0 2 1 6 6
SME * -1 3 1 3 5
Corporate 14 14 22 25 14 28 24 71
SMN Finans and other 1 2 11 2 4 3 5 19
Collective write downs 0 0 0 0 0 0 0 0
Total loss on loans 15 17 32 30 21 32 38 101
* As from 1 January 2014 the bank's SME portfolio is split up and assigned to Retail Banking and Corporate Banking respectively.
30 Jun.
20
1 1
13
-1
14
25
22
1414
4
211
21
2Q13 3Q13 4Q13 1Q14 2Q14
Retail SME Corporate SMN Finans and other
- 21 -
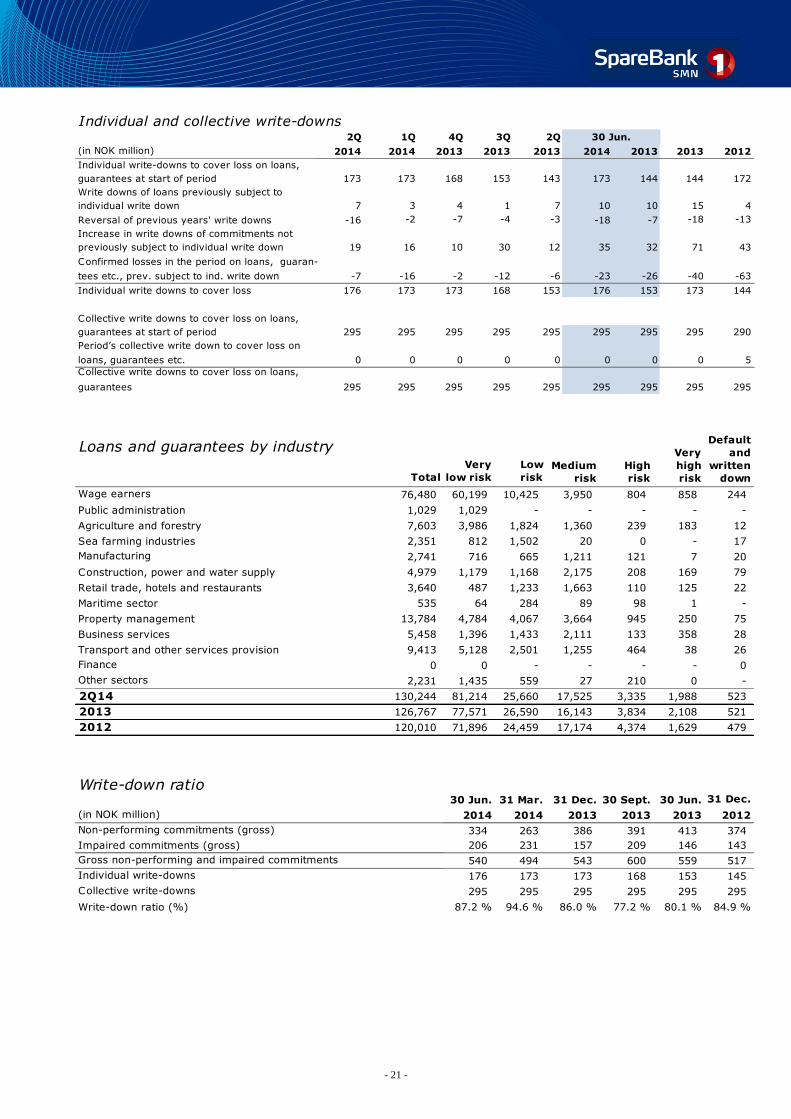
Individual and collective write-downs2Q 1Q 4Q 3Q 2Q
(in NOK million) 2014 2014 2013 2013 2013 2014 2013 2013 2012
Individual write-downs to cover loss on loans,
guarantees at start of period 173 173 168 153 143 173 144 144 172
Write downs of loans previously subject to
individual write down 7 3 4 1 7 10 10 15 4
Reversal of previous years' write downs -16 -2 -7 -4 -3 -18 -7 -18 -13
Increase in write downs of commitments not
previously subject to individual write down 19 16 10 30 12 35 32 71 43
Confirmed losses in the period on loans, guaran-
tees etc., prev. subject to ind. write down -7 -16 -2 -12 -6 -23 -26 -40 -63
Individual write downs to cover loss 176 173 173 168 153 176 153 173 144
Collective write downs to cover loss on loans,
guarantees at start of period 295 295 295 295 295 295 295 295 290
Period’s collective write down to cover loss on
loans, guarantees etc. 0 0 0 0 0 0 0 0 5
Collective write downs to cover loss on loans,
guarantees 295 295 295 295 295 295 295 295 295
30 Jun.
Loans and guarantees by industry
Total
Very
low risk
Low
risk
Wage earners 76,480 60,199 10,425 3,950 804 858 244
Public administration 1,029 1,029 - - - - -
Agriculture and forestry 7,603 3,986 1,824 1,360 239 183 12
Sea farming industries 2,351 812 1,502 20 0 - 17
Manufacturing 2,741 716 665 1,211 121 7 20
Construction, power and water supply 4,979 1,179 1,168 2,175 208 169 79
Retail trade, hotels and restaurants 3,640 487 1,233 1,663 110 125 22
Maritime sector 535 64 284 89 98 1 -
Property management 13,784 4,784 4,067 3,664 945 250 75
Business services 5,458 1,396 1,433 2,111 133 358 28
Transport and other services provision 9,413 5,128 2,501 1,255 464 38 26
Finance 0 0 - - - - 0
Other sectors 2,231 1,435 559 27 210 0 -
2Q14 130,244 81,214 25,660 17,525 3,335 1,988 523
2013 126,767 77,571 26,590 16,143 3,834 2,108 521
2012 120,010 71,896 24,459 17,174 4,374 1,629 479
Default
and
written
down
Medium
risk
High
risk
Very
high
risk
Write-down ratio30 Jun. 31 Mar. 31 Dec. 30 Sept. 30 Jun.
(in NOK million) 2014 2014 2013 2013 2013 2012
Non-performing commitments (gross) 334 263 386 391 413 374
Impaired commitments (gross) 206 231 157 209 146 143
Gross non-performing and impaired commitments 540 494 543 600 559 517
Individual write-downs 176 173 173 168 153 145
Collective write-downs 295 295 295 295 295 295
Write-down ratio (%) 87.2 % 94.6 % 86.0 % 77.2 % 80.1 % 84.9 %
31 Dec.
- 22 -
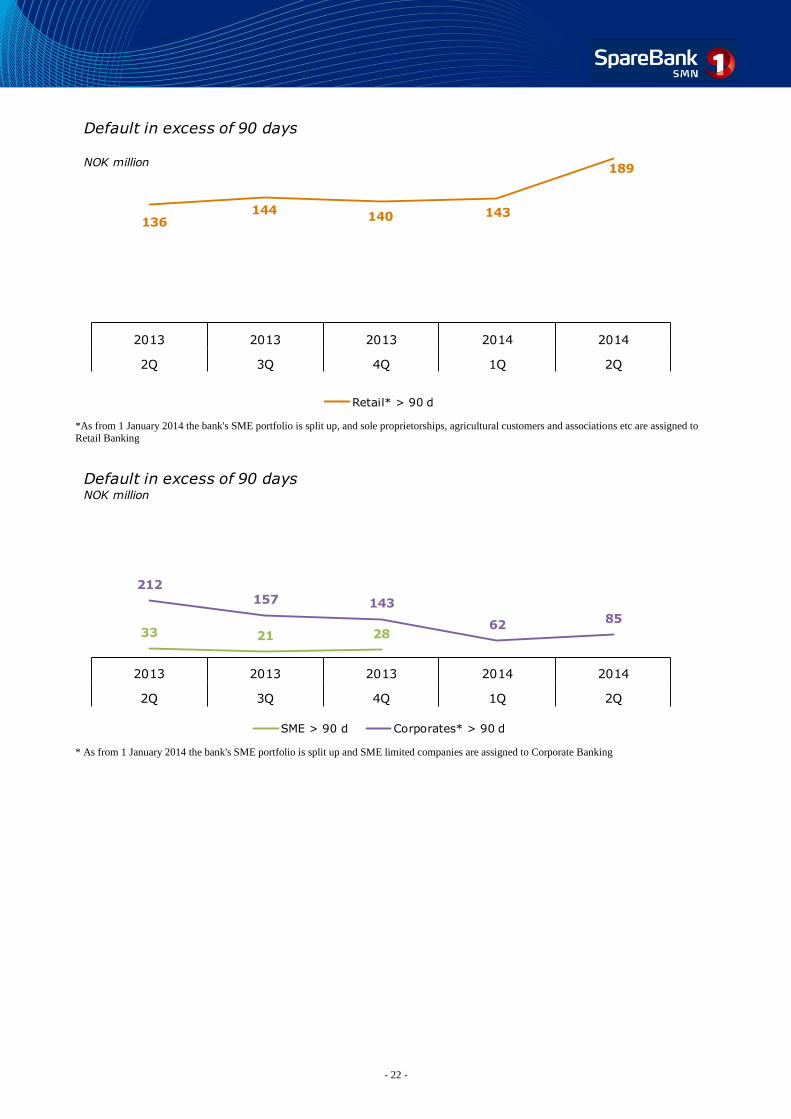
189
143140144
136
20142014201320132013
2Q1Q4Q3Q2Q
Default in excess of 90 days
NOK million
Retail* > 90 d
*As from 1 January 2014 the bank's SME portfolio is split up, and sole proprietorships, agricultural customers and associations etc are assigned to
Retail Banking
28213385
62
143157212
20142014201320132013
2Q1Q4Q3Q2Q
Default in excess of 90 daysNOK million
SME > 90 d Corporates* > 90 d
* As from 1 January 2014 the bank's SME portfolio is split up and SME limited companies are assigned to Corporate Banking
- 23 -
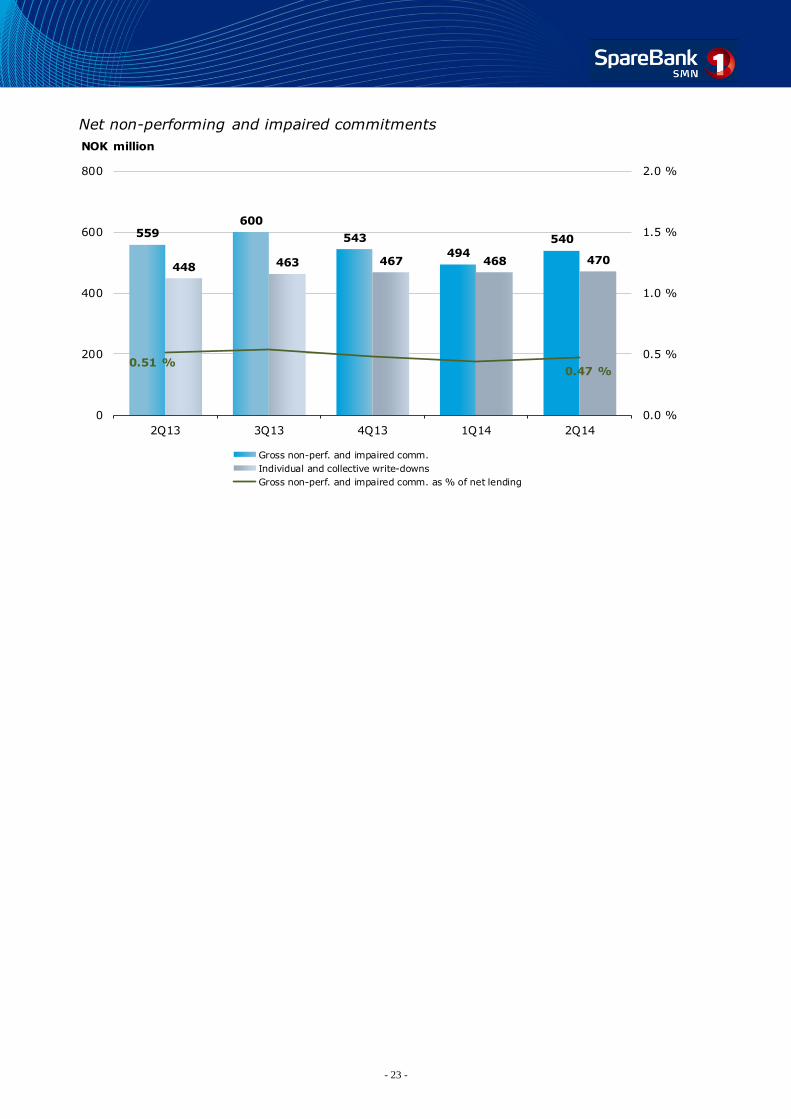
559600
543
494
540
448 463 467 468 470
0.51 %0.47 %
0.0 %
0.5 %
1.0 %
1.5 %
2.0 %
0
200
400
600
800
2Q13 3Q13 4Q13 1Q14 2Q14
NOK million
Net non-performing and impaired commitments
Gross non-perf. and impaired comm.
Individual and collective write-downs
Gross non-perf. and impaired comm. as % of net lending
- 24 -
4. Capital Adequacy
SpareBank 1 SMN has used IRB (Internal Rating Approach – Foundation) to calculate charges
for credit risk since January 2007. Using IRB imposes wide-ranging requirements on the bank’s
organisation, competence, risk models and risk management systems. In June 2013 the bank
applied for permission to switch to Advanced IRB for enterprise portfolios currently reported
using the foundation approach. The effect of the risk weights under IRB is limited due to
transitional rules set out in regulations issued by Finanstilsynet.
As from Q2 2013 the measurement method for operational risk was changed from the basic
approach to the standardised approach at the parent bank. At the group level, subsidiaries are
still measured using the basic approach.
As from 1 July 2013 new buffer requirements have been introduced; see the Financial
Institutions Act section 2-9e. As of 30 June 2014 the capital conservation buffer requirement is
2.5 per cent and the systemic risk buffer requirement is 2 per cent. These requirements are in
addition to the requirement that own funds should constitute at least 4.5 per cent common
equity tier 1 (CET1) capital, bringing the overall minimum CET1 requirement to 9 per cent.
The systemic risk buffer requirement will increase by a further 1 percentage point, bringing the
overall CET1 requirement as of 1 July 2014 to 10 per cent. As of 30 June 2015, a
countercyclical buffer requirement of 1 percentage point will be applicable.
BN Bank received approval for the use of the advanced IRB approach for its corporate portfolio
in April 2014. This brought a reduction of NOK 134m in the capital requirement on BN Bank
over the course of the quarter, mainly due reduced risk weights in BN Bank's corporate
portfolio.
Hybrid capital denotes bonds with a nominal interest rate, but the bank is not obliged to pay
interest in a period where dividends are not paid, and neither is the investor subsequently
entitled to interest that has not been paid, i.e. interest does not accumulate. Hybrid capital
characterized by moderate repayment incentives is approved as an element of tier 1 capital up
to limit of 15 per cent of aggregate tier 1 capital. If, on the other hand, hybrid capital has no
fixed term to maturity and has no repayment incentives, it may be included as an element of
core capital up to limit of 35 per cent of aggregate core capital.
Finanstilsynet (Norway’s FSA) can require hybrid capital to be written down in proportion with
equity capital should the bank’s tier 1 capital adequacy fall below 5 per cent or total capital
adequacy falls below 8 per cent. Written-down amounts on hybrid capital must be written up
before dividends can be paid to shareholders or before equity capital is written up. Hybrid
capital is recognised as other long-term debt at amortised cost.
In connection with change requirements regarding the conditions for hybrid capital, hybrid
capital that does not satisfy the new requirements over time will not be eligible for inclusion in
other core capital. Such hybrid capital will be reduced by 20 per cent in 2014 and 10 per cent
thereafter. As of 30 June 2014, SpareBank 1 SMN held NOK 450m in hybrid capital which will
be subject to reduction.
Subordinated debt ranks behind all other liabilities. Dated subordinated loans cannot constitute
more than 50 per cent of tier 1 capital for capital adequacy purposes, while perpetual
subordinated loans cannot constitute more than 100 per cent of tier 1 capital. Subordinated
loans are classified as a liability in the balance sheet and are measured at amortised cost in
the same way as other long-term loans.
- 25 -
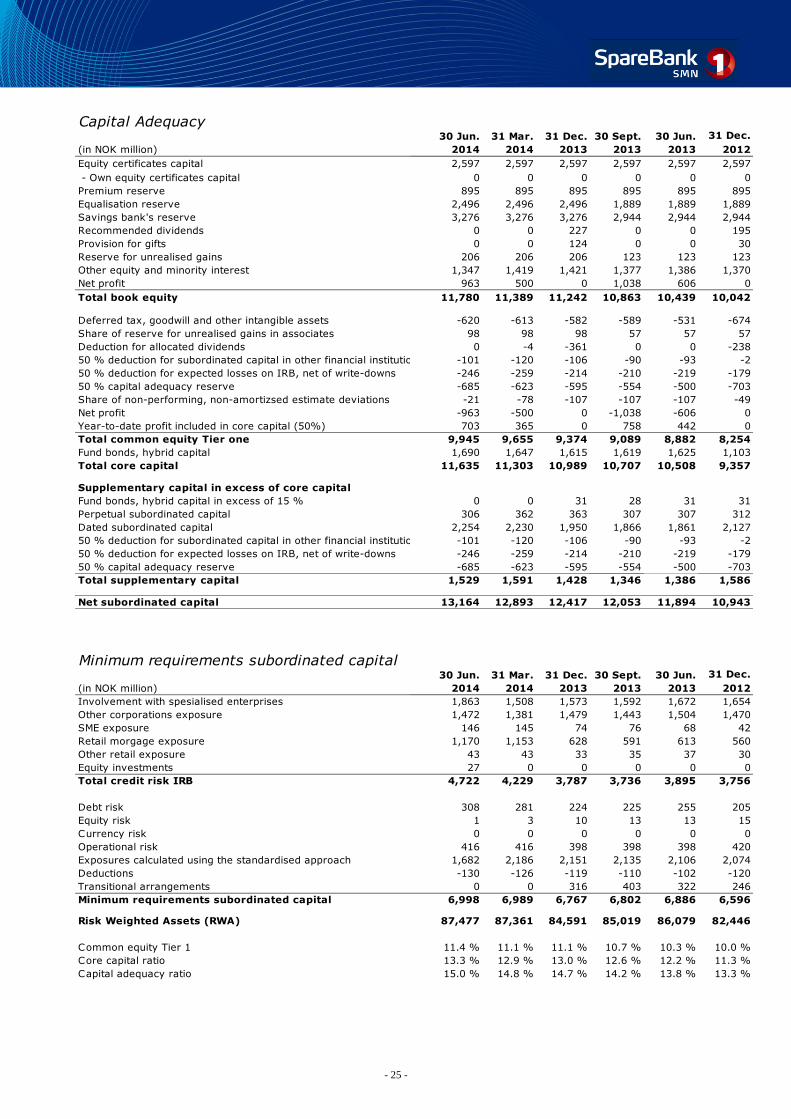
Capital Adequacy30 Jun. 31 Mar. 31 Dec. 30 Sept. 30 Jun. 31 Dec.
(in NOK million) 2014 2014 2013 2013 2013 2012
Equity certificates capital 2,597 2,597 2,597 2,597 2,597 2,597
- Own equity certificates capital 0 0 0 0 0 0
Premium reserve 895 895 895 895 895 895
Equalisation reserve 2,496 2,496 2,496 1,889 1,889 1,889
Savings bank's reserve 3,276 3,276 3,276 2,944 2,944 2,944
Recommended dividends 0 0 227 0 0 195
Provision for gifts 0 0 124 0 0 30
Reserve for unrealised gains 206 206 206 123 123 123
Other equity and minority interest 1,347 1,419 1,421 1,377 1,386 1,370
Net profit 963 500 0 1,038 606 0
Total book equity 11,780 11,389 11,242 10,863 10,439 10,042
Deferred tax, goodwill and other intangible assets -620 -613 -582 -589 -531 -674
Share of reserve for unrealised gains in associates 98 98 98 57 57 57
Deduction for allocated dividends 0 -4 -361 0 0 -238
50 % deduction for subordinated capital in other financial institutions -101 -120 -106 -90 -93 -2
50 % deduction for expected losses on IRB, net of write-downs -246 -259 -214 -210 -219 -179
50 % capital adequacy reserve -685 -623 -595 -554 -500 -703
Share of non-performing, non-amortizsed estimate deviations -21 -78 -107 -107 -107 -49
Net profit -963 -500 0 -1,038 -606 0
Year-to-date profit included in core capital (50%) 703 365 0 758 442 0
Total common equity Tier one 9,945 9,655 9,374 9,089 8,882 8,254
Fund bonds, hybrid capital 1,690 1,647 1,615 1,619 1,625 1,103
Total core capital 11,635 11,303 10,989 10,707 10,508 9,357
Supplementary capital in excess of core capital
Fund bonds, hybrid capital in excess of 15 % 0 0 31 28 31 31
Perpetual subordinated capital 306 362 363 307 307 312
Dated subordinated capital 2,254 2,230 1,950 1,866 1,861 2,127
50 % deduction for subordinated capital in other financial institutions -101 -120 -106 -90 -93 -2
50 % deduction for expected losses on IRB, net of write-downs -246 -259 -214 -210 -219 -179
50 % capital adequacy reserve -685 -623 -595 -554 -500 -703
Total supplementary capital 1,529 1,591 1,428 1,346 1,386 1,586
Net subordinated capital 13,164 12,893 12,417 12,053 11,894 10,943
Minimum requirements subordinated capital30 Jun. 31 Mar. 31 Dec. 30 Sept. 30 Jun. 31 Dec.
(in NOK million) 2014 2014 2013 2013 2013 2012
Involvement with spesialised enterprises 1,863 1,508 1,573 1,592 1,672 1,654
Other corporations exposure 1,472 1,381 1,479 1,443 1,504 1,470
SME exposure 146 145 74 76 68 42
Retail morgage exposure 1,170 1,153 628 591 613 560
Other retail exposure 43 43 33 35 37 30
Equity investments 27 0 0 0 0 0
Total credit risk IRB 4,722 4,229 3,787 3,736 3,895 3,756
Debt risk 308 281 224 225 255 205
Equity risk 1 3 10 13 13 15
Currency risk 0 0 0 0 0 0
Operational risk 416 416 398 398 398 420
Exposures calculated using the standardised approach 1,682 2,186 2,151 2,135 2,106 2,074
Deductions -130 -126 -119 -110 -102 -120
Transitional arrangements 0 0 316 403 322 246
Minimum requirements subordinated capital 6,998 6,989 6,767 6,802 6,886 6,596
Risk Weighted Assets (RWA) 87,477 87,361 84,591 85,019 86,079 82,446
Common equity Tier 1 11.4 % 11.1 % 11.1 % 10.7 % 10.3 % 10.0 %
Core capital ratio 13.3 % 12.9 % 13.0 % 12.6 % 12.2 % 11.3 %
Capital adequacy ratio 15.0 % 14.8 % 14.7 % 14.2 % 13.8 % 13.3 %
- 26 -
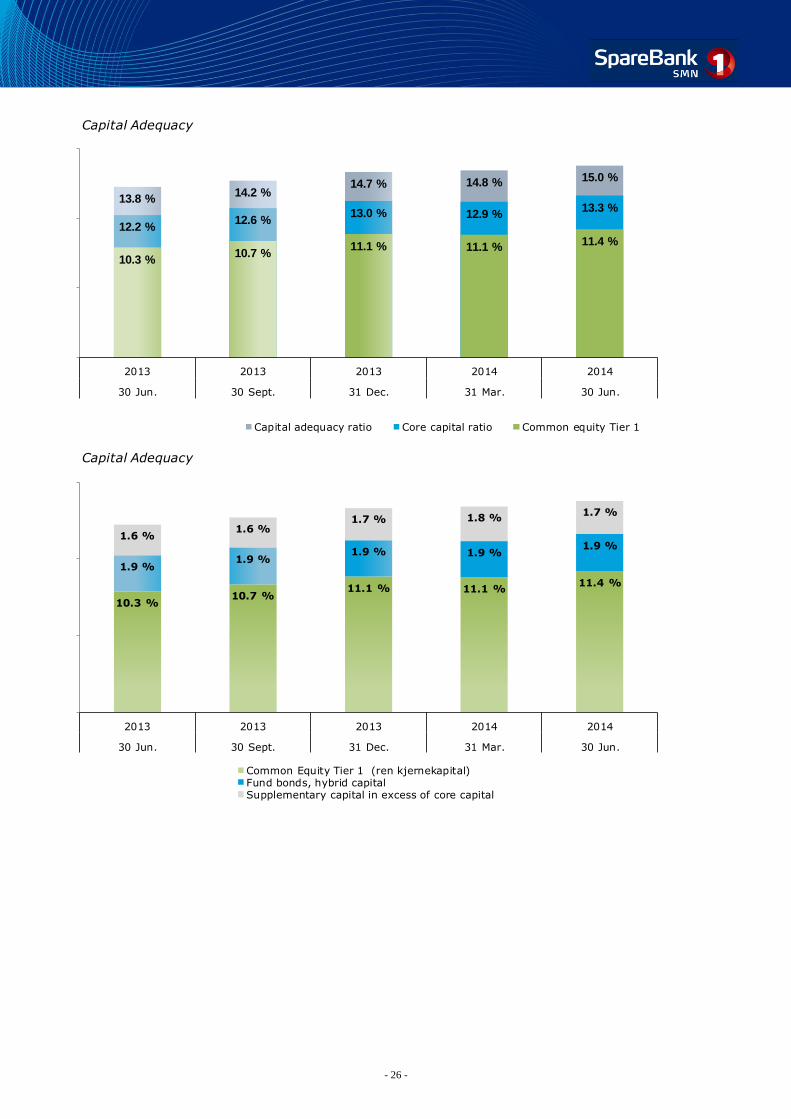
13.8 %14.2 %
14.7 % 14.8 % 15.0 %
12.2 %12.6 %
13.0 % 12.9 %13.3 %
10.3 %10.7 %
11.1 % 11.1 % 11.4 %
2013 2013 2013 2014 2014
30 Jun. 30 Sept. 31 Dec. 31 Mar. 30 Jun.
Capital Adequacy
Capital adequacy ratio Core capital ratio Common equity Tier 1
10.3 %10.7 %
11.1 % 11.1 %11.4 %
1.9 %1.9 %
1.9 % 1.9 %1.9 %
1.6 %1.6 %
1.7 % 1.8 %1.7 %
2013 2013 2013 2014 2014
30 Jun. 30 Sept. 31 Dec. 31 Mar. 30 Jun.
Capital Adequacy
Common Equity Tier 1 (ren kjernekapital)Fund bonds, hybrid capitalSupplementary capital in excess of core capital
- 27 -
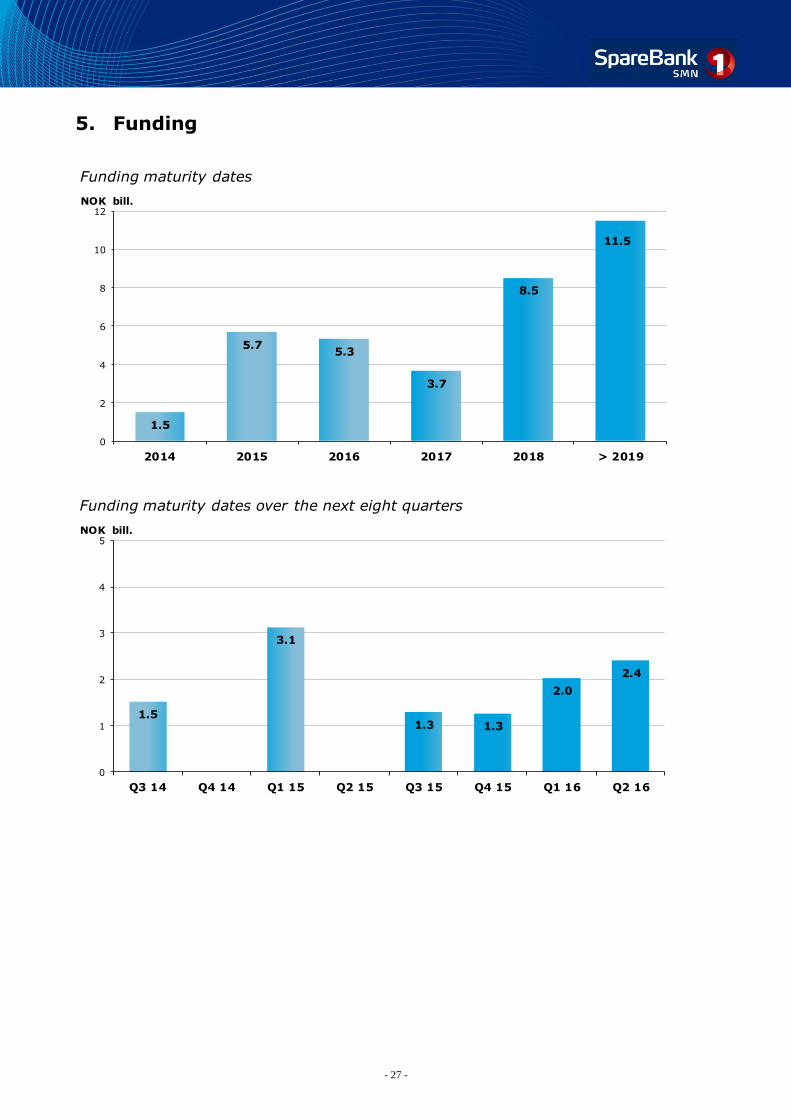
5. Funding
1.5
5.75.3
3.7
8.5
11.5
0
2
4
6
8
10
12
2014 2015 2016 2017 2018 > 2019
NOK bill.
Funding maturity dates
1.5
3.1
1.3 1.3
2.0
2.4
0
1
2
3
4
5
Q3 14 Q4 14 Q1 15 Q2 15 Q3 15 Q4 15 Q1 16 Q2 16
NOK bill.
Funding maturity dates over the next eight quarters

- 28 -
Capital markets funding30 Jun. 31 Mar. 31 Dec. 30 Sept. 30 Jun. 31 Dec.
(in NOK million) 2014 2014 2013 2013 2013 2012
NOK Bonds 18,753 19,403 18,953 19,686 21,336 22,858
Curr Bonds 12,403 8,022 11,451 9,832 9,550 6,944
NOK CD's 775 2,750 2,750 112 109 706
Interbank 6,777 5,565 5,159 5,615 6,372 5,137
Gov. Swap arrangement - 1,143 1,220 2,273 2,273 2,273
Perp. Sub. Loan capital 306 304 304 307 307 12
Hybrid equity 1,400 1,433 1,431 1,431 1,441 432
Subordinated loan capital 1,600 1,576 1,569 1,602 1,598 1,810
Other liabilities 7,754 6,942 5,830 7,952 5,846 5,938
Total 49,769 47,137 48,667 48,812 48,830 46,110
NOK Bonds 38 %
Curr Bonds 25 %
NOK CD's 2 % Interbank 14 % Perp. Sub. Loan capital 1 % Hybrid equity 3
%
Subordinated loan capital 3 %
Other liabilities 16 %
- 29 -
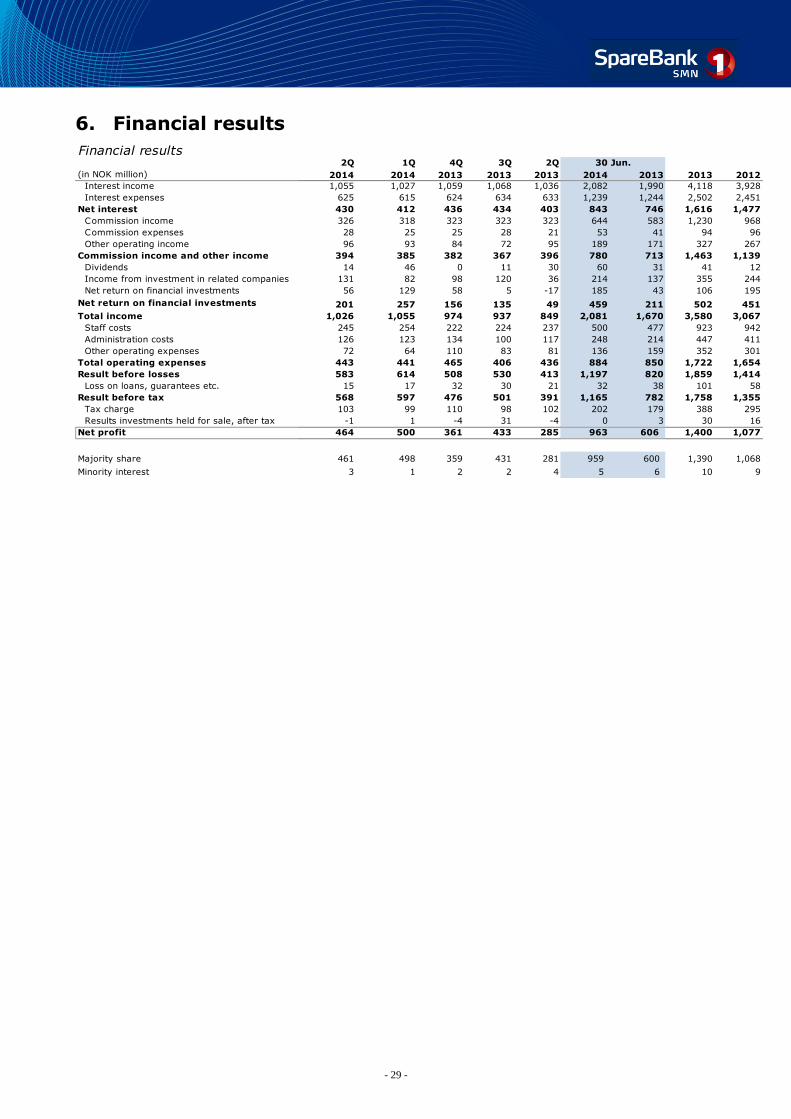
6. Financial results
Financial results2Q 1Q 4Q 3Q 2Q
2014 2014 2013 2013 2013 2014 2013 2013 2012
Interest income 1,055 1,027 1,059 1,068 1,036 2,082 1,990 4,118 3,928
Interest expenses 625 615 624 634 633 1,239 1,244 2,502 2,451
Net interest 430 412 436 434 403 843 746 1,616 1,477
Commission income 326 318 323 323 323 644 583 1,230 968
Commission expenses 28 25 25 28 21 53 41 94 96
Other operating income 96 93 84 72 95 189 171 327 267
Commission income and other income 394 385 382 367 396 780 713 1,463 1,139
Dividends 14 46 0 11 30 60 31 41 12
Income from investment in related companies 131 82 98 120 36 214 137 355 244
Net return on financial investments 56 129 58 5 -17 185 43 106 195
Net return on financial investments 201 257 156 135 49 459 211 502 451
Total income 1,026 1,055 974 937 849 2,081 1,670 3,580 3,067
Staff costs 245 254 222 224 237 500 477 923 942
Administration costs 126 123 134 100 117 248 214 447 411
Other operating expenses 72 64 110 83 81 136 159 352 301
Total operating expenses 443 441 465 406 436 884 850 1,722 1,654
Result before losses 583 614 508 530 413 1,197 820 1,859 1,414
Loss on loans, guarantees etc. 15 17 32 30 21 32 38 101 58
Result before tax 568 597 476 501 391 1,165 782 1,758 1,355
Tax charge 103 99 110 98 102 202 179 388 295
Results investments held for sale, after tax -1 1 -4 31 -4 0 3 30 16
Net profit 464 500 361 433 285 963 606 1,400 1,077
Majority share 461 498 359 431 281 959 600 1,390 1,068
Minority interest 3 1 2 2 4 5 6 10 9
30 Jun.
(in NOK million)
- 30 -
Balance sheet30 Jun. 31 Mar. 31 Dec. 30 Sept. 30 Jun. 31 Dec.
2014 2014 2013 2013 2013 2012
Cash and receivables from central banks 2,940 1,196 4,793 172 1,333 1,079
Deposits with and loans to credit institutions 1,088 1,086 1,189 988 2,140 3,012
Gross loans to customers before write-down 85,206 79,366 80,303 79,842 78,976 74,943
- Specified write-downs -176 -173 -173 -168 -153 -144
- Write-downs by loan category -295 -295 -295 -295 -295 -295
Net loans to and receivables from customers 84,735 78,898 79,836 79,379 78,528 74,504
Fixed-income CDs and bonds at fair value 15,743 17,623 16,887 19,192 19,402 17,164
Derivatives 4,366 3,205 3,050 2,609 2,784 3,100
Shares, units and other equity interests 1,138 1,108 1,030 995 981 777
Investment in related companies 4,783 4,787 4,624 4,440 4,294 4,573
Investments held for sale 62 62 113 118 145 486
Goodwill 522 521 495 491 491 482
Other assets 3,380 3,122 3,344 3,593 3,090 2,798
Assets 118,758 111,609 115,360 111,977 113,190 107,975
Deposits from credit institutions 6,774 6,710 6,379 7,888 8,644 7,410
Deposits from and debt to customers 59,408 54,736 56,074 53,423 55,294 52,252
Debt created by issue of securities 31,667 29,914 33,762 29,592 30,936 30,259
Derivatives 3,569 2,516 2,295 1,975 2,288 2,790
Other liabilities 2,222 3,036 2,303 4,862 2,210 2,070
Investments held for sale 0 0 0 32 31 72
Subordinated loan capital 3,338 3,308 3,304 3,341 3,345 3,040
Total liabilities 106,978 100,220 104,118 101,114 102,750 97,892
Equity capital certificate 2,597 2,597 2,597 2,597 2,597 2,597
Own holding of ECCs 0 0 0 0 0 0
Premium fund 895 895 895 895 895 895
Dividend equalisation fund 2,496 2,496 2,496 1,889 1,889 1,889
Recommended dividends 0 0 227 0 0 195
Provision for gifts 0 0 124 0 0 30
Savings bank’s reserve 3,276 3,276 3,276 2,944 2,944 2,944
Unrealised gains reserve 206 206 206 123 123 123
Other equity capital 1,280 1,357 1,354 1,312 1,323 1,343
Result of the period 963 500 0 1,038 606 0
Minority interests 66 62 67 65 63 67
Total equity capital 11,780 11,389 11,242 10,863 10,439 10,082
Total liabilities and equity 118,758 111,609 115,360 111,977 113,190 107,975
(in NOK million)

- 31 -
Key figures 2Q 1Q 4Q 3Q 2Q
2014 2014 2013 2013 2013 2014 2013 2013 2012
Return on equity 16.0 % 17.7 % 13.1 % 16.3 % 11.1 % 16.8 % 11.9 % 13.3 % 11.7 %
Cost/income ratio group 43 % 42 % 48 % 43 % 51 % 42 % 51 % 48 % 54 %
Cost/income ratio group, ex. financial inv. 54 % 55 % 57 % 51 % 54 % 55 % 58 % 56 % 63 %
12-month cost growth 4.0 % 6.5 % 4.1 % 3.3 % 6.9 % 4.0 % 6.9 % 4.1 % 11.6 %
Gross loans to customers* 114,561 111,560 112,038 110,237 108,968 114,561 108,968 112,038 104,909
Growth in loans last 12 months* 5.1 % 4.4 % 6.8 % 6.7 % 8.4 % 5.1 % 8.4 % 6.8 % 10.2 %
Growth in loans this period* 2.7 % -0.4 % 1.6 % 1.2 % 2.0 % 2.3 % 3.9 % 6.8 % 10.2 %
Deposits from customers 59,408 54,736 56,074 53,423 55,294 59,408 55,294 56,074 52,252
Growth in deposits last 12 months 7.4 % 4.1 % 7.3 % 5.1 % 7.3 % 7.4 % 7.3 % 7.3 % 9.2 %
Growth in deposits this period 8.5 % -2.4 % 5.0 % -3.3 % 5.1 % 5.9 % 5.8 % 7.3 % 9.2 %
Ordinary lending financed by ordinary deposits 70 % 69 % 70 % 67 % 70 % 70 % 70 % 70 % 70 %
Total assets 118,758 111,609 115,360 111,977 113,190 118,758 113,190 115,360 107,919
Average total assets (quarterly) 115,184 113,485 113,668 112,583 111,979 115,243 110,626 111,843 105,372
Employees in employment group 1,167 1,157 1,159 1,165 1,164 1,167 1,164 1,159 1,135
Employees in employment parent bank 761 750 757 772 764 761 764 757 793
Employees in employment subsidiares 405 407 401 393 399 405 400 401 342
Number of branches 49 50 50 48 50 49 50 50 51
Lending margin 2.63 2.77 2.75 2.75 2.65 2.69 2.51 2.64 2.07
Deposit margin (0.55) (0.59) (0.56) (0.53) (0.50) (0.57) (0.46) (0.51) (0.05)
Net other operating income of total income 38 % 37 % 39 % 39 % 47 % 37 % 43 % 41 % 37 %
Common Equity Tier 1 ratio 11.4 % 11.1 % 11.1 % 10.7 % 10.3 % 11.4 % 10.3 % 11.1 % 10.0 %
Capital adequacy ratio 15.0 % 14.8 % 14.7 % 14.2 % 13.8 % 15.0 % 13.8 % 14.7 % 13.3 %
Core capital ratio 13.3 % 12.9 % 13.0 % 12.6 % 12.2 % 13.3 % 12.2 % 13.0 % 11.3 %
Total core capital 11,635 11,303 10,989 10,707 10,508 11,635 10,508 10,989 9,357
Net subordinated capital 13,164 12,893 12,417 12,053 11,894 13,164 11,894 12,417 10,943
Impairment losses ratio 0.05 % 0.06 % 0.12 % 0.11 % 0.08 % 0.06 % 0.07 % 0.09 % 0.06 %
Non-performing commitm. as % of gross loans 0.29 % 0.24 % 0.34 % 0.35 % 0.38 % 0.29 % 0.38 % 0.34 % 0.36 %
Other doubtfull commitm. as % of gross loans 0.18 % 0.21 % 0.14 % 0.19 % 0.13 % 0.18 % 0.13 % 0.14 % 0.14 %
ECC price 54.25 53.75 55.00 45.70 46.50 54.25 46.50 55.00 34.80
Number of certificates issued, millions 129.83 129.83 129.83 129.83 129.83 129.83 129.83 129.83 129.83
Booked equity capital per ECC (incl. dividend) 58.32 56.39 55.69 53.76 51.66 58.32 51.66 55.69 50.09
Adjusted profit per ECC 2.29 2.48 1.79 2.18 1.43 4.77 2.99 6.92 5.21
P/E per ECC 5.91 5.42 7.68 5.23 8.13 5.68 7.79 7.95 6.68
P/B equity capital 0.93 0.95 0.99 0.85 0.90 0.93 0.90 0.99 0.69
* Gross loans to customers includes Sparebank1 Boligkreditt and Sparebank 1 Næringskreditt
30 Jun.
- 32 -
7. Segment information
As of 1 January 2014 the bank's SME portfolio was split up and assigned to Retail Banking and
Corporate Banking respectively. Limited companies are transferred to Corporate Banking. Sole
proprietorships, agricultural customers and associations etc are transferred to Retail Banking.
Historical data have not been reworked owing to the difficulty of reconstructing such data at a
sufficiently precise level. In the segment information, historical data for Retail customers are
exclusive sole proprietorships, agricultural customers and associations. Historical data for Corporate
customers are the former Large Corporates. The SME portfolio is treated as a separate business line
in figures for 2013.
For the subsidiaries, the figures refer to the respective company accounts, while for joint ventures
incorporated by the equity method the Group’s profit share is stated, after tax, as well as book value
of the investment at group level.
7.1. Extract from income statement
Group (in NOK million)
Retail
Market
Corporate
Market
SpareBank
1 SMN
Markets
Eiendoms
Megler 1
Midt-
Norge
SpareBank
1 Finans
Midt-Norge
AS
SpareBank
1
Regnskapsh
uset SMN AS
SpareBank
1 Gruppen BN Bank Uncollated Total
Net interest 404 411 -3 1 62 -0 - - -33 843
Allocated 21 33 0 - - - - - -54 -
Total interest income 425 444 -3 1 62 -0 - - -87 843
Commission income and other income 383 80 12 177 -2 106 - - 25 780
Net profit on financial investments 0 13 20 - - - 150 55 219 459
Total income 809 537 30 178 60 106 150 55 156 2,081
Total operating expenses 380 150 31 152 26 87 57 884
Ordinary operating profit 428 387 -2 26 34 19 150 55 99 1,197
Loss on loans, guarantees etc. 1 28 0 - 3 - - - 0 32
Result before tax incl investments held for
sale 427 359 -2 26 32 19 150 55 99 1,165
Post-tax return on equity 39.3 % 18.0 % 16.8 %
Balance sheet
Loans and advances to customers 75,490 34,656 - - 3,511 - - - 903 114,561
adv. of this to Boligkreditt and Næringskreditt -28,208 -1,146 - - - - - - -1 -29,355
Individual allowance for impairment on loan -28 -134 - - -13 - - - -0 -176
Group allowance for impairment on loan -90 -188 - - -16 - - - - -295
Other assets 239 134 - 256 12 138 1,228 1,164 30,851 34,023
Total assets 47,403 33,322 - 256 3,494 138 1,228 1,164 31,753 118,758
Deposits to customers 32,150 25,872 - - - - 1,386 59,408
Other liabilities and equity 15,253 7,450 - 256 3,494 138 1,228 1,164 30,367 59,351
Total liabilites 47,403 33,322 - 256 3,494 138 1,228 1,164 31,753 118,758
Retail Market
47 %
Corporate Market
31 %
SpareBank 1 SMN Markets
2 %
EiendomsMegler 1 Midt-
Norge10 %
SpareBank 1 Finans Midt-
Norge AS4 %
SpareBank 1
Regnskapshuset SMN AS6 %
Income specified by segment, excluding financial investments
- 33 -
As from 1 January 2014 the bank's SME portfolio is split up and assigned to Retail Banking and
Corporate Banking respectively. Limited companies are transferred to Corporate Banking. Sole
proprietorships, agricultural customers and associations etc are transferred to Retail Banking.
Figures for 2014 are therefore not directly comparable with historical figures.
Interest income, Retail Market, Corporate Market and SME
2Q 1Q 4Q 3Q 2Q
(in NOK million) 2014 2014 2013 2013 2013 2014 2013 2013
Retail 207 197 172 172 151 404 285 630
Corporate 205 206 186 185 177 411 325 695
SME 71 74 70 139 284
Net interest income 412 404 429 430 399 815 749 1,608
Developement in margin, Retail Market and Corporate Market
2Q 1Q 4Q 3Q 2Q
Lending (in percentage) 2014 2014 2013 2013 2013 2014 2013 2013
Retail 2.51 2.65 2.62 2.63 2.49 2.59 2.37 2.50
Corporate 2.93 3.03 3.03 2.93 2.93 2.97 2.72 2.82
Total 2.63 2.77 2.75 2.75 2.65 2.69 2.51 2.64
2Q 1Q 4Q 3Q 2Q
Deposits (in percentage) 2014 2014 2013 2013 2013 2014 2013 2013
Retail -0.46 -0.53 -0.48 -0.39 -0.33 -0.49 -0.31 -0.37
Corporate -0.63 -0.61 -0.61 -0.68 -0.67 -0.64 -0.63 -0.65
Total -0.55 -0.59 -0.56 -0.53 -0.50 0.57- 0.46- -0.51
*Definition margin: Average customer interest minus 3 months average nibor
30 Jun.
30 Jun.
30 Jun.
Development in volume, Retail Market, Corporate Market and SME
2Q 1Q 4Q 3Q 2Q
Lending* (in NOK million) 2014 2014 2013 2013 2013 2014 2013 2013
Retail 75,490 73,735 63,518 62,233 60,832 75,490 60,832 63,518
Corporate 34,656 33,436 31,920 31,775 32,420 34,656 32,420 31,920
SME 9,055 9,124 8,827 8,827 9,055
Total 110,147 107,171 104,492 103,131 102,079 110,147 102,079 104,492
* Gross loans to customers includes SpareBank 1 Boligkreditt and SpareBank 1 Næringskreditt
2Q 1Q 4Q 3Q 2Q
Deposits (in NOK million) 2014 2014 2013 2013 2013 2014 2013 2013
Retail 32,150 29,432 24,185 23,880 24,186 32,150 24,186 24,185
Corporate 25,872 24,740 21,544 19,330 20,601 25,872 20,601 21,544
SME 8,734 8,641 8,640 8,640 8,734
Total 58,022 54,171 54,463 51,852 53,427 58,022 53,427 54,463
Developement in commision income, Retail Market, Corporate Market and SME
2Q 1Q 4Q 3Q 2Q
(in NOK million) 2014 2014 2013 2013 2013 2014 2013 2013
Retail 190 194 200 194 173 384 311 705
Corporate 46 47 35 52 29 93 53 140
SME 21 19 20 39 80
Total 236 240 256 266 222 476 403 925
30 Jun.
30 Jun.
30 Jun.
- 34 -
7.2. Retail Market The Retail Market is responsible for all activity directed at the region’s retail customers. The
Retail Market provides personal financial advice. The Retail Market aims to attract and retain
customers by developing a strong product range, first class advisers, unique accessibility and
excellent customer handling. As from 1 January 2014 sole proprietorships, agricultural
customers and associations are assigned to Retail Banking. Figures for 2014 are therefore not
directly comparable with historical figures.
Business description 30 Jun.
Facts about the business area 2014
Lending volume 75,490
Deposits volume 32,150
No. of active customers 198,106
FTEs 385
Financial performance 2Q 1Q 4Q 3Q 2Q
(in NOK million) 2014 2014 2013 2013 2013 2014 2013 2013
Net interest income lending 154 148 126 121 99 302 184 431
Net interest income deposits 53 50 47 51 53 103 101 199
Net interest income allocated capital 12 9 4 2 2 21 5 11
Total interest income 219 206 177 174 154 425 291 641
Net guarantee commision, incl. Boligkreditt 112 124 128 112 102 237 186 426
Net commision of savings products 10 8 10 12 10 18 17 38
Net commision insurance services 28 25 25 25 33 52 48 99
Net commision payment trans. services 39 37 36 45 28 76 60 141
Other commision income 0 0 0 0 0 0 0 0
Net fee and commission income 190 194 200 194 173 383 310 704
Net profit on financial investments 0 0 0 0 0 0 0 1
Total income 408 400 377 368 327 809 601 1,346
Total operating expences* 176 204 168 149 161 380 325 641
Results 232 196 209 219 166 428 277 705
Loss on loans, guarantees etc. 0 1 1 0 2 1 6 6
Results before tax 232 195 208 220 164 427 270 699
*) Includes both direct and distributed expences
Post-tax return on equity (annualized) 39.3 % 31.9 % 38.7 %
30 Jun.
2.512.652.622.632.49
-0.46-0.53-0.48-0.39-0.33
20142014201320132013
2Q1Q4Q3Q2Q
Development in margin
Lending margin Retail Deposits margin Retail
Definition margin: Average customer interest minus 3 months average nibor
- 35 -
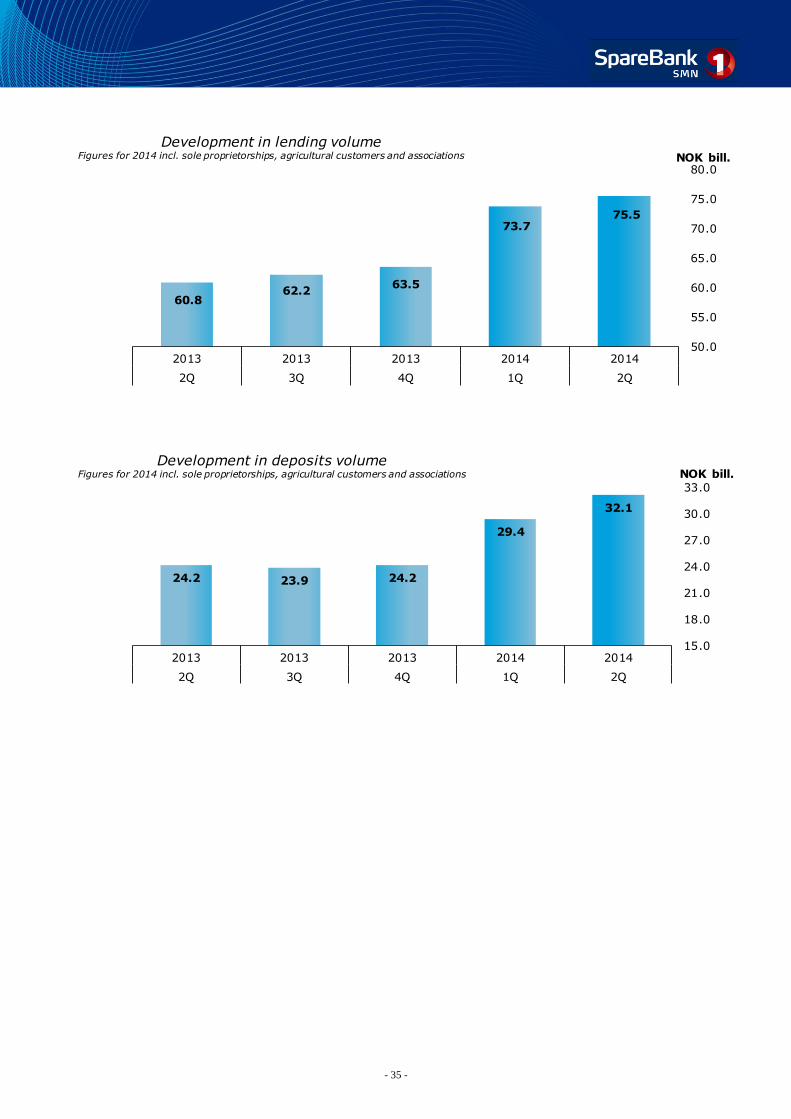
75.573.7
63.562.2
60.8
50.0
55.0
60.0
65.0
70.0
75.0
80.0
20142014201320132013
2Q1Q4Q3Q2Q
NOK bill.
Development in lending volume Figures for 2014 incl. sole proprietorships, agricultural customers and associations
32.1
29.4
24.223.924.2
15.0
18.0
21.0
24.0
27.0
30.0
33.0
20142014201320132013
2Q1Q4Q3Q2Q
NOK bill.Development in deposits volume
Figures for 2014 incl. sole proprietorships, agricultural customers and associations
- 36 -
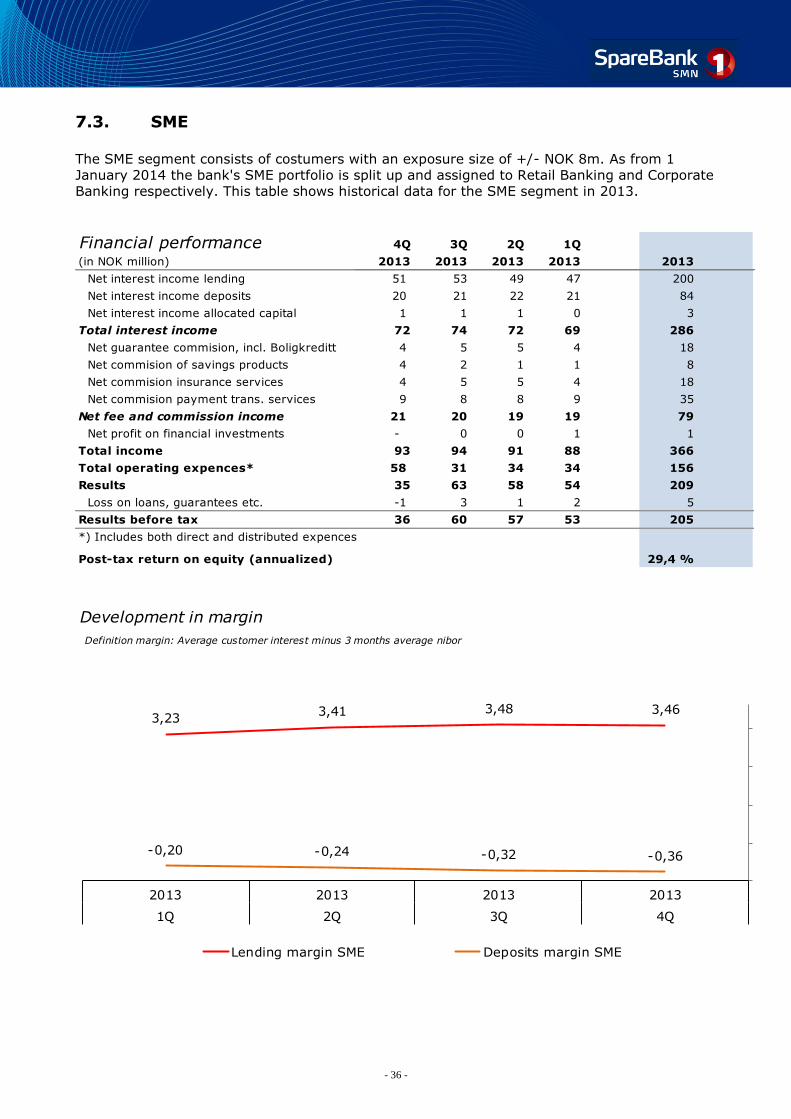
7.3. SME The SME segment consists of costumers with an exposure size of +/- NOK 8m. As from 1
January 2014 the bank's SME portfolio is split up and assigned to Retail Banking and Corporate
Banking respectively. This table shows historical data for the SME segment in 2013.
Financial performance 4Q 3Q 2Q 1Q 1q
(in NOK million) 2013 2013 2013 2013 2013
Net interest income lending 51 53 49 47 200
Net interest income deposits 20 21 22 21 84
Net interest income allocated capital 1 1 1 0 3
Total interest income 72 74 72 69 286
Net guarantee commision, incl. Boligkreditt 4 5 5 4 18
Net commision of savings products 4 2 1 1 8
Net commision insurance services 4 5 5 4 18
Net commision payment trans. services 9 8 8 9 35
Net fee and commission income 21 20 19 19 79
Net profit on financial investments - 0 0 1 1
Total income 93 94 91 88 366
Total operating expences* 58 31 34 34 156
Results 35 63 58 54 209
Loss on loans, guarantees etc. -1 3 1 2 5
Results before tax 36 60 57 53 205
*) Includes both direct and distributed expences
Post-tax return on equity (annualized) 29,4 %
3,463,483,413,23
-0,36-0,32-0,24-0,20
2013201320132013
4Q3Q2Q1Q
Development in margin
Lending margin SME Deposits margin SME
Definition margin: Average customer interest minus 3 months average nibor
- 37 -
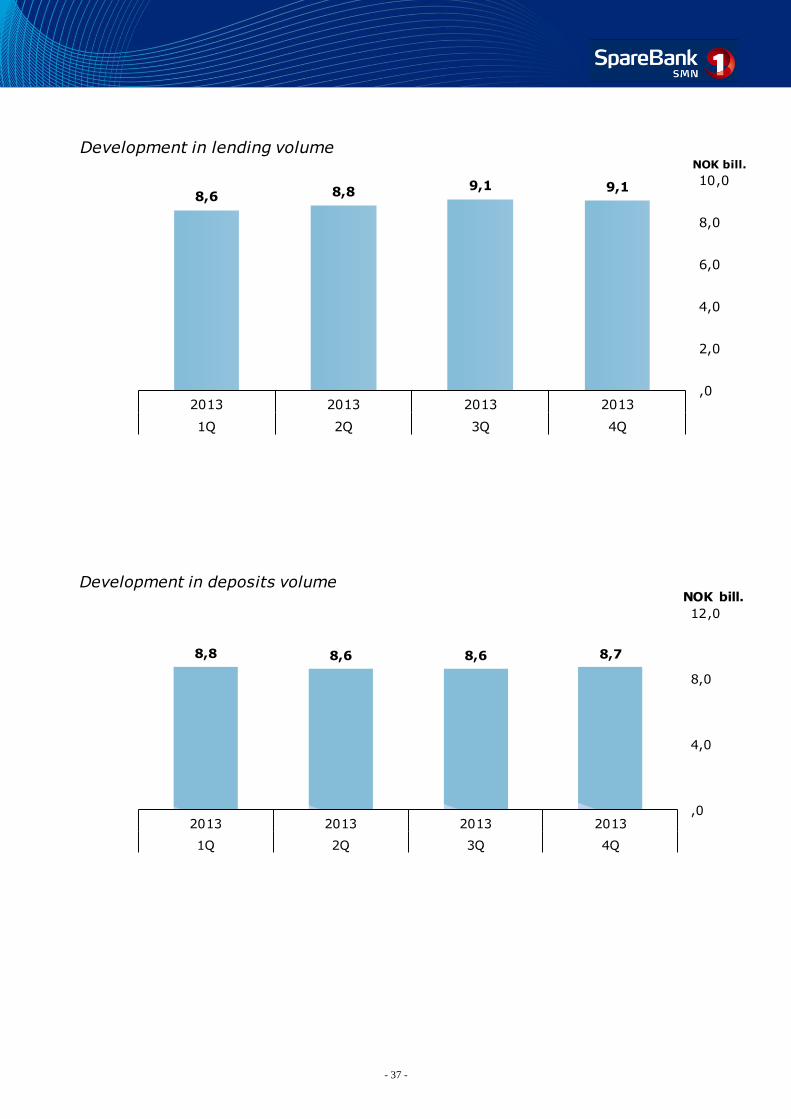
9,19,18,88,6
,0
2,0
4,0
6,0
8,0
10,0
2013201320132013
4Q3Q2Q1Q
NOK bill.
Development in lending volume
8,78,68,68,8
,0
4,0
8,0
12,0
2013201320132013
4Q3Q2Q1Q
NOK bill.Development in deposits volume
- 38 -
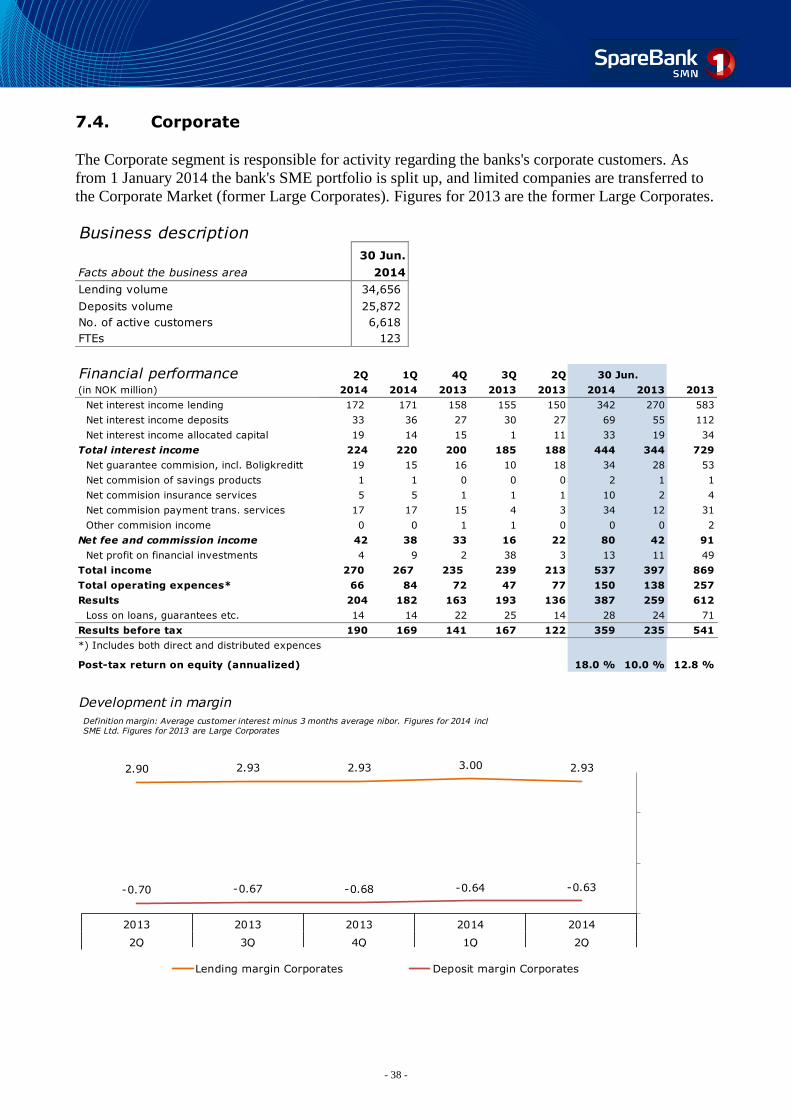
7.4. Corporate The Corporate segment is responsible for activity regarding the banks's corporate customers. As
from 1 January 2014 the bank's SME portfolio is split up, and limited companies are transferred to
the Corporate Market (former Large Corporates). Figures for 2013 are the former Large Corporates.
Business description
30 Jun.
Facts about the business area 2014
Lending volume 34,656
Deposits volume 25,872
No. of active customers 6,618
FTEs 123
Financial performance 2Q 1Q 4Q 3Q 2Q
(in NOK million) 2014 2014 2013 2013 2013 2014 2013 2013
Net interest income lending 172 171 158 155 150 342 270 583
Net interest income deposits 33 36 27 30 27 69 55 112
Net interest income allocated capital 19 14 15 1 11 33 19 34
Total interest income 224 220 200 185 188 444 344 729
Net guarantee commision, incl. Boligkreditt 19 15 16 10 18 34 28 53
Net commision of savings products 1 1 0 0 0 2 1 1
Net commision insurance services 5 5 1 1 1 10 2 4
Net commision payment trans. services 17 17 15 4 3 34 12 31
Other commision income 0 0 1 1 0 0 0 2
Net fee and commission income 42 38 33 16 22 80 42 91
Net profit on financial investments 4 9 2 38 3 13 11 49
Total income 270 267 235 239 213 537 397 869
Total operating expences* 66 84 72 47 77 150 138 257
Results 204 182 163 193 136 387 259 612
Loss on loans, guarantees etc. 14 14 22 25 14 28 24 71
Results before tax 190 169 141 167 122 359 235 541
*) Includes both direct and distributed expences
Post-tax return on equity (annualized) 18.0 % 10.0 % 12.8 %
30 Jun.
2.933.002.932.932.90
-0.63-0.64-0.68-0.67-0.70
20142014201320132013
2Q1Q4Q3Q2Q
Development in margin
Lending margin Corporates Deposit margin Corporates
Definition margin: Average customer interest minus 3 months average nibor. Figures for 2014 incl SME Ltd. Figures for 2013 are Large Corporates
- 39 -
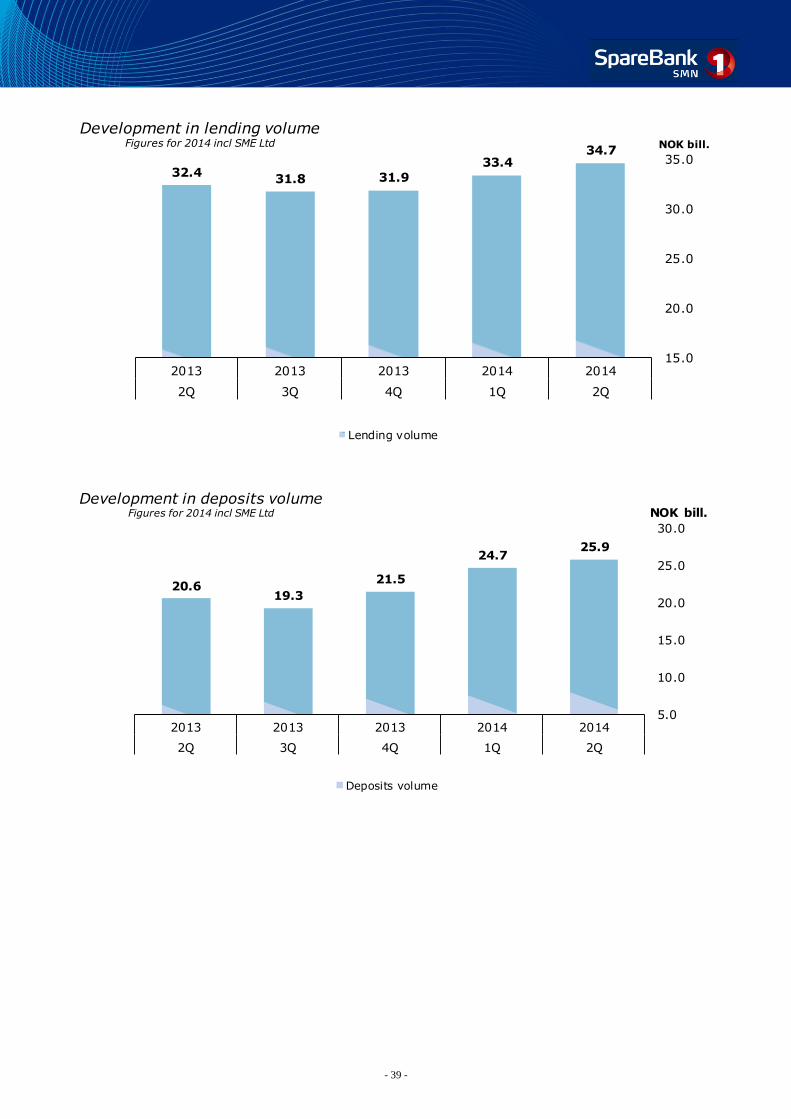
34.733.4
31.931.832.4
15.0
20.0
25.0
30.0
35.0
20142014201320132013
2Q1Q4Q3Q2Q
NOK bill.
Development in lending volumeFigures for 2014 incl SME Ltd
Lending volume
25.924.7
21.5
19.320.6
5.0
10.0
15.0
20.0
25.0
30.0
20142014201320132013
2Q1Q4Q3Q2Q
NOK bill.Development in deposits volume
Figures for 2014 incl SME Ltd
Deposits volume
- 40 -
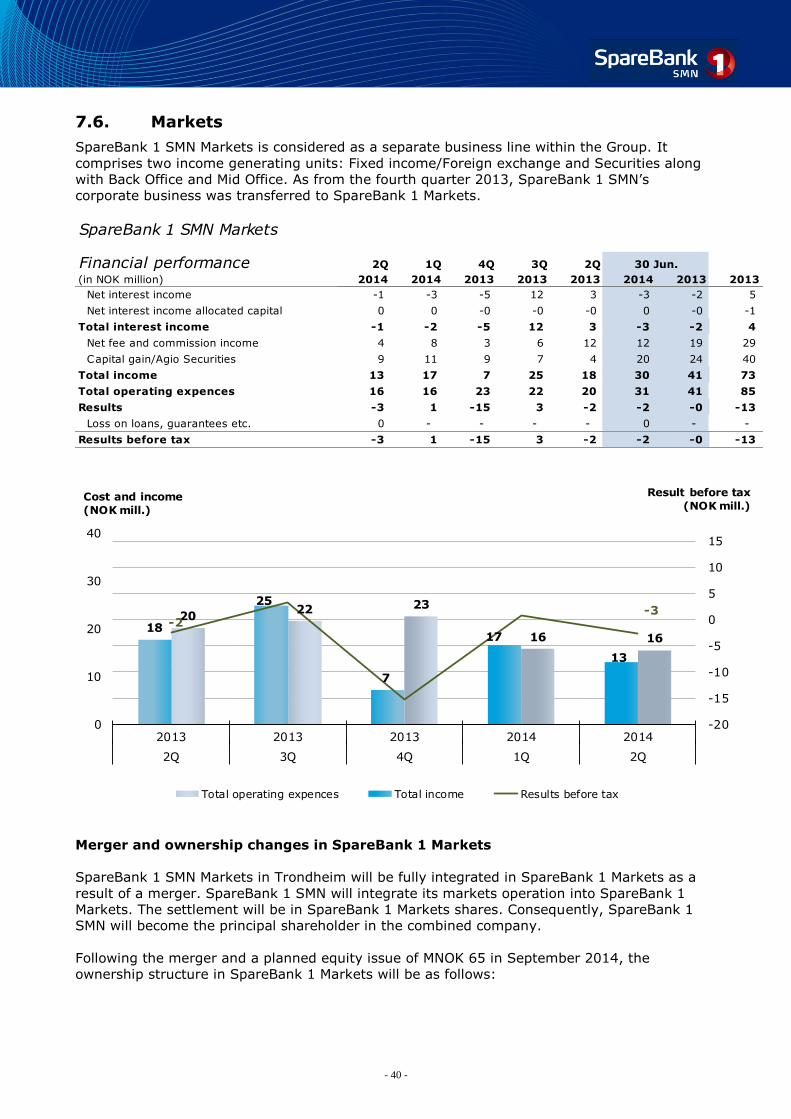
7.6. Markets
SpareBank 1 SMN Markets is considered as a separate business line within the Group. It
comprises two income generating units: Fixed income/Foreign exchange and Securities along
with Back Office and Mid Office. As from the fourth quarter 2013, SpareBank 1 SMN’s
corporate business was transferred to SpareBank 1 Markets.
SpareBank 1 SMN Markets
Financial performance 2Q 1Q 4Q 3Q 2Q
(in NOK million) 2014 2014 2013 2013 2013 2014 2013 2013
Net interest income -1 -3 -5 12 3 -3 -2 5
Net interest income allocated capital 0 0 -0 -0 -0 0 -0 -1
Total interest income -1 -2 -5 12 3 -3 -2 4
Net fee and commission income 4 8 3 6 12 12 19 29
Capital gain/Agio Securities 9 11 9 7 4 20 24 40
Total income 13 17 7 25 18 30 41 73
Total operating expences 16 16 23 22 20 31 41 85
Results -3 1 -15 3 -2 -2 -0 -13
Loss on loans, guarantees etc. 0 - - - - 0 - -
Results before tax -3 1 -15 3 -2 -2 -0 -13
30 Jun.
1616
232220
13
17
7
25
18
-3-2
-20
-15
-10
-5
0
5
10
15
0
10
20
30
40
20142014201320132013
2Q1Q4Q3Q2Q
Result before tax
(NOK mill.)Cost and income
(NOK mill.)
Total operating expences Total income Results before tax
Merger and ownership changes in SpareBank 1 Markets
SpareBank 1 SMN Markets in Trondheim will be fully integrated in SpareBank 1 Markets as a
result of a merger. SpareBank 1 SMN will integrate its markets operation into SpareBank 1
Markets. The settlement will be in SpareBank 1 Markets shares. Consequently, SpareBank 1
SMN will become the principal shareholder in the combined company.
Following the merger and a planned equity issue of MNOK 65 in September 2014, the
ownership structure in SpareBank 1 Markets will be as follows:
- 41 -
SpareBank 1 SMN: 73.3 % (previously 27.0 %)
SpareBank 1 Nord-Norge: 10.0 % (27.0 %)
SamSpar: 10.0 % (27.0 %)
Sparebanken Hedmark: 6.1 % (16.6 %)
Other shareholders: 0.6 % (2.2%)
The operations of the two companies will primarily continue as-is, with 70 employees in Oslo
and 40 employees in Trondheim. The merged company will be led by Stein Husby. The
business area 'Foreign Exchange and Derivatives', as well as certain supporting functions, will
be located in Trondheim. Finn Haugan, CEO of SpareBank 1 SMN, will be appointed Chairman
of the Board in SpareBank 1 Markets.
In September 2014, an equity issue of MNOK 65 in SpareBank 1 Markets will be completed.
The issue is a part of an already planned recapitalisation of the company, independent of the
merger.
SpareBank 1 Markets recorded a loss of MNOK 69 as of 2Q14. Restructuring costs constitute
MNOK 40 of the loss, whilst trading losses constitute MNOK 17.
The transaction is expected to be completed within 4(th) quarter of 2014, subject to regulatory
approval and final Board approvals.
- 42 -
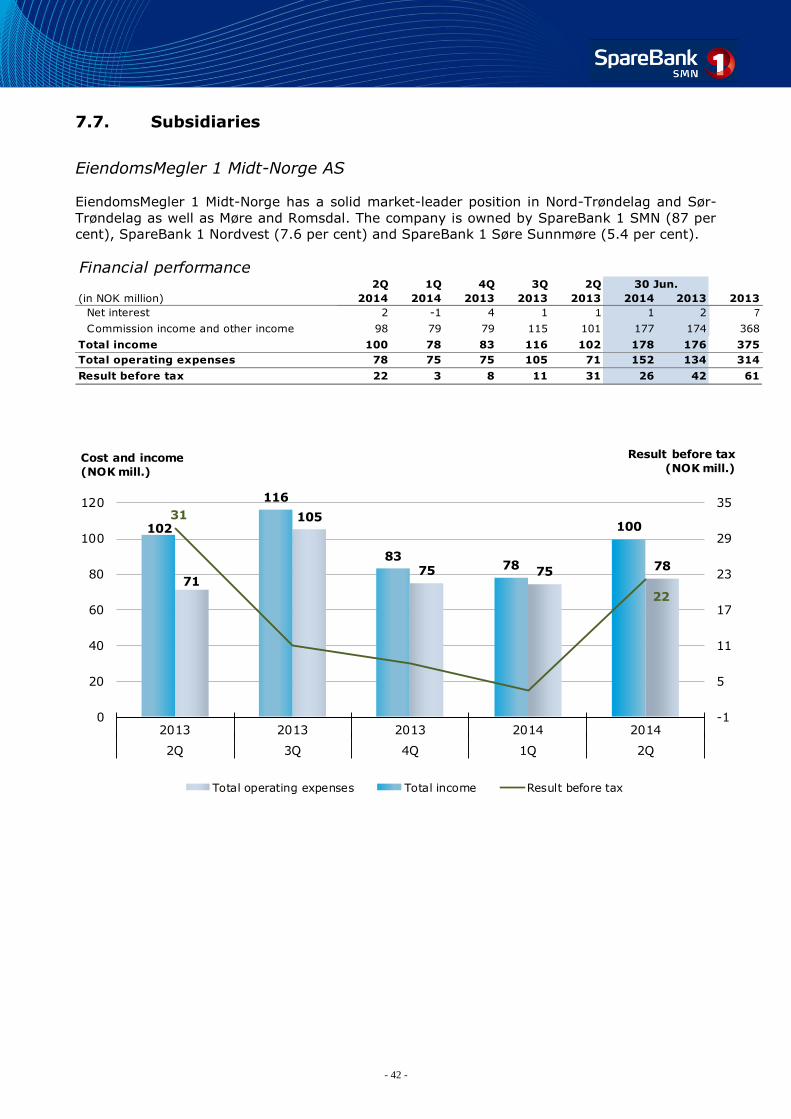
7.7. Subsidiaries
EiendomsMegler 1 Midt-Norge AS
EiendomsMegler 1 Midt-Norge has a solid market-leader position in Nord-Trøndelag and Sør-
Trøndelag as well as Møre and Romsdal. The company is owned by SpareBank 1 SMN (87 per
cent), SpareBank 1 Nordvest (7.6 per cent) and SpareBank 1 Søre Sunnmøre (5.4 per cent).
Financial performance2Q 1Q 4Q 3Q 2Q
(in NOK million) 2014 2014 2013 2013 2013 2014 2013 2013
Net interest 2 -1 4 1 1 1 2 7
Commission income and other income 98 79 79 115 101 177 174 368
Total income 100 78 83 116 102 178 176 375
Total operating expenses 78 75 75 105 71 152 134 314
Result before tax 22 3 8 11 31 26 42 61
30 Jun.
787575
105
71
100
7883
116
102
22
31
-1
5
11
17
23
29
35
0
20
40
60
80
100
120
20142014201320132013
2Q1Q4Q3Q2Q
Result before tax
(NOK mill.)Cost and income
(NOK mill.)
Total operating expenses Total income Result before tax
- 43 -
SpareBank 1 Finans Midt-Norge AS SpareBank 1 Finans Midt-Norge is the region’s leading finance company and an active partner
for businesses. SpareBank 1 Finans Midt-Norge emphasises local competence, and works for
greater value creation in Trøndelag and Nordvestlandet. The company services the market
through its own sales operation and through the Bank’s offices and suppliers.
The company is owned by SpareBank 1 SMN (90.9 per cent), SpareBank 1 Nordvest and
SpareBank 1 Søre Sunnmøre (9.9 per cent).
Financial performance2Q 1Q 4Q 3Q 2Q
(in NOK million) 2014 2014 2013 2013 2013 2014 2013 2013
Total interest income 31 32 29 26 33 62 58 118
Commission income and other income -2 -0 -1 5 -4 -2 -1 -3
Total income 29 31 29 31 30 60 57 116
Total operating expenses 13 13 12 12 11 26 21 45
Ordinary operating profit 16 19 16 19 19 34 35 70
Loss on loans, guarantees etc. 1 2 9 5 4 3 6 20
Total costs incl. loss on loans 14 15 21 17 15 28 28 65
Result before tax 15 17 8 14 15 32 29 51
30 Jun.
1415
2117
15
2931
293130
1515
0
5
10
15
20
25
30
35
0
5
10
15
20
25
30
35
20142014201320132013
2Q1Q4Q3Q2Q
Result before tax
(NOK mill.)
Cost and income
(NOK mill.)
Total costs incl. loss on loans Total income Result before tax
- 44 -
SpareBank 1 Regnskapshuset SMN AS SpareBank 1 Regnskapshuset SMN is a wholly-owned subsidiary of SpareBank 1 SMN. In
collaboration with other SpareBank 1 banks, SpareBank 1 Regnskapshuset SMN has launched
a nationwide drive in the accounting business through SpareBank 1 Regnskapshuset.
SpareBank 1 Regnskapshuset intends to be one of Norway’s leading actors in the accounting
industry by building up a national accounting enterprise based on regional ownership, strong
links to the owner banks and closeness to the market.
SpareBank 1 Regnskapshuset SMN took over six accounting firms in 2013. Four further
accounting firms were acquired in the first half of 2014. The strategy of growth through
acquisitions represents a consolidation of a fragmented accounting industry.
Financial performance2Q 1Q 4Q 3Q 2Q
(in NOK million) 2014 2014 2013 2013 2013 2014 2013 2013
Total interest income -0 0 -0 -0 -0 -0 -0 -0
Commission income and other income 57 50 31 29 40 106 73 133
Total income 56 50 30 29 40 106 73 132
Total operating expenses 44 43 28 29 32 87 61 118
Result before tax 12 7 2 0 9 19 12 14
30 Jun.
4443
282932
56
50
3029
40
12
9
0
2
4
6
8
10
12
14
0
10
20
30
40
50
60
70
20142014201320132013
2Q1Q4Q3Q2Q
Result before tax
(NOK mill.)
Cost and income
(NOK mill.)
Total operating expenses Total income Result before tax
- 45 -
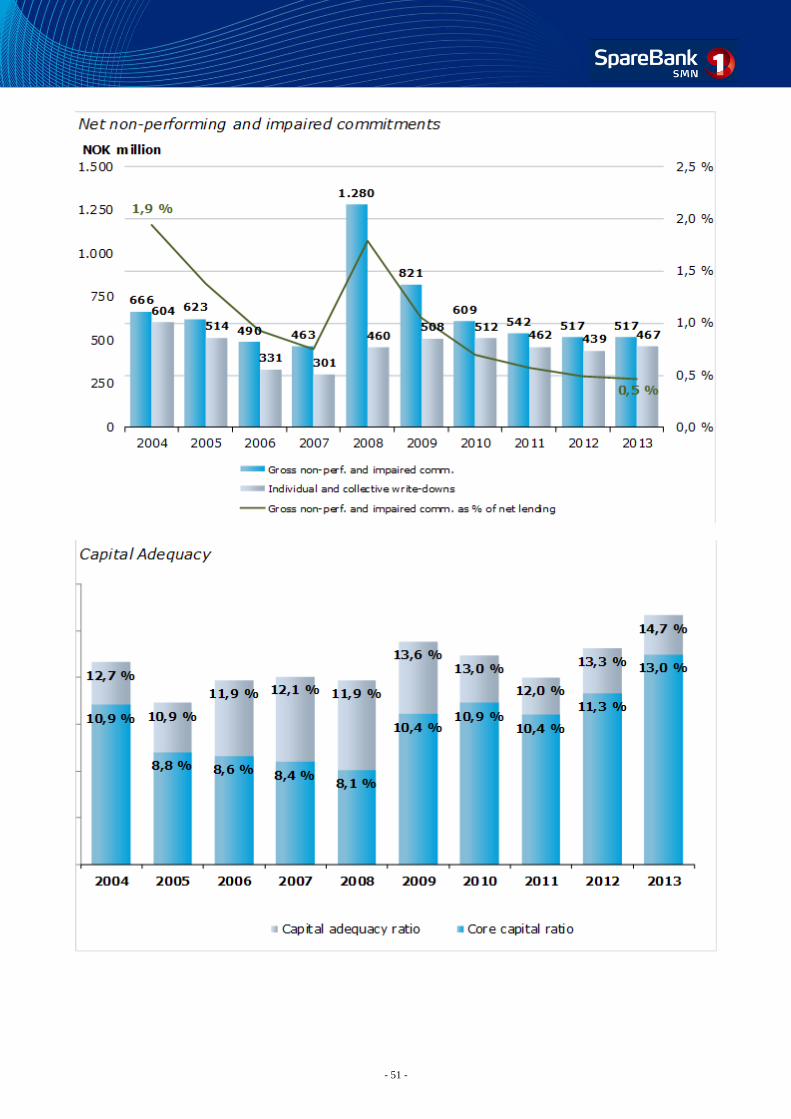
8. Development last ten years
- 46 -
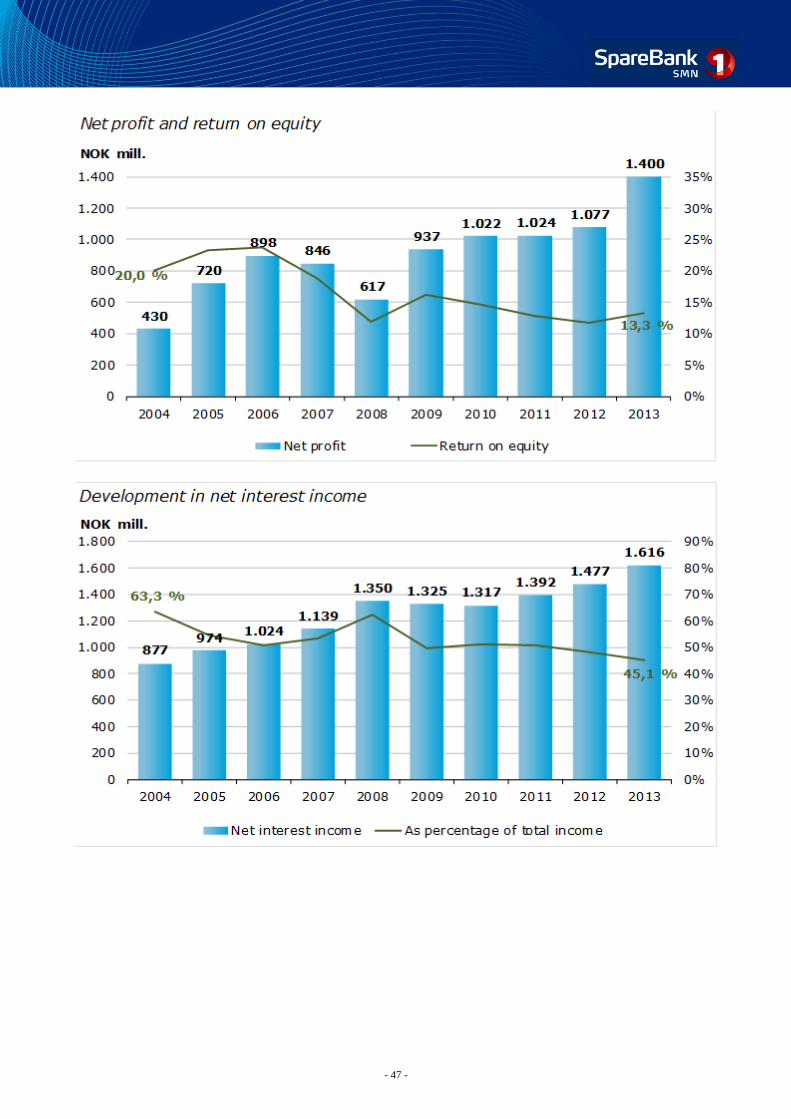
- 47 -
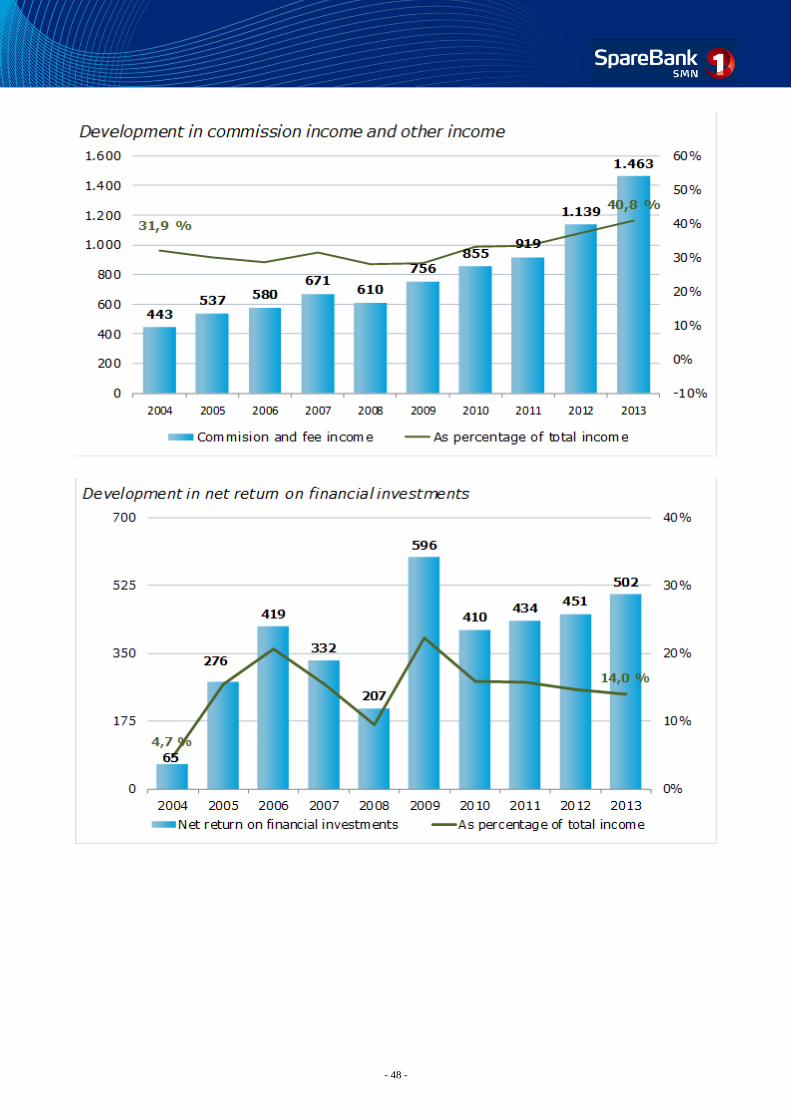
- 48 -
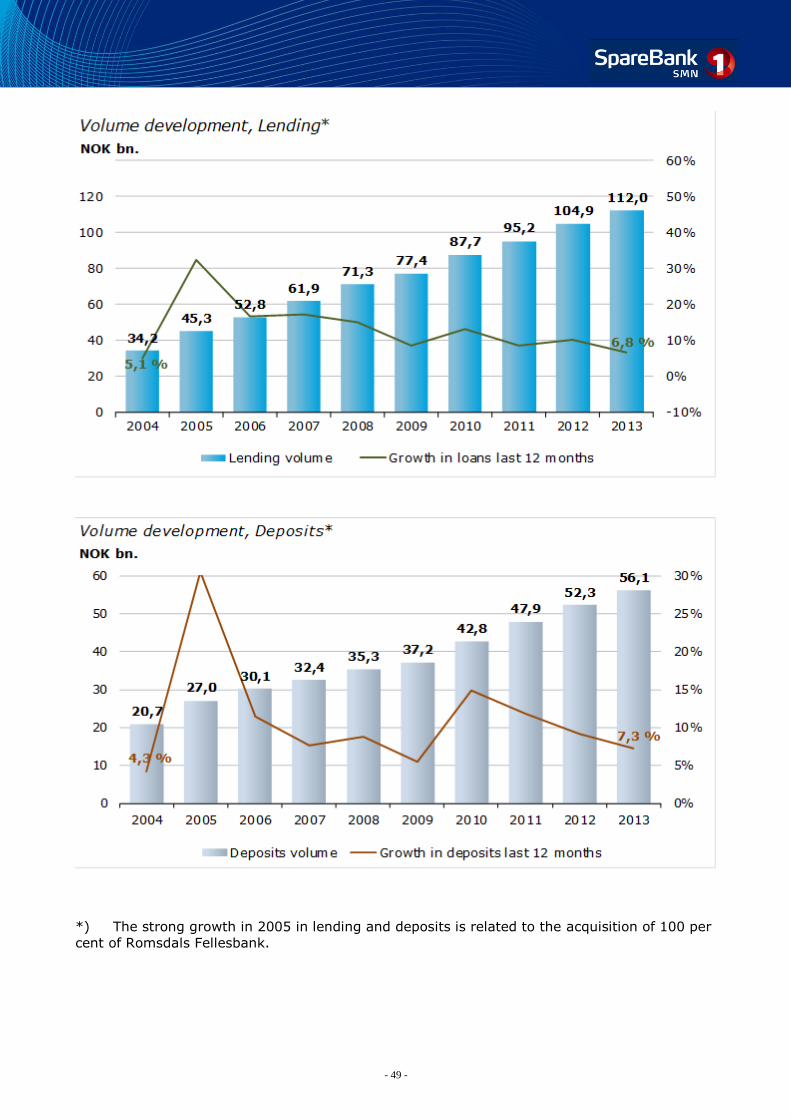
- 49 -
*) The strong growth in 2005 in lending and deposits is related to the acquisition of 100 per
cent of Romsdals Fellesbank.

- 50 -
- 51 -