Embed Size (px)
Citation preview
Interim Results 2014Briefing to Analysts
______________________________________
Television Broadcasts Limited
20 August 2014

Financial HighlightsAs at 30 June 2014
HK$mil 1H14 1H13 % change
Turnover $2,700 $2,592 +4%
Total costs * $1,839 $1,663 +11%
Profit attributable to equity holders $700 $770 -9%
Net profit % 26% 30% -13%
EPS (HK$/sh) $1.60 $1.76 -9%
Interim dividend (HK$/sh) $0.60 $0.60 -
2
1H14: 6 months ended 30 June 2014* Total costs include cost of sales, selling distribution and transmission costs, and general and
administrative expenses.

Major business development during the Period
• Hong Kong TV broadcasting– Advertising revenue increased 5% as a result of the World Cup
– Segment profit lowered due to high programme costs
• Digital New Media Business– Improving monetization through mobile platforms
– GOTV launched in January 2014
• Hong Kong pay TV business– Online piracy using internet protocol-based devices adversely affected this
business
– Higher programme costs due to the World Cup
• Overseas Pay TV– Adversely affected by OTT set-top-boxes
3

HK$mil 1H14 1H13 % change
Turnover $2,700 $2,592 +4%
Cost of sales ($1,150) ($1,030) +12%
Gross profit $1,550 $1,562 -1%
Other revenues $40 $29 +42%
Selling, distribution and transmission costs ($316) ($298) +6%
General and administrative expenses ($373) ($335) +11%
Other (losses)/gains, net ($8) - N/A
Finance costs ($2) ($1) +68%
Share of losses of joint ventures ($5) ($2) +147%
Share of losses of associates (note 1) ($42) ($25) +71%
Profit before income tax $844 $930 -9%
Income taxation expenses ($143) ($151) -5%
Profit for the period $701 $779 -10%
Profit attributable to equity holders $700 $770 -9%
Consolidated Income StatementFor Period Ended 30 June 2014
4
Note1. TVB Pay Vision Holdings Limited was accounted for as an associate.

Total CostsFor Period Ended 30 June 2014
(Cost of Sales, Selling Distribution and Transmission Costs, General and Administrative Expenses)
5
1,663
1,920 1,839
+ HK$176mor + 11%

Cost of Programmes, Film Rights and StocksFor Period Ended 30 June 2014
6
+ HK$120mor + 12%
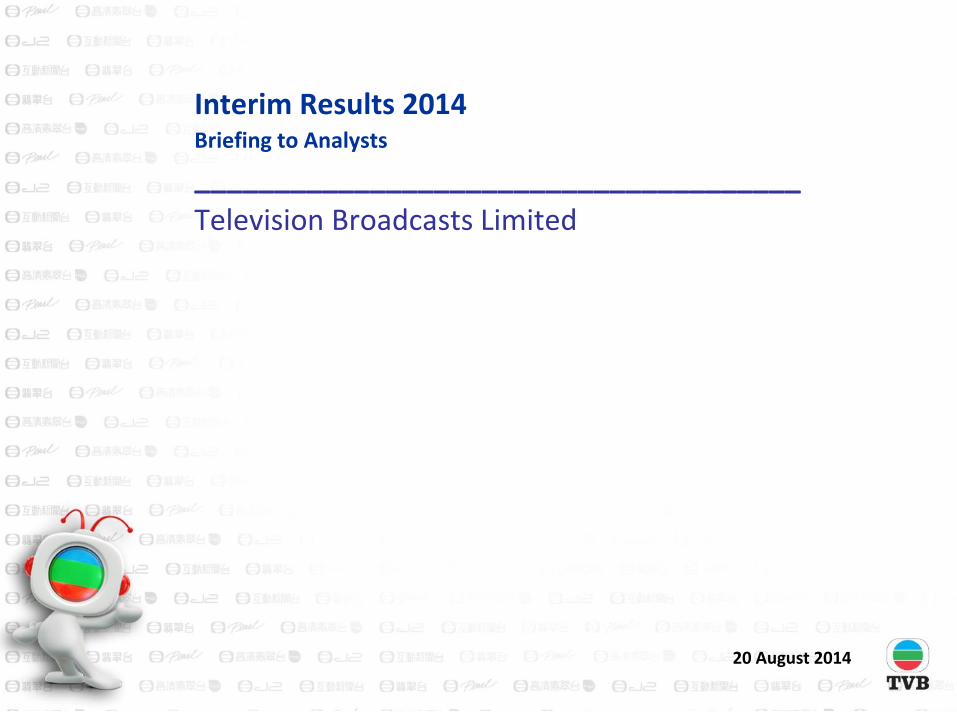
Capex and DepreciationFor Period Ended 30 June 2014
7
• Capex HK$190m (1H13: HK$341m)• Capital commitments HK$1,060m (30 June 2013: HK$1,371m)
- HK$151mor - 44%

Consolidated Statement of Financial PositionAs at 30 June 2014
HK$mil 30.06.14 31.12.13 % change
Non-current assets $4,020 $4,002 +1%
Current assets (other than cash and cash equivalents) $3,523 $3,399 +4%
Bank deposits, cash and cash equivalents $2,484 $2,900 -14%
Total assets $10,027 $10,301 -3%
Total equity $8,257 $8,427 -2%
Total liabilities $1,770 $1,874 -6%
Equity and Liabilities $10,027 $10,301 -3%
Current ratio 3.9 3.8
Gearing ratio 2.8% 3.0%
8

Turnover by Operating Segment
HK$mil 1H14 1H13 % change
Hong Kong TV broadcasting (note 1) $1,581 $1,459 +8%
Programme licensing and distribution (note 2) $516 $517 -0%
Overseas pay TV (note 3) $122 $168 -27%
Taiwan operations $414 $398 +4%
Channel operations (note 4) $63 $63 -0%
Hong Kong digital business and other activities $116 $83 +39%
Inter-segment sales ($112) ($96) +17%
Total $2,700 $2,592 +4%
Note:1. Includes terrestrial TV broadcasting and supply of channels to Hong Kong pay TV platform2. Includes businesses in Malaysia, Singapore and Mainland China (TVBC)3. Includes platforms in North America (USA), Australia, and Europe.4. Includes satellite channel operations under TVB8 and Xing He channels.
9

Turnover by Operating Segment
% relating to 1H of 2013 are shown in brackets
10
(3%)
(54%)
(19%)
(6%)
(15%)
(3%)

Reportable Segment Profit by Operating Segment
HK$mil 1H14 1H13 % change
Hong Kong TV broadcasting (note 1) $444 $473 -6%
Programme licensing and distribution (note 2) $311 $317 -2%
Overseas pay TV (note 3) $(24) $19 N/A
Taiwan operations $123 $119 +3%
Channel operations (note 4) $18 $23 -19%
Hong Kong digital business and other activities $20 $6 +288%
Total $892 $957 -7%
Note:1. Includes terrestrial TV broadcasting and supply of channels to Hong Kong pay TV platform2. Includes businesses in Malaysia, Singapore and Mainland China (TVBC)3. Includes platforms in North America (USA), Australia, and Europe.4. Includes satellite channel operations under TVB8 and Xing He channels.
11

Reportable Segment Profit by Operating Segment
% relating to 1H of 2013 are shown in brackets
12
(33%)
(49%)
(2%)
(13%)
(2%)
(1%)

Turnover (Geographical Analysis)
13
+ 55%
- 40%
- 2%
- 22%
- 2%
+ 4%
+ 9%
- 24%

Hong Kong TV BroadcastingTurnover, Operating Costs and Reportable Segment Profit
• Turnover increased by 8% and reportable segment profit decreased by 6%.• Operating margin changed from 32% → 38% → 28%
14

Programme Licensing and DistributionTurnover, Operating Costs and Reportable Segment Profit
• Turnover decreased by 0.2%, operating profit decreased by 2%.• Operating margin changed from 61% → 58% → 60%
15

Overseas Pay TVTurnover, Operating Costs and Reportable Segment Profit
• Turnover decreased by 27%, reportable segment recorded a loss for the period (a profit in 1H13).• Operating margin changed from 11% → -4 % → -19% 16

Taiwan OperationsTurnover, Operating Costs and Reportable Segment Profit
• Turnover increased by 4%, operating profit increased by 3%.• Operating margin changed from 30% → 29% → 30%
17

Channel OperationsTurnover, Operating Costs and Reportable Segment Profit
• Turnover remained stable, operating profit decreased by 19%.• Operating margin changed from 37% → 29% → 29%
18

Hong Kong Digital Media Business and Other ActivitiesTurnover, Operating Costs and Reportable Segment Profit
• Turnover increased by 39%, operating profit increased by 288%.• Operating margin changed from 7% → 33% → 17%
19

SummaryResults for the period ended 30 June 2014
Overall
• Turnover increased from $2,592m to $2,700m (up 4%).
• Total costs increased from $1,663m to $1,839m (up 11%), driven by increase in programmes costs and staff costs (new headcount).
• Overall, profit attributable to equity holders was $700m (down 9%).
• Interim dividend declared at $0.60 per share (2013: $0.60 per share).
Segments
• Overseas pay TV business reported a segment loss of $24m (2013:$19m profit) due to the adverse impact of pirated contents being delivered through OTT set-top boxes.
• Share of losses of TVB Network Vision widened to $42m (2013: $25m loss) due to increase in programme costs.
• TVBC experienced a slower telecast licensing business while digital new media licensing business reported an upward trend.
20

Television Broadcasts LimitedHKSE stock code: 00511
DisclaimerAll information and data are provided for information purpose only. All opinion included herein constitute TVB’s judgment as of the date hereof and are subject to change without notice. TVB and its subsidiaries and affiliates hereby disclaim (i) all express, implied and statutory warranties of any kind to user and/or any third party including warranties as to accuracy, timeliness, completeness, or fitness for any particular purpose; and (ii) any liability whatsoever for any loss howsoever arising from or in reliance upon the whole or any part of the information and data contained herein.
21