Embed Size (px)
Citation preview
Building Detection in SAR Imagery
Ryan M. Steinbach, Mark W. Koch, Mary M. Moya, and Jeremy Goold
Sandia National Laboratories, PO Box 5800, Albuquerque NM, USA 87158
For question please email [email protected]
This work was supported by PANTHER, a Laboratory Directed Research and Development (LDRD) Project at Sandia
National Laboratories. For additional information about PANTHER, please contact Kristina Czuchlewski, Ph.D.,
[email protected]. Sandia National Laboratories is a multiprogram laboratory operated by Sandia Corporation, a
Lockheed Martin Company, for the United States Department of Energy’s National Nuclear Security Administration
under Contract DE-AC04-94AL85000.
SAND2014-16584R

Building Detection in SAR Imagery
Ryan M. Steinbach*a, Mark W. Koch
a, Mary M. Moya
a, and Jeremy Goold
a
a Sandia National Laboratories, PO Box 5800, Albuquerque NM, USA 87158
* For question please email [email protected]
ABSTRACT
Current techniques for building detection in Synthetic Aperture Radar (SAR) imagery can be computationally expensive
and/or enforce stringent requirements for data acquisition. The desire is to present a technique that is effective and
efficient at determining an approximate building location. This approximate location can be used to extract a portion of
the SAR image to then perform a more robust detection. The proposed technique assumes that for the desired image,
bright lines and shadows, SAR artifact effects, are approximately labeled. These labels are enhanced and utilized to
locate buildings, only if the related bright lines and shadows can be grouped. In order to find which of the bright lines
and shadows are related, all of the bright lines are connected to all of the shadows. This allows the problem to be solved
from a connected graph viewpoint. Where the nodes are the bright lines and shadows and the arcs are the connections
between bright lines and shadows. Constraints based on angle of depression and the relationship between connected
bright lines and shadows are applied to remove unrelated arcs. Once the related bright lines and shadows are grouped,
their locations are combined to provide an approximate building location. Experimental results are provided showing
the outcome of the technique.
Keywords: SAR, Building Detection, SAR artifact effects, shadows, bright lines
1. INTRODUCTION
With the vast amount of Synthetic Aperture Radar (SAR) data available, processing all the data manually is difficult.
Algorithms from the areas of image processing and computer vision can help process the large amount of data collected
using air-borne systems. Approaches in the areas of terrain classification, SAR artifact effects classification, and
automatic target recognition allow an analyst to concentrate on high level tasks. (SAR artifact effects refer to man-made
objects that produce certain effects when interacting with the radar. Examples include bright lines and shadows. Bright
lines are the result of the corner reflector created when the wall and ground meet. The shadow is the result of the scene
behind the building being blocked by the building.) This paper proposes a technique for building detection in SAR that
is efficient and effective in comparison to other proposed techniques. The technique makes a few assumptions. First, an
automated algorithm has already labeled the bright and shadow regions of a SAR image. Second, daily SAR images are
gathered which have the same frequency, flight path, polarization, and depression angle. This paper will provide a
motivation for such a technique and discuss related work. Then an overview will be presented, followed by a more in
depth discussion on the technique. Finally, some of the results will be presented to show the effectiveness of the
technique.
1.1 Motivation and Overall Approach
There is a need to classify, characterize, and detect the different regions of SAR images. Detecting objects such as
buildings is very useful but poses several problems. Buildings have many unique shapes, sizes, and heights. This
creates a complication because there are no fix quantitative attributes that one can utilize to recognize a building.
However, shadows and bright lines can be exploited to locate a building if they can be properly grouped. There are
several techniques proposed by others which require multiple aspect images or a good interferometric SAR (InSAR)
product. These techniques, however, can put demanding, stringent requirements on SAR data collection or are
computationally expensive. A technique is required to locate a building that is efficient and not demanding on the
gathering of SAR data and can handle images covering large areas (hundreds to thousands of square kilometers).
Determining which bright lines and shadows are related without a priori information is a difficult task. Figure 1 is a
block diagram of the proposed technique. The first block represents the required input data. Here, we use assume access
to a SAR image product with the shadow and bright lines classified. Currently we use a technique based on superpixel
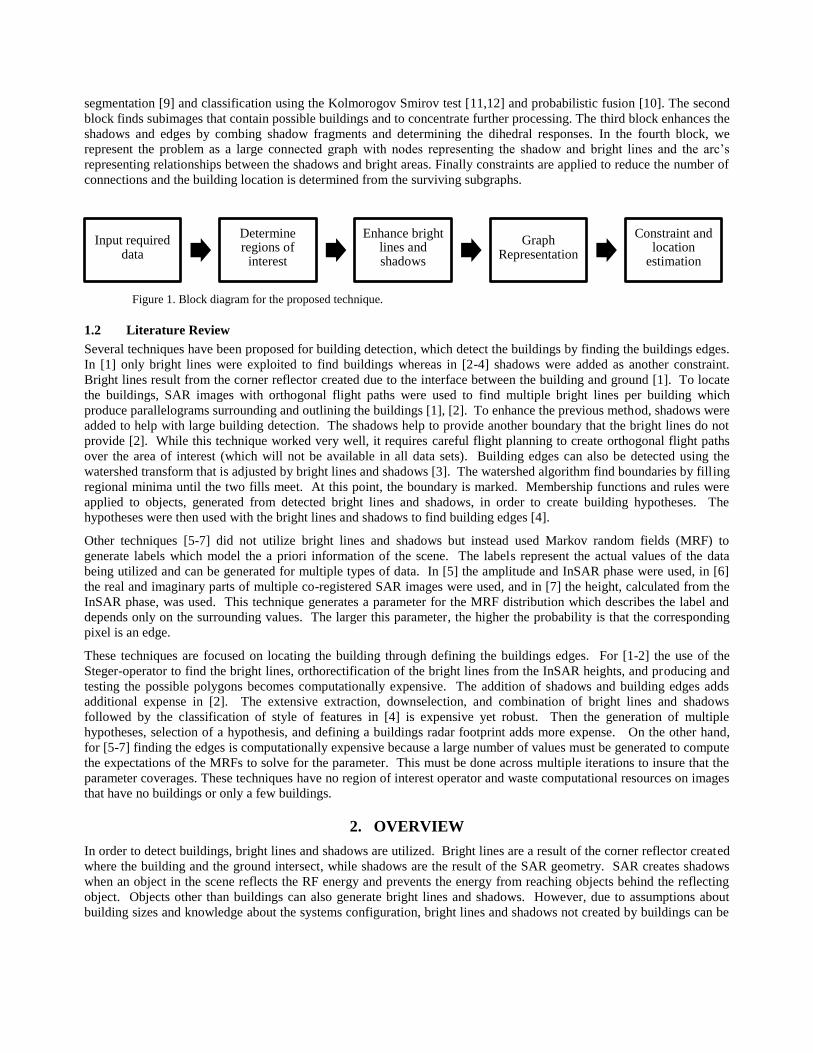
segmentation [9] and classification using the Kolmorogov Smirov test [11,12] and probabilistic fusion [10]. The second
block finds subimages that contain possible buildings and to concentrate further processing. The third block enhances the
shadows and edges by combing shadow fragments and determining the dihedral responses. In the fourth block, we
represent the problem as a large connected graph with nodes representing the shadow and bright lines and the arc’s
representing relationships between the shadows and bright areas. Finally constraints are applied to reduce the number of
connections and the building location is determined from the surviving subgraphs.
Figure 1. Block diagram for the proposed technique.
1.2 Literature Review
Several techniques have been proposed for building detection, which detect the buildings by finding the buildings edges.
In [1] only bright lines were exploited to find buildings whereas in [2-4] shadows were added as another constraint.
Bright lines result from the corner reflector created due to the interface between the building and ground [1]. To locate
the buildings, SAR images with orthogonal flight paths were used to find multiple bright lines per building which
produce parallelograms surrounding and outlining the buildings [1], [2]. To enhance the previous method, shadows were
added to help with large building detection. The shadows help to provide another boundary that the bright lines do not
provide [2]. While this technique worked very well, it requires careful flight planning to create orthogonal flight paths
over the area of interest (which will not be available in all data sets). Building edges can also be detected using the
watershed transform that is adjusted by bright lines and shadows [3]. The watershed algorithm find boundaries by filling
regional minima until the two fills meet. At this point, the boundary is marked. Membership functions and rules were
applied to objects, generated from detected bright lines and shadows, in order to create building hypotheses. The
hypotheses were then used with the bright lines and shadows to find building edges [4].
Other techniques [5-7] did not utilize bright lines and shadows but instead used Markov random fields (MRF) to
generate labels which model the a priori information of the scene. The labels represent the actual values of the data
being utilized and can be generated for multiple types of data. In [5] the amplitude and InSAR phase were used, in [6]
the real and imaginary parts of multiple co-registered SAR images were used, and in [7] the height, calculated from the
InSAR phase, was used. This technique generates a parameter for the MRF distribution which describes the label and
depends only on the surrounding values. The larger this parameter, the higher the probability is that the corresponding
pixel is an edge.
These techniques are focused on locating the building through defining the buildings edges. For [1-2] the use of the
Steger-operator to find the bright lines, orthorectification of the bright lines from the InSAR heights, and producing and
testing the possible polygons becomes computationally expensive. The addition of shadows and building edges adds
additional expense in [2]. The extensive extraction, downselection, and combination of bright lines and shadows
followed by the classification of style of features in [4] is expensive yet robust. Then the generation of multiple
hypotheses, selection of a hypothesis, and defining a buildings radar footprint adds more expense. On the other hand,
for [5-7] finding the edges is computationally expensive because a large number of values must be generated to compute
the expectations of the MRFs to solve for the parameter. This must be done across multiple iterations to insure that the
parameter coverages. These techniques have no region of interest operator and waste computational resources on images
that have no buildings or only a few buildings.
2. OVERVIEW
In order to detect buildings, bright lines and shadows are utilized. Bright lines are a result of the corner reflector created
where the building and the ground intersect, while shadows are the result of the SAR geometry. SAR creates shadows
when an object in the scene reflects the RF energy and prevents the energy from reaching objects behind the reflecting
object. Objects other than buildings can also generate bright lines and shadows. However, due to assumptions about
building sizes and knowledge about the systems configuration, bright lines and shadows not created by buildings can be
Input required data
Determine regions of
interest Enhance bright
lines and shadows
Graph Representation
Constraint and location
estimation
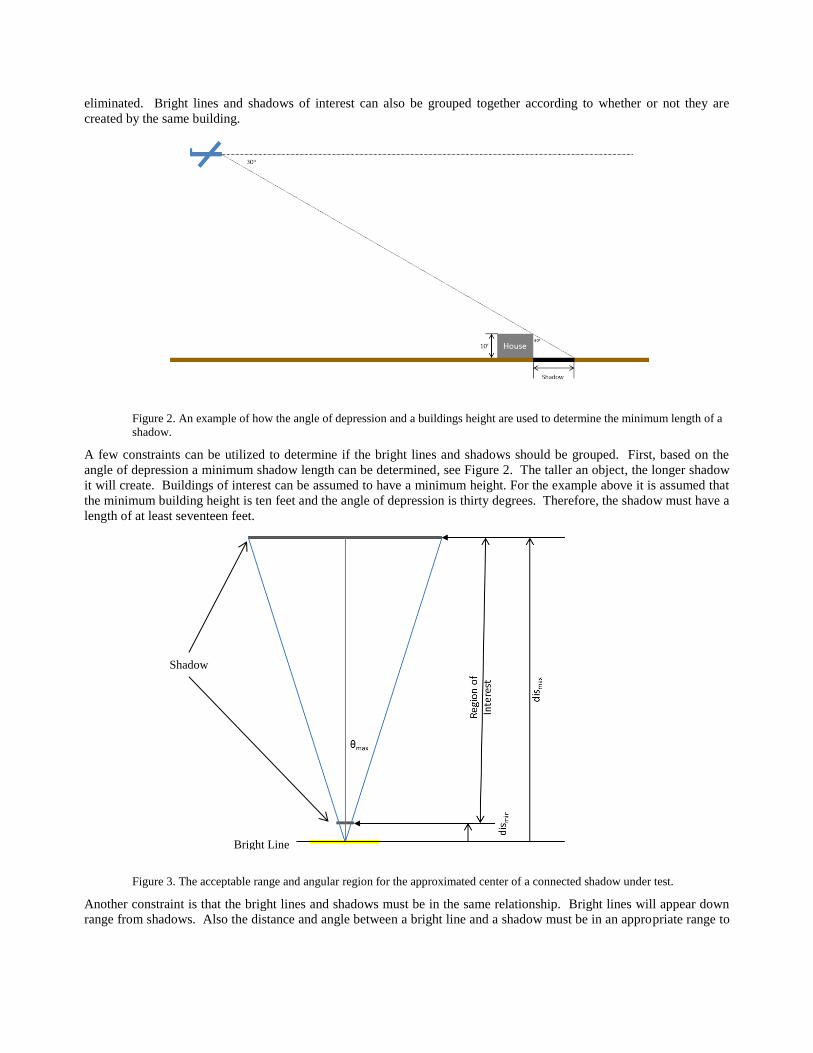
eliminated. Bright lines and shadows of interest can also be grouped together according to whether or not they are
created by the same building.
Figure 2. An example of how the angle of depression and a buildings height are used to determine the minimum length of a
shadow.
A few constraints can be utilized to determine if the bright lines and shadows should be grouped. First, based on the
angle of depression a minimum shadow length can be determined, see Figure 2. The taller an object, the longer shadow
it will create. Buildings of interest can be assumed to have a minimum height. For the example above it is assumed that
the minimum building height is ten feet and the angle of depression is thirty degrees. Therefore, the shadow must have a
length of at least seventeen feet.
Figure 3. The acceptable range and angular region for the approximated center of a connected shadow under test.
Another constraint is that the bright lines and shadows must be in the same relationship. Bright lines will appear down
range from shadows. Also the distance and angle between a bright line and a shadow must be in an appropriate range to
Bright Line
Shadow

be part of the same building. The distance cannot be too great or it is not part of the same building, but it cannot be too
close either. If it is too close then the object is not long enough to be a building. Similarly, the angle cannot be too great
or the bright line and shadow will not be part of the same building. Figure 3 shows the acceptable region for the
connected shadow’s estimated center to be located, in order to be considered a valid connection.
Once the bright lines and the shadows are appropriately grouped they can be used to determine the location of a building.
This is done by averaging the center of the bright lines and shadows. This provides a location for the building, however
it is not guaranteed to be the center of the building, nor is it a bounding box for the building. However, this location
should be contained within the area of the building.
3. TECHNIQUE
In order to utilize bright lines and shadows for locating the building, it is useful to first determine regions of interest
where the bright lines and shadows could possibly correspond. To locate regions of interests an image of the scene is
assumed to be available with bright line and shadow areas labeled. Figure 4 shows examples of the expected SAR
products.
(a) (b)
Figure 4. Examples of the expected SAR products. (a) Median back-scatter image. (b) Bright lines (pink) and shadows
labeled (purple).
3.1 Region of Interest
The first step is to detect regions of interest (ROI). ROI’s are subimages that could contain one or more building and
allow the concentration of future processing to be confined to these areas. First, the combination of bright line and
shadow labels are dilated. Then, the result of the dilation is grouped using four pixel connection and bounding boxes are
found for these groups. Each of these bounding boxes is then checked to see if they contained both bright lines and
shadow pixels. The idea with this dilation and grouping is that a building will have bright lines and shadows relatively
close to each other. If these bright lines and shadows, related to a building, are aggressively dilated they will overlap
and create one blob. Figure 5 shows an example of the aggressive dilation.
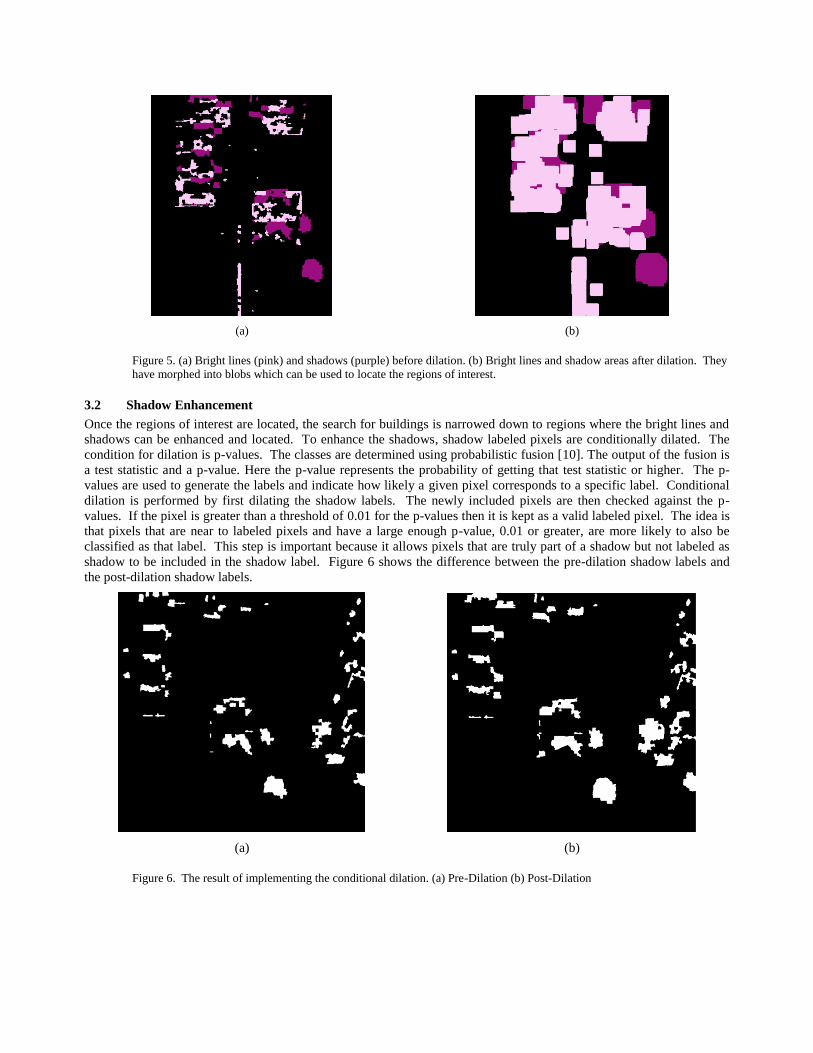
(a) (b)
Figure 5. (a) Bright lines (pink) and shadows (purple) before dilation. (b) Bright lines and shadow areas after dilation. They
have morphed into blobs which can be used to locate the regions of interest.
3.2 Shadow Enhancement
Once the regions of interest are located, the search for buildings is narrowed down to regions where the bright lines and
shadows can be enhanced and located. To enhance the shadows, shadow labeled pixels are conditionally dilated. The
condition for dilation is p-values. The classes are determined using probabilistic fusion [10]. The output of the fusion is
a test statistic and a p-value. Here the p-value represents the probability of getting that test statistic or higher. The p-
values are used to generate the labels and indicate how likely a given pixel corresponds to a specific label. Conditional
dilation is performed by first dilating the shadow labels. The newly included pixels are then checked against the p-
values. If the pixel is greater than a threshold of 0.01 for the p-values then it is kept as a valid labeled pixel. The idea is
that pixels that are near to labeled pixels and have a large enough p-value, 0.01 or greater, are more likely to also be
classified as that label. This step is important because it allows pixels that are truly part of a shadow but not labeled as
shadow to be included in the shadow label. Figure 6 shows the difference between the pre-dilation shadow labels and
the post-dilation shadow labels.
(a) (b)
Figure 6. The result of implementing the conditional dilation. (a) Pre-Dilation (b) Post-Dilation
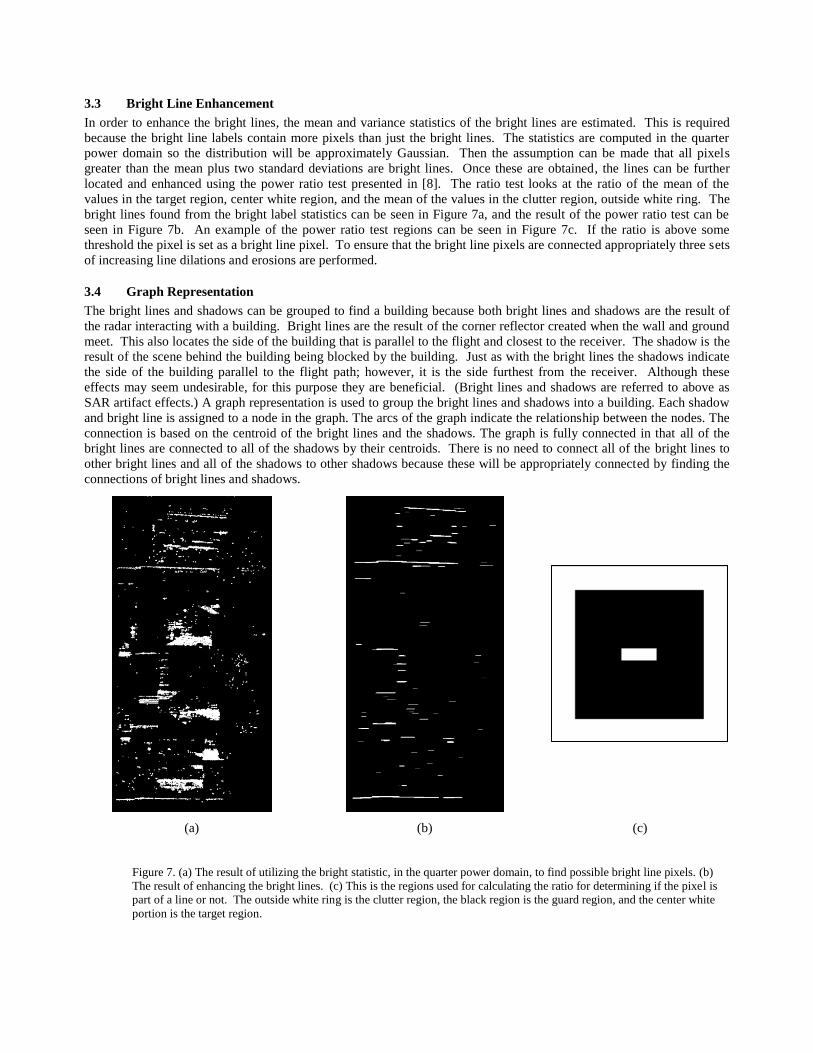
3.3 Bright Line Enhancement
In order to enhance the bright lines, the mean and variance statistics of the bright lines are estimated. This is required
because the bright line labels contain more pixels than just the bright lines. The statistics are computed in the quarter
power domain so the distribution will be approximately Gaussian. Then the assumption can be made that all pixels
greater than the mean plus two standard deviations are bright lines. Once these are obtained, the lines can be further
located and enhanced using the power ratio test presented in [8]. The ratio test looks at the ratio of the mean of the
values in the target region, center white region, and the mean of the values in the clutter region, outside white ring. The
bright lines found from the bright label statistics can be seen in Figure 7a, and the result of the power ratio test can be
seen in Figure 7b. An example of the power ratio test regions can be seen in Figure 7c. If the ratio is above some
threshold the pixel is set as a bright line pixel. To ensure that the bright line pixels are connected appropriately three sets
of increasing line dilations and erosions are performed.
3.4 Graph Representation
The bright lines and shadows can be grouped to find a building because both bright lines and shadows are the result of
the radar interacting with a building. Bright lines are the result of the corner reflector created when the wall and ground
meet. This also locates the side of the building that is parallel to the flight and closest to the receiver. The shadow is the
result of the scene behind the building being blocked by the building. Just as with the bright lines the shadows indicate
the side of the building parallel to the flight path; however, it is the side furthest from the receiver. Although these
effects may seem undesirable, for this purpose they are beneficial. (Bright lines and shadows are referred to above as
SAR artifact effects.) A graph representation is used to group the bright lines and shadows into a building. Each shadow
and bright line is assigned to a node in the graph. The arcs of the graph indicate the relationship between the nodes. The
connection is based on the centroid of the bright lines and the shadows. The graph is fully connected in that all of the
bright lines are connected to all of the shadows by their centroids. There is no need to connect all of the bright lines to
other bright lines and all of the shadows to other shadows because these will be appropriately connected by finding the
connections of bright lines and shadows.
Figure 7. (a) The result of utilizing the bright statistic, in the quarter power domain, to find possible bright line pixels. (b)
The result of enhancing the bright lines. (c) This is the regions used for calculating the ratio for determining if the pixel is
part of a line or not. The outside white ring is the clutter region, the black region is the guard region, and the center white
portion is the target region.
(a) (b) (c)
3.5 Graph Reduction using Constraints
Once all of the connections are made between bright lines and shadows there is no clear groups for buildings. The
connections must be narrowed down in order to locate buildings. Some simple constraints are utilized to narrow down
the connections. First, the length of the shadow is verified. If the shadow is too short then it cannot be the result of
building. The minimum length of a shadow can be calculated by knowing the angle of depression and also the minimum
allowable height of a building, see Figure 2. Any shadow that is shorter than the minimum is discarded as well as any
connections to this shadow. As stated previously, bright lines connected to shadows are closer to the receiver. With this
in mind, any connections that are connecting bright lines to shadows closer to the receiver are also discarded. Another
constraint is the angle of the vector connecting the bright lines to shadows relative to the range direction. This further
reduces connections between bright lines and shadows, since the angle must also not be too large, see Figure 3.
Once all of the bright lines and shadows in a group are known the building location can be approximated. To do this,
first the shadow centroids are averaged and the bright line centroids are averaged. Then these two averages are averaged.
What this ensures is that if there are a greater number of bright lines or shadows, the result will not be skewed one way
or the other. With this result the building is now located. It is important to note that this is not a bounding box of the
building or the exact center of the building. This also is very useful for narrowing down the location of the building so a
more robust or computationally expensive technique can be utilized.
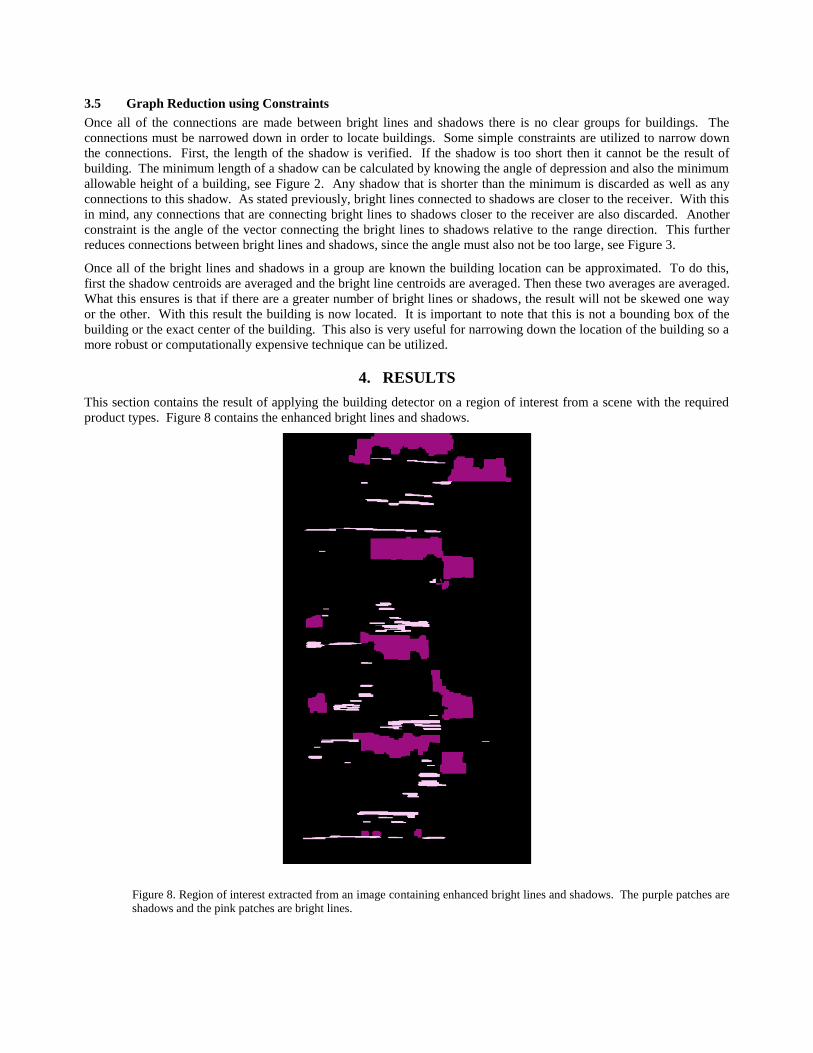
4. RESULTS
This section contains the result of applying the building detector on a region of interest from a scene with the required
product types. Figure 8 contains the enhanced bright lines and shadows.
Figure 8. Region of interest extracted from an image containing enhanced bright lines and shadows. The purple patches are
shadows and the pink patches are bright lines.
(a) (b)
(c) (d)
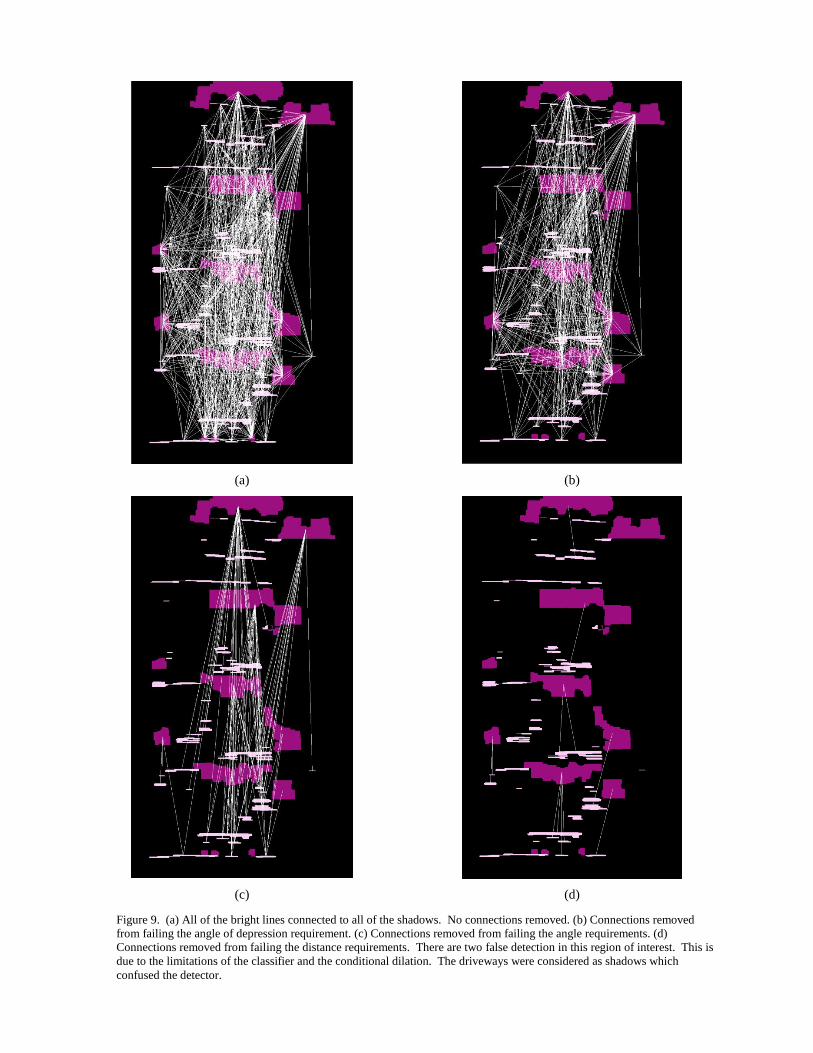
Figure 9. (a) All of the bright lines connected to all of the shadows. No connections removed. (b) Connections removed
from failing the angle of depression requirement. (c) Connections removed from failing the angle requirements. (d)
Connections removed from failing the distance requirements. There are two false detection in this region of interest. This is
due to the limitations of the classifier and the conditional dilation. The driveways were considered as shadows which
confused the detector.
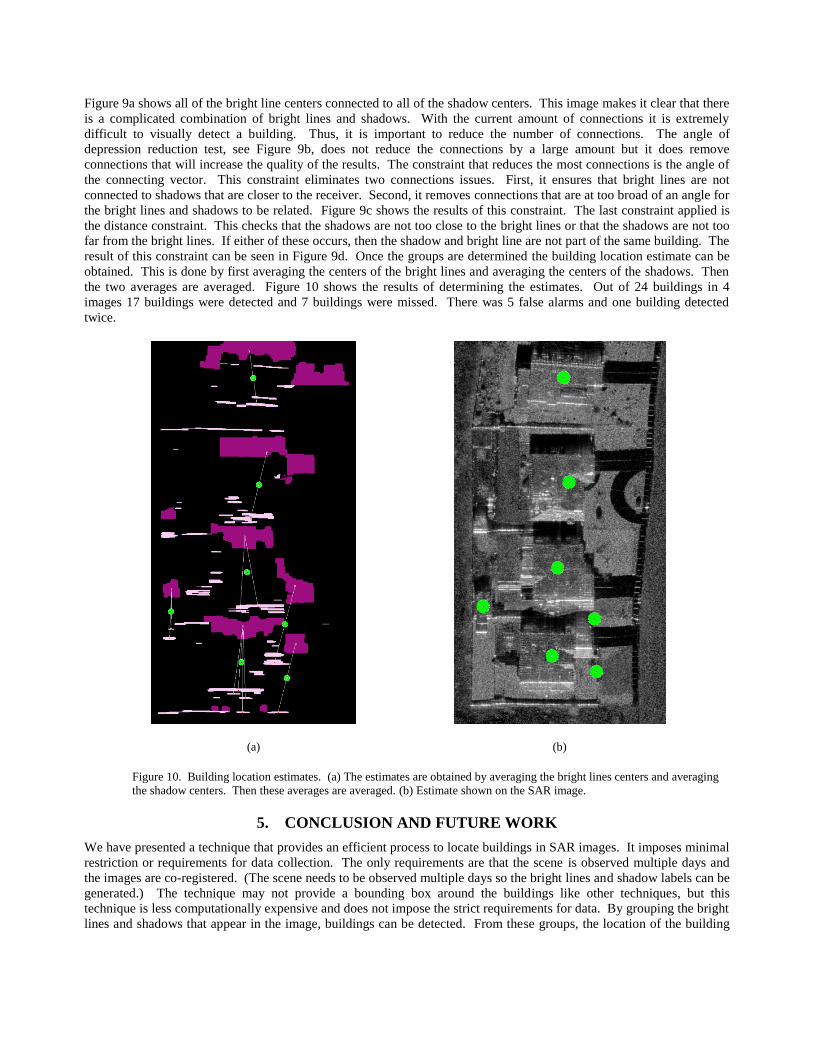
Figure 9a shows all of the bright line centers connected to all of the shadow centers. This image makes it clear that there
is a complicated combination of bright lines and shadows. With the current amount of connections it is extremely
difficult to visually detect a building. Thus, it is important to reduce the number of connections. The angle of
depression reduction test, see Figure 9b, does not reduce the connections by a large amount but it does remove
connections that will increase the quality of the results. The constraint that reduces the most connections is the angle of
the connecting vector. This constraint eliminates two connections issues. First, it ensures that bright lines are not
connected to shadows that are closer to the receiver. Second, it removes connections that are at too broad of an angle for
the bright lines and shadows to be related. Figure 9c shows the results of this constraint. The last constraint applied is
the distance constraint. This checks that the shadows are not too close to the bright lines or that the shadows are not too
far from the bright lines. If either of these occurs, then the shadow and bright line are not part of the same building. The
result of this constraint can be seen in Figure 9d. Once the groups are determined the building location estimate can be
obtained. This is done by first averaging the centers of the bright lines and averaging the centers of the shadows. Then
the two averages are averaged. Figure 10 shows the results of determining the estimates. Out of 24 buildings in 4
images 17 buildings were detected and 7 buildings were missed. There was 5 false alarms and one building detected
twice.
(a) (b)
Figure 10. Building location estimates. (a) The estimates are obtained by averaging the bright lines centers and averaging
the shadow centers. Then these averages are averaged. (b) Estimate shown on the SAR image.
5. CONCLUSION AND FUTURE WORK
We have presented a technique that provides an efficient process to locate buildings in SAR images. It imposes minimal
restriction or requirements for data collection. The only requirements are that the scene is observed multiple days and
the images are co-registered. (The scene needs to be observed multiple days so the bright lines and shadow labels can be
generated.) The technique may not provide a bounding box around the buildings like other techniques, but this
technique is less computationally expensive and does not impose the strict requirements for data. By grouping the bright
lines and shadows that appear in the image, buildings can be detected. From these groups, the location of the building
can be determined. The results show that the technique is quite valuable and has minimal issues. The false alarms are
due to limitations in characterizing bright lines and shadows. The downsides for this technique are the requirements to
accurately detect the bright lines and shadows. These are difficult processes because there are other objects in the scene
that have a similar backscatter to that of the bright lines and shadows. Cement and water are examples of objects that are
similar to shadow, while power lines and other narrow metal objects often appear similar to bright lines. The technique
can be improved by improving characterization techniques such as the enhancement of bright lines and shadows, which
are used for grouping the bright lines and shadows. The results are also very useful because they provide a starting point
to more computationally intensive algorithms which can more accurately and robustly detect the buildings. This
framework also could lead to a probabilistic graph framework what would give the probability of different shadow and
bright line groupings.
ACKNOWLEDGEMENTS
This work was supported by PANTHER, a Laboratory Directed Research and Development (LDRD) Project at Sandia
National Laboratories. For additional information about PANTHER, please contact Kristina Czuchlewski, Ph.D.,
[email protected]. Sandia National Laboratories is a multiprogram laboratory operated by Sandia Corporation, a
Lockheed Martin Company, for the United States Department of Energy’s National Nuclear Security Administration
under Contract DE-AC04-94AL85000.
REFERENCES
[1] Thiele A., Cadario E., Schulz K., Thonnessen U., and Soergel U., “Building Recognition Fusing Multi-Aspect High-
Resolution Interferometric SAR Data”, IEEE International Conference on Geoscience and Remote Sensing
Symposium, 2006, 3626-3629, (2006).
[2] Thiele A., Cadario E., Schulz K., Thonnessen U., and Soergel U., “Building Recognition From Multi-Aspect High-
Resolution InSAR Data in Urban Areas”, IEEE Transactions on Geoscience and Remote Sensing, Vol. 45, No. 11,
3583-3593, (2007).
[3] Zhao L., Zhou X., and Kuang G., “Building detection from urban SAR image using building characteristics and
contextual information,” EURASIP Journal on Advances in Signal Processing, 2013:56, (2013).
[4] Ferro A., Brunner D., and Bruzzone L., “Automatic Detection and Reconsturction of Building Radar Footprints
From Single VHR SAR Images”, IEEE Transactions on Geoscience and Remote Sensing, Vol. 51, No. 2, 935-952,
(2013).
[5] Baselice, F. and Ferraioli, G., “Statistical Edge Detection in Urban Areas Exploiting SAR Complex Data,” IEEE
Geoscience and Remote Sensing Letters, Vol. 9, No. 2, 185-189, (2012).
[6] Baselice, F., Ferraioli, G., and Reale D., “Edge Detection Using Real and Imaginary Decomposition of SAR Data,”
IEEE Transactions on Geoscience and Remote Sensing, Vol. 52, No. 7, 3833-3842, (2014).
[7] Ferraioli, G., “Multichannel InSAR Building Edge Detection,” IEEE Transactions on Geoscience and Remote
Sensing, Vol. 48, No. 3, 1224-1231, (2009).
[8] Lombardo, P., Sciotti, M., and Kaplan L. M., “SAR Prescreening using Both Target and Shadow Information,”
Proceedings of the 2001 IEEE Radar Conference, 147-152, (2001).
[9] Moya, M., “Superpixel Segmentations of Synthetic Aperture Radar Imagery Derived from Combinations of Multiple
Data Products”, Conference on Data Analysis 2014, Santa Fe, NM, March 5-7, 2014, (2014).
[10] Simonson, K. A., “Probabilistic Fusion of ATR Results”, Sandia National Laboratories SAND Report, August
1998, SAND98-1699, (1998).
[11] Kolmogorov A., “Sulla determinazione empirica di una legge di distribuzione”, G. Ist. Ital. Attuari, Vol. 4, 83–91,
(1933).
[12] Smirnov N., “Table for estimating the goodness of fit of empirical distributions”, Annals of Mathematical
Statistics, Vol. 19, 279–281, (1948).