Embed Size (px)
Citation preview
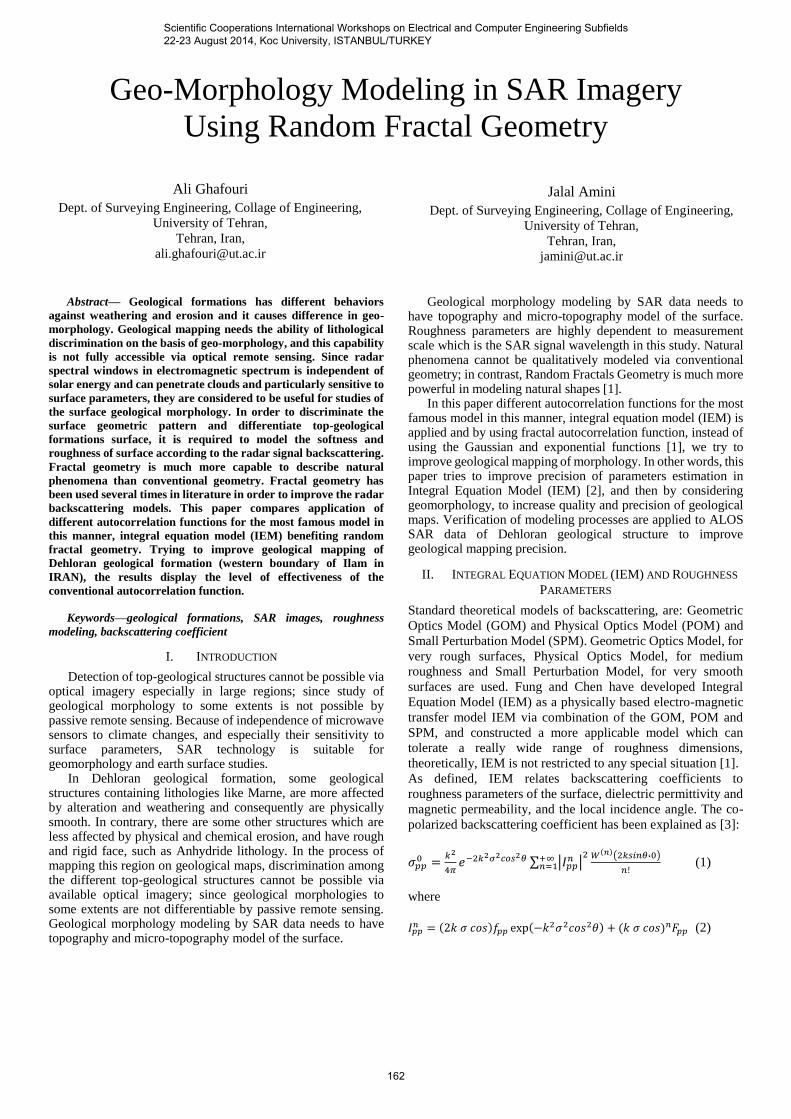
Geo-Morphology Modeling in SAR Imagery
Using Random Fractal Geometry
Ali Ghafouri
Dept. of Surveying Engineering, Collage of Engineering,
University of Tehran,
Tehran, Iran,
Jalal Amini
Dept. of Surveying Engineering, Collage of Engineering,
University of Tehran,
Tehran, Iran,
Abstract— Geological formations has different behaviors
against weathering and erosion and it causes difference in geo-
morphology. Geological mapping needs the ability of lithological
discrimination on the basis of geo-morphology, and this capability
is not fully accessible via optical remote sensing. Since radar
spectral windows in electromagnetic spectrum is independent of
solar energy and can penetrate clouds and particularly sensitive to
surface parameters, they are considered to be useful for studies of
the surface geological morphology. In order to discriminate the
surface geometric pattern and differentiate top-geological
formations surface, it is required to model the softness and
roughness of surface according to the radar signal backscattering.
Fractal geometry is much more capable to describe natural
phenomena than conventional geometry. Fractal geometry has
been used several times in literature in order to improve the radar
backscattering models. This paper compares application of
different autocorrelation functions for the most famous model in
this manner, integral equation model (IEM) benefiting random
fractal geometry. Trying to improve geological mapping of
Dehloran geological formation (western boundary of Ilam in
IRAN), the results display the level of effectiveness of the
conventional autocorrelation function.
Keywords—geological formations, SAR images, roughness
modeling, backscattering coefficient
I. INTRODUCTION
Detection of top-geological structures cannot be possible via optical imagery especially in large regions; since study of geological morphology to some extents is not possible by passive remote sensing. Because of independence of microwave sensors to climate changes, and especially their sensitivity to surface parameters, SAR technology is suitable for geomorphology and earth surface studies.
In Dehloran geological formation, some geological structures containing lithologies like Marne, are more affected by alteration and weathering and consequently are physically smooth. In contrary, there are some other structures which are less affected by physical and chemical erosion, and have rough and rigid face, such as Anhydride lithology. In the process of mapping this region on geological maps, discrimination among the different top-geological structures cannot be possible via available optical imagery; since geological morphologies to some extents are not differentiable by passive remote sensing. Geological morphology modeling by SAR data needs to have topography and micro-topography model of the surface.
Geological morphology modeling by SAR data needs to have topography and micro-topography model of the surface. Roughness parameters are highly dependent to measurement scale which is the SAR signal wavelength in this study. Natural phenomena cannot be qualitatively modeled via conventional geometry; in contrast, Random Fractals Geometry is much more powerful in modeling natural shapes [1].
In this paper different autocorrelation functions for the most famous model in this manner, integral equation model (IEM) is applied and by using fractal autocorrelation function, instead of using the Gaussian and exponential functions [1], we try to improve geological mapping of morphology. In other words, this paper tries to improve precision of parameters estimation in Integral Equation Model (IEM) [2], and then by considering geomorphology, to increase quality and precision of geological maps. Verification of modeling processes are applied to ALOS SAR data of Dehloran geological structure to improve geological mapping precision.
II. INTEGRAL EQUATION MODEL (IEM) AND ROUGHNESS
PARAMETERS
Standard theoretical models of backscattering, are: Geometric
Optics Model (GOM) and Physical Optics Model (POM) and
Small Perturbation Model (SPM). Geometric Optics Model, for
very rough surfaces, Physical Optics Model, for medium
roughness and Small Perturbation Model, for very smooth
surfaces are used. Fung and Chen have developed Integral
Equation Model (IEM) as a physically based electro-magnetic
transfer model IEM via combination of the GOM, POM and
SPM, and constructed a more applicable model which can
tolerate a really wide range of roughness dimensions,
theoretically, IEM is not restricted to any special situation [1].
As defined, IEM relates backscattering coefficients to
roughness parameters of the surface, dielectric permittivity and
magnetic permeability, and the local incidence angle. The co-
polarized backscattering coefficient has been explained as [3]:
𝜎𝑝𝑝0 =
𝑘2
4𝜋𝑒−2𝑘2𝜎2𝑐𝑜𝑠2𝜃 ∑ |𝐼𝑝𝑝
𝑛 |2 𝑊(𝑛)(2𝑘𝑠𝑖𝑛𝜃،0)
𝑛!
+∞𝑛=1 (1)
where
𝐼𝑝𝑝𝑛 = (2𝑘 𝜎 𝑐𝑜𝑠)𝑓𝑝𝑝 exp(−𝑘2𝜎2𝑐𝑜𝑠2𝜃) + (𝑘 𝜎 𝑐𝑜𝑠)𝑛𝐹𝑝𝑝 (2)
Scientific Cooperations International Workshops on Electrical and Computer Engineering Subfields 22-23 August 2014, Koc University, ISTANBUL/TURKEY
162
and pp, polarization (hh or vv); k, wave number (𝑘 =2𝜋
𝜆: λ is
the wavelength), θ is the local incidence angle, σ, the surface
rms-height, 𝑊(𝑛), fourier transform of 𝑛𝑡ℎ power of the
correlation function, and 𝑓ℎℎ, 𝑓𝑣𝑣, 𝐹ℎℎ and 𝐹𝑣𝑣 are approximated
by:
𝑓ℎℎ =−2𝑅ℎ
𝑐𝑜𝑠𝜃
𝑓ℎℎ =2𝑅𝑣
𝑐𝑜𝑠𝜃
𝐹ℎℎ = 2𝑠𝑖𝑛2𝜃
𝑐𝑜𝑠𝜃[4𝑅ℎ − (1 −
1
𝜀) (1 + 𝑅ℎ)2]
𝐹𝑣𝑣 = 2𝑠𝑖𝑛2𝜃
𝑐𝑜𝑠𝜃[(1 −
𝜀 𝑐𝑜𝑠2𝜃
𝜀 − 𝑠𝑖𝑛2𝜃) (1 − 𝑅𝑣)2 − (1 −
1
𝜀) (1 + 𝑅𝑣)2]
The horizontally and vertically polarized Fresnel reflection
coefficients, 𝑅ℎ and 𝑅𝑣, are described as:
𝑅ℎ =𝑐𝑜𝑠𝜃 − √𝜀 − 𝑠𝑖𝑛2𝜃
𝑐𝑜𝑠𝜃 + √𝜀 − 𝑠𝑖𝑛2𝜃
𝑅𝑣 =𝜀 𝑐𝑜𝑠𝜃 − √𝜀 − 𝑠𝑖𝑛2𝜃
𝜀 𝑐𝑜𝑠𝜃 + √𝜀 − 𝑠𝑖𝑛2𝜃
𝜀 is the dielectric constant. Considering 𝐶(𝜌), the surface
autocorrelation function (ACF), and 𝐽0 as zeroth order Bessel
function, surface power spectrum, 𝑊(𝑛) in IEM can be defined
as:
𝑊(𝑛)(𝐾) = ∫ 𝐶(𝜌). 𝜌. 𝐽0(𝐾𝜌)𝑑𝜌𝜌=+∞
𝜌=0 (3)
Gaussian and exponential functions are two special cases of
ACF, which will be described in the next section.
Calculation of the model parameters from SAR signal
backscattering coefficient is not directly possible, because of
the model complexity and some other strategies must be
pursued. In this paper Look Up Table (LUT) method is
employed; so for this purpose a table of different possible
values of roughness parameters/dielectric constant and
corresponding backscattering coefficients tabulated.
In sections A, B and C, respectively, the three main
specifications for the radar Backscattering study, the rms-
height, correlation length and autocorrelation function are
defined.
A. Heights Root Mean Square (rms-height)
The root mean square of surface heights (rms-height) defines
the variation in surface elevation above an arbitrary plane and
is used to be calculated on the basis of a one-dimensional
discrete surface profile measurement consisting N points with
elevations 𝑧𝑖 [4]:
𝑠 = √1
𝑁[(∑ 𝑧𝑖
2𝑁𝑖=1 ) − 𝑁𝑧̅2] (4)
where
𝑧̅ =1
𝑁∑ 𝑧𝑖
𝑁𝑖=1 (5)
In (4), s represents standard deviation of the surface micro-
topography discrete heights.
B. Correlation Length
The level of surface heights uniformity over a finite profile of
the surface is usually described by Correlation Length [4]. In
other words, the horizontal variations of the surface heights is
called correlation length. Unlike the simplicity of this
definition, measurements of the correlation length is
complicated. The calculated values for this parameter via
different ways are extremely variable and also greatly depends
on the length of the sampling profile length [6]. As a typical
methodology, Davidson et al. (2003) has proposed a linear
interpolation on the correlation function of the heights:
𝑙 = (𝑒−1 − 𝐶(𝜌1))𝜌2−𝜌1
𝐶(𝜌2)−𝐶(𝜌1)+ 𝜌1 (6)
where 𝐶(𝜌) is the autocorrelation function, 𝜌1 and 𝜌2 are two
arbitrary points. On the basis of the parameter definition, in this
equation, it is considered that 𝐶(𝑙) = 𝑒−1.
C. Autocorrelation Function
The normalized autocorrelation function, for 𝜌 = 𝑗𝛥𝑥, where
∆x is the spatial resolution of the profile, is given by:
𝐶(𝜌) =∑ 𝑧𝑖𝑧𝑖+𝑗
𝑁−𝑗𝑖=1
∑ 𝑧𝑖2𝑁
𝑖=1
(7)
In order to fully characterize the ACF of a surface, a
discretization interval, used to sample the profile, should be at
least as small as one tenth of the correlation length.
In backscattering models, often two types of ACFs, the
exponential and the Gaussian autocorrelation functions are
being used. The exponential ACF is given by:
𝐶(𝜌) = 𝑒−|𝜌|
𝑙⁄
(8)
and the Gaussian function;
𝐶(𝜌) = 𝑒−𝜌2
𝑙2⁄ (9)
where l, is the correlation length.
III. IEM MODELING METHOD USING FRACTAL GEOMETRY
The most famous improvement for backscattering modeling
using fractal geometry is using fractal ACF instead of Gaussian
or exponential one.
Eqs. (8) and (9), show the exponential and Gaussian ACFs,
respectively. Likewise fractal correlation function is [1]:
Scientific Cooperations International Workshops on Electrical and Computer Engineering Subfields 22-23 August 2014, Koc University, ISTANBUL/TURKEY
163
𝐶(𝜌) = 𝑒−𝜌𝜏
𝑙𝜏⁄ (10)
where, on the basis of experimental data, parameter 𝜏 has a
linear relation with fractal dimension and the relation is
computable via: 𝜏 = −1.67 𝐷 + 3.67, in which, D is the fractal
dimension of the earth surface and can be calculated via various
methods. In natural surfaces which have more complexity,
fractal functions are more appropriate than the exponential and
Gaussian correlation functions. Since the exponential and
Gaussian functions are particular forms for particular situations
of fractal function [1].
IV. IMPLEMENTATION, RESULTS AND DISCUSSION
A. Case Study
As the application case study, western part of Dehloran
geological formation is selected which is located in the
following coordinates:
Longitude: 46°45' to 46°55'
Latitude: 32°40' to 32°45'
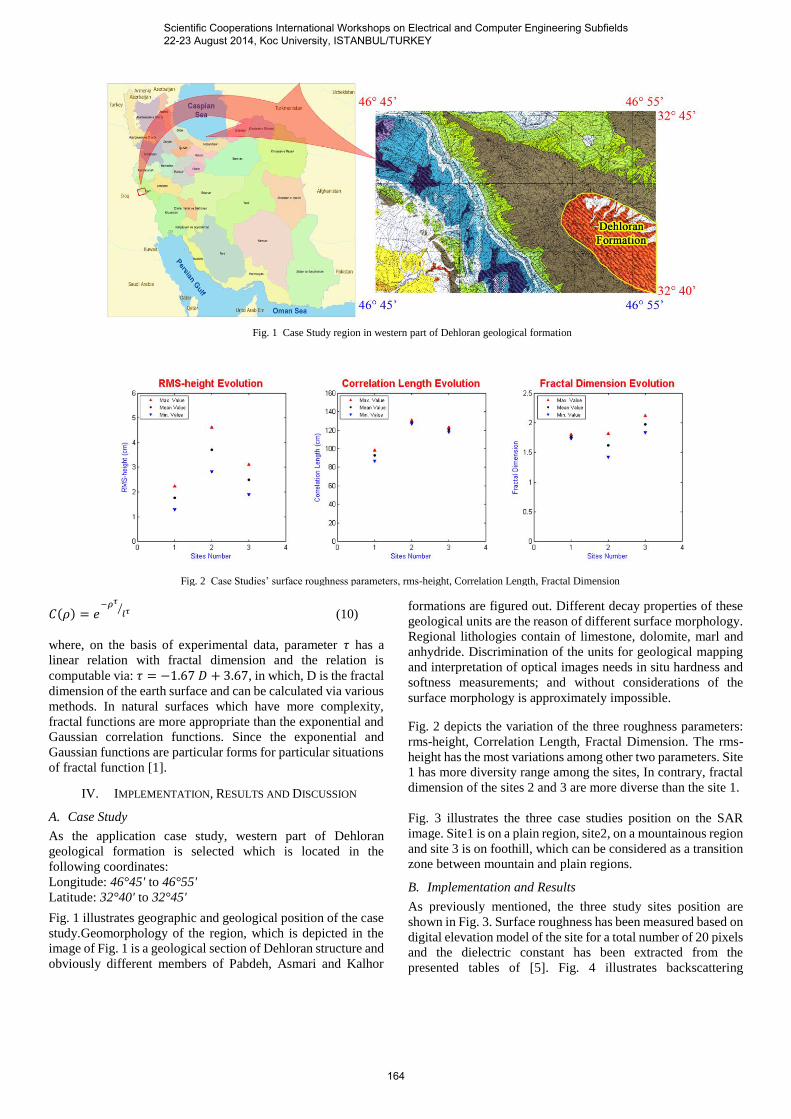
Fig. 1 illustrates geographic and geological position of the case
study.Geomorphology of the region, which is depicted in the
image of Fig. 1 is a geological section of Dehloran structure and
obviously different members of Pabdeh, Asmari and Kalhor
formations are figured out. Different decay properties of these
geological units are the reason of different surface morphology.
Regional lithologies contain of limestone, dolomite, marl and
anhydride. Discrimination of the units for geological mapping
and interpretation of optical images needs in situ hardness and
softness measurements; and without considerations of the
surface morphology is approximately impossible.
Fig. 2 depicts the variation of the three roughness parameters:
rms-height, Correlation Length, Fractal Dimension. The rms-
height has the most variations among other two parameters. Site
1 has more diversity range among the sites, In contrary, fractal
dimension of the sites 2 and 3 are more diverse than the site 1.
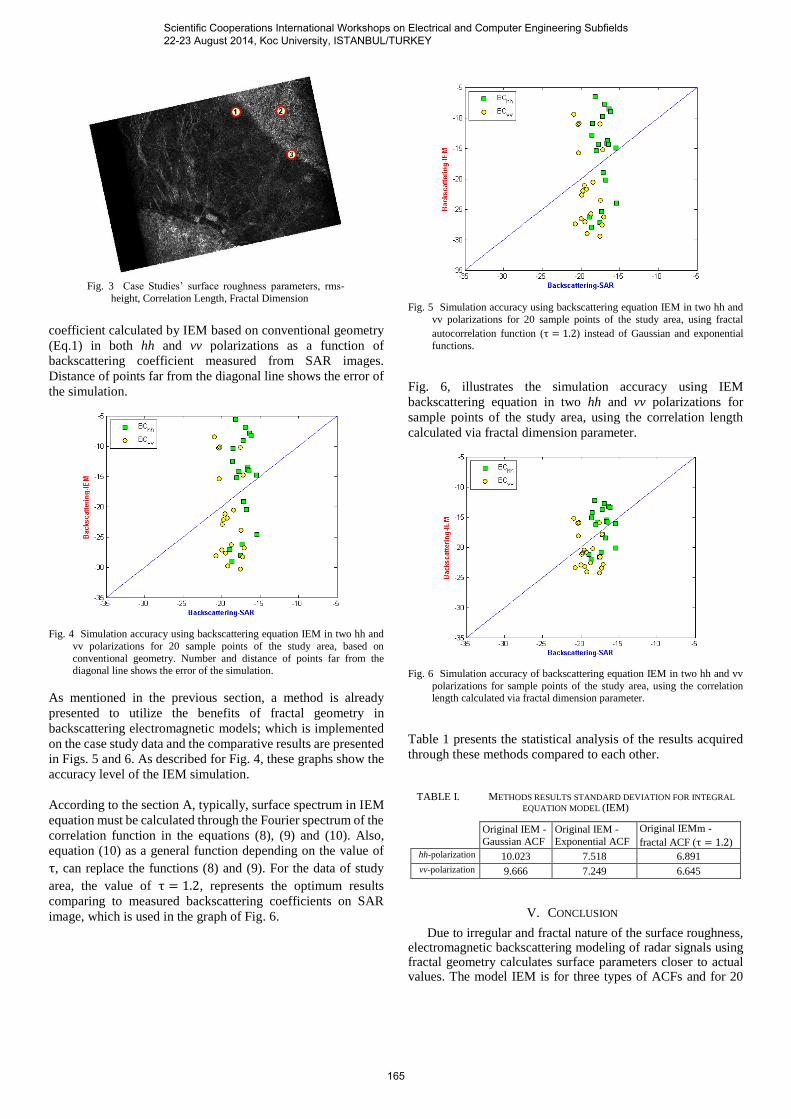
Fig. 3 illustrates the three case studies position on the SAR
image. Site1 is on a plain region, site2, on a mountainous region
and site 3 is on foothill, which can be considered as a transition
zone between mountain and plain regions.
B. Implementation and Results
As previously mentioned, the three study sites position are
shown in Fig. 3. Surface roughness has been measured based on
digital elevation model of the site for a total number of 20 pixels
and the dielectric constant has been extracted from the
presented tables of [5]. Fig. 4 illustrates backscattering
Fig. 1 Case Study region in western part of Dehloran geological formation
Fig. 2 Case Studies’ surface roughness parameters, rms-height, Correlation Length, Fractal Dimension
]
Scientific Cooperations International Workshops on Electrical and Computer Engineering Subfields 22-23 August 2014, Koc University, ISTANBUL/TURKEY
164
coefficient calculated by IEM based on conventional geometry
(Eq.1) in both hh and vv polarizations as a function of
backscattering coefficient measured from SAR images.
Distance of points far from the diagonal line shows the error of
the simulation.
Fig. 4 Simulation accuracy using backscattering equation IEM in two hh and
vv polarizations for 20 sample points of the study area, based on
conventional geometry. Number and distance of points far from the diagonal line shows the error of the simulation.
As mentioned in the previous section, a method is already
presented to utilize the benefits of fractal geometry in
backscattering electromagnetic models; which is implemented
on the case study data and the comparative results are presented
in Figs. 5 and 6. As described for Fig. 4, these graphs show the
accuracy level of the IEM simulation.
According to the section A, typically, surface spectrum in IEM
equation must be calculated through the Fourier spectrum of the
correlation function in the equations (8), (9) and (10). Also,
equation (10) as a general function depending on the value of
τ, can replace the functions (8) and (9). For the data of study
area, the value of τ = 1.2, represents the optimum results
comparing to measured backscattering coefficients on SAR
image, which is used in the graph of Fig. 6.
Fig. 5 Simulation accuracy using backscattering equation IEM in two hh and
vv polarizations for 20 sample points of the study area, using fractal
autocorrelation function (τ = 1.2) instead of Gaussian and exponential
functions.
Fig. 6, illustrates the simulation accuracy using IEM
backscattering equation in two hh and vv polarizations for
sample points of the study area, using the correlation length
calculated via fractal dimension parameter.
Fig. 6 Simulation accuracy of backscattering equation IEM in two hh and vv
polarizations for sample points of the study area, using the correlation length calculated via fractal dimension parameter.
Table 1 presents the statistical analysis of the results acquired
through these methods compared to each other.
TABLE I. METHODS RESULTS STANDARD DEVIATION FOR INTEGRAL
EQUATION MODEL (IEM)
Original IEM -
Gaussian ACF
Original IEM -
Exponential ACF
Original IEMm -
fractal ACF (τ = 1.2) hh-polarization 10.023 7.518 6.891
vv-polarization 9.666 7.249 6.645
V. CONCLUSION
Due to irregular and fractal nature of the surface roughness, electromagnetic backscattering modeling of radar signals using fractal geometry calculates surface parameters closer to actual values. The model IEM is for three types of ACFs and for 20
Fig. 3 Case Studies’ surface roughness parameters, rms-
height, Correlation Length, Fractal Dimension
Scientific Cooperations International Workshops on Electrical and Computer Engineering Subfields 22-23 August 2014, Koc University, ISTANBUL/TURKEY
165

sample points on three different sites is tested. The graphs and the deviation table, demonstrate obviously the effectiveness of fractal ACF. The studied fractal ACF is implemented with the available linear interpolation which relates fractal dimension and correlation length, more studies on this interpolation can be planned for future studies.
ACKNOWLEDGMENT
The authors are thankful to the University of Tehran for providing financial assistance to carry out this research.
REFERENCES
[1] Baghdadi, N., I. Gherboudj, M. Zribi, M. Sahebi, C. King, F. Bonn, “Semi-empirical calibration of the IEM backscattering model using radar images and moisture and roughness field measurements”, International
Journal of Remote Sensing, Vol. 25, Iss. 18, 2004, DOI: 10.1080/01431160310001654392
[2] Fung, A., Z. Li, and K. Chen “Backscattering from a randomly rough dielectric surface”, IEEE Geoscience and Remote Sensing Letters vol.30, no.2, pp. 356,369, 1992, DOI: 10.1109/36.134085
[3] Fung, A. and K. Chen, “An update on the IEM surface backscattering model”, IEEE Geoscience and Remote Sensing Letters vol.1, no.2, pp. 75,77, 2004, DOI: 10.1109/LGRS.2004.826564
[4] Gupta, V. K., and R. A. Jangid, “Microwave response of rough surfaces with auto-correlation functions, RMS heights and correlation lengths using active remote sensing”, Indian Journal of Radio & Space Physics, Vol 40, pp 137-14, 2011.
[5] Martinez, A. and A. P. Byrnes, “Modeling Dielectric-constant values of Geologic Materials: An Aid to Ground-Penetrating Radar Data Collection and Interpretation”, Current Research in Earth Sciences, Bulletin 247, part 1, 2001.
[6] Verhoest, N. E., H. Lievens, W. Wagner, J. Álvarez Mozos, M. S. Moran, and F. Mattia, “On the soil roughness parameterization problem in soil moisture retrieval of bare surfaces from synthetic aperture radar”. Sensors 8.7, pp.4213,4248, 2008, DOI: 10.3390/s8074213
Scientific Cooperations International Workshops on Electrical and Computer Engineering Subfields 22-23 August 2014, Koc University, ISTANBUL/TURKEY
166