Embed Size (px)
Citation preview

Cairn Homes plc2020 Interim Results Presentation
1
2020 Interim Results Presentation
Table of Contents Page
Michael Stanley
Co-Founder & CEO
Declan Murray
Head of Investor Relations
Shane Doherty
Chief Financial Officer
1 H1 2020 Review 2
2 Financial Results & Guidance 8
3 Our Sustainability Agenda 16
4 Landbank & Market 20
5 Outlook 27
6 Appendices 29

2
01H1 2020 Review
3
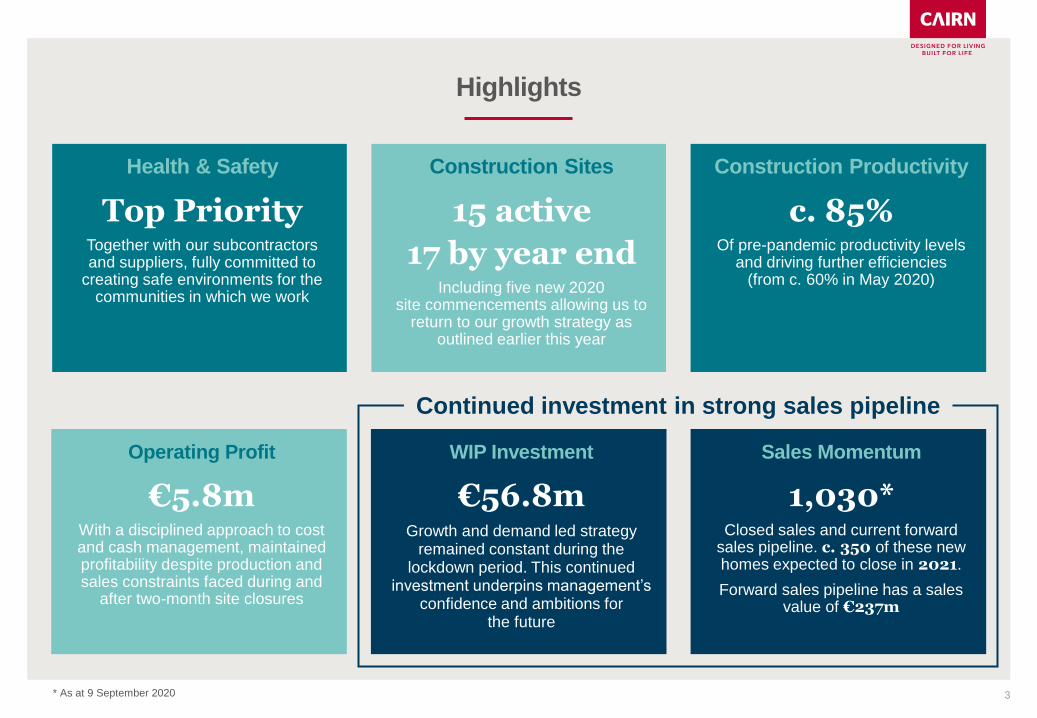
Highlights
* As at 9 September 2020
Continued investment in strong sales pipeline
Health & Safety
Top PriorityTogether with our subcontractors and suppliers, fully committed to
creating safe environments for the communities in which we work
Operating Profit
€5.8mWith a disciplined approach to cost and cash management, maintained profitability despite production and sales constraints faced during and
after two-month site closures
Construction Productivity
c. 85%Of pre-pandemic productivity levels
and driving further efficiencies (from c. 60% in May 2020)
Sales Momentum
1,030*Closed sales and current forward
sales pipeline. c. 350 of these new homes expected to close in 2021.
Forward sales pipeline has a sales value of €237m
WIP Investment
€56.8mGrowth and demand led strategy
remained constant during the lockdown period. This continued
investment underpins management’s confidence and ambitions for
the future
Construction Sites
15 active
17 by year endIncluding five new 2020
site commencements allowing us to return to our growth strategy as
outlined earlier this year
4
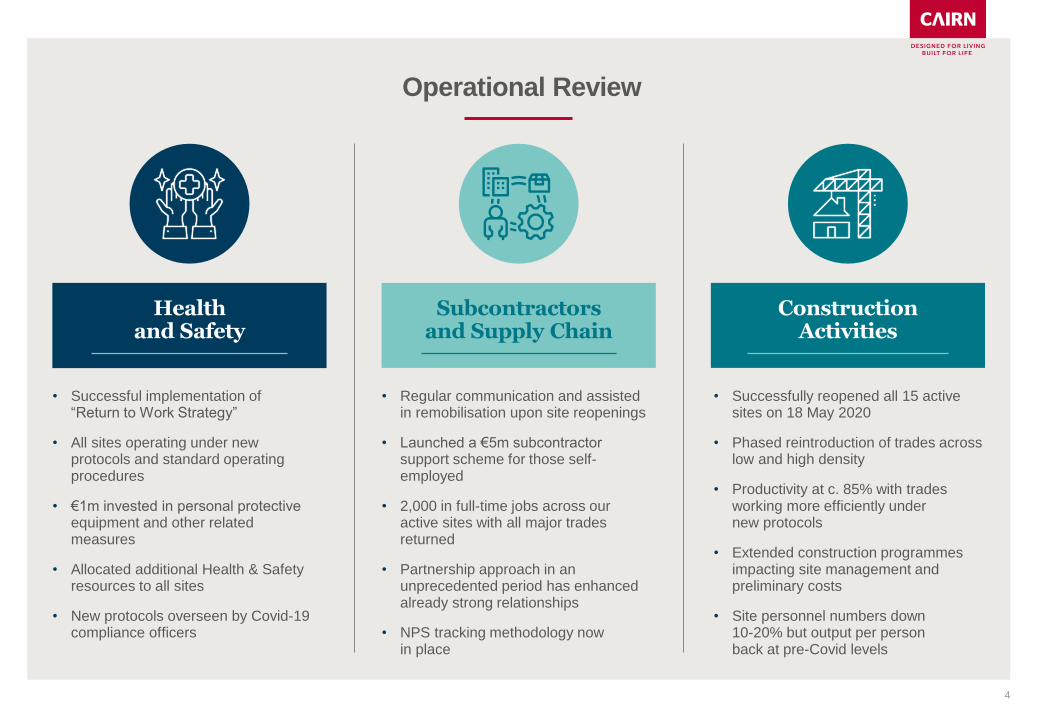
Operational Review
• Successful implementation of “Return to Work Strategy”
• All sites operating under new protocols and standard operating procedures
• €1m invested in personal protective equipment and other related measures
• Allocated additional Health & Safety resources to all sites
• New protocols overseen by Covid-19 compliance officers
• Regular communication and assisted in remobilisation upon site reopenings
• Launched a €5m subcontractor support scheme for those self-employed
• 2,000 in full-time jobs across our active sites with all major trades returned
• Partnership approach in an unprecedented period has enhanced already strong relationships
• NPS tracking methodology now in place
Health and Safety
Subcontractors and Supply Chain
Construction Activities
• Successfully reopened all 15 active sites on 18 May 2020
• Phased reintroduction of trades across low and high density
• Productivity at c. 85% with trades working more efficiently under new protocols
• Extended construction programmes impacting site management and preliminary costs
• Site personnel numbers down 10-20% but output per person back at pre-Covid levels
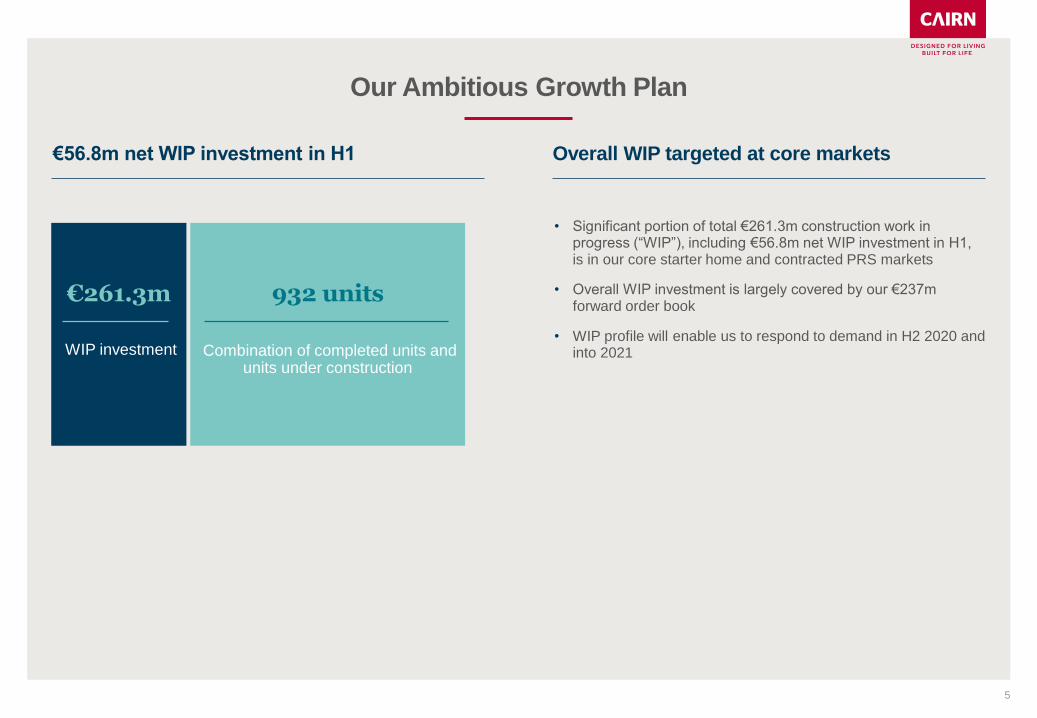
Our Ambitious Growth Plan
5
€56.8m net WIP investment in H1 Overall WIP targeted at core markets
• Significant portion of total €261.3m construction work in progress (“WIP”), including €56.8m net WIP investment in H1, is in our core starter home and contracted PRS markets
• Overall WIP investment is largely covered by our €237m forward order book
• WIP profile will enable us to respond to demand in H2 2020 and into 2021
€261.3m
WIP investment
932 units
Combination of completed units and units under construction
Strengthening 2020 and 2021 Closed and Forward Order Book
6
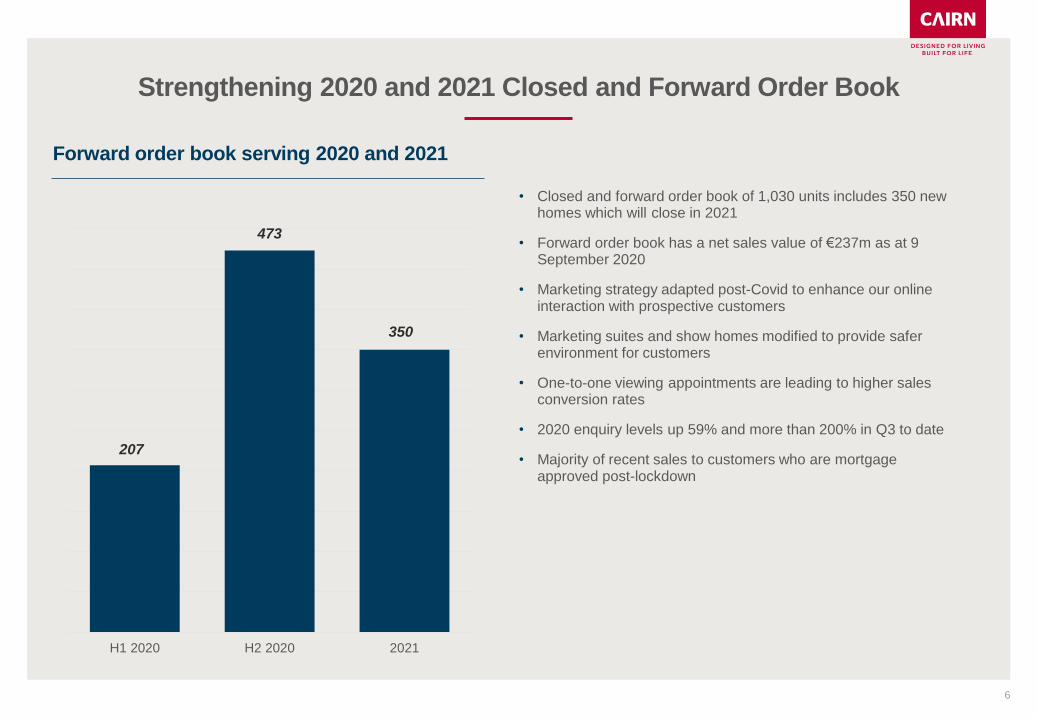
• Closed and forward order book of 1,030 units includes 350 new homes which will close in 2021
• Forward order book has a net sales value of €237m as at 9 September 2020
• Marketing strategy adapted post-Covid to enhance our online interaction with prospective customers
• Marketing suites and show homes modified to provide safer environment for customers
• One-to-one viewing appointments are leading to higher sales conversion rates
• 2020 enquiry levels up 59% and more than 200% in Q3 to date
• Majority of recent sales to customers who are mortgage approved post-lockdown
Forward order book serving 2020 and 2021
H1 2020 H2 2020 2021
207
350
473
First Time Buyer Market Trends
7
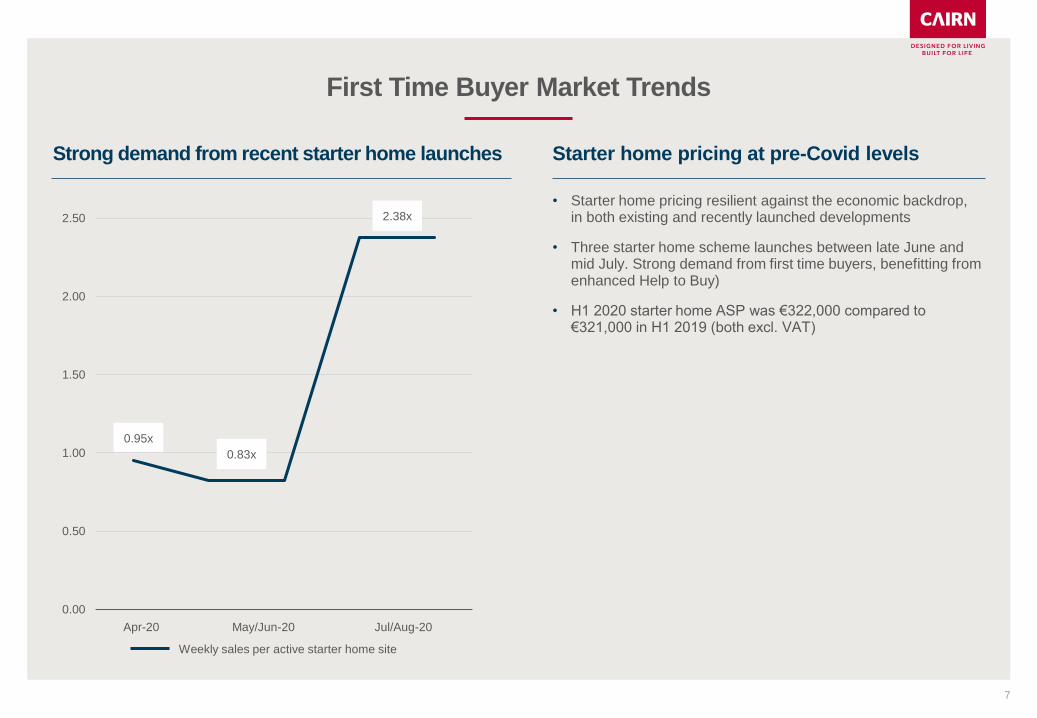
Strong demand from recent starter home launches
• Starter home pricing resilient against the economic backdrop, in both existing and recently launched developments
• Three starter home scheme launches between late June and mid July. Strong demand from first time buyers, benefitting from enhanced Help to Buy)
• H1 2020 starter home ASP was €322,000 compared to €321,000 in H1 2019 (both excl. VAT)
Weekly sales per active starter home site
Starter home pricing at pre-Covid levels
0.95x
0.00
0.50
1.00
1.50
2.00
2.50
Apr-20 May-20 Jun-20 Jul-20 Aug-20Apr-20 May/Jun-20 Jul/Aug-20
2.38x
0.83x
8
02Financial Results & Guidance
Gandon Park, Lucan
9
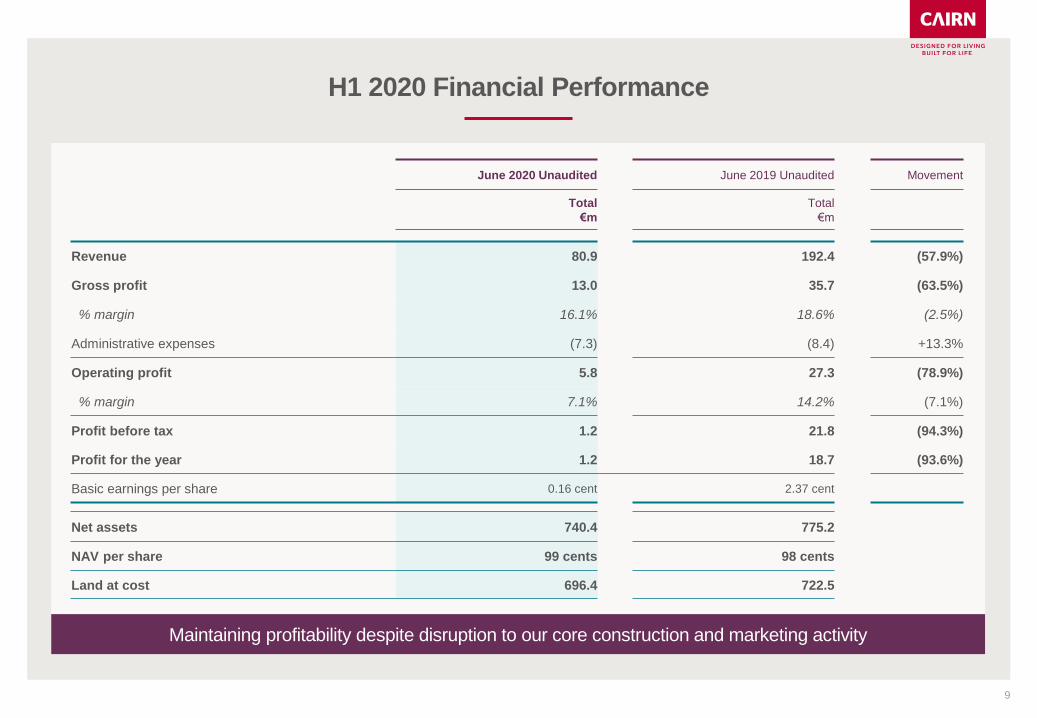
H1 2020 Financial Performance
Maintaining profitability despite disruption to our core construction and marketing activity
June 2020 Unaudited June 2019 Unaudited Movement
Total
€m
Total
€m
Revenue 80.9 192.4 (57.9%)
Gross profit 13.0 35.7 (63.5%)
% margin 16.1% 18.6% (2.5%)
Administrative expenses (7.3) (8.4) +13.3%
Operating profit 5.8 27.3 (78.9%)
% margin 7.1% 14.2% (7.1%)
Profit before tax 1.2 21.8 (94.3%)
Profit for the year 1.2 18.7 (93.6%)
Basic earnings per share 0.16 cent 2.37 cent
Net assets 740.4 775.2
NAV per share 99 cents 98 cents
Land at cost 696.4 722.5
10
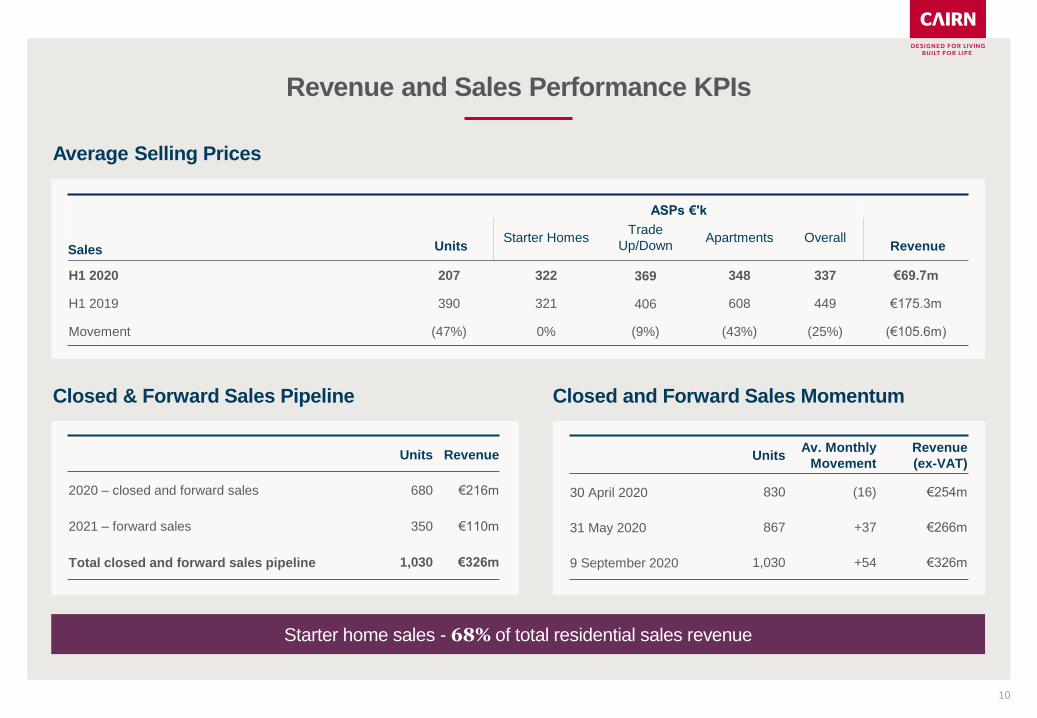
Revenue and Sales Performance KPIs
Starter home sales - 68% of total residential sales revenue
Average Selling Prices
Sales Units
ASPs €'k
Revenue Starter Homes
Trade
Up/DownApartments Overall
H1 2020 207 322 369 348 337 €69.7m
H1 2019 390 321 406 608 449 €175.3m
Movement (47%) 0% (9%) (43%) (25%) (€105.6m)
Closed & Forward Sales Pipeline
Units Revenue
2020 – closed and forward sales 680 €216m
2021 – forward sales 350 €110m
Total closed and forward sales pipeline 1,030 €326m
UnitsAv. Monthly
Movement
Revenue
(ex-VAT)
30 April 2020 830 (16) €254m
31 May 2020 867 +37 €266m
9 September 2020 1,030 +54 €326m
Closed and Forward Sales Momentum
11
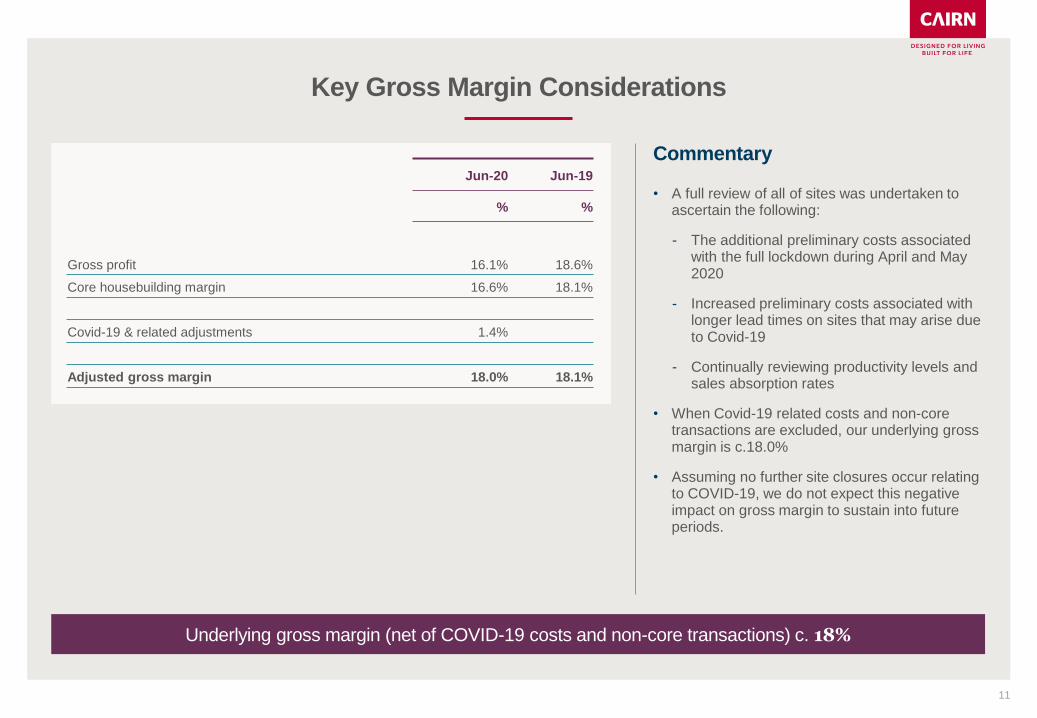
Key Gross Margin Considerations
Commentary
• A full review of all of sites was undertaken to ascertain the following:
- The additional preliminary costs associated with the full lockdown during April and May 2020
- Increased preliminary costs associated with longer lead times on sites that may arise due to Covid-19
- Continually reviewing productivity levels and sales absorption rates
• When Covid-19 related costs and non-core transactions are excluded, our underlying gross margin is c.18.0%
• Assuming no further site closures occur relating to COVID-19, we do not expect this negative impact on gross margin to sustain into future periods.
Jun-20 Jun-19
% %
Gross profit 16.1% 18.6%
Core housebuilding margin 16.6% 18.1%
Covid-19 & related adjustments 1.4%
Adjusted gross margin 18.0% 18.1%
Underlying gross margin (net of COVID-19 costs and non-core transactions) c. 18%
12
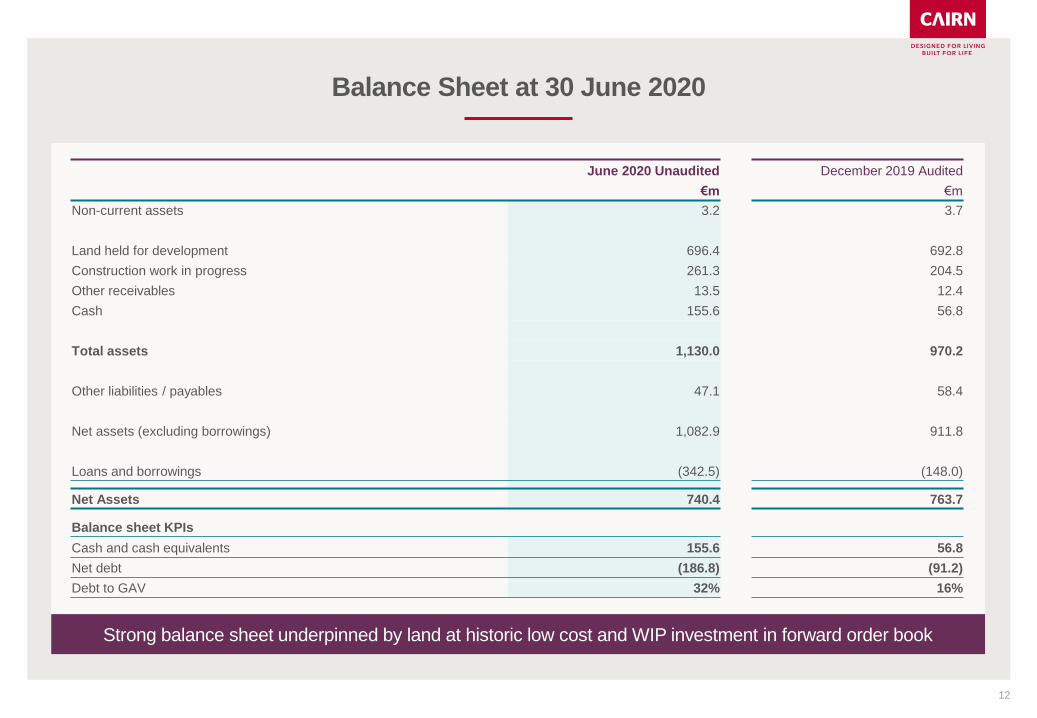
Balance Sheet at 30 June 2020
June 2020 Unaudited December 2019 Audited
€m €m
Non-current assets 3.2 3.7
Land held for development 696.4 692.8
Construction work in progress 261.3 204.5
Other receivables 13.5 12.4
Cash 155.6 56.8
Total assets 1,130.0 970.2
Other liabilities / payables 47.1 58.4
Net assets (excluding borrowings) 1,082.9 911.8
Loans and borrowings (342.5) (148.0)
Net Assets 740.4 763.7
Balance sheet KPIs
Cash and cash equivalents 155.6 56.8
Net debt (186.8) (91.2)
Debt to GAV 32% 16%
Strong balance sheet underpinned by land at historic low cost and WIP investment in forward order book
13
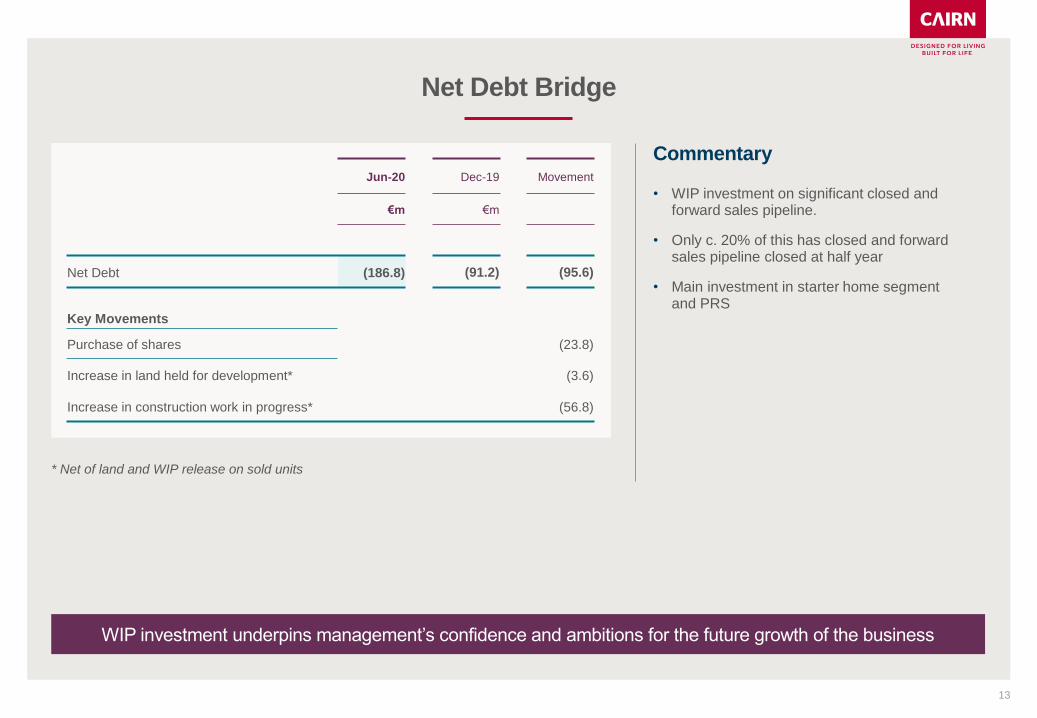
Net Debt Bridge
Commentary
• WIP investment on significant closed and forward sales pipeline.
• Only c. 20% of this has closed and forward sales pipeline closed at half year
• Main investment in starter home segment and PRS
WIP investment underpins management’s confidence and ambitions for the future growth of the business
Jun-20 Dec-19 Movement
€m €m
Net Debt (186.8) (91.2) (95.6)
Key Movements
Purchase of shares (23.8)
Increase in land held for development* (3.6)
Increase in construction work in progress* (56.8)
* Net of land and WIP release on sold units
14
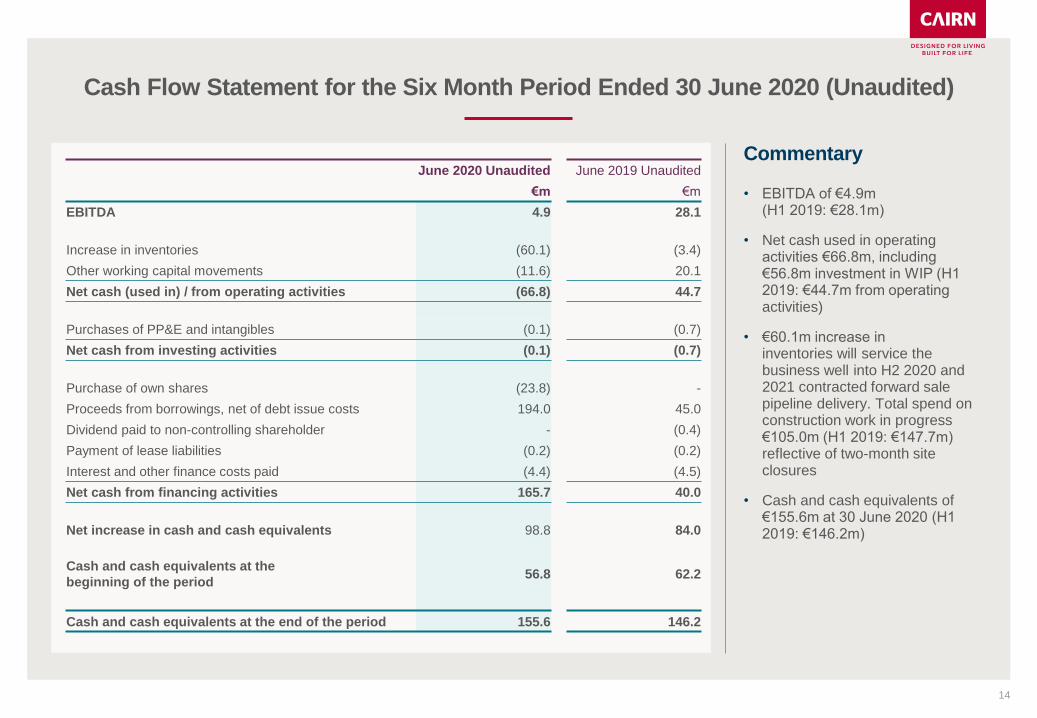
Cash Flow Statement for the Six Month Period Ended 30 June 2020 (Unaudited)
June 2020 Unaudited June 2019 Unaudited
€m €m
EBITDA 4.9 28.1
Increase in inventories (60.1) (3.4)
Other working capital movements (11.6) 20.1
Net cash (used in) / from operating activities (66.8) 44.7
Purchases of PP&E and intangibles (0.1) (0.7)
Net cash from investing activities (0.1) (0.7)
Purchase of own shares (23.8) -
Proceeds from borrowings, net of debt issue costs 194.0 45.0
Dividend paid to non-controlling shareholder - (0.4)
Payment of lease liabilities (0.2) (0.2)
Interest and other finance costs paid (4.4) (4.5)
Net cash from financing activities 165.7 40.0
Net increase in cash and cash equivalents 98.8 84.0
Cash and cash equivalents at the
beginning of the period56.8 62.2
Cash and cash equivalents at the end of the period 155.6 146.2
Commentary
• EBITDA of €4.9m (H1 2019: €28.1m)
• Net cash used in operating activities €66.8m, including €56.8m investment in WIP (H1 2019: €44.7m from operating activities)
• €60.1m increase in inventories will service the business well into H2 2020 and 2021 contracted forward sale pipeline delivery. Total spend on construction work in progress €105.0m (H1 2019: €147.7m) reflective of two-month site closures
• Cash and cash equivalents of €155.6m at 30 June 2020 (H1 2019: €146.2m)
15
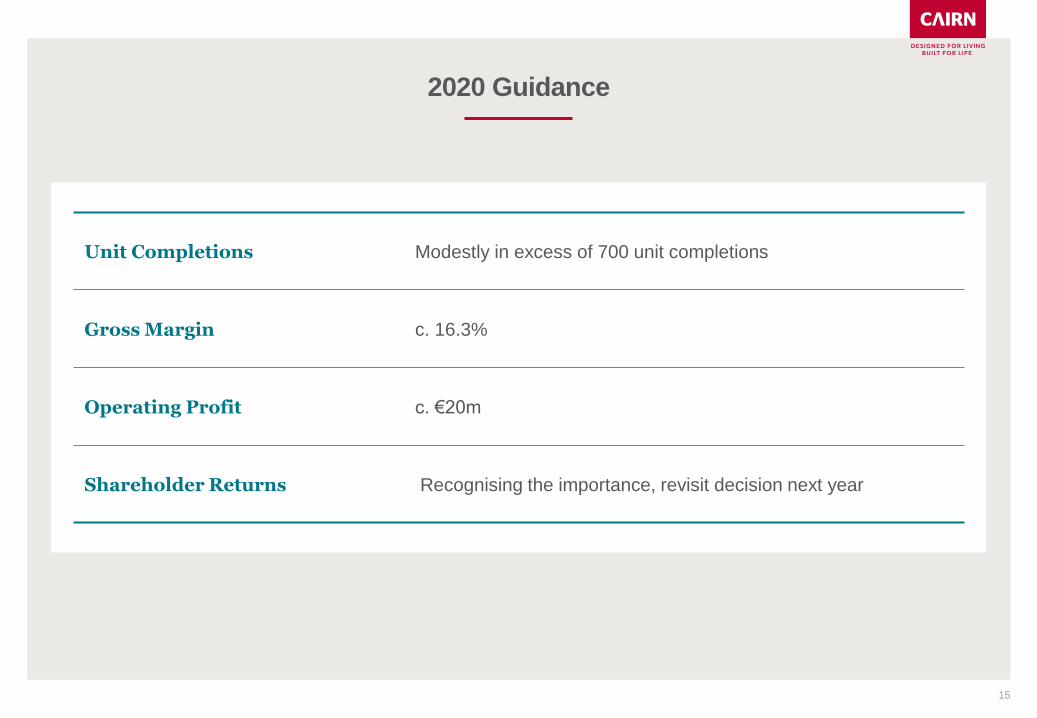
2020 Guidance
Unit Completions Modestly in excess of 700 unit completions
Gross Margin c. 16.3%
Operating Profit c. €20m
Shareholder Returns Recognising the importance, revisit decision next year
16
03Our Sustainability Agenda
Wildflower meadow, Mariavilla, Maynooth
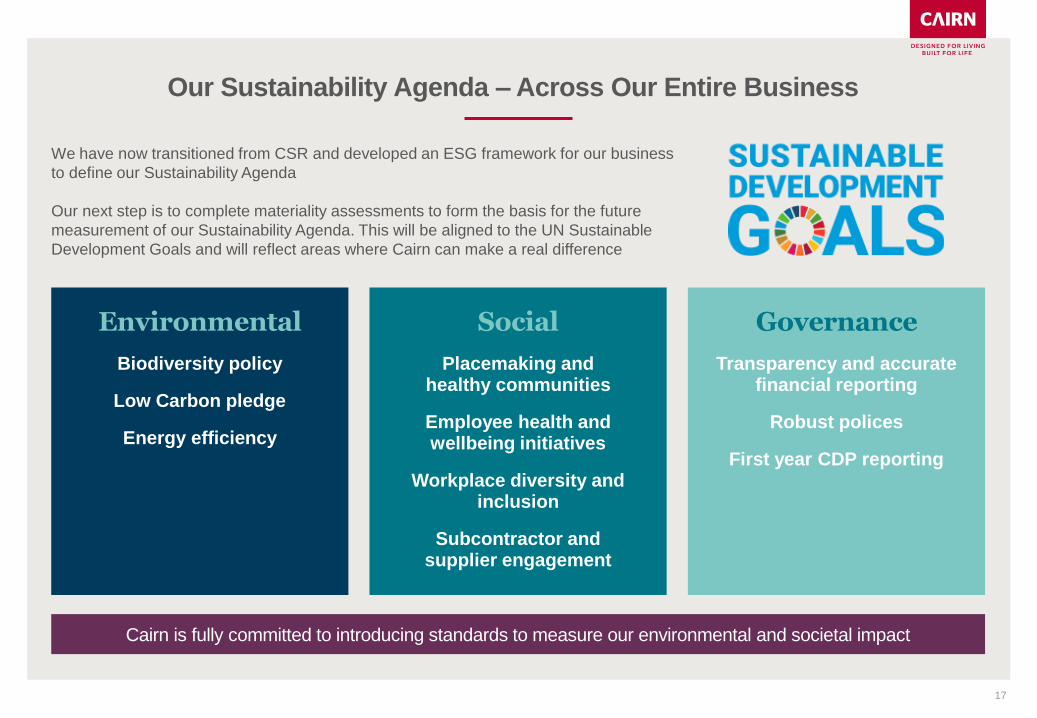
Our Sustainability Agenda –Across Our Entire Business
Cairn is fully committed to introducing standards to measure our environmental and societal impact
We have now transitioned from CSR and developed an ESG framework for our business
to define our Sustainability Agenda
Our next step is to complete materiality assessments to form the basis for the future
measurement of our Sustainability Agenda. This will be aligned to the UN Sustainable
Development Goals and will reflect areas where Cairn can make a real difference
Environmental
Biodiversity policy
Low Carbon pledge
Energy efficiency
Social
Placemaking and healthy communities
Employee health and wellbeing initiatives
Workplace diversity and inclusion
Subcontractor and supplier engagement
Governance
Transparency and accurate financial reporting
Robust polices
First year CDP reporting
17
18
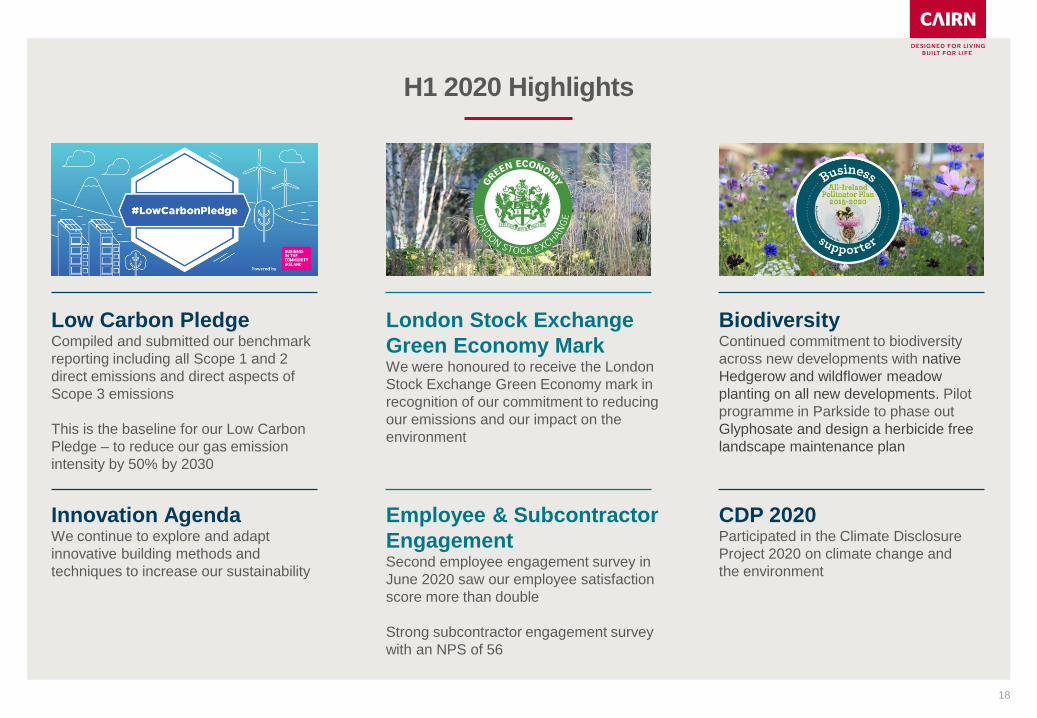
H1 2020 Highlights
Low Carbon PledgeCompiled and submitted our benchmark
reporting including all Scope 1 and 2
direct emissions and direct aspects of
Scope 3 emissions
This is the baseline for our Low Carbon
Pledge – to reduce our gas emission
intensity by 50% by 2030
BiodiversityContinued commitment to biodiversity
across new developments with native
Hedgerow and wildflower meadow
planting on all new developments. Pilot
programme in Parkside to phase out
Glyphosate and design a herbicide free
landscape maintenance plan
London Stock Exchange
Green Economy MarkWe were honoured to receive the London
Stock Exchange Green Economy mark in
recognition of our commitment to reducing
our emissions and our impact on the
environment
Employee & Subcontractor
EngagementSecond employee engagement survey in
June 2020 saw our employee satisfaction
score more than double
Strong subcontractor engagement survey
with an NPS of 56
CDP 2020Participated in the Climate Disclosure
Project 2020 on climate change and
the environment
Innovation AgendaWe continue to explore and adapt
innovative building methods and
techniques to increase our sustainability
19
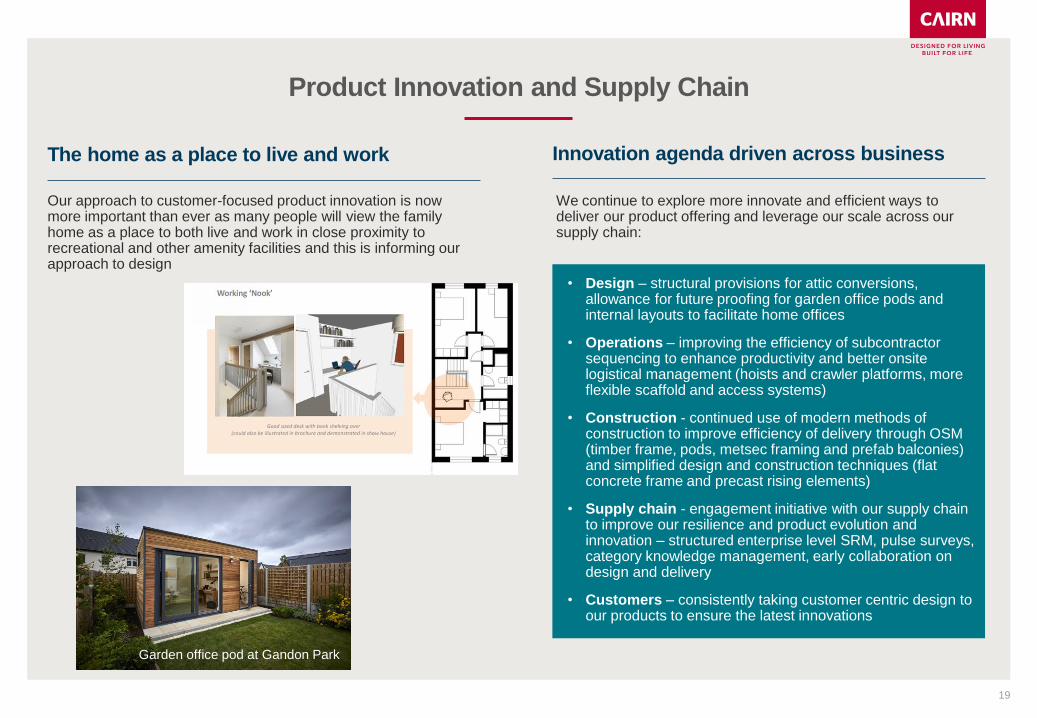
Product Innovation and Supply Chain
• Design – structural provisions for attic conversions, allowance for future proofing for garden office pods and internal layouts to facilitate home offices
• Operations – improving the efficiency of subcontractor sequencing to enhance productivity and better onsite logistical management (hoists and crawler platforms, more flexible scaffold and access systems)
• Construction - continued use of modern methods of construction to improve efficiency of delivery through OSM (timber frame, pods, metsec framing and prefab balconies) and simplified design and construction techniques (flat concrete frame and precast rising elements)
• Supply chain - engagement initiative with our supply chain to improve our resilience and product evolution and innovation – structured enterprise level SRM, pulse surveys, category knowledge management, early collaboration on design and delivery
• Customers – consistently taking customer centric design to our products to ensure the latest innovations
Innovation agenda driven across business
Garden office pod at Gandon Park
The home as a place to live and work
Our approach to customer-focused product innovation is now more important than ever as many people will view the family home as a place to both live and work in close proximity torecreational and other amenity facilities and this is informing our approach to design
We continue to explore more innovate and efficient ways to deliver our product offering and leverage our scale across our supply chain:
20
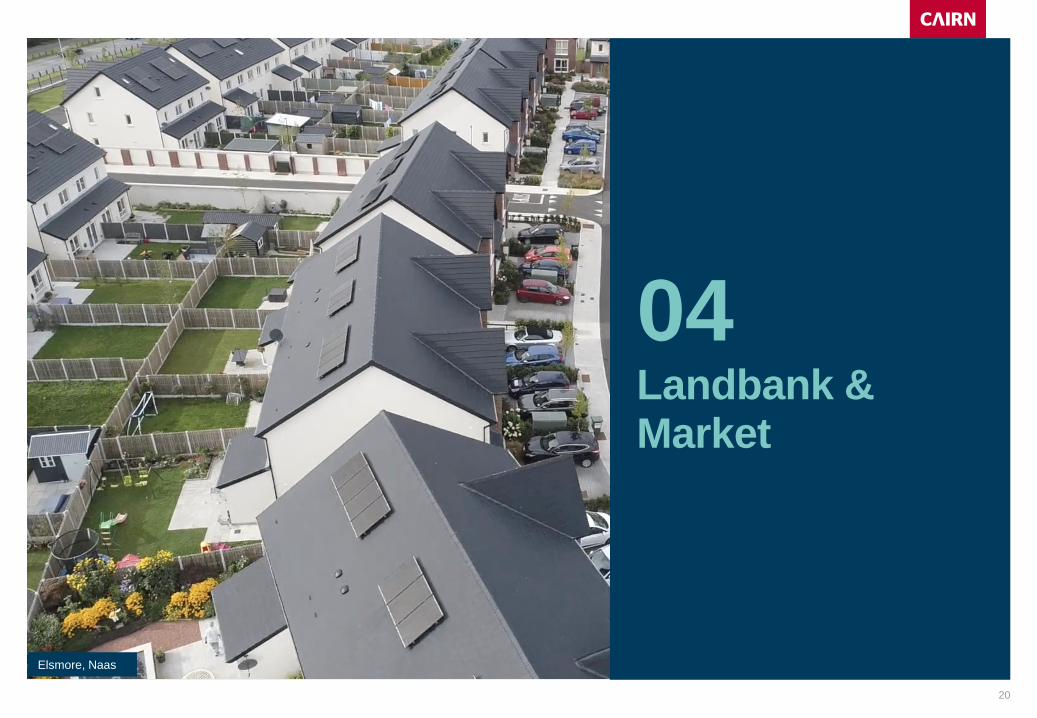
04Landbank & Market
Elsmore, Naas
21
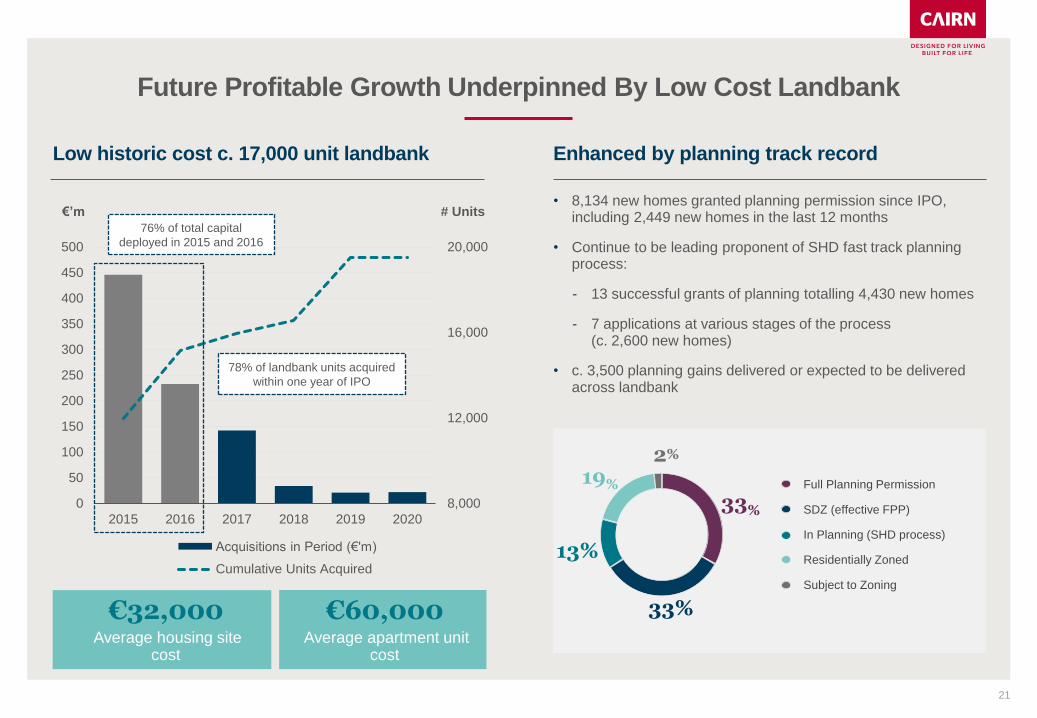
Future Profitable Growth Underpinned By Low Cost Landbank
Low historic cost c. 17,000 unit landbank
€’m # Units
8,000
12,000
16,000
20,000
0
50
100
150
200
250
300
350
400
450
500
2015 2016 2017 2018 2019 2020
Acquisitions in Period (€'m)
Cumulative Units Acquired
33%
33%
13%
19%
2%
Full Planning Permission
SDZ (effective FPP)
In Planning (SHD process)
Residentially Zoned
Subject to Zoning
Enhanced by planning track record
• 8,134 new homes granted planning permission since IPO, including 2,449 new homes in the last 12 months
• Continue to be leading proponent of SHD fast track planning process:
- 13 successful grants of planning totalling 4,430 new homes
- 7 applications at various stages of the process (c. 2,600 new homes)
• c. 3,500 planning gains delivered or expected to be delivered across landbank
78% of landbank units acquired
within one year of IPO
76% of total capital
deployed in 2015 and 2016
.€32,000Average housing site
cost
€60,000Average apartment unit
cost
22
Land Acquisitions – All Adjoining Existing Sites
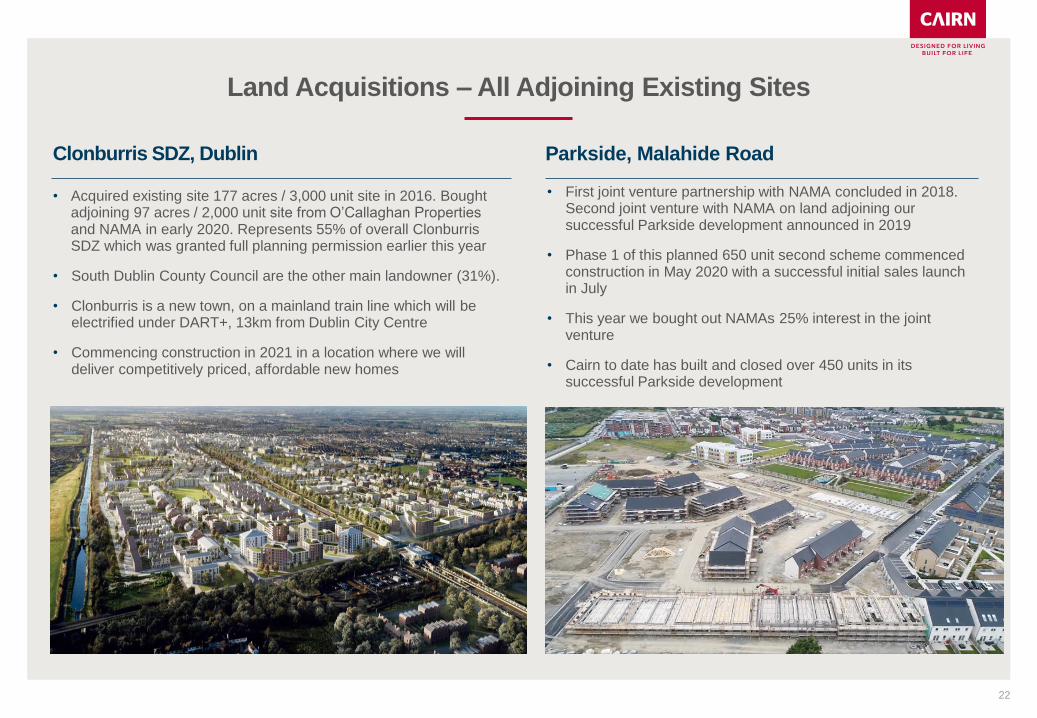
Clonburris SDZ, Dublin
• First joint venture partnership with NAMA concluded in 2018. Second joint venture with NAMA on land adjoining our successful Parkside development announced in 2019
• Phase 1 of this planned 650 unit second scheme commenced construction in May 2020 with a successful initial sales launch in July
• This year we bought out NAMAs 25% interest in the joint venture
• Cairn to date has built and closed over 450 units in its successful Parkside development
Parkside, Malahide Road
• Acquired existing site 177 acres / 3,000 unit site in 2016. Bought adjoining 97 acres / 2,000 unit site from O’Callaghan Properties and NAMA in early 2020. Represents 55% of overall ClonburrisSDZ which was granted full planning permission earlier this year
• South Dublin County Council are the other main landowner (31%).
• Clonburris is a new town, on a mainland train line which will be electrified under DART+, 13km from Dublin City Centre
• Commencing construction in 2021 in a location where we will deliver competitively priced, affordable new homes
23
Land Acquisition – Creating Shareholder Value
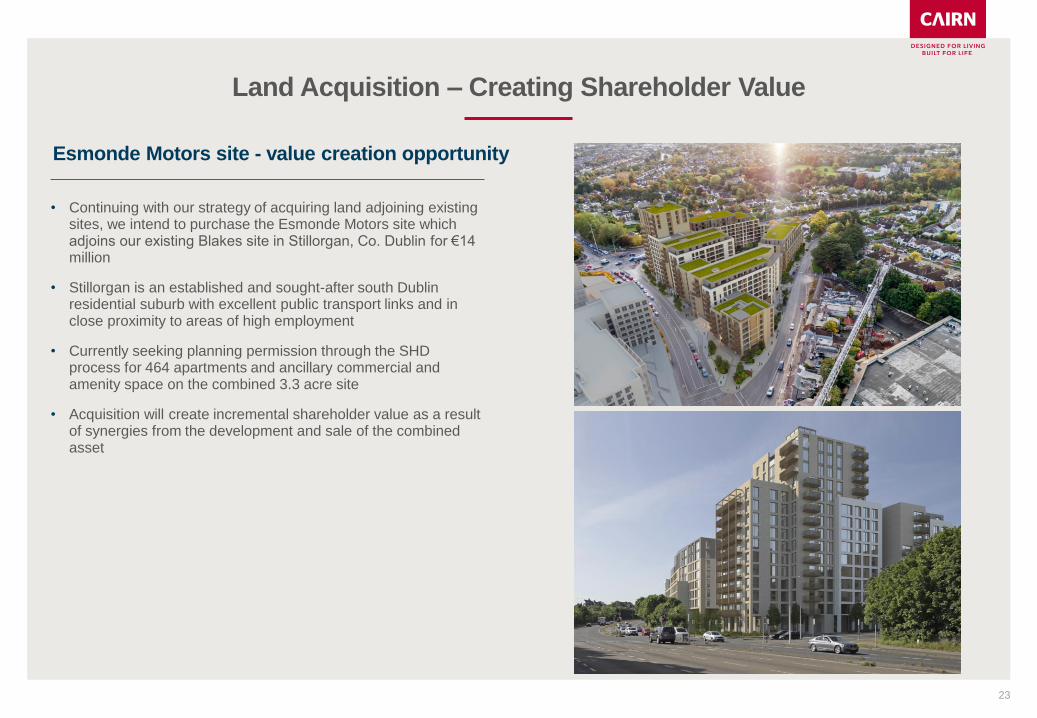
Esmonde Motors site - value creation opportunity
• Continuing with our strategy of acquiring land adjoining existing sites, we intend to purchase the Esmonde Motors site which adjoins our existing Blakes site in Stillorgan, Co. Dublin for €14 million
• Stillorgan is an established and sought-after south Dublin residential suburb with excellent public transport links and in close proximity to areas of high employment
• Currently seeking planning permission through the SHD process for 464 apartments and ancillary commercial and amenity space on the combined 3.3 acre site
• Acquisition will create incremental shareholder value as a result of synergies from the development and sale of the combined asset
24
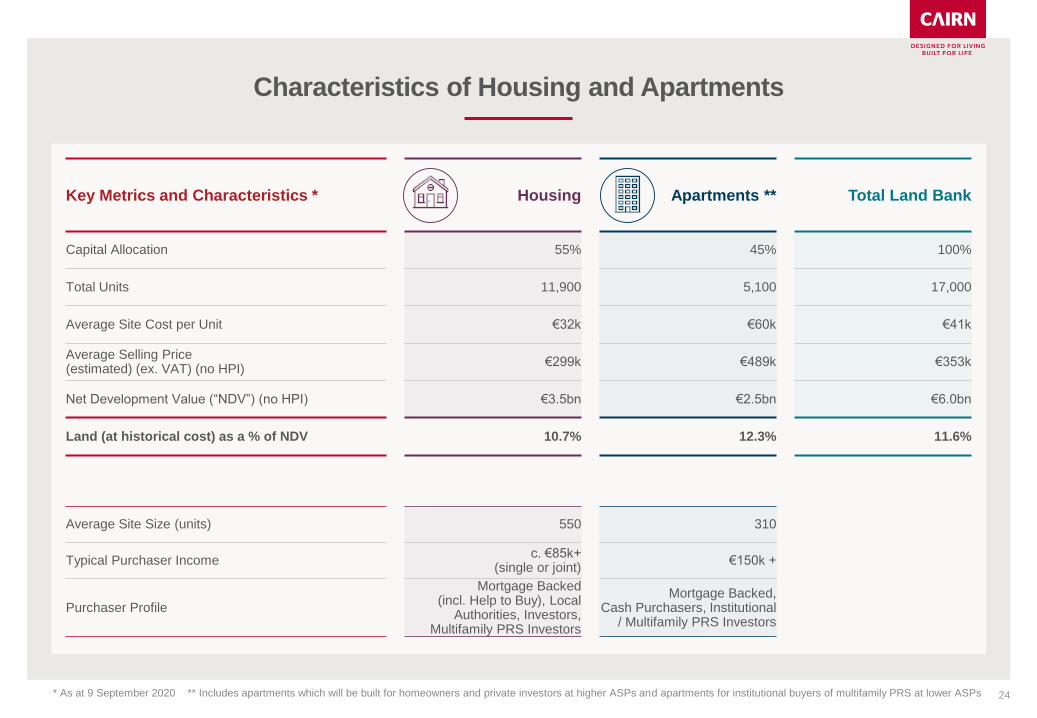
Characteristics of Housing and Apartments
Key Metrics and Characteristics * Housing Apartments ** Total Land Bank
Capital Allocation 55% 45% 100%
Total Units 11,900 5,100 17,000
Average Site Cost per Unit €32k €60k €41k
Average Selling Price (estimated) (ex. VAT) (no HPI)
€299k €489k €353k
Net Development Value (“NDV”) (no HPI) €3.5bn €2.5bn €6.0bn
Land (at historical cost) as a % of NDV 10.7% 12.3% 11.6%
Average Site Size (units) 550 310
Typical Purchaser Incomec. €85k+
(single or joint)€150k +
Purchaser Profile
Mortgage Backed (incl. Help to Buy), Local
Authorities, Investors, Multifamily PRS Investors
Mortgage Backed, Cash Purchasers, Institutional
/ Multifamily PRS Investors
* As at 9 September 2020 ** Includes apartments which will be built for homeowners and private investors at higher ASPs and apartments for institutional buyers of multifamily PRS at lower ASPs
25
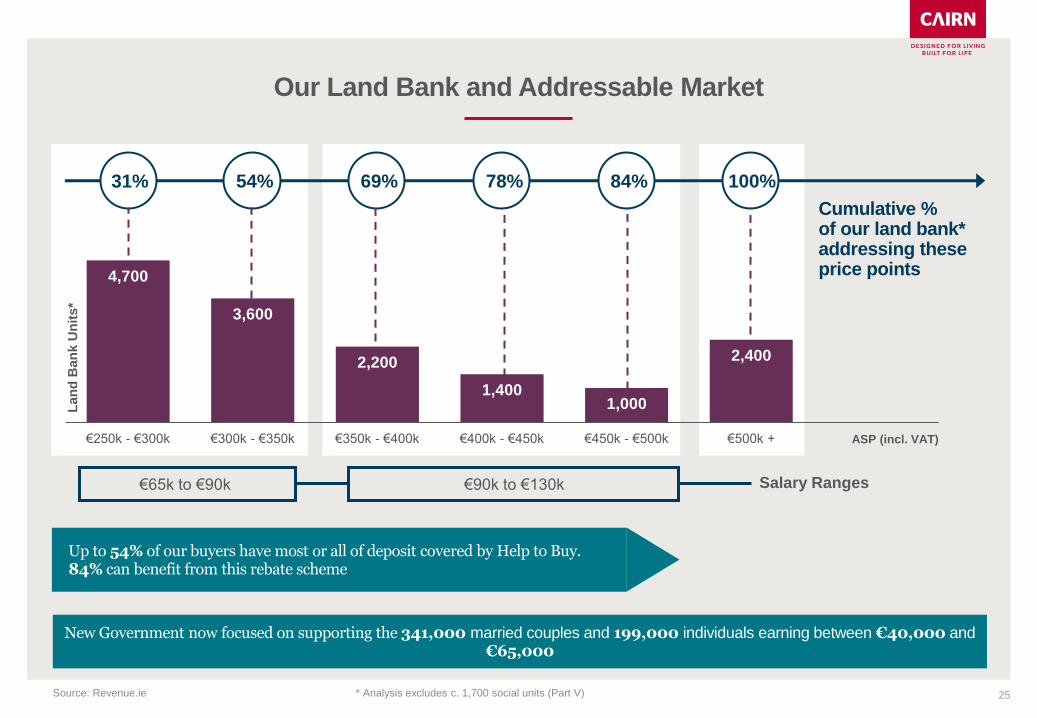
Our Land Bank and Addressable Market
* Analysis excludes c. 1,700 social units (Part V)
Cumulative % of our land bank* addressing these price points
ASP (incl. VAT)
Source: Revenue.ie
4,700
3,600
2,200
1,4001,000
2,400
€250k - €300k €300k - €350k €350k - €400k €400k - €450k €450k - €500k €500k +
Lan
d B
an
k U
nit
s*
New Government now focused on supporting the 341,000 married couples and 199,000 individuals earning between €40,000 and €65,000
84% 100%31% 54% 78%69%
Up to 54% of our buyers have most or all of deposit covered by Help to Buy. 84% can benefit from this rebate scheme
€65k to €90k €90k to €130k Salary Ranges
26
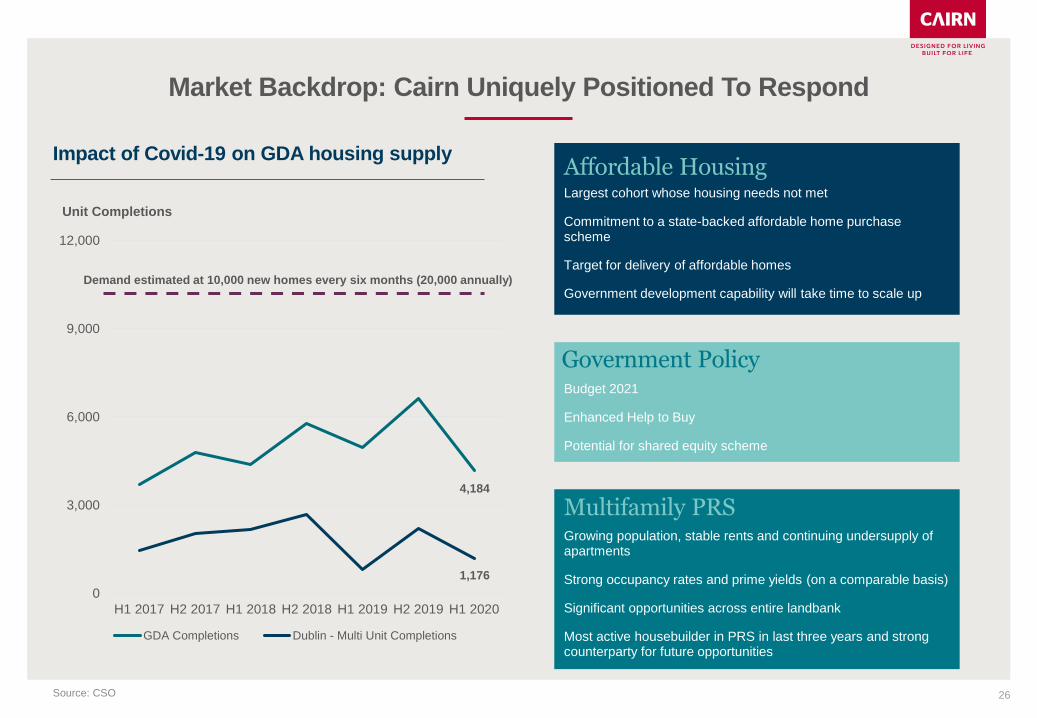
Market Backdrop: Cairn Uniquely Positioned To Respond
0
3,000
6,000
9,000
12,000
H1 2017 H2 2017 H1 2018 H2 2018 H1 2019 H2 2019 H1 2020
GDA Completions Dublin - Multi Unit Completions
Impact of Covid-19 on GDA housing supply
Unit Completions
4,184
1,176
Largest cohort whose housing needs not met
Commitment to a state-backed affordable home purchase scheme
Target for delivery of affordable homes
Government development capability will take time to scale up
Budget 2021
Enhanced Help to Buy
Potential for shared equity scheme
Growing population, stable rents and continuing undersupply of apartments
Strong occupancy rates and prime yields (on a comparable basis)
Significant opportunities across entire landbank
Most active housebuilder in PRS in last three years and strong counterparty for future opportunities
Government Policy
Multifamily PRS
Affordable Housing
Source: CSO
Demand estimated at 10,000 new homes every six months (20,000 annually)
27
05Outlook
Mariavilla, Maynooth
28
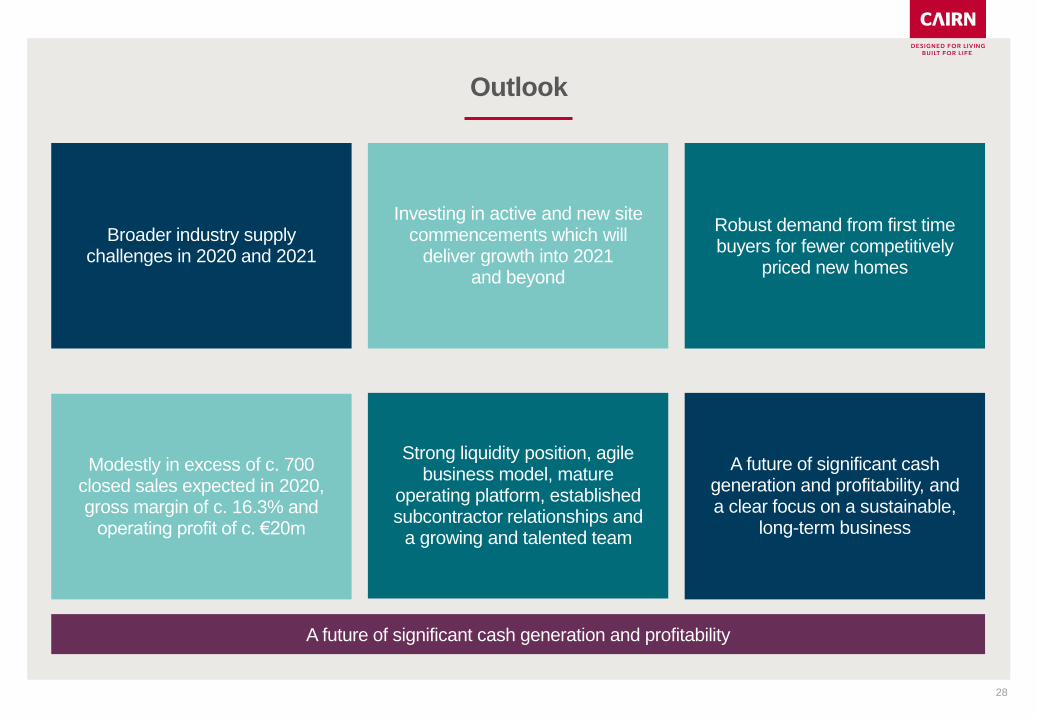
Outlook
Modestly in excess of c. 700 closed sales expected in 2020, gross margin of c. 16.3% and
operating profit of c. €20m
Investing in active and new site commencements which will
deliver growth into 2021 and beyond
Broader industry supply challenges in 2020 and 2021
A future of significant cash generation and profitability, and a clear focus on a sustainable,
long-term business
Robust demand from first time buyers for fewer competitively
priced new homes
Strong liquidity position, agile business model, mature
operating platform, established subcontractor relationships and
a growing and talented team
A future of significant cash generation and profitability
29
06Appendices
Oak Park, Naas
30
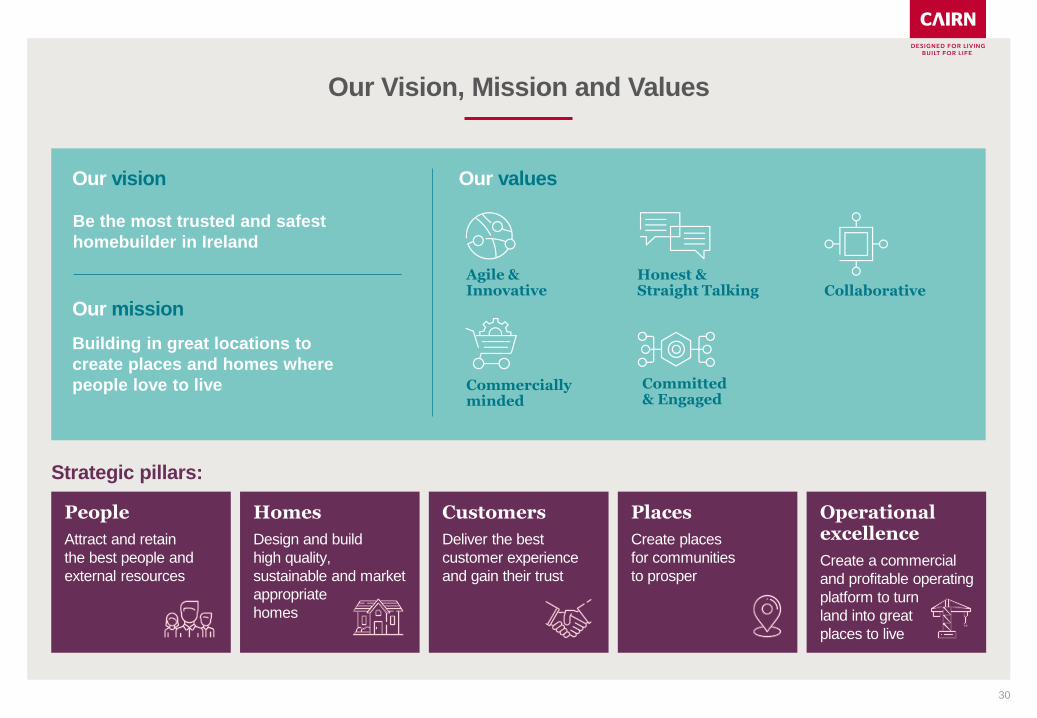
Our Vision, Mission and Values
Be the most trusted and safest
homebuilder in Ireland
Our vision
Our mission
Building in great locations to
create places and homes where
people love to live
Collaborative
Commerciallyminded
Honest &Straight Talking
Agile &Innovative
Committed & Engaged
Our values
Strategic pillars:
People
Attract and retain
the best people and
external resources
Operational excellence
Create a commercial
and profitable operating
platform to turn
land into great
places to live
Places
Create places
for communities
to prosper
Customers
Deliver the best
customer experience
and gain their trust
Homes
Design and build
high quality,
sustainable and market
appropriate
homes
31
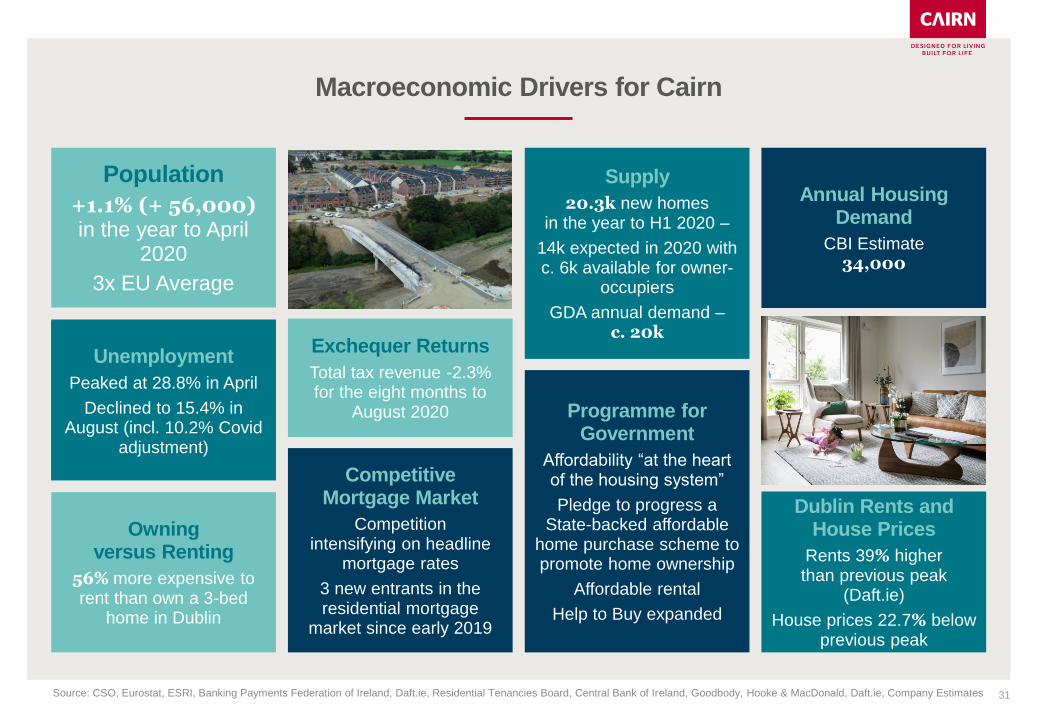
Macroeconomic Drivers for Cairn
CompetitiveMortgage Market
Competition intensifying on headline
mortgage rates
3 new entrants in the residential mortgage
market since early 2019
Owning versus Renting
56% more expensive to rent than own a 3-bed
home in Dublin
Unemployment Peaked at 28.8% in AprilDeclined to 16.7% in July
(incl. 11.7% on PUP)
Population
+1.1% (+ 56,000) in the year to April
2020
3x EU Average
Supply
20.3k new homes in the year to H1 2020 –
14k expected in 2020 with c. 6k available for owner-
occupiers
GDA annual demand –c. 20k
Dublin Rents and House Prices
Rents 39% higher than previous peak
(Daft.ie)
House prices 22.7% belowprevious peak
Annual Housing Demand
CBI Estimate34,000
Exchequer Returns
Total tax revenue -2.3% for the eight months to
August 2020 Programme for Government
Affordability “at the heart of the housing system”
Pledge to progress a State-backed affordable
home purchase scheme to promote home ownership
Affordable rental
Help to Buy expanded
Source: CSO, Eurostat, ESRI, Banking Payments Federation of Ireland, Daft.ie, Residential Tenancies Board, Central Bank of Ireland, Goodbody, Hooke & MacDonald, Daft.ie, Company Estimates
Unemployment
Peaked at 28.8% in April
Declined to 15.4% in August (incl. 10.2% Covid
adjustment)
32
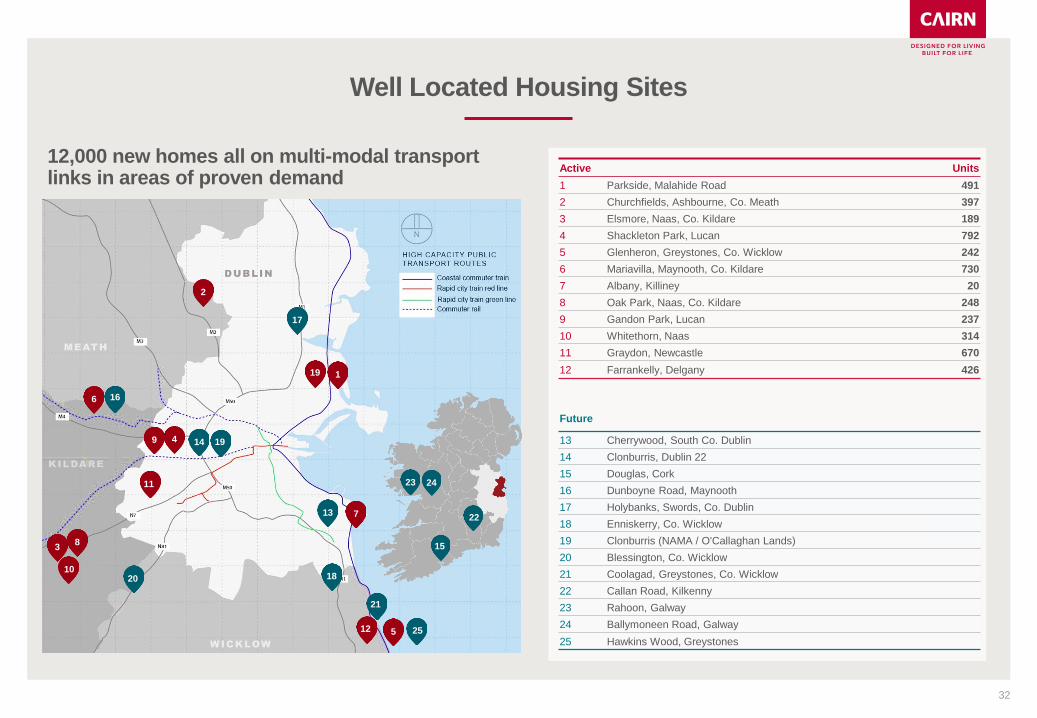
Well Located Housing Sites
12,000 new homes all on multi-modal transport links in areas of proven demand
1
0
1
1
1
3
1
6
2
38
5
4
7
9 14
13
21
18
22
2423
17
19
18
11
12
15
16
19
20
25
10
Active Units
1 Parkside, Malahide Road 491
2 Churchfields, Ashbourne, Co. Meath 397
3 Elsmore, Naas, Co. Kildare 189
4 Shackleton Park, Lucan 792
5 Glenheron, Greystones, Co. Wicklow 242
6 Mariavilla, Maynooth, Co. Kildare 730
7 Albany, Killiney 20
8 Oak Park, Naas, Co. Kildare 248
9 Gandon Park, Lucan 237
10 Whitethorn, Naas 314
11 Graydon, Newcastle 670
12 Farrankelly, Delgany 426
Future
13 Cherrywood, South Co. Dublin
14 Clonburris, Dublin 22
15 Douglas, Cork
16 Dunboyne Road, Maynooth
17 Holybanks, Swords, Co. Dublin
18 Enniskerry, Co. Wicklow
19 Clonburris (NAMA / O'Callaghan Lands)
20 Blessington, Co. Wicklow
21 Coolagad, Greystones, Co. Wicklow
22 Callan Road, Kilkenny
23 Rahoon, Galway
24 Ballymoneen Road, Galway
25 Hawkins Wood, Greystones
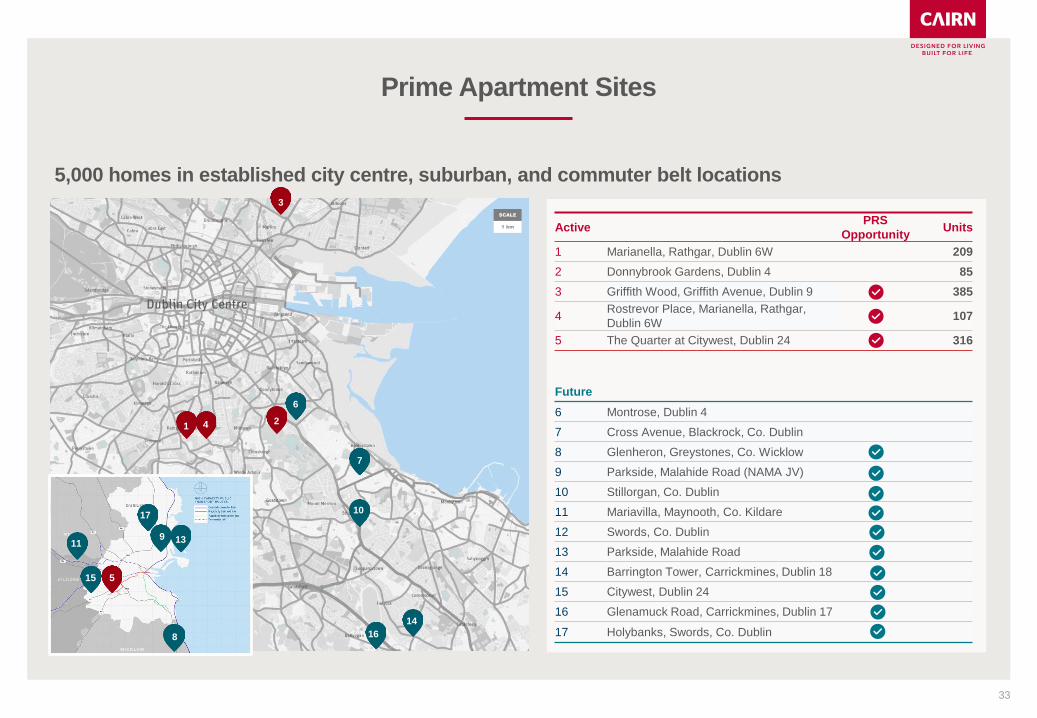
Active PRS
OpportunityUnits
1 Marianella, Rathgar, Dublin 6W 209
2 Donnybrook Gardens, Dublin 4 85
3 Griffith Wood, Griffith Avenue, Dublin 9 385
4Rostrevor Place, Marianella, Rathgar,
Dublin 6W107
5 The Quarter at Citywest, Dublin 24 316
Future
6 Montrose, Dublin 4
7 Cross Avenue, Blackrock, Co. Dublin
8 Glenheron, Greystones, Co. Wicklow
9 Parkside, Malahide Road (NAMA JV)
10 Stillorgan, Co. Dublin
11 Mariavilla, Maynooth, Co. Kildare
12 Swords, Co. Dublin
13 Parkside, Malahide Road
14 Barrington Tower, Carrickmines, Dublin 18
15 Citywest, Dublin 24
16 Glenamuck Road, Carrickmines, Dublin 17
17 Holybanks, Swords, Co. Dublin
33
Prime Apartment Sites
1 km
SCALE
5,000 homes in established city centre, suburban, and commuter belt locations
12
6
17
16
14
9
10
11 139
4
5
3
15
7
8
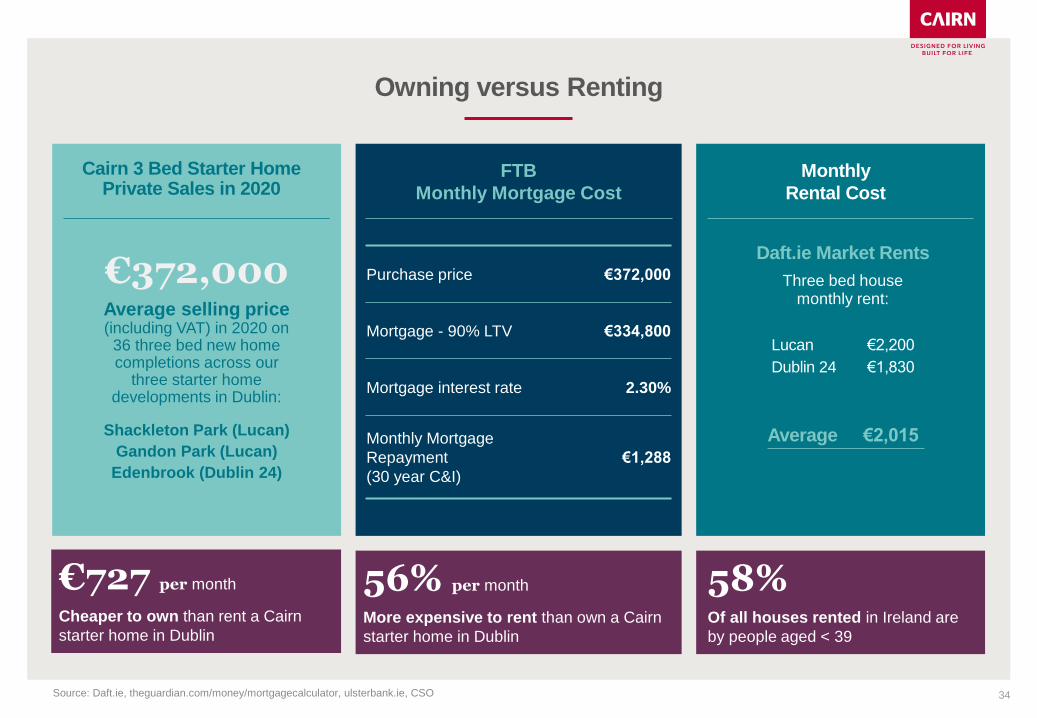
Cairn 3 Bed Starter Home Private Sales in 2020
FTB
Monthly Mortgage Cost
Monthly
Rental Cost
34
Owning versus Renting
Source: Daft.ie, theguardian.com/money/mortgagecalculator, ulsterbank.ie, CSO
€372,000Average selling price (including VAT) in 2020 on
36 three bed new home completions across our
three starter home developments in Dublin:
Shackleton Park (Lucan)
Gandon Park (Lucan)
Edenbrook (Dublin 24)
Daft.ie Market Rents
Three bed housemonthly rent:
Lucan €2,200
Dublin 24 €1,830
Average €2,015
Purchase price €372,000
Mortgage - 90% LTV €334,800
Mortgage interest rate 2.30%
Monthly Mortgage
Repayment
(30 year C&I)
€1,288
€727 per month
Cheaper to own than rent a Cairn
starter home in Dublin
56% per month
More expensive to rent than own a Cairn
starter home in Dublin
58%Of all houses rented in Ireland are
by people aged < 39
35
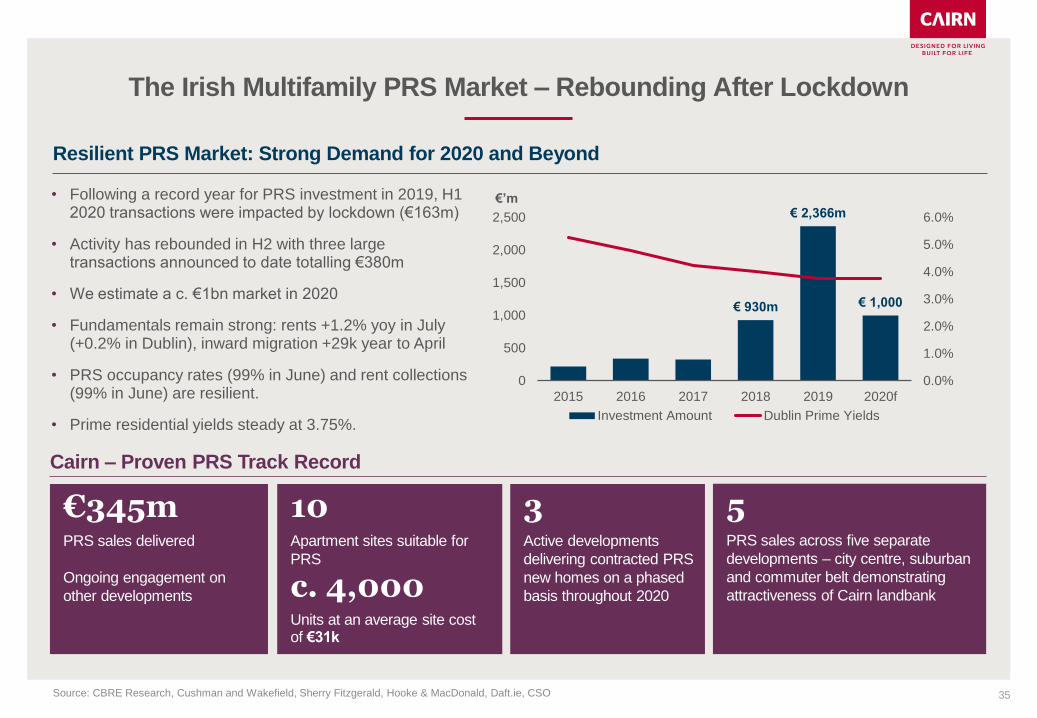
The Irish Multifamily PRS Market – Rebounding After Lockdown
Cairn – Proven PRS Track Record
• Following a record year for PRS investment in 2019, H1 2020 transactions were impacted by lockdown (€163m)
• Activity has rebounded in H2 with three large transactions announced to date totalling €380m
• We estimate a c. €1bn market in 2020
• Fundamentals remain strong: rents +1.2% yoy in July (+0.2% in Dublin), inward migration +29k year to April
• PRS occupancy rates (99% in June) and rent collections (99% in June) are resilient.
• Prime residential yields steady at 3.75%.
Resilient PRS Market: Strong Demand for 2020 and Beyond
Source: CBRE Research, Cushman and Wakefield, Sherry Fitzgerald, Hooke & MacDonald, Daft.ie, CSO
3Active developments
delivering contracted PRS
new homes on a phased
basis throughout 2020
5PRS sales across five separate
developments – city centre, suburban
and commuter belt demonstrating
attractiveness of Cairn landbank
€345mPRS sales delivered
Ongoing engagement on
other developments
10Apartment sites suitable for
PRS
c. 4,000Units at an average site cost of €31k
€ 930m
€ 2,366m
€ 1,000
0.0%
1.0%
2.0%
3.0%
4.0%
5.0%
6.0%
0
500
1,000
1,500
2,000
2,500
2015 2016 2017 2018 2019 2020f
Investment Amount Dublin Prime Yields
€’m
36
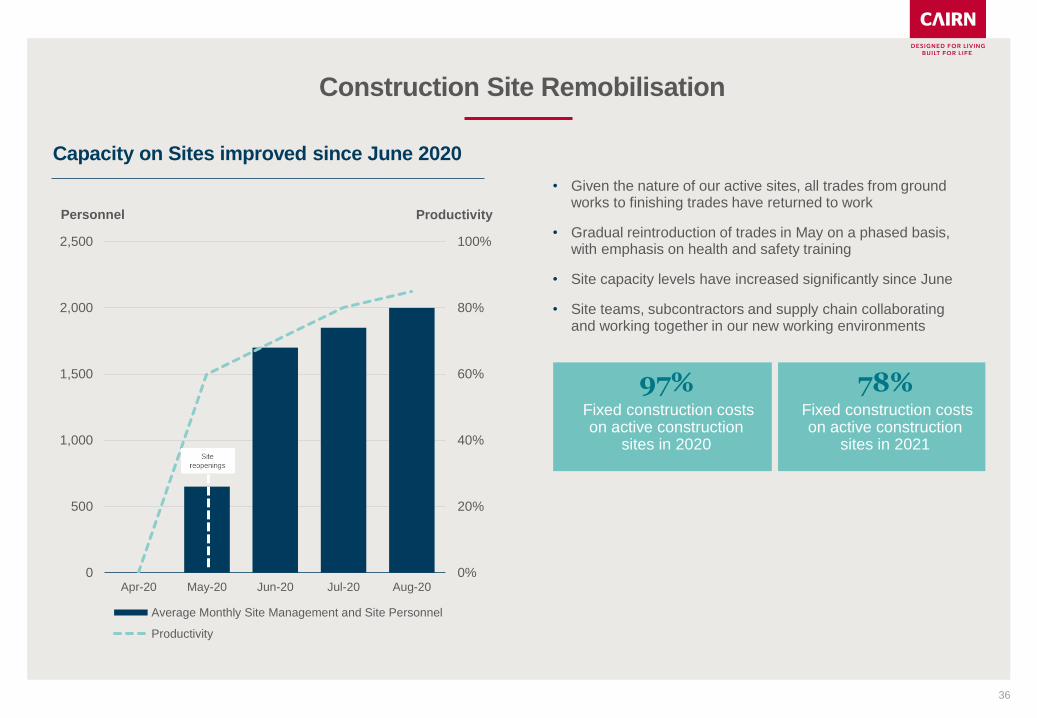
Construction Site Remobilisation
• Given the nature of our active sites, all trades from ground works to finishing trades have returned to work
• Gradual reintroduction of trades in May on a phased basis, with emphasis on health and safety training
• Site capacity levels have increased significantly since June
• Site teams, subcontractors and supply chain collaborating and working together in our new working environments
0%
20%
40%
60%
80%
100%
0
500
1,000
1,500
2,000
2,500
Apr-20 May-20 Jun-20 Jul-20 Aug-20
Average Monthly Site Management and Site Personnel
Productivity
Capacity on Sites improved since June 2020
Personnel Productivity
.97%Fixed construction costson active construction
sites in 2020
78%Fixed construction costs on active construction
sites in 2021
-
5,000
10,000
15,000
20,000
25,000
1970
1977
1984
1991
1998
2005
2012
2019
Estimated CBI Annual Demand to 2040
15,000 units
37
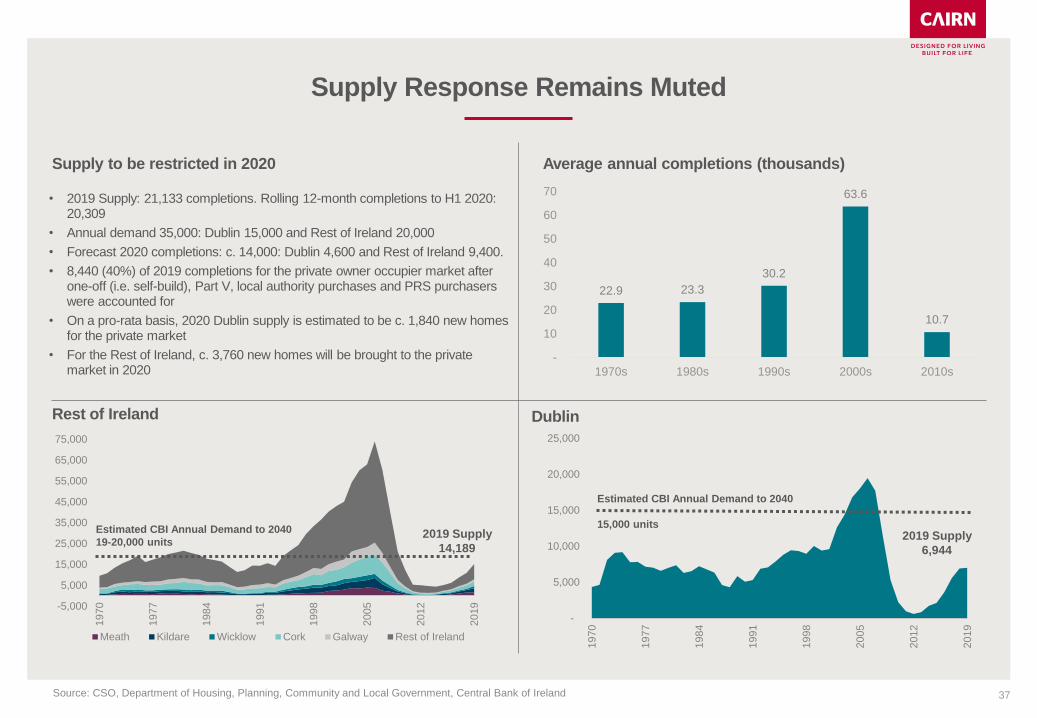
Supply Response Remains Muted
Source: CSO, Department of Housing, Planning, Community and Local Government, Central Bank of Ireland
-5,000
5,000
15,000
25,000
35,000
45,000
55,000
65,000
75,000
1970
1977
1984
1991
1998
2005
2012
2019
Meath Kildare Wicklow Cork Galway Rest of Ireland
Rest of Ireland Dublin
Estimated CBI Annual Demand to 2040
19-20,000 units2019 Supply
6,944
• 2019 Supply: 21,133 completions. Rolling 12-month completions to H1 2020: 20,309
• Annual demand 35,000: Dublin 15,000 and Rest of Ireland 20,000
• Forecast 2020 completions: c. 14,000: Dublin 4,600 and Rest of Ireland 9,400.
• 8,440 (40%) of 2019 completions for the private owner occupier market after one-off (i.e. self-build), Part V, local authority purchases and PRS purchasers were accounted for
• On a pro-rata basis, 2020 Dublin supply is estimated to be c. 1,840 new homes for the private market
• For the Rest of Ireland, c. 3,760 new homes will be brought to the private market in 2020
2019 Supply
14,189
Supply to be restricted in 2020 Average annual completions (thousands)
22.9 23.3
30.2
63.6
10.7
-
10
20
30
40
50
60
70
1970s 1980s 1990s 2000s 2010s
38
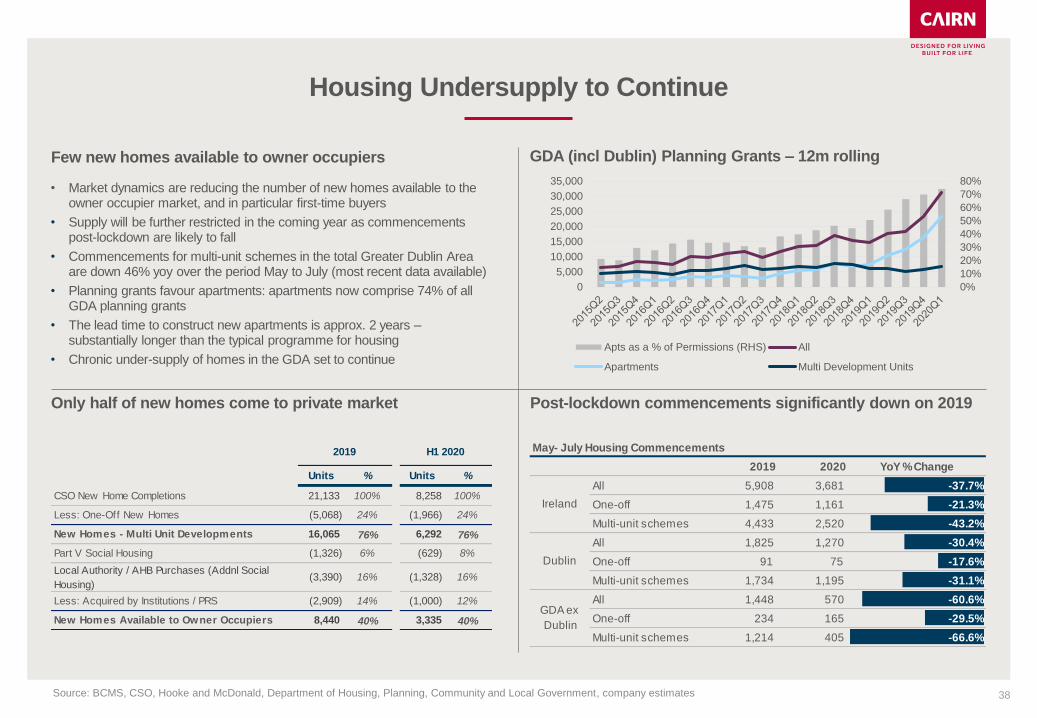
Housing Undersupply to Continue
Source: BCMS, CSO, Hooke and McDonald, Department of Housing, Planning, Community and Local Government, company estimates
• Market dynamics are reducing the number of new homes available to the owner occupier market, and in particular first-time buyers
• Supply will be further restricted in the coming year as commencements post-lockdown are likely to fall
• Commencements for multi-unit schemes in the total Greater Dublin Area are down 46% yoy over the period May to July (most recent data available)
• Planning grants favour apartments: apartments now comprise 74% of all GDA planning grants
• The lead time to construct new apartments is approx. 2 years –substantially longer than the typical programme for housing
• Chronic under-supply of homes in the GDA set to continue
Few new homes available to owner occupiers
Only half of new homes come to private market
GDA (incl Dublin) Planning Grants – 12m rolling
Post-lockdown commencements significantly down on 2019
0%
10%
20%
30%
40%
50%
60%
70%
80%
0
5,000
10,000
15,000
20,000
25,000
30,000
35,000
Apts as a % of Permissions (RHS) All
Apartments Multi Development Units
May- July Housing Commencements
2019 2020 YoY % Change
All 5,908 3,681 -37.7%
One-off 1,475 1,161 -21.3%
Multi-unit schemes 4,433 2,520 -43.2%
All 1,825 1,270 -30.4%
One-off 91 75 -17.6%
Multi-unit schemes 1,734 1,195 -31.1%
All 1,448 570 -60.6%
One-off 234 165 -29.5%
Multi-unit schemes 1,214 405 -66.6%
Ireland
Dublin
Source: BCMS
GDA ex
Dublin
Units % Units %
CSO New Home Completions 21,133 100% 8,258 100%
Less: One-Off New Homes (5,068) 24% (1,966) 24%
New Homes - Multi Unit Developments 16,065 76% 6,292 76%
Part V Social Housing (1,326) 6% (629) 8%
Local Authority / AHB Purchases (Addnl Social
Housing) (3,390) 16% (1,328) 16%
Less: Acquired by Institutions / PRS (2,909) 14% (1,000) 12%
New Homes Available to Owner Occupiers 8,440 40% 3,335 40%
2019 H1 2020
0
200
400
600
800
1000
1200
0-14 15-24 25-39 40-49 50-64 65-79 80+
39
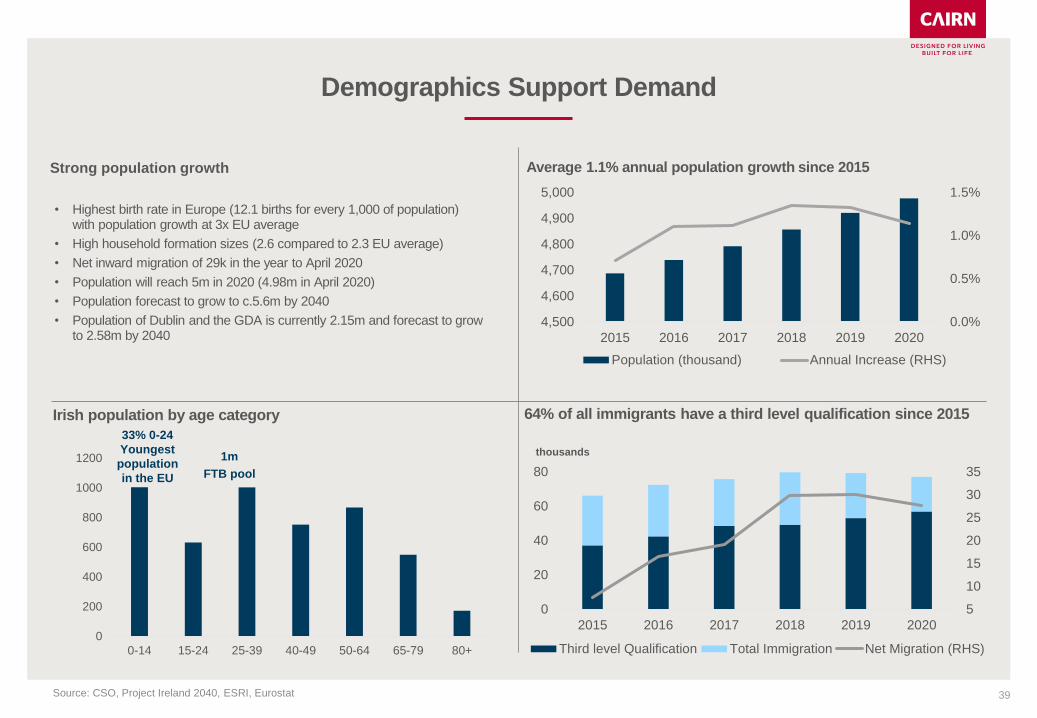
Demographics Support Demand
• Highest birth rate in Europe (12.1 births for every 1,000 of population) with population growth at 3x EU average
• High household formation sizes (2.6 compared to 2.3 EU average)
• Net inward migration of 29k in the year to April 2020
• Population will reach 5m in 2020 (4.98m in April 2020)
• Population forecast to grow to c.5.6m by 2040
• Population of Dublin and the GDA is currently 2.15m and forecast to grow to 2.58m by 2040
Source: CSO, Project Ireland 2040, ESRI, Eurostat
1m
FTB pool
Irish population by age category
Average 1.1% annual population growth since 2015
64% of all immigrants have a third level qualification since 2015
33% 0-24
Youngest
population
in the EU
0.0%
0.5%
1.0%
1.5%
4,500
4,600
4,700
4,800
4,900
5,000
2015 2016 2017 2018 2019 2020
Population (thousand) Annual Increase (RHS)
5
10
15
20
25
30
35
0
20
40
60
80
2015 2016 2017 2018 2019 2020
Third level Qualification Total Immigration Net Migration (RHS)
thousands
Strong population growth
40
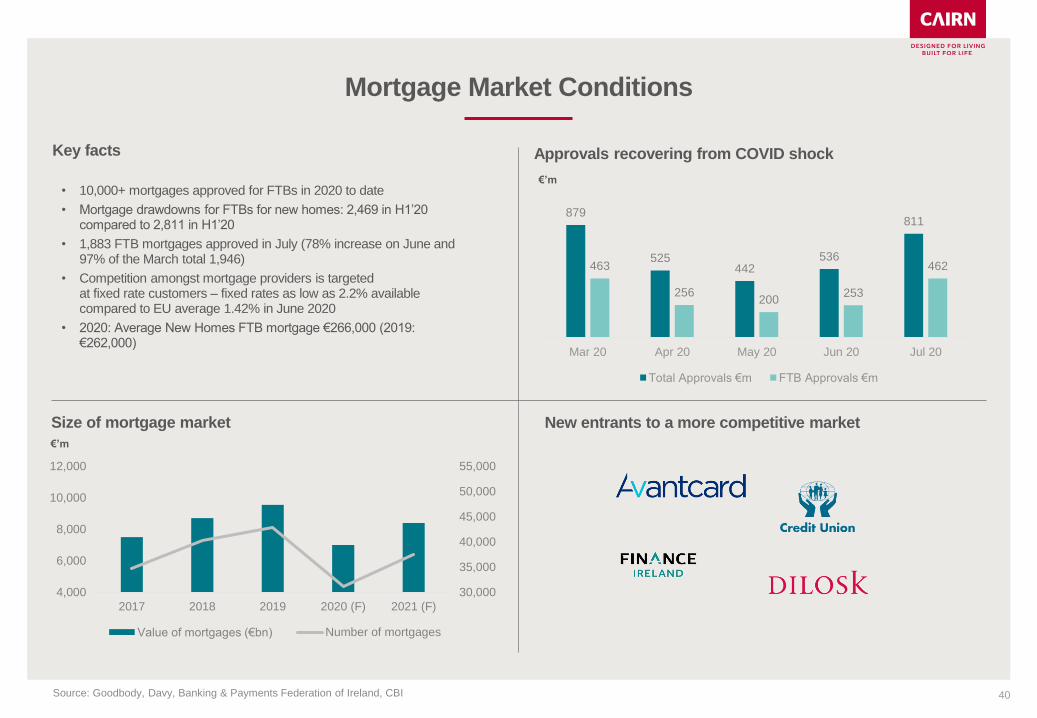
Mortgage Market Conditions
Source: Goodbody, Davy, Banking & Payments Federation of Ireland, CBI
Size of mortgage market
Approvals recovering from COVID shock
New entrants to a more competitive market
€’m
€’m
30,000
35,000
40,000
45,000
50,000
55,000
4,000
6,000
8,000
10,000
12,000
2017 2018 2019 2020 (F) 2021 (F)
Value of mortgages (€bn) Number of mortgages
Key facts
879
525442
536
811
463
256200
253
462
Mar 20 Apr 20 May 20 Jun 20 Jul 20
Total Approvals €m FTB Approvals €m
• 10,000+ mortgages approved for FTBs in 2020 to date
• Mortgage drawdowns for FTBs for new homes: 2,469 in H1’20 compared to 2,811 in H1’20
• 1,883 FTB mortgages approved in July (78% increase on June and 97% of the March total 1,946)
• Competition amongst mortgage providers is targeted at fixed rate customers – fixed rates as low as 2.2% available compared to EU average 1.42% in June 2020
• 2020: Average New Homes FTB mortgage €266,000 (2019: €262,000)
41
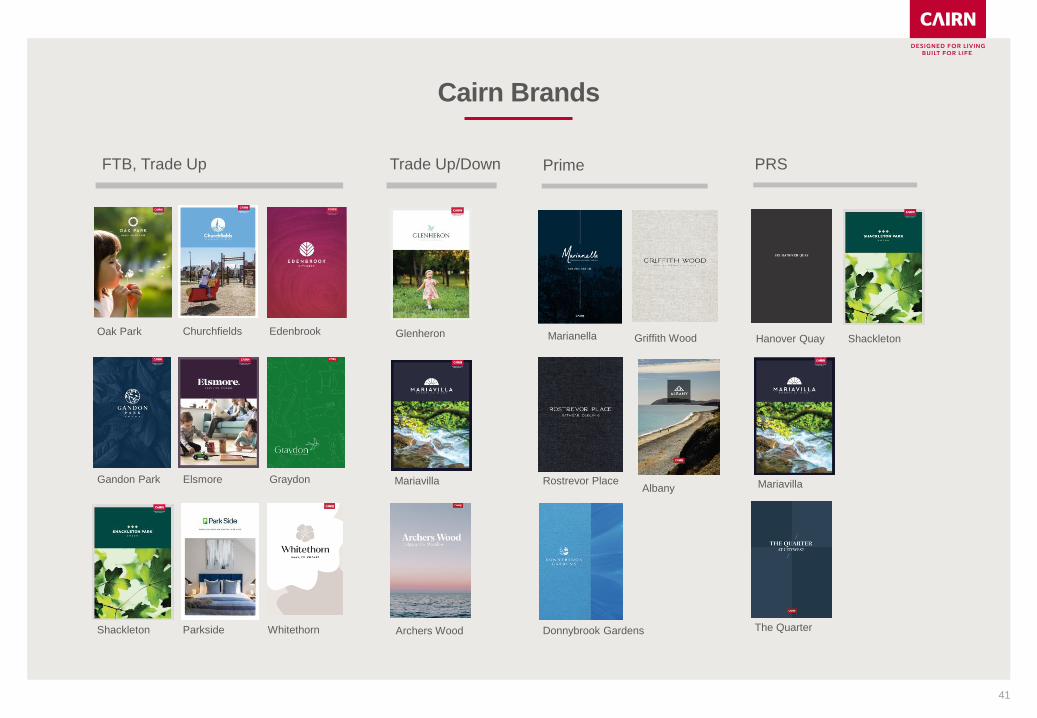
Cairn Brands
FTB, Trade Up Trade Up/Down Prime PRS
Oak Park Churchfields Edenbrook
Gandon Park Elsmore Graydon
Shackleton Parkside
Glenheron
Archers Wood
Mariavilla
Marianella
Albany
Donnybrook Gardens
Hanover QuayGriffith Wood
The Quarter
Rostrevor Place Mariavilla
Shackleton
Whitethorn
42
This presentation document (hereinafter “this document”) has been
prepared by Cairn Homes plc (“Cairn” or the “Company”).
This document has been prepared in good faith, but the information
contained in it has not been subject to a verification exercise.
No representation or warranty, express or implied, is given by
or on behalf of the Company, its group companies or any of their
respective shareholders, directors, officers, advisers, agents of
other persons as to the accuracy, fairness or sufficiency of
the information, projections, forecasts or opinions contained in the
presentation. In particular, the market data in this document has been
sourced from third parties. Save in the context of fraud, no liability is
accepted for any errors, omissions or inaccuracies in any of the
information or opinions in this document.
Certain information contained herein constitutes “forward-looking
statements”, which can be identified by the use of terms such as
“may”, “will”, “should”, “expect”, “anticipate”, “project”, “intend”,
“continue”, “target” or “believe” (or the negatives thereof) or other
variations thereon or comparable terminology. Due to various risks
and uncertainties, actual events or results of actual performance of
the Company may differ materially from those reflected or
contemplated in such forward-looking statements. No representation
or warranty is made as to the achievement or reasonableness of and
no reliance should be placed on such forward-looking statements.
There is no guarantee that the Company will generate a particular
rate of return, operating profit margin or that it will achieve its targeted
number of homes (per annum or over a development period).
Disclaimer
www.cairnhomes.com
+353 1 696 4600
7 Grand Canal
Grand Canal Street Lower
Dublin 2
Ireland
D02 KW81
Glenheron, Greystones
43