Embed Size (px)
Citation preview

Examining the Relationship between Service Quality and Customer Loyalty in
Lebanese Restaurants
Dissertation
Submitted to Northcentral University
Graduate Faculty of the School of Business and Technology Management
in Partial Fulfillment of the
Requirements for the Degree of
DOCTOR OF PHILOSOPHY
by
JOSEPH E. SALEEBY
Prescott Valley, Arizona August 2008

UMI Number: 3321218
Copyright 2008 by Saleeby, Joseph E.
All rights reserved
INFORMATION TO USERS
The quality of this reproduction is dependent upon the quality of the copy
submitted. Broken or indistinct print, colored or poor quality illustrations and
photographs, print bleed-through, substandard margins, and improper
alignment can adversely affect reproduction.
In the unlikely event that the author did not send a complete manuscript
and there are missing pages, these will be noted. Also, if unauthorized
copyright material had to be removed, a note will indicate the deletion.
______________________________________________________________
UMI Microform 3321218 Copyright 2009 by ProQuest LLC
All rights reserved. This microform edition is protected against unauthorized copying under Title 17, United States Code.
_______________________________________________________________
ProQuest LLC 789 East Eisenhower Parkway
P.O. Box 1346 Ann Arbor, MI 48106-1346

Copyright 2008
JOSEPH E. SALEEBY


ABSTRACT
Examining the Relationship Between Service Quality and Customer Loyalty in
Lebanese Restaurants
By
JOSEPH E. SALEEBY Northcentral University, August 2008
Restaurants in Lebanon, a country with an economy relying heavily on its tourism
sector, have flourished over the past decade. They are diverse, differentiated,
and have helped to create an industry which is highly competitive and boasts
high standards in quality and service. In this paper, the relationship between
quality of service and customer loyalty in the restaurant industry is investigated.
The customer’s perception of quality of service is studied based on the
SERVQUAL model. Customer loyalty is defined as a hybrid between behavioral
and attitudinal loyalty with a higher emphasis on the behavioral aspect of
customer loyalty (Ballinger and Rubinson 1996; Dick and Basu 1994). The
research survey covered 7 different restaurants in Lebanon and the correlation
between perceived quality of service and customer loyalty was calculated using
the Pearson r coefficient. The findings show a strong positive correlation (r
=0.671) between customer loyalty and service quality. Further analysis revealed
that the SERVQUAL components of Assurance and Responsiveness are more
highly correlated with customer loyalty than the other components.
iii

ACKNOWLEDGEMENTS
The writing of this dissertation has been one of the highest, and
distinguished academic achievements for me. I would like to take this great
opportunity to express my deepest gratitude to my coach and advisor Dr. Daljit
Singh, who gave me the needed guidance and freedom to express my own
thoughts and explore new ideas. Special thanks for Dr. Joseph DiRenzo and Dr.
Thomas Driver for commenting on my views and helping me understand and
enrich my ideas. I am also indebted to the rest of the members of the dissertation
committee at NCU, for their feedback and input. Also, without the support, and
patience of my wife and my family this study would not have been completed.
This Dissertation is dedicated to my wife Mireille, and my daughter
Rebecca, who inspired my efforts in all stages, despite all the difficulties that I
was facing.
iv
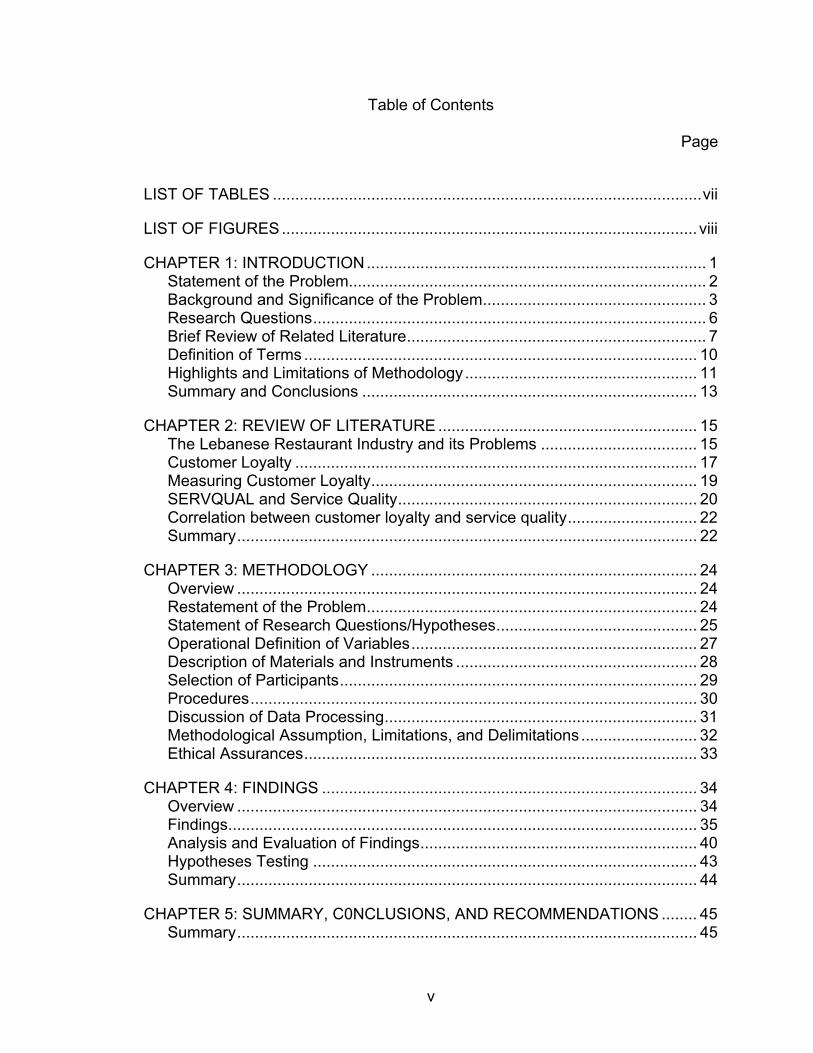
Table of Contents
Page
LIST OF TABLES ................................................................................................vii
LIST OF FIGURES............................................................................................. viii
CHAPTER 1: INTRODUCTION............................................................................ 1 Statement of the Problem................................................................................ 2 Background and Significance of the Problem.................................................. 3 Research Questions........................................................................................ 6 Brief Review of Related Literature................................................................... 7 Definition of Terms ........................................................................................ 10 Highlights and Limitations of Methodology.................................................... 11 Summary and Conclusions ........................................................................... 13
CHAPTER 2: REVIEW OF LITERATURE .......................................................... 15 The Lebanese Restaurant Industry and its Problems ................................... 15 Customer Loyalty .......................................................................................... 17 Measuring Customer Loyalty......................................................................... 19 SERVQUAL and Service Quality................................................................... 20 Correlation between customer loyalty and service quality............................. 22 Summary....................................................................................................... 22
CHAPTER 3: METHODOLOGY ......................................................................... 24 Overview ....................................................................................................... 24 Restatement of the Problem.......................................................................... 24 Statement of Research Questions/Hypotheses............................................. 25 Operational Definition of Variables................................................................ 27 Description of Materials and Instruments ...................................................... 28 Selection of Participants................................................................................ 29 Procedures.................................................................................................... 30 Discussion of Data Processing...................................................................... 31 Methodological Assumption, Limitations, and Delimitations .......................... 32 Ethical Assurances........................................................................................ 33
CHAPTER 4: FINDINGS .................................................................................... 34 Overview ....................................................................................................... 34 Findings......................................................................................................... 35 Analysis and Evaluation of Findings.............................................................. 40 Hypotheses Testing ...................................................................................... 43 Summary....................................................................................................... 44
CHAPTER 5: SUMMARY, C0NCLUSIONS, AND RECOMMENDATIONS ........ 45 Summary....................................................................................................... 45
v

Conclusions................................................................................................... 46 Recommendations ........................................................................................ 47
REFERENCES................................................................................................... 49
APPENDIXES..................................................................................................... 52
Appendix A Service Quality Questionnaire....................................................... 53
Appendix B Customer Loyalty Test ..................... Error! Bookmark not defined.
Appendix C: Overall Customer Loyalty Rating Calculation Form................. Error! Bookmark not defined.
vi
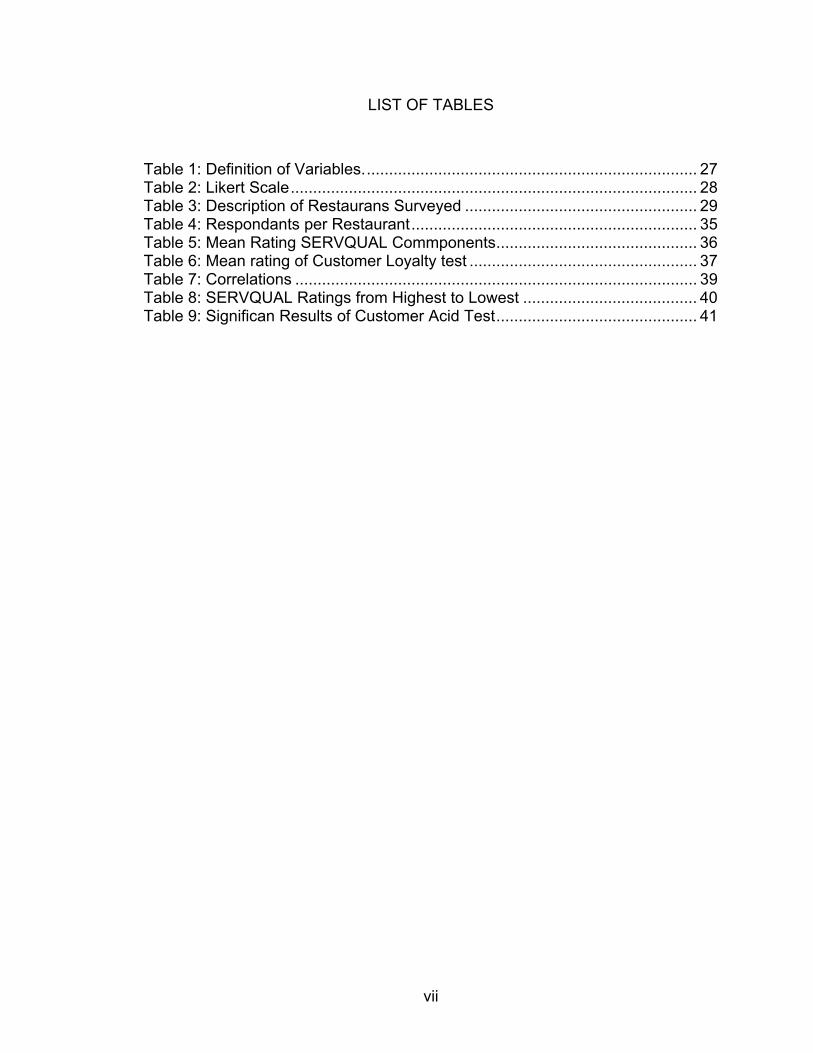
LIST OF TABLES
Table 1: Definition of Variables........................................................................... 27 Table 2: Likert Scale........................................................................................... 28 Table 3: Description of Restaurans Surveyed .................................................... 29 Table 4: Respondants per Restaurant................................................................ 35 Table 5: Mean Rating SERVQUAL Commponents............................................. 36 Table 6: Mean rating of Customer Loyalty test ................................................... 37 Table 7: Correlations .......................................................................................... 39 Table 8: SERVQUAL Ratings from Highest to Lowest ....................................... 40 Table 9: Significan Results of Customer Acid Test............................................. 41
vii

LIST OF FIGURES
Figure 1. Remodeled Service-Profit Chain (Heskett et al. 1994, Magnusson and Sundin, 2005) ..................................................................................................... 19
viii

1
CHAPTER 1: INTRODUCTION
Lebanese restaurateurs are finding it difficult to accurately assess
customer loyalty and identify its drivers. According to the Ministry of Tourism,
Lebanon has more than 4000 restaurants that cater for more than 150,000
persons daily. As new restaurants are setup on a frequent basis, customers tend
to show shifting patterns, trends and even unpredictable behavior causing
restaurants to lose market share as others gain them (Majali, 2006). Diminishing
customer loyalty has caused some restaurants to report yearly revenue
decreases on an average of 20% and sometimes even up to 45 % (Majali, 2006).
Lebanon is a Middle Eastern country located on the eastern side of the
Mediterranean Sea. Tourism is one of the pillars of Lebanese economy
accounting for around 10% of the country’s GDP (Restovista), and its importance
has driven a growing and competitive market for the food & beverage industry
where professionalism, innovation, and a high quality of customer service are
minimum requirements for survival in this challenging business. After the 15-year
old civil war, an estimated investment of $1.23 billion (Restovista) has been
spent on reshuffling or setting up new restaurants in Lebanon which employ
around 80,000 employees and constitutes the largest private employment sector
in the country according to Restovista. The Lebanese business environment is
very entrepreneurial especially when it comes to the restaurant industry, and
investors and businessmen have readily ventured into new concepts and
restaurants despite the political turmoil plaguing the country since 2005. They

2
cater to the Lebanese people who are frequent restaurant goers and are very
critical of good service, especially the relatively well-to-do suburban class.
Consequently, and in today’s competitive environment, restaurants are in
a constant quest to achieve competitive advantage. They are thus eager to
identify the components of service that are most valued by customers.
Statement of the Problem
Restaurant owners are complaining about decreases in revenue caused
by decreasing customer loyalty in the highly competitive and dynamic Lebanese
restaurant market according to Majali (2006). As Lebanese restaurant owners
export and franchise into external markets, especially those in the gulf which
amount to around 80% of Lebanese franchises, they risk exporting the same
problems they are facing in the local market.
Today, competition is intensifying and the industry in Lebanon is in need
of accurate data and tools to help effectively and efficiently retain customers.
The purpose of this mixed correlational quantitative and qualitative
research was to analyze the impact of service quality on customer loyalty in the
context of Lebanese restaurants.
This was done by identifying and answering the following research
questions:
1. How should customer loyalty be defined in the restaurant industry?
2. What measurement tool for customer loyalty should be used to
conduct the research in the Lebanese restaurant industry?

3
3. How does the variation in overall service rating affect the customer
loyalty rating in Lebanese restaurants?
4. How does the variation in one of the service components impact the
level of customer loyalty in Lebanese restaurants?
The results of the proposed research offered insight on the correlation
between the services offered by restaurants of all types on the degree of
customer loyalty in the Lebanese market. Also, the service offering was
segmented into a set of components that were individually examined and their
impact on loyalty determined.
Furthermore and for the purpose of this research, the SERVQUAL
framework, a comprehensive analytical tool used to define, analyze, and
measure the service quality, was investigated. Then, the relevance of each
SERVQUAL determinant of service quality to the restaurant industry in general
and to the Lebanese restaurants in particular was also evaluated. Last but not
least, the proposed research may provide the industry with a valuable
measurement tool of customer loyalty.
Background and Significance of the Problem
Lebanon is a country renowned for its expertise in the services sector in
the Middle East. When it comes to tourism and the restaurant industry, the
Lebanese have a reputation for being successful restaurant entrepreneurs and
for pioneers in concepts and franchising in the region.
Literature review and personal interviews have shown that, restaurant
managers have recently complained about what they perceive as lack of

4
customer loyalty. In an interview with Mr. Azzam Dbeis, the manager of Chicken
Inc., a medium-sized chain of restaurants with outlets in every major city which
specialize in fried and roasted chicken, he helped in illustrating the problem by
stating the following:
The [Lebanese] customer in general is not very loyal. A floor manager of
one of our major outlets once told me that there was a customer who used
to come as frequently as five times a week to order the same meal, one
half roasted chicken with garlic paste on the side and baked potatoes.
Then, on his day off, he [the floor manager] happened to pass by one of
our main competitor’s branches, and saw our supposedly loyal customer
purchasing some chicken to take-out. And this happens often with our
customers. It is a very big problem. We cannot predict how our customers
will behave, and who is really loyal and who is not … we are not knowing
what makes our customer loyal to us and what doesn’t. (Azzam Dbeis,
personal communication, April 14, 2007)
Mr. Dbeis’s statement highlights several problems. Firstly, the problem of
customer loyalty which Mr. Dbeis complains about is not very well understood.
There is a need to clarify the meaning of customer loyalty in the context of
Lebanese restaurants. Second of all, there is no reliable framework or method to
quantitatively measure customer loyalty in Lebanese restaurants, or understand
what affects them. As little as 30% of restaurants in Lebanon rely on customer
feedback through comment cards in managing their operations and this figure is
virtually insignificant when it comes to small family owned restaurants (Majali,

5
2006). This low responsiveness to comment cards can be attributed to the lack of
faith in the effectiveness of feedback, and/or a lack sense of duty towards
restaurants which suggests a low attitudinal loyalty on the part of the patrons.
Furthermore, the recent political turmoil in the country since 2005 has had
a negative impact on the local restaurant industry. This in turn has pushed
restaurant owners to expand to the more stable regional markets such as Jordan,
Egypt, Kuwait, Saudi Arabia, and the U.A.E. Jean-Paul Ramy, a Lebanese
entrepreneur previously working in the clothing industry, has opened with his
partners a total of 22 restaurant outlets in the middle east in a period of just four
years with more to come for the year 2008 (“Food Franchising”, 2007). Another
large Lebanese franchiser, Zaatar w Zeit, has expanded regionally and includes
2 outlets in Jordan, 6 in the UAE, and 4 in Kuwait (Locate Zaatar w Zeit, 2007).
Due to the importance of the restaurant sector to the Lebanese economy,
as well as the potential revenues from the gulf markets, it has become a national
duty to help in researching, documenting, and analyzing the many problems of
the Lebanese restaurant industry in a professional and scholarly manner. A
research on how quality of service in restaurants affects customer loyalty will
contribute to the insufficient literature tackling the subject of restaurants in
Lebanon, and will help managers and restaurant owners both locally and
regionally in understanding and identifying problems associated with customer
loyalty and service in their many outlets, which will in turn help them in becoming
more competitive and more professional.

6
Research Questions
The problems identified are multifaceted. They involve qualitative
problems such as the appropriate definition of customer loyalty, as well as
quantitative questions regarding how loyal customers are and how they rate
quality of service in Lebanese restaurants. As stated before, the SERVQUAL
framework will be used to identify quality of service in restaurants. The problem
statement will be investigated by answering 5 comprehensive research questions
in a qualitative and quantitative manner as deemed appropriate by depending on
previous literature, statistics, questionnaires, and analysis of the acquired data.
The research questions are:
1. How should customer loyalty be defined in the restaurant industry?
There is a multitude of definitions for customer loyalty. In this sense, the
research proposed a suitable definition based on literature for customer loyalty in
the context of Lebanese restaurants. Both the behavioral and attitudinal
dimensions of the customer loyalty paradigm were investigated.
2. What measurement tool for customer loyalty should be used to
conduct the research in the Lebanese restaurant industry?
El Hakim (2003) suggested a method to measure customer satisfaction in
the airline industry and particularly the Middle East Airlines as a case study,
However, El Hakim (2003) failed to mention customer loyalty or provide any
method to measure customer loyalty while considering local cultural preferences.
Majali (2003) studied the Lebanese Restaurant industry in particular but also
failed to provide a measurement method for customer loyalty. Shankar, Smith

7
and Rangaswamy (2000) studied the concept of loyalty in online and offline
environments and propose a measurement method.
3. How does the variation in overall service rating affect the customer
loyalty rating in Lebanese restaurants?
The quantitative correlation between the overall service quality (as
perceived by the customers) and customer loyalty in Lebanese restaurants was
investigated in the proposed research. The overall value attributed to customer
service rather than the specific components of customer service according to the
SERVQUAL model was used. A correlation was found between this variable and
the customer loyalty variable, as defined by the methods derived from answering
the above qualitative questions. An investigation into the basic correlation
between service quality and customer loyalty were conducted in the primary
stage of the proposed research
4. How does the variation in one of the service components impact the
level of customer loyalty in Lebanese restaurants?
Different components of service have different levels of impact on
customer loyalty and therefore should be given different degrees of importance
from the restaurant manager’s point of view. The answer to this question, a
principle point of investigation, helped in identifying the parts of the service that
have the strongest impact on customer loyalty and should hence be prioritized.
Brief Review of Related Literature
The literature covered includes broad topics regarding restaurants, service
quality and the SERVQUAL framework, and customer loyalty in general. The
8
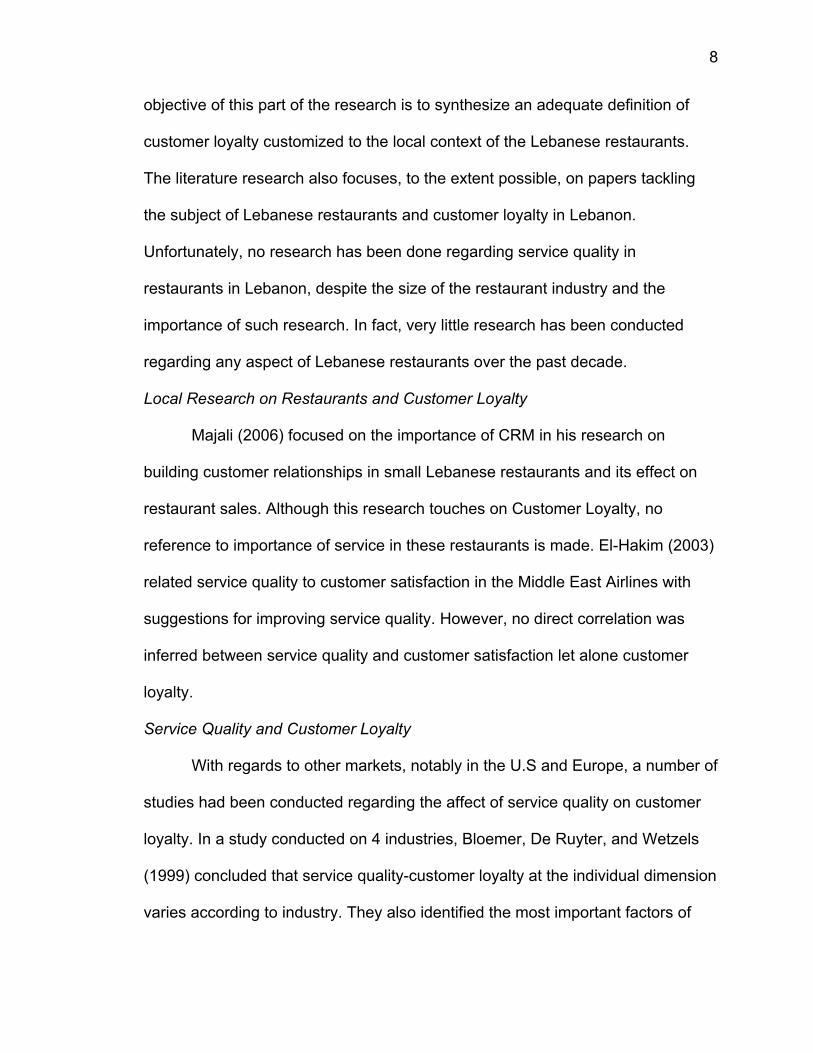
objective of this part of the research is to synthesize an adequate definition of
customer loyalty customized to the local context of the Lebanese restaurants.
The literature research also focuses, to the extent possible, on papers tackling
the subject of Lebanese restaurants and customer loyalty in Lebanon.
Unfortunately, no research has been done regarding service quality in
restaurants in Lebanon, despite the size of the restaurant industry and the
importance of such research. In fact, very little research has been conducted
regarding any aspect of Lebanese restaurants over the past decade.
Local Research on Restaurants and Customer Loyalty
Majali (2006) focused on the importance of CRM in his research on
building customer relationships in small Lebanese restaurants and its effect on
restaurant sales. Although this research touches on Customer Loyalty, no
reference to importance of service in these restaurants is made. El-Hakim (2003)
related service quality to customer satisfaction in the Middle East Airlines with
suggestions for improving service quality. However, no direct correlation was
inferred between service quality and customer satisfaction let alone customer
loyalty.
Service Quality and Customer Loyalty
With regards to other markets, notably in the U.S and Europe, a number of
studies had been conducted regarding the affect of service quality on customer
loyalty. In a study conducted on 4 industries, Bloemer, De Ruyter, and Wetzels
(1999) concluded that service quality-customer loyalty at the individual dimension
varies according to industry. They also identified the most important factors of

9
customer loyalty; purchase intention, word of mouth, price sensitivity, and
complaining behavior. Fu and Parks (2001) researched the affect on customer
loyalty in restaurants amongst elderly who are usually more critical of the service
they are given. A similar study by Ostrowski, O'Brien and Gordon (1993) showed
that service quality was perceived as low in a study conducted on two
commercial airlines, and that subsequently, customer loyalty was low. Bell,
Seigyoung, and Smalley (2005) and Koutouvolas and Siomkos (2006) added the
dimension of switching costs to their studies and showed that increases in
switching costs diminished the dependence of customer loyalty on service
quality.
SERVQUAL and Service Quality
Bartlett & Han (2007), Bell Seigyoung & Smalley (2005), and El Hakim
(2003) all used SERVQUAL as a reliable tool for quantification and measurement
of service quality. The SERVQUAL instrument provides a standard which makes
any research customizable and applicable to other service related issues across
industries locally and globally.
Furthermore, analysis tools such as multiple regression analysis are also
commonly used in order to correlate elements of service quality to loyalty. As Fu
and Parks (2001) showed by using a multiple regression model, elements of
service quality are factored differently and given varying levels of importance
depending on the market studied, where for example, the elderly give more value
to the friendliness and importance given to the customer than other aspects of
service in restaurants such as the credibility projected by the restaurant server.
10
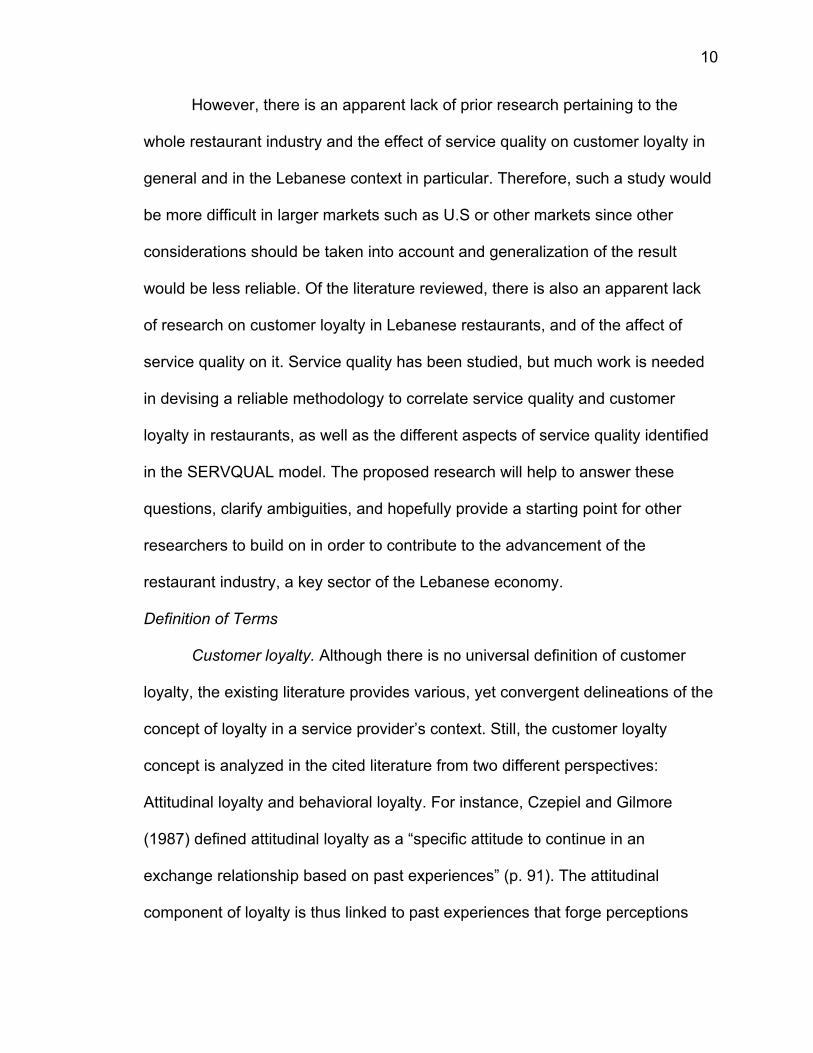
However, there is an apparent lack of prior research pertaining to the
whole restaurant industry and the effect of service quality on customer loyalty in
general and in the Lebanese context in particular. Therefore, such a study would
be more difficult in larger markets such as U.S or other markets since other
considerations should be taken into account and generalization of the result
would be less reliable. Of the literature reviewed, there is also an apparent lack
of research on customer loyalty in Lebanese restaurants, and of the affect of
service quality on it. Service quality has been studied, but much work is needed
in devising a reliable methodology to correlate service quality and customer
loyalty in restaurants, as well as the different aspects of service quality identified
in the SERVQUAL model. The proposed research will help to answer these
questions, clarify ambiguities, and hopefully provide a starting point for other
researchers to build on in order to contribute to the advancement of the
restaurant industry, a key sector of the Lebanese economy.
Definition of Terms
Customer loyalty. Although there is no universal definition of customer
loyalty, the existing literature provides various, yet convergent delineations of the
concept of loyalty in a service provider’s context. Still, the customer loyalty
concept is analyzed in the cited literature from two different perspectives:
Attitudinal loyalty and behavioral loyalty. For instance, Czepiel and Gilmore
(1987) defined attitudinal loyalty as a “specific attitude to continue in an
exchange relationship based on past experiences” (p. 91). The attitudinal
component of loyalty is thus linked to past experiences that forge perceptions

11
and attitudes towards a certain product, service, brand, or company. Behavioral
loyalty on the other hand is defined by Jacoby and Chestnut (1978) as “the
biased (i.e. non-random) behavioral response, expressed over time, by some
decision making unit, with respect to one store, out of a set of stores, which is a
function of psychological processes resulting in brand commitment” (p. 21).
SERVQUAL. Zeethaml, Parasuraman and Berry (1988), developed
SERVQUAL as a generic model to breakdown and qualify service in any
industry. They suggest that service quality can be assessed from five
dimensions: tangibles, reliability, responsiveness, assurances, and empathy.
This instrument utilizes a gap score analysis method which assesses the
difference between a user’s expectations of service and the actually perceived
service. However, research has shown that not all elements of the SERVQUAL
model are relevant or applicable in specific industries. One of the aims of the
proposed research is to highlight the relevant factors of the SERVQUAL model to
the restaurant industry and in particular, the Lebanese restaurant industry.
Highlights and Limitations of Methodology
In order to investigate the relationship between service and customer
loyalty, and examine how service quality in Lebanese restaurants, as perceived
by the customer, affects loyalty, a mixed qualitative and quantitative method
using correlation and multiple regression was used.
Research questions 1 and 2 constitute the qualitative part of the research
regarding the broad definition and measurement of customer loyalty which were
then customized to the context of Lebanese restaurants. This was done by a

12
careful and thorough understanding and analysis of related literature. To define
customer loyalty, there was a heavy reliance on the works of Czepiel and
Gilmore (1987) and Jacoby and Chestnut (1978) constituting the two broadly
accepted descriptions of customer loyalty as being considered as attitudinal or
behavioral respectively. Other research papers conducted regarding customer
loyalty in restaurants or similar related business such as casinos or hotels were
used in order to identify the best definition of customer loyalty in the required
context. (Hu, Jang, and McCain, 2005) performed a gap analysis of loyal
customers compared with switchers to evaluate service quality in casinos. They
adopted the behavioral definition of customer loyalty and considered loyal
customers as customer with repetitive behavior and recurring visits. After a
common definition of customer loyalty was adopted for the research at hand, a
method for measuring customer loyalty was determined. This was based on
previous research as well as various customer loyalty measurement methods
used in different cases and industries and a hybrid of the most appropriate ones
was used.
After determining the appropriate definition and method of determining
customer loyalty in Lebanese restaurants, a quantitative analysis was conducted
in order to answer the research questions 3 and 4. A survey was conducted on a
number of Lebanese restaurants in order to determine the loyalty of customers
and their assessment of the service quality in each restaurant. Then, a degree of
correlation was determined between Overall Customer Loyalty and Overall
Service Quality Rating based on the SERVQUAL model. A linear regression

13
analysis was conducted to determine the most important attributes of service
quality in Lebanese restaurants and their relative importance to Overall Service
Quality Rating. For example, Gupta and Chen (1995) used a least square
regression analysis to determine the importance of five factors of the
SERVQUAL model (tangibles, reliability, responsiveness, assurance, and
empathy) in the three types of service (pure service, mixed service, and quasi-
manufacturing service) of the Chase and Tansik model (Chase & Tansik, 1988).
In attempting to thoroughly and conclusively tackle the research questions
derived from the problem statement, there are limitations to be considered. The
first concern is the objectiveness and impartiality of the Lebanese customers in
answering the survey questionnaire. Both Majali (2006) and El-Hakim (2003)
identified a slight degree of lack of cooperation amongst Lebanese customers
and even managers and business owners when answering surveys. Although a
non-monetary incentive will be used (Singer, n.d), the data derived might not be
100 % accurate. Another limitation is the lack of existing literature on Lebanese
restaurants on which a comparison can be based in order to make a better
assessment on the correctness of the data and progress in the restaurant sector.
These limitations will be discussed further in Chapter III and methods to
overcome them will be suggested.
Summary and Conclusions
The aim of the proposed research was to provide the industry with a
valuable measurement tool for customer loyalty. Furthermore, such a research
may bring about awareness on the importance and effectiveness of quantitative

14
correlational, and qualitative research as tools for improvements in the whole
industry. Through the research, an increased awareness of the relevance and
effectiveness of the SERVQUAL model was created. This will hopefully drive
similar researches by local higher degree candidates on other aspects of the
restaurant business and hospitality industry to help improve this highly
dependent sector of the economy.

15
CHAPTER 2: REVIEW OF LITERATURE
The literature review for the research project began with previous
researches and sources introducing the problems of the restaurant industry in the
Lebanese market. It includes a selection of widely accepted papers as resources
for the broad topics of customer loyalty and the SERVQUAL model. In addition,
there are numerous other papers that discuss cases involving customer loyalty
and the SERVQUAL model related to the hospitality industry and in some cases
specific to the restaurant industry. Literature research also deals with
measurement of customer loyalty. Information is also obtained from research on
the specifics of customer loyalty in Lebanon. Unfortunately, no research has
been done regarding service quality in restaurants in Lebanon, despite the size
of the restaurant industry and the importance of such research. Finally, literature
where correlation and other methods were used to analyze and interpret data on
customer loyalty and service quality is reviewed. This covered the main
questions of our research in a thorough theoretical study with regards to the
qualitative questions of SERVQUAL, customer loyalty, and measurement.
The Lebanese Restaurant Industry and its Problems
Literature research has revealed that there are very little papers written on
the Lebanese restaurant industry. Majali (2006) has tackled the subject of
Lebanese restaurants and his work on the impact of developing customer
relationships in small family-owned (Majali, 2006) includes an introduction to the
Lebanese restaurant market and to the problems they face. Majali (2006)
focused on the importance of CRM in his research on building customer

16
relationships in small Lebanese restaurants and its effect on restaurant sales.
Although Majali touches on customer loyalty in his research, no reference to the
importance of service in these restaurants is made. Majali detected a 25 % to 40
% reported decrease in yearly revenues in surveyed restaurants which he
attributes to diminishing customer loyalty, or the failure of customers to show a
repetitive behavior in frequenting a given restaurant, and show a tendency to try
out new restaurants as they open. Majali conducted in-depth interviews with
restaurant managers and owners and surveyed 80 customers. Majali suggested
improving customer relationship management and in his conclusions noted that
42% of surveyed restaurants who enhanced their CRM, even in primitive
methods such as recording customer names and keeping basic information
regarding customer preferences, showed an improvement in sales over the one
year period when the study was conducted. Although this ratio might seem small,
it is important to keep in mind that the restaurants surveyed were generally small
family-owned businesses with traditional methods of management and who
would find it difficult to implement effective CRM. Although not explicitly
mentioned, customer loyalty in this research seems to take on two definitions.
Lebanese customers tend to show little behavioral loyalty as suggested by
Jacoby and Chestnut (1978) where Lebanese customers do not show any brand
commitment to given restaurants and although constantly frequenting a given
restaurant, they would readily become patrons of a new one for no apparent
reason (Majali, 2006).

17
Majali (2006) introduced some key problems in the industry; little customer
loyalty resulting in diminishing revenues, traditional and unprofessional methods
of management, volatile and frequently changing trends in the market, and lack
of sufficient data and reliable statistics. This sheds light on the status of the
Lebanese restaurant industry as well as the possible obstacles to overcome
while conducting a research survey and specific market characteristics to be
taken into consideration. The first topic to discuss of the restaurant industry in
Lebanon is customer loyalty. The following section reviews previous works on
customer loyalty in general as well as cases of customer loyalty in the restaurant
industry and service related industries.
Customer Loyalty
There are two widely accepted definitions of customer loyalty. Czepiel and
Gilmore (1987) defined attitudinal loyalty as a “specific attitude to continue in an
exchange relationship based on past experiences” (p. 91). On the other hand,
behavioral loyalty as defined by Jacoby and Chestnut (1978) is “the biased (i.e.
non-random) behavioral response, expressed over time, by some decision
making unit, with respect to one store, out of a set of stores, which is a function
of psychological processes resulting in brand commitment” (p. 21). Recent
research has attempted to explain customer loyalty as an integrated form of both
the attitudinal and behavioral dimensions of loyalty as two distinct but important
constructs (Ballinger and Rubinson 1996; Dick and Basu 1994). According to
Bennet (2002), loyalty is defined as the relationship between an individual's
attitudinal predisposition towards an object and the repeat patronage of that

18
object. It is thus apparent that recent definitions of customer loyalty are a hybrid
of both attitudinal and behavioral dimensions of loyalty.
In order to define customer loyalty in the context of restaurants, research
literature on the topic was reviewed. In a study relating service tangibility to
customer loyalty in several industries including restaurants, Magnusson and
Sundin (2005), who surveyed 240 respondents, considered Oliver’s (1999)
definition of loyalty; “a deeply held commitment to rebuy or repatronize a
preferred product/service consistently in the future, thereby causing repetitive
same-brand or same brand-set purchasing, despite situational influences and
marketing efforts having potential to cause switching behavior.” (Oliver, 1999,
p.2). Fu and Parks (2001) identified the relationship between service quality and
customer loyalty amongst the elderly in restaurants in the U.S. In their study, they
adopted an attitudinal definition of loyalty and considered loyal patrons as those
who have a positive attitude towards the restaurants they frequent, despite the
frequency of their visits to that specific restaurant. This would seem appropriate
for the demographic segment of elder people. For the purpose of this study, a
functional definition of customer loyalty should be taken, meaning that loyal
customers should be ones who, at the end of the day, drive higher sales and
improve revenues. This is illustrated by Heskett et al. (1994) service-profit chain
(see figure 1). This service-profit chain was conceptualized for the case of
service-oriented organizations and the importance of putting customers and
employees as a priority (Heskett et al. 1994). Therefore, customer loyalty should
be considered as an integration of attitudinal and behavioral loyalty but with

19
emphasis on behavior which is materialized by repetitive purchasing and
patronage of the restaurant.
With the establishment of a definition of customer loyalty, a method for
measuring loyalty should be defined. The following section reviews literature
dealing with the measurement of customer loyalty in restaurants and related
industries.
Figure 1. Remodeled Service-Profit Chain (Heskett et al. 1994, Magnusson and Sundin, 2005)
Measuring Customer Loyalty
In Loyalty Rules! Reichheld (2001) suggested a highly reliable and widely
employed method for measuring customer and employee loyalty knows as the
Loyalty Acid Test (Reichheld). The Customer Acid Test is used to measure
customer loyalty and emphasizes the behavioral dimension of customer loyalty
by asking questions such as “How likely are you to continue buying Company's
products and/or services from Company xYz?” and “How long have you been a
customer of Company xYz?” (SATMETRIX, n.d, p.1). This test will be used
throughout the survey; however it is important to point out other considerations
when dealing with measuring customer loyalty such as taking into account the
attitudinal dimension of customer loyalty. Bennet (2002) suggested the 3x3
matrix taken from Ballinger and Rubinson (1996) to take into account both
dimensions of loyalty. Bennet proposed this method because it is more accurate
to measure loyalty.“It appears to be commonly accepted amongst cognitive

20
researchers that attitude precedes behavior in the context of repurchasing a
product and is important because attitudes towards an object determine choice”
(p.11).
However, attitudinal loyalty is difficult to measure and since they cannot be
directly measured, then they are not appropriate in the context of research (Bass,
1974). Local research on the topic did not bring much insight. El Hakim (2003)
measured quality of service in the Middle East Airlines but did not provide any
method to measure customer loyalty. Majali (2006) mentioned customer loyalty in
his study on Lebanese restaurants, but he did not devise a method to measure it.
The literature reviewed so far covered the meaning of customer loyalty
and methods of measuring it. The second part of the problem deals with service
quality and the SERVQUAL model which will be discussed in the following
section.
SERVQUAL and Service Quality
Service quality is conceptualized as the comparison of service
expectations with actual performance perceptions (Zeithaml et al., 1990).
SERVQUAL (Zeethaml, Parasuraman and Berry, 1988) is a generic
multidimensional instrument based on the gap model between expectations and
perception that divides service quality into the following:
1. Tangibles
2. Reliability
3. Responsiveness
4. Assurance

21
5. Empathy
This model is widely used while conducting research on service quality
across the range of industries and it is common for researches to focus on a
relevant set of these dimensions and not all of them at the same time. For
example, Gupta and Chen (1995) conducted a study which identified the
relationship between five of the dimensions of SERVQUAL (tangibles, reliability,
responsiveness, assurance and empathy) and customer perceived service
quality using a linear regression model in different types of service industries.
Their results show that tangibles is perceived as most relevant in the surveyed
industries. The model has been used extensively in the hospitality industry,
seeing as it’s a service oriented industry (Bartlett and Han, 2007, Bell Seigyoung
& Smalley, 2005, Fu and Parks, 2001) and has been used in local research
papers such as the work of El-Hakim (2003) on service quality in the Middle East
Airlines company.
Despite its wide use, SERVQUAL cannot be used as an ultimate fail-proof
model to examine service quality without taking cultural considerations. It has
been criticized as being inappropriate in its applications particularly in the
marketing field (Myerscough, 2002). However, it can be used as a foundation to
conceptualize a model in different cultures (Bartlett and Han, 2007). As is the
case in our research, no model based on SERVQUAL has been customized for
the Lebanese industry, which creates an opportunity to fill a gap and identify the
most relevant dimensions of service quality as a result of this research, to be
used by scholars in the future.

22
Correlation between customer loyalty and service quality
Although no works have been conducted regarding the relationship
between customer loyalty and service quality in Lebanese restaurants, this issue
has been tackled in the restaurant industry and other service-oriented industries
in other markets such as Europe and the U.S. A study by Ostrowski, O'Brien and
Gordon (1993) on two commercial airlines showed that low service quality
resulted in low customer loyalty. Another example is Bloemer, De Ruyter, and
Wetzel’s’ (1999) work which linked customer loyalty in a to service quality based
on the SERVQUAL model in a multidimensional study across four industries;
entertainment, fast food, supermarket, and health care services. In this study, the
relationship between four dimensions of customer loyalty (word-of-mouth
communications, purchase intention, price sensitivity, and complaining behavior)
was analyzed with the overall service quality and the SERVQUAL dimensions
tangibles, empathy, reliability, responsiveness, and assurance.
Summary
The literature reviewed has clearly identified the lack and need of
conducting the proposed research for the Lebanese restaurant industry. Different
definitions of customer loyalty were discussed, and adopting the behavioral
definition of customer loyalty proves to be relevant to the problem at hand. A
proper reliable method for measuring loyalty was found. Furthermore, the
SERVQUAL model as a reliable foundation for studying the dimensions of
service quality was proven to be widely used and efficient for the given context. It
was also shown that the lack of literature using the SERVQUAL model in the

23
different sectors of the service-oriented Lebanese economy will make this work a
significant contribution which can be built upon for the improvement of services in
Lebanon. Finally, the importance of correlating service quality and customer
loyalty has become clear and the lack thereof in the Lebanese industry makes it
even more essential.

24
CHAPTER 3: METHODOLOGY
Overview
In this section, the steps and methods used in aim of answering the
research questions derived from the problem statement are explained. The
problem and research questions along with related hypotheses are restated.
Then, the research design is presented and explained. Following that, a
description of the variables are given and then the instruments used to acquire
the data along with a description of the restaurants, participants, owners and
managers included in the survey. The procedure taken to acquire the data and
the mathematical methods used to analyze it and withdraw conclusions is
explained. Finally, the limitations and possible shortcoming of the proposed
methodology are mentioned.
The survey was conducted with the highest level of objectivity and the
resulting data was analyzed in its rawest form.
Restatement of the Problem
Restaurants in Lebanon are suffering from diminishing revenues caused
by, amongst other reasons, behavior showing low customer loyalty. A significant
number of restaurant owners use traditional methods of management and there
is no documented research suggesting the relationship between customer loyalty
and quality of service, let alone providing solutions to the problem at hand.
Furthermore, Lebanese restaurants are actively expanding to the gulf amidst
increasing competition and risk exporting the problems they face to foreign
markets.

25
The aim of the proposed correlational quantitative and qualitative research
is to tackle the problem by analyzing the impact of service quality on customer
loyalty.
The four research questions derived from the problem statement as well
as the proposed hypothesis where applicable are discussed in next section.
Statement of Research Questions/Hypotheses
The research aims to answer the following questions:
1. How should customer loyalty be defined in the restaurant industry?
Through literature research, it was shown that the most recently adopted
definition of customer loyalty is an integrated multi-dimensional definition
incorporating both behavioral and attitudinal definitions of customer loyalty.
However, when it comes to service-oriented industries, the behavioral definition
is more appropriate from a practical sense seeing as it is more measurable
(Bennet 2002, Bass 1974). Results based on loyalty test conducted in this
research coupled with comparison to previous works proved that the using the
behavioral dimension of customer loyalty is accurate and effective in providing
reliable results in the research conducted. The attitudinal characteristics of
customer loyalty proved to be less relevant in the context of the restaurant
industry.
2. What measurement tool for customer loyalty should be used to
conduct the research in the Lebanese restaurant industry?
The measurement of customer loyalty is based on Reichheld (2001)
Loyalty Acid Test with emphasis on likeliness to return, satisfaction, likeliness to

26
purchase if substitutes exist, and other behavioral factors. The result of the test
was then summarized in one rating and used as a variable to answer the
remaining questions.
3. How does the variation in overall service rating affect the overall
customer loyalty rating in Lebanese restaurants?
This constitutes the central question of the research. A quantitative
relationship between overall customer loyalty and overall service quality was
investigated. Following are the null and the derived hypothesis.
H3o: The overall rating of service quality in Lebanese restaurants is not
correlated to the overall customer loyalty rating.
H3a: The overall rating of service quality in Lebanese restaurants is
positively correlated to the overall customer loyalty rating.
4. How does the variation in one of the SERVQUAL service component
variables impact the overall customer loyalty rating in Lebanese restaurants?
Further to investigating how the overall service quality rating affects the
overall customer loyalty rating, the effect of each of SERVQUAL’s separate
dimension of service on customer loyalty were analyzed to identify what factors
are more relevant and should be prioritized by restaurant owners and managers.
The hypothesis and its null are as follows:
H4o: The rating of any single or combination of the SERVQUAL service
components is not correlated to the overall customer loyalty rating.
H4a: The rating of any single or combination of the SERVQUAL service
components is positively correlated to the overall customer loyalty rating.
27
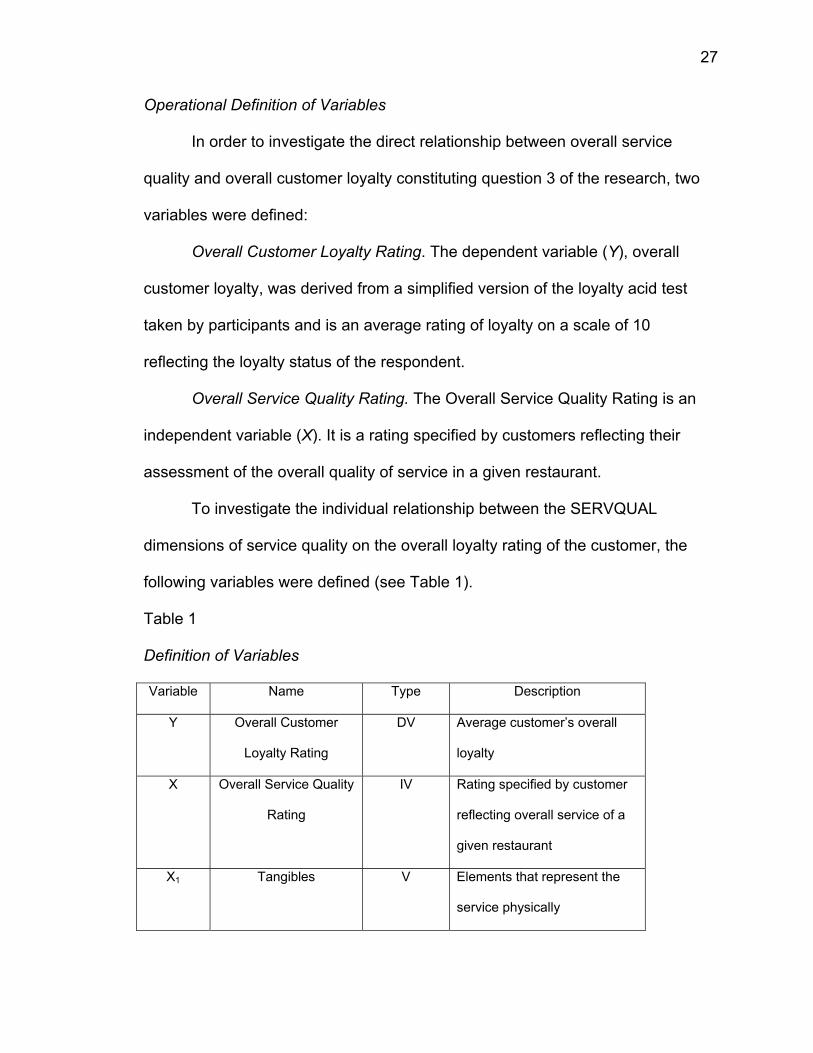
Operational Definition of Variables
In order to investigate the direct relationship between overall service
quality and overall customer loyalty constituting question 3 of the research, two
variables were defined:
Overall Customer Loyalty Rating. The dependent variable (Y), overall
customer loyalty, was derived from a simplified version of the loyalty acid test
taken by participants and is an average rating of loyalty on a scale of 10
reflecting the loyalty status of the respondent.
Overall Service Quality Rating. The Overall Service Quality Rating is an
independent variable (X). It is a rating specified by customers reflecting their
assessment of the overall quality of service in a given restaurant.
To investigate the individual relationship between the SERVQUAL
dimensions of service quality on the overall loyalty rating of the customer, the
following variables were defined (see Table 1).
Table 1
Definition of Variables
Variable Name Type Description
Y Overall Customer
Loyalty Rating
DV Average customer’s overall
loyalty
X Overall Service Quality
Rating
IV Rating specified by customer
reflecting overall service of a
given restaurant
X1 Tangibles V Elements that represent the
service physically

28
X2 Reliability V Ability to deliver promised
service accurately
X3 Responsiveness V Willingness to help customers
and provide prompt service
X4 Assurance V Ability to inspire trust and
confidence
X5 Empathy V How customers are treated
individually
Description of Materials and Instruments
The research was conducted using two questionnaires. The first
questionnaire (see Appendix A) deals with the perceived service quality and is
centered on the SERVQUAL criteria and using the five-point Likert-type
excellence model, where customers were asked to rate each criterion on a scale
consisting of 1 to 5 with 5 being Excellent and 1 being Poor as shown in Table 2.
Table 2
Likert Scale 1 2 3 4 5
Poor Fair Neutral Good Excellent
The customers were then asked to rate the overall customer service of the
restaurant which constitutes variable X as described in Table 1. This type of
questionnaire is commonly used for its simplicity and its responsiveness. Majali

29
(2006), El-Hakim (2003), and Fu and Parks (2001) all use this model in their
questionnaires.
The second questionnaire is the customer loyalty questionnaire based on
the Acid Loyalty Test (see Appendix B). This was given simultaneously with the
service quality questionnaire and was used to derive an overall customer loyalty
rating. Incentives were given prior to the questionnaire in order to instill a sense
of duty in the respondent to answer objectively.
In the proposed research the impact of variations in those factors on
customer loyalty were analyzed, but with caution not to fall into the “satisfaction
survey” (Reichheld, 1995, p.2) trap; the questionnaire did not include any
questions regarding general customer satisfaction focused specifically on
customer loyalty. In attempting to analyze and measure customer loyalty, many
researchers have fallen into Reichheld’s customer satisfaction trap. Loyalty could
be viewed as a consequence of satisfaction that results in an action (such as
repeated purchase) while satisfaction is a mere feeling that does not necessarily
lead to an action.
Selection of Participants
The survey was conducted on a variety of restaurants (see Table 3)
covering different income segments of the market based on average spending
per customer per restaurant. This gave a more comprehensive idea about the
whole market and the different customers.
Table 3
Description of restaurants surveyed

30
Restaurant Food Type Average dollar spending per customer
Roadster’s Diner American 12.00
ZWZ Lebanese Fast Food 8.00
Sultan Ibrahim Lebanese Mezzeh 30.00
La Parilla Argentinean
Steakhouse
50.00
Chopsticks Chinese 15.00
Sushi Bar Japanese 50.00
Chicken Inc. Fast Food 8.00
The sample population was a random set that was composed of 63
subjects and was conducted on a period of one week in order to cover the whole
weekly cycle of the restaurant which included all typical customers during the
week from families to couples to corporate customers. The survey did not
differentiate between gender and age group of customers in restaurants.
Procedures
In agreement with restaurant owners, the survey questionnaires were
distributed over a period of one week in all restaurants mentioned in Table 3.
Questionnaires were given to customers after they completed their meal and
before they ordered their bills. Each customer received two questionnaires; the
Customer Acid Test and the Service Quality Questionnaire. A dessert coupon
was usually given to each customer after completing the questionnaire as an

31
incentive. In some restaurants, such as Sultan Ibrahim, Turkish coffee was
offered instead of the dessert.
Discussion of Data Processing
After the questionnaires were completed, the data was collected and
analyzed with two sets of data resulting from the questionnaires. Each set of data
was separately entered for analysis using the SPSS 16.0 for Windows release
16.0.1 statistical software.
From the data collected, the Y (Overall Customer Loyalty Rating) variable
was calculated. The form for calculation is included in Appendix C. The variable
Y was calculated for each individual Customer Acid Test survey and a
subsequent set of Overall Customer Loyalty Rating results was obtained. In this
method of calculation, it is assumed that the ratings of the Customer Acid Test
questions are of equal importance and have an equal weight when calculating
the average.
Then, a correlation between Y (Overall Customer Loyalty Rating) and X
(Overall Service Quality Rating) was calculated and linear regression analysis
was used in order to verify the correlation. This was done by calculating the
correlation coefficient r based on the Pearson product-moment method. The
value of r should range between -1.0 and 1.0 and determines the extent and type
of correlation between the variables. A value close to the extremities indicates a
high correlation and indicates whether the correlation is negative or positive. A
close to zero value indicates no correlation and a value in between indicates the
existence of correlation to some moderate degree depending on the value.

32
The second set of data consisted of the different ratings for the five
variables of the SERVQUAL model (X1…5) was correlated with the Overall
Customer Loyalty Rating (Y) to derive a relationship between each individual
SERVQUAL service component and Overall Customer Loyalty in order to identify
the more important factors of service quality which affect customer loyalty.
Therefore, a set of correlation coefficients ri was be calculated between each
individual rating and the Overall Customer Loyalty Rating.
Methodological Assumption, Limitations, and Delimitations
In the study to be conducted, there are assumptions to be considered
which are relevant to the accuracy of the data collected. First and foremost, it
was assumed that the surveyed customers have thoroughly understood and
accurately answered questions regarding loyalty and their perceptions of
customer service in the surveyed restaurant. Lebanon is an Arabic speaking
country, and although most restaurant patrons are educated and have a basic
understanding of the English language, it was not guaranteed that they were able
to answer in full accuracy. Another assumption to be considered is that the
behavioral-attitudinal definition of customer loyalty applies to the case at hand.
Furthermore, it is assumed that all criteria of the Customer Acid Test have equal
weight when calculating the average to derive the Overall Customer Loyalty
Rating.
In order to address the problem of understanding the survey questions,
the surveys were as self-explanatory as possible. Furthermore, the surveyor
clarified all possible all ambiguities and difficulties in understanding the

33
questionnaires. However, there is a limit to how much can be explained, and to
the number of surveyed patrons who can be engaged on a one-to-one basis.
Another limitation is the type of participants of the survey. Although the survey
was conducted in a diverse set of restaurants and included participants with
different income levels and from different cultural backgrounds, it cannot be
accurately stated that the survey was able to constitute a microcosm of the whole
restaurant market in Lebanon, keeping in mind that the Lebanese population is in
itself ethnically and religiously diverse. It is important to note here that the
Lebanese population consists of no less than 18 registered religious groups and
subgroups with different cultural backgrounds.
Ethical Assurances
The survey was conducted from an objective perspective and the data
from the questionnaires was not affected by the surveyor in any way. This was
done by directly entering the participant’s answers in the questionnaires into the
SPSS 16 statistical software without recalculating or altering the data in any way.
Furthermore, all subjects have been assured their anonymity and their opinions
will stay confidential and will not be disclosed to restaurant managers. The
respondents answered the questionnaires at their own will and respondents who
wished not to participate were not pressured to do so. In turn, the restaurant
managers gave their consent to conduct such a survey.

34
CHAPTER 4: FINDINGS
Overview
The following chapter presents the findings of the conducted research. It
includes a summary of the data found in the questionnaires. Then, an analysis
and evaluation of the data will be given and it will be verified with the hypotheses.
The chapter will be concluded with a summary of the data, analysis, and results.
The research questions will be revisited in the next chapter and the final
conclusions of the research will be drawn.
The findings in this chapter deal with the quantitative part of the study in
which the correlation between quality of service and customer loyalty is
investigated at the broad level of overall perception of quality of service and
overall customer loyalty, and also at the more detailed level in which different
components of service based on the Servqual model are investigated. The
qualitative part of the research was done prior to conducting the survey and
answers research questions 1 and 2 established in Chapter I of this paper. They
are as follows:
1. How should customer loyalty be defined in the restaurant industry?
Literature review has shown that customer loyalty is being viewed as a
hybrid of two long established definitions of customer loyalty; attitudinal loyalty
defined by Czepiel and Gilmore (1987) and behavioral loyalty defined by Jacoby
and Chestnut (1978). In the restaurant industry, the behavioral aspect is more
significant in conducting research since it defines customer loyalty based on
repetitive behavior which itself is the driver of sales and revenue.

35
2. What measurement tool for customer loyalty should be used to
conduct the research in the Lebanese restaurant industry?
It was found that studying the behavioral aspects of customer loyalty give
a good indication of the effective loyalty of the customers. For that purpose, the
Customer Acid Test (Reichheld, 2001) was used as a tool for conducting the
survey on customer loyalty in Lebanese restaurants.
In the following section, a summary of the findings of both the Service
Quality questionnaire (see Appendix A) and the Customer Loyalty Test (see
Appendix B) based on Reichheld’s (2001) Customer Acid Test will be given. The
survey was conducted on 63 respondents in 7 different restaurants in Lebanon.
Findings
The survey was conducted in 7 different restaurants serving different
types of food and catering for patrons of different income levels. The respondents
per restaurant are shown in Table 4.
Table 4
Respondents per restaurant Restaurant Respondents Food Type Average dollar spending per customer
Roadster’s Diner 11 American 12.00
ZWZ 12 Lebanese
Fast Food
8.00
Sultan Ibrahim 7 Lebanese
Mezzeh
30.00
La Parilla 6 Argentinean
Steakhouse
50.00

36
Chopsticks 10 Chinese 15.00
Sushi Bar 8 Japanese 50.00
Chicken Inc. 9 Fast Food 8.00
TOTAL 63
The respondents were given two questionnaires. The first is the Service
Quality Questionnaire (see Appendix A) in which customers were asked to rate
the restaurant’s five SERVQUAL components on a scale from 1 to 5, with 5 being
the highest and 1 being the lowest. The second questionnaire (see Appendix B),
was the Customer Loyalty test comprised of 12 questions answered on a scale
from 0 to 10 with 10 being most likely and 0 being not likely at all.
The descriptive statistics of the Service Quality Questionnaire were
generated by the SPSS 16 software are given in Table 5.
Table 5
Mean rating of SERVQUAL components SERVQUAL Component
Mean Rating Standard Deviation
[X1] Tangibles 4.3175 0.7145
[X2] Reliability 4.3810 0.6072
[X3] Responsiveness 3.7143 0.7055
[X4] Assurance 3.5714 0.8370
[X5] Empathy 3.7143 0.8314

37
[X] Overall
Service Quality 3.9365 0.6189
The respondents simultaneously filled the Customer Loyalty Test
questionnaire composed of twelve questions. The descriptive statistics were
generated by the SPSS 16 software and are given in Table 6 below. The
dependant variable Overall Customer Loyalty(Y) was then calculated for each
survey by finding the average of the ratings of the 12 questions. The rating found
indicates the customer loyalty of each respondent.
Table 6
Mean rating of Customer Loyalty Test
Question Mean Rating
Standard Deviation
[Q1] How likely are you to continue buying the
Restaurant’s products and/or services from this
Restaurant?
7.5556 1.0592
[Q2] If you were selecting a similar Restaurant for the
first time, how likely is it that you would choose this
Restaurant again?
7.5397 1.3892
[Q3] Overall, how likely are you to provide enthusiastic
referrals for this Restaurant? 6.8889 1.2587
[Q4a] Restaurant really cares about building a
relationship with me 6.5238 1.0137
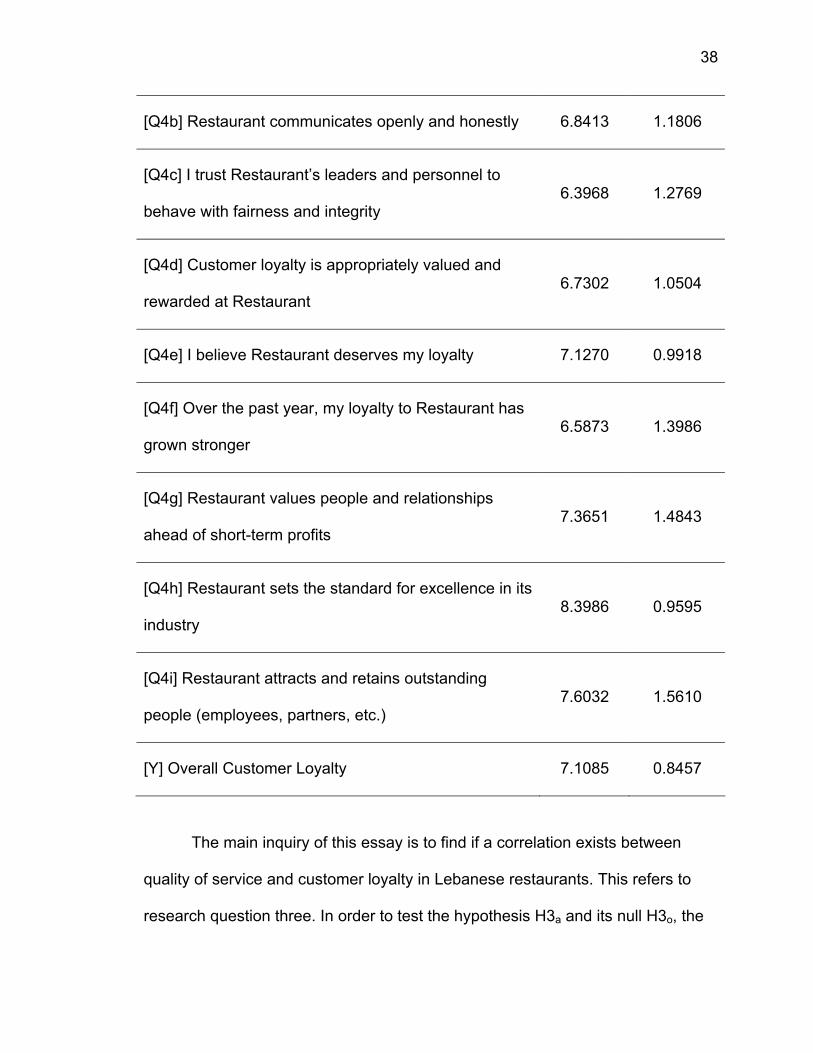
38
[Q4b] Restaurant communicates openly and honestly 6.8413 1.1806
[Q4c] I trust Restaurant’s leaders and personnel to
behave with fairness and integrity 6.3968 1.2769
[Q4d] Customer loyalty is appropriately valued and
rewarded at Restaurant 6.7302 1.0504
[Q4e] I believe Restaurant deserves my loyalty 7.1270 0.9918
[Q4f] Over the past year, my loyalty to Restaurant has
grown stronger 6.5873 1.3986
[Q4g] Restaurant values people and relationships
ahead of short-term profits 7.3651 1.4843
[Q4h] Restaurant sets the standard for excellence in its
industry 8.3986 0.9595
[Q4i] Restaurant attracts and retains outstanding
people (employees, partners, etc.) 7.6032 1.5610
[Y] Overall Customer Loyalty 7.1085 0.8457
The main inquiry of this essay is to find if a correlation exists between
quality of service and customer loyalty in Lebanese restaurants. This refers to
research question three. In order to test the hypothesis H3a and its null H3o, the

39
Pearson’s correlation factor R is calculated using the correlation function of the
SPSS 16 software between the dependant variable Overall Customer Loyalty (Y)
and the independent variable Overall Service Quality (X). The secondary inquiry
of this research is to find which of the SERVQUAL components is more relevant
to the restaurant industry. This was also done by calculating the correlation
between the ratings of the individual SERVQUAL components (independent
variables X1-5) and the dependant variable Overall Customer Loyalty (Y). The
Pearson R factors are given in the table below.
Table 7
Correlations Variables Correlation
[Y] Overall Customer Loyalty
[X] Overall Service Quality 0.671
[X1] Tangibles 0.512
[X2] Reliability 0.410
[X3] Responsiveness 0.643
[X4] Assurance 0.636
[X5] Empathy 0.616

40
Analysis and Evaluation of Findings
The tabulated data and statistics presented in the Findings section have
significant implications regarding the research questions and hypotheses. They
also reveal important data regarding quality of service and customer loyalty in
Lebanese restaurants. In this section, the data is evaluated and analyzed.
The Service Quality Questionnaire based on the five SERVQUAL
components (Zeethaml, Parasuraman and Berry, 1988) shows that there are
general trends in the perception of service quality in Lebanese restaurants. Table
8 shows the averages of the different ratings resulting from the questionnaire
from highest to lowest.
Table 8
SERVQUAL ratings from highest to lowest SERVQUAL Component
Mean Rating Standard Deviation
Reliability 4.3810 0.6072
Tangibles 4.3175 0.7145
Responsiveness 3.7143 0.7055
Empathy 3.7143 0.8314
Assurance 3.5714 0.8370
Table 8 shows that the Lebanese customers perceive Reliability as the
best component of service in Lebanese restaurants with Assurance having the

41
lowest rating. Lebanese restaurants are better at providing reliable service and
also score a high rating when it comes to tangibles. This apparent trend is
justifiable given that Lebanese restaurant managers tend to focus on providing
consistent reliable quality and give importance to image which is materialized in
high quality tableware and their dependence on branding and design (Majali,
2006). The average of the Overall Service Quality for the survey was 3.9365 (on
a scale from 1 to 5).
The most significant results of the Customer Acid Test are shown in Table
9.
Table 9
Significant results of Customer Acid Test
Question Mean Rating
Standard Deviation
[Q4a] Restaurant really cares about building a
relationship with me 6.5238 1.0137
[Q4c] I trust Restaurant’s leaders and personnel to
behave with fairness and integrity 6.3968 1.2768
[Q4d] Customer loyalty is appropriately valued and
rewarded at Restaurant 6.7302 1.0504
[Q4h] Restaurant sets the standard for excellence in its
industry 8.3968 0.9595
[Y] Overall Customer Loyalty 7.1085 0.8457

42
The average of the Overall Customer Loyalty rating, 7.1085 (on a scale
from 1 to 10), indicates a good level of customer loyalty. However, there is
potential for a higher rating. The more significant findings of the questionnaire are
the lower ratings given for some statements of the survey. Notably, the
restaurant is perceived as not caring to build a relationship with customers. Also,
customers do not highly trust the integrity and fairness of the restaurant staff and
also gave lower ratings for how much the restaurant values customer loyalty. By
contrast, most customers believe that the restaurant they visited sets the
standard for excellence in the industry, meaning that they regard it as better than
its competition. This is a good explanation for repetitive behavior on the part of
the customers although they do not on average believe that the respective
restaurants focus on building customer loyalty and integrity. This indicates that
customers might be loyal to restaurants not because of the restaurant’s efforts to
make them more loyal, but because the restaurant is the best there is amongst
its competitors. This coincides with the high ratings given by customers for
tangibles and reliability in the Quality Service Questionnaire and respectively
lower ratings given for empathy, assurance, and responsiveness.
The correlations shown in Table 7 are main indicators of the same
phenomenon. The testing of hypotheses H3a and H3o reveals a Pearson’s R
factor of 0.671 which shows that there is a positive correlation between Overall
Service Quality and Overall Customer Loyalty. In testing the hypotheses H4a and
H4o, it was shown that Responsiveness and Assurance are more positively
correlated with Overall Customer Loyalty (0.643 and 0.636 respectively) than

43
Empathy, Tangibles, and Reliability (0.616, 0.512, and 0.410 respectively). They
are therefore more relevant to improving customer loyalty. This supports the idea
that customer loyalty in Lebanese restaurants is driven by elements of service
that are concerned with the human interaction between customers and staff
rather than what the restaurant has to offer in terms of quality and image.
Hypotheses Testing
The statistical survey was designed to test the hypotheses H3 and H4 and
their nulls.
H3o: The overall rating of service quality in Lebanese restaurants is not
correlated to the overall customer loyalty rating.
H3a: The overall rating of service quality in Lebanese restaurants is
positively correlated to the overall customer loyalty rating.
H4o: The rating of any single or combination of the SERVQUAL service
components is not correlated to the overall customer loyalty rating.
H4a: The rating of any single or combination of the SERVQUAL service
components is positively correlated to the overall customer loyalty rating.
The correlation value of 0.671 (see Table 7) between Overall Service
Quality and Overall Customer Loyalty indicates that there is a positive correlation
between service quality and customer loyalty in Lebanese restaurants and thus
the null hypothesis H30 should be rejected. Similarly, the positive correlation
values between each of the five SERVQUAL components X1-5 and Overall
Customer Loyalty (see Table 7) also indicate that the null hypothesis H40 should
be rejected. Therefore both null hypotheses H30 and H40 are rejected.

44
Summary
The findings of the survey show that the quality of service in Lebanese
restaurants is perceived as being relatively high (3.9365) with Tangibles and
Reliability achieving higher ratings than Empathy, Assurance, and
Responsiveness. The Overall Customer Loyalty rating was 7.1085 which is
relatively good, but has a margin for improvement. These findings verify the
problem specified at the beginning of the research; that customers do not show
very high customer loyalty.
The data shows a strong positive relationship between Overall Service
Quality and Overall Customer Loyalty (correlation of 0.671) and shows that the
service components of Responsiveness and Assurance are the more important
factors affecting customer loyalty.
The most likely explanation to the problem resulting is that restaurant
managers are focusing more on quality and image, shown in the higher ratings
given to Tangibles and Reliability rather than on the human factor ( Empathy,
Assurance, and Responsiveness) which is the driver of customer loyalty
according to the results of the correlations.
45
CHAPTER 5: SUMMARY, C0NCLUSIONS, AND RECOMMENDATIONS
Summary
This paper deals with the relationship between quality of service and
customer loyalty in Lebanese restaurants. The problem of diminishing revenues
attributed to low customer loyalty with customers easily switching between
restaurants was identified. Since the restaurant industry is a service based
industry, it was important to identify to uncover a relationship, if any exists,
between quality of service and customer loyalty.
Through a survey of existing literature, the SERVQUAL multidimensional
model (Zeethaml, Parasuraman and Berry, 1988) based on five components of
service (Tangibles, Reliability, Responsiveness, Assurance, and Empathy) was
deemed appropriate in order to investigate the quality of service in the restaurant
industry. The same model was used for similar researches in the industry such
as those of Bartlett and Han (2007), Bell Seigyoung & Smalley (2005), and Fu
and Parks (2001). Customer loyalty was defined as a hybrid of the two widely
accepted definitions of customer loyalty; the behavioral definition (Czepiel and
Gilmore, 1987) and the attitudinal definition (Jacoby and Chestnut, 1978).
Furthermore, there was a lack of existing literature on Lebanese restaurants in
general and the works of Majali (2006) helped in identifying the problems of the
market.
The experiment was then designed to find the relationship being
investigated. A Service Quality Questionnaire based on the SERVQUAL model
and a Customer Loyalty Test based on Reichheld’s (2001) Loyalty Acid Test

46
were distributed for a survey covering 7 Lebanese restaurants. The resulting
variables of Overall Customer Loyalty rating and Overall Service Quality rating
were correlated and other correlational measures were done between the
separate components of the SERVQUAL model and the Overall Customer
Loyalty rating. The correlation was done using the Pearson method.
The findings showed a strong positive correlation between service quality
and customer loyalty and identified that the components of Responsiveness and
Assurance are more important factors with regards to Customer Loyalty. This
adds a contribution to the little existing literature on Lebanese restaurants, and
identifies that restaurant managers should give more importance to
Responsiveness and Assurance in order to increase the loyalty of their
customers.
Conclusions
Restaurant managers in Lebanon have problems in understanding and
identifying the drivers of customer loyalty. Low behavioral customer loyalty has
caused restaurants to repeatedly lose customers without having possible
solutions for the problem. Research on the relationship between customer loyalty
and quality of service will have a strong impact on how restaurant managers view
service and what components of it they should focus on.
Regarding the definition of customer loyalty in restaurants, literature
research has shown that customer loyalty in the restaurant industry is a hybrid of
attitudinal and behavioral loyalty with more emphasis on the behavioral aspect
which is concerned with repetitive buying and switching between restaurants

47
(Ballinger and Rubinson 1996; Dick and Basu 1994; Oliver 1999). This aspect is
more significant because it is what drives revenues in the high turnover
restaurant business.
Through literature research, a customer loyalty questionnaire (see
Appendix B) was designed based on Reichheld’s (2001) Customer Acid Test
since this type of questionnaire emphasizes the behavioral aspect of customer
loyalty. This questionnaire has proved efficient and useful.
The survey was conducted and the analysis of the findings has shown that
the service quality and customer loyalty are highly positively correlated.
Therefore, improving the quality of service in Lebanese restaurants should have
a noticeable impact on customer loyalty. Furthermore, the survey has shown that
the quality of service is perceived as high (3.965 on a scale of 1 to 5) in the
surveyed restaurants, and that customer loyalty is at an acceptable overall rating
of 7.1085 on a scale of 0 to 10. However, customer loyalty can still be increased.
The findings have also shown that customers perceive tangibles and reliability as
better than the other components of customer services.
A further study on the correlation between the different components of the
SERVQUAL model and customer loyalty has shown that responsiveness and
assurance have a higher impact on customer loyalty and should thus be the
focus of restaurant managers.
Recommendations
This study has given an important insight on how service quality affects
customer service in Lebanese restaurants. The findings have shown that

48
restaurant managers should focus on the human aspect of customer service
which has a stronger impact on customer loyalty. The findings have also shown
that customers are loyal to restaurants not due to the restaurants’ efforts on
improving their relationships with their customers, but more due to the position of
these restaurants with regards to their competitors on the market and their focus
on high quality and image. It is therefore recommended that restaurant managers
find ways to improve their relationships with their customers on a human level.
This opens possibilities on the different ways that can be achieved and
constitutes a good topic for further research into the matter.

49
REFERENCES
Bass, F. (1974), The theory of stochastic preference and brand switching. Journal of Marketing Research, 11(1), 1-20.
Ballinger, A. L. & Rubinson, J. (1996), Brand loyalty: the link between attitude
and behavior. Journal of Advertising Research, 36(6), 22-34. Bartlett, J. Han, F. (2007). Analysis of service quality in restaurants in China: An
Eastern perspective. ABR & TLC Conference Proceeding. Hawaii, USA. Bell, S.J. Seigyoung, A. & Smalley, K. (2005). Customer relationship dynamics:
Service quality and customer loyalty in the context of varying levels of customer expertise and switching costs. Journal of the Academy of Marketing Science, 33(2), 169–183.
Bennet, R. (2002). Identifying the key issues for measuring loyalty. Australasian
Journal of Market Research, 9(2), 27-44. Bloemer J. De Ruyter K. Wetzels, M. (1999). Linking perceived service quality
and service loyalty: A Multi-dimensional perspective. European Journal of Marketing, 33(11/12), 1082.
Chen, I. & Gupta, A. (1995). Service quality: implications for management
development. International Journal of Quality & Reliability Management, 12(7), 28–35
Cyrrhus Tours (n.d.) Offering services for travel and tourism. Retrieved
December 27, 2006 from http://www.cyrrhus.com/companypro.htm Czepiel, A. & Gilmore, R. (1987). Exploring the concept of loyalty in services. The
Services Marketing Challenge: Integrating for Competitive Advantage. Pp 91-4.
El Hakim, H. (2003). Customer satisfaction and its relationship with service
quality: the Middle East Airlines (MEA) as a case study. Suleiman S. Olayan School of Business. American University of Beirut Publications.
Food franchising and the right blend. (2007). Kipp report, new business thinking.
Retrieved October 21, 2007 from http://www.kippreport.com/article.php?articleid=705 Fu, Y. & Parks, S.C. (2001). The relationship between restaurant service quality
and consumer loyalty among the elderly. Journal of Hospitality & Tourism Research, 25(3), 320–326

50
Heskett, J. L., T. O. Jones, G. W. Loveman, W. E. Jr. Sasser, and L. A. Schlesinger (1994, March-April). Putting the service–profit chain to work. Harvard Business Review, pp. 164-174.
Hu, C, Jang S, & McCain S. (2005). Service quality gap analysis toward
customer loyalty: practical guidelines for casino hotels. International Journal of Hospitality Management, 24(3), 465–472.
Jacoby, J. & Chestnut R. (1978), Brand loyalty: Measurement and management,
New York: John Wiley & Sons. Koutouvalas, D.K. & Siomkos, G.J. (2006, January). An examination of the
relationship between service quality perceptions and customer loyalty in public versus private Greek banks. International Journal of Financial Services Management, 2(3), 190–204.
Locate Zaatar W Zeit. (n.d.). Retrieved November 15, 2007 from
http://www.zaatarwzeit.net/locate_zwz.shtml Magnusson, J. & Sundin, E. (2005). Service tangibility and customer loyalty: Is
there a relationship. Jonkoping International Business School, Jonkoping University.
Majali, N. Ayman. (2006). Impact of developing customer relationships on sales
in small family owned restaurants in Lebanon. Suleiman S. Olayan School of Business. American University of Beirut Publications.
Myerscough, M. (2002). Concerns about SERVQUAL’s underlying dimensions.
IACIS, pp. 462 – 470. Oliver, R.L. (1999). Whence consumer loyalty? Journal of Marketing [Special
Edition], pp. 33 – 45. Ostrowski, P.L., O’Brien , T.V. & Gordon, G.L. (1993). Service quality and
customer loyalty in commercial airline industry. Journal of Travel Research, 32(2),16–24.
Parasuraman , A. Berry, L. & Zeithaml,V. (1985). A conceptual model of service
quality and its implications for future research. Journal of Marketing, 49(4),41-50.
Parasuraman , A. Berry, L. & Zeithaml,V. (1988) SERVQUAL: A multiple-item
scale for measuring consumer perceptions of service quality. Journal of Retailing, 64(1),12-37.

51
Reichheld, F. (2001). Loyalty rules ! How today’s leaders build Lasting relationships. Harvard Business School Press.
Reichheld, F. (1995). Loyalty effect: The satisfaction trap. Essay # 5. Bain &
Company. SATMETRIX Customer Acid Text (n.d.). Retrieved February 2, 2007, from
http://www.loyaltyrules.com/loyaltyrules/acid_test_customer.html Shankar, V. Smith, A. & Rangaswamy, A. ( 2000 ). Customer satisfaction and
loyalty in online and offline environments. Marketing. Center for Electronic Markets and Enterprises.
Singer, E. & Kulka, R.A. (2002). Paying respondents for survey participation.
Studies of Welfare Populations: Data Collection and Research Issues. 105-128. Committee on National Statistics. Division of Behavioral and Social Sciences and Education.
Singer, E (n.d). Survey methodology program. The use of incentives to reduce
nonresponse in household surveys. Survey Research Center. The University of Michigan Institute for Social Research.

APPENDIXES

53
Appendix A
Service Quality Questionnaire
RESPONDENT # : ______________
Please rate the following service quality criteria by circling the most appropriate
number.
1 Tangibles: Rate the restaurant’s service
material (tableware, tablecloth, plates, cups).
Excellent Good Neutral Fair Poor
5 4 3 2 1
2 Reliability: Rate the restaurant’s ability to
provide service accurately and consistently.
Excellent Good Neutral Fair Poor
5 4 3 2 1
3 Responsiveness: Rate the restaurant’s ability
to help customers and provide prompt service.
Excellent Good Neutral Fair Poor
5 4 3 2 1
4 Assurance: Rate your confidence and trust in
the restaurant’s service.
Excellent Good Neutral Fair Poor
5 4 3 2 1
5 Empathy: Rate how you were treated by the
restaurant staff.
Excellent Good Neutral Fair Poor
5 4 3 2 1
6 Rate the restaurant’s overall quality of service. Excellent Good Neutral Fair Poor
5 4 3 2 1

54
Appendix B
Customer Loyalty Test
RESPONDENT # : ______________
Please rate the following on a scale from 0 to 10 with 10 being ‘most likely,’ 0 ‘not
likely at all,’ and 5 indicating ‘neutral.’
1. How likely are you to continue buying the Restaurant’s products and/or
services from this Restaurant ? ________
2. If you were selecting a similar Restaurant for the first time, how likely is it
that you would choose this Restaurant again? ________
3. Overall, how likely are you to provide enthusiastic referrals for this
Restaurant? ________
4. Please rate your overall agreement with the following statements:
Attribute Agreement
a. Restaurant really cares about building a relationship with me
b. Restaurant communicates openly and honestly
c. I trust Restaurant’s leaders and personnel to behave with fairness and
integrity
d. Customer loyalty is appropriately valued and rewarded at Restaurant

55
e. I believe Restaurant deserves my loyalty
f. Over the past year, my loyalty to Restaurant has grown stronger
g. Restaurant values people and relationships ahead of short-term
profits
h. Restaurant sets the standard for excellence in its industry
i. Restaurant attracts and retains outstanding people (employees,
partners, etc.)

56
Appendix C:
Overall Customer Loyalty Rating Calculation Form
RESPONDENT # : ______________
Question
(Customer Acid Test)
Rating
1
2
3
4a
4b
4c
4d
4e
4f
4g
4h
4i
Average
Overall Customer Loyalty Rating:______________