Embed Size (px)
Citation preview
Canadian TEMPO-related
Activities
Chris McLinden
Air Quality Research Division, Environment Canada
3rd TEMPO Science Team Meeting
Huntsville, AL 27-28 May 2015
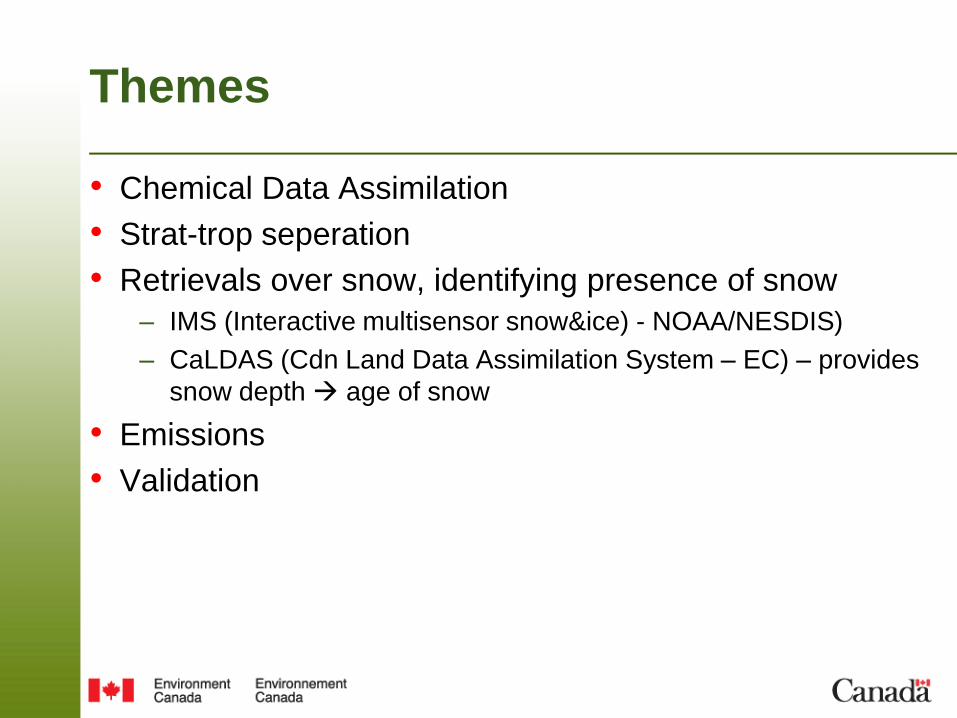
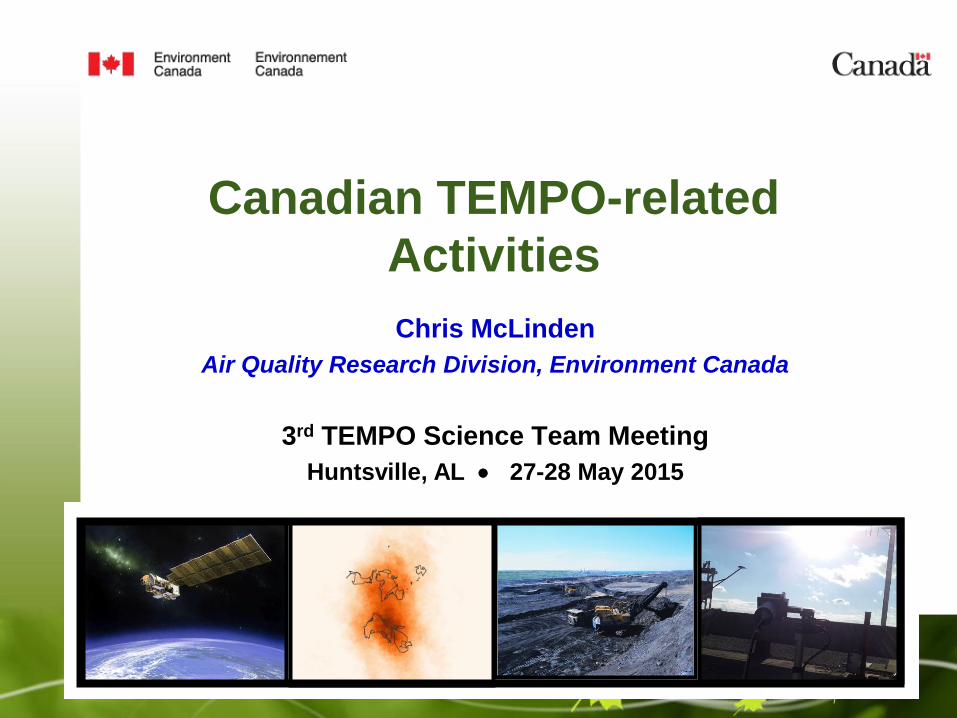
Themes
• Chemical Data Assimilation
• Strat-trop seperation
• Retrievals over snow, identifying presence of snow
– IMS (Interactive multisensor snow&ice) - NOAA/NESDIS)
– CaLDAS (Cdn Land Data Assimilation System – EC) – provides
snow depth age of snow
• Emissions
• Validation
Research Activities – CDA
• Currently EC has operational objective analyses of surface O3, NO2,
SO2, PM2.5, PM10 over North America
– Assimilation of these surface obs is being done in research mode
– TropOMI, MODIS AOD will be assimilated
• A large initiative is underway to have an operational assimilation/
forecasting system in place for 2019 that will use:
– EC GEM-MACH* operational AQ forecast model
– North American surface stations (O3, NO2, PM2.5)
– TEMPO (+ TropOMI) measurements of O3, NO2, AOD
– TEMPO SO2, HCHO are TBD
– Stratospheric profiles of NO2 (pending availability)
* Global Environmental Multi-scale model - Modelling Air quality and CHemistry
Research Activities – CDA
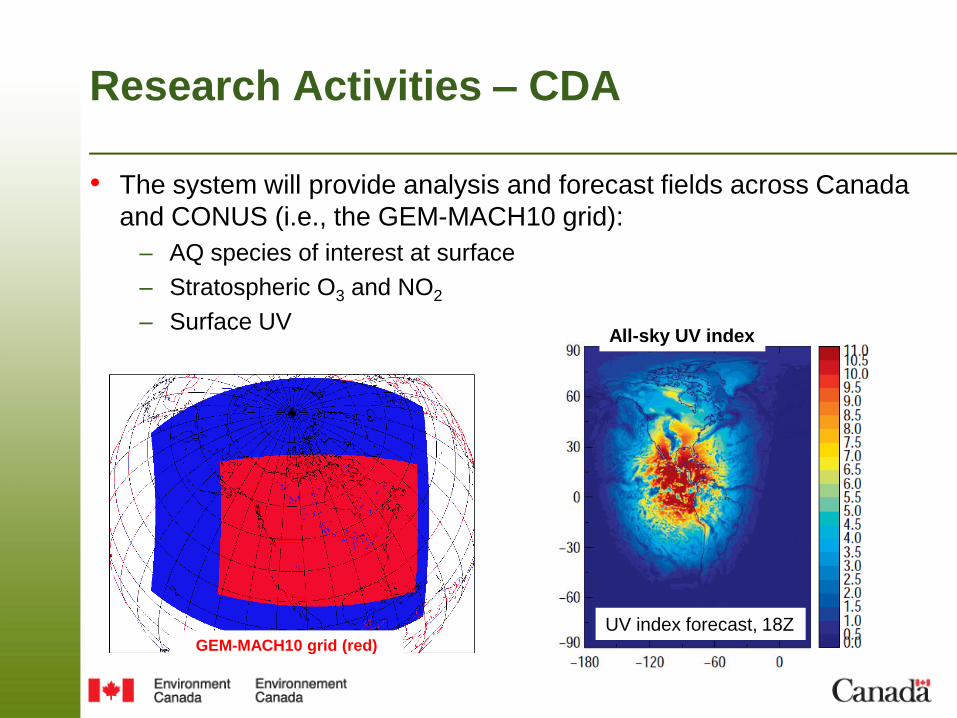
• The system will provide analysis and forecast fields across Canada
and CONUS (i.e., the GEM-MACH10 grid):
– AQ species of interest at surface
– Stratospheric O3 and NO2
– Surface UV
GEM-MACH10 grid (red)
All-sky UV index
UV index forecast, 18Z
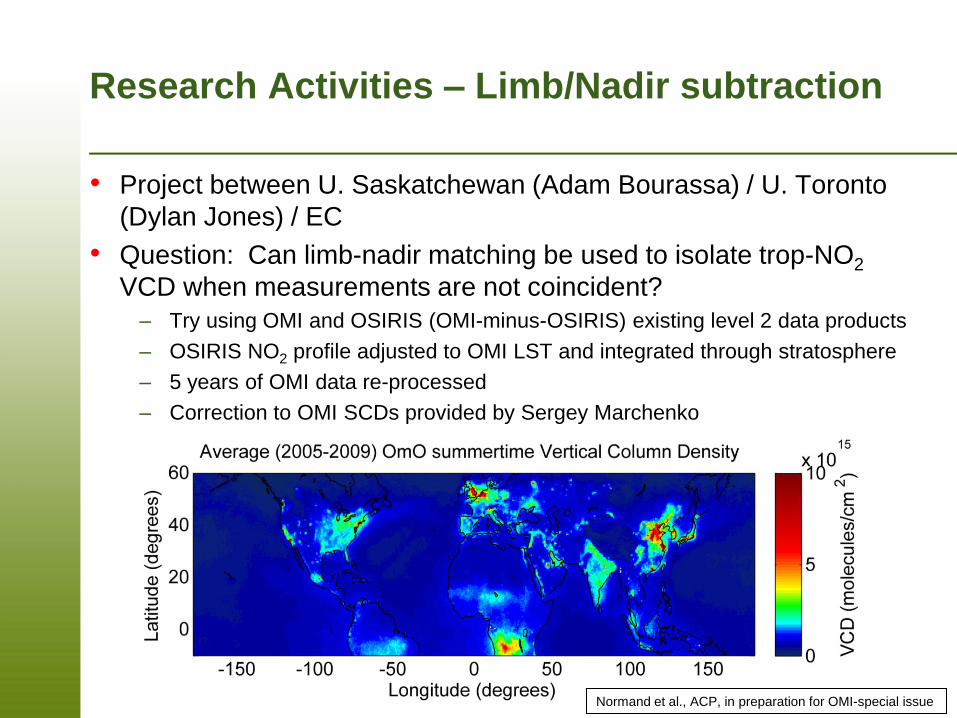
• Project between U. Saskatchewan (Adam Bourassa) / U. Toronto
(Dylan Jones) / EC
• Question: Can limb-nadir matching be used to isolate trop-NO2
VCD when measurements are not coincident?
– Try using OMI and OSIRIS (OMI-minus-OSIRIS) existing level 2 data products
– OSIRIS NO2 profile adjusted to OMI LST and integrated through stratosphere
– 5 years of OMI data re-processed
– Correction to OMI SCDs provided by Sergey Marchenko
Research Activities – Limb/Nadir subtraction
Normand et al., ACP, in preparation for OMI-special issue
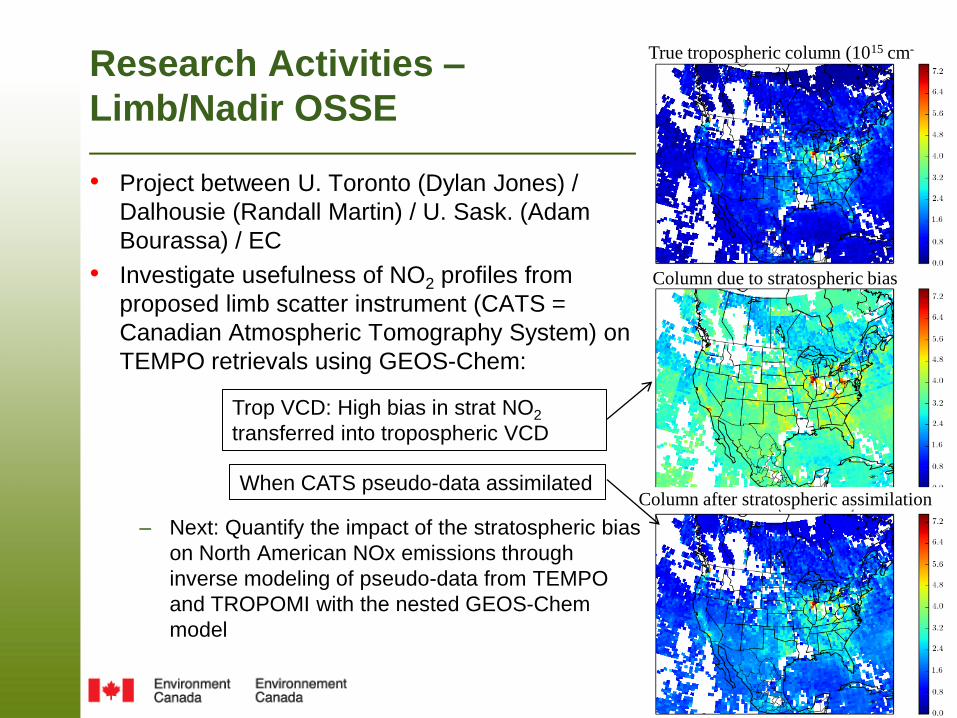
True tropospheric column (1015 cm-
2)
Column due to stratospheric bias
Column after stratospheric assimilation
• Project between U. Toronto (Dylan Jones) /
Dalhousie (Randall Martin) / U. Sask. (Adam
Bourassa) / EC
• Investigate usefulness of NO2 profiles from
proposed limb scatter instrument (CATS =
Canadian Atmospheric Tomography System) on
TEMPO retrievals using GEOS-Chem:
– Next: Quantify the impact of the stratospheric bias
on North American NOx emissions through
inverse modeling of pseudo-data from TEMPO
and TROPOMI with the nested GEOS-Chem
model
Research Activities –
Limb/Nadir OSSE
Trop VCD: High bias in strat NO2
transferred into tropospheric VCD
When CATS pseudo-data assimilated
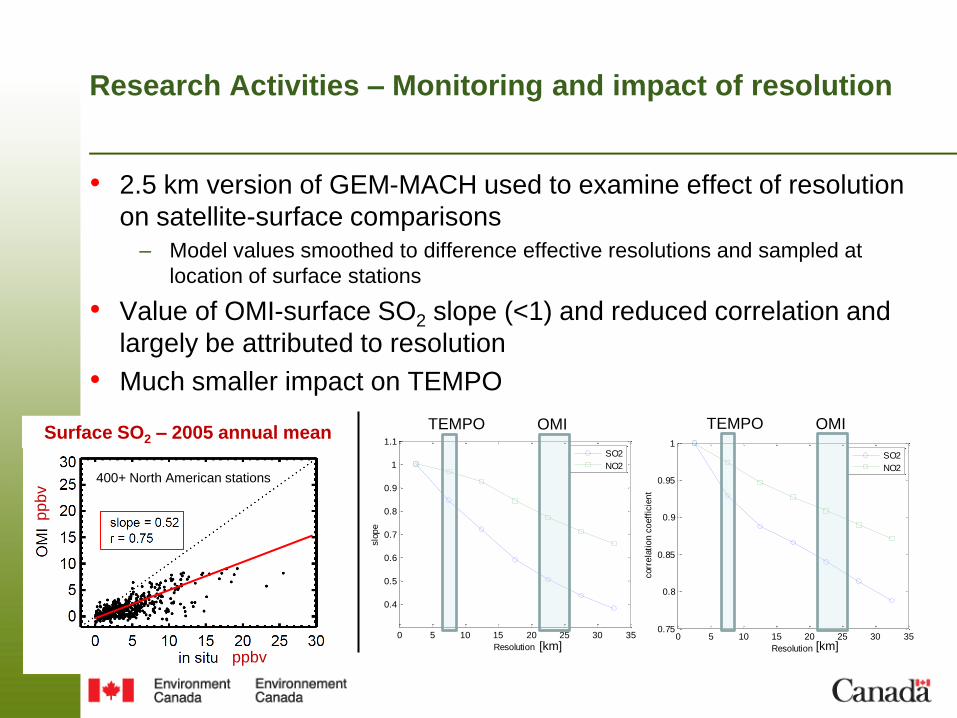
Research Activities – Monitoring and impact of resolution
• 2.5 km version of GEM-MACH used to examine effect of resolution
on satellite-surface comparisons
– Model values smoothed to difference effective resolutions and sampled at
location of surface stations
• Value of OMI-surface SO2 slope (<1) and reduced correlation and
largely be attributed to resolution
• Much smaller impact on TEMPO
ppbv
Surface SO2 – 2005 annual mean
pp
bv
0 5 10 15 20 25 30 350.75
0.8
0.85
0.9
0.95
1
Resolutioncorr
ela
tio
n c
oeff
icie
nt
SO2
NO2
0 5 10 15 20 25 30 35
0.4
0.5
0.6
0.7
0.8
0.9
1
1.1
Resolution
slo
pe
SO2
NO2
OMI
[km] [km]
TEMPO OMI TEMPO
400+ North American stations
2006 2007 2008 2009 2010 2011 2012 2013 201420
40
60
80
100
120
140
Year
SO
2 E
mis
sio
ns [
kt/
yr]
Trend = -3.4 0.5%/yrTrend = -3.3 1.5%/yr
NPRI
NPRI (3 yr)
OMI (3 yr)
2006 2007 2008 2009 2010 2011 2012 2013 201420
30
40
50
60
70
80
Year
NO
x E
mis
sio
ns [
kt/
yr]
Trend = 3.3 0.4%/yrTrend = 5.1 0.9%/yrTrend = 5.2 0.5%/yr
NPRI
NPRI (3 yr)
OMI (3 yr)
OMI (3 yr; fixed )
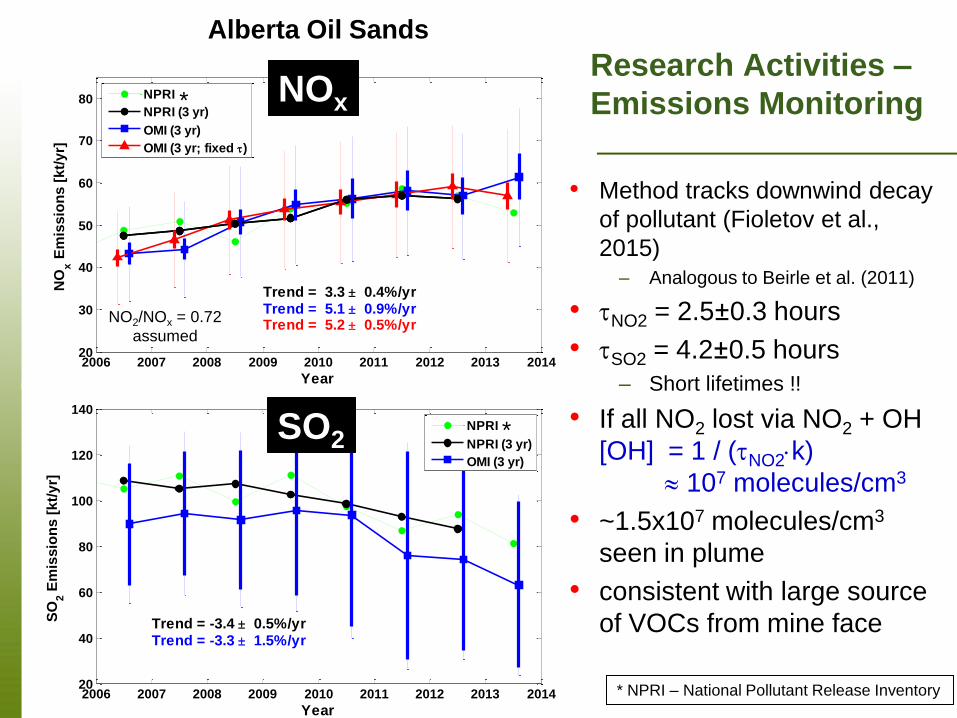
Research Activities –
Emissions Monitoring NOx
SO2
• Method tracks downwind decay
of pollutant (Fioletov et al.,
2015) – Analogous to Beirle et al. (2011)
• NO2 = 2.5±0.3 hours
• SO2 = 4.2±0.5 hours
– Short lifetimes !!
• If all NO2 lost via NO2 + OH
[OH] = 1 / (NO2k)
107 molecules/cm3
• ~1.5x10⁷ molecules/cm3
seen in plume
• consistent with large source
of VOCs from mine face
NO2/NOx = 0.72
assumed
Alberta Oil Sands
* NPRI – National Pollutant Release Inventory
*
*
Validation Activities
• EC deploying Pandora spectrometers to select monitoring
sites
– First four sites: Toronto, Oil sands, CARE (N of Toronto), Edmonton
– 6+ should be in place for TropOMI validation
– 8+ expected for TEMPO validation
• Aircraft campaigns:
– Aircraft campaign being planned for 2016/17 (possibly winter)\
– Support at EC for TEMPO validation campaign

Additional Material
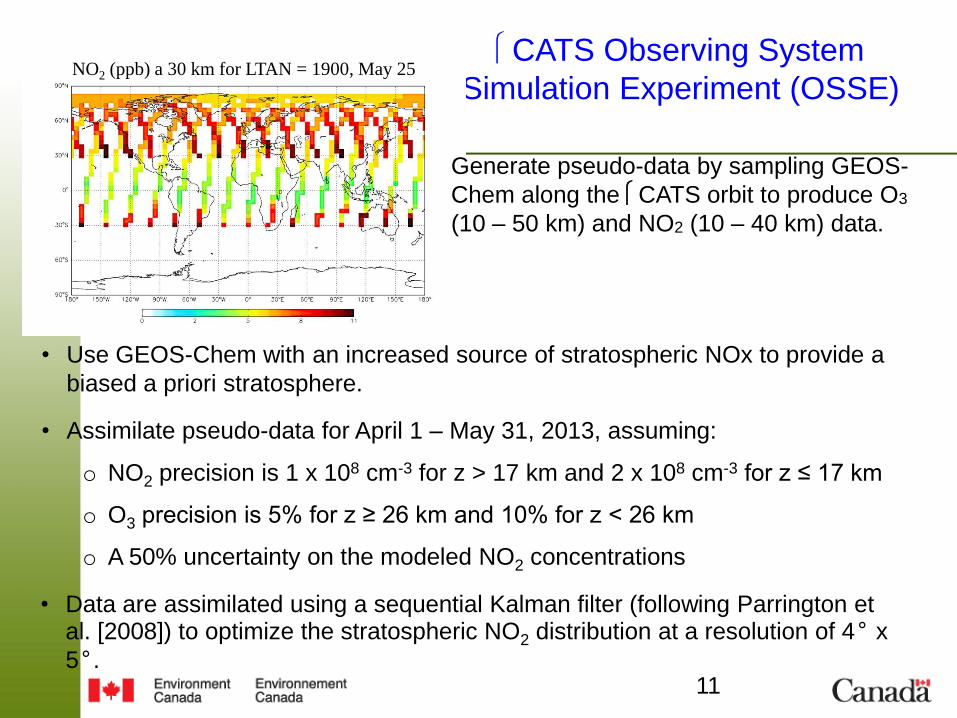
• Use GEOS-Chem with an increased source of stratospheric NOx to provide a
biased a priori stratosphere.
• Assimilate pseudo-data for April 1 – May 31, 2013, assuming:
o NO2 precision is 1 x 108 cm-3 for z > 17 km and 2 x 108 cm-3 for z ≤ 17 km
o O3 precision is 5% for z ≥ 26 km and 10% for z < 26 km
o A 50% uncertainty on the modeled NO2 concentrations
• Data are assimilated using a sequential Kalman filter (following Parrington et al. [2008]) to optimize the stratospheric NO2 distribution at a resolution of 4° x
5°.
CATS Observing System
Simulation Experiment (OSSE)
11
NO2 (ppb) a 30 km for LTAN = 1900, May 25
Generate pseudo-data by sampling GEOS-
Chem along the CATS orbit to produce O3
(10 – 50 km) and NO2 (10 – 40 km) data.
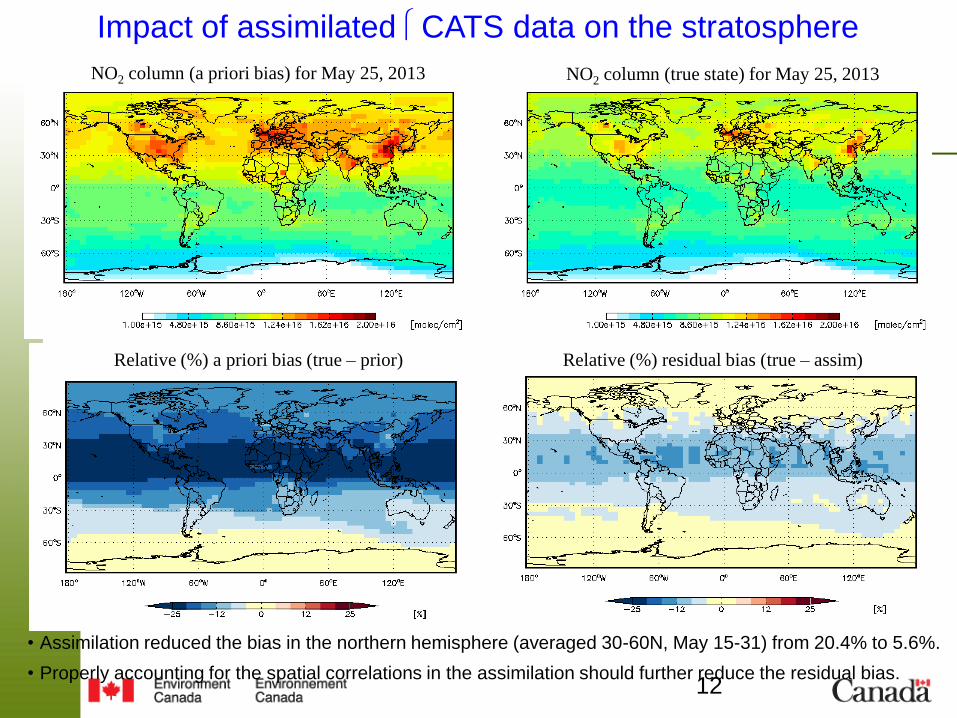
NO2 column (a priori bias) for May 25, 2013 NO2 column (true state) for May 25, 2013
Relative (%) a priori bias (true – prior)
Impact of assimilated CATS data on the stratosphere
12
Relative (%) residual bias (true – assim)
• Assimilation reduced the bias in the northern hemisphere (averaged 30-60N, May 15-31) from 20.4% to 5.6%.
• Properly accounting for the spatial correlations in the assimilation should further reduce the residual bias.
13
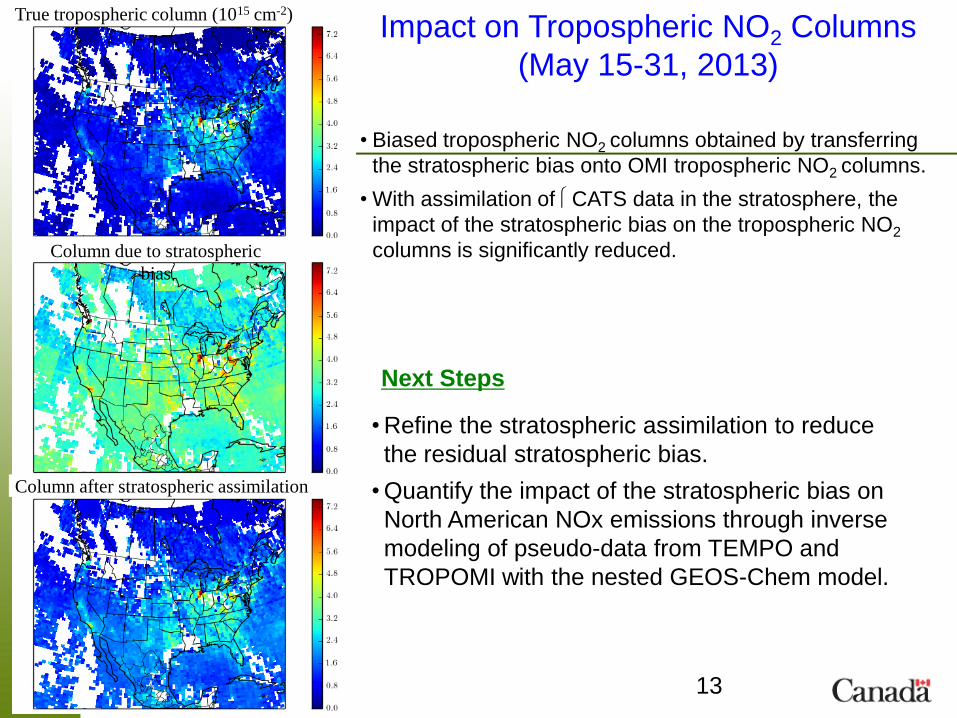
Impact on Tropospheric NO2 Columns
(May 15-31, 2013)
• Biased tropospheric NO2 columns obtained by transferring
the stratospheric bias onto OMI tropospheric NO2 columns.
• With assimilation of CATS data in the stratosphere, the
impact of the stratospheric bias on the tropospheric NO2
columns is significantly reduced.
True tropospheric column (1015 cm-2)
Column due to stratospheric
bias
Column after stratospheric assimilation
Next Steps
• Refine the stratospheric assimilation to reduce
the residual stratospheric bias.
• Quantify the impact of the stratospheric bias on
North American NOx emissions through inverse
modeling of pseudo-data from TEMPO and
TROPOMI with the nested GEOS-Chem model.
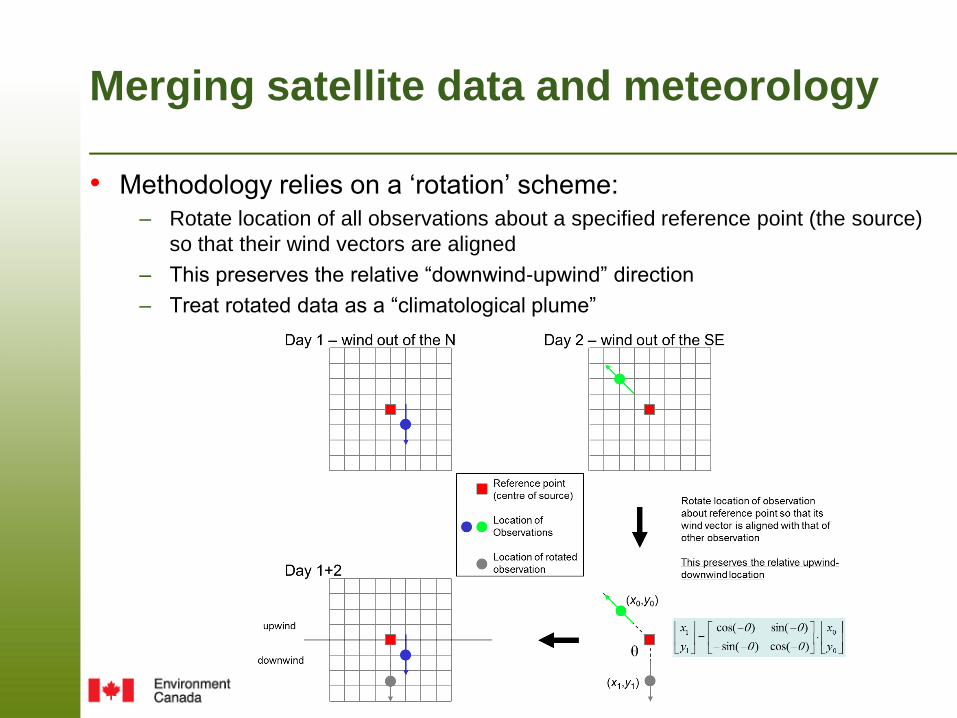
Merging satellite data and meteorology
• Methodology relies on a ‘rotation’ scheme:
– Rotate location of all observations about a specified reference point (the source)
so that their wind vectors are aligned
– This preserves the relative “downwind-upwind” direction
– Treat rotated data as a “climatological plume”
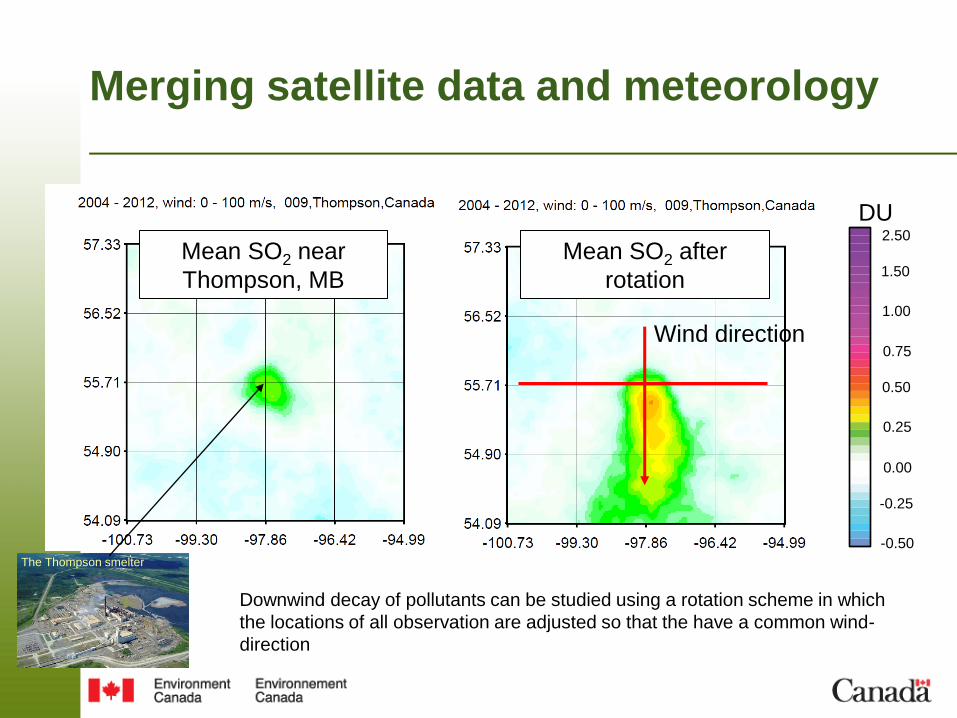
Wind direction
Downwind decay of pollutants can be studied using a rotation scheme in which
the locations of all observation are adjusted so that the have a common wind-
direction
The Thompson smelter
-1.0
-0.5
0.0
0.5
1.0
1.5
2.0
2.5
3.0
-0.50
-0.25
0.00
0.25
0.50
0.75
1.00
1.50
2.50
DU
Merging satellite data and meteorology
Mean SO2 near
Thompson, MB
Mean SO2 after
rotation
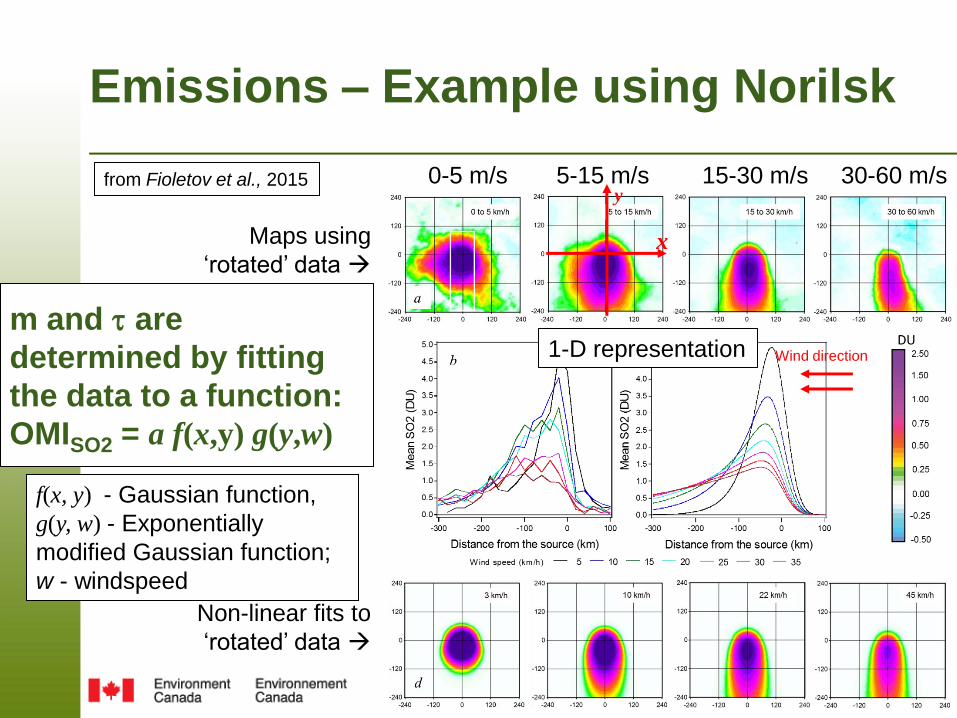
Emissions – Example using Norilsk
Maps using
‘rotated’ data
0-5 m/s 5-15 m/s 15-30 m/s 30-60 m/s
Non-linear fits to
‘rotated’ data
m and are
determined by fitting
the data to a function:
OMISO2 = a f(x,y) g(y,w)
f(x, y) - Gaussian function,
g(y, w) - Exponentially
modified Gaussian function;
w - windspeed
y
x
Wind direction 1-D representation
from Fioletov et al., 2015
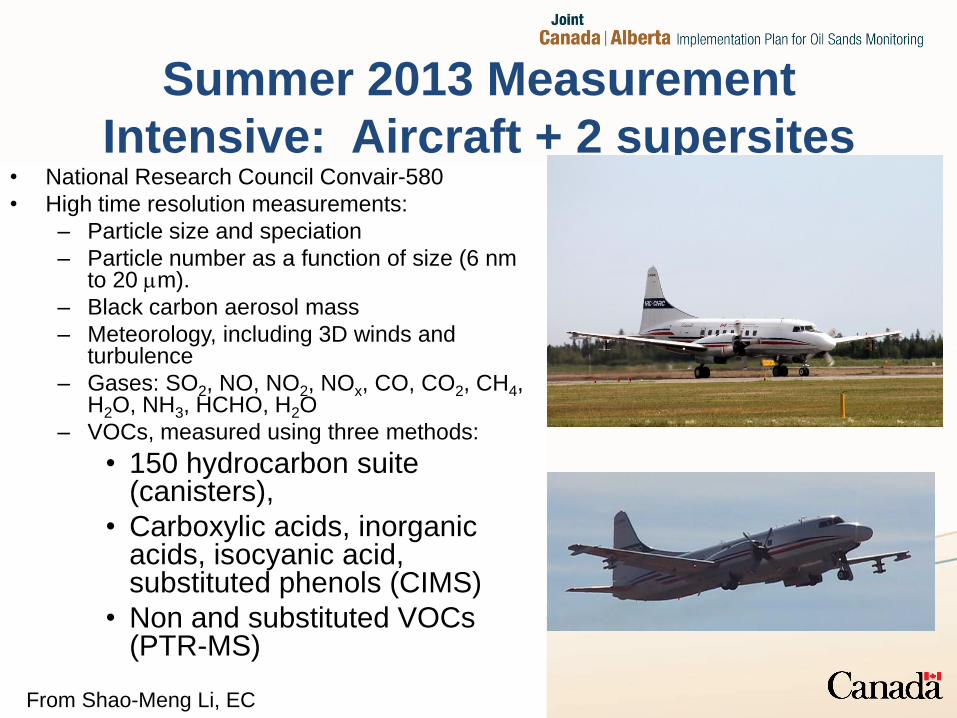
Summer 2013 Measurement
Intensive: Aircraft + 2 supersites • National Research Council Convair-580
• High time resolution measurements:
– Particle size and speciation
– Particle number as a function of size (6 nm to 20 mm).
– Black carbon aerosol mass
– Meteorology, including 3D winds and turbulence
– Gases: SO2, NO, NO2, NOx, CO, CO2, CH4, H2O, NH3, HCHO, H2O
– VOCs, measured using three methods:
• 150 hydrocarbon suite (canisters),
• Carboxylic acids, inorganic acids, isocyanic acid, substituted phenols (CIMS)
• Non and substituted VOCs (PTR-MS)
From Shao-Meng Li, EC
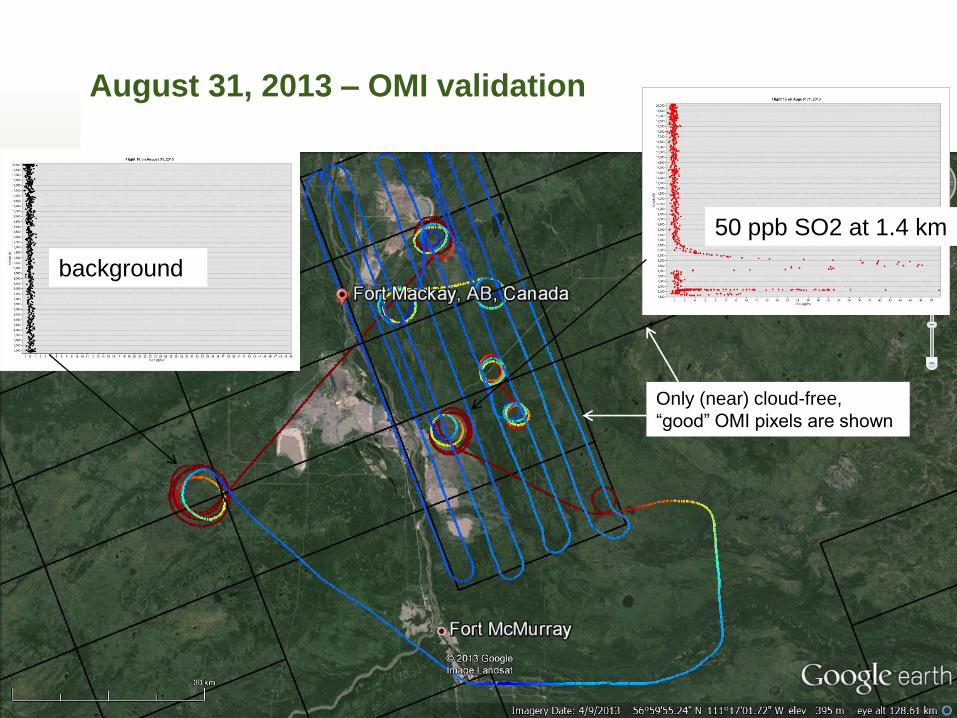
August 31, 2013 – OMI validation
Only (near) cloud-free,
“good” OMI pixels are shown
50 ppb SO2 at 1.4 km
background

Pandora Network
Pandora
2013: Toronto, oil sands
2015: Egbert, Saturna
2016: Edmonton, oil sands (2)
2017: tbd x 2