Embed Size (px)
Citation preview

Mar
isa d
a Co
nceiç
ão G
omes
Lop
es
Outubro de 2013UMin
ho |
201
3
Universidade do MinhoEscola de Engenharia
Candida albicans
Cand
ida
albi
cans
Outubro de 2013
Universidade do Minho
Escola de Engenharia
Marisa da Conceição Gomes Lopes
Optimization of Candida albicans Biofilms Inactivation by Benzophenoxazine Compounds for Photodynamic Therapy
Dissertação de Mestrado Mestrado Integrado em Engenharia Biomédica
Trabalho efetuado sob a orientação da
Professora Doutora Isabel Maria Pires Belo
Professora Doutora Mariana Contente Rangel Henriques

ii
DECLARAÇÃO
Nome: Marisa da Conceição Gomes Lopes
Endereço eletrónico: [email protected] Telefone: 91 285 63 07
Número do Bilhete de Identidade: 13790943
Título dissertação/tese: Optimization of Candida albicans biofilms inactivation by
benzophenoxazine compounds for photodynamic therapy
Ano de conclusão: 2013
Orientador(es): Professora Doutora Isabel Maria Pires Belo
Professora Doutora Mariana Contente Rangel Henriques
Designação do Mestrado: Mestrado Integrado em Engenharia Biomédica
Área de Especialização: Engenharia Clínica
Escola: de Engenharia
Departamento: de Engenharia Biológica
DE ACORDO COM A LEGISLAÇÃO EM VIGOR, NÃO É PERMITIDA A REPRODUÇÃO DE
QUALQUER PARTE DESTA TESE/TRABALHO
Universidade do Minho, ___ /___ /_____
Assinatura: ______________________________________________

iii
AKNOWLEDGEMENTS
First of all, I want to express my gratitude to my supervisors Dr. Isabel Belo and Dr.
Mariana Henriques. This work would not have been possible without them. To Dr. Isabel Belo I
want especially to thank the availability of guidance, the knowledge, sympathy and the
encouragement which were essential to my self-confidence, autonomy and organization. To Dr.
Mariana Henriques, I want especially express my gratefulness for the knowledge, dedication and
time spent put on my dissertation. All the advices, suggestions and encouragement that she gave
me during the experimental work and dissertation-writing period were very important.
I have to express my gratefulness to Dr. Maria Sameiro Gonçalves for her availability and
for gently provide the benzophenoxazine compounds, as well as to thank to Dr. Paulo Coutinho
for the permission to use the irradiation systems, for all the support, knowledge and suggestions.
To Carlos Tiago Alves I want to express my gratefulness for all the time he spent with me
and the support in the lab, as well as all the teaching, the encouragement, the friendship and the
advices he devoted to me during all stages of this work. I have no words to express how his
support was important to me.
To Dr. Sónia Silva I want to thank for all the teaching, support, availability, patience and
hospitality in the lab which were essential for me to learn and develop my experimental work.
Additionally, I have to recognize all the members of the lab for the hospitality and the sharing of
experiences. They made me feel a part of the group.
I am also grateful to my closest friends and course colleagues for the friendship,
affection, sharing of experiences and good moments during all these years. I learned and grew
very much at their side and I am glad for being with them during this long walk.
To Elson Pina I want to thank all the affection, love, encouragement and patience that
has always held for me, particularly in the most difficult days. He was my safe haven and his
emotional support was very important to keep me motivated during the development of this work.
Finally, the last words are addressed to my beloved family, my parents and my sister. I
am deeply grateful to them for all the education, values, love, affection, as well as their emotional
support and continuous encouragement to get through difficult times and to achieve my goals.


Optimization of Candida albicans Biofilms Inactivation by Benzophenoxazine Compounds v for Photodynamic Therapy
ABSTRACT
The incidence of fungal infections has increased in the last decades, being Candida
albicans the most common etiologic agent of fungal-related biofilm infections. In the last years,
Candida strains have shown high levels of drug resistance, so the interest in new antifungal
therapeutic options has increased. The antimicrobial photodynamic therapy (APDT) has been
shown to be an emerging and promising approach to treat localized infections. The present
dissertation aimed to optimize the antifungal photodynamic efficacy of two new
benzophenoxazine-type fluorescent dyes against C. albicans biofilms by APDT, as well as to
understand the different APDT outcomes achieved.
The antifungal susceptibility of C. albicans planktonic cells to dyes N-[5-(3-
hydroxypropylamino)-10-methyl-9H-benzo[a]phenoxazin-9-ylidene]ethanaminium chloride (FSc)
and N-(5-(11-hydroxyundecylamino)-10-methyl-9H-benzo[a]phenoxazin-9-ylidene)ethanaminium
chloride (FSd) with concentrations in the range of 0-100 μM during 48 h was firstly determined.
The potential photodynamic activity of dyes against C. albicans biofilms was then evaluated and
optimized by incubation of biofilms with dyes in the range of 100-300 μM for 3 or 18 h followed
by illumination at fluences of 12 or 36 J cm-2 through the use of a xenon arc lamp (600 ± 2
nm). In order to understand the APDT outcomes achieved, dye uptake by the biofilm matrix and
cells during dark incubation was also evaluated by spectrofluorimetric analysis (ex=590 nm;
em=645 nm) and fluorescence microscopy.
On antifungal susceptibility assays, FSc dye showed no growth inhibition of C. albicans
cells, while FSd produced a very poor growth inhibition when used at 50 and 100 μM. Regarding
to APDT outcomes, only FSc dye showed to have photosensitizing activity against C. albicans
biofilms. Using FSc at 300 μM for 18 h followed by illumination with 36 J cm-2 of fluence, a total
photoinactivation of C. albicans biofilm cells was achieved. The notorious uptake of FSc over FSd
dye by biofilms may explain its higher photodynamic effectiveness.
In summary, data suggests that FSc-mediated APDT might be successfully used to treat
C. albicans infections.

Otimização da Inativação de Biofilmes de Candida albicans por Ação de Compostos do Tipo vii Benzofenoxazinas para Fototerapia Dinâmica
RESUMO
A incidência de infeções fúngicas tem aumentado nas últimas décadas, sendo a espécie
C. albicans o agente etiológico mais comum nas infeções causadas por biofilmes. Nos últimos
anos, as estirpes do género Candida têm demonstrado elevados níveis de resistência aos
agentes antifúngicos convencionais, impulsionando o interesse por novas terapias antifúngicas. A
fototerapia dinâmica antimicrobiana é uma nova abordagem terapêutica que se tem
demonstrado bastante promissora no tratamento de infeções localizadas. A presente dissertação
teve como objetivo otimizar a inativação de biofilmes de C. albicans pela ação fotodinâmica
antifúngica de dois novos corantes fluorescentes do tipo benzofenoxazina, assim como analisar
as diferentes eficácias fotodinâmicas encontradas.
Inicialmente determinou-se a suscetibilidade antifúngica aos corantes cloreto de N-(5-((3-
hidroxipropil)amino)-10-metil-9H-benzo[a]fenoxazina-9-ilidene)etanamínio (FSc) e cloreto de N-(5-
((11-hidroxiundecil)amino)-10-metil-9H-benzo[a]fenoxazina-9-ilidene)etanamínio (FSd) - utilizando
concentrações de 0-100 μM durante 48 h em células planctónicas de C. albicans. A potencial
atividade fotodinâmica dos corantes em biofilmes de C. albicans foi posteriormente avaliada e
otimizada incubando os biofilmes de C. albicans com os corantes com concentrações de 100-
300 μM durante 3 ou 18 h, seguido de irradiação com uma lâmpada de arco de xénon (600 ± 2
nm) com fluência de 12 ou 36 J cm-2. Com o intuito de entender as diferentes eficácias
fotodinâmicas observadas, foi também avaliada a absorção dos corantes por espetrofluorimetria
(ex=590 nm; em=645 nm) e microscopia de fluorescência.
Os ensaios de suscetibilidade antifúngica revelaram que o corante FSc não apresenta
efeito de inibição de crescimento, enquanto o corante FSd produz um pequeno efeito de inibição
do crescimento quanto utlizado a 50 ou 100 μM. Relativamente à ação fotodinâmica
antimicrobiana apenas o corante FSc demonstrou ter atividade fotossensibilizante nos biofilmes
de C. albicans. Da incubação dos biofilmes com corante FSc a 300 μM durante 18 h, seguido de
irradiação com 36 J cm-2 de fluência, obteve-se uma total inativação celular. A notória absorção
do corante FSc em relação ao FSd pelos biofilmes poderá explicar a sua maior eficácia
fotodinâmica. Em suma, os resultados indicam que o corante FSc poderá ser um potencial
agente fotossensibilizante para a fototerapia dinâmica antifúngica de infeções provocadas por C.
albicans.

ix
TABLE OF CONTENTS
AKNOWLEDGEMENTS .............................................................................................................. iii
ABSTRACT ................................................................................................................................ v
RESUMO ................................................................................................................................. vii
TABLE OF CONTENTS .............................................................................................................. ix
LIST OF FIGURES .................................................................................................................... xiii
LIST OF TABLES ..................................................................................................................... xvii
ABBREVIATIONS ...................................................................................................................... xix
SYMBOLS ................................................................................................................................ xxi
PREAMBLE ............................................................................................................................ xxiii
1. CHAPTER I - INTRODUCTION ................................................................................................ 1
1.1. Candida albicans ........................................................................................................... 3
1.1.1. The Role of C. albicans Cell Wall ............................................................................. 4
1.1.2. Virulence Factors of C. albicans .............................................................................. 4
1.1.3. The Role of Biofilm in Antifungal Agents Resistance ................................................. 8
1.2. ANTIMICROBIAL PHOTODYNAMIC THERAPY (APDT) .................................................... 11
1.2.1. Photophysical processes of PDT ............................................................................ 12
1.2.2. The Photobleaching Process ................................................................................. 14
1.2.3. Mechanism of Action of APDT ............................................................................... 14
1.2.4. Biofilms eradication by APDT ................................................................................ 16
1.2.5. Cellular Resistance Mechanisms to APDT .............................................................. 17
1.2.6. Applications of APDT ............................................................................................. 18
1.3. PHOTOSENSITIZERS ................................................................................................... 19
1.3.1. Properties of Photosensitizers ............................................................................... 19
1.3.2. Most Common Photosensitizers in APDT ............................................................... 22
1.3.3. Benzo[a]phenoxazines .......................................................................................... 24

x
1.3.4. Formulation of New Concepts ............................................................................... 26
1.4. LIGHT SOURCES AND DELIVERY ................................................................................. 26
1.4.1. The concept of Light Fluence and Source Irradiance .............................................. 26
1.4.2. Light Penetration .................................................................................................. 27
1.4.3. Most Common Light Sources in PDT ..................................................................... 27
2.CHAPTER II - MATERIALS AND METHODS ........................................................................... 29
2.1. Benzophenoxazines Origin ........................................................................................... 31
2.2. Benzophenoxazines Stock Solutions ............................................................................. 31
2.3. Organism, Culture Media and Growth Conditions .......................................................... 32
2.4. Antifungal Susceptibility Testing ................................................................................... 33
2.5. Biofilm Formation ........................................................................................................ 33
2.6. Quantification of Cultivable Biofilm Cells ....................................................................... 33
2.7. Antifungal Photodynamic Therapy ................................................................................ 34
2.7.1. Dark Toxicity ......................................................................................................... 34
2.7.2 Photodynamic Inactivation ..................................................................................... 34
2.7.3. Absorption Spectra of Biofilms .............................................................................. 35
2.8. Dye Uptake .................................................................................................................. 35
2.9. Fluorescence Microscopy ............................................................................................. 36
2.9.1. Fluorescence Microscopy of Planktonic Cells ......................................................... 36
2.9.2. Fluorescence Microscopy of Biofilm Resuspended Cells ......................................... 37
2.10. Statistical Analysis ..................................................................................................... 37
3. CHAPTER III - RESULTS AND DISCUSSION ......................................................................... 39
3.1. Antifungal Susceptibility Testing ................................................................................... 41
3.2. Antifungal Photodynamic Therapy ................................................................................ 42
3.3. Dye Uptake .................................................................................................................. 47

xi
4. CHAPTER IV - CONCLUSIONS AND FUTURE PERSPECTIVES............................................... 54
5. REFERENCES ..................................................................................................................... 59
6. APPENDICES ...................................................................................................................... 71
Appendix A - Absorption Spectra of Biofilms ......................................................................... 73
Appendix B - Calibration Curves .......................................................................................... 77


xiii
LIST OF FIGURES
CHAPTER I - INTRODUCTION
Figure 1. Illustration of steps in Candida albicans biofilm formation. 1 and 2. Formation begins
with adhesion of yeast cells to a surface by nonspecific interactions, such as hydrophobic and
electrostatic forces, as well as specific adhesin-ligand bonds. 3. Attached cells proliferate to form
microcolonies and start to deposit the ECM.4. The biofilm grow into a thick layer where ECM
involves a complex network of yeast cells, hyphae and pseudohyphae. 5. Cells released or
detached from the biofilm spread into the environment, dispersing infections and forming new
biofilms. ................................................................................................................................... 7
Figure 2. Schematic illustration of photodynamic therapy mechanism of action.. ...................... 12
Figure 3. Illustrative scheme of essential steps involved on antifungal photodynamic therapy.. . 15
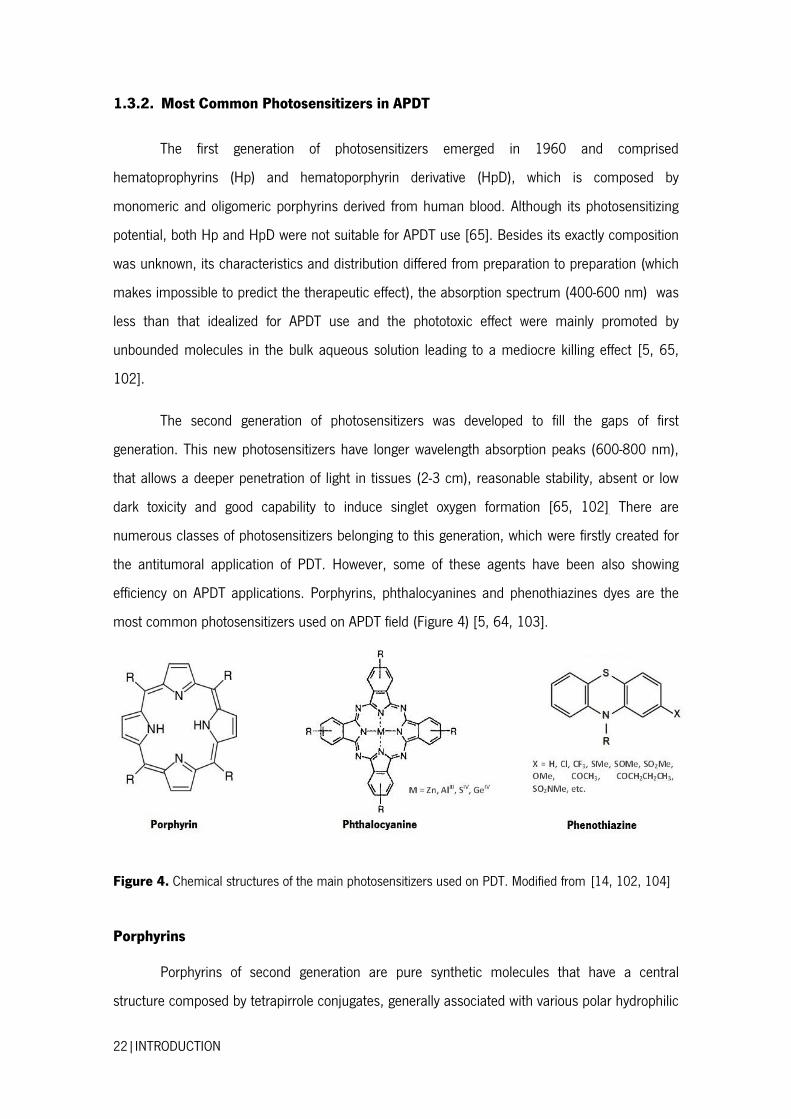
Figure 4. Chemical structures of the main photosensitizers used on PDT. ................................ 22
Figure 5. (A) Chemical structure of phenoxazines and benzophenoxazines; (B) Structures of the
three best known benzo[a]phenoxazines.. ............................................................................... 25
CHAPTER II - MATERIALS AND METHODS
Figure 6. Chemical structure of FSc (A) and FSd (B) dyes. ....................................................... 31
CHAPTER III - RESULTS AND DISCUSSION
Figure 7. Susceptibility of C. albicans ATCC 90028 planktonic cells exposed for 48 h to FSc (A)
and FSd (B) dye in RPMI. Error bars represent standard deviation. *Statistically different from the
respective control, 0 μM (P <0.05).......................................................................................... 41
Figure 8. Logarithm of number of C. albicans ATCC 90028 biofilm cells per cm2 after 3 h of dark
incubation with FSc (A) and FSd (B) dye at different concentrations in PBS. Error bars represent
standard deviation. *Statistically different from the control, 0 μM (P <0.05). ............................ 43
Figure 9. Logarithm of number of C. albicans ATCC 90028 biofilm cells per cm2 after 3 h of dark
incubation with FSc (A) and FSd (B) dye at different concentrations in PBS followed of exposure
to various light doses. Error bars represent standard deviation. *Statistically different from the
control, 0 μM (P <0.05). ......................................................................................................... 44
xiv
Figure 10. Logarithm of number of C. albicans ATCC 90028 biofilm cells per cm2 after 18 h of
dark incubation with both FSc and FSd dyes at different concentrations in PBS. Error bars
represent standard deviation. * Statistically different from the control, 0 μM (P <0.05). ............ 44
Figure 11. Logarithm of number of C. albicans ATCC 90028 biofilm cells per cm2 after 18 h of
dark incubation with FSc (A) and FSd (B) dye at different concentrations in PBS followed of
exposure to various light doses. Error bars represent standard deviation.*Statistically different
from the control, 0 μM (P <0.05). ........................................................................................... 45
Figure 12. Fluorescence microscopy micrographs obtained for C. albicans ATCC 90028
planktonic cells after 3 h of incubation (A1-A3) and 18 h of incubation (B1-B3) with PBS only, as
well as with FSc and FSd dye at 300 μM in PBS. .................................................................... 50
Figure 13. Fluorescence microscopy micrographs obtained for C. albicans ATCC 90028 biofilm
resuspended cells after 3 h of dark incubation (A1-A3) and 18 h of dark incubation (B1-B3) with
PBS only, as well as with FSc and FSd dye at 300 μM in PBS. ................................................ 51
APPENDICES – APPENDIX A
Figure A 1. Absorption spectra of biofilms of Candida albicans ATCC 90028 before and after
exposure to a light fluence of 12 J cm-2 following 3 h of incubation with FSc dye at 100 μM (A),
200 μM (B) and 300 μM (C) in PBS. ...................................................................................... 73
Figure A 2. Absorption spectra of biofilms of Candida albicans ATCC 90028 before and after
exposure to a light fluence of 12 J cm-2 following 3 h of incubation with FSd dye at a 100 μM (A),
200 μM (B) and 300 μM (C) in PBS. ...................................................................................... 73
Figure A 3. Absorption spectra of biofilms of Candida albicans ATCC 90028 before and after
exposure to a light fluence of 36 J cm-2 following 3 h of incubation with FSc dye at 100 μM (A),
200 μM (B) and 300 μM (C) in PBS. ...................................................................................... 74
Figure A 4. Absorption spectra of biofilms of Candida albicans ATCC 90028 before and after
exposure to a light fluence of 36 J cm-2 following 3 h of incubation with FSd dye at 100 μM (A),
200 μM (B) and 300 μM (C) in PBS. ...................................................................................... 74
Figure A 5. Absorption spectra of biofilms of Candida albicans ATCC 90028 before and after
exposure to a light fluence of 12 J cm-2 following 18 h of incubation with FSc dye at 100 μM (A),
200 μM (B) and 300 μM (C) in PBS. ...................................................................................... 75
xv
Figure A 6. Absorption spectra of biofilms of Candida albicans ATCC 90028 before and after
exposure to a light fluence of 36 J cm-2 following 18 h of incubation with FSc dye at 100 μM (A),
200 μM (B) and 300 μM (C) in PBS. ...................................................................................... 75
Figure A 7. Absorption spectra of biofilms of Candida albicans ATCC 90028 before and after
exposure to a light fluence of 36 J cm-2 following 18 h of incubation with FSd dye at 100 μM (A),
200 μM (B) and 300 μM (C) in PBS. ...................................................................................... 76
APPENDICES – APPENDIX B
Figure B 1. Calibration curve of absorbance versus FSc dye concentration. .............................. 77
Figure B 2. Calibration curve of absorbance versus FSd dye concentration............................... 77
Figure B 3. Calibration curve of fluorescence intensity versus FSc dye concentration. ............... 78
Figure B 4. Calibration curve of fluorescence intensity versus FSd dye concentration. .............. 78

xvii
LIST OF TABLES
CHAPTER I - INTRODUCTION
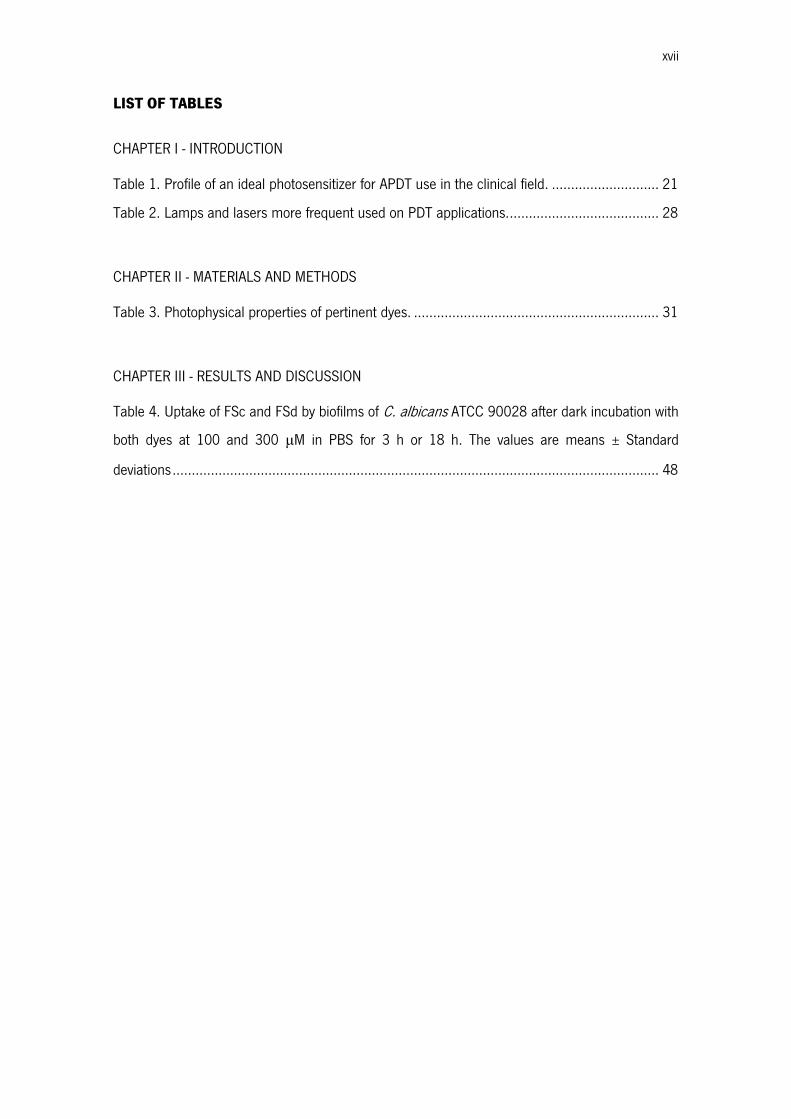
Table 1. Profile of an ideal photosensitizer for APDT use in the clinical field. ............................ 21
Table 2. Lamps and lasers more frequent used on PDT applications. ....................................... 28
CHAPTER II - MATERIALS AND METHODS
Table 3. Photophysical properties of pertinent dyes. ................................................................ 31
CHAPTER III - RESULTS AND DISCUSSION
Table 4. Uptake of FSc and FSd by biofilms of C. albicans ATCC 90028 after dark incubation with
both dyes at 100 and 300 μM in PBS for 3 h or 18 h. The values are means ± Standard
deviations ............................................................................................................................... 48

xix
ABBREVIATIONS
ABC ATP-binding Cassette
Abs Absorbance
ALA 5-Aminolevulinic acid
Als Agglutinnin-like sequence
ANOVA Analysis of Variance
APDT Antimicrobial Photodynamic Therapy
ATCC American Type Culture Collection
ATP Adenosine Triphosphate
cAMP Cyclic Adenosine Monophosphate
CDR Complementarity-determining regions
CFU Colony forming units
CLSI Clinical and Laboratory Standards Institute
DNA Deoxyribonucleic acid
FDA Food and Drug Administration
HIV Human Immunodeficiency Virus
HP Hematoporphyrin
HPD Hematoporphyrin Derivative
HSP Heat Shock Proteins
MAPK Mitogen-activated Protein Kinase
MB Methylene Blue
MDR Multidrug Resistance
MFS Major Facilitator Superfamily
MOPS 3-(N-Morpholino)propanesulfonic acid, 4-Morpholinepropanesulfonic acid
NCCLS National Committee for Clinical Laboratory Standards
xx
PBS Phosphate Buffered Saline
PKA Protein Kinase A
Pp Protoporphyrin
RNA Ribonucleic acid
rpm Revolutions per minute
Ras Rat Sarcoma
RPMI Roswell Park Memorial Institute
SAP Stress Associated Protein
Saps Secreted Aspartyl Proteinases
SDA Sabouraud Dextrose Agar
SDB Sabouraud Dextrose Broth
TBO Toluidine Blue
TRITC Tetramethylrhodamine Isothiocyanate

xxi
SYMBOLS
λmax Wavelength of maximum absorption
ε Extinction coefficient
τt Triplet-state life time
Φt Triplet-state quantum yield
ΔEt Triplet-state energy
ΦΔ Singlet oxygen quantum yield
λex Excitation wavelength
λem Emission wavelength
ΦF Absolute fluorescence quantum yield
ɡ Gravity constant
P Significance value

xxiii
PREAMBLE
In the last decades, the incidence of superficial and systemic fungal infections has
increased due to several factors, including the more frequent use of invasive procedures,
prosthetic devices, immunosupressive medication and broad-spectrum antibiotics, as well as the
increased incidence of neutropenia and HIV infections [1]. Yeasts from the genus Candida are
responsible for 70-90% of the fungal infections cases, with Candida albicans representing about
50% of all yeasts isolated in clinical samples [2, 3]. In fact, C. albicans is the most virulent
Candida species and represents an important public health challenge with a high economic and
medical relevance due to the increased costs of care, time of hospitalization and high morbidity
and mortality rates, especially on immunocompromised patients [4]. In this context, conventional
approaches of antifungal therapies can be time consuming, expensive and in the last years they
have been largely associated with the emergence of resistant strains [5]. Thus, nowadays there is
an increased necessity to discover alternative, more effective and localized antifungal therapeutic
options to treat fungal infections [3].
The photodynamic therapy (PDT), originally developed for the treatment of skin tumors,
has been shown as an effective therapy to eliminate bacteria and fungi, even resistant strains,
that cause localized infections of the skin and oral cavity [3, 6-8]. This approach combines a
photoative molecule (a non-toxic dye), termed photosensitizer, with visible light and oxygen to
produce cytotoxic oxygen species that are able to react with cellular components leading to cell
dead [3, 9, 10]. Several studies have been shown that the use of the antimicrobial photodynamic
therapy (APDT) as a therapeutic approach to treat localized infections is an emerging and
promising field [3, 6-8]. Therefore, this dissertation aimed to contribute for the development of an
APDT approach against candidosis. The principal aim of this work was to optimize the
inactivation of C. albicans biofilms by APDT through the action of two new photosensitizers
(benzophenoxazinium chlorides of different molecular size) that were synthetized by the
Chemistry Department of University of Minho. A set of parameters that guarantees the
inactivation of C. albicans biofilm cells by APDT was optimized in this work. These parameters
include the photosensitizer concentration, the contact time with C. albicans biofilms that ensures
dye uptake and the light dose that promotes the cytotoxic oxygen species production.
xxiv
Additionally, it was evaluated the dye uptake during the incubation conditions with the intent to
verify if there is a correlation between the APDT outcomes achieved and the levels of dye uptake.
The present dissertation is divided into four chapters. Chapter 1 is an introduction to the
theme, where the C. albicans characteristics, pathogenicity, virulence factors and its
mechanisms of drug resistance, as well as the principles of APDT are described. Additionally, this
chapter also shows a short review of the main photosensitizers and light sources used, as well as
the potential antifungal applications of APDT. The second chapter includes the materials and
methods used during all experimental work. On chapter 3 the results obtained and their
discussion are presented. The last part (chapter 4) reveals the main conclusions and presents
some suggestions for future works.
Part of the results obtained in this dissertation were presented in the form of Poster in the
“2nd Fungal Biofilms Meeting” Conference on May 20th and 21st of 2013 with the following
reference: Lopes, Marisa, Alves, Carlos, Rama Raju, B., Gonçalves, S., Coutinho, P., Henriques,
M., Belo, I. Antifungal Photodynamic Efficacy of Benzo[a]phenoxazinium Chlorides against
Candida albicans Biofilms. 2nd Fungal Biofilm Conference, Glasgow, Scotland, 20-21 May, 2013.

1. CHAPTER I INTRODUCTION

INTRODUCTION|3
1.1. Candida albicans
In nature there is a wide diversity of microorganisms, however only a small part is able to act
like opportunistic pathogens and cause infections on human host. C. albicans is the most virulent
among all the well-known clinically relevant Candida species and the species most predominant
found on superficial fungal infections of the skin, oral cavity, esopaghus, intestinal and genital
tract (candidosis), as well as in invasive blood stream infections (candidemia) [3].
C. albicans is a commensal microorganism present in the normal flora of the human body
that has an optimal growth at the body temperature (37ºC) [11]. Although they are commensals
on the majority of healthy individuals, whenever the opportunity arises, i.e, whenever the body is
immunocompromised or debilitated in some other way, C. albicans becomes a serious
pathogenic and opportunist microorganism, causing serious fungal infections. For these reasons,
C. albicans is not only the main species related with oral mycoses but also the most common
fungus affecting HIV infected patients and those with haematologic and oncologic malignancies
during the immunosuppression period. In these patients, oropharyngeal candidosis episodes are
the most cause of morbidity, which are of special concern, once oral candidosis can lead to
esophageal candidosis and even more serious complications [3].
The cell wall of C. albicans is an essential component of its success as a pathogen [4]. It is
required for growth, provides strength and protection against osmotic insult and establishes the
contact between C. albicans cells and host tissues, through some associated cell surface
macromolecules, leading to tissue invasion and colonization [12]. However, the pathogenicity of
C. albicans may be attributed to several virulence factors including host defenses evasion,
production of some tissue-damaging hydrolytic enzymes, as well as adherence and biofilm
formation on host tissues and medical devices [4]. The biofilm formation ability is indeed the
main virulence factor of C. albicans to the extent that it is the main responsible for its drug
resistance against a wide range of conventional antifungal agents, including amphotericin B and
fluconazole [4, 13]. Next will be reviewed each of these elements that contribute for C. albicans
pathogenicity.
4|INTRODUCTION
1.1.1. The Role of C. albicans Cell Wall
The fungal cell wall is a dynamic and highly organized organelle that determines both cell
shape and its viability, as well as acts like a permeability barrier and determines the interaction
between the microorganism and its environment [14, 15]. Because the fungal cell wall is a
dynamic structure, it is continuously biosynthesized and extended during cell proliferation and
growth phase. So, although the fungal cell wall has a protective function for cells, it is also
responsible for the cell susceptibility to some antifungal agents that have the ability to disturb the
processes by which the cell wall is synthesized [16].
C. albicans cell wall is mostly composed by polysaccharides, representing around 80% of the
cell wall dry weight. This structure consists in β-(1,3)-glucan covalently linked to β-(1,6)-glucan
and chitin and is designed to work as a robust external skeleton, as well as a scaffold for the
external glycoprotein layer that represents the other 20% of cell wall constituents. This layer
includes not only lipids and various inorganic salts, but also many proteins that are involved in
permeability control, interaction with hosts, recognition of other fungi and regulation of several
processes [17, 18]. Besides the fungal cell wall being a crucial factor to host tissue evasion and
colonization, it is also the first point of contact with innate immune system of the host and thus it
also plays an important role in recognition and phagocytosis by host immune cells [15].
1.1.2. Virulence Factors of C. albicans
It was believed, decades ago, that yeasts were passive participants of the pathogenesis
process and the organic weakness and immunocompromised patients was the only mechanism
that triggers the establishment of opportunistic infection. Nowadays, it is known that these
microorganisms are active participants in the infection process, using mechanisms of host cells
aggression termed virulence factors [4].
C. albicans virulence factors include the ability to express specific host recognition and
adhesion biomolecules, secretion of hydrolytic enzymes, morphologic transition between
unicellular yeast cells and filamentous phase (hyphae and pseudo-hyphae) and the ability of
biofilm formation on several surfaces [4, 11].
The primary factor that contributes to the C. albicans virulence is the host recognition and
adhesion [4]. These two phenomena are conferred by specialized cell wall proteins termed

INTRODUCTION|5
adhesins that bind specifically to peptides or sugar residues of other cells and/or increase the
cell surface hydrophobicity, promoting the binding to abiotic surfaces through hydrophobic
interactions [19]. The mechanisms of adhesion can be divided into two groups: lectin-like
adhesion and sugar-insensitive adhesion [19]. The first one refers to lectin-like binding of
adhesins to cell surface sugars residues, because these adhesins have a lectin-like carbohydrate
binding domain. On the other hand, on sugar-insensitive adhesion, adhesins bind to peptides or
raises the hydrophobicity of cell surface promoting the binding to certain abiotic surfaces [20].
One example of the later one in C. albicans is the Agglutinnin-like sequence (Als) proteins that
specifically bind to peptides [21].
One of the most remarkable features of yeast adhesion is the ability to adapt the adhesion
properties to new environments [19]. Several signaling pathways are involved in adhesins
synthesis in response to stress, nutrient limitation or molecules produced by hosts. These include
the Ras/cAMP/PKA, the Mitogen-activated Protein Kinase (MAPK) – dependent filamentous
growth and the main glucose repression pathways [22]. Additionally, adhesins are submitted to
stochastic expression patterns [23]. These cell wall proteins have a common structure of three
domains: the C-terminal that links the adhesin to the cell wall, the N-terminal projected from the
cell surface and the middle domain rich in threonine and serine-rich repeats [19]. Because of
their similarity and repetitive occurrence, these repeats trigger recombination events and/or
splippage during the DNA replication, offering an endless reservoir of adhesion properties to cells
that gives them a great opportunity to quickly adapt to stressful environments [23].
The production and release of hydrolytic enzymes, most of them resultant from extracellular
secretion, are also a key factor on C. albicans virulence [4, 24]. These enzymes help on host
adhesion, tissue invasion and destruction, as well as they are also thought to be responsible for
changes on host immunity response [4]. The most discussed hydrolytic enzymes released during
the pathogenic process are aspartic proteinases (Saps), but phospholipases and lipases are also
hydrolytic enzymes that are involved in C. albicans virulence [24]. The proteolytic activity of Saps
is attributed to a multigene SAP family of, at least, ten members that are differentially regulated
and expressed on C. albicans infections, suggesting that different Saps have distinct roles during
the infectious process [24]. These enzymes are responsible for the digestion or destruction of
host cells membrane and degradation of host surface molecules, contributing to host tissue
invasion [24]. Additionally, recent evidences have suggested that Saps are also involved in the

6|INTRODUCTION
activation and maintenance of the inflammatory response in epithelial surfaces [25]. On the other
hand, phospholipases are enzymes with the ability to hydrolyse ester bonds in
glycerophospholipids [24]. Seven phospholipases have been identified [26] being the difference
between their the mode of action and the target within the phospholipid molecule, which is the
major component of cell membrane [24]. The functions of phospholipases on C. albicans
virulence are not yet clear but they have showed to be involved in adhesion to epithelial cells and
cell penetration [24] as well as in epithelium invasion [27] and may be in interaction with host
signal transduction pathways [27]. Regarding to lipases, they have the ability to catalyse the
hydrolysis of the ester bonds of phospholipids and mono- di- and triacylglycerols, but almost
nothing is known about their role as C. albicans virulence factor. The potential roles of lipases
that have been suggested include the digestion of lipids for nutrient acquisition, lyses of
competitive microflora, adhesion to host tissues, as well as changes in immune cells [28, 29]. In
addition, the production and release of haemolysins may also play a key role in C. albicans
virulence [4]. C. albicans expresses haemolysins that allows the destruction of red blood cells
and the acquisition of iron from host erythrocytes, an essential element for the development of
microorganisms and a consequent establishment of infection [30].
The ability to go under a reversible morphologic transition between unicellular yeast cells and
filamentous phase (hyphae and pseudo-hyphae) is another important virulence factor of C.
albicans, with the extent that this ability provides cells with a flexibility of adaptation to hostile
conditions imposed by the human body [4]. The filamentous phase raises resistance to
phagocytosis and it has a cell wall containing three times more chitin that gives it more
mechanical strength and makes epithelium penetration easier, allowing the invasion of more
deep tissues [4, 31]. Although the parameters that triggers morphologic transition are not yet
well understood, in vitro studies show that this behavior is influenced by temperature and pH:
unicellular phase are stimulated at 25ºC and acid pH, whereas filamentous phase is favored at
37ºC with pH around neutrality [11].
The most important virulence factor of C. albicans is the capacity to form biofilm on several
surfaces [4]. Recent evidence suggests that the majority of C. albicans infections are associated
with biofilm formation [13]. In fact, Candida species, most notably C. albicans, are the main
fungal species associated with biofilm formation causing superficial and deep-seated infections.
This microorganism can colonize not only epithelial surfaces, but also numerous medical devices
INTRODUCTION|7
(e.g. catheters and prosthetic devices, like voice prostheses, heart valves, denture surfaces and
etc.) [3, 32].
Biofilms are defined as highly well structured, coordinated and functionalized communities of
microorganisms that are surface associated or attached to one another and embedded in a self-
produced protective extracellular matrix (ECM) composed by diverse polymeric substances such
as cell wall glycoproteins and polysaccharides (e.g. β-glucan) [4, 13, 33]. Fungal biofilms have
defined key phases of development that were elucidated through the use of model systems.
These key phases include the arrival to the substratum, adhesion, colonization, ECM production
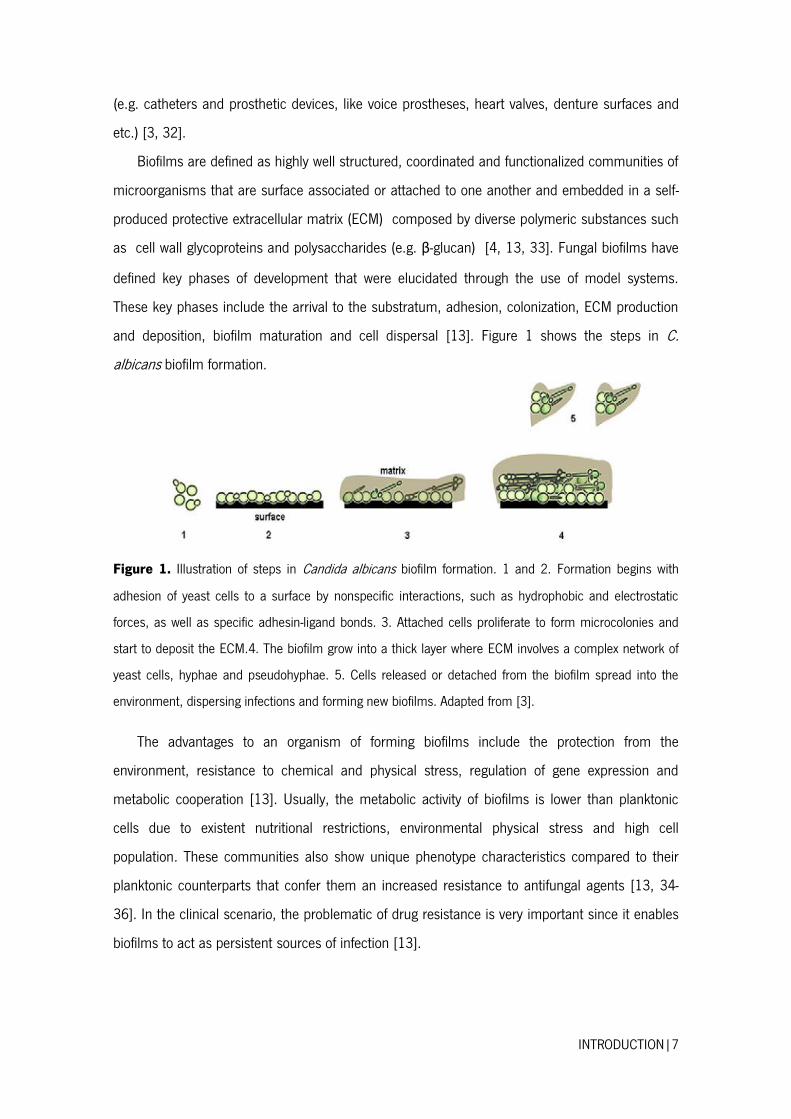
and deposition, biofilm maturation and cell dispersal [13]. Figure 1 shows the steps in C.
albicans biofilm formation.
Figure 1. Illustration of steps in Candida albicans biofilm formation. 1 and 2. Formation begins with
adhesion of yeast cells to a surface by nonspecific interactions, such as hydrophobic and electrostatic
forces, as well as specific adhesin-ligand bonds. 3. Attached cells proliferate to form microcolonies and
start to deposit the ECM.4. The biofilm grow into a thick layer where ECM involves a complex network of
yeast cells, hyphae and pseudohyphae. 5. Cells released or detached from the biofilm spread into the
environment, dispersing infections and forming new biofilms. Adapted from [3].
The advantages to an organism of forming biofilms include the protection from the
environment, resistance to chemical and physical stress, regulation of gene expression and
metabolic cooperation [13]. Usually, the metabolic activity of biofilms is lower than planktonic
cells due to existent nutritional restrictions, environmental physical stress and high cell
population. These communities also show unique phenotype characteristics compared to their
planktonic counterparts that confer them an increased resistance to antifungal agents [13, 34-
36]. In the clinical scenario, the problematic of drug resistance is very important since it enables
biofilms to act as persistent sources of infection [13].
8|INTRODUCTION
1.1.3. The Role of Biofilm in Antifungal Agents Resistance
The increased resistance to antifungal agents is one of the defining characteristics of biofilms
[13]. Nowadays, C. albicans biofilms show an increased resistance to a wide range of
conventional antifungal agents, such as amphotericin B and fluconazole. This phenotype can be
about twenty times more resistant to amphotericin B and one hundred times more resistant to
fluconazole than the planktonically growth form [3, 37].
Antifungal resistance is both complex and multifaceted. The resistant phenotype of
planktonic cells is generally due to irreversible genetic changes, but biofilms are able to be
resistant through their physical presence and cell density, which turns it into an almost inducible
resistant phenotype independent from the genetic alterations [13]. Understanding the processes
mentioned above enabled the science to unravel the mechanisms that are involved in drug
resistance. Over the last few years, several factors that play a role in fungal biofilm resistance
have been described, including the physiological state, cell density, extracellular matrix, efflux
pump-mediated resistance, overexpression of drug targets and the presence of persister cells [4,
13, 38].
The general physiological state of cells in sessile populations are implicated on the
susceptibility profiles of fungal biofilms [13]. Nutrient and oxygen limitation, particularly in the
deeper cell layers of the biofilm, are responsible for slowing down the growth rate of these cells
leading to cell’s surface alterations that consequently would result on a slower or inefficient drug
uptake [34, 35, 39]. However, other factors like pH, temperature, changes in osmolarity,
oxidative and ionic stress can also cause stress responses through conserved signaling pathways
and perhaps alter their antifungal susceptibility, which suggests that more complex factors may
be involved on drug resistance of biofilms [40, 41]. Some of the most tolerance responses
triggered by these physiological stress factors is the activation of MAPK signal transduction
network that is involved on biofilm development [22, 40], the activation of the Calcineurin via that
plays among other things an important role on antifungal drug responses [42, 43] and finally the
activation of the heat shock protein (HSP) Hsp90 that regulates complex cellular circuitry and
potentiates the resistance to azoles and echinocandins in C. albicans, at least through the
calcineurin via [44].
Cell density is also an important resistance factor of biofilm populations [13]. A previous
investigation showed a phase-dependent increased antifungal resistance on the biofilm
INTRODUCTION|9
development, supporting the belief that the physical density of cells within biofilms plays a role in
drug resistance [45]. Within these highly dense communities there is a cooperation between cells
through the quorum sensing systems, which enables them to promote communication and
collective behaviors via the secretion of signaling molecules in a population-dependent manner
[46]. This process allows communities to improve nutrient and niches accesses, as well as,
collective defense against other competitive microorganisms and antifungal agents [3, 4].
However, some previous work have shown that both planktonic and biofilm resuspended cells
shows similar resistant phenotype to the Clinical and Laboratory Standards Institute (CLSI)
methodology, suggesting alternative mechanisms of resistance [47].
The ECM is an important feature of biofilms with the extent that this component provides to
cells protection from host immunity and antifungal agents [48]. Its principal role in the antifungal
resistance is the diffusion barrier effect that restricts drug diffusion throughout the biofilm
structure, particularly to the deeper cell layers, and therefore, only the most superficial layers are
exposed to lethal doses of antibiotics [35]. Recently, it was also been shown that the ECM
composition of C. albicans biofilms have also a central role in drug resistance. In this respect,
some recent results have shown that β-1,3 glucans are responsible to sequestering azoles and
thus conferring resistance on C. albicans biofilms [49]. Additionally, the regulation of ECM
production may also be a key resistance factor [13]. It is thought that some glucoamylases and
alcohol dehydrogenases may have positive roles on the matrix production and maturation phase
of biofilms, respectively [50].
The fungistatic effect of the azoles against C. albicans induces a strong response of the
biofilm population, allowing the development of some drug resistance mechanisms [13, 51]. The
principal molecular mechanism of azole-resistance in C. albicans is the increased efflux of
antifungal agents principally mediated by the Adenosine Triphosphate (ATP)-binding cassette and
major facilitator superfamily (MFS) transporters [4, 45, 52]. The increased drug efflux by ATP-
binding cassette (ABC) transporters is due to the overexpression of the genes encoding drug
efflux pumps CDR1 and CDR2, whereas the contribute of members of the MFS on azole-
resistance is mostly due to the overexpression of the MDR1 gene, a gene that encodes drug
efflux pumps of MFS [45, 52, 53]. In fact, efflux pumps are an important determinant of fungal
biofilm resistance. Their primary role may be the protection of cell to acute toxicity, but a clinical

10|INTRODUCTION
exposure to azoles may triggers the levels of efflux pump expression and thus contributing for
drug resistance [54].
Ergosterol alterations in biofilm cell membranes may also be the reason for C. albicans
resistance to both azole and polyene-derived antifungal agents [45, 52]. Azoles actively bind to
ERG11p enzyme (lanosterol 14-a-demethylase) encoded by ERG11 gene and block ergosterol
biosynthesis, leading to a depletion of cell membrane ergosterol and the accumulation of toxic
sterol pathways intermediates capable to inhibit cell growth [40, 55]. On the other hand,
polyenes use the binding to cell membrane ergosterol to promote the formation of cell
membrane pores and consequently cause the loss of intracellular substances, leading to cell
dead [56]. Thus, amino acid substitutions in the enzyme ERG11p due to missense mutations on
ERG11 gene or the overexpression of this enzyme may cause ergosterol alterations that elicit
azole and polyenes resistance on C. albicans [55, 56]. It has been reported that mature C.
albicans biofilms show an overexpression of the enzyme Erg11p, as well as a significant content
of altered membrane ergosterol [3, 45].
The presence of persistent cells (0.1-1% of biofilm population) is also one important
mechanism of resistance in chronic infections that has gathered some recent attention in fungal
biofilms [13, 57]. Persister cells are “dormant variants of regular cells that form stochastically in
microbial populations and are highly tolerant to antibiotics” [58]. In particular for C. albicans
biofilms, it has been described the presence of a small subpopulation of yeast cells that are
highly resistant to amphotericin B, independently of efflux pumps upregulation or cell membrane
composition [4, 13, 59]. It is thought that phenotypic adaptive changes arising from the
prolonged and ineffectual antifungal treatment may be the responsible for the extraordinary
survival ability of persister cells and thus for the antimicrobial drug failure [13]. However, the
exactly mechanisms that enable these subpopulations to persist still remain unclear.
The antifungal biofilm resistance seems to be a multifactorial and complex process, where
antifungal agents with a single mechanism of action are likely to be poorly effective. Thus, other
antifungal strategies with more effective mechanisms of action are needed [3, 34].

INTRODUCTION|11
1.2. ANTIMICROBIAL PHOTODYNAMIC THERAPY (APDT)
The deadly effect of visible light when combined with chemical compounds was described
for the first time by Oscar Rabb and his professor Herman Von Tappeiner in 1900. They found
that visible light combined with acridine was able to inactivate cultures of Paramecium caudatum
[14]. Shortly later, the essential role of the oxygen and light in the process was demonstrated by
Von Tappeiner, who created the term “Photodynamic” [6]. However, the potential of PDT against
pathogens was not explored over several years for two principal reasons: some pathogens,
especially gram-negative bacteria and protozoa, are poorly inactivated by PDT and the discovery
of antibiotics, particularly the penicillin in 1928, raised the belief that every microbiological
diseases would have been reduce to a level that nevermore would have impact on human health
[14]. Such expectations were disappointed in the end of 50 decade with the emergence of
resistant strains and then, the researches on the PDT approach were retaken [6, 14].
In the 70s, it was discovered that porphyrins dyes localized selectively in tumors and so,
PDT was initially developed as a cancer therapy. Since then, PDT has been clinically used for
therapy of various diseases. So far, PDT is approved by FDA (Food and Drug Administration) for
treatment of non-melanoma skin cancer (basocelullar carcinoma and Actinic Keratosis), choroidal
neovascularization in age-related macular degeneration, as well as in treating lung and Barrett's
esophagus cancer [10, 60, 61]. On the other hand, PDT investigations has included a wide range
of applications, such as arterial restenosis prevention, therapy of another malignancies (prostate,
neck, mesothelioma and brain) and autoimmune diseases, such as psoriasis [60, 61].
Recently, antimicrobial PDT (APDT) has been proposed as an alternative approach to kill
pathogens. APDT combines a non-toxic and light sensitive dye, termed photosensitizer, with
oxygen and harmless visible light with appropriate wavelength, which matches with the
absorption spectrum of photosensitizer [61-63].
Initially, this therapy requires a localized administration of the photosensitizer. Then, the
photosensitizer taken up by cells or attached to them is excited with the visible light source, by
photon absorption. On this state, the photosensitizer can undergo reaction with ambient oxygen
and could originate cytotoxic oxygen species that may kill pathogens by oxidative modifications of
the cellular constituents [14, 62, 64, 65].
12|INTRODUCTION
1.2.1. Photophysical processes of PDT
The photosensitizers used on this therapy are molecular structures characterized by
conjugated double bounds containing a system of –electrons. In the photosensitizer ground
(singlet) state these electrons are spin paired at the low energy orbitals. Upon application of the
light with wavelength corresponding to the absorption peak of the photosensitizer, the electron in
the highest occupied molecular orbital (HOMO) is excited to the lowest unoccupied molecular
orbital (LUMO) and keeps its spin, leaving the photosensitizer in the excited singlet state, which is
highly unstable and short lived (in the range of nanoseconds) [62, 66]. At this phase, the
photosensitizer can rapidly return to the ground state, releasing the energy absorbed as
fluorescence or suffering internal conversion, releasing heat. However, the most important event
to the photodynamic therapy is the reversal of the excited electron’s spin, known as intersystem
crossing, which leads the photosensitizers to the triplet state. This state is less energetic than
the previous state, but has a longer life time (in the range of microseconds) [64, 65].
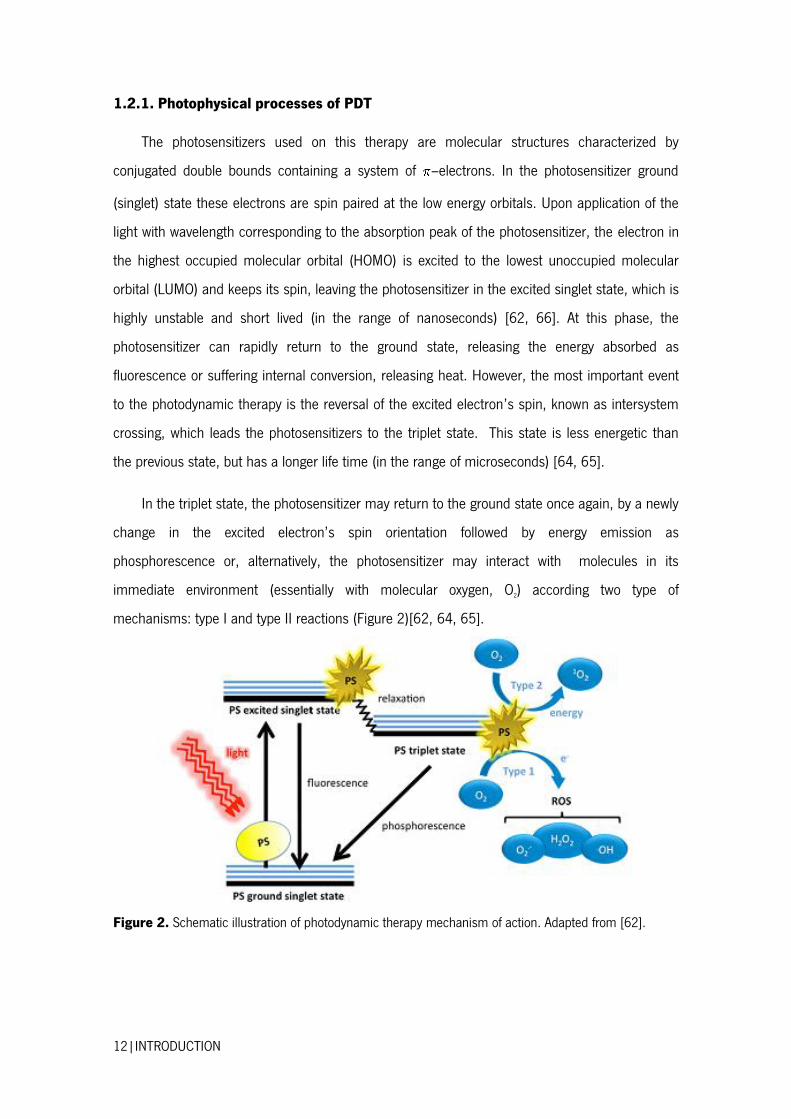
In the triplet state, the photosensitizer may return to the ground state once again, by a newly
change in the excited electron’s spin orientation followed by energy emission as
phosphorescence or, alternatively, the photosensitizer may interact with molecules in its
immediate environment (essentially with molecular oxygen, O2) according two type of
mechanisms: type I and type II reactions (Figure 2)[62, 64, 65].
Figure 2. Schematic illustration of photodynamic therapy mechanism of action. Adapted from [62].
INTRODUCTION|13
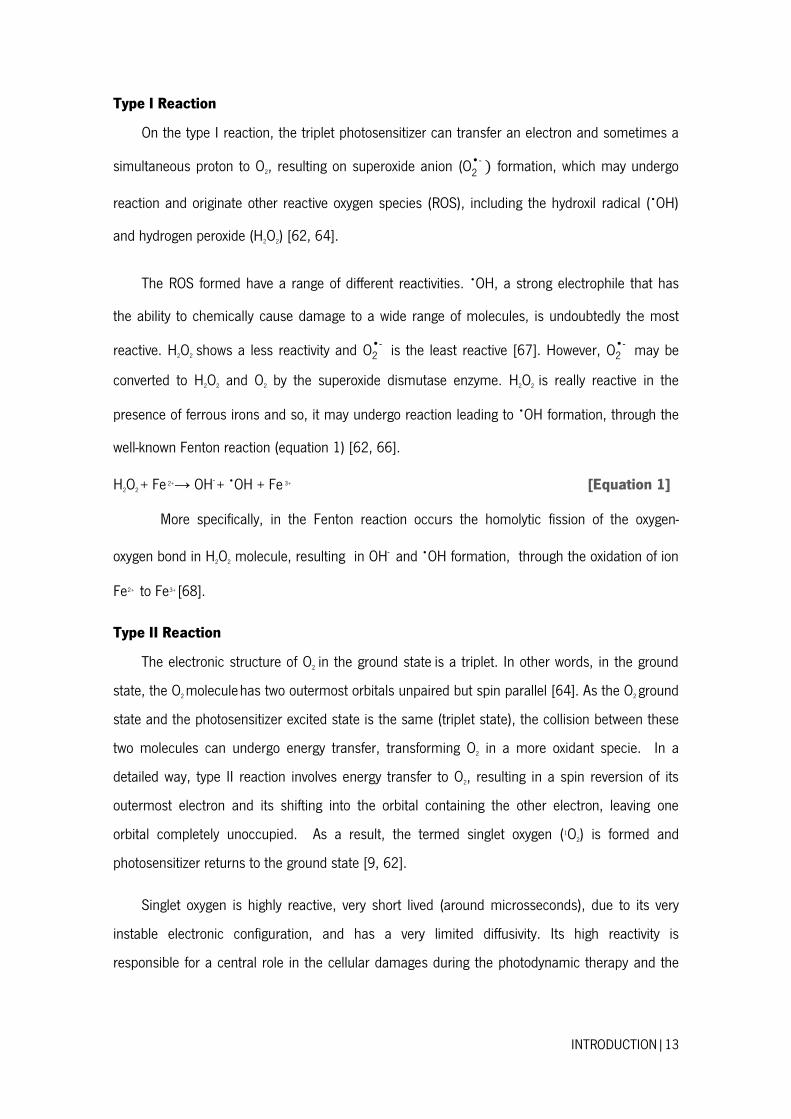
Type I Reaction
On the type I reaction, the triplet photosensitizer can transfer an electron and sometimes a
simultaneous proton to O2, resulting on superoxide anion 2 - formation, which may undergo
reaction and originate other reactive oxygen species (ROS), including the hydroxil radical ( OH)
and hydrogen peroxide (H2O2) [62, 64].
The ROS formed have a range of different reactivities. OH, a strong electrophile that has
the ability to chemically cause damage to a wide range of molecules, is undoubtedly the most
reactive. H2O2 shows a less reactivity and 2 - is the least reactive [67]. However, 2
- may be
converted to H2O2 and O2 by the superoxide dismutase enzyme. H2O2 is really reactive in the
presence of ferrous irons and so, it may undergo reaction leading to OH formation, through the
well-known Fenton reaction (equation 1) [62, 66].
H2O2 + Fe 2+→ OH- + OH + Fe 3+ [Equation 1]
More specifically, in the Fenton reaction occurs the homolytic fission of the oxygen-
oxygen bond in H2O2 molecule, resulting in OH- and OH formation, through the oxidation of ion
Fe
2+ to Fe
3+ [68].
Type II Reaction
The electronic structure of O2 in the ground state is a triplet. In other words, in the ground
state, the O2 molecule has two outermost orbitals unpaired but spin parallel [64]. As the O2 ground
state and the photosensitizer excited state is the same (triplet state), the collision between these
two molecules can undergo energy transfer, transforming O2 in a more oxidant specie. In a
detailed way, type II reaction involves energy transfer to O2, resulting in a spin reversion of its
outermost electron and its shifting into the orbital containing the other electron, leaving one
orbital completely unoccupied. As a result, the termed singlet oxygen (1O2) is formed and
photosensitizer returns to the ground state [9, 62].
Singlet oxygen is highly reactive, very short lived (around microsseconds), due to its very
instable electronic configuration, and has a very limited diffusivity. Its high reactivity is
responsible for a central role in the cellular damages during the photodynamic therapy and the
14|INTRODUCTION
limited diffusivity gives it a simultaneous localized effect (in a radius of approximately 20 nm) [60,
62, 66].
Although both types of reactions can occur simultaneously in the presence of molecular
oxygen, the second one occurs preferentially. Thus, singlet oxygen is not only more reactive than
ROS, but also the main product of the photodynamic process, constituting the principal
responsible for causing cellular damages [67].
1.2.2. The Photobleaching Process
As a consequence of light exposure, the photochemical destruction of the photosensitizer
can occur. This process called photobleaching is generally denounced by the decrease of
photosensitizer’s fluorescence intensity over time and can be minimized by decreasing
illumination light intensity [66].
It was thought that the photobleaching process is due to a reaction between the
photosensitizer molecule and singlet oxygen or ROS produced during illumination in a way that
leads to a decrease of its efficacy for further photosensitization processes. However, in some
cases the first product of photobleaching is a better photosensitizer than the initial molecule [66].
Photobleaching generally means a loss of reactivity but this process can have some
beneficial effects towards selective treatments. In fact, it is thought that photobleaching may be
responsible for the destruction of large amounts of photosensitizers on healthy tissues [69]. If
this process occurs fast enough, healthy tissues may be spared from photodynamic cell
damages, increasing injury site selectivity. However, there are still no clear evidences that the
photobleaching can affect PDT treatments in this way [66, 70].
1.2.3. Mechanism of Action of APDT
The APDT Mechanism of action is quite different depending on the type of target microbial
cells. The pathway where an initial increase of permeability of the cell wall is required, being an
operative pathway for yeasts and also for gram-negative bacteria and protozoa in the cystic stage
will be described [14].
The process begins when the photosensitizer (positively charged) binds to negative charges
of the cell wall, according to electrostatic forces. Then, this agent can modify the cell wall
INTRODUCTION|15
permeability (in the dark or photo-induced), leading to a massive influx of the photosensitizer for
the plasma membrane [14, 71]. At this point, a portion of the photosensitizer may cross the
plasma membrane and take different subcellular localizations, especially when a prolonged
incubation period is used. In the last few years, some authors have been described that certain
photosensitizers can cross the plasma membrane of eukaryotic cells and accumulate in
mitochondria, lysosomes (vacuoles, in the case of fungi) or Golgi apparatus, as well as in
endoplasmic reticulum [66].
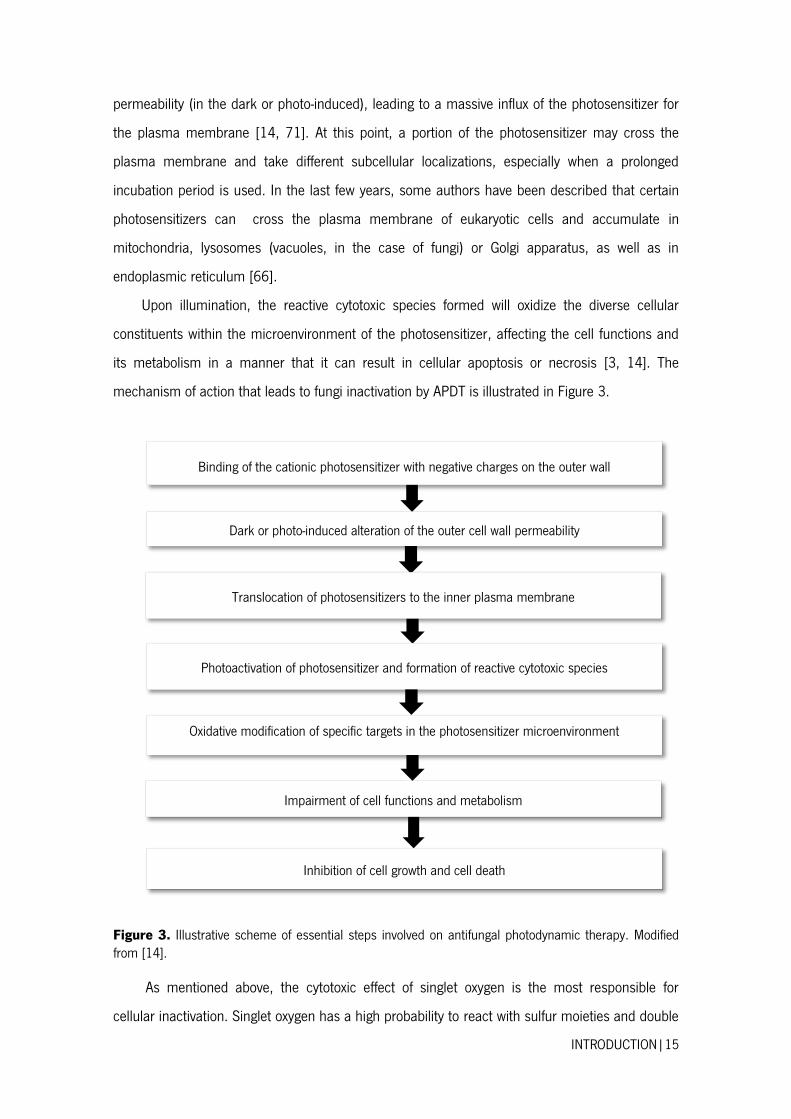
Upon illumination, the reactive cytotoxic species formed will oxidize the diverse cellular
constituents within the microenvironment of the photosensitizer, affecting the cell functions and
its metabolism in a manner that it can result in cellular apoptosis or necrosis [3, 14]. The
mechanism of action that leads to fungi inactivation by APDT is illustrated in Figure 3.
Figure 3. Illustrative scheme of essential steps involved on antifungal photodynamic therapy. Modified from [14].
As mentioned above, the cytotoxic effect of singlet oxygen is the most responsible for
cellular inactivation. Singlet oxygen has a high probability to react with sulfur moieties and double
Binding of the cationic photosensitizer with negative charges on the outer wall
Dark or photo-induced alteration of the outer cell wall permeability
Translocation of photosensitizers to the inner plasma membrane
Photoactivation of photosensitizer and formation of reactive cytotoxic species
Oxidative modification of specific targets in the photosensitizer microenvironment
Impairment of cell functions and metabolism
Inhibition of cell growth and cell death
16|INTRODUCTION
bonds, having the ability to interact with aromatic components of macromolecules [62]. Thus,
this product of type II reaction is a non-specific oxidizing agent that has multiple targets. It has
the ability to oxidize aminoacids, inactivating some proteins and enzymes (e.g., catalase,
superoxide dismutase, alcohol dehydrogenase, cytochrome coxidase, glyceraldehyde-3-phosphate
dehydrogenase and hexokinase), as well as it is responsible for oxidation of nucleic acids and
lipids peroxidation [9, 72]. In particular, lipids peroxidation can lead to the lyses of vacuoles,
mitochondria and plasma membrane [3].
Mitochondria are an important target of APDT. APDT induced mitochondrial damages
have been related to the tendency of many photosensitizers to produce cell apoptosis involving
the caspases pathway or the release of cytochrome c [66, 71]. However, plasma membrane
represents the critical target of APDT. The damages caused on this organelle can lead to loss of
barrier properties and inhibition of calcium and potassium transporter proteins, resulting in cell
swelling, loss of cellular constituents, collapse of cell ionic balance, as well as deficiency of some
essential substrates of anabolic and catabolic pathways [14, 73]. Additionally, the damage
caused in the cell wall and plasma membrane may allow more photosensitizer to be translocated
to endocytoplasmic districts and produce more reactive cytotoxic species upon illumination that
will cause more oxidative modifications on a variety of cell targets [3, 66].
Although singlet oxygen can react with nucleic acids, several studies shown that the
oxidative damages caused on plasmid and genomic DNA are not directly correlated with cell
death [14, 74, 75]. In fact, DNA photo-induced oxidative modifications are little significant, since
(i) the bacteria Deinococcus radiodurans, which has a highly efficient mechanism of DNA
repairing, is quickly killed by APDT [14]; and wild strains of Escherichia coli have similar
sensitivity to inactivation by APDT than E. coli strains with deficient DNA repairing mechanisms
[76]. These observations are in agreement with the lack of mutagenic effects observed in
photosensitization of microbial cells with several photosensitizers [14].
1.2.4. Biofilms Eradication by APDT
The clinical significance of biofilms is highlighted by recent estimates that over 65% of all
hospital infections are originated by these microbial communities [41, 57]. A recent scanning
electron microscopy studies [77, 78] have provided evidences that APDT has not only the ability
to kill a wide of pathogens within the biofilm but also has a direct effect on biofilm extracellular
INTRODUCTION|17
biomolecules. These authors described that the high reactivity of singlet oxygen exerts also effect
on the matrix polysaccharides, leading to biofilm destruction [3]. This twofold activity of APDT in
biofilm eradication may be very advantageous in clinical use because the structural rupture of
biofilms may inhibit plasmid exchanges and transference of drug resistance factors, as well as
may avoid new colonization and prevent recurrent infections [9]. However, there are only a few
studies in this area and most of them were developed using biofilms of pathogenic bacteria.
Given the high clinical relevance of fungi and fungal biofilms, there is a substantial need to
provide a deep understanding about the APDT effect on these communities.
1.2.5. Cellular Resistance Mechanisms to APDT
Since APDT products have no specific target and can cause damage to a variety of
cellular constituents, it seems to be very unlikely that microbial cells can develop resistance to
APDT [3].
One mechanism that may provide cellular resistance to APDT is the inactivation of the
oxygen reactive species H2O2, OH and
- by antioxidants detoxifying enzymes, such as
catalase, superoxide dismutase and peroxidase [62, 79]. For instance, the catalase enzyme can
remove the hydrogen peroxide (H2O2) from the Fenton reaction on type I process, breaking down
this molecule and forming water (H2O) and oxygen (O2) [80]. In addition, some antioxidants
peptides, such as glutathione, may also quench some oxygen reactive species leading to the
development of cellular resistance to APDT [62]. On the other hand, singlet oxygen cannot be
broken down by antioxidant enzymes in any enzymatic reaction, by contrast it has sometimes the
ability to inactivate them, which is the case of catalase and superoxide dismutase [81].
It was also thought that the general mechanisms of cell drug resistance, such as active
efflux pumps, altered drug uptake and intracellular trafficking of the photosensitizer may
contribute to the microbial resistance to APDT [3]. In the particular case of C. albicans, it has
been shown that the two major efflux systems, ABC and MFS transporters, are responsible for
the decrease of the killing effect of methylene blue (MB) – mediating APDT against this pathogen,
which suggests that both type of transporters are involved in MB efflux. To overcome this
problem, some authors proposed the combined use of efflux pumps inhibitors [3, 77]. However
and according to Prates et al. [82], the phototoxic effect of MB is improved using an ABC
transporter inhibitor, but is decreased when a MFS channel inhibitor is used, suggesting that
18|INTRODUCTION
MFS channels are also an uptake mechanism of MB [82]. Nevertheless, some authors support
that photosensitizers have not to be necessarily taken up by cells. The main important cellular
targets of APDT are the cell wall and plasma membrane and so, photosensitizers that specific
bind to these cell structures will be potential photosensitizers for APDT of the target cell [3].
On the other hand, some recent studies [79, 83] have revealed that the expression of HSP
can be significantly increased after the photodynamic treatment. These proteins play an
important role in refolding proteins and prevention of protein aggregation. So, it may constitute a
mechanism whereby microbial cells could develop resistance to APDT. For instance, in 2011 St
Denis et al. [63] had demonstrated that APDT-mediated by Toluidine Blue (TBO) in E. coli and
Enterococcus faecalis leads to the upregulation of the HSPs DNaK and GroEL and consequently
its survival is increased in about 2 log and 4 log, respectively. However, the mechanism that
leads to HSP expression is no yet completely understood and the combination of APDT with HSP
inhibitors does not seem to potentiate the killing effect of APDT in both microorganisms [3].
In summary, the studies and reports discussing the possible microbial resistance to APDT
are scattered and sometimes are quite controversial. Thus, a better knowledge in this field is
needed and perhaps could provide new therapeutic approaches, such as the combination of
APDT with other therapies [3].
1.2.6. Applications of APDT
The APDT potential have been investigated in a wide range of applications. Given that
photosensitizers have a broad antimicrobial spectrum of action, their use as general disinfectants
have been studied. This approach could be used to sterilize chirurgic material, blood products
and also surfaces and floors of wards or other healthcare facilities. On this last application,
photosensitizers could be applied as a wash liquid or spray and illuminated using ambient lights,
that will induce the production of oxygen cytotoxic species and so, an antimicrobial effect that
could lead to a decrease of the amount of microbial transmission in these places without induces
drug resistance to the conventional drugs [9].
On the other hand, applications like the sterilization of oral cavities and root canals, as
well the treatment of localized infections (e.g. impetigo, candidosis and periodontitis) seems to be
also a promising feature of APDT [6, 14, 60]. Besides these sites are readily accessible to topical
delivery of photosensitizers and light, this therapy may also kill the resistant strains without arm
INTRODUCTION|19
the surrounding tissues. Indeed, there is a possible set of optimal conditions that makes APDT
suitable to treat localized infections [14]. The combination of an appropriated incubation time,
low photosensitizer concentration and slight illumination parameters appears to allow a selective
killing of pathogens, sparing human cells (e.g., keratinocytes and fibroblasts) from photo-induced
cell damages [84-86]. Therefore, APDT provide a good antimicrobial alternative approach that
may decrease the mortality rates of the microbial associated diseases [3].
With the respect to photodynamic inactivation of C. albicans, superficial and localized
infected tissues on the skin and mucosae, such as mucocutaneous candidosis, seems to be the
main application of antifungal PDT [5]. Several classes of photosensitizers, mostly belonging to
the phenothiazines and porphyrin classes have been used on APDT of Candida species growing
on both planktonic cultures and biofilms (see section 1.3.2.) [3]. Many in vitro studies have been
reported the use of APDT on killing Candida species and some in vivo studies have also been
developed [7, 87-101].
1.3. PHOTOSENSITIZERS
In the last 30 years, the research on APDT field has significantly increased and thus, several
forms of photosensitizers have been created. Photosensitizers are organic aromatic molecules
constituted by large conjugated systems of double bonds that can be considered as a central
cromophore combined with auxiliary side chains that are responsible for further electron
delocalization of the photosensitizer [14, 62, 65]. Although APDT success is influenced by oxygen
availability and illumination light dose, photosensitizer concentration, as well as its own properties
are crucial parameters on the photodynamic inactivation process of pathogens [3, 65, 67].
1.3.1. Properties of Photosensitizers
The type and efficacy of cellular mechanisms of uptake of dye, as well as the pattern of
its distribution into the cell are dependent on its chemical properties, such as the amphiphilic
character, lipophilicity-hidrophilicity balance, degree of ionization or the presence of electric
charged groups [5].
20|INTRODUCTION
In particular, the amphiphilic character and the presence of electric charged groups are
very important factors on photosensitizer performance. While amphiphilic property avoid self-
aggregation of photosensitizer and provides a good penetration in the lipid layer of plasma
membrane, the presence of electric charged groups provides electrostatic affinity that
encourages the distribution of photosensitizer for various subcellular targets [5, 66, 102].
However, there are small details to consider depending on the target. Some photosensitizers that
are efficient in killing gram-negative and gram-positive bacteria do not show the same therapeutic
effect in fungi. For instance, a large number of positive charges are required to inactivate
bacteria, but the same structural factor does not provide a good binding or uptake by fungi cells,
especially if they are distributed homogeneously. In this case, more lipophilic structures with less
positive charges seem to be more appropriated [62].
Although there are small differences between suitable photosensitizers for fungi or
bacteria, there is a consensus on the electronic character of photosensitizers. Cationic structures
are more effective to kill both bacteria and fungi than anionic or neutral ones, due the
electrostatic affinity provided between its positive charges and the negatively charged groups of
cell wall and plasma membrane [14].
Recently, it was also established that there are essential photophysical and
photochemical parameters that determine photosensitizing capability of a compound. These
parameters are the absorption peak wavelenght (λmax), extinction coeficient (ε), triplet-state life
time (τt), triplet-state quantum yield (Φt), triplet-state energy ( ΔEt) and singlet oxygen quantum
yield (ΦΔ), which are all specific of each photosensitizer and dependent on its molecular
structure [5, 65]. In short, a photosensitizer with optimal properties to APDT clinical use must
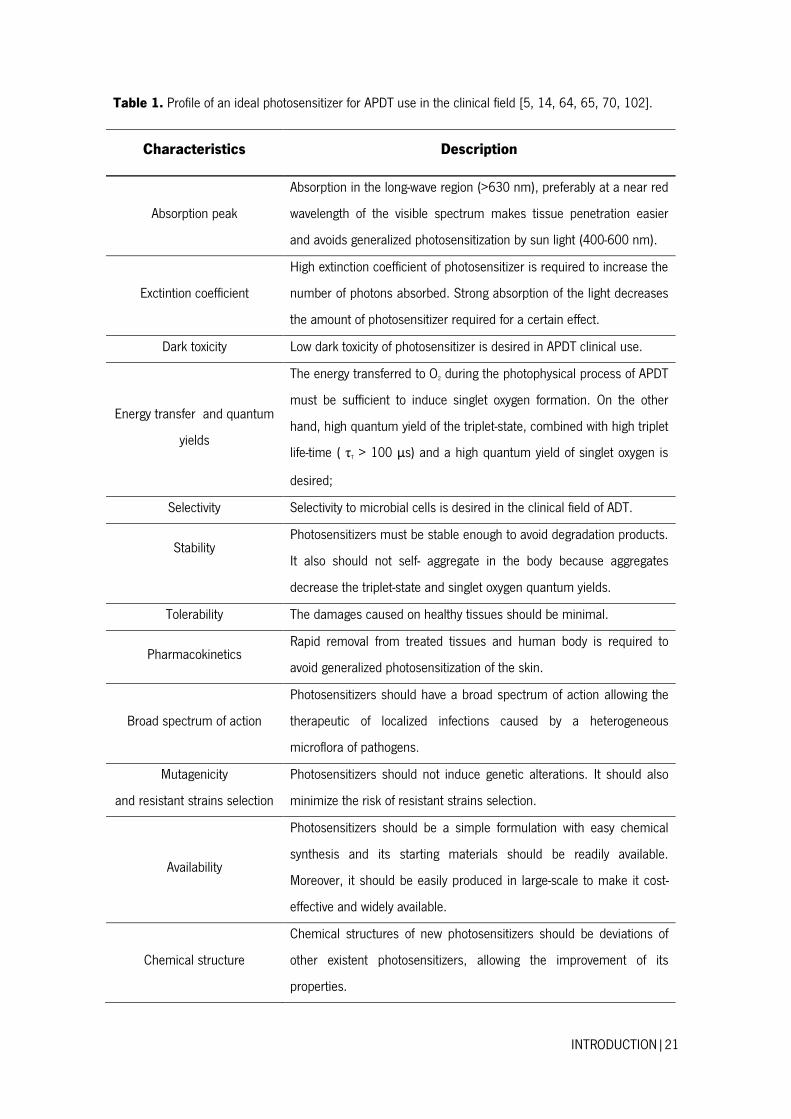
have a wide range of properties. Table 1 describes the profile of an ideal photosensitizer for
APDT use in the clinical field [5, 14, 64, 65, 70, 102].
INTRODUCTION|21
Table 1. Profile of an ideal photosensitizer for APDT use in the clinical field [5, 14, 64, 65, 70, 102].
Characteristics Description
Absorption peak
Absorption in the long-wave region (>630 nm), preferably at a near red
wavelength of the visible spectrum makes tissue penetration easier
and avoids generalized photosensitization by sun light (400-600 nm).
Exctintion coefficient
High extinction coefficient of photosensitizer is required to increase the
number of photons absorbed. Strong absorption of the light decreases
the amount of photosensitizer required for a certain effect.
Dark toxicity Low dark toxicity of photosensitizer is desired in APDT clinical use.
Energy transfer and quantum
yields
The energy transferred to O2 during the photophysical process of APDT
must be sufficient to induce singlet oxygen formation. On the other
hand, high quantum yield of the triplet-state, combined with high triplet
life-time ( τT > 100 μs) and a high quantum yield of singlet oxygen is
desired;
Selectivity Selectivity to microbial cells is desired in the clinical field of ADT.
Stability Photosensitizers must be stable enough to avoid degradation products.
It also should not self- aggregate in the body because aggregates
decrease the triplet-state and singlet oxygen quantum yields.
Tolerability The damages caused on healthy tissues should be minimal.
Pharmacokinetics Rapid removal from treated tissues and human body is required to
avoid generalized photosensitization of the skin.
Broad spectrum of action
Photosensitizers should have a broad spectrum of action allowing the
therapeutic of localized infections caused by a heterogeneous
microflora of pathogens.
Mutagenicity
and resistant strains selection
Photosensitizers should not induce genetic alterations. It should also
minimize the risk of resistant strains selection.
Availability
Photosensitizers should be a simple formulation with easy chemical
synthesis and its starting materials should be readily available.
Moreover, it should be easily produced in large-scale to make it cost-
effective and widely available.
Chemical structure
Chemical structures of new photosensitizers should be deviations of
other existent photosensitizers, allowing the improvement of its
properties.
22|INTRODUCTION
1.3.2. Most Common Photosensitizers in APDT
The first generation of photosensitizers emerged in 1960 and comprised
hematoprophyrins (Hp) and hematoporphyrin derivative (HpD), which is composed by
monomeric and oligomeric porphyrins derived from human blood. Although its photosensitizing
potential, both Hp and HpD were not suitable for APDT use [65]. Besides its exactly composition
was unknown, its characteristics and distribution differed from preparation to preparation (which
makes impossible to predict the therapeutic effect), the absorption spectrum (400-600 nm) was
less than that idealized for APDT use and the phototoxic effect were mainly promoted by
unbounded molecules in the bulk aqueous solution leading to a mediocre killing effect [5, 65,
102].
The second generation of photosensitizers was developed to fill the gaps of first
generation. This new photosensitizers have longer wavelength absorption peaks (600-800 nm),
that allows a deeper penetration of light in tissues (2-3 cm), reasonable stability, absent or low
dark toxicity and good capability to induce singlet oxygen formation [65, 102]. There are
numerous classes of photosensitizers belonging to this generation, which were firstly created for
the antitumoral application of PDT. However, some of these agents have been also showing
efficiency on APDT applications. Porphyrins, phthalocyanines and phenothiazines dyes are the
most common photosensitizers used on APDT field (Figure 4) [5, 64, 103].
Figure 4. Chemical structures of the main photosensitizers used on PDT. Modified from [14, 102, 104]
Porphyrins
Porphyrins of second generation are pure synthetic molecules that have a central
structure composed by tetrapirrole conjugates, generally associated with various polar hydrophilic

INTRODUCTION|23
substituents groups: hydroxy, carboxy, quaternary ammonium, sulfonic or pyridinium. These
photosensitizers have absorption peaks in the 650 - 700 nm waveband and are 30-times more
efficient than HpD. [5, 102].
The polarity of these molecules is their critical factor. The more recent porphyrins
derivatives are amphiphilic and water soluble molecules that are characterized by a greater
uptake and, consequently, have a better activity against yeasts in comparison to HpD or other
porphyrins derivatives [5]. In fact, a new cationic porphyrin photosensitizer - the meso-tetra (N-
methyl-4-pyridyl porphine tetra tosylate (TMP-1363) - was shown highly effective in APDT against
yeast forms of C. albicans and C. glabrata [62]
As microorganisms self-produce and accumulate porphyrins, it has also been adopted
the endogeneous photosensitization of microbial cells through administration of a small non-dye
aminoacid (5-aminolevulinic acid; ALA) [62, 105]. On this approach, exogenously supplied ALA
enters into the microbial heme synthesis pathway, allowing an excessive accumulation of
protoporphyrin IX (Pp IX). Upon illumination, Pp IX can act like an effective photosensitizer and
produce photodamage at the mitochondria level (where it is synthetized), as well as on plasma
membrane. Pp IX has its absorption peak at the 375-405 nm waveband, however it has other
lowest peak at 630-633 nm region [5, 64, 106].
Phthalocyanines
Phthalocyanines have similar chemical structures to porphyrins and are characterized by
the condensation of benzene rings with pyrrole moieties. Chemical properties of phthalocyanines
may be adjusted by modifying the central metal/semi-metal atom or the number and type of side
chains. In fact, the central atom (Zn, AlIII, SiIV ou GeIV) plays an important role on the phototoxic
activity. It may affect the triplet-state life time and quantum yield, as well as the introduction of
polar substituents on side chains, which will influence the polarity balance and, consequently, the
cell uptake and its distribution into microbial cells [5].
Phthalocyanines have great singlet oxygen quantum yield and high extinction coefficient
in the far red (680-720 nm). Despite the lack of knowledge about the phthalocyanines cell
targets, they have showed to be effective against C. albicans. One recent photosensitizer of this
family, BAM-SiPC (also known as malachite green), has been shown a great activity against some

24|INTRODUCTION
pathogens by APDT, including C. albicans [62]. Moreover, other study conducted by Lam et al.
[94] showed that phthalocyanine PC4-mediated APDT can induce apoptosis of C. albicans cells.
Phenothiazines
Phenothiazines have a very dissimilar chemical structure in comparison to all dyes
mentioned above. These dyes have simple planar and tricyclic skeleton combined with polar
substituents (side chains), having its absorption peak in the 600-900 nm waveband [5, 103]. The
most frequent used phenothiazines derivatives are MB and TBO, two efficient producers of singlet
oxygen that have its absorption peak at 656 nm and 625 nm, respectively [5, 64].
In yeasts, phenothiazines tend to accumulate on plasma membrane and damage it after
light exposure. Both MB and TBO have been shown efficient photosensitizers to C. albicans
photoinactivation by APDT [5]. In particular, MB and its analogues show killing rates 18-200
times bigger than those determined for keratinocytes, suggesting that MB-APDT of fungal
infections of the skin can be highly effective and selective [5].
1.3.3. Benzo[a]phenoxazines
Phenoxazines have a similar chemical structure of phenothiazines with the difference
that has an oxygen atom replacing the sulfur atom (Figure 5A). Benzophenoxazines are the result
of addition of benzene rings to phenoxazines and thus, they may have linear,
(benzo[b]phenoxazine) or angular structures (benzo[a]phenoxazine and benzo[c]phenoxazine),
depending on orientation of benzene ring fusion. Despite there are three types of structures, only
benzo[a]phenoxazines have been molecules of interest and widely explored in contemporary
science [104]. The presence of substituents groups in some orientations of these structures may
give it the ability to freely donate and/or accept electron density, granting them the capacity to
emit fluorescence and so, some benzo[a]phenoxazines have been widely used as biomolecular
probes of DNA and RNA in fluorescence studies [104].

INTRODUCTION|25
Figure 5. (A) Chemical structure of phenoxazines and benzophenoxazines; (B) Structures of the three best known benzo[a]phenoxazines. Adapted from [104].
The first benzo[a]phenoxazine to be discovered was Meldola’s Blue, however Nile Blue
and Nile Red are by far the more used (Figure 5B) [104]. As Meldola’s Blue is poorly water-
soluble and Nile Red is a neutral benzo[a]phenoxazine (and so, also poorly water-soluble), the
positively charged benzo[a]phenoxazine Nile Blue is the only one of interest for APDT [103, 104].
Nile Blue, which has its absorption peak localized at 635 nm, has a positively charged and
oxidized phenoxazine system, i.e, it is a benzo[a]phenoxazinium dye and has a 9-diethylamino
substituent to donate electron density across the ring and an iminium substituent to act as
acceptor [104].
As a result of research on PDT field, there have been created some Nile Blue derivatives
that may have its absorption peak in the 600-700 waveband [104]. In the clinical field,
commercial Nile Blue and some selected derivatives has been showed a high biological selectivity
to tumoral tissues accompanied by a quickly pharmacokinetic elimination (24 hours post
administration) [104, 107]. Accordingly to Foley et al. [103], some Nile Blue chalcogens
analogues can also have a great photo-induced activity against yeasts and bacteria, such as C.
albicans, E. coli and E. faecalis [64].
Certainly, the possibility to synthetize new benzo[a]phenoxazinium dyes derived from Nile
Blue with better pharmacologic and physic-chemical properties may be a promising approach to
create new APDT photosensitizers. Benzo[a]phenoxazinium dyes may have some characteristics
that make them good photosensitizers for APDT application. They are: broad-spectrum of action;
efficient absorbers of 600-700 nm light; good cell binding and cell uptake; great photo-induced
activity against pathogens; and high singlet oxygen quantum yield [103].
A B
B B
26|INTRODUCTION
1.3.4. Formulation of New Concepts
The list of photosensitizers for APDT use has still expanding, especially the ones focused
to inactivate pathogenic fungi such as C. albicans. Curcumin, chlorin e6, bacteriochlorin, boron
difluoride (BF2) or Rose Bengal (RB) are some examples of new photosensitizers that have been
shown effective in killing yeasts by APDT, including C. albicans [62].
Alternatively, the combination of photosensitizers with compounds that create pores
within the fungal membrane may increase the cellular uptake and thus, may be a potent strategy
for treatment of fungal infections. Saponins and polyenes, such as amphotericin B and nystatin,
are compounds with pore-forming properties that may be used in conjunction with
photosensitizers on this strategy [62]. For instance, Coleman et al. [108] reported that the
pretreatment of C. albicans cells with a saponin significantly increased the influx of Rose Bengal
and Chlorin e6, as well increased 2-5 log the killing effect of this photosensitizer upon
illumination with low-intensity light at the correct wavelength.
Furthermore, the emerging of a third generation photosensitizers has been also studied.
This new generation has the principal aim to overcome the problem of aggregation of
photosensitizer in aqueous solutions, as well as improve photosensitizer delivery and inactivation
kinetics [62, 109, 110]. In this strategy, photosensitizer delivery is achieved through carriers like
liposomes, micelles and nanoparticles that may be also combined with specific antibodies for the
target [102, 111]. Among these carriers, liposomes are the most commonly used carrier and
have been proved to enhance the killing effect of many photosensitizers by APDT. They increase
photosensitizer’s solubility and stability, as well as facilitate the penetration into cell by means of
fusion processes or disturbing the cell wall [112].
1.4. LIGHT SOURCES AND DELIVERY
1.4.1. The concept of Light Fluence and Source Irradiance
By definition, APDT requires a light source with a wavelength that matches with
absorption spectrum of the photosensitizer to supply the requested energy for inducing singlet
oxygen production or promoting redox reactions. Therefore, the efficiency of APDT process is
directly dependent on light exposure [9].
INTRODUCTION|27
In light based medicine and dentistry, radiant exposure is defined as fluence and is a
measurement of energy (Joule) over area (usually cm2) of the light device spot size. Other
relevant concept is the light source irradiance, which is a measurement of source power (Watt)
per area (usually cm2) of light device spot size. Typically, irradiances for light sources in
antifungal PDT are in the range of 10-100 mW cm-2, with light fluence comprised between 10
and 200 J cm-2 [3]. The crucial point in this light dosimetry is to avoid thermal effects of light
when power outputs above 100 mW cm-2 are needed [62].
Indeed, there is no need to use high light doses. The anti-tumoral PDT research
demonstrated that at low irradiances, oxygen consuming is lowest and thus, exposure period of
tissues to singlet oxygen are longest, resulting in a high therapeutic response. Other researches
in the antifungal PDT have also shown that C. albicans cells can be significantly killed at
relatively low light intensities [62].
1.4.2. Light Penetration
The light fluences applied to the biological sites decreases exponentially with the
penetration into the tissues by the combination of some dispersive and absorption effects. The
proportion between these two processes is dependent on tissue type and light wavelength [66].
As is known, skin is irregular, inhomogeneous and has microscopic structures like
follicles, cell organelles, macromolecules and natural cromophores, so, a portion of received
photons may be reflected, dispersed or absorbed until reach the target [66]. It was of general
agreement that tissue penetration of light increases with the increase of light wavelength in the
visible spectrum (400-700 nm) [6, 66]. Thus, light sources with wavelength in the far red can do
a good penetration into the skin, as well as photosensitizers with absorption peak in this range
are the most suitable to kill dermatophytes that colonizes stratum corneum and hair follicles [5].
1.4.3. Most Common Light Sources in PDT
In the PDT field it has been used a wide range of lamps and lasers as light sources.
While lasers provides highly coherent monochromatic light, decreasing the required time to reach
a given light dose, lamps has a wide range of wavelengths a so, they can be used with numerous
photosensitizers. At the level of clinical treatment of localized infections on the skin or oral cavity,
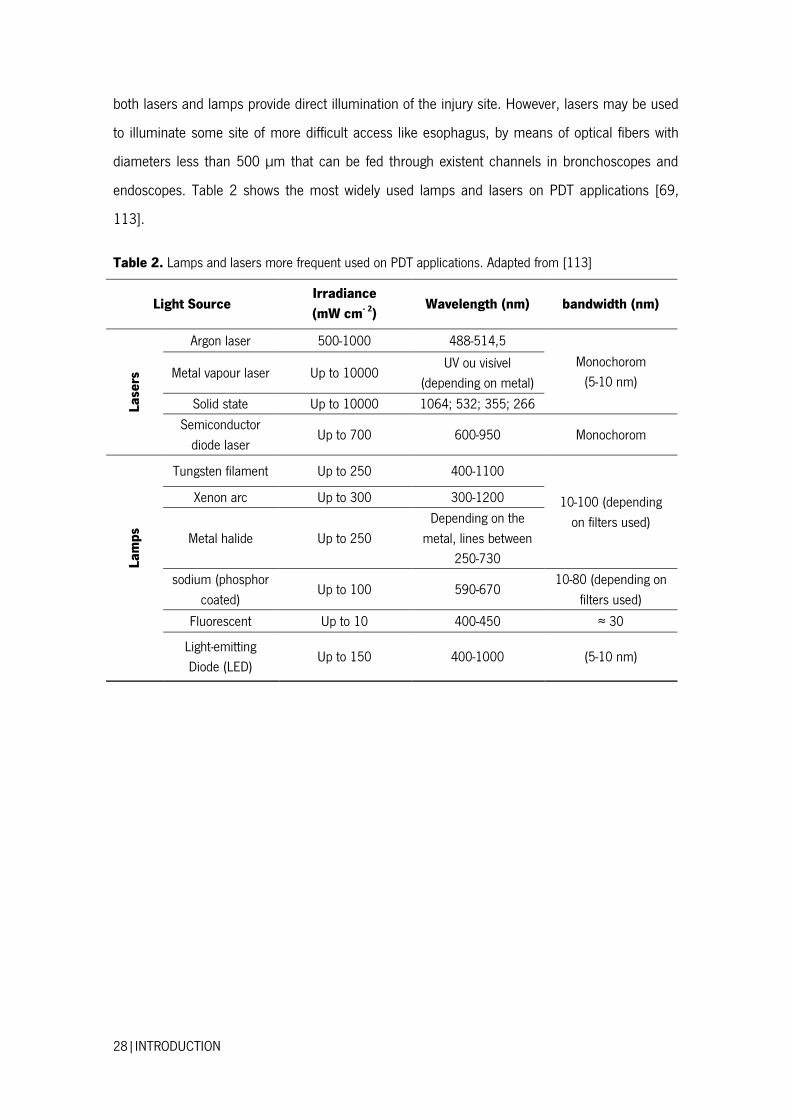
28|INTRODUCTION
both lasers and lamps provide direct illumination of the injury site. However, lasers may be used
to illuminate some site of more difficult access like esophagus, by means of optical fibers with
diameters less than 500 µm that can be fed through existent channels in bronchoscopes and
endoscopes. Table 2 shows the most widely used lamps and lasers on PDT applications [69,
113].
Table 2. Lamps and lasers more frequent used on PDT applications. Adapted from [113]
Light Source Irradiance
(mW cm- 2) Wavelength (nm) bandwidth (nm)
Lase
rs
Argon laser 500-1000 488-514,5
Monochorom
(5-10 nm) Metal vapour laser Up to 10000
UV ou visível
(depending on metal)
Solid state Up to 10000 1064; 532; 355; 266
Semiconductor
diode laser Up to 700 600-950 Monochorom
Lam
ps
Tungsten filament Up to 250 400-1100
10-100 (depending
on filters used)
Xenon arc Up to 300 300-1200
Metal halide Up to 250
Depending on the
metal, lines between
250-730
sodium (phosphor
coated) Up to 100 590-670
10-80 (depending on
filters used)
Fluorescent Up to 10 400-450 ≈ 30
Light-emitting
Diode (LED) Up to 150 400-1000 (5-10 nm)

2. CHAPTER IIMATERIALS AND METHODS

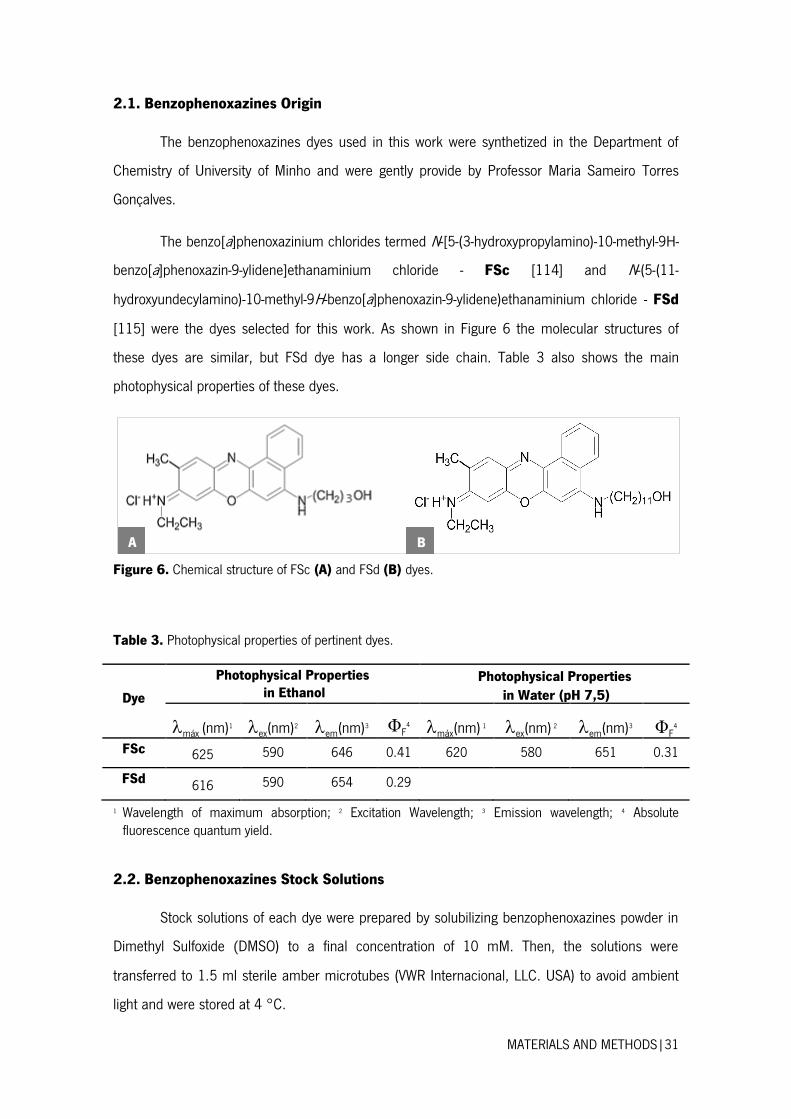
MATERIALS AND METHODS|31
2.1. Benzophenoxazines Origin
The benzophenoxazines dyes used in this work were synthetized in the Department of
Chemistry of University of Minho and were gently provide by Professor Maria Sameiro Torres
Gonçalves.
The benzo[a]phenoxazinium chlorides termed N-[5-(3-hydroxypropylamino)-10-methyl-9H-
benzo[a]phenoxazin-9-ylidene]ethanaminium chloride - FSc [114] and N-(5-(11-
hydroxyundecylamino)-10-methyl-9H-benzo[a]phenoxazin-9-ylidene)ethanaminium chloride - FSd
[115] were the dyes selected for this work. As shown in Figure 6 the molecular structures of
these dyes are similar, but FSd dye has a longer side chain. Table 3 also shows the main
photophysical properties of these dyes.
Figure 6. Chemical structure of FSc (A) and FSd (B) dyes.
Table 3. Photophysical properties of pertinent dyes.
Dye
Photophysical Properties in Ethanol
Photophysical Properties
in Water (pH 7,5)
máx (nm)1 ex(nm)2 em(nm)3
ΦF
4 máx(nm) 1 ex(nm) 2
em(nm)3 ΦF
4 FSc 625 590 646 0.41 620 580 651 0.31
FSd 616 590 654 0.29
1 Wavelength of maximum absorption; 2 Excitation Wavelength; 3 Emission wavelength; 4 Absolute fluorescence quantum yield.
2.2. Benzophenoxazines Stock Solutions
Stock solutions of each dye were prepared by solubilizing benzophenoxazines powder in
Dimethyl Sulfoxide (DMSO) to a final concentration of 10 mM. Then, the solutions were
transferred to 1.5 ml sterile amber microtubes (VWR Internacional, LLC. USA) to avoid ambient
light and were stored at 4 °C.
A B
MATERIALS AND METHODS|32
Immediately before each experiment, aliquots of the dyes were diluted in sterile
Phosphate Buffered Saline solution (PBS; pH 7.5; 0.1 M), which was previously prepared, to
obtain working solutions with 1mM concentration. Then, these solutions were diluted again in
PBS in order to obtain the required working concentrations. All the solutions were prepared on
1.5 ml sterile brown microtubes as described above.
PBS solution was prepared in sterilized water by adding 8 g l-1 of sodium chloride (NaCl),
0.2 g l-1 of potassium chloride (KCl), 0.3 g l-1 of potassium dihydrogen phosphate (KH2PO4) and
1.15 g l-1 of disodium phosphate (Na2HPO4). The pH was adjusted to 7.0 and the solution was
autoclaved at 121 ˚C for 15 minutes and reserved at room temperature.
2.3. Organism, Culture Media and Growth Conditions
The microorganism used in this study was Candida albicans ATCC 90028, a reference
yeast strain from American Type Culture Collection. This strain was preserved at -80ºC in a
storage solution of Sabouraud Dextrose Broth (SDB; Liofilchem®, Roseto degli Abruzzi, Italy)
supplemented with 10% of glycerol.
SDB and Sabouraud Dextrose Agar plates (SDA; Liofilchem®, Roseto degli Abruzzi, Italy)
were prepared at 30 g l-1 concentration of SDB in distilled water and SDA by supplementation of
SDB with 20 g l-1 of agar (Liofilchem®). Then, both media were sterilized in a steam autoclave at
121°C for 15 minutes and were stored at room temperature. RPMI-1640 medium were prepared
by dissolving 10.4 g l-1 of this powder in distilled water and adding 34.53 g l-1 of MOPS (Sigma
Aldrich, Portugal). Finally the pH was adjusted to 7 and the medium was sterilized by filtration
through a 0.22 μm cellulose filter.
Previously to each experiment, yeast cells were sub-cultured on SDA for 48 h at 37ºC.
Then, one loopful of single-cell colonies (3-5 colonies) was inoculated in 30 ml of SDB and
incubated for 18 h, at 37ºC, under constant agitation of 120 rpm. After this step, cells were
harvested by centrifugation at 3000 x g for 10 min at 4°C and washed twice with 15 ml of PBS.
The pellets were then suspended in 10 ml of sterile RPMI-1640 (Sigma Aldrich, St Louis, USA),
for antifungal susceptibility testing, and in 10 ml of SDB for the remaining experiments. The
cellular density was adjusted, depending on the experiment, using an improved Neubauer
haemocytometer (Marienfild, Land-Könicshofen, Germany).

MATERIALS AND METHODS|33
2.4. Antifungal Susceptibility Testing
The antifungal susceptibility testing was performed under the orientation of M27-A2
document from NCCLS - National Committee for clinical Laboratory Standards - [116] with some
modifications.
Different dyes concentration at twofold final concentration (20, 25, 30, 50, 100 and 200
µM) were firstly prepared in PBS, previously to each experiment. Then, standardized cell
suspensions (100 µl of containing 2x10⁷ cells ml-1 or 2x10⁸ cells ml-1 in RPMI) were combined
with 100 µl of each dye at concentrations described above in respective wells of Biolite 96-well
multidish plates (Thermo Fischer Scientific, Waltham, USA).
The microplates were incubated in the dark at 37°C during 48 h and the number of
cultivable cells was then determined by counting colony forming units (CFUs). Briefly, the cell
suspensions of each 3 wells per condition were collected and vortexed during 1 min. Then, serial
dilutions on PBS were done and plated onto SDA. After 24 h of incubation at 37ºC, the number
of colonies formed was counted and the total CFUs per unit of volume were determined. These
experiments were performed three times with at least each condition evaluated in triplicate.
Negative, dyes and yeast controls were also included.
2.5. Biofilm Formation
Standardized cell suspensions (200 µl of containing 1x10⁷ cells ml-1 in SDB) were placed
into selected wells of 96-wells polystyrene microtiter plates (Orange Scientific, Braine-l’Alleud,
Belgium) and incubated at 37°C under agitation at 120 rpm. At 24 h, 100 µl of SDB medium
was removed and the same volume of fresh SDB was added. The preparations were then
incubated for a further 24 h. After biofilm formation the medium was aspirated and non-adherent
cells removed by washing biofilms once in 200 μl of PBS.
2.6. Quantification of Cultivable Biofilm Cells
In order to determine the number of biofilm cultivable cells on dark toxicity and
photodynamic inactivation assays, the biofilms were firstly resuspended in 200 μl of PBS by
scrapping the adhered biomass from the wells using a mechanic technique and repeated
pipetting. Then, these 200 μl were collected to a sterile microtube and the same method was
done with 100 μl of PBS to guarantee that each biofilm cell was totally resuspended. The

MATERIALS AND METHODS|34
resulting resuspended biofilms of each 3 wells per condition (on the case of dark toxicity assay)
and 2 wells per condition (on the case of photodynamic inactivation assays) were collected and
vigorously vortexed during 1 min to disrupt the biofilm matrix. Then, serial decimal dilutions in
PBS were done and plated onto SDA. Agar plates were incubated at 37 ºC for 24 h and the total
CFUs per unit area (Log CFU cm-2) of microtiter plate well was enumerated.
2.7. Antifungal Photodynamic Therapy
2.7.1. Dark Toxicity
To verify the absence of antifungal activity of each dye on C. albicans biofilms,
standardized solutions of FSc or FSd dye with 100, 200 and 300 µM concentration, previously
prepared, were added to wells after biofilm formation and the microtiter plates were then
incubated in the dark at 37ºC during 3 h or 18 h with constant agitation at 120 rpm.
Afterwards, dye solutions were aspired and the biofilms were washed twice in 200 μl of
PBS to remove loosely attached cells and excess of dye. Then, 200 μl of PBS were added again
to wells and the number of cultivable biofilm cells was determined by counting colony forming
units (CFUs) as described on section 2.6. These experiments were performed three times with
each condition evaluated in triplicate. Negative, dyes and yeast controls were also included.
2.7.2. Photodynamic Inactivation
In this experiment, the biofilms were formed and specific concentrations of FSc and FSd
(100, 200 and 300 µM) were added (as described above) on selected wells of the microtiter
plate, leaving an interval of three wells between each well used, to avoid side light exposure
during biofilms illumination.
After dark incubation during 3 h or 18 h in the same conditions as described on section
2.7.1, dyes solutions were aspired and biofilms were washed twice in 200 μl of PBS to remove
loosely attached cells and excess of dye. Then, 200 μl of PBS were added again to wells and
each biofilm was aseptically (assured with a Bunsen burner) illuminated at an average irradiance
of 10 mW cm-2 with a xenon arc lamp (OSRAM HBO 200W) equipped with a bandpass filter
centered on 600 ±2 nm (ThorLabs, New Jersey, USA). Biofilms were illuminated during 20 or 60
minutes, which corresponds to a light fluence of 12 J cm-2 and 36 J cm-2, respectively. Exact
power was measured at the end of every experiment with an integrating sphere photodiode
power sensor (model S144C; ThorLabs) using the PM100D Utility software (Thorlabs).
MATERIALS AND METHODS|35
The number of cultivable biofilm cells was then determined by CFUs after biofilm cells
resuspension, as described on section 2.6. Negative, dyes and yeast controls, even as light
controls (illumination of biofilm with PBS only; light fluence=12 J cm-2 or 36 J cm-2) and dark
controls (biofilm with dyes in the absence of light; light fluence=0 J cm-2) were also included.
Experiments were repeated three times with each condition evaluated in duplicate.
2.7.3. Absorption Spectra of Biofilms
The absorption spectrum of each biofilm illuminated was also determined previously and
after the biofilm illumination. This step was intended to observe possible dyes alterations or
aggregations during light exposure. The absorption spectrum was measured using an optical fiber
and the ThorLabs SPLICCO software (ThorLabs, New Jersey, USA). The selected absorption
spectrum of each condition tested is on appendix A.
2.8. Dye Uptake
Dye uptake assays were realized to verify if photodynamic inactivation was correlated
with dye uptake, even as to observe if that effect was influenced in a concentration-dependent
manner.
After biofilm formation, biofilms were incubated in the dark with both dyes at the
concentration of 100 and 300 μM during 3 h or 18 h at the same conditions as described on
section 2.7.1. After dark incubation, biofilms were washed twice in 200 μl of PBS to remove
excess of dye and loosely adhered cells. Then, the same volume of PBS was added and the
biofilms were resuspended as described above (section 2.6). The resulting resuspended biofilms
of each 3 wells per condition were collected, centrifuged at 6654 x g for 5 min at 4°C and the
supernatants were then collected for fluorescence analysis, to achieve dye retained in the biofilm
matrix during dark incubation. These pellets were resuspended in 900 μl of PBS and cells were
lysed by sonication (3 cycles of 60 seconds with 30 seconds off between each cycle, at 20 kHz
and 35% of power output) through a VCX750 ultrasonic processor (Cole-Parmer, USA). The
resulting lysates were centrifuged and the supernatant was removed for fluorescence analysis to
achieve dye taken up by cells during dark incubation. It is important to emphasize that sonication
parameters were previously optimized in order to promote the complete lysis of all biofilm cells.
For fluorescence analysis, 200 μl of each supernatant solution were placed in triplicate
on selected wells of a black 96-wells pureGrade microtiter plate (VWR, Portugal). Fluorescence
MATERIALS AND METHODS|36
was determined through a microtiter plate reader (Bio-Tek® Synergy HT, Izasa, Portugal) with
excitation wavelength set to 590 nm and the emission wavelength set to 645 nm. The sensibility
of device was set to 80 and the agitation intensity was defined for 1 with the duration of 3
seconds.
Results were expressed as concentration of dye on supernatant (μM). The concentration
of dye was determined through previously prepared standard curves of fluorescence intensity
versus concentration of dyes in PBS (Appendix B). Experiments were repeated three times with
each condition evaluated in triplicate. Control wells containing biofilm with only PBS were also
performed and treated as the remaining samples to determine whether PBS and the remaining
biomass, even as the material plate could interfere with fluorescence intensity of the samples.
2.9. Fluorescence Microscopy
In this experiment, fluorescence microscopy analysis was performed in planktonic cells
and biofilm resuspended cells, in order to observe the differences of dye uptake by cells on each
approach.
2.9.1. Fluorescence Microscopy of Planktonic Cells
For fluorescence microscopy of planktonic cells, cells were inoculated in SDB for 18 h at
37ºC under agitation at 120 rpm. Then, cells were harvested by centrifugation (3000 x g for 10
min at 4ºC) and washed twice in 15 ml of PBS. After cells resuspension in 10 ml of PBS, the
cells density was adjusted to 1x10⁷ cells ml-1 and aliquots of 200 μl of this cell suspension was
added to a 15 ml Falcon-tube (Orange Scientific, Belgium). Afterwards, these cells were
harvested again by centrifugation at 1700 x g for 5 min at 4ºC, resuspended in 200 μl of each
dye solution at a concentration of 300 μM and incubated in the dark for 3 h or 18 h at the same
conditions described on section 2.7.1. After this step, cells were harvested by centrifugation at
1700 x g for 5 min at room temperature and washed twice in 200 μl PBS. After the last wash,
the resulting pellets were resuspended on 20 μl of PBS, transferred to microscope slides and
examined in a BX51 Olympus Fluorescence Microscope through a TRITC filter, using the same
exposure time. The obtained images are result of one single experiment with a single evaluation
of each condition.
MATERIALS AND METHODS|37
2.9.2. Fluorescence Microscopy of Biofilm Resuspended Cells
For fluorescence microscopy analysis of biofilm resuspended cells, several biofilms were
formed and incubated in the dark with both dyes at the 300 μM concentration for 3 and 18 h at
the same conditions described on section 2.7.1. After the dark incubation step, biofilms were
washed twice in 200 μl of PBS and resuspended in the same volume of PBS through using a
mechanic technique and repeated pipetting. Then, cells were harvested by centrifugation at 1700
x g for 5 min at room temperature and washed again twice in 200 μl of PBS. Then, samples
were analyzed as previously described for the planktonic cells. The obtained images are result of
one single experiment with a single evaluation of each condition.
2.10. Statistical Analysis
Statistical analysis was performed using the statistical program GraphPad Prism 5. All
data were compared using two-way analysis of variance (ANOVA) by applying the Bonferroni post-
test. Tests were performed with a confidence level of 95%.


3. CHAPTER III
RESULTS AND DISCUSSION

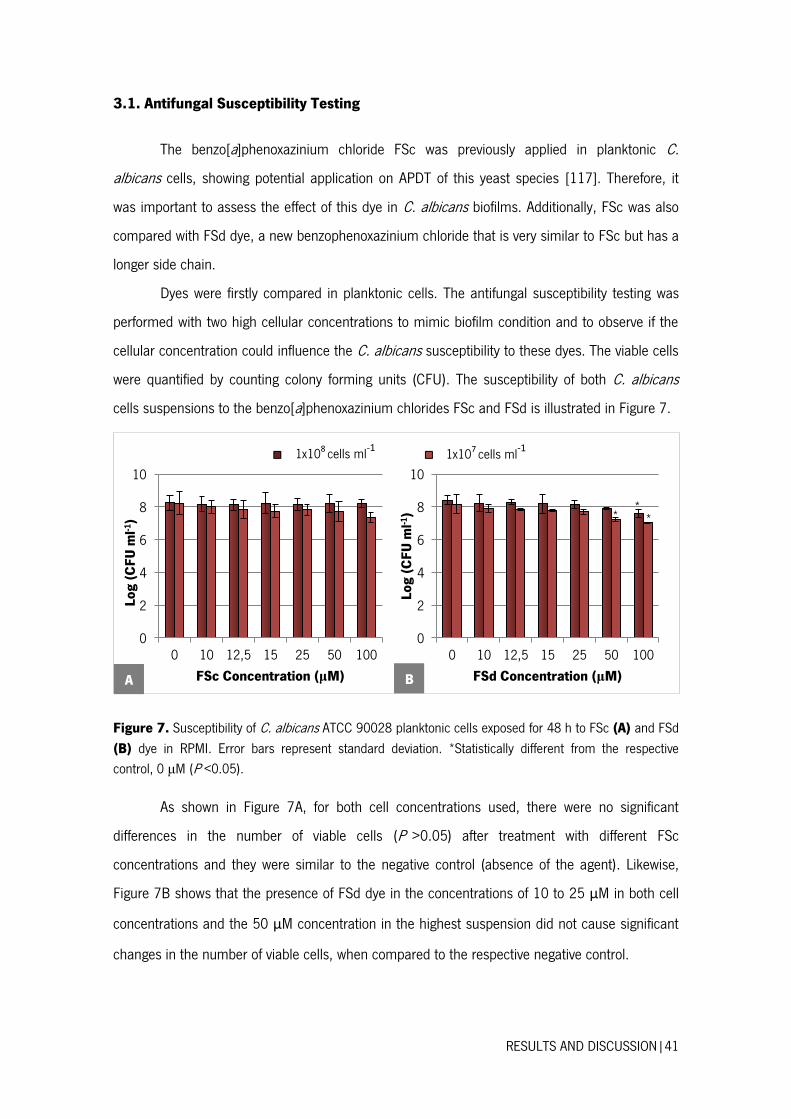
RESULTS AND DISCUSSION|41
3.1. Antifungal Susceptibility Testing
The benzo[a]phenoxazinium chloride FSc was previously applied in planktonic C.
albicans cells, showing potential application on APDT of this yeast species [117]. Therefore, it
was important to assess the effect of this dye in C. albicans biofilms. Additionally, FSc was also
compared with FSd dye, a new benzophenoxazinium chloride that is very similar to FSc but has a
longer side chain.
Dyes were firstly compared in planktonic cells. The antifungal susceptibility testing was
performed with two high cellular concentrations to mimic biofilm condition and to observe if the
cellular concentration could influence the C. albicans susceptibility to these dyes. The viable cells
were quantified by counting colony forming units (CFU). The susceptibility of both C. albicans
cells suspensions to the benzo[a]phenoxazinium chlorides FSc and FSd is illustrated in Figure 7.
Figure 7. Susceptibility of C. albicans ATCC 90028 planktonic cells exposed for 48 h to FSc (A) and FSd
(B) dye in RPMI. Error bars represent standard deviation. *Statistically different from the respective
control, 0 μM (P <0.05).
As shown in Figure 7A, for both cell concentrations used, there were no significant
differences in the number of viable cells (P >0.05) after treatment with different FSc
concentrations and they were similar to the negative control (absence of the agent). Likewise,
Figure 7B shows that the presence of FSd dye in the concentrations of 10 to 25 μM in both cell
concentrations and the 50 μM concentration in the highest suspension did not cause significant
changes in the number of viable cells, when compared to the respective negative control.
0
2
4
6
8
10
0 10 12,5 15 25 50 100
Log
(C
FU
ml-1
)
FSc Concentration (μM)
0
2
4
6
8
10
0 10 12,5 15 25 50 100
Log
(C
FU
ml-1
)
FSd Concentration (μM)
* * *
A B
1x10⁸ cells ml-1
1x10⁷ cells ml-1
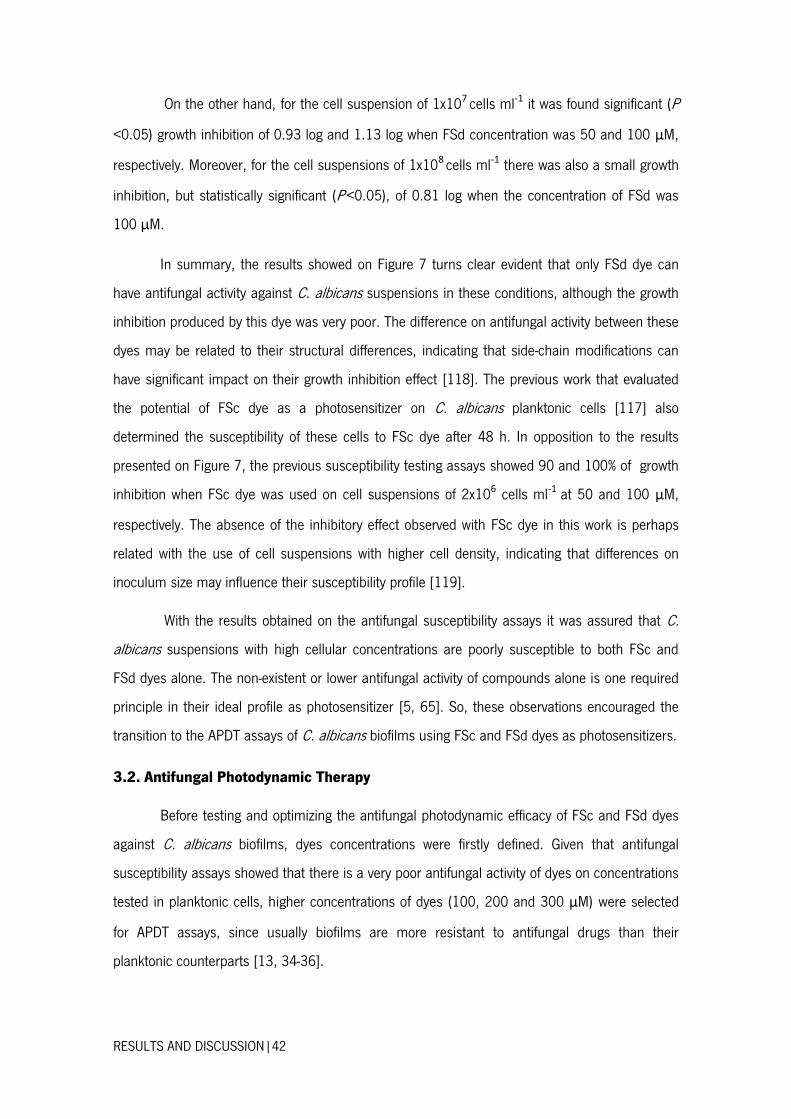
RESULTS AND DISCUSSION|42
On the other hand, for the cell suspension of 1x10⁷ cells ml-1 it was found significant (P
<0.05) growth inhibition of 0.93 log and 1.13 log when FSd concentration was 50 and 100 μM,
respectively. Moreover, for the cell suspensions of 1x10⁸ cells ml-1 there was also a small growth
inhibition, but statistically significant (P <0.05), of 0.81 log when the concentration of FSd was
100 μM.
In summary, the results showed on Figure 7 turns clear evident that only FSd dye can
have antifungal activity against C. albicans suspensions in these conditions, although the growth
inhibition produced by this dye was very poor. The difference on antifungal activity between these
dyes may be related to their structural differences, indicating that side-chain modifications can
have significant impact on their growth inhibition effect [118]. The previous work that evaluated
the potential of FSc dye as a photosensitizer on C. albicans planktonic cells [117] also
determined the susceptibility of these cells to FSc dye after 48 h. In opposition to the results
presented on Figure 7, the previous susceptibility testing assays showed 90 and 100% of growth
inhibition when FSc dye was used on cell suspensions of 2x10⁶ cells ml-1 at 50 and 100 μM,
respectively. The absence of the inhibitory effect observed with FSc dye in this work is perhaps
related with the use of cell suspensions with higher cell density, indicating that differences on
inoculum size may influence their susceptibility profile [119].
With the results obtained on the antifungal susceptibility assays it was assured that C.
albicans suspensions with high cellular concentrations are poorly susceptible to both FSc and
FSd dyes alone. The non-existent or lower antifungal activity of compounds alone is one required
principle in their ideal profile as photosensitizer [5, 65]. So, these observations encouraged the
transition to the APDT assays of C. albicans biofilms using FSc and FSd dyes as photosensitizers.
3.2. Antifungal Photodynamic Therapy
Before testing and optimizing the antifungal photodynamic efficacy of FSc and FSd dyes
against C. albicans biofilms, dyes concentrations were firstly defined. Given that antifungal
susceptibility assays showed that there is a very poor antifungal activity of dyes on concentrations
tested in planktonic cells, higher concentrations of dyes (100, 200 and 300 μM) were selected
for APDT assays, since usually biofilms are more resistant to antifungal drugs than their
planktonic counterparts [13, 34-36].
RESULTS AND DISCUSSION|43
The dark toxicity of these dyes on C. albicans biofilms using the set of concentrations
mentioned above was firstly determined using a dark incubation period of 3 h with the intent to
assess their dye alone effect using such incubation conditions. Figure 8 shows the resultant dark
toxicity of both dyes on C. albicans biofilms.
Figure 8. Logarithm of number of C. albicans ATCC 90028 biofilm cells per cm2 after 3 h of dark
incubation with FSc (A) and FSd (B) dye at different concentrations in PBS. Error bars represent standard deviation. *Statistically different from the control, 0 μM (P <0.05).
As shown in Figure 8, dyes concentration of 100 and 200 μM showed no inactivation
effect (P >0.05) of C. albicans biofilms. On the other hand, it was observed a little inactivation (P
<0.05) of these biofilms when FSc and FSd dyes were used at 300 μM, been the killing effect at
this concentration 0.62 log and 0.40 log, respectively. Indeed, it is clearly evident that dark
toxicity of both dyes against C. albicans biofilms was very low at the conditions used. Given the
clinical use of APDT ideally requires photosensitizers without dark activity, this set of dark
incubation conditions could be ideal for APDT of C. albicans biofilms if it was achieved great
levels of cell inactivation upon irradiation [5, 65]. So, such dark incubation conditions were then
used in the first APDT assays of both dyes. On APDT assays, after dark incubation with dyes,
biofilms were aseptically illuminated with a xenon arc lamp during 20 and 60 minutes,
corresponding respectively to light fluences of 12 and 36 J cm-2. Two controls: absence of dye
only with light and absence of light, only with dye at different concentrations were also performed
in parallel. The susceptibility of C. albicans biofilms to the photosensitization assays using FSc
and FSd is shown in Figure 9.
0
1
2
3
4
5
6
7
8
0 100 200 300
Log
(C
FU
cm
-2)
FSc Concentration (μM)
0
1
2
3
4
5
6
7
8
0 100 200 300
Log
(C
FU
cm
-2)
FSd Concentration (μM)
* *
A B
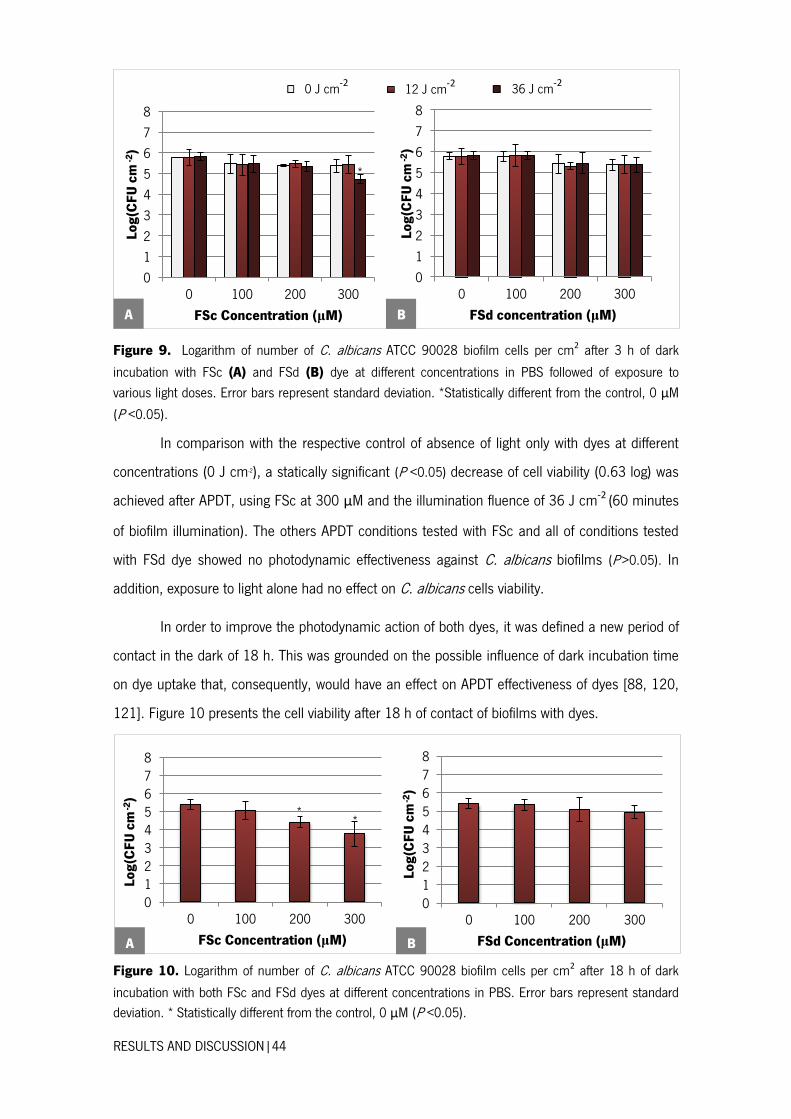
RESULTS AND DISCUSSION|44
Figure 9. Logarithm of number of C. albicans ATCC 90028 biofilm cells per cm2 after 3 h of dark
incubation with FSc (A) and FSd (B) dye at different concentrations in PBS followed of exposure to
various light doses. Error bars represent standard deviation. *Statistically different from the control, 0 μM
(P <0.05).
In comparison with the respective control of absence of light only with dyes at different
concentrations (0 J cm-2), a statically significant (P <0.05) decrease of cell viability (0.63 log) was
achieved after APDT, using FSc at 300 μM and the illumination fluence of 36 J cm-2 (60 minutes
of biofilm illumination). The others APDT conditions tested with FSc and all of conditions tested
with FSd dye showed no photodynamic effectiveness against C. albicans biofilms (P >0.05). In
addition, exposure to light alone had no effect on C. albicans cells viability.
In order to improve the photodynamic action of both dyes, it was defined a new period of
contact in the dark of 18 h. This was grounded on the possible influence of dark incubation time
on dye uptake that, consequently, would have an effect on APDT effectiveness of dyes [88, 120,
121]. Figure 10 presents the cell viability after 18 h of contact of biofilms with dyes.
Figure 10. Logarithm of number of C. albicans ATCC 90028 biofilm cells per cm2 after 18 h of dark
incubation with both FSc and FSd dyes at different concentrations in PBS. Error bars represent standard
deviation. * Statistically different from the control, 0 μM (P <0.05).
0
1
2
3
4
5
6
7
8
0 100 200 300
Log
(CF
U c
m -2
)
FSc Concentration (μM)
0
1
2
3
4
5
6
7
8
0 100 200 300
Log
(CF
U c
m -2
)
FSd concentration (μM)
012345678
0 100 200 300
Log
(CF
U c
m -2
)
FSc Concentration (μM)
0
12
3
45
67
8
0 100 200 300
Log
(CF
U c
m -2
)
FSd Concentration (μM)
* *
*
A B
A B
0 J cm-2
12 J cm-2
36 J cm-2
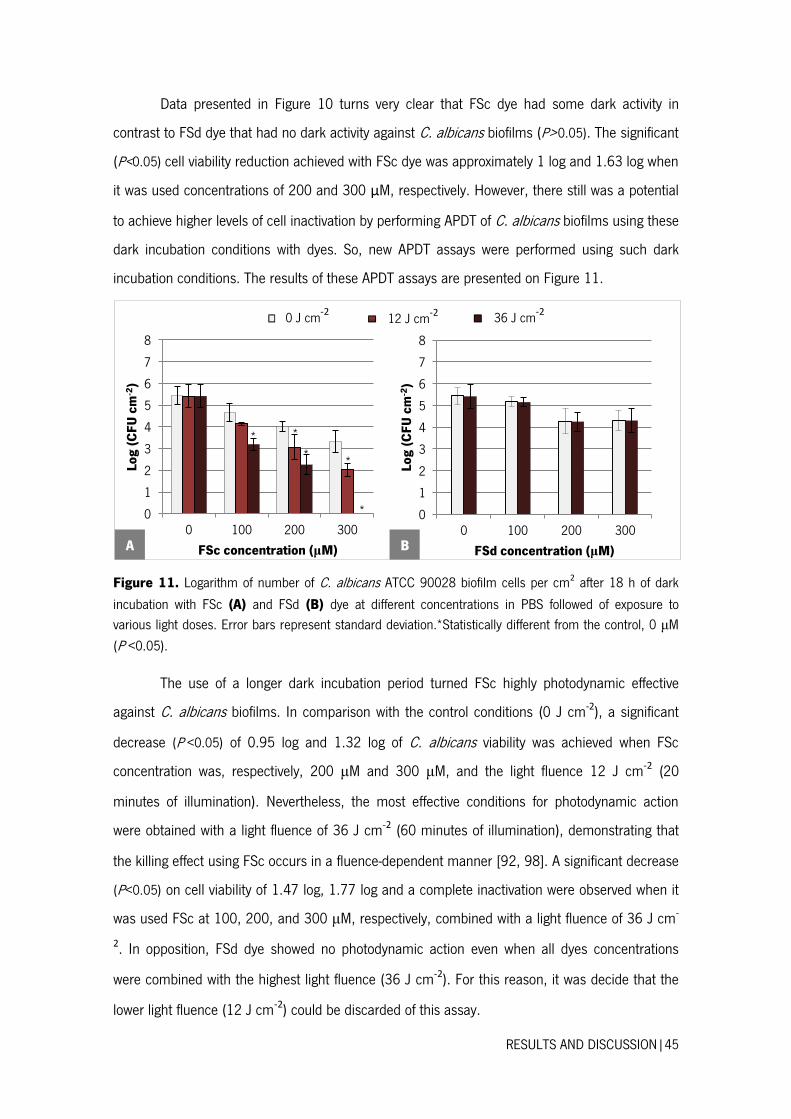
RESULTS AND DISCUSSION|45
Data presented in Figure 10 turns very clear that FSc dye had some dark activity in
contrast to FSd dye that had no dark activity against C. albicans biofilms (P > 0.05). The significant
(P< 0.05) cell viability reduction achieved with FSc dye was approximately 1 log and 1.63 log when
it was used concentrations of 200 and 300 μM, respectively. However, there still was a potential
to achieve higher levels of cell inactivation by performing APDT of C. albicans biofilms using these
dark incubation conditions with dyes. So, new APDT assays were performed using such dark
incubation conditions. The results of these APDT assays are presented on Figure 11.
Figure 11. Logarithm of number of C. albicans ATCC 90028 biofilm cells per cm2 after 18 h of dark
incubation with FSc (A) and FSd (B) dye at different concentrations in PBS followed of exposure to
various light doses. Error bars represent standard deviation.*Statistically different from the control, 0 μM
(P <0.05).
The use of a longer dark incubation period turned FSc highly photodynamic effective
against C. albicans biofilms. In comparison with the control conditions (0 J cm-2), a significant
decrease (P <0.05) of 0.95 log and 1.32 log of C. albicans viability was achieved when FSc
concentration was, respectively, 200 μM and 300 μM, and the light fluence 12 J cm-2 (20
minutes of illumination). Nevertheless, the most effective conditions for photodynamic action
were obtained with a light fluence of 36 J cm-2 (60 minutes of illumination), demonstrating that
the killing effect using FSc occurs in a fluence-dependent manner [92, 98]. A significant decrease
(P <0.05) on cell viability of 1.47 log, 1.77 log and a complete inactivation were observed when it
was used FSc at 100, 200, and 300 μM, respectively, combined with a light fluence of 36 J cm-
2. In opposition, FSd dye showed no photodynamic action even when all dyes concentrations
were combined with the highest light fluence (36 J cm-2). For this reason, it was decide that the
lower light fluence (12 J cm-2) could be discarded of this assay.
0
1
2
3
4
5
6
7
8
0 100 200 300
Log
(C
FU
cm
-2)
FSc concentration (μM)
0
1
2
3
4
5
6
7
8
0 100 200 300
Log
(C
FU
cm
-2)
FSd concentration (μM)
*
*
* *
*
A B
0 J cm-2
12 J cm-2
36 J cm-2

RESULTS AND DISCUSSION|46
The increasing incidence of localized fungal infections combined with the rise of drug-
resistant strains has led to the investigation of new antifungal approaches. Photodynamic therapy
emerged as a promising approach due to the antimicrobial effectiveness against several
microorganisms. Accordingly to Kato et al. [97], APDT treatments may inhibit virulence factors
and reduce in vivo pathogenicity of C. albicans without causing alterations in daughter cells,
suggesting that APDT effects are transitory and strengthening that APDT approach could be
indeed a promising alternative therapy to treat C. albicans infections. In this study it was
achieved an optimal set of APDT conditions that promises a complete inactivation of C. albicans
biofilms. With the benzo[a]phenoxazinium chloride termed FSc at 300 μM (119.25 mg l-1) and
using a dark incubation period of 18 hours followed by illumination with a light fluence of 36 J
cm-2, it could accomplished a complete eradication of C. albicans biofilms. This successfully
achieve indicate that FSc-mediated APDT might be a potential new approach to treat C. albicans
infections.
The susceptibility of fungal species to photodynamic action of several photosensitizing
dyes and lights with appropriate wavelengths has been receiving increased attention in the last
few years. Indeed, a complete eradiation of C. albicans biofilms was previously reported by
Teichert et al. [101] using a murine model. Nevertheless, the authors described the use a higher
dye concentration (450 and 500 mg l-1 of MB) and higher light doses (275 J cm-2). The use of
similar APDT conditions to this study that inactivates C. albicans biofilms was reported by Dovigo
et al. [87]. The study was developed using a commercial porphyrin termed Photogem® at 25
mg l-1 and a blue LED light at 37.5 J cm-2. However, the cell viability reduction achieved was less
than 1 log. In 2006, Foley et al. [103] had described so far the first benzo[a]phenoxazinium
analogue that was highly effective in APDT of C. albicans – a benzo[a]phenoselenazinium dye.
The authors achieved a 99% of cell killing when planktonic cultures of 107 cells ml-1 were
incubated during 10 minutes with this dye at 20 μM and then exposed to a light with only a 4 J
cm-2 of fluence. A comparative study between FSc and the benzo[a]phenoselenazinium dye in the
APDT of C. albicans biofilms, could be an interesting and enriching contribute for the research in
this field.
The previous work performed with FSc dye [117] achieved a 67.1% of cell inactivation
when C. albicans planktonic cultures of 4 x 10⁷ cells ml-1 were incubated during 60 minutes with
the FSc dye at 200 μM and illuminated at 12 J cm-2 of fluence. In this study it was necessary a
RESULTS AND DISCUSSION|47
higher dye concentration, a longer incubation time and a higher illumination fluence to achieve a
significant reduction of cell viability on C. albicans biofilms using FSc as photosensitizing agent.
These differences on APDT conditions are due to the structural differences between planktonic
and biofilm grown-cells [33]. At this respect Donnelly et al. [122] reported an interesting study.
The authors designed a mucoadhesive patch containing 50 or 100 mg cm-2 of TBO with suitable
properties to be used as controlled delivery system in APDT of oropharyngeal candidosis. As a
conclusion of their study, they achieved that short time period of mucoadhesive patches with this
dye could be used to treat recently acquired oropharyngeal candidosis caused by planktonic
cells, but longer application times of the patch or longer illumination periods may be required to
treat infections caused by C. albicans biofilms [122]. These observations lend support to the
notion that higher application times of the photosensitizer or/and longer light illumination periods
are needed when biofilms are implicated.
The susceptibility of C. albicans biofilms to APDT by using a benzo[a]phenoxazinium
chloride, as photosensitizing agent, is an important step in the potential use of this novel
therapeutic strategy to treat fungal infections. Obviously, the issue of selectivity will be an
important one, since healthy human tissues can be susceptible to damage of APDT treatments.
Nevertheless, the potential for topical application of dyes and light application only to affected
sites in mucocutaneous candidosis makes these infections particularly amenable to APDT [92].
Zeina et al. [123, 124] have demonstrated that APDT with MB under conditions that lead to
effective killing of common skin microorganisms, including C. albicans, cause neither cytotoxicity
nor DNA damage to keratinocytes in vitro, supporting the belief that selectivity for the
microorganism may be possible for mucocutaneous candidosis. However, some in vivo data will
always be important.
3.3. Dye Uptake
According to Foley et al. [103], the APDT effectiveness might depends on photochemical
efficiencies of dyes, the degree of dye absorption and cell-dye binding, or both. It is interesting to
note that the crossing of all APDT results using FSc suggests that increasing dye’s concentration
and the time of dark incubation resulted on a higher photodynamic efficacy of the dye. On the
other hand, the APDT results using FSd showed that increasing dye’s concentration or the
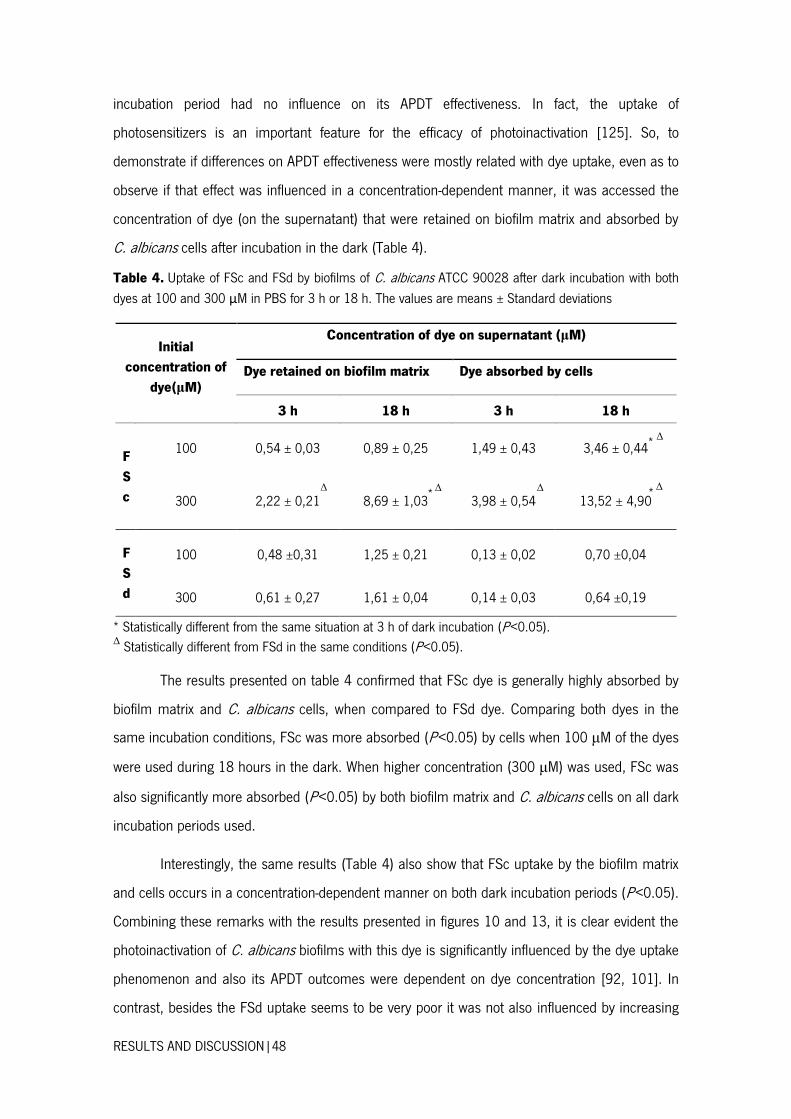
RESULTS AND DISCUSSION|48
incubation period had no influence on its APDT effectiveness. In fact, the uptake of
photosensitizers is an important feature for the efficacy of photoinactivation [125]. So, to
demonstrate if differences on APDT effectiveness were mostly related with dye uptake, even as to
observe if that effect was influenced in a concentration-dependent manner, it was accessed the
concentration of dye (on the supernatant) that were retained on biofilm matrix and absorbed by
C. albicans cells after incubation in the dark (Table 4).
Table 4. Uptake of FSc and FSd by biofilms of C. albicans ATCC 90028 after dark incubation with both
dyes at 100 and 300 μM in PBS for 3 h or 18 h. The values are means ± Standard deviations
Initial
concentration of
dye(μM)
Concentration of dye on supernatant (μM)
Dye retained on biofilm matrix Dye absorbed by cells
3 h 18 h 3 h 18 h
F
S
c
100 0,54 ± 0,03 0,89 ± 0,25 1,49 ± 0,43 3,46 ± 0,44
300 2,22 ± 0,21 8,69 ± 1,03 3,98 ± 0,54 13,52 ± 4,90
F
S
d
100 0,48 ±0,31 1,25 ± 0,21 0,13 ± 0,02 0,70 ±0,04
300 0,61 ± 0,27 1,61 ± 0,04 0,14 ± 0,03 0,64 ±0,19
* Statistically different from the same situation at 3 h of dark incubation (P <0.05). Δ Statistically different from FSd in the same conditions (P <0.05).
The results presented on table 4 confirmed that FSc dye is generally highly absorbed by
biofilm matrix and C. albicans cells, when compared to FSd dye. Comparing both dyes in the
same incubation conditions, FSc was more absorbed (P <0.05) by cells when 100 μM of the dyes
were used during 18 hours in the dark. When higher concentration (300 μM) was used, FSc was
also significantly more absorbed (P <0.05) by both biofilm matrix and C. albicans cells on all dark
incubation periods used.
Interestingly, the same results (Table 4) also show that FSc uptake by the biofilm matrix
and cells occurs in a concentration-dependent manner on both dark incubation periods (P <0.05).
Combining these remarks with the results presented in figures 10 and 13, it is clear evident the
photoinactivation of C. albicans biofilms with this dye is significantly influenced by the dye uptake
phenomenon and also its APDT outcomes were dependent on dye concentration [92, 101]. In
contrast, besides the FSd uptake seems to be very poor it was not also influenced by increasing
* Δ
Δ * Δ
Δ *
Δ
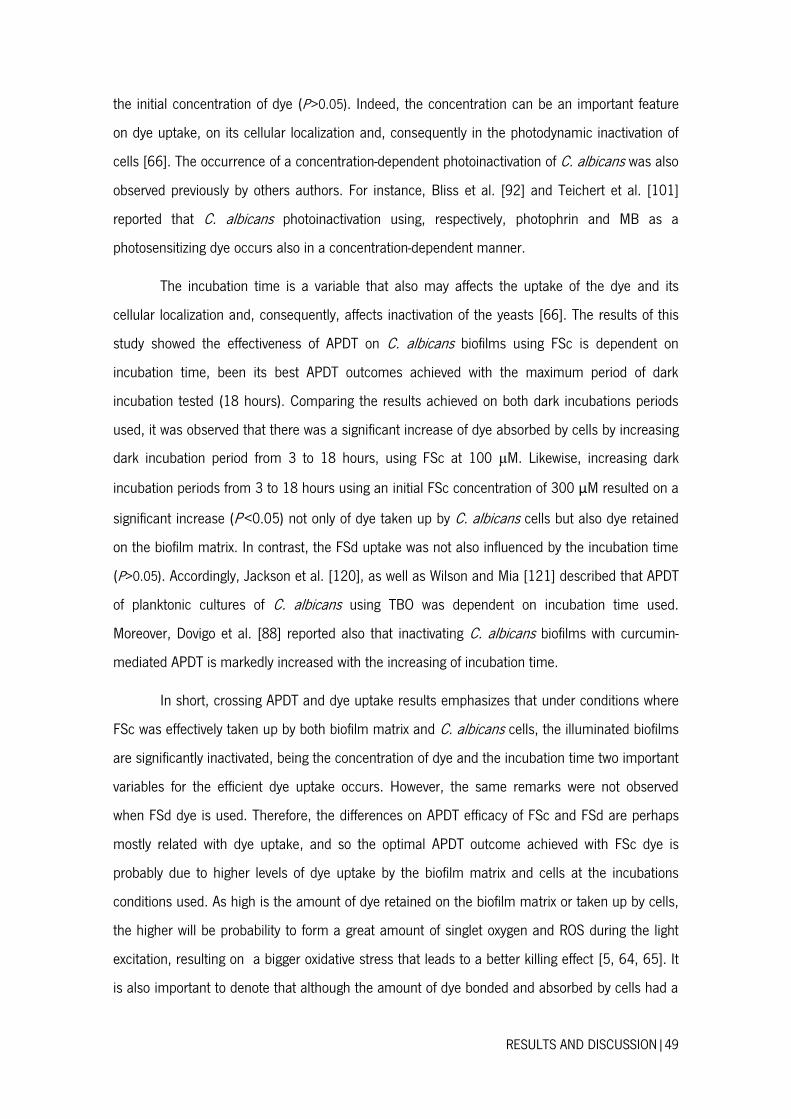
RESULTS AND DISCUSSION|49
the initial concentration of dye (P >0.05). Indeed, the concentration can be an important feature
on dye uptake, on its cellular localization and, consequently in the photodynamic inactivation of
cells [66]. The occurrence of a concentration-dependent photoinactivation of C. albicans was also
observed previously by others authors. For instance, Bliss et al. [92] and Teichert et al. [101]
reported that C. albicans photoinactivation using, respectively, photophrin and MB as a
photosensitizing dye occurs also in a concentration-dependent manner.
The incubation time is a variable that also may affects the uptake of the dye and its
cellular localization and, consequently, affects inactivation of the yeasts [66]. The results of this
study showed the effectiveness of APDT on C. albicans biofilms using FSc is dependent on
incubation time, been its best APDT outcomes achieved with the maximum period of dark
incubation tested (18 hours). Comparing the results achieved on both dark incubations periods
used, it was observed that there was a significant increase of dye absorbed by cells by increasing
dark incubation period from 3 to 18 hours, using FSc at 100 μM. Likewise, increasing dark
incubation periods from 3 to 18 hours using an initial FSc concentration of 300 μM resulted on a
significant increase (P <0.05) not only of dye taken up by C. albicans cells but also dye retained
on the biofilm matrix. In contrast, the FSd uptake was not also influenced by the incubation time
(P >0.05). Accordingly, Jackson et al. [120], as well as Wilson and Mia [121] described that APDT
of planktonic cultures of C. albicans using TBO was dependent on incubation time used.
Moreover, Dovigo et al. [88] reported also that inactivating C. albicans biofilms with curcumin-
mediated APDT is markedly increased with the increasing of incubation time.
In short, crossing APDT and dye uptake results emphasizes that under conditions where
FSc was effectively taken up by both biofilm matrix and C. albicans cells, the illuminated biofilms
are significantly inactivated, being the concentration of dye and the incubation time two important
variables for the efficient dye uptake occurs. However, the same remarks were not observed
when FSd dye is used. Therefore, the differences on APDT efficacy of FSc and FSd are perhaps
mostly related with dye uptake, and so the optimal APDT outcome achieved with FSc dye is
probably due to higher levels of dye uptake by the biofilm matrix and cells at the incubations
conditions used. As high is the amount of dye retained on the biofilm matrix or taken up by cells,
the higher will be probability to form a great amount of singlet oxygen and ROS during the light
excitation, resulting on a bigger oxidative stress that leads to a better killing effect [5, 64, 65]. It
is also important to denote that although the amount of dye bonded and absorbed by cells had a
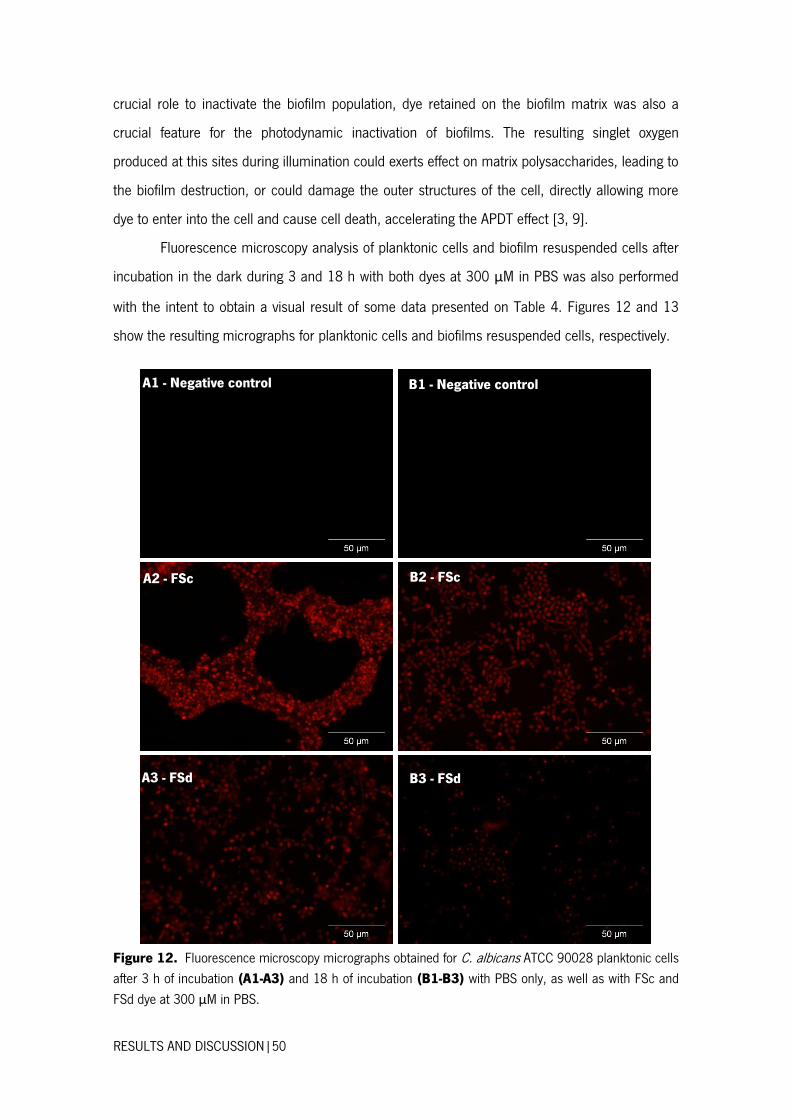
RESULTS AND DISCUSSION|50
crucial role to inactivate the biofilm population, dye retained on the biofilm matrix was also a
crucial feature for the photodynamic inactivation of biofilms. The resulting singlet oxygen
produced at this sites during illumination could exerts effect on matrix polysaccharides, leading to
the biofilm destruction, or could damage the outer structures of the cell, directly allowing more
dye to enter into the cell and cause cell death, accelerating the APDT effect [3, 9].
Fluorescence microscopy analysis of planktonic cells and biofilm resuspended cells after
incubation in the dark during 3 and 18 h with both dyes at 300 μM in PBS was also performed
with the intent to obtain a visual result of some data presented on Table 4. Figures 12 and 13
show the resulting micrographs for planktonic cells and biofilms resuspended cells, respectively.
Figure 12. Fluorescence microscopy micrographs obtained for C. albicans ATCC 90028 planktonic cells
after 3 h of incubation (A1-A3) and 18 h of incubation (B1-B3) with PBS only, as well as with FSc and
FSd dye at 300 μM in PBS.
A1 - Negative control B1 - Negative control
A2 - FSc B2 - FSc
A3 - FSd B3 - FSd
RESULTS AND DISCUSSION|51
Figure 13. Fluorescence microscopy micrographs obtained for C. albicans ATCC 90028 biofilm
resuspended cells after 3 h of dark incubation (A1-A3) and 18 h of dark incubation (B1-B3) with PBS
only, as well as with FSc and FSd dye at 300 μM in PBS.
It was possible to observe that on both situations, particularly on biofilm resuspended
cells, the dark incubation with FSc resulted on higher levels of cell fluorescence, suggesting the
levels of uptake of FSc was much higher than FSd dye. This qualitative analysis is in accordance
with the results presented on Table 4. However, it is important to highlight that FSc and FSd have
different absolute fluorescence quantum yields (Table 3), which are likely to result in some
differences of fluorescence intensity observed.
Interestingly, it is also well clear on both figures that increasing the dark incubation
period do not resulted on higher levels of fluorescence, as it was expected. Instead, it seems to
influence the formation of little points of fluorescence, suggesting dye concentration at some cell
A1 - Negative control B1 - Negative control
A2 - FSc B2 -FSc
A3 - FSd B3 - FSd
RESULTS AND DISCUSSION|52
clusters. However, further investigations are required to confirm this observation. In fact, as it
was mentioned previously, dyes can cross over the plasma membrane, especially after prolonged
incubation periods, and take different subcellular localizations, such as mitochondria, nucleus,
vacuoles or Golgi apparatus, as well as in endoplasmic reticulum [66]. Upon illumination, the
ROS produced at these sites can cause damage to these constituents, inactivating some proteins
and enzymes, oxidizing nucleic acids and peroxidizing lipids of the surface membrane, leading to
the loss of cell viability [9, 72].
The higher cell fluorescence when FSd was incubated with planktonic cells, instead
biofilms, was also remarkable. Figure 16 shows when there is no presence of biofilm matrix, FSd
dye can do a larger binding to C. albicans cells, indicating that much of the small amount of dye
absorbed by biofilms stays perhaps retained in the biofilm matrix.
Treatment efficacy could depend on the specificity of the compound to the target.
Typically, specificity to targets could be increased by using macromolecular conjugates [118]. In
this study, it was explored the possibility to enhance specificity of benzo[a]phenoxazinium salts to
C. albicans cells, through small functional groups modifications. The presence of the distinct side
chains on FSc and FSd dyes are presumably the responsible for distinct levels of dye uptake by
C. albicans and, consequently, for the differences on its APDT outcomes. Besides side chain
modifications may have a little effect on photophysical properties of photosensitizers [118], the
presence of a longer side chain on FSd dye are presumably make more difficult its entry and
diffusion throughout the biofilm matrix, impairing the cell-dye binding and dye uptake. Plus, data
presented on Appendix A showed that the absorption peak of FSd dye seems to be shifted 40-70
nm to the left, in relation to the initial absorption peak (616 nm), after incubation with C. albicans
biofilms. This shift is probably related with the formation of aggregates that absorb light at fewer
wavelengths than the wavelength of maximum absorption of the dye [115, 126, 127]. The
formation of dye aggregates is presumably enhancing the barrier effect of the biofilm matrix,
making difficult its penetration in this structure and its arrival to cells, leading to a non-existent
APDT action. Nevertheless, the hypothesis that the presence of a longer side chain on FSd
molecules grants also them a higher affinity to the biofilm matrix components is not also out of
the hypothesis.

4. CHAPTER IVCONCLUSIONS AND
FUTURE PERSPECTIVES


CONCLUSIONS AND FUTURE PERSPECTIVES |55
The interest on APDT approach to treat fungal infections has been receiving an increased
attention in our society in the last few years. The increasing of fungal infections due to the
augmented use of indwelling devices and the growth of imunocompromised patients, as well as
the emergence of drug resistant strains are the principal reasons that triggered the interest in a
more effective and localized therapeutic approach to treat these microbiological diseases. Despite
the numerous APDT investigations and the rising development of new photosensitizers that are
photodynamic effective against a several range of pathogens, there is still a need to investigate
and explore the potential of APDT approach to treat fungal infections, especially when originated
by biofilms. With the intent to fill this gap of knowledge, this project aimed to evaluate and
optimize the photodynamic antifungal activity of two new benzo[a]phenoxazinium chlorides (FSc
and FSd) against C. albicans biofilms.
Regarding to the antifungal susceptibility testing of dyes, FSd dye showed to have a very
small dark activity against C. albicans planktonic cells when used at 50 and 100 μM, while FSc
dye showed no dark activity on all conditions tested. In relation to the antifungal photodynamic
action, only FSc dye showed a photodynamic killing effect against C. albicans biofilms, been
achieved a complete cell inactivation using FSc dye at 300 μM in contact with C. albicans
biofilms during 18 h, followed by light exposition (600 ± 2 nm) with a fluence of 36 J cm-2. The
interest on benzo[a]phenoxazinium chlorides as photosensitizers agents to treat C. albicans
infections by APDT grows with these results, because FSc dye showed to have an optimal
photosensitizing activity in the APDT of C. albicans biofilms. However, it was also important to
understand the uneven APDT outcomes achieved, so another important part of this study
addressed the investigation of a potential correlation between dye uptake and APDT effectiveness
of dyes by spectrofluorimetric analysis and fluorescence microscopy.
As a conclusion of this second part of the study, it was possible to observe that the
differences in efficacy of FSc dye over FSd and the increasing of its effectiveness with
incubation time are due to a higher dye uptake by the biofilm matrix and cells.
In conclusion, this study permitted to increase and to expand the knowledge about the
APDT action of benzo[a]phenoxazinium chlorides on C. albicans biofilms towards new
perspectives, since their APDT action on biofilms has remained unknown.

CONCLUSIONS AND FUTURE PERSPECTIVES |56
As future work, it would be interesting to determine the exactly intracellular localization of
the FSc dye after the dark incubation period, in order to understand its mechanism of action. The
execution of confocal microscopy analysis of biofilms incubated for long times with FSc dye may
bring some important visual information about the intracellular localization of dye taken up by
cells. Additionally, to determine the molecular mechanisms that lead to cell necrosis or
apoptosis would be also an advance towards the knowledge about APDT action of these
benzo[a]phenoxazinium chlorides.
The use of a target delivery of photosensitizers to cells is increasing and has been shown
to be very promising in the APDT field. Thus, to explore the potential integration of FSc dye into
nanoparticles that may be also combined with specific antibodies for the target could be an
interesting approach that should be investigated. Likewise, the synergic effects of FSc-mediated
APDT with compounds that create pores within the fungal membrane and increase the cellular
uptake, such as amphotericin B and nystatin, may be an interesting approach that may also be
explored on further investigations in this field. Nonetheless, additional information about the
possible development of cellular resistance to FSc-mediated APDT treatments as well as to the
combination of APDT with the strategies mentioned above should be also considered on
subsequent investigations.
Given the high clinical relevance of fungal biofilms and the potential clinical application of
APDT to treat candidosis, there is a substantial need to provide a deep understanding about the
implications of these treatments in humans. Thus, it would be also important to evaluate the
potential cytotoxic effects on mammalian cells arising from the incubation with the
benzo[a]phenoxazinium chloride FSc during 18 h, as well as from the posterior combination with
the light.
In real life, almost all localized infections are caused by polymicrobial biofilms, especially
when a HIV-infected patient is involved. Therefore, to evaluate the effects of FSc-mediated APDT
on the viability of mixed biofilms formed by pathogenic microorganisms, such as C. albicans,
Staphylococcus aureus and Staphylococcus mutans would be very interesting. Plus, in vivo
studies will be also important for the development of this new potential APDT strategy. The
development of these two approaches could help to mimic the real problem of localized
infections and to understand to what extent this new therapeutic strategy could treat efficiently
this type of disease.

CONCLUSIONS AND FUTURE PERSPECTIVES |57
These are some of many perspectives of investigation in the field of APDT. The interest
and the necessity to turn this approach in a real solution to treat superficial infections are
growing and these are the main driving forces under the research in this area.


5. REFERENCES

REFERENCES|61
1. Donnelly, R.F., P.A. McCarron, and M.M. Tunney, Antifungal photodynamic therapy.
Microbiological Research, 2008. 163(1): p. 1-12.
2. Eggimann, P., J. Garbino, and D. Pittet, Epidemiology of Candida species infections in
critically ill non-immunosuppressed patients. The Lancet Infectious Diseases, 2003.
3(11): p. 685-702.
3. Pereira Gonzales, F. and T. Maisch, Photodynamic inactivation for controlling Candida
albicans infections. Fungal Biology, 2012. 116(1): p. 1-10.
4. Sardi, J.C.O., et al., Candida species: current epidemiology, pathogenicity, biofilm
formation, natural antifungal products and new therapeutic options. Journal of Medical
Microbiology, 2013. 62(Pt 1): p. 10-24.
5. Calzavara-Pinton, P.G., M. Venturini, and R. Sala, A comprehensive overview of
photodynamic therapy in the treatment of superficial fungal infections of the skin. Journal
of Photochemistry and Photobiology B: Biology, 2005. 78(1): p. 1-6.
6. Maisch, T., Anti-microbial photodynamic therapy: useful in the future? Lasers in Medical
Science, 2007. 22(2): p. 83-91.
7. Mima, E.G.d.O., et al., Susceptibility of Candida albicans to photodynamic therapy in a
murine model of oral candidosis. Oral Surgery, Oral Medicine, Oral Pathology, Oral
Radiology, and Endodontology, 2010. 109(3): p. 392-401.
8. Pereira, C., et al., Susceptibility of Candida albicans, Staphylococcus aureus , and
Streptococcus mutans biofilms to photodynamic inactivation: an in vitro study. Lasers in
Medical Science, 2011. 26(3): p. 341-348.
9. Wainwright, M. and K.B. Crossley, Photosensitising agents—circumventing resistance and
breaking down biofilms: a review. International Biodeterioration & Biodegradation,
2004. 53(2): p. 119-126.
10. Wilson, B.C. and M.S. Patterson, The physics, biophysics and technology of
photodynamic therapy. Physics in Medicine and Biology, 2008. 53(9): p. R61.
11. Calderone, R.A. and W.A. Fonzi, Virulence factors of Candida albicans. Trends in
Microbiology, 2001. 9(7): p. 327-335.
12. Calderone, R.A. and P.C. Braun, Adherence and receptor relationships of Candida
albicans. Microbiological Reviews, 1991. 55(1): p. 1-20.
13. Ramage, G., et al., Fungal Biofilm Resistance. International Journal of Microbiology,
2012. 2012.

REFERENCES|62
14. Jori, G., et al., Photodynamic therapy in the treatment of microbial infections: Basic
principles and perspective applications. Lasers in Surgery and Medicine, 2006. 38(5): p.
468-481.
15. Lewis, L.E., et al., Stage specific assessment of Candida albicans phagocytosis by
macrophages identifies cell wall composition and morphogenesis as key determinants.
PLoS Pathog, 2012. 8(3): p. e1002578.
16. Franklin, T.J. and G.A. Snow, Vulnerable shields—the cell walls of bacteria and fungi, in
Biochemistry and Molecular Biology of Antimicrobial Drug Action2005, Springer US. p.
17-45.
17. Chaffin, W.L., et al., Cell Wall and Secreted Proteins ofCandida albicans: Identification,
Function, and Expression. Microbiology and Molecular Biology Reviews, 1998. 62(1): p.
130-180.
18. Masuoka, J., Surface Glycans of Candida albicans and Other Pathogenic Fungi:
Physiological Roles, Clinical Uses, and Experimental Challenges. Clin Microbiol Rev,
2004. 17(2): p. 281-310.
19. Verstrepen, K.J. and F.M. Klis, Flocculation, adhesion and biofilm formation in yeasts.
Mol Microbiol, 2006. 60(1): p. 5-15.
20. Kang, S. and H. Choi, Effect of surface hydrophobicity on the adhesion of S. cerevisiae
onto modified surfaces by poly(styrene-ran-sulfonic acid) random copolymers. Colloids
Surf B Biointerfaces, 2005. 46(2): p. 70-7.
21. Klotz, S.A., et al., Degenerate peptide recognition by Candida albicans adhesins Als5p
and Als1p. Infect Immun, 2004. 72(4): p. 2029-34.
22. Kumamoto, C.A., A contact-activated kinase signals Candida albicans invasive growth
and biofilm development. Proc Natl Acad Sci U S A, 2005. 102(15): p. 5576-81.
23. Verstrepen, K.J., et al., Intragenic tandem repeats generate functional variability. Nat
Genet, 2005. 37(9): p. 986-90.
24. Schaller, M., et al., Hydrolytic enzymes as virulence factors of Candida albicans.
Mycoses, 2005. 48(6): p. 365-377.
25. Beausejour, A., et al., Proteolytic activation of the interleukin-1beta precursor by Candida
albicans. Infect Immun, 1998. 66(2): p. 676-81.
REFERENCES|63
26. Samaranayake, Y.H., et al., Differential phospholipase gene expression by Candida
albicans in artificial media and cultured human oral epithelium. APMIS, 2006. 114(12):
p. 857-66.
27. Jayatilake, J.A., Y.H. Samaranayake, and L.P. Samaranayake, An ultrastructural and a
cytochemical study of candidal invasion of reconstituted human oral epithelium. J Oral
Pathol Med, 2005. 34(4): p. 240-6.
28. Stehr, F., et al., Expression analysis of the Candida albicans lipase gene family during
experimental infections and in patient samples. FEMS Yeast Res, 2004. 4(4-5): p. 401-8.
29. Gacser, A., et al., Targeted gene deletion in Candida parapsilosis demonstrates the role
of secreted lipase in virulence. J Clin Invest, 2007. 117(10): p. 3049-58.
30. Manns, J.M., D.M. Mosser, and H.R. Buckley, Production of a hemolytic factor by
Candida albicans. Infect Immun, 1994. 62(11): p. 5154-6.
31. Kumamoto, C.A. and M.D. Vinces, Contributions of hyphae and hypha-co-regulated
genes to Candida albicans virulence. Cellular Microbiology, 2005. 7(11): p. 1546-1554.
32. Douglas, L.J., Medical importance of biofilms in Candida infections. Rev Iberoam Micol,
2002. 19(3): p. 139-43.
33. Chandra, J., et al., Biofilm formation by the fungal pathogen Candida albicans:
development, architecture, and drug resistance. J Bacteriol, 2001. 183(18): p. 5385-
94.
34. Douglas, L.J., Candida biofilms and their role in infection. Trends in Microbiology, 2003.
11(1): p. 30-36.
35. Donlan, R.M. and J.W. Costerton, Biofilms: survival mechanisms of clinically relevant
microorganisms. Clin Microbiol Rev, 2002. 15(2): p. 167-93.
36. Al-Fattani, M.A. and L.J. Douglas, Penetration of Candida Biofilms by Antifungal Agents.
Antimicrobial Agents and Chemotherapy, 2004. 48(9): p. 3291-3297.
37. Ramage, G., et al., Candida biofilms: an update. Eukaryot Cell, 2005. 4(4): p. 633-8.
38. Niimi, M., N.A. Firth, and R.D. Cannon, Antifungal drug resistance of oral fungi.
Odontology, 2010. 98(1): p. 15-25.
39. Baillie, G.S. and L.J. Douglas, Effect of Growth Rate on Resistance ofCandida albicans
Biofilms to Antifungal Agents. Antimicrobial Agents and Chemotherapy, 1998. 42(8): p.
1900-1905.
REFERENCES|64
40. Cannon, R.D., et al., Candida albicans drug resistance another way to cope with stress.
Microbiology, 2007. 153(Pt 10): p. 3211-7.
41. Mah, T.-F.C. and G.A. O'Toole, Mechanisms of biofilm resistance to antimicrobial agents.
Trends in Microbiology, 2001. 9(1): p. 34-39.
42. Sanglard, D., et al., Calcineurin A of Candida albicans: involvement in antifungal
tolerance, cell morphogenesis and virulence. Mol Microbiol, 2003. 48(4): p. 959-76.
43. Uppuluri, P., et al., Synergistic effect of calcineurin inhibitors and fluconazole against
Candida albicans biofilms. Antimicrob Agents Chemother, 2008. 52(3): p. 1127-32.
44. Cowen, L.E. and S. Lindquist, Hsp90 potentiates the rapid evolution of new traits: drug
resistance in diverse fungi. Science, 2005. 309(5744): p. 2185-9.
45. Mukherjee, P.K., et al., Mechanism of fluconazole resistance in Candida albicans
biofilms: phase-specific role of efflux pumps and membrane sterols. Infect Immun, 2003.
71(8): p. 4333-40.
46. Hornby, J.M., et al., Quorum sensing in the dimorphic fungus Candida albicans is
mediated by farnesol. Appl Environ Microbiol, 2001. 67(7): p. 2982-92.
47. Ramage, G., et al., Investigation of multidrug efflux pumps in relation to fluconazole
resistance in Candida albicans biofilms. J Antimicrob Chemother, 2002. 49(6): p. 973-
80.
48. Ramage, G., et al., Our current understanding of fungal biofilms. Crit Rev Microbiol,
2009. 35(4): p. 340-55.
49. Nett, J.E., et al., Genetic basis of Candida biofilm resistance due to drug-sequestering
matrix glucan. J Infect Dis, 2010. 202(1): p. 171-5.
50. Nobile, C.J., et al., Biofilm matrix regulation by Candida albicans Zap1. PLoS Biol, 2009.
7(6): p. e1000133.
51. Anderson, J.B., Evolution of antifungal-drug resistance: mechanisms and pathogen
fitness. Nat Rev Microbiol, 2005. 3(7): p. 547-56.
52. García-Sánchez, S., et al., Candida albicans Biofilms: a Developmental State Associated
With Specific and Stable Gene Expression Patterns. Eukaryotic Cell, 2004. 3(2): p. 536-
545.
53. Albertson, G.D., et al., Multiple efflux mechanisms are involved in Candida albicans
fluconazole resistance. Antimicrob Agents Chemother, 1996. 40(12): p. 2835-41.
REFERENCES|65
54. Piddock, L.J., Multidrug-resistance efflux pumps - not just for resistance. Nat Rev
Microbiol, 2006. 4(8): p. 629-36.
55. Akins, R.A., An update on antifungal targets and mechanisms of resistance in Candida
albicans. Med Mycol, 2005. 43(4): p. 285-318.
56. Wang, H., et al., Rapid detection of ERG11 gene mutations in clinical Candida albicans
isolates with reduced susceptibility to fluconazole by rolling circle amplification and DNA
sequencing. BMC Microbiol, 2009. 9: p. 167.
57. Lewis, K., Riddle of Biofilm Resistance. Antimicrobial Agents and Chemotherapy, 2001.
45(4): p. 999-1007.
58. Lewis, K., Persister cells. Annu Rev Microbiol, 2010. 64: p. 357-72.
59. LaFleur, M.D., C.A. Kumamoto, and K. Lewis, Candida albicans Biofilms Produce
Antifungal-Tolerant Persister Cells. Antimicrobial Agents and Chemotherapy, 2006.
50(11): p. 3839-3846.
60. Zhu, T.C. and J.C. Finlay, The role of photodynamic therapy (PDT) physics. Med Phys,
2008. 35(7): p. 3127-36.
61. Lee, Y. and E.D. Baron, Photodynamic Therapy: Current Evidence and Applications in
Dermatology. Seminars in Cutaneous Medicine and Surgery, 2011. 30(4): p. 199-209.
62. Dai, T., et al., Concepts and principles of photodynamic therapy as an alternative
antifungal discovery platform. Front Microbiol, 2012. 3: p. 120.
63. St. Denis, T.G., et al., Analysis of the Bacterial Heat Shock Response to Photodynamic
Therapy-mediated Oxidative Stress. Photochemistry and Photobiology, 2011. 87(3): p.
707-713.
64. Yano, S., et al., Current states and future views in photodynamic therapy. Journal of
Photochemistry and Photobiology C: Photochemistry Reviews, 2011. 12(1): p. 46-67.
65. Nyman, E.S. and P.H. Hynninen, Research advances in the use of tetrapyrrolic
photosensitizers for photodynamic therapy. Journal of Photochemistry and Photobiology
B: Biology, 2004. 73(1–2): p. 1-28.
66. Castano, A.P., T.N. Demidova, and M.R. Hamblin, Mechanisms in photodynamic
therapy: part one—photosensitizers, photochemistry and cellular localization.
Photodiagnosis and Photodynamic Therapy, 2004. 1(4): p. 279-293.
REFERENCES|66
67. Ochsner, M., Photophysical and photobiological processes in the photodynamic therapy
of tumours. Journal of Photochemistry and Photobiology B: Biology, 1997. 39(1): p. 1-
18.
68. Valko, M., H. Morris, and M.T.D. Cronin, Metals, Toxicity and Oxidative Stress. Current
Medicinal Chemistry, 2005. 12(10): p. 1161-1208.
69. Macdonald, I.J. and T.J. Dougherty, Basic principles of photodynamic therapy. Journal of
Porphyrins and Phthalocyanines, 2001. 5(2): p. 105-129.
70. Plaetzer, K., et al., Photophysics and photochemistry of photodynamic therapy:
fundamental aspects. Lasers in Medical Science, 2009. 24(2): p. 259-268.
71. Robertson, C.A., D.H. Evans, and H. Abrahamse, Photodynamic therapy (PDT): A short
review on cellular mechanisms and cancer research applications for PDT. Journal of
Photochemistry and Photobiology B: Biology, 2009. 96(1): p. 1-8.
72. Paardekooper, M., et al., Intracellular Damage In Yeast Cells Caused By Photodynamic
Treatment With Toluidine Blue. Photochemistry and Photobiology, 1995. 61(1): p. 84-
89.
73. Amaral, L., et al., Phenothiazines, Bacterial Efflux Pumps and Targeting the Macrophage
for Enhanced Killing of Intracellular XDRTB. In Vivo, 2010. 24(4): p. 409-424.
74. Bertoloni, G., et al., Photosensitizing activity of hematoporphyrin on Staphylococcus
aureus cells. Biochimica et Biophysica Acta (BBA) - General Subjects, 2000. 1475(2): p.
169-174.
75. Lambrechts, S.A.G., M.C.G. Aalders, and J. Van Marle, Mechanistic Study of the
Photodynamic Inactivation of Candida albicans by a Cationic Porphyrin. Antimicrobial
Agents and Chemotherapy, 2005. 49(5): p. 2026-2034.
76. Valduga, G., et al., Photosensitization of Wild and Mutant Strains ofEscherichia
colibymeso-Tetra (N-methyl-4-pyridyl)porphine. Biochemical and Biophysical Research
Communications, 1999. 256(1): p. 84-88.
77. Kishen, A., et al., Efflux Pump Inhibitor Potentiates Antimicrobial Photodynamic
Inactivation of Enterococcus faecalis Biofilm. Photochemistry and Photobiology, 2010.
86(6): p. 1343-1349.
78. Collins, T., et al., The Effect of a Cationic Porphyrin on <i>Pseudomonas aeruginosa
Biofilms. Current Microbiology, 2010. 61(5): p. 411-416.
REFERENCES|67
79. Casas, A., et al., Mechanisms of Resistance to Photodynamic Therapy. Current Medicinal
Chemistry, 2011. 18(16): p. 2486-2515.
80. Price, M., S.R. Terlecky, and D. Kessel, A role for hydrogen peroxide in the pro-apoptotic
effects of photodynamic therapy. Photochem Photobiol, 2009. 85(6): p. 1491-6.
81. Kim, S.Y., O.J. Kwon, and J.-W. Park, Inactivation of catalase and superoxide dismutase
by singlet oxygen derived from photoactivated dye. Biochimie, 2001. 83(5): p. 437-444.
82. Prates, R.A., et al., Influence of multidrug efflux systems on methylene blue-mediated
photodynamic inactivation of Candida albicans. Journal of Antimicrobial Chemotherapy,
2011. 66(7): p. 1525-1532.
83. Shackley, D.C., et al., Comparison of the cellular molecular stress responses after
treatments used in bladder cancer. BJU International, 2002. 90(9): p. 924-932.
84. Zeina, B., et al., Killing of cutaneous microbial species by photodynamic therapy. British
Journal of Dermatology, 2001. 144(2): p. 274-278.
85. Reddi, E., et al., Photophysical Properties and Antibacterial Activity of Meso-substituted
Cationic Porphyrins. Photochemistry and Photobiology, 2002. 75(5): p. 462-470.
86. Soukos, N.S., et al., Photodynamic effects of toluidine blue on human oral keratinocytes
and fibroblasts and Streptococcus sanguis evaluated in vitro. Lasers in Surgery and
Medicine, 1996. 18(3): p. 253-259.
87. Dovigo, L.N., et al., Fungicidal effect of photodynamic therapy against fluconazole-
resistant Candida albicans and Candida glabrata. Mycoses, 2011. 54(2): p. 123-130.
88. Dovigo, L.N., et al., Investigation of the Photodynamic Effects of Curcumin Against
Candida albicans. Photochemistry and Photobiology, 2011. 87(4): p. 895-903.
89. Dovigo, L.N., et al., Susceptibility of clinical isolates of Candida to photodynamic effects
of curcumin. Lasers in Surgery and Medicine, 2011. 43(9): p. 927-934.
90. Chabrier-Roselló, Y., et al., Inhibition of electron transport chain assembly and function
promotes photodynamic killing of Candida. Journal of Photochemistry and Photobiology
B: Biology, 2010. 99(3): p. 117-125.
91. Chabrier-Roselló, Y., et al., Sensitivity of Candida albicans Germ Tubes and Biofilms to
Photofrin-Mediated Phototoxicity. Antimicrobial Agents and Chemotherapy, 2005.
49(10): p. 4288-4295.
92. Bliss, J.M., et al., Susceptibility of Candida Species to Photodynamic Effects of Photofrin.
Antimicrobial Agents and Chemotherapy, 2004. 48(6): p. 2000-2006.
REFERENCES|68
93. Quiroga, E.D., M.G. Alvarez, and E.N. Durantini, Susceptibility of Candida albicans to
photodynamic action of 5,10,15,20-tetra(4-N-methylpyridyl)porphyrin in different media.
FEMS Immunology & Medical Microbiology, 2010. 60(2): p. 123-131.
94. Lam, M., et al., Photodynamic Therapy with Pc 4 Induces Apoptosis of Candida albicans.
Photochemistry and Photobiology, 2011. 87(4): p. 904-909.
95. Donnelly, R.F., et al., Delivery of Methylene Blue and meso-tetra (N-methyl-4-pyridyl)
porphine tetra tosylate from cross-linked poly(vinyl alcohol) hydrogels: A potential means
of photodynamic therapy of infected wounds. Journal of Photochemistry and
Photobiology B: Biology, 2009. 96(3): p. 223-231.
96. Mitra, S., et al., Effective photosensitization and selectivity In Vivo of Candida Albicans by
meso-tetra (N-methyl-4-pyridyl) porphine tetra tosylate. Lasers in Surgery and Medicine,
2011. 43(4): p. 324-332.
97. Kato, I.T., et al., Antimicrobial Photodynamic Inactivation Inhibits Candida albicans
Virulence Factors and Reduces In Vivo Pathogenicity. Antimicrobial Agents and
Chemotherapy, 2013. 57(1): p. 445-451.
98. Mang, T.S., L. Mikulski, and R.E. Hall, Photodynamic inactivation of normal and
antifungal resistant Candida species. Photodiagnosis Photodyn Ther, 2010. 7(2): p. 98-
105.
99. Soares, B.M., et al., In vitro photodynamic inactivation of Candida spp. growth and
adhesion to buccal epithelial cells. Journal of Photochemistry and Photobiology B:
Biology, 2009. 94(1): p. 65-70.
100. Biel, M.A., et al., Antimicrobial photodynamic therapy treatment of chronic recurrent
sinusitis biofilms. International Forum of Allergy & Rhinology, 2011. 1(5): p. 329-334.
101. Teichert, M.C., et al., Treatment of oral candidiasis with methylene blue-mediated
photodynamic therapy in an immunodeficient murine model. Oral Surg Oral Med Oral
Pathol Oral Radiol Endod, 2002. 93(2): p. 155-60.
102. Wöhrle, D., et al., Photodynamic therapy of cancer: Second and third generations of
photosensitizers. Russian Chemical Bulletin, 1998. 47(5): p. 807-816.
103. Foley, J.W., et al., Synthesis and Properties of Benzo[a]phenoxazinium Chalcogen
Analogues as Novel Broad-Spectrum Antimicrobial Photosensitizers. Journal of Medicinal
Chemistry, 2006. 49(17): p. 5291-5299.

REFERENCES|69
104. Jose, J. and K. Burgess, Benzophenoxazine-based fluorescent dyes for labeling
biomolecules. Tetrahedron, 2006. 62(48): p. 11021-11037.
105. Monfrecola, G., et al., In vitro effect of 5-aminolaevulinic acid plus visible light on Candida
albicans. Photochemical & Photobiological Sciences, 2004. 3(5): p. 419-422.
106. Oriel, S. and Y. Nitzan, Photoinactivation of Candida albicans by Its Own Endogenous
Porphyrins. Current Microbiology, 2010. 60(2): p. 117-123.
107. Lewis, M.R., P.P. Goland, and H.A. Sloviter, The Action of Oxazine Dyes on Tumors in
Mice. Cancer Research, 1949. 9(12): p. 736-740.
108. Coleman, J.J., et al., Characterization of Plant-Derived Saponin Natural Products against
Candida albicans. ACS Chemical Biology, 2010. 5(3): p. 321-332.
109. Mantareva, V., et al., Photodynamic efficacy of water-soluble Si(IV) and Ge(IV)
phthalocyanines towards Candida albicans planktonic and biofilm cultures. European
Journal of Medicinal Chemistry, 2011. 46(9): p. 4430-4440.
110. Khan, S., et al., Gold nanoparticles enhance methylene blue–induced photodynamic
therapy: a novel therapeutic approach to inhibit Candida albicans biofilm. Int J
Nanomedicine, 2012. 7: p. 3245-57.
111. Josefsen, L.B. and R.W. Boyle, Photodynamic therapy: novel third-generation
photosensitizers one step closer? British Journal of Pharmacology, 2008. 154(1): p. 1-3.
112. Jia, Y., H. Joly, and A. Omri, Characterization of the interaction between liposomal
formulations and Pseudomonas aeruginosa. Journal of Liposome Research, 2010.
20(2): p. 134-146.
113. Brancaleon, L. and H. Moseley, Laser and Non-laser Light Sources for Photodynamic
Therapy. Lasers in Medical Science, 2002. 17(3): p. 173-186.
114. Frade, V.H.J., et al., Functionalised benzo[a]phenoxazine dyes as long-wavelength
fluorescent probes for amino acids. Tetrahedron, 2007. 63(7): p. 1654-1663.
115. Alves, C.M.A., et al., Novel DNA fluorescence probes based on N-[5-(11-functionalised-
undecylamino)-9H-benzo[a]phenoxazin-9-ylidene]propan-1-aminium chlorides: synthesis
and photophysical studies. Tetrahedron Letters, 2011. 52(1): p. 112-116.
116. NCCLS, Reference Method for Broth Dilution Antifungal Susceptibility Testing of Yeasts.
Approved Standard-Second Edition. NCCLS document M27-A2, 2002.
REFERENCES|70
117. Pereira, J.P., Aplicação de Novos Antifúngicos do Tipo Benzofenoxazinas no Controlo de
Infecções: Avaliação do Potencial Uso em Fototerapia Dinâmica, in Biological
Engineering Department2009, University of Minho.
118. Verma, S., et al., Antimicrobial Photodynamic Efficacy of Side-chain Functionalized
Benzo[a]phenothiazinium Dyes. Photochemistry and Photobiology, 2009. 85(1): p. 111-
118.
119. Perumal, P., S. Mekala, and W.L. Chaffin, Role for Cell Density in Antifungal Drug
Resistance in Candida albicans Biofilms. Antimicrobial Agents and Chemotherapy, 2007.
51(7): p. 2454-2463.
120. Jackson, Z., et al., Killing of the Yeast and Hyphal Forms of Candida albicans Using a
Light-Activated Antimicrobial Agent. Lasers in Medical Science, 1999. 14(2): p. 150-157.
121. Wilson, M. and N. Mia, Effect of environmental factors on the lethal photosensitization
ofCandida albicans in vitro. Lasers in Medical Science, 1994. 9(2): p. 105-109.
122. Donnelly, R.F., et al., Potential of photodynamic therapy in treatment of fungal infections
of the mouth. Design and characterisation of a mucoadhesive patch containing toluidine
blue O. Journal of Photochemistry and Photobiology B: Biology, 2007. 86(1): p. 59-69.
123. Zeina, B., et al., Antimicrobial photodynamic therapy: assessment of genotoxic effects on
keratinocytes in vitro. Br J Dermatol, 2003. 148(2): p. 229-32.
124. Zeina, B., et al., Cytotoxic effects of antimicrobial photodynamic therapy on keratinocytes
in vitro. Br J Dermatol, 2002. 146(4): p. 568-73.
125. Zheng, B.-Y., et al., Photodynamic inactivation of Candida albicans sensitized by a series
of novel axially di-substituted silicon (IV) phthalocyanines. Dyes and Pigments, 2012(0).
126. Frade, V.H.J., et al., Synthesis and spectral properties of long-wavelength fluorescent
dyes. Journal of Photochemistry and Photobiology A: Chemistry, 2007. 185(2–3): p.
220-230.
127. Rama Raju, B., et al., Novel Nile Blue derivatives as fluorescent probes for DNA. Dyes
and Pigments, 2013. 99(1): p. 220-227.
128. Guilbault, G.G., Practical fluorescence : theory, methods, and techniques1973, New
York: Dekker.

6. APPENDICES

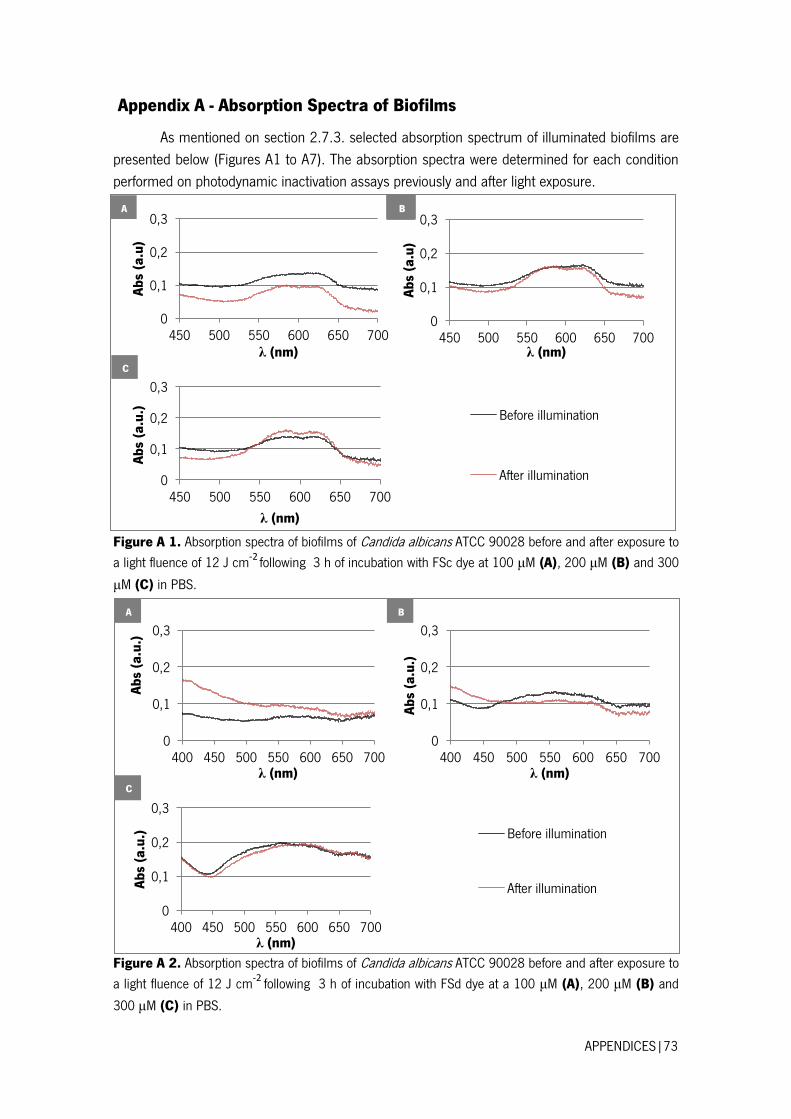
APPENDICES|73
Appendix A - Absorption Spectra of Biofilms
As mentioned on section 2.7.3. selected absorption spectrum of illuminated biofilms are
presented below (Figures A1 to A7). The absorption spectra were determined for each condition
performed on photodynamic inactivation assays previously and after light exposure.
Figure A 1. Absorption spectra of biofilms of Candida albicans ATCC 90028 before and after exposure to
a light fluence of 12 J cm-2 following 3 h of incubation with FSc dye at 100 μM (A), 200 μM (B) and 300
μM (C) in PBS.
Figure A 2. Absorption spectra of biofilms of Candida albicans ATCC 90028 before and after exposure to
a light fluence of 12 J cm-2 following 3 h of incubation with FSd dye at a 100 μM (A), 200 μM (B) and
300 μM (C) in PBS.
0
0,1
0,2
0,3
450 500 550 600 650 700
Ab
s (a
.u)
λ (nm)
0
0,1
0,2
0,3
450 500 550 600 650 700
Ab
s (a
.u)
λ (nm)
0
0,1
0,2
0,3
450 500 550 600 650 700
Ab
s (a
.u.)
λ (nm)
Before illumination
After illumination
0
0,1
0,2
0,3
400 450 500 550 600 650 700
Ab
s (a
.u.)
λ (nm)
0
0,1
0,2
0,3
400 450 500 550 600 650 700
Ab
s (a
.u.)
λ (nm)
0
0,1
0,2
0,3
400 450 500 550 600 650 700
Ab
s (a
.u.)
λ (nm)
Before illumination
After illumination
A
C
B
A
C
B
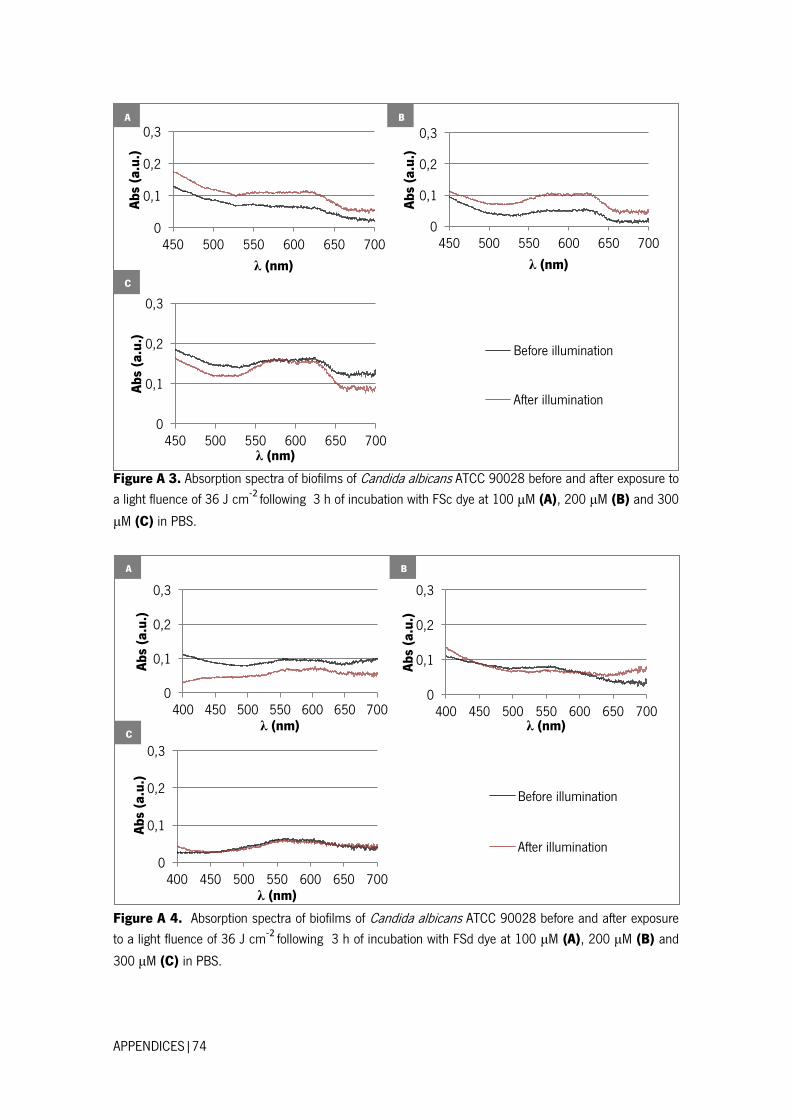
APPENDICES|74
Figure A 3. Absorption spectra of biofilms of Candida albicans ATCC 90028 before and after exposure to
a light fluence of 36 J cm-2 following 3 h of incubation with FSc dye at 100 μM (A), 200 μM (B) and 300
μM (C) in PBS.
Figure A 4. Absorption spectra of biofilms of Candida albicans ATCC 90028 before and after exposure
to a light fluence of 36 J cm-2 following 3 h of incubation with FSd dye at 100 μM (A), 200 μM (B) and
300 μM (C) in PBS.
0
0,1
0,2
0,3
450 500 550 600 650 700
Ab
s (a
.u.)
λ (nm)
0
0,1
0,2
0,3
450 500 550 600 650 700
Ab
s (a
.u.)
λ (nm)
0
0,1
0,2
0,3
450 500 550 600 650 700
Ab
s (a
.u.)
λ (nm)
Before illumination
After illumination
0
0,1
0,2
0,3
400 450 500 550 600 650 700
Ab
s (a
.u.)
λ (nm)
0
0,1
0,2
0,3
400 450 500 550 600 650 700
Ab
s (a
.u.)
λ (nm)
0
0,1
0,2
0,3
400 450 500 550 600 650 700
Ab
s (a
.u.)
λ (nm)
Before illumination
After illumination
A
C
B
A
C
B
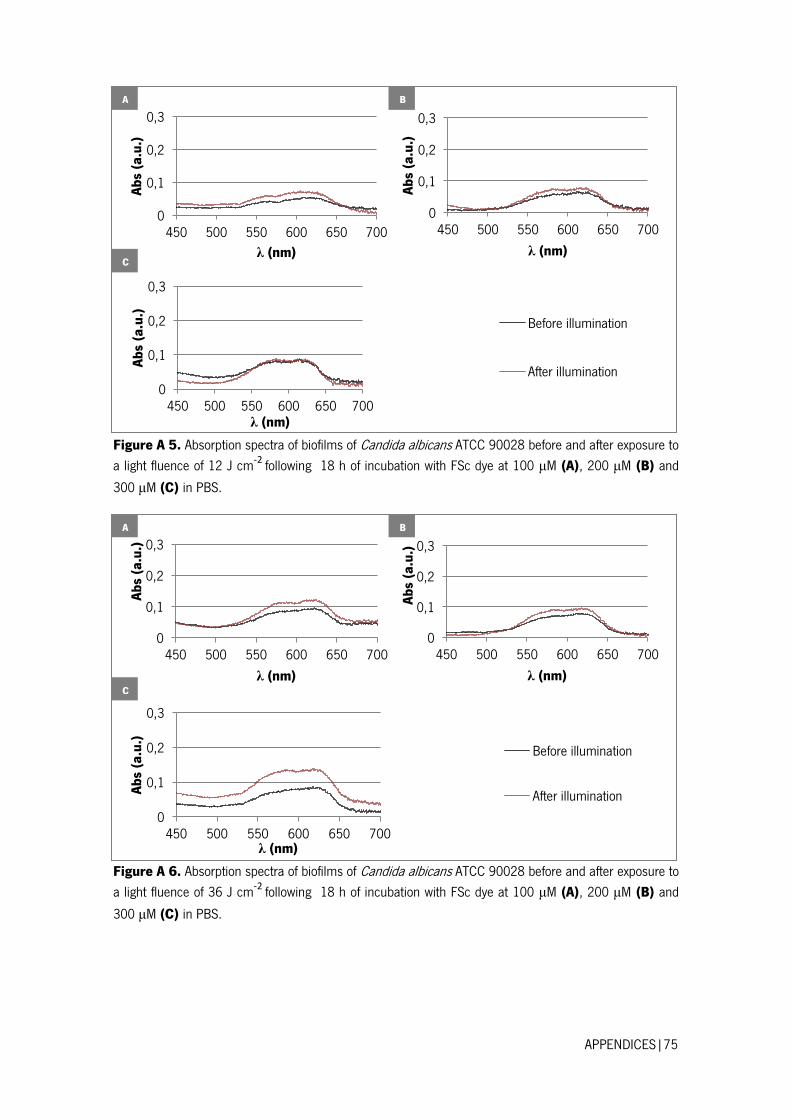
APPENDICES|75
Figure A 5. Absorption spectra of biofilms of Candida albicans ATCC 90028 before and after exposure to
a light fluence of 12 J cm-2 following 18 h of incubation with FSc dye at 100 μM (A), 200 μM (B) and
300 μM (C) in PBS.
Figure A 6. Absorption spectra of biofilms of Candida albicans ATCC 90028 before and after exposure to
a light fluence of 36 J cm-2 following 18 h of incubation with FSc dye at 100 μM (A), 200 μM (B) and
300 μM (C) in PBS.
0
0,1
0,2
0,3
450 500 550 600 650 700
Ab
s (a
.u.)
λ (nm)
0
0,1
0,2
0,3
450 500 550 600 650 700
Ab
s (a
.u.)
λ (nm)
0
0,1
0,2
0,3
450 500 550 600 650 700
Ab
s (a
.u.)
λ (nm)
Before illumination
After illumination
0
0,1
0,2
0,3
450 500 550 600 650 700
Ab
s (a
.u.)
λ (nm)
0
0,1
0,2
0,3
450 500 550 600 650 700
Ab
s (a
.u.)
λ (nm)
0
0,1
0,2
0,3
450 500 550 600 650 700
Ab
s (a
.u.)
λ (nm)
Before illumination
After illumination
A
C
B
A
C
B
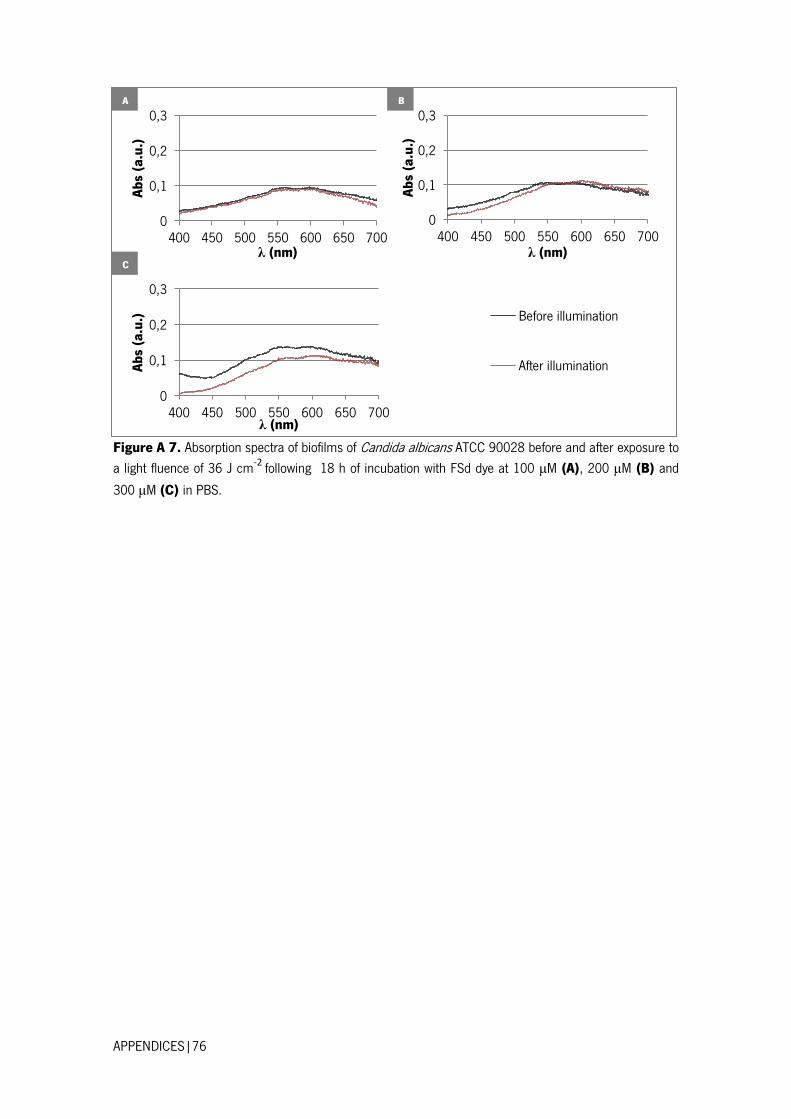
APPENDICES|76
Figure A 7. Absorption spectra of biofilms of Candida albicans ATCC 90028 before and after exposure to
a light fluence of 36 J cm-2 following 18 h of incubation with FSd dye at 100 μM (A), 200 μM (B) and
300 μM (C) in PBS.
0
0,1
0,2
0,3
400 450 500 550 600 650 700
Ab
s (a
.u.)
λ (nm)
0
0,1
0,2
0,3
400 450 500 550 600 650 700
Ab
s (a
.u.)
λ (nm)
0
0,1
0,2
0,3
400 450 500 550 600 650 700
Ab
s (a
.u.)
λ (nm)
Before illumination
After illumination
A
C
B
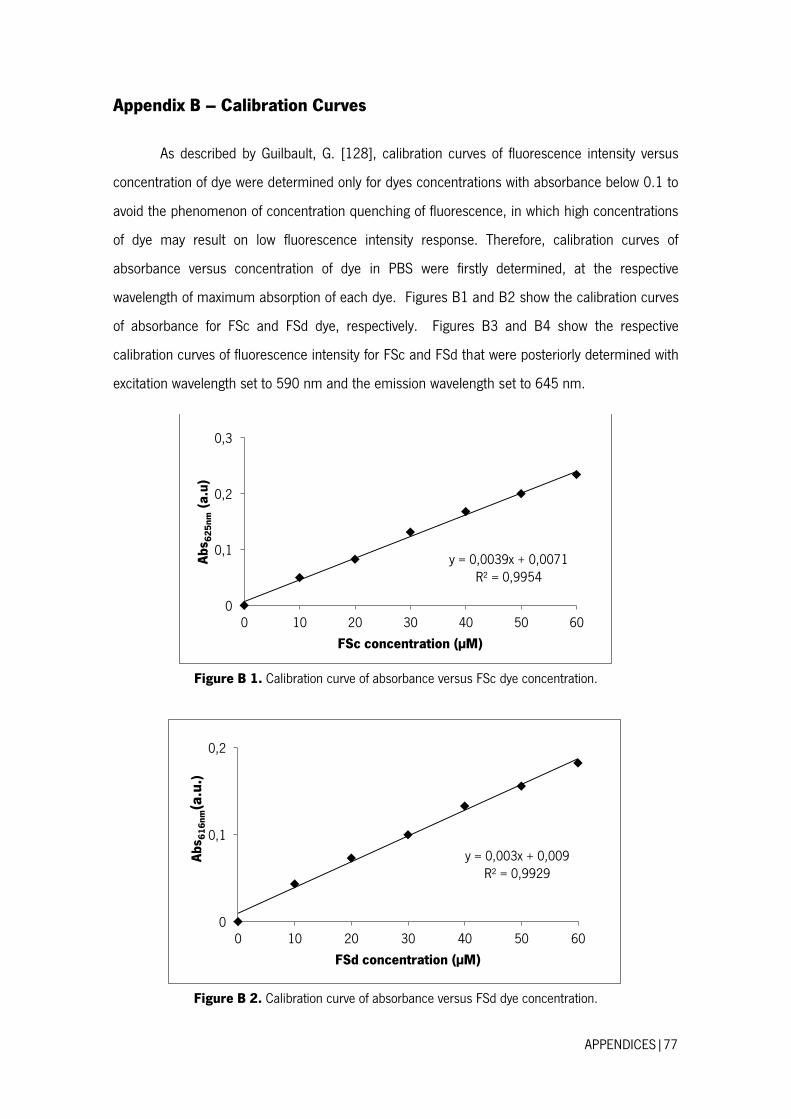
APPENDICES|77
Appendix B – Calibration Curves
As described by Guilbault, G. [128], calibration curves of fluorescence intensity versus
concentration of dye were determined only for dyes concentrations with absorbance below 0.1 to
avoid the phenomenon of concentration quenching of fluorescence, in which high concentrations
of dye may result on low fluorescence intensity response. Therefore, calibration curves of
absorbance versus concentration of dye in PBS were firstly determined, at the respective
wavelength of maximum absorption of each dye. Figures B1 and B2 show the calibration curves
of absorbance for FSc and FSd dye, respectively. Figures B3 and B4 show the respective
calibration curves of fluorescence intensity for FSc and FSd that were posteriorly determined with
excitation wavelength set to 590 nm and the emission wavelength set to 645 nm.
Figure B 1. Calibration curve of absorbance versus FSc dye concentration.
Figure B 2. Calibration curve of absorbance versus FSd dye concentration.
y = 0,0039x + 0,0071 R² = 0,9954
0
0,1
0,2
0,3
0 10 20 30 40 50 60
Ab
s 62
5n
m (
a.u
)
FSc concentration (µM)
y = 0,003x + 0,009 R² = 0,9929
0
0,1
0,2
0 10 20 30 40 50 60
Ab
s 61
6n
m(a
.u.)
FSd concentration (µM)

APPENDICES|78
Figure B 3. Calibration curve of fluorescence intensity versus FSc dye concentration.
Figure B 4. Calibration curve of fluorescence intensity versus FSd dye concentration.
y = 12104x + 237,2 R² = 0,9901
0
20000
40000
60000
80000
100000
120000
0 1 2 3 4 5 6 7 8 9 10
Flu
ore
sce
nce
In
ten
sity
(a
. u
.)
FSc concentration (µM)
y = 5255,7x + 1410 R² = 0,9959
0
10000
20000
30000
40000
50000
60000
0 1 2 3 4 5 6 7 8 9 10
Flu
ore
sce
nce
In
ten
sity
(a
.u.)
FSd Concentration (µM)