Embed Size (px)
Citation preview
1
Carlsberg Breweries
Third Quarter Results7 November 2002
2
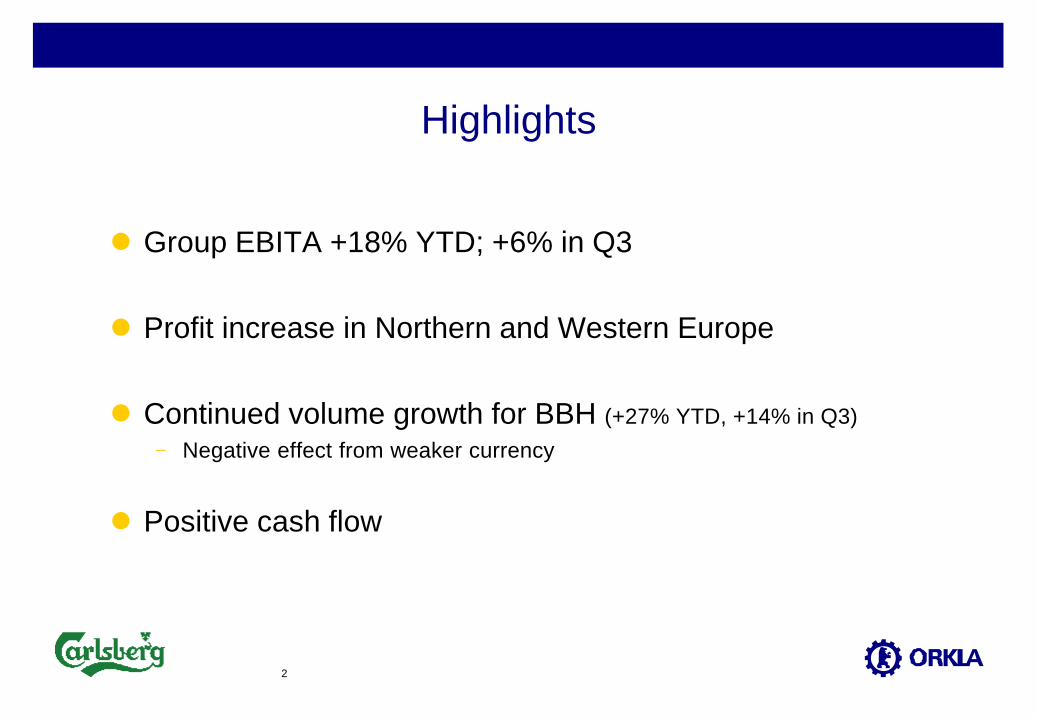
Highlights
l Group EBITA +18% YTD; +6% in Q3
l Profit increase in Northern and Western Europe
l Continued volume growth for BBH (+27% YTD, +14% in Q3)
− Negative effect from weaker currency
l Positive cash flow
3
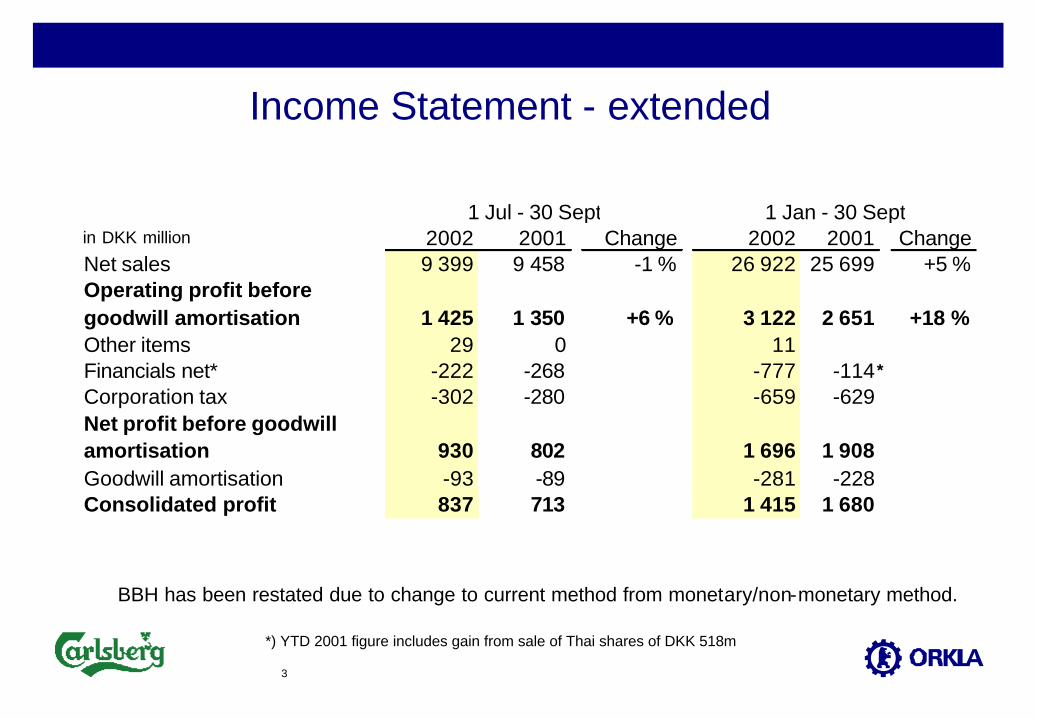
Income Statement - extended
in DKK million 2002 2001 Change 2002 2001 ChangeNet sales 9 399 9 458 -1 % 26 922 25 699 +5 %Operating profit before goodwill amortisation 1 425 1 350 +6 % 3 122 2 651 +18 %Other items 29 0 11Financials net* -222 -268 -777 -114Corporation tax -302 -280 -659 -629Net profit before goodwill amortisation 930 802 1 696 1 908Goodwill amortisation -93 -89 -281 -228Consolidated profit 837 713 1 415 1 680
1 Jan - 30 Sept1 Jul - 30 Sept
BBH has been restated due to change to current method from monetary/non-monetary method.
*) YTD 2001 figure includes gain from sale of Thai shares of DKK 518m
*
4
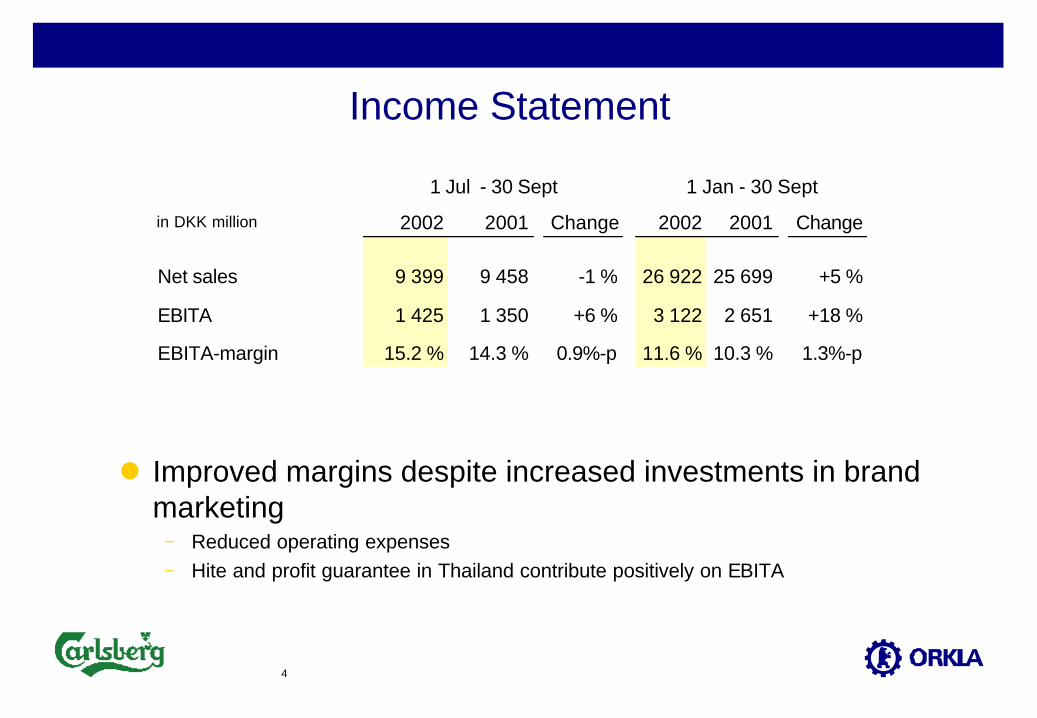
Income Statement
in DKK million 2002 2001 Change 2002 2001 Change
Net sales 9 399 9 458 -1 % 26 922 25 699 +5 %
EBITA 1 425 1 350 +6 % 3 122 2 651 +18 %
EBITA-margin 15.2 % 14.3 % 0.9%-p 11.6 % 10.3 % 1.3%-p
1 Jul - 30 Sept 1 Jan - 30 Sept
l Improved margins despite increased investments in brand marketing
− Reduced operating expenses− Hite and profit guarantee in Thailand contribute positively on EBITA
5
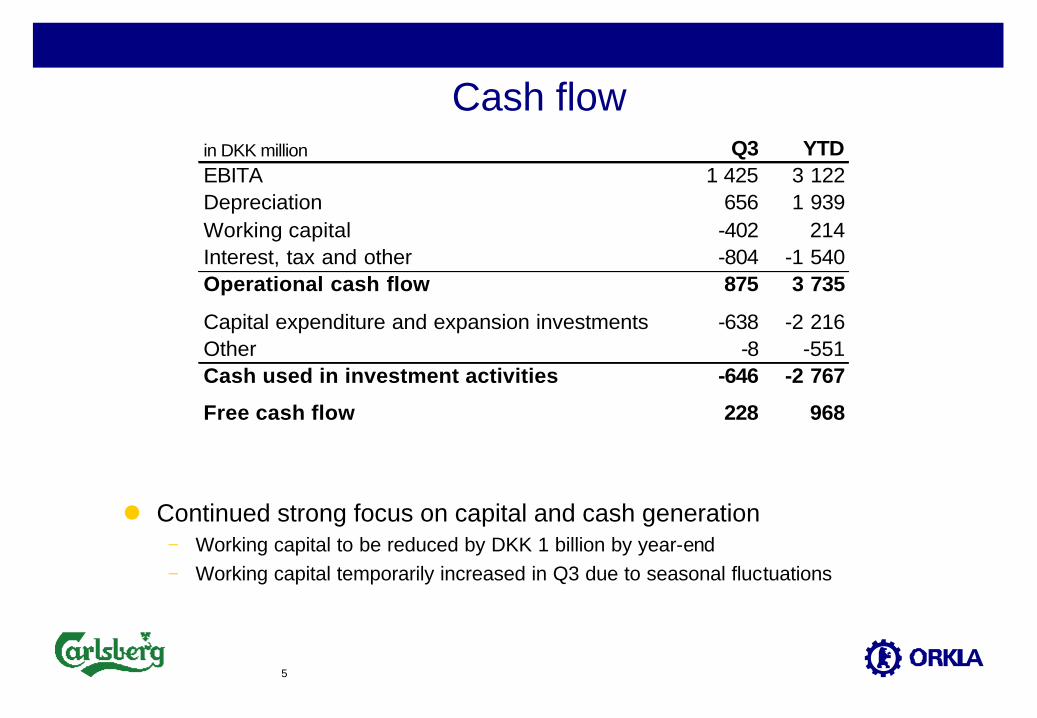
Cash flowin DKK million Q3 YTDEBITA 1 425 3 122Depreciation 656 1 939Working capital -402 214Interest, tax and other -804 -1 540Operational cash flow 875 3 735
Capital expenditure and expansion investments -638 -2 216Other -8 -551Cash used in investment activities -646 -2 767
Free cash flow 228 968
l Continued strong focus on capital and cash generation− Working capital to be reduced by DKK 1 billion by year-end− Working capital temporarily increased in Q3 due to seasonal fluctuations
6
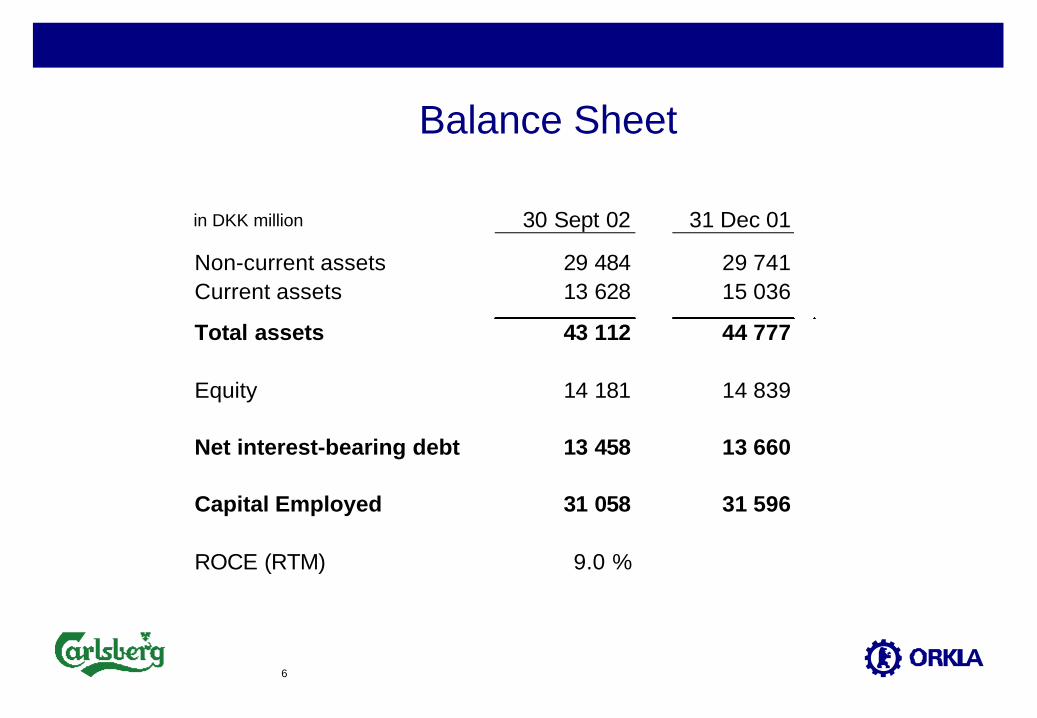
Balance Sheet
in DKK million 30 Sept 02 31 Dec 01
Non-current assets 29 484 29 741Current assets 13 628 15 036
Total assets 43 112 44 777
Equity 14 181 14 839
Net interest-bearing debt 13 458 13 660
Capital Employed 31 058 31 596
ROCE (RTM) 9.0 %
7
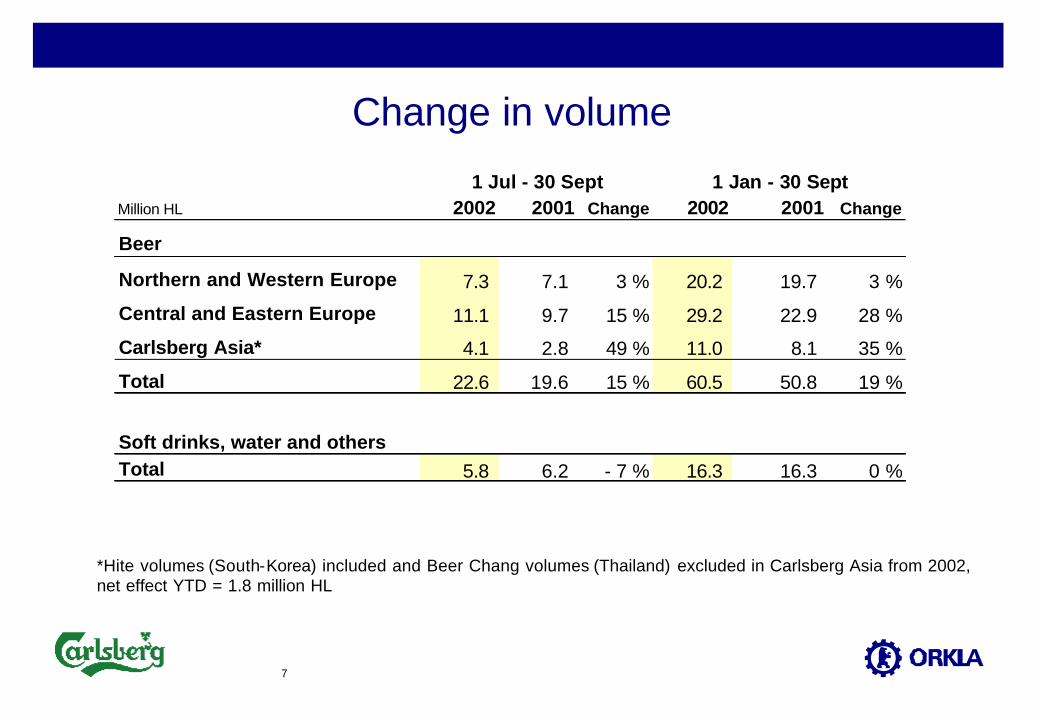
Change in volume
Million HL 2002 2001 Change 2002 2001 Change
Beer
Northern and Western Europe 7.3 7.1 3 % 20.2 19.7 3 %
Central and Eastern Europe 11.1 9.7 15 % 29.2 22.9 28 %
Carlsberg Asia* 4.1 2.8 49 % 11.0 8.1 35 %
Total 22.6 19.6 15 % 60.5 50.8 19 %
Soft drinks, water and othersTotal 5.8 6.2 - 7 % 16.3 16.3 0 %
1 Jul - 30 Sept 1 Jan - 30 Sept
*Hite volumes (South-Korea) included and Beer Chang volumes (Thailand) excluded in Carlsberg Asia from 2002,net effect YTD = 1.8 million HL
8
Change in volume (cont.)
l Beer volume continued to grow− +18% YTD− Carlsberg brand +5% YTD− In BBH volume growth ahead of competitors
l Soft drink volumes are down in Q3 due to− Parallel import to Denmark− Increased focus on high-value segment in Sweden
9
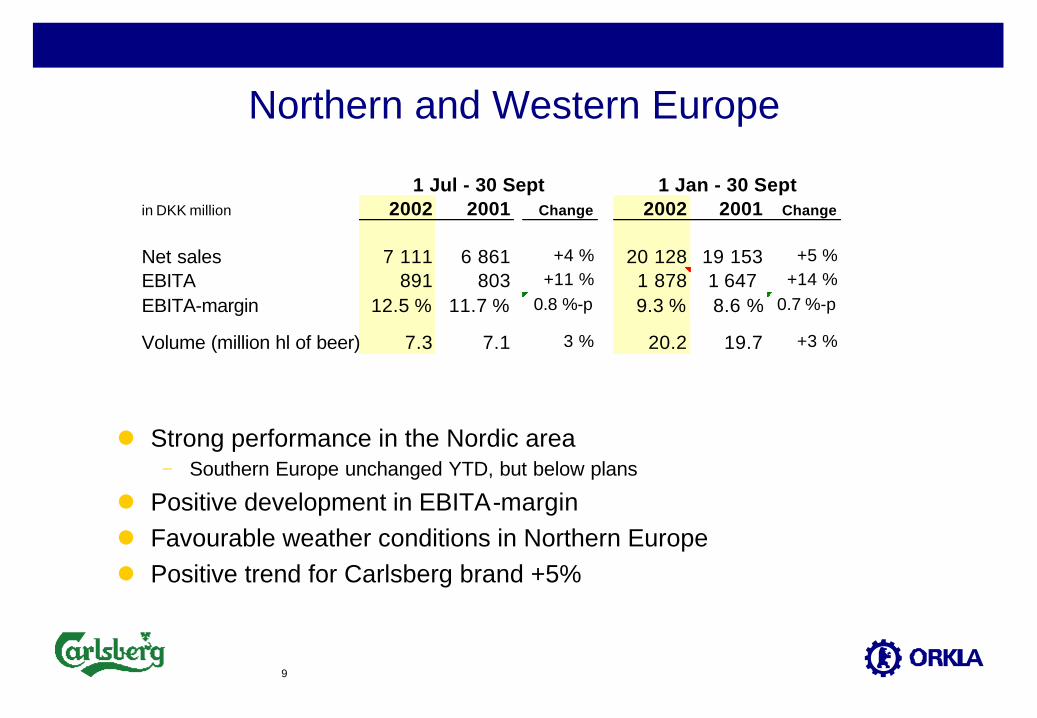
Northern and Western Europe
l Strong performance in the Nordic area− Southern Europe unchanged YTD, but below plans
l Positive development in EBITA-marginl Favourable weather conditions in Northern Europel Positive trend for Carlsberg brand +5%
in DKK million 2002 2001 Change 2002 2001 Change
Net sales 7 111 6 861 +4 % 20 128 19 153 +5 %EBITA 891 803 +11 % 1 878 1 647 +14 %
EBITA-margin 12.5 % 11.7 % 0.8 %-p 9.3 % 8.6 % 0.7 %-p
Volume (million hl of beer) 7.3 7.1 3 % 20.2 19.7 +3 %
1 Jul - 30 Sept 1 Jan - 30 Sept
10
The Nordic area
l Continued positive development in Norway and Finland− Driven by volume growth and favourable product mix effects
l Profit improvement in Carlsberg Sweden− Original cost synergy project following the merger has been completed− Further measures have been announced in order to counteract the effect of
unfavourable market development seen in the past two years
l EBITA-level in Denmark slightly above last year− Cans have taken approx. 5% market share− Illegal trade in beer and soft drinks is increasingly professionally organised
11
UK
l Total market development +1.5% YTD− Total market share for Carlsberg-Tetley approx. 12% YTD− Carlsberg Lager volume growth +11% YTD− Carlsberg Export volume growth +20% YTD
l Review of brand portfolio and distribution− Focus on core brands− New porterage contracts
l Underlying profit improvedl Strong cash flow through reduced capital employed
12
Central and Eastern Europe
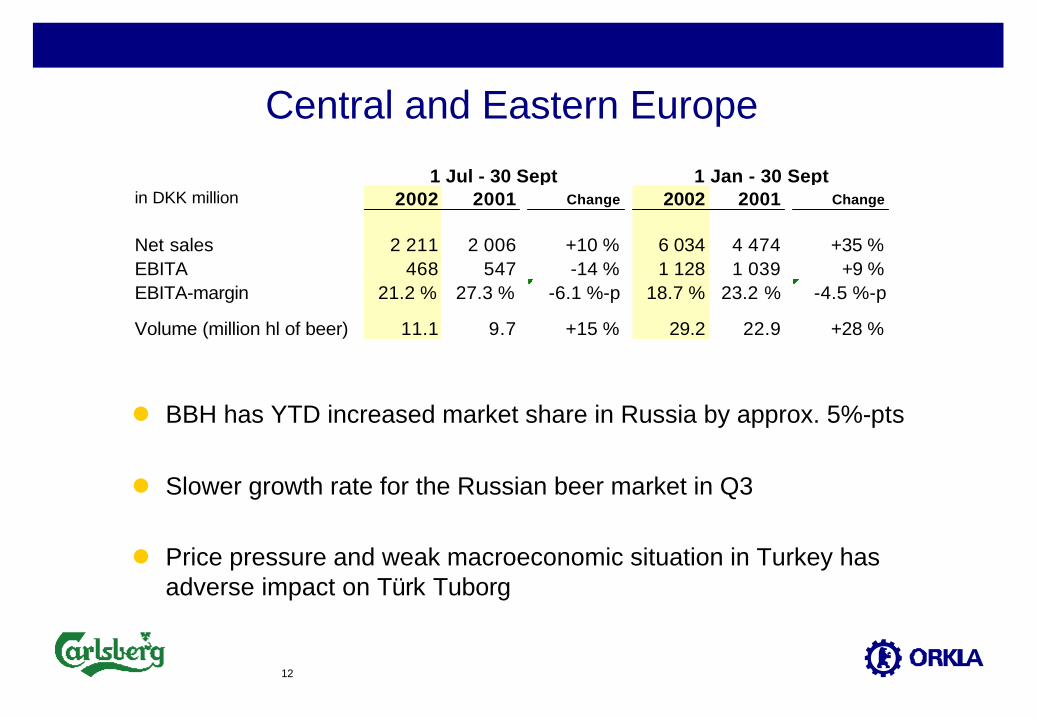
in DKK million 2002 2001 Change 2002 2001 Change
Net sales 2 211 2 006 +10 % 6 034 4 474 +35 %EBITA 468 547 -14 % 1 128 1 039 +9 %EBITA-margin 21.2 % 27.3 % -6.1 %-p 18.7 % 23.2 % -4.5 %-p
Volume (million hl of beer) 11.1 9.7 +15 % 29.2 22.9 +28 %
1 Jul - 30 Sept 1 Jan - 30 Sept
l BBH has YTD increased market share in Russia by approx. 5%-pts
l Slower growth rate for the Russian beer market in Q3
l Price pressure and weak macroeconomic situation in Turkey has adverse impact on Türk Tuborg
13
Central and Eastern Europe (cont.)
l Poland on schedule; Okocim positive in 2002 but Piastresults below plans
l Bulgarian business not consolidated by Q3
l Weaker results in Q3 mainly due to − Currency effects; DKK 42 million in Q3 (40 YTD) due to weaker USD/EUR− Weaker result in Turkey (as mentioned above)
14
Turkey (Türk Tuborg)
l Difficult economic environmentl Disappointing financial performancel Positive sales and market share development driven by
high market investmentsl Change in management
15
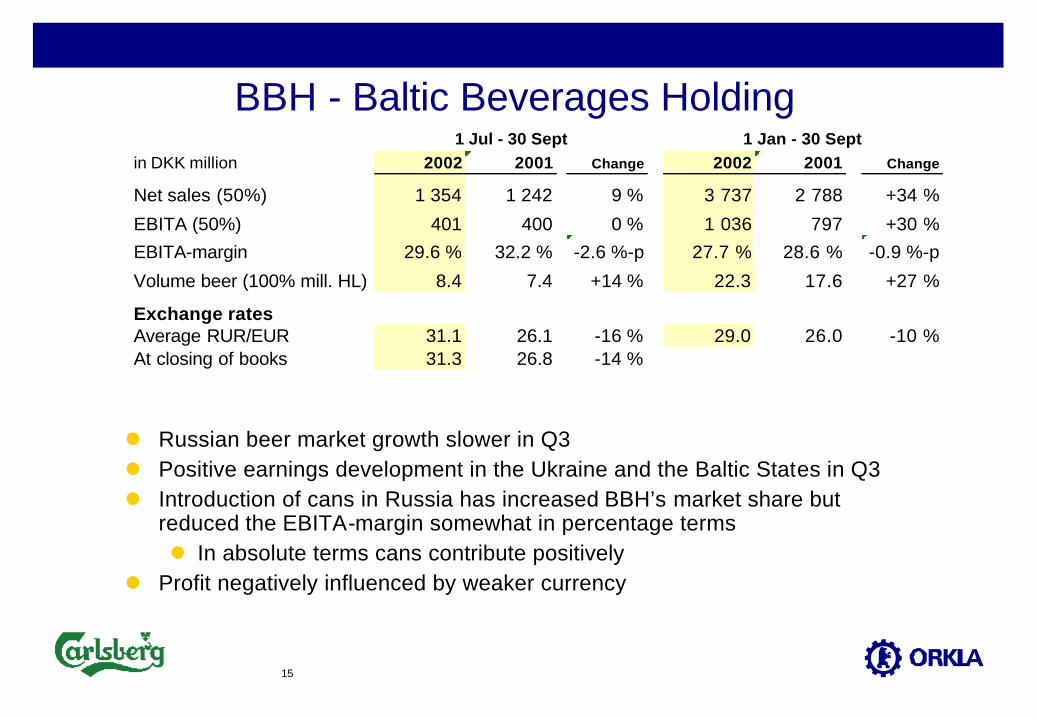
BBH - Baltic Beverages Holdingin DKK million 2002 2001 Change 2002 2001 Change
Net sales (50%) 1 354 1 242 9 % 3 737 2 788 +34 %
EBITA (50%) 401 400 0 % 1 036 797 +30 %
EBITA-margin 29.6 % 32.2 % -2.6 %-p 27.7 % 28.6 % -0.9 %-p
Volume beer (100% mill. HL) 8.4 7.4 +14 % 22.3 17.6 +27 %
Exchange ratesAverage RUR/EUR 31.1 26.1 -16 % 29.0 26.0 -10 %At closing of books 31.3 26.8 -14 %
1 Jan - 30 Sept1 Jul - 30 Sept
l Russian beer market growth slower in Q3l Positive earnings development in the Ukraine and the Baltic States in Q3l Introduction of cans in Russia has increased BBH’s market share but
reduced the EBITA-margin somewhat in percentage termsl In absolute terms cans contribute positively
l Profit negatively influenced by weaker currency
16
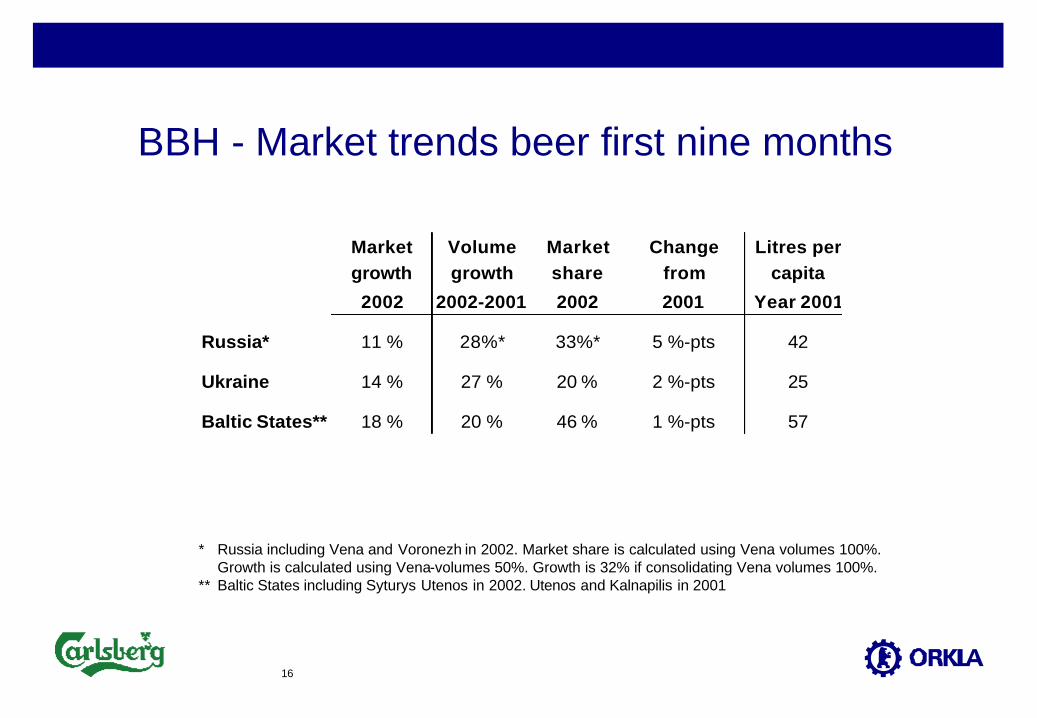
BBH - Market trends beer first nine months
Market Volume Market Change Litres pergrowth growth share from capita
2002 2002-2001 2002 2001 Year 2001
Russia* 11 % 28%* 33%* 5 %-pts 42
Ukraine 14 % 27 % 20 % 2 %-pts 25
Baltic States** 18 % 20 % 46 % 1 %-pts 57
* Russia including Vena and Voronezh in 2002. Market share is calculated using Vena volumes 100%. Growth is calculated using Vena-volumes 50%. Growth is 32% if consolidating Vena volumes 100%.
** Baltic States including Syturys Utenos in 2002. Utenos and Kalnapilis in 2001
17
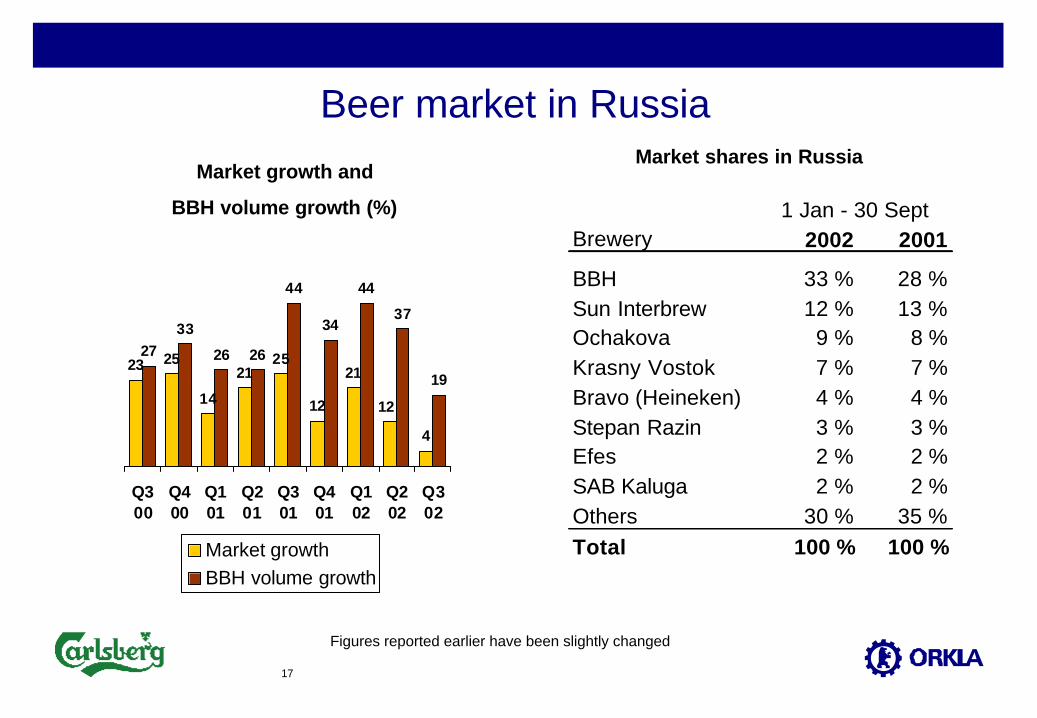
Beer market in RussiaMarket shares in Russia
Brewery 2002 2001
BBH 33 % 28 %Sun Interbrew 12 % 13 %Ochakova 9 % 8 %Krasny Vostok 7 % 7 %Bravo (Heineken) 4 % 4 %Stepan Razin 3 % 3 %Efes 2 % 2 %SAB Kaluga 2 % 2 %Others 30 % 35 %Total 100 % 100 %
1 Jan - 30 Sept
Market growth and
BBH volume growth (%)
23 25
14
2125
12
21
4
2733
26 26
44
34
44
37
19
12
Q300
Q400
Q101
Q201
Q301
Q401
Q102
Q202
Q302
Market growthBBH volume growth
Figures reported earlier have been slightly changed
18
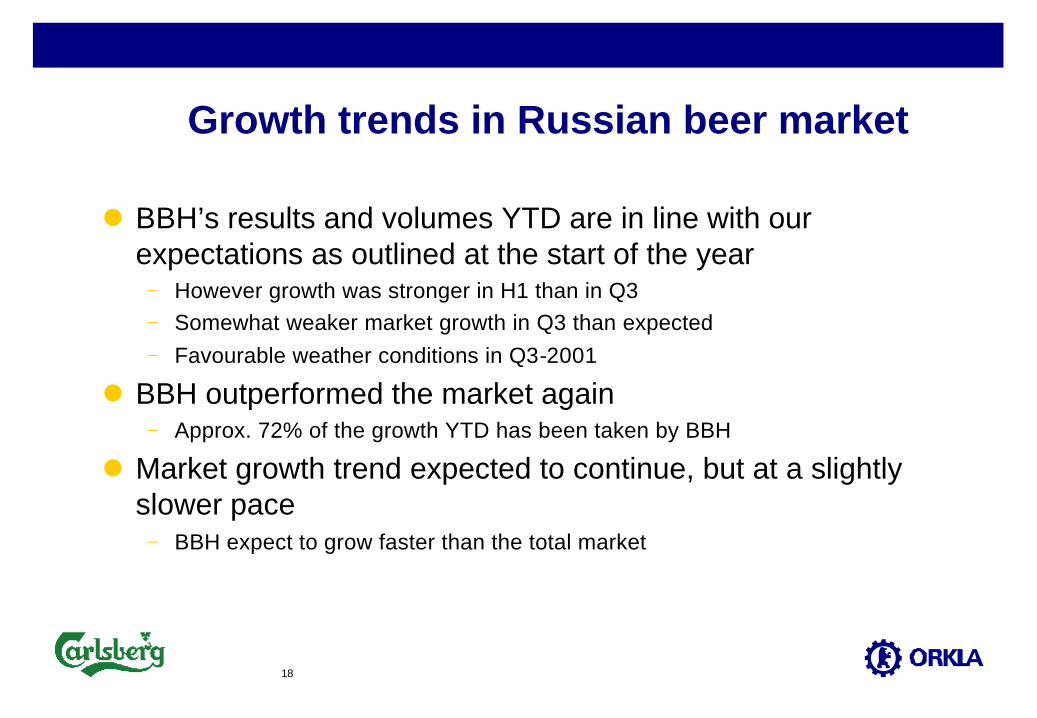
Growth trends in Russian beer market
l BBH’s results and volumes YTD are in line with our expectations as outlined at the start of the year− However growth was stronger in H1 than in Q3− Somewhat weaker market growth in Q3 than expected− Favourable weather conditions in Q3-2001
l BBH outperformed the market again− Approx. 72% of the growth YTD has been taken by BBH
l Market growth trend expected to continue, but at a slightly slower pace− BBH expect to grow faster than the total market
19
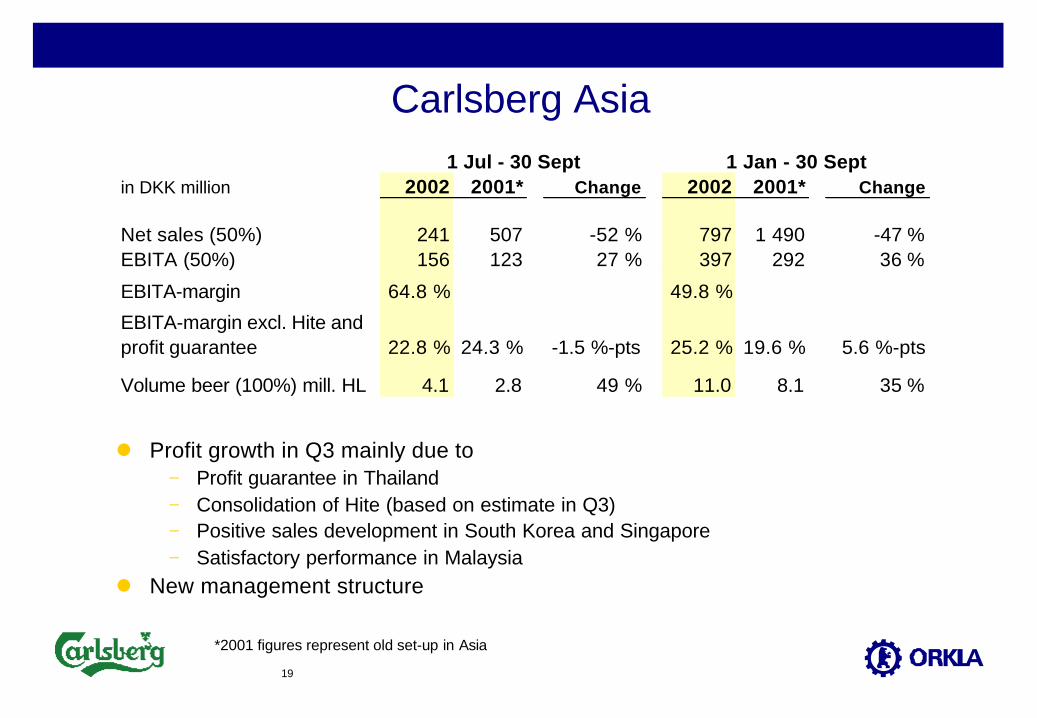
Carlsberg Asia
l Profit growth in Q3 mainly due to− Profit guarantee in Thailand− Consolidation of Hite (based on estimate in Q3)− Positive sales development in South Korea and Singapore− Satisfactory performance in Malaysia
l New management structure
*2001 figures represent old set-up in Asia
in DKK million 2002 2001* Change 2002 2001* Change
Net sales (50%) 241 507 -52 % 797 1 490 -47 %EBITA (50%) 156 123 27 % 397 292 36 %
EBITA-margin 64.8 % 49.8 %
EBITA-margin excl. Hite and profit guarantee 22.8 % 24.3 % -1.5 %-pts 25.2 % 19.6 % 5.6 %-pts
Volume beer (100%) mill. HL 4.1 2.8 49 % 11.0 8.1 35 %
1 Jul - 30 Sept 1 Jan - 30 Sept
20
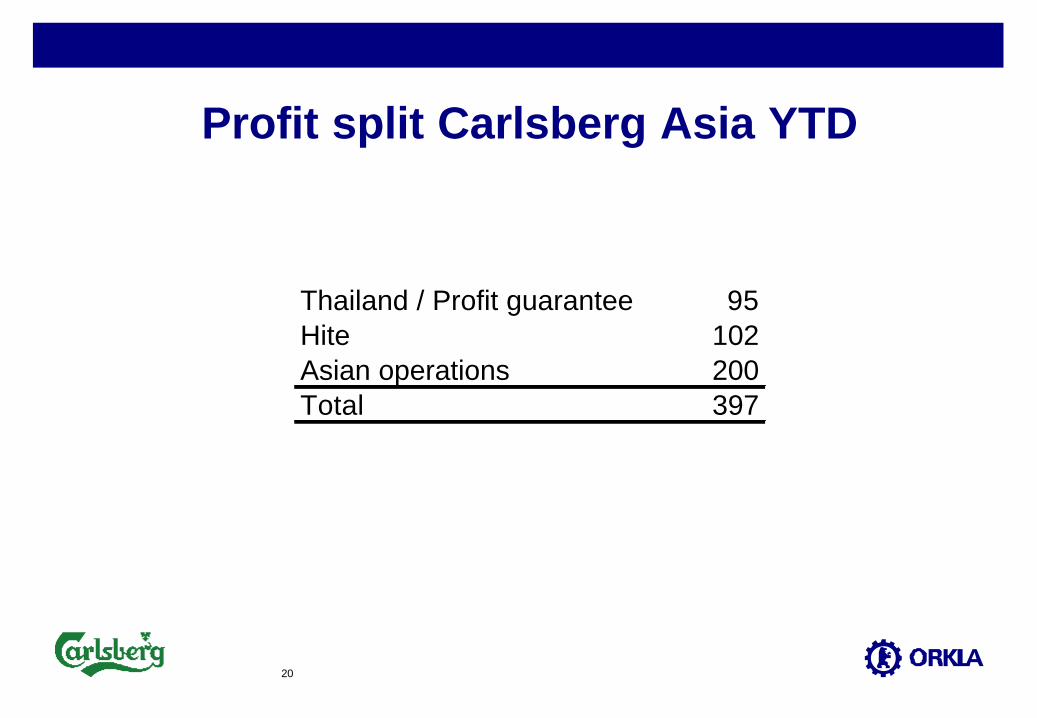
Profit split Carlsberg Asia YTD
Thailand / Profit guarantee 95Hite 102Asian operations 200Total 397
21
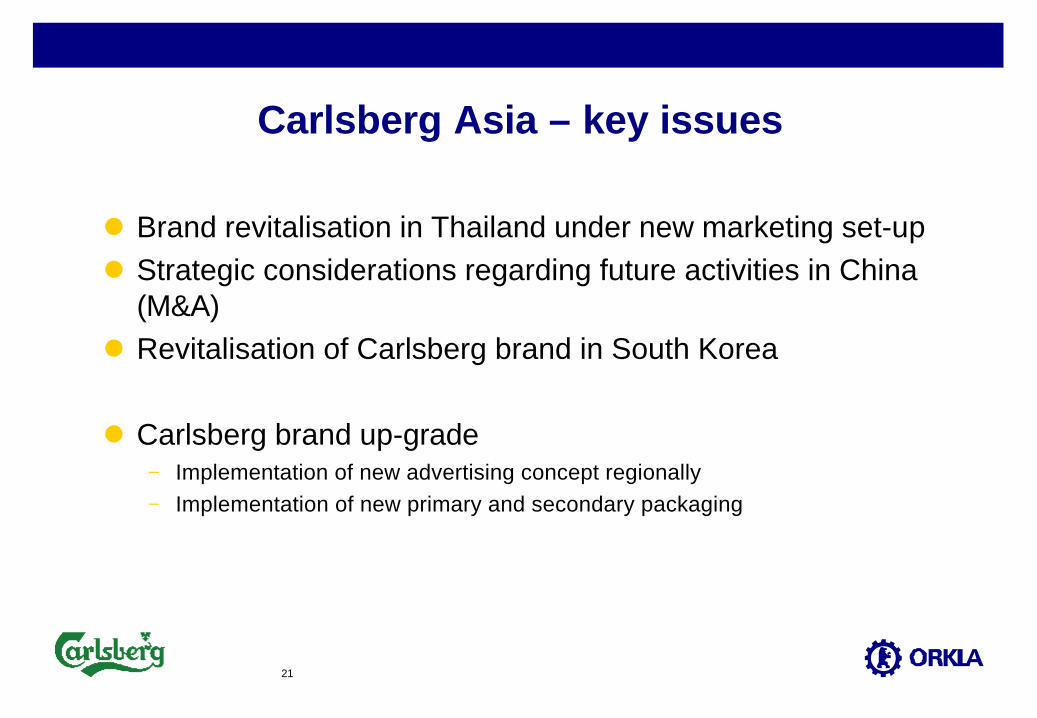
Carlsberg Asia – key issues
l Brand revitalisation in Thailand under new marketing set-upl Strategic considerations regarding future activities in China
(M&A)l Revitalisation of Carlsberg brand in South Korea
l Carlsberg brand up-grade − Implementation of new advertising concept regionally− Implementation of new primary and secondary packaging
22
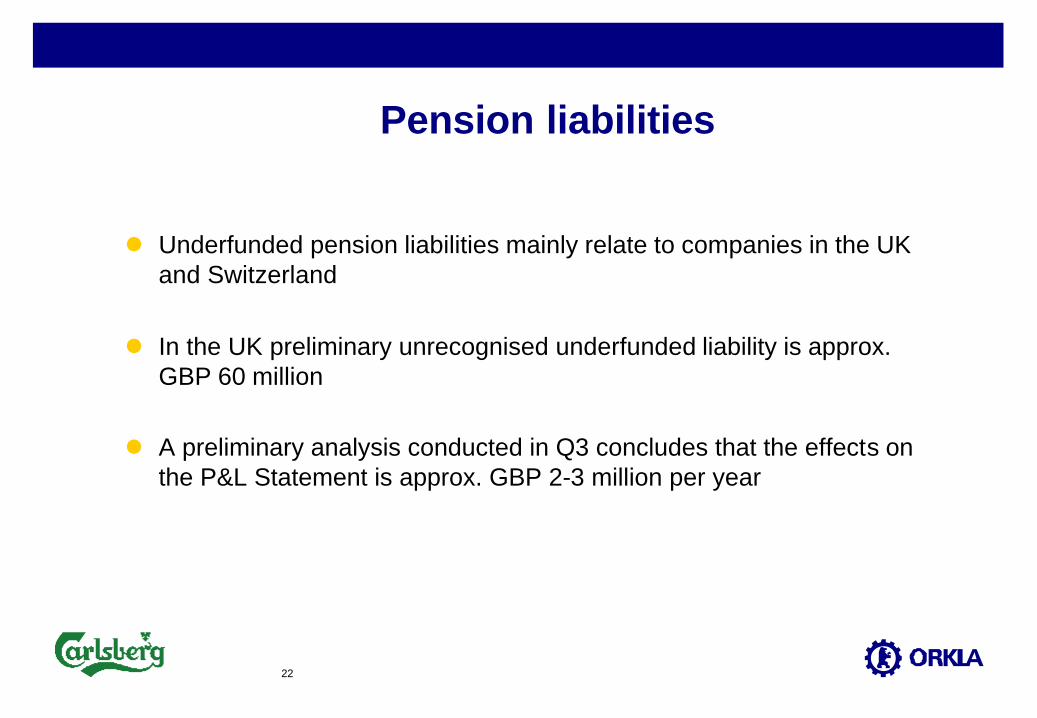
Pension liabilities
l Underfunded pension liabilities mainly relate to companies in the UK and Switzerland
l In the UK preliminary unrecognised underfunded liability is approx. GBP 60 million
l A preliminary analysis conducted in Q3 concludes that the effects on the P&L Statement is approx. GBP 2-3 million per year
23
Carlsberg Breweries – going forward
l Maintained expectations for EBITA growth in 2002 - approximately 20%l Strong focus on cash flow and reduction of capital employedl Continue to improve operational performance
− Stabilise and improve Swedish operations − Turnaround to continue in Poland and Switzerland− Strengthen operations in Turkey in spite of economic environment
l Strengthen and grow the Carlsberg brandl Grow profitably according to strategy
− Continued investments in growth markets− Participate in market consolidation − Focus on customers and consumers
24
Enclosures
25
Impacts of change on current method at BBH
l Figures for Q1 and Q2 are restated from the monetary/non-monetary method to the current method
l Effect for Carlsberg Breweries (50%)− EBIT + DKK 8m− Deferred tax + DKK 82m− Net profit + DKK 58m
26
Carlsberg Asia – new management structure
l Executive committee− 2 members from Carlsberg Breweries − 2 members from Chang
l Management team− 1 Chief Operating Officer North Asia− 1 Chief Operating Officer South Asia− 1 Chief Investment Officer− 1 Chief Administrative Officer
27
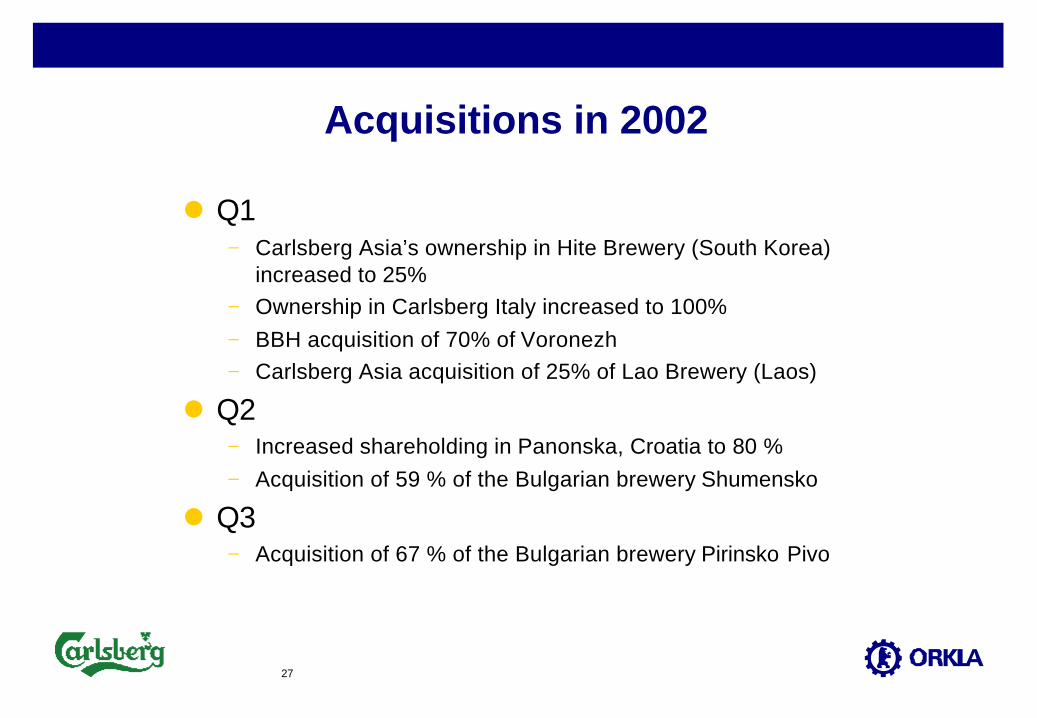
Acquisitions in 2002
l Q1− Carlsberg Asia’s ownership in Hite Brewery (South Korea)
increased to 25%− Ownership in Carlsberg Italy increased to 100%− BBH acquisition of 70% of Voronezh− Carlsberg Asia acquisition of 25% of Lao Brewery (Laos)
l Q2− Increased shareholding in Panonska, Croatia to 80 %− Acquisition of 59 % of the Bulgarian brewery Shumensko
l Q3− Acquisition of 67 % of the Bulgarian brewery Pirinsko Pivo
28
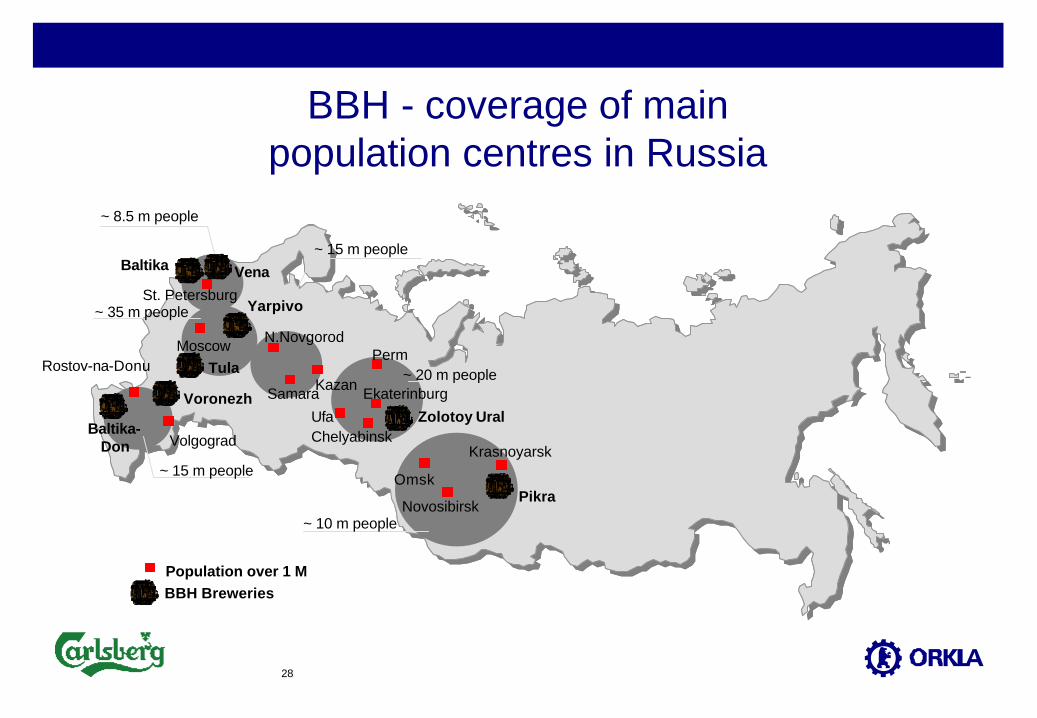
BBH - coverage of main population centres in Russia
St. Petersburg
MoscowRostov-na-Donu
Volgograd
N.Novgorod
Samara Ekaterinburg
Perm
Kazan
UfaChelyabinsk
Omsk
Novosibirsk
Krasnoyarsk
Population over 1 M
~ 8.5 m people
~ 35 m people
~ 15 m people
~ 15 m people
~ 20 m people
~ 10 m people
BBH Breweries
Baltika
Baltika-Don
Yarpivo
Tula
Zolotoy Ural
Pikra
Voronezh
Vena
29
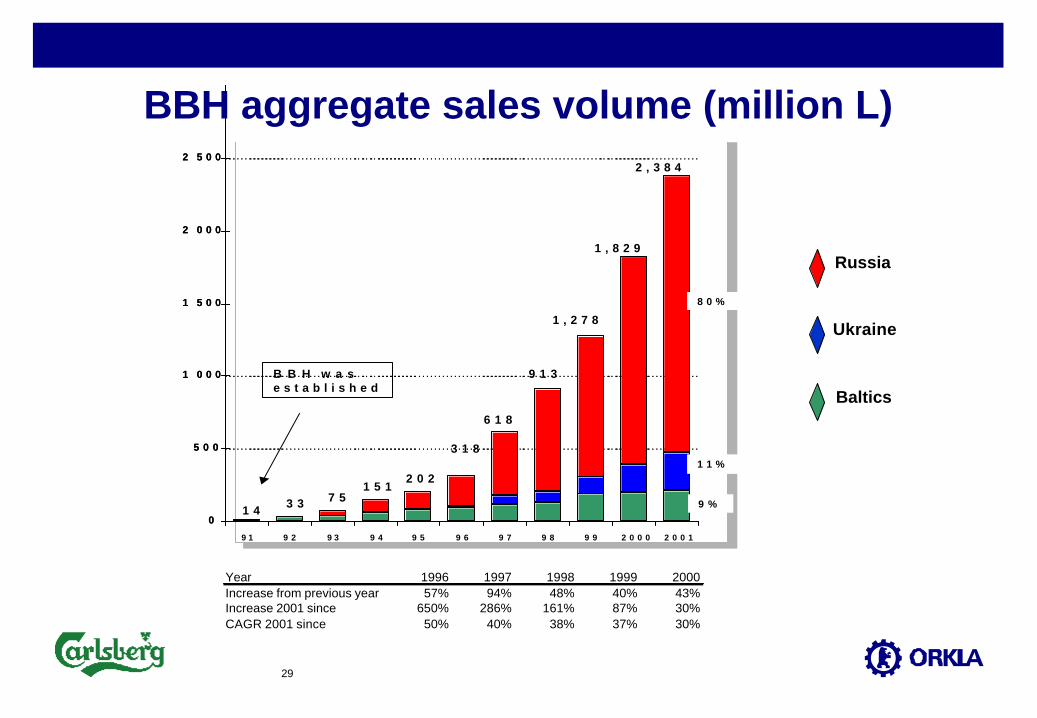
BBH aggregate sales volume (million L)
0
5 0 0
1 0 0 0
1 5 0 0
2 0 0 0
2 5 0 0
9 1 9 2 9 3 9 4 9 5 9 6 9 7 9 8 9 9 2 0 0 0 2 0 0 1
1 4 3 3 7 51 5 1
2 0 2
3 1 8
6 1 8
9 1 3
1 , 2 7 8
1 , 8 2 9
8 0 %
1 1 %
9 %
2 , 3 8 4
B B H w a se s t a b l i s h e d
0
5 0 0
1 0 0 0
1 5 0 0
2 0 0 0
2 5 0 0
9 1 9 2 9 3 9 4 9 5 9 6 9 7 9 8 9 9 2 0 0 0 2 0 0 1
1 4 3 3 7 51 5 1
2 0 2
3 1 8
6 1 8
9 1 3
1 , 2 7 8
1 , 8 2 9
8 0 %
1 1 %
9 %
8 0 %
1 1 %
9 %
2 , 3 8 4
B B H w a se s t a b l i s h e d
Baltics
Ukraine
Russia
Year 1996 1997 1998 1999 2000Increase from previous year 57% 94% 48% 40% 43%Increase 2001 since 650% 286% 161% 87% 30%CAGR 2001 since 50% 40% 38% 37% 30%
30
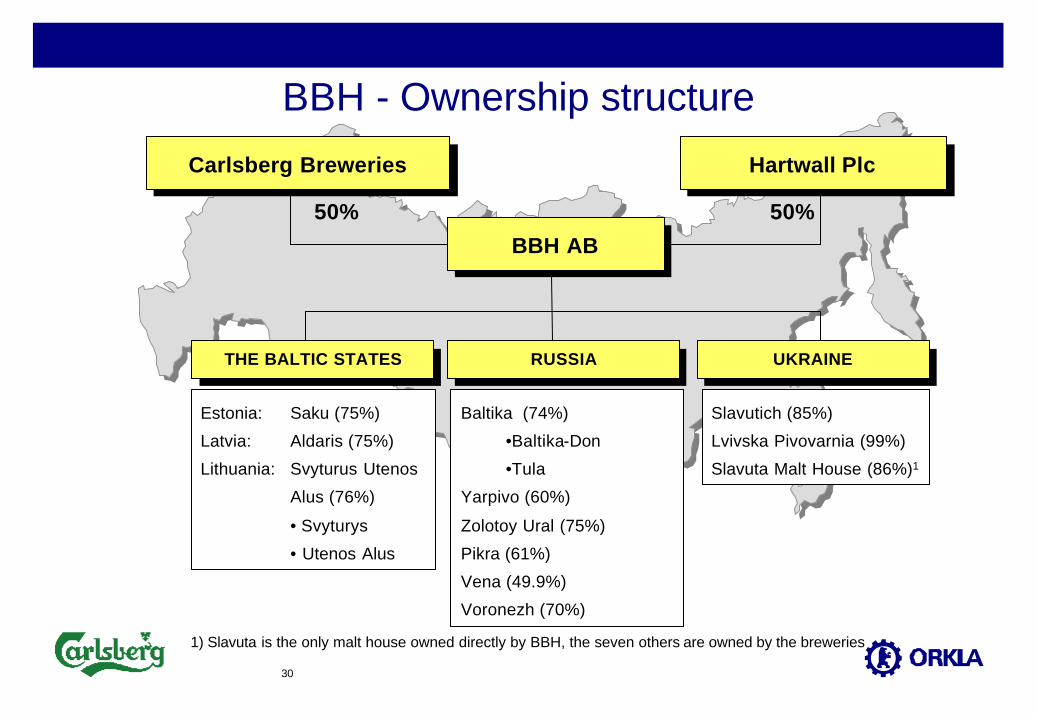
BBH - Ownership structure
Carlsberg BreweriesCarlsberg Breweries Hartwall PlcHartwall Plc
Estonia: Saku (75%)
Latvia: Aldaris (75%)
Lithuania: Svyturus Utenos
Alus (76%)
• Svyturys
• Utenos Alus
THE BALTIC STATESTHE BALTIC STATES
Slavutich (85%)
Lvivska Pivovarnia (99%)
Slavuta Malt House (86%)1
UKRAINEUKRAINE
50% 50%
BBH ABBBH AB
Baltika (74%)
•Baltika-Don
•Tula
Yarpivo (60%)
Zolotoy Ural (75%)
Pikra (61%)
Vena (49.9%)
Voronezh (70%)
RUSSIARUSSIA
1) Slavuta is the only malt house owned directly by BBH, the seven others are owned by the breweries
31
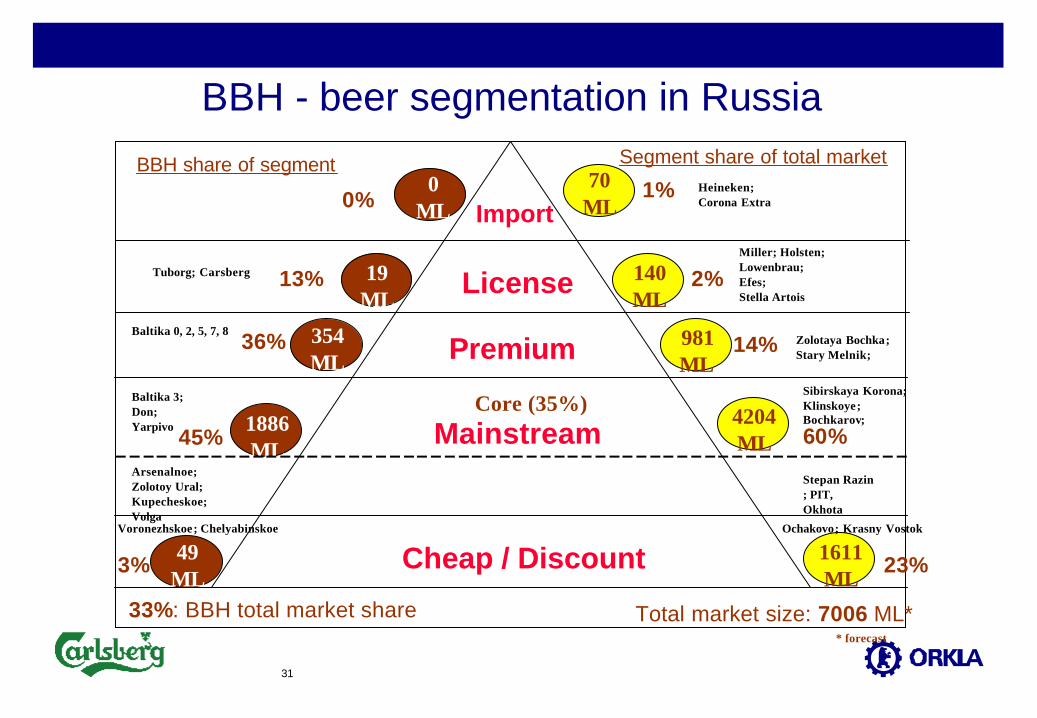
BBH - beer segmentation in Russia
License
Premium
Mainstream
Cheap / Discount
Segment share of total marketBBH share of segment
Total market size: 7006 ML*33%: BBH total market share
1611ML
70ML
981ML
4204ML
0ML
354ML
1886ML
49ML
36%
0%
45%
3%
60%
23%
1%
14%
Core (35%)
Baltika 0, 2, 5, 7, 8
Baltika 3; Don; Yarpivo
Arsenalnoe;Zolotoy Ural; Kupecheskoe;Volga
Heineken; Corona Extra
Miller; Holsten; Lowenbrau; Efes; Stella Artois
Sibirskaya Korona;Klinskoye;Bochkarov;
Stepan Razin; PIT, Okhota
140ML
19ML
13% 2%
Zolotaya Bochka; Stary Melnik;
* forecast
Import
Tuborg; Carsberg
Ochakovo; Krasny VostokVoronezhskoe; Chelyabinskoe
32
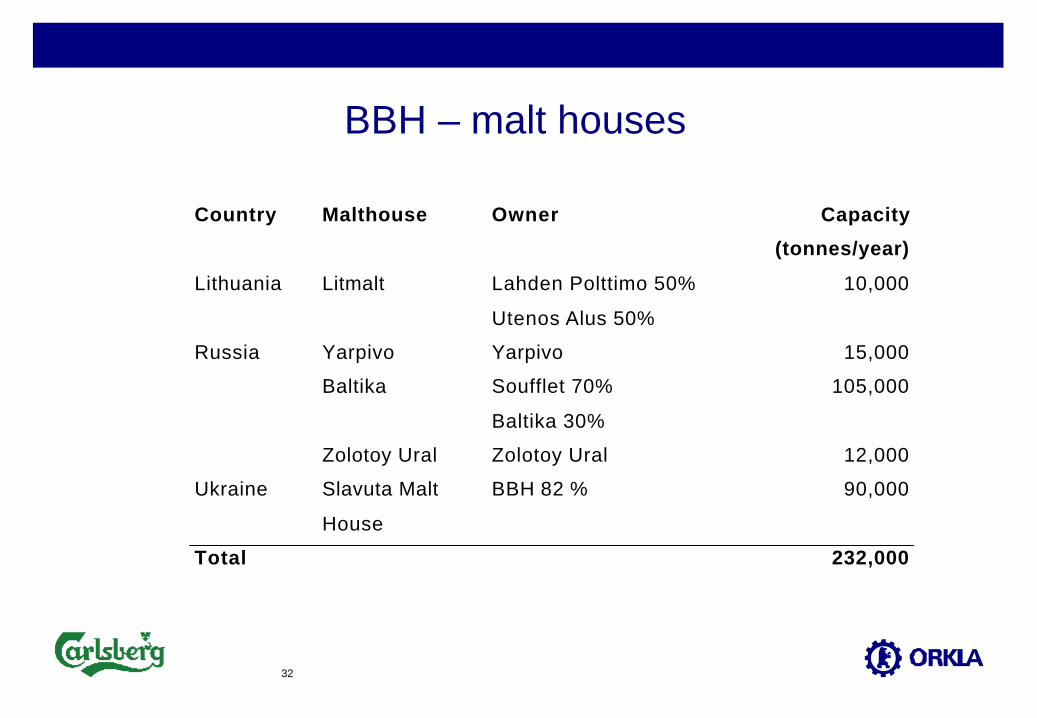
BBH – malt houses
Country Malthouse Owner Capacity
(tonnes/year)
Lithuania Litmalt Lahden Polttimo 50%
Utenos Alus 50%
10,000
Russia Yarpivo Yarpivo 15,000
Baltika Soufflet 70%
Baltika 30%
105,000
Zolotoy Ural Zolotoy Ural 12,000
Ukraine Slavuta Malt
House
BBH 82 % 90,000
Total 232,000
33
BBH - success factors
l Acquire majority interests in locally dominant breweries through new issues of equity− Local brands, management and ownership− collector of beer tax
l Quality improvements− Beer of western quality using modern technology− Extensive personnel development
l Brand strategy with focus on mainstream quality segmentl Volume growth (capacity expansion and further acquisitions)l Improved distribution systeml Support from BBH (Hartwall/Carlsberg Breweries) in marketing, sales and
distribution as well as in purchasing and financing