Embed Size (px)
DESCRIPTION
Cellular Respiration. Lesson 2. Enzyme. Enzyme. ADP. P. Substrate. +. ATP. Product. Figure 9.7. Substrate Level Phosphorylation. Both glycolysis and the citric acid cycle Can generate ATP by substrate-level phosphorylation. 2 NAD +. Triose phosphate dehydrogenase. P i. 2. 2. - PowerPoint PPT Presentation
Citation preview
Cellular Respiration
Lesson 2
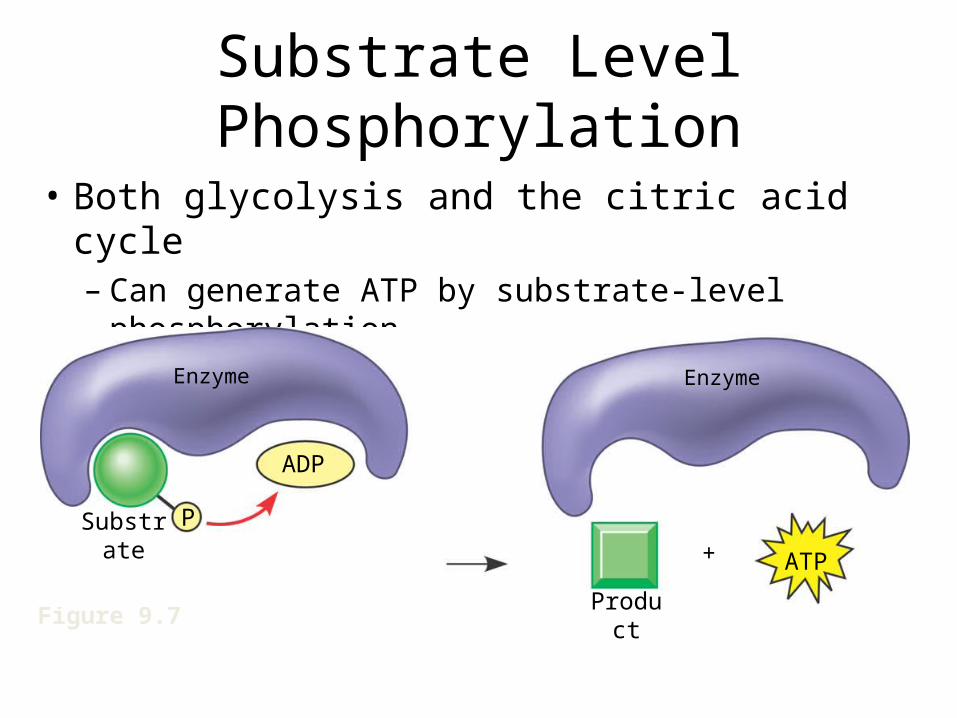
Substrate Level Phosphorylation
• Both glycolysis and the citric acid cycle– Can generate ATP by substrate-level
phosphorylation
Figure 9.7
Enzyme Enzyme
ATP
ADP
Product
SubstrateP
+
2 NAD+
NADH2+ 2 H+
Triose phosphatedehydrogenase
2 P i
2P C
CHOH
O
P
O
CH2 O
2 O–
1, 3-Bisphosphoglycerate2 ADP
2 ATP
Phosphoglycerokinase
CH2 O P
2
CCHOH
3-Phosphoglycerate
Phosphoglyceromutase
O–
C
C
CH2OH
H O P
2-Phosphoglycerate
2 H2O
2 O–
Enolase
CC
OPO
CH2
Phosphoenolpyruvate2 ADP
2 ATPPyruvate kinase
O–
C
C
O
O
CH3
2
6
8
7
9
10
Pyruvate
O
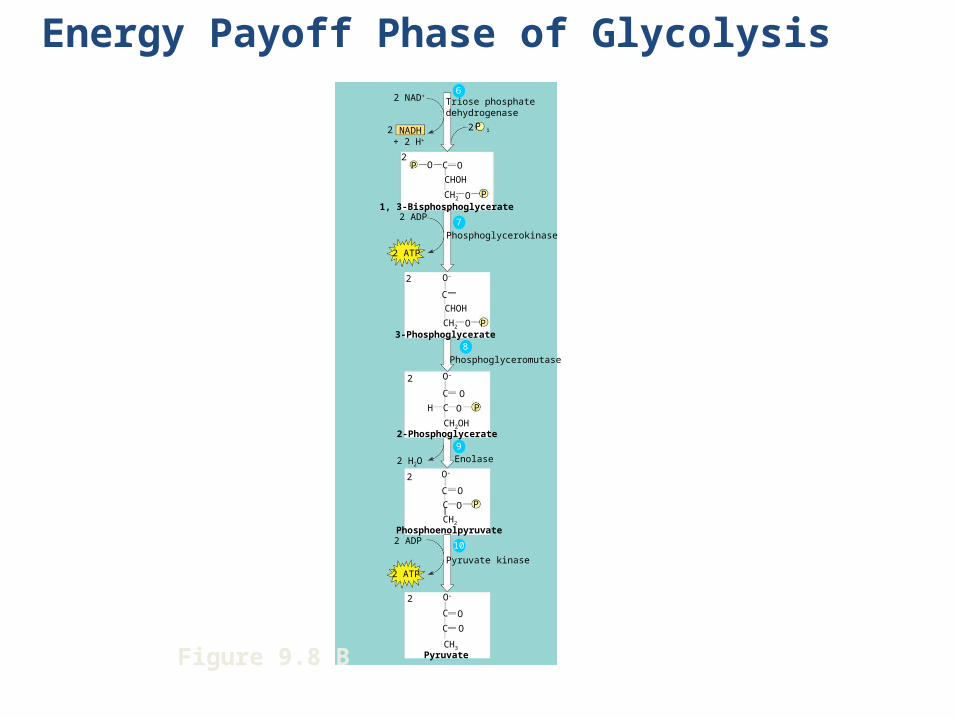
Figure 9.8 B
Energy Payoff Phase of Glycolysis
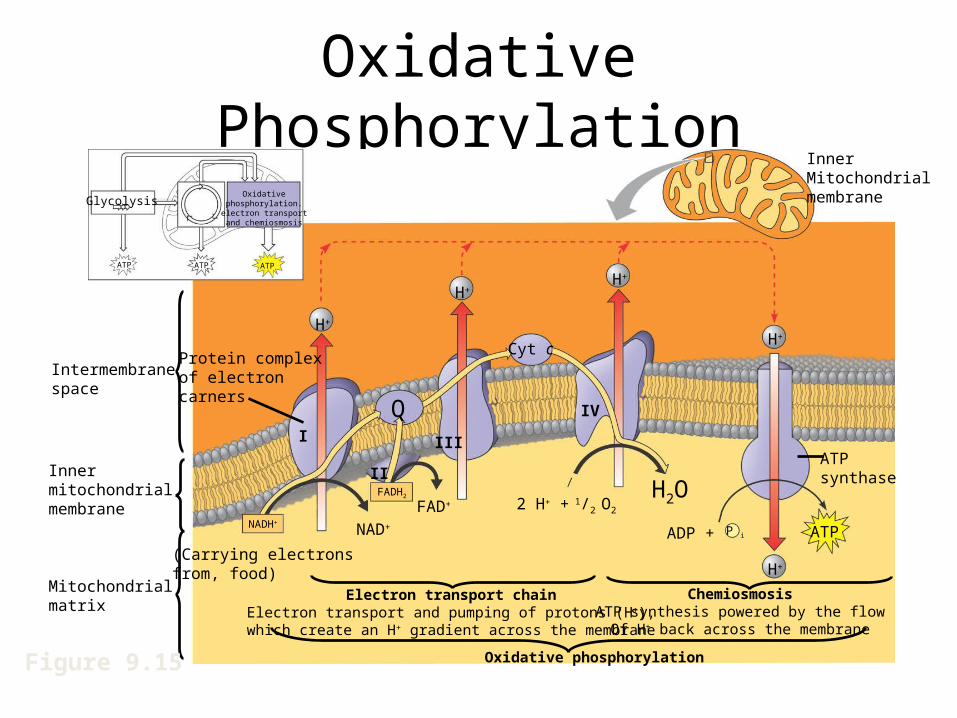
Oxidative PhosphorylationOxidative
phosphorylation.electron transportand chemiosmosis
Glycolysis
ATP ATP ATP
InnerMitochondrialmembrane
H+
H+H+
H+
H+
ATPP i
Protein complexof electron carners
Cyt c
I
II
III
IV
(Carrying electronsfrom, food)
NADH+
FADH2
NAD+
FAD+ 2 H+ + 1/2 O2
H2O
ADP +
Electron transport chainElectron transport and pumping of protons (H+),
which create an H+ gradient across the membrane
ChemiosmosisATP synthesis powered by the flow
Of H+ back across the membrane
ATPsynthase
Q
Oxidative phosphorylation
Intermembranespace
Innermitochondrialmembrane
Mitochondrialmatrix
Figure 9.15

Respiration Overview
H2O
O2
NADH
FADH2
FMN
Fe•S Fe•S
Fe•S
O
FAD
Cyt b
Cyt c1
Cyt c
Cyt a
Cyt a3
2 H + + 12
I
II
III
IV
Multiproteincomplexes
0
10
20
30
40
50
Free
ene
rgy
(G) r
elati
ve to
O2 (k
cl/m
ol)
Figure 9.13
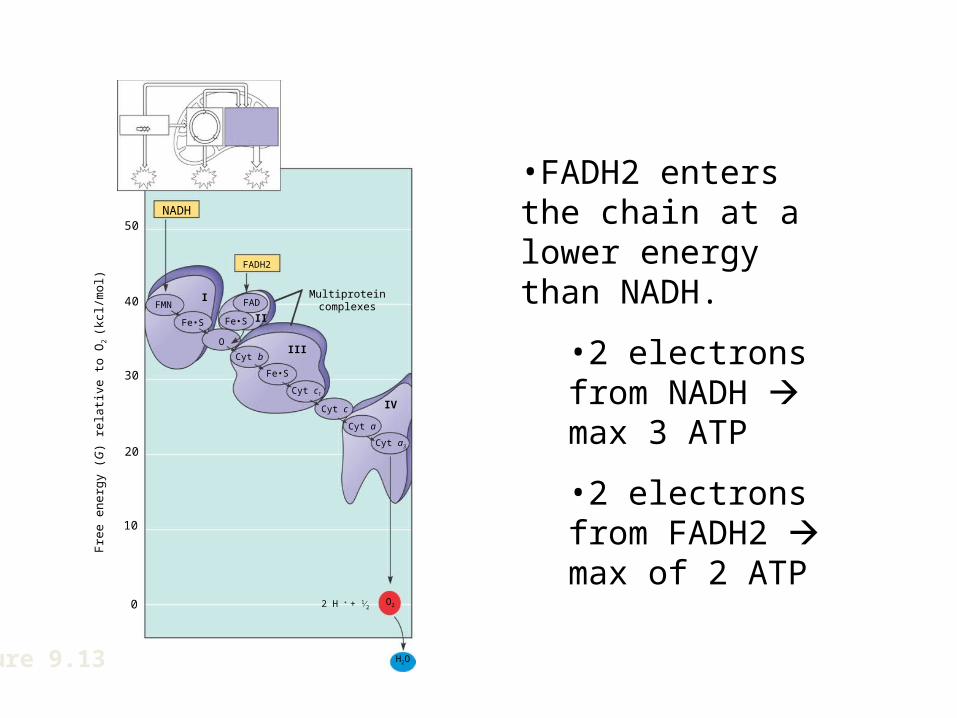
•FADH2 enters the chain at a lower energy than NADH.
•2 electrons from NADH max 3 ATP
•2 electrons from FADH2 max of 2 ATP
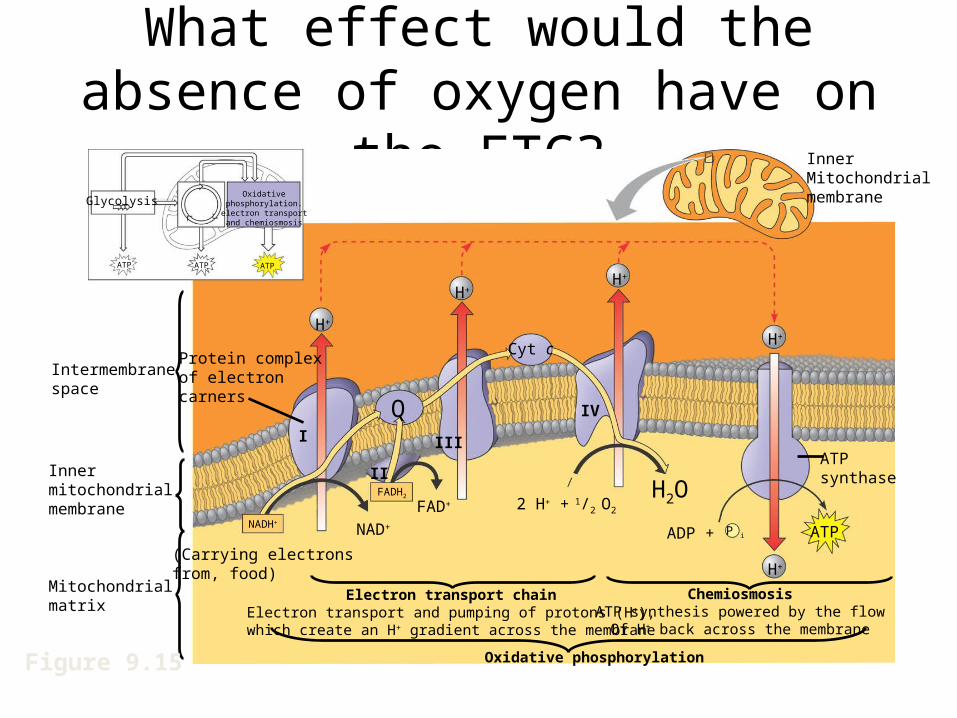
What effect would the absence of oxygen have on the ETC?
Oxidativephosphorylation.
electron transportand chemiosmosis
Glycolysis
ATP ATP ATP
InnerMitochondrialmembrane
H+
H+H+
H+
H+
ATPP i
Protein complexof electron carners
Cyt c
I
II
III
IV
(Carrying electronsfrom, food)
NADH+
FADH2
NAD+
FAD+ 2 H+ + 1/2 O2
H2O
ADP +
Electron transport chainElectron transport and pumping of protons (H+),
which create an H+ gradient across the membrane
ChemiosmosisATP synthesis powered by the flow
Of H+ back across the membrane
ATPsynthase
Q
Oxidative phosphorylation
Intermembranespace
Innermitochondrialmembrane
Mitochondrialmatrix
Figure 9.15
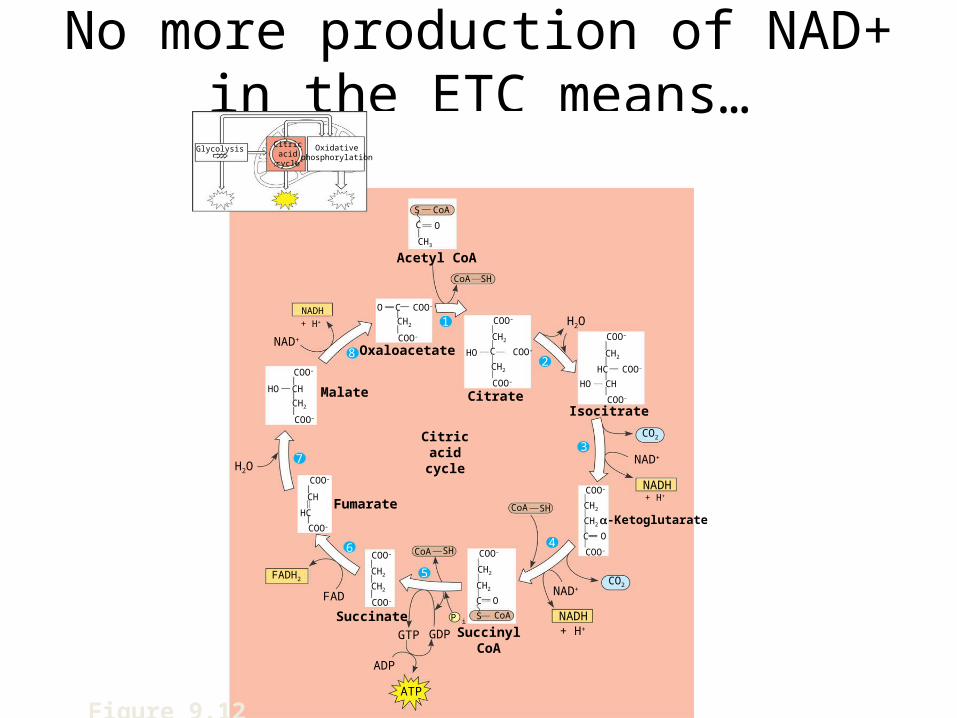
No more production of NAD+ in the ETC means…
Acetyl CoA
NADH
Oxaloacetate
CitrateMalate
Fumarate
SuccinateSuccinyl
CoA
-Ketoglutarate
Isocitrate
Citricacidcycle
S CoA
CoA SH
NADH
NADH
FADH2
FAD
GTP GDP
NAD+
ADP
P i
NAD+
CO2
CO2
CoA SH
CoA SH
CoAS
H2O
+ H+
+ H+ H2O
C
CH3
O
O C COO–
CH2
COO–
COO–
CH2
HO C COO–
CH2
COO–
COO–
COO–
CH2
HC COO–
HO CHCOO–
CH
CH2
COO–
HO
COO–
CH
HC
COO–
COO–
CH2
CH2
COO–
COO–
CH2
CH2
C O
COO–
CH2
CH2
C O
COO–
1
2
3
4
5
6
7
8
Glycolysis Oxidativephosphorylation
NAD+
+ H+
ATP
Citricacidcycle
Figure 9.12
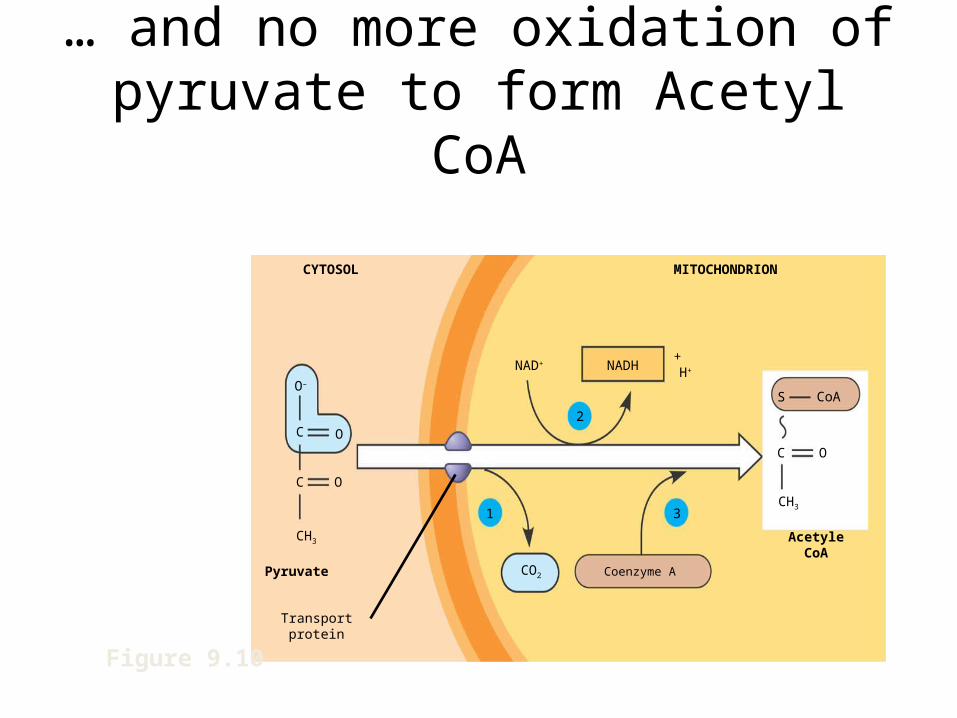
… and no more oxidation of pyruvate to form Acetyl CoA
CYTOSOL MITOCHONDRION
NADH + H+NAD+
2
31
CO2 Coenzyme APyruvate
Acetyle CoA
S CoA
C
CH3
O
Transport protein
O–
O
O
C
C
CH3
Figure 9.10
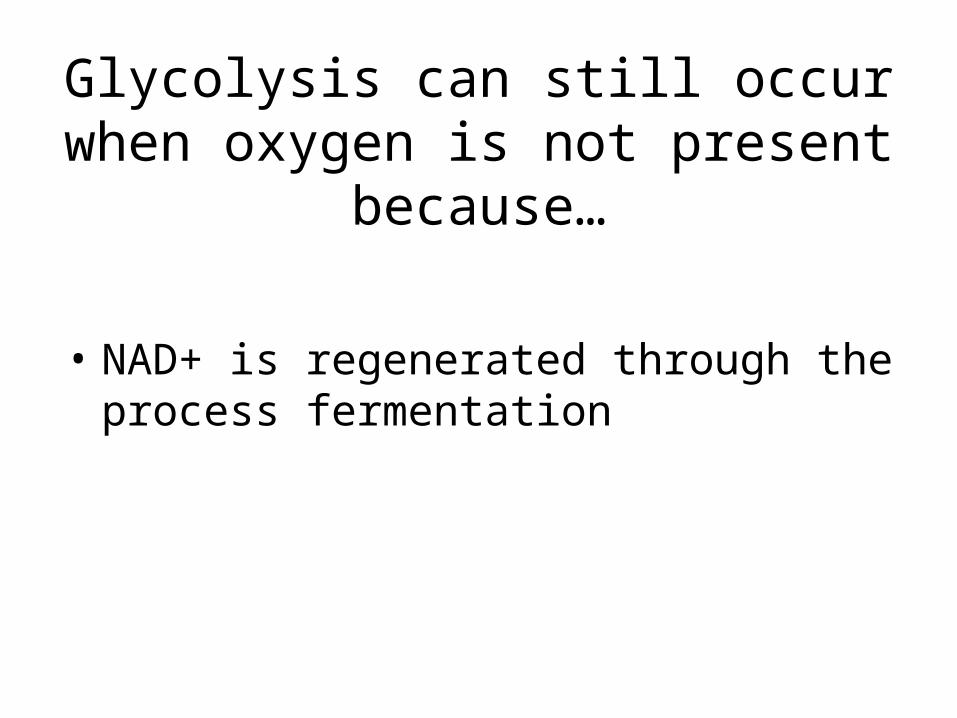
Glycolysis can still occur when oxygen is not present because…
• NAD+ is regenerated through the process fermentation
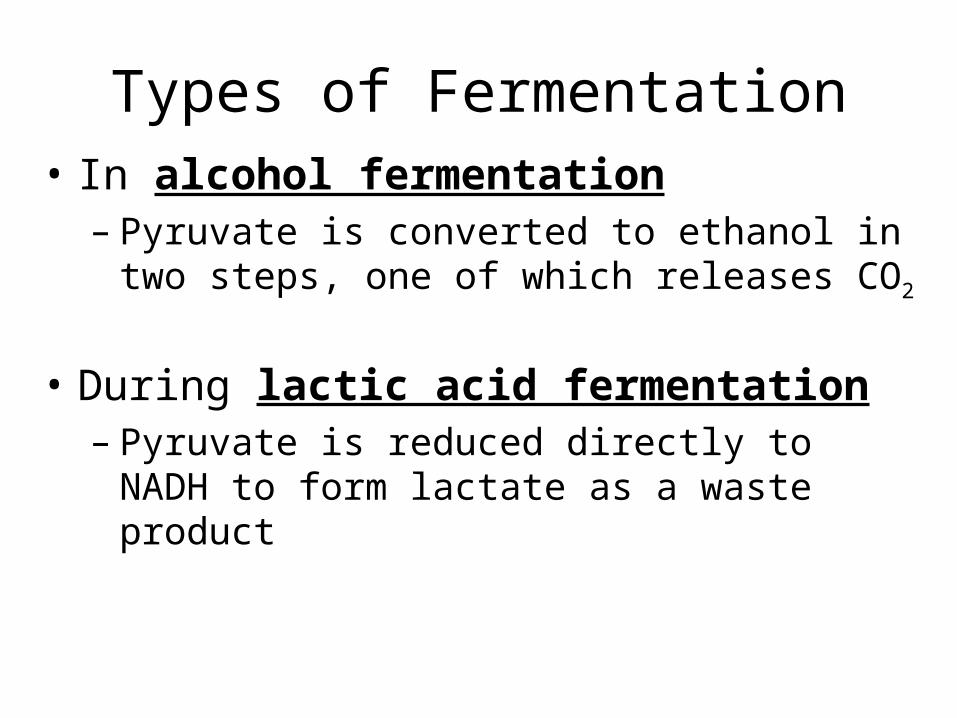
Types of Fermentation• In alcohol fermentation– Pyruvate is converted to ethanol in two steps, one
of which releases CO2
• During lactic acid fermentation– Pyruvate is reduced directly to NADH to form lactate
as a waste product
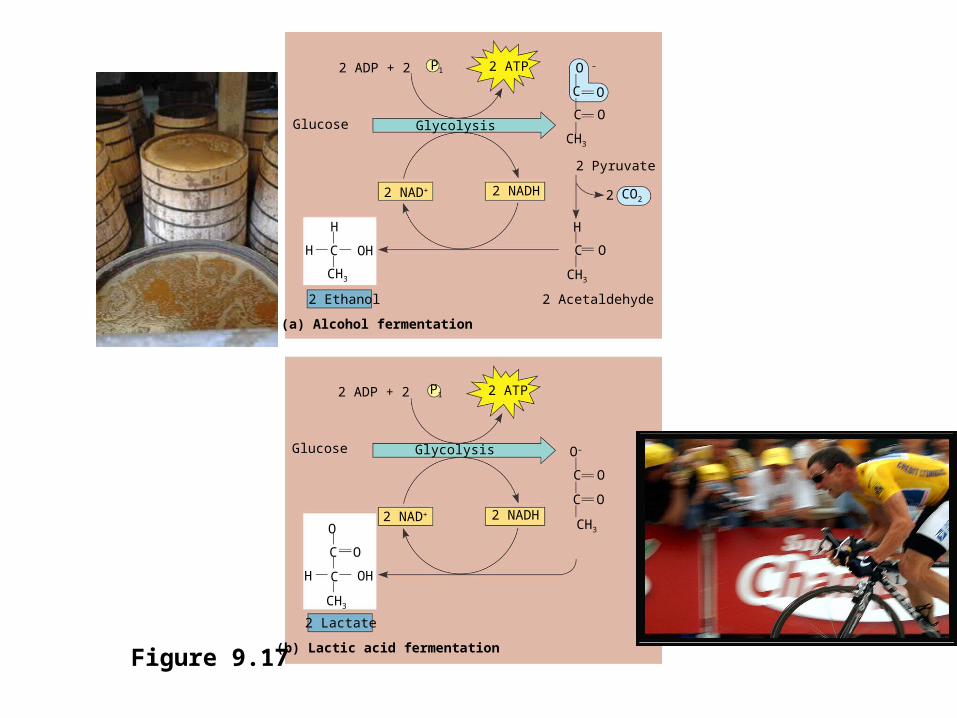
2 ADP + 2 P1 2 ATP
GlycolysisGlucose
2 NAD+ 2 NADH
2 Pyruvate
2 Acetaldehyde 2 Ethanol
(a) Alcohol fermentation
2 ADP + 2 P1 2 ATP
GlycolysisGlucose
2 NAD+ 2 NADH
2 Lactate
(b) Lactic acid fermentation
H
H OH
CH3
C
O –
OC
C O
CH3
H
C O
CH3
O–
C O
C O
CH3O
C O
C OHH
CH3
CO22
Figure 9.17

• Pyruvate is a key juncture in catabolismGlucose
CYTOSOL
PyruvateNo O2 presentFermentation
O2 present Cellular respiration
Ethanolor
lactate
Acetyl CoA
MITOCHONDRION
Citricacidcycle
Figure 9.18
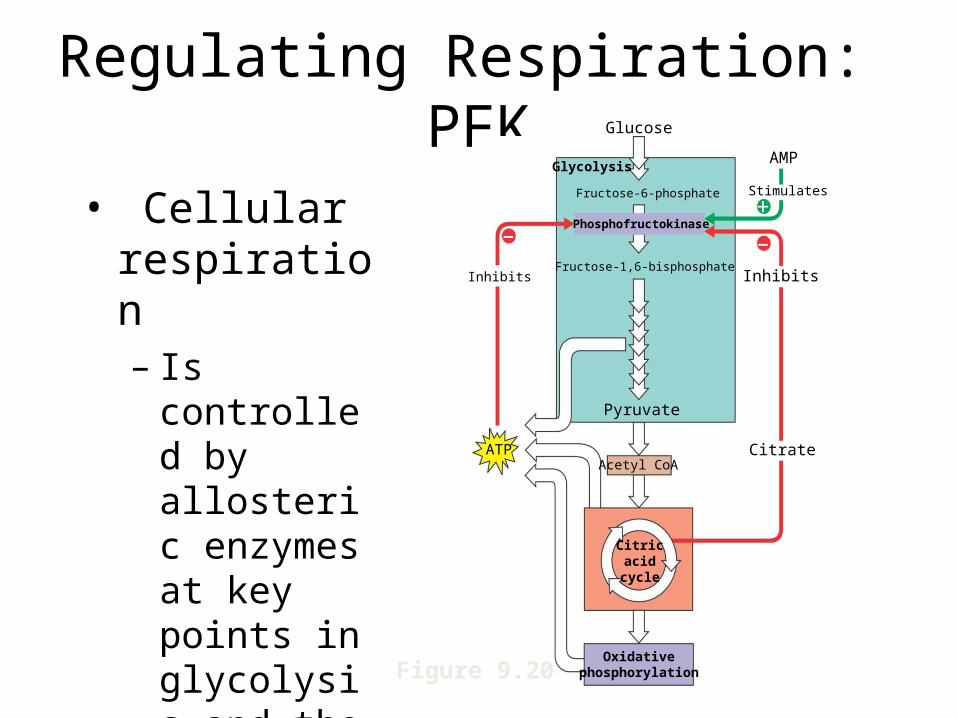
Regulating Respiration: PFKGlucose
Glycolysis
Fructose-6-phosphate
Phosphofructokinase
Fructose-1,6-bisphosphateInhibits Inhibits
Pyruvate
ATPAcetyl CoA
Citricacidcycle
Citrate
Oxidativephosphorylation
Stimulates
AMP
+– –
Figure 9.20
• Cellular respiration– Is controlled
by allosteric enzymes at key points in glycolysis and the citric acid cycle