Embed Size (px)
Citation preview
Cellular/Molecular
Munc13-3 Superprimes Synaptic Vesicles at Granule Cell-to-Basket Cell Synapses in the Mouse Cerebellum
Shimpei Ishiyama,1 Hartmut Schmidt,1 X Benjamin H. Cooper,2 Nils Brose,2 and X Jens Eilers1
1Carl Ludwig Institute for Physiology, Medical Faculty, University of Leipzig, D-04103 Leipzig, Germany, and 2Department of Molecular Neurobiology, MaxPlanck Institute of Experimental Medicine, D-37075 Gottingen, Germany
Munc13-3 is a presynaptic protein implicated in vesicle priming that is strongly expressed in cerebellar granule cells (GCs). Mice deficientof Munc13-3 (Munc13-3�/�) show an increased paired-pulse ratio (PPR), which led to the hypothesis that Munc13-3 increases the releaseprobability (pr ) of vesicles. In the present study, we analyzed unitary synaptic connections between GCs and basket cells in acutecerebellar slices from wild-type and Munc13-3�/� mice. Unitary EPSCs recorded from Munc13-3�/� GCs showed normal kinetics andsynaptic latency but a significantly increased PPR and fraction of synaptic failures. A quantal analysis revealed that neither the charge ofsingle quanta nor the binominal parameter N were affected by loss of Munc13-3 but that pr was almost halved in Munc13-3�/�. Neitherpresynaptic Ca 2� influx was affected by deletion of Munc13-3 nor replenishment of the readily releasable vesicle pool. However, a highconcentration of EGTA led to a reduction in EPSCs that was significantly stronger in Munc13-3�/�. We conclude that Munc13-3 isresponsible for an additional step of molecular and/or positional “superpriming” that substantially increases the efficacy of Ca 2�-triggered release.
Key words: granule cell; Munc13; release probability; superpriming; vesicular release
IntroductionCNS neurons can fuse synaptic vesicles (SVs) with high tem-poral precision and fidelity during brief bursts of presynapticaction potentials (APs; Chadderton et al., 2004). The synapticefficacy of such phasic transmission is influenced by severalpresynaptic and postsynaptic factors, among which the releaseprobability ( pr) of SVs is functionally the most relevant pa-rameter. It determines the amount of release in response to thefirst AP, which can be expected to be important for plasticity(Malinow and Tsien, 1990), reliability (Stevens and Wang,1994), and speed of information processing in multistage neu-ronal networks (Thorpe et al., 1996). Via SV depletion, pr alsoaffects short-term plasticity (Fioravante and Regehr, 2011),allowing for redistributing synaptic efficacy within bursts(Markram and Tsodyks, 1996).
The pr of an SV is set during molecular and positional prim-ing, which renders SVs highly susceptible for release-triggeringCa 2� influx through voltage-gated Ca 2� channels. During prim-ing, a complex interaction of proteins controls the intrinsic Ca 2�
sensitivity of the release machinery (molecular priming) and itscoupling distance to Ca 2� channels (positional priming; Neherand Sakaba, 2008; Sudhof, 2013). Munc13 proteins, mammalianhomologs of Caenorhabditis elegans Unc-13, play distinct roles inSV priming (Brose et al., 2000). Of the four Munc13 isoforms(Munc13-1, ubMunc13-2, bMunc13-2, and Munc13-3) ex-pressed in the brain (Betz et al., 2001), the ubiquitously expressedMunc13-1 (Augustin et al., 1999b) is essential for fusion compe-tence of SVs in excitatory synapses (Augustin et al., 1999a). Theremaining three Munc13s convey more subtle influences on SVrelease, which are isoform and apparently also cell-type specific.Munc13-3 is mainly expressed in the cerebellum, pons, brains-tem (Augustin et al., 2001), visual cortex (Yang et al., 2002), andthe calyx of Held (Chen et al., 2013). It is thought to regulate pr inthe cerebellum (Augustin et al., 2001; Beierlein et al., 2007; Bao etal., 2010) and potentially at the calyx of Held (Lee et al., 2013) toslow SV replenishment at the calyx of Held (Chen et al., 2013) andto play a role in network maturation in the visual cortex (Yang etal., 2002).
Here, we characterized the role of Munc13-3 at granule cell(GC)-to-basket cell (BC) synapses in cerebella from wild-type(WT) and Munc13-3-deficient [Munc13-3�/� (Augustin et al.,2001)] mice. Using paired recordings, Ca 2� imaging and appli-cation of a high concentration of the exogenous Ca 2� bufferEGTA, we provide direct evidence that Munc13-3 drastically in-creases pr by enhancing Ca 2� release coupling via an additionalpriming step of either molecular or positional nature (Schluter etal., 2006) but leaves all other parameters of transmission unaf-fected. We conclude that Munc13-3 superprimes SVs at GC–BCsynapses.
Received May 20, 2014; revised Sept. 17, 2014; accepted Sept. 22, 2014.Author contributions: S.I., B.H.C., N.B., and J.E. designed research; S.I., H.S., and B.H.C. performed research; S.I.,
H.S., and B.H.C. analyzed data; S.I., N.B., and J.E. wrote the paper.This work was supported by German Research Foundation research training group InterNeuro 1097 (J.E.), Grant
SCHM1838/1 (H.S.), and Collaborative Research Centre 889/B1 (N.B.). We thank Gudrun Bethge for technical assis-tance and Manfred Heckmann and Stefan Hallermann for comments on this manuscript.
The authors declare no competing financial interests.Correspondence should be addressed to Jens Eilers, Carl Ludwig Institute for Physiology, Medical Faculty, Uni-
versity of Leipzig, D-04103 Leipzig, Germany. E-mail: [email protected]. Ishiyama’s present address: Bernstein Center for Computational Neuroscience, Humboldt University of Berlin,
D-10115 Berlin, Germany.DOI:10.1523/JNEUROSCI.2060-14.2014
Copyright © 2014 the authors 0270-6474/14/3414687-10$15.00/0
The Journal of Neuroscience, October 29, 2014 • 34(44):14687–14696 • 14687
Materials and MethodsAnimals. Homozygous Munc13-3 deletion mutant mice [Munc13-3�/�
(Augustin et al., 2001)] with a C57BL/6 background were obtained byinterbreeding of heterozygous mutant mice. Pups were genotyped byPCR with tail biopsy sampled at birth. Munc13-3�/� and C57BL/6 con-trol mice (postnatal days 18 –26, either sex) were anesthetized usingisoflurane before decapitation. The cerebellum was removed and imme-diately immersed into ice-cold solution containing the following (inmM): 64 NaCl, 25 NaHCO3, 2.5 KCl, 1.25 NaH2PO4, 0.5 CaCl2, 7 MgCl2,10 D-glucose, and 120 D-sucrose, pH 7.4 when aerated with carbogen(95% O2/5% CO2). Horizontal slices of the cerebellum (400 �m thick-ness) were prepared using a vibratome (VT1200S; Leica) and incubatedat 35°C for 45 min in a solution containing the following (in mM): 125NaCl, 2.5 KCl, 1.25 NaH2PO4, 26 NaHCO3, 1 MgCl2, 2 CaCl2, 20D-glucose, 3 myo-inositol, 4 Na-pyruvate (Serva Electrophoresis), 0.8L-ascorbic acid, pH 7.4 when aerated with carbogen (325 mOsm/kg ad-justed by D-sucrose). Slices were then maintained at room temperature(RT) before starting experiments. Experimental procedures were ap-proved by the local authority (state directorate of Saxony, Germany).
Electrophysiological recordings. The horizontal slices were placed in arecording chamber and perfused with a carbogen-gassed artificial CSF(ACSF) containing the following (in mM): 125 NaCl, 2.5 KCl, 1.25NaH2PO4, 26 NaHCO3, 1 MgCl2, 2 CaCl2, 20 D-glucose, and 0.01 of theGABAA-receptor antagonist SR-95531 [2-(3-carboxypropyl)-3-amino-6-(4-methoxyphenyl)pyridazinium bromide; Sigma-Aldrich], pH 7.4(325 mOsm/kg adjusted by D-sucrose). The intracellular solution forwhole-cell and cell-attached recordings consisted of the following (inmM): 150 KCl, 3 ATP-Mg, 0.3 GTP-Na, 10 HEPES-K, 10 NaCl, and 1EGTA, pH 7.4 (�320 mOsm/kg). Electrophysiological recordings wereconducted at RT (20 � 1°C) under optical control (BX51WI; Olympus)using an EPC10 amplifier controlled by PatchMaster 2.69 software(HEKA Elektronik). For whole-cell recordings and cell-attached stimu-lation, borosilicate glass pipettes (Hilgenberg) were pulled (PC-10; Na-rishige) to resistances of 5– 6 M� when filled with the intracellularsolution. For tract stimulation, pipettes had 3– 4 M� resistance whenfilled with ACSF. Tract stimulation was performed using ISO-STIM 01DPI (npi electronic). Currents were filtered at 7 kHz and sampled at 20kHz.
BCs were identified by the location of their somata in the lower third ofthe molecular layer and by their capability to generate APs. BCs werevoltage clamped in the whole-cell configuration at a holding potential of�80 mV (corrected for the liquid junction potential). Once the whole-cell configuration was established, the membrane capacitance cancella-tion was applied and the series resistance was compensated to limit theeffective Rs to �10 M�.
For paired recordings, putative presynaptic GCs were identified in athree-step procedure (Schmidt et al., 2013): first, the recording pipettewas positioned in the GC layer close to the surface of the slice; brief pulsesof positive pressure were applied to the pipette so that the ejected K �-rich pipette solution would depolarize a patch of nearby GCs. Differentlocations were tested until bursts of EPSCs could be recorded in thepostsynaptic BC in response to the pressure pulse, and duration andstrength of the pressure pulse were kept minimal (�500 ms and �2mbar, respectively). Second, the recording pipette was lowered and aloose-cell recording was established with one of the GCs in the active areaby applying slight negative pressure to the pipette; subsequently, the GCwas depolarized for 50 ms with increasing voltage pulses until presynap-tic action currents (ACs) were observed (typically 5 during the 50 msdepolarization). If the ACs were not associated with time-locked EPSCsin the BC, the GC was discarded and, using the same pipette, a nearby GCwas targeted. Third, once a connected GC had been identified, the stim-ulus intensity was established that reliably evoked only a single AC inresponse to a brief (1 ms) depolarization of the GC [�20% above thethreshold of the AC (100 –300 mV), at a holding potential of �80 mV(Perkins, 2006)]; seal resistances ranged from 50 to 100 M�. GCs locatedup to 30 �m to each side under the BC soma were targeted so that theunitary EPSCs (uEPSCs) may have originated from ascending axonsand/or parallel fibers.
Recordings were visually inspected for the absence of spontaneousACs between stimuli. Paired-pulse stimulations were applied to the pre-synaptic GCs with interleaved interstimulus intervals (ISIs) of 10, 20, 50,100, 200, 500, and 1000 ms, repeated sequentially every 5 s. The PPR wascalculated as the ratio of the mean charge of the second uEPSCs at a givenISI (Q2) to the mean charge of the first uEPSCs of all ISIs (Q� 1). Chargeswere calculated over a period of 8.5 ms after the end of the presynapticdepolarization. The relationships between PPR and ISIs were fitted witha monoexponential function forced to return to unity.
Quantal parameters were estimated from GC-mediated uEPSCs re-corded at different extracellular calcium concentrations ([Ca 2�]o: 1, 2, 5,or 10 mM, �80 repetitions at each concentration, 5 s stimulus interval) bya multiple-probability fluctuation analysis (MPFA) well suited for uni-tary connections (Clements and Silver, 2000). In the MPFA, the varianceof charges (corrected for the variance of visually identified failures) isplotted versus the mean charge (including failures), which allows extract-ing the quantal size q, pr, and the binomial parameter N from a parabolicfit to the data (for details, see Hallermann et al., 2010). Estimates of N,which in theory should be integers but are reported as real numbers bythe fitting routine, were rounded to one decimal place to reflect theuncertainty of the fit. Charges were calculated over a period of 8.5 msafter the end of the presynaptic depolarization, independent of whether agiven responses would be visually identified as failure or success. To testwhether the MPFA was distorted by postsynaptic receptor saturation,experiments were performed with EPSCs in BCs mediated by tract stim-ulation of parallel fibers (tEPSCs) recorded in the presence of 1 mM
kynurenic acid in the ACSF (see Fig. 2H ).The distributions of failures and successes expected from the MPFA
were superimposed on histograms of the charges recorded at the differ-ent Ca 2� concentrations (see Fig. 2C,F ). The distributions were calcu-lated from the estimated N, q, and pr values by (1) rounding N to thenearest integer, (2) setting the SD of failures to that of visually identifiedfailures, (3) estimating the SD of single-quanta responses from a Gauss-ian fit to the binned charges around q, and (4) assuming that the meanand SD of multiquantal responses scale linearly with the number of re-leased quanta.
For calcium buffer application experiments, EGTA-AM or BAPTA-AM(Invitrogen) dissolved in DMSO was aliquoted and stored at �20°C. Im-mediately before experiments, the aliquots were diluted in ACSF to theirfinal concentration. Parallel fiber-mediated tEPSCs in BCs were recordedevery 5 s.
For quantifying vesicle replenishment, uEPSCs were recorded fromBCs during train stimulation (30 pulses, at 100 Hz, 5 min interval) inpresynaptic GCs.
Ca2� imaging. GCs were held in the whole-cell configuration incurrent-clamp mode. The intracellular solution consisted of the follow-ing (in mM): 150 K-gluconate, 10 NaCl, 3 ATP-Mg, 0.3 GTP-Na, 10HEPES, and 0.1 Oregon Green BAPTA-1 (OGB-1; Invitrogen). Imagingexperiments were performed 20 – 40 min after the establishment of thewhole-cell configuration. Single APs were generated by somatic currentinjection (200 – 400 pA for 1 ms), and AP-mediated presynaptic Ca 2�
transients were measured from individual boutons of GC axons in thepoint mode with a custom-build two-photon microscope that consists ofa Fluoview 300 scanner (Olympus), a 60�/0.90 numerical aperture (NA)objective, and a mode-locked titanium:sapphire laser (Spectra-Physics;set to a central wavelength of 810 nm). Fluorescence signals were re-corded at 500 kHz with an external photomultiplier tube module(Hamamatsu) and digitized via the Fluoview scanner. Fluorescence sig-nals were temporally binned to 500 Hz, background corrected, and rep-resented as F/F0 values.
Immunohistochemistry. Mice were killed at postnatal day 20 by decap-itation under isoflurane anesthesia. Brains were removed and rapidlyfrozen in isopentane cooled to �35°C. Sagittal sections (20 �m thick)through the cerebellum were made at the cryostat and thaw-mounted onSuperfrost slides. To ensure comparable fixation and labeling conditionsbetween genotypes, sections from Munc13-1– enhanced yellow fluores-cent protein (EYFP; Kalla et al., 2006) and Munc13-3–EGFP (Cooper etal., 2012) mice were collected on each slide, air dried for 15 min, andimmersion fixed in ice-cold 4% paraformaldehyde solution (4% PFA in
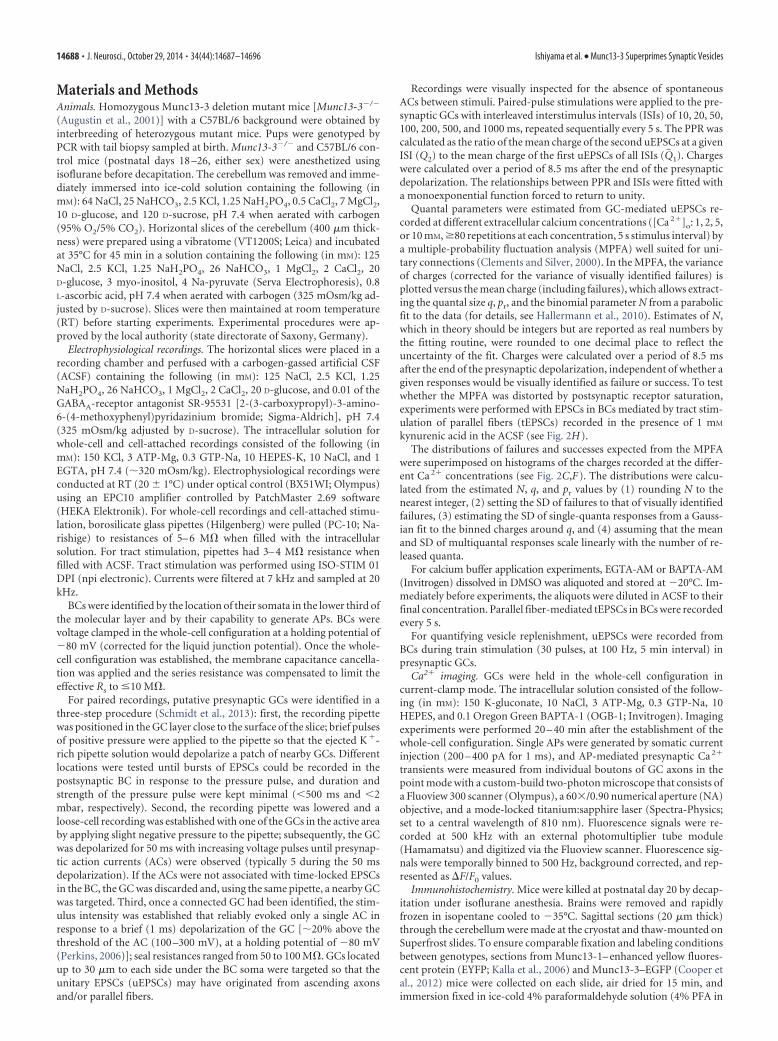
14688 • J. Neurosci., October 29, 2014 • 34(44):14687–14696 Ishiyama et al. • Munc13-3 Superprimes Synaptic Vesicles
0.1 M PB, pH 7.4) for 5 min at RT. Sections were incubated 90 min at RTin blocking solution (0.1 M PB, 5% normal goat serum, 0.1% cold-waterfish skin gelatin, and 0.5% Triton X-100, pH 7.4) and then overnight at4°C with primary antibodies (monoclonal rabbit anti-GFP, Invitrogencatalog #G10362, 1:20; monoclonal mouse anti-bassoon, Enzo Life Sci-ences catalog #SAP7F407) diluted in incubation buffer (0.1 M PB, 3%normal goat serum, 0.1% cold-water fish skin gelatin, and 0.3% TritonX-100, pH 7.4). Slides were washed extensively in PB and then incubated2 h at RT in the dark with fluorescent secondary antibodies (Alexa Fluor488-coupled goat anti-rabbit; Alexa Fluor 555-coupled goat anti-mouse;Alexa Fluor 633 goat anti-chicken; Invitrogen; 1:2000) diluted in incu-bation buffer. Coverslips were mounted on slides with Aqua-PolyMount(Polysciences).
Confocal laser scanning micrographs were acquired with a Leica TCS-SP5 confocal microscope equipped with a tunable white light laser andhybrid gallium/arsenic/phosphorus detectors. Single-plane images ofMunc13 and bassoon immunolabeling were acquired in sequential scan-ning mode using an HCX PL APO CS 100�, 1.4 NA oil-immersionobjective corrected for coverslip thickness and a 6� zoom, resulting inpixel dimensions of 50.6 nm (x and y). Laser power and detector gainswere optimized to ensure that all signals collected were in the linear rangeof detection. Individual micrographs were tiled throughout the cerebel-lar molecular layer and subsequently merged to provide an overview athigh resolution.
The particle analysis feature of NIH Image J (version 1.47q) was usedto delineate the boundaries of bassoon-immunoreactive active zoneswithin the cerebellar molecular layer, and the mean signal intensity ofbassoon and GFP signals within the constraints of the active zones weremeasured. Identical parameters were applied to analyze both genotypes.The ratio of Munc13–XFP/bassoon signal intensity (Chen et al., 2013)was calculated for each pixel within the delineated active zone for creat-ing ratio images (see Fig. 4 A, B) or averaged per active zone for statisticalanalysis (see Fig. 4C).
The Colocalization plugin of NIH Image J was used to detect sites ofcolocalization between Munc13-1 and Bassoon (see Fig. 4D). Two signalswere considered colocalized if their respective channel intensities ex-ceeded an arbitrary threshold (set to 40 for both channels) and the ratioof pixel intensities for both channels exceeded 50%. The number ofindividual colocalized sites was divided by either the total number ofBassoon puncta to estimate the relative proportion of active zones exhib-iting colocalization with respective Munc13–XFPs or the total number ofMunc13–XFP puncta to estimate the relative specificity with which re-spective Munc13–XFPs are localized to Bassoon-positive active zones inthe cerebellar molecular layer. This analysis was repeated with horizon-tally flipped Bassoon images to estimate the contribution of incidentalcolocalization (Lipstein et al., 2013).
Statistical analysis. Normally distributed data (tested by Shapiro–Wilktest) are given as mean � SEM; intergroup comparisons were performedwith Student’s t test. Data with non-normal distribution are given asmedian and interquartile ranges (IQRs); comparisons were done by Wi-lcoxon’s rank-sum (Wrs) test. For comparisons of PPR, two-wayrepeated-measures ANOVA was used. The levels of significance are rep-resented as *p � 0.05, **p � 0.01, and ***p � 0.001; n refers to samplesize. Data were analyzed with Igor Pro 6.22A (Wavemetrics), and statis-tical tests were performed using SigmaPlot 11 (Systat Software).
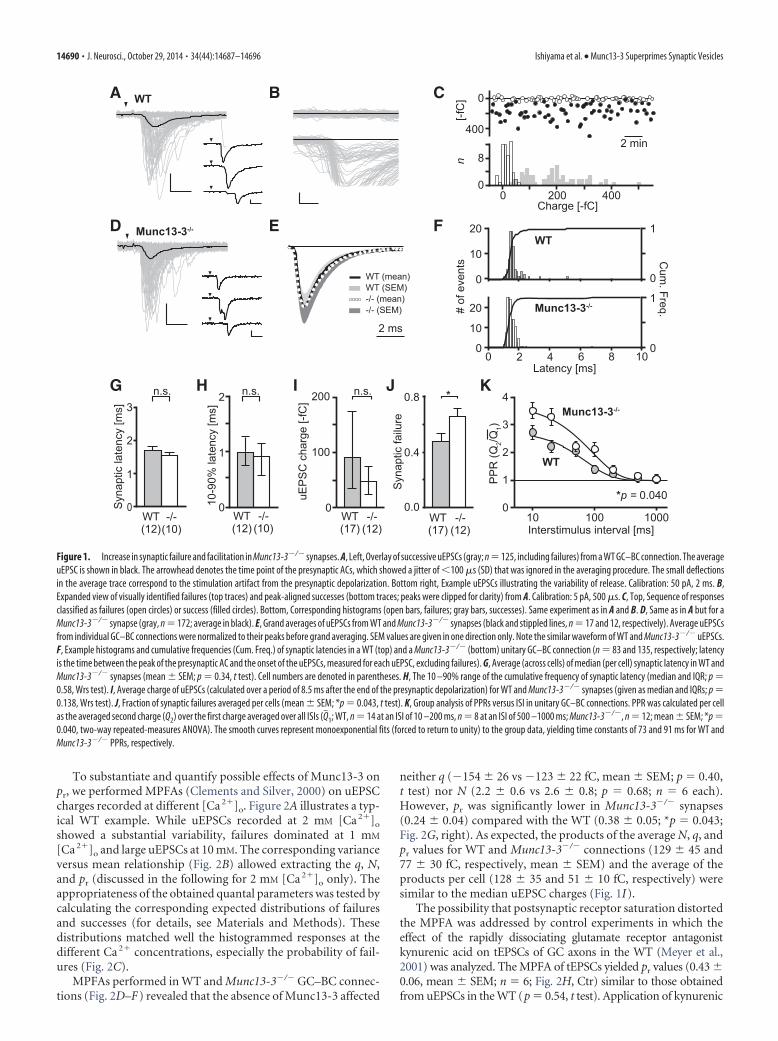
ResultsEPSCs were recorded in cerebellar BCs, whereas single presynap-tic GCs were stimulated in the cell-attached configuration. Thisconfiguration allowed for recording uEPSCs evoked by singlepresynaptic APs (Barbour, 1993). In the WT, individual uEPSCsshowed rapid kinetics and a substantial variability in amplitude,synchronicity, and success in release (Fig. 1A). The low degree ofsynchronicity was not attributable to temporal imprecision of APtiming in the presynaptic GCs, which showed a jitter (SD) of�100 �s per cell (81 � 16 �s, mean � SEM; n 12 cells).Instead, it was most likely attributable to the kinetics of the re-lease machinery, which lead to release over several hundred mil-
liseconds even after a single AP (Trigo et al., 2012; Schmidt et al.,2013). Synaptic responses could readily be visually classified asfailures or successes (Fig. 1B), with typically �2% ambiguousresponses. The uEPSC charges showed a substantial (Fig. 1C,bottom) but stable scattering (Fig. 1C, top), with no indication ofrecruitment of silent synapses during the recording periods (Red-man, 1990).
In unitary connections from Munc13-3�/� mice, similar syn-aptic characteristics were observed (Fig. 1D). Temporal impreci-sion of presynaptic APs was again negligible (120 � 32 �s, n 10;p 0.25 compared with the WT, t test). Average uEPSCs (Fig.1A,D, black traces) showed similar kinetics in all WT andMunc13-3�/� connections. Values for 10 –90% rise and decaytimes were 0.61 ms (0.45– 0.84 ms) and 2.60 ms (2.42–3.77 ms)for WT (medians and IQRs; n 14) and 0.54 ms (0.50 – 0.73 ms)and 2.40 ms (1.88 –3.78 ms) for Munc13-3�/� (n 12), respec-tively (rise times, p 0.82; decay times, p 0.40; Wrs test).Correspondingly, the grand average WT and Munc13-3�/�
uEPSCs were indistinguishable when normalized to their peaks(Fig. 1E). We next quantified synaptic latencies as the time be-tween presynaptic APs and the onset of uEPSCs in WT andMunc13-3�/� synapses (Fig. 1F). On average, both the medianlatency (Fig. 1G; WT, 1.69 � 0.11 ms, n 12 and Munc13-3�/�,1.55 � 0.09 ms, n 10, mean � SEM) and the 10 –90% range[Fig. 1H; WT, 0.99 ms (0.75–1.33 ms) and Munc13-3�/�, 0.91 ms(0.58 –1.25 ms)] were not different between the strains (p 0.34,t test and p 0.58, Wrs test, respectively). These data indicatethat the absence of Munc13-3 does not affect the time course ofvesicular release.
In contrast to the kinetics, the averaged charge of uEPSCs(including failures) in Munc13-3�/� synapses [�63 fC (�22 to�77 fC), n 12] was smaller compared with the WT [�89 fC(�33 to �192 fC), n 17; Figure 1I]. However, this differencedid not reach the level of significance (p 0.14, Wrs test), pre-sumably because of the substantial scatter of average responsesacross cells. Similarly, the average peak amplitudes of uEPSCswere not different between WT and Munc13-3�/� synapses[�356 pA (�156 to �1030 pA), n 17 and �251 pA (�87 to�361 pA), n 12, respectively; p 0.088, Wrs test]. Conversely,the fraction of synaptic failures was significantly larger inMunc13-3�/� compared with WT connections (0.66 � 0.06, n 12 vs 0.48 � 0.06, n 17, respectively, mean � SEM; *p 0.043,t test; Fig. 1J), indicating that either pr or the number of releasesites are decreased in Munc13-3�/� synapses.
Evidence for a Munc13-3-dependent effect on pr had beenobtained previously by analyzing EPSCs evoked by tract stimula-tion of bundles of GC axons (tEPSCs) in BCs (Bao et al., 2010),Golgi cells (Beierlein et al., 2007), and Purkinje cells (PCs) (Au-gustin et al., 2001; Beierlein et al., 2007; but see Bao et al., 2010).For these GC connections, an increase in paired-pulse facilitation(PPF) was observed in Munc13-3�/� mice. We reexamined thisfinding at unitary GC–BC connections with paired presynapticstimulations applied at different ISIs (Fig. 1K). To minimize theeffect of synaptic jitter, PPRs were calculated as the average chargeof the second uEPSCs at each ISI divided by the charge of the firstuEPSCs averaged over all ISIs. Both, WT and Munc13-3�/� synapsesdisplayed a strong facilitation at short ISIs that decreased to unity atintervals of 500 –1000 ms. At an ISI of 10 ms, PPR was 2.7 � 0.2(mean � SEM, n 14) in the WT but 3.5 � 0.3 (n 12) inMunc13-3�/� mice, values in good agreement with the previousstudies. The increased facilitation was statistically significant(*p 0.04, two-way repeated-measures ANOVA).
Ishiyama et al. • Munc13-3 Superprimes Synaptic Vesicles J. Neurosci., October 29, 2014 • 34(44):14687–14696 • 14689
To substantiate and quantify possible effects of Munc13-3 onpr, we performed MPFAs (Clements and Silver, 2000) on uEPSCcharges recorded at different [Ca 2�]o. Figure 2A illustrates a typ-ical WT example. While uEPSCs recorded at 2 mM [Ca 2�]o
showed a substantial variability, failures dominated at 1 mM
[Ca 2�]o and large uEPSCs at 10 mM. The corresponding varianceversus mean relationship (Fig. 2B) allowed extracting the q, N,and pr (discussed in the following for 2 mM [Ca 2�]o only). Theappropriateness of the obtained quantal parameters was tested bycalculating the corresponding expected distributions of failuresand successes (for details, see Materials and Methods). Thesedistributions matched well the histogrammed responses at thedifferent Ca 2� concentrations, especially the probability of fail-ures (Fig. 2C).
MPFAs performed in WT and Munc13-3�/� GC–BC connec-tions (Fig. 2D–F) revealed that the absence of Munc13-3 affected
neither q (�154 � 26 vs �123 � 22 fC, mean � SEM; p 0.40,t test) nor N (2.2 � 0.6 vs 2.6 � 0.8; p 0.68; n 6 each).However, pr was significantly lower in Munc13-3�/� synapses(0.24 � 0.04) compared with the WT (0.38 � 0.05; *p 0.043;Fig. 2G, right). As expected, the products of the average N, q, andpr values for WT and Munc13-3�/� connections (129 � 45 and77 � 30 fC, respectively, mean � SEM) and the average of theproducts per cell (128 � 35 and 51 � 10 fC, respectively) weresimilar to the median uEPSC charges (Fig. 1I).
The possibility that postsynaptic receptor saturation distortedthe MPFA was addressed by control experiments in which theeffect of the rapidly dissociating glutamate receptor antagonistkynurenic acid on tEPSCs of GC axons in the WT (Meyer et al.,2001) was analyzed. The MPFA of tEPSCs yielded pr values (0.43 �0.06, mean � SEM; n 6; Fig. 2H, Ctr) similar to those obtainedfrom uEPSCs in the WT (p 0.54, t test). Application of kynurenic
A B C
D E F
G H I J K
Figure 1. Increase in synaptic failure and facilitation in Munc13-3�/� synapses. A, Left, Overlay of successive uEPSCs (gray; n125, including failures) from a WT GC–BC connection. The averageuEPSC is shown in black. The arrowhead denotes the time point of the presynaptic ACs, which showed a jitter of �100 �s (SD) that was ignored in the averaging procedure. The small deflectionsin the average trace correspond to the stimulation artifact from the presynaptic depolarization. Bottom right, Example uEPSCs illustrating the variability of release. Calibration: 50 pA, 2 ms. B,Expanded view of visually identified failures (top traces) and peak-aligned successes (bottom traces; peaks were clipped for clarity) from A. Calibration: 5 pA, 500 �s. C, Top, Sequence of responsesclassified as failures (open circles) or success (filled circles). Bottom, Corresponding histograms (open bars, failures; gray bars, successes). Same experiment as in A and B. D, Same as in A but for aMunc13-3�/� synapse (gray, n 172; average in black). E, Grand averages of uEPSCs from WT and Munc13-3�/� synapses (black and stippled lines, n 17 and 12, respectively). Average uEPSCsfrom individual GC–BC connections were normalized to their peaks before grand averaging. SEM values are given in one direction only. Note the similar waveform of WT and Munc13-3�/� uEPSCs.F, Example histograms and cumulative frequencies (Cum. Freq.) of synaptic latencies in a WT (top) and a Munc13-3�/� (bottom) unitary GC–BC connection (n 83 and 135, respectively; latencyis the time between the peak of the presynaptic AC and the onset of the uEPSCs, measured for each uEPSC, excluding failures). G, Average (across cells) of median (per cell) synaptic latency in WT andMunc13-3�/� synapses (mean � SEM; p 0.34, t test). Cell numbers are denoted in parentheses. H, The 10 –90% range of the cumulative frequency of synaptic latency (median and IQR; p 0.58, Wrs test). I, Average charge of uEPSCs (calculated over a period of 8.5 ms after the end of the presynaptic depolarization) for WT and Munc13-3�/� synapses (given as median and IQRs; p 0.138, Wrs test). J, Fraction of synaptic failures averaged per cells (mean � SEM; *p 0.043, t test). K, Group analysis of PPRs versus ISI in unitary GC–BC connections. PPR was calculated per cellas the averaged second charge (Q2) over the first charge averaged over all ISIs (Q�1; WT, n 14 at an ISI of 10 –200 ms, n 8 at an ISI of 500 –1000 ms; Munc13-3�/�, n 12; mean � SEM; *p 0.040, two-way repeated-measures ANOVA). The smooth curves represent monoexponential fits (forced to return to unity) to the group data, yielding time constants of 73 and 91 ms for WT andMunc13-3�/� PPRs, respectively.
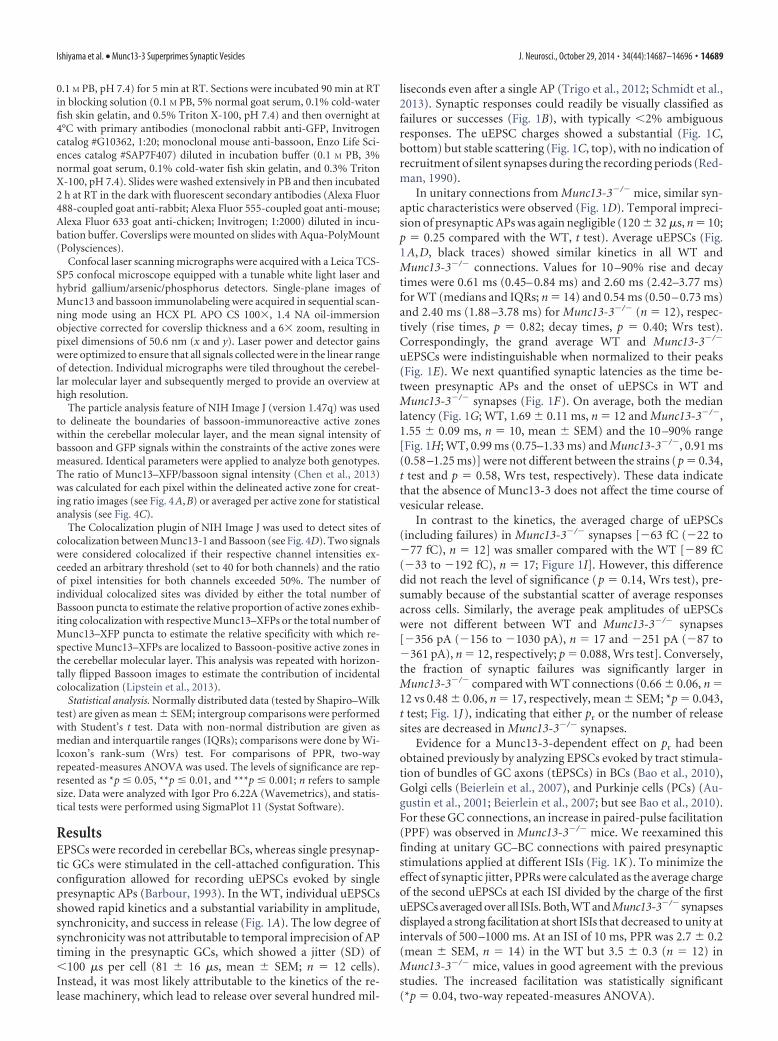
14690 • J. Neurosci., October 29, 2014 • 34(44):14687–14696 Ishiyama et al. • Munc13-3 Superprimes Synaptic Vesicles
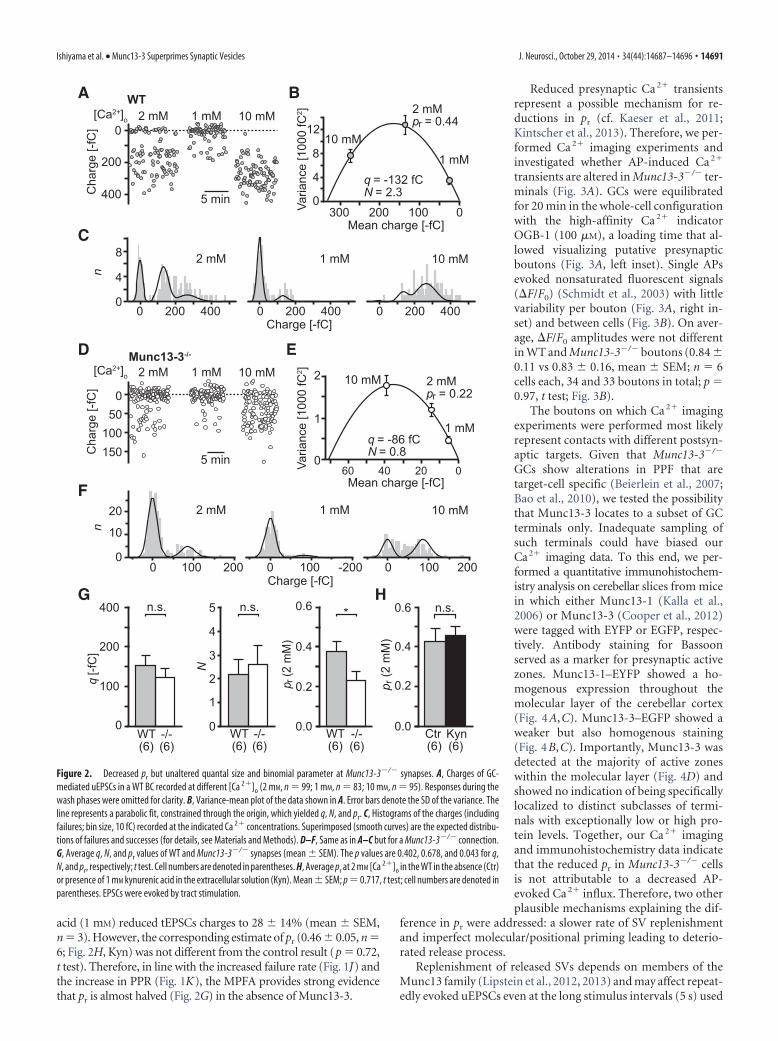
acid (1 mM) reduced tEPSCs charges to 28 � 14% (mean � SEM,n 3). However, the corresponding estimate of pr (0.46 � 0.05, n 6; Fig. 2H, Kyn) was not different from the control result (p 0.72,t test). Therefore, in line with the increased failure rate (Fig. 1J) andthe increase in PPR (Fig. 1K), the MPFA provides strong evidencethat pr is almost halved (Fig. 2G) in the absence of Munc13-3.
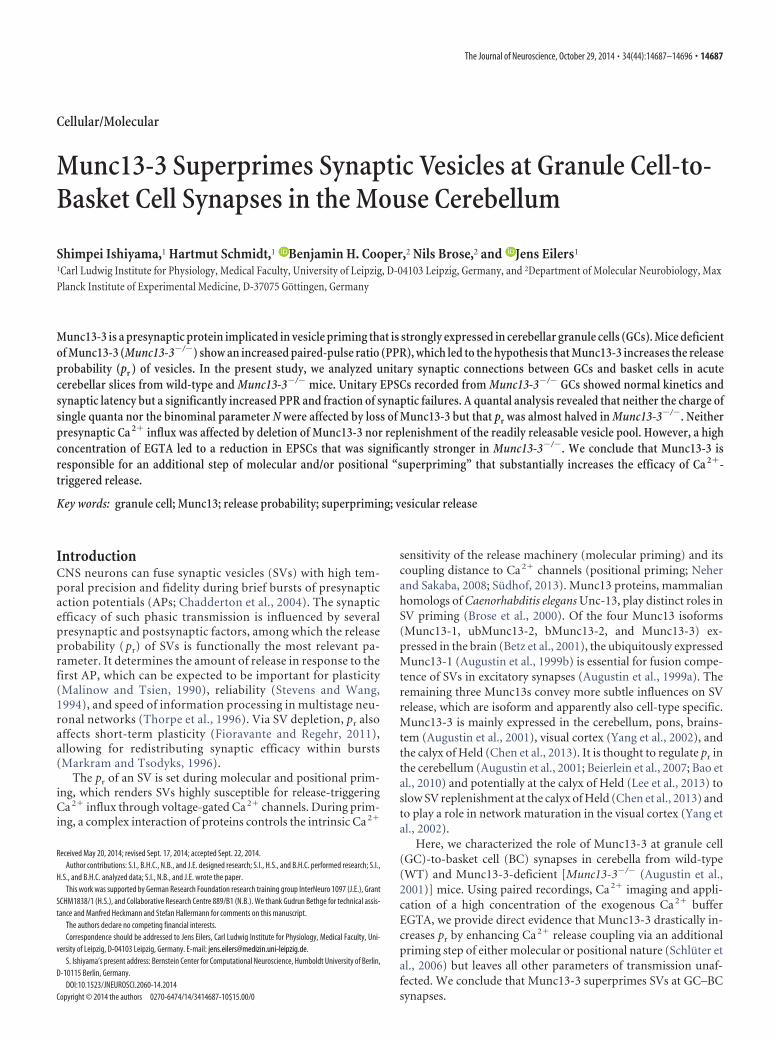
Reduced presynaptic Ca 2� transientsrepresent a possible mechanism for re-ductions in pr (cf. Kaeser et al., 2011;Kintscher et al., 2013). Therefore, we per-formed Ca 2� imaging experiments andinvestigated whether AP-induced Ca 2�
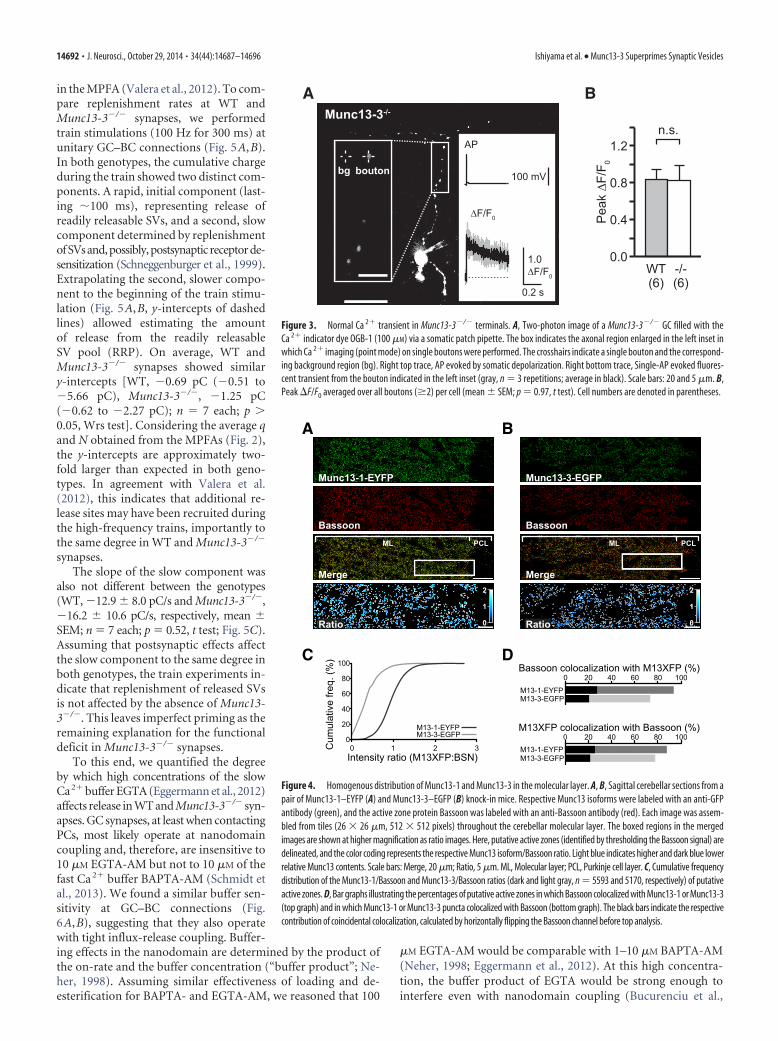
transients are altered in Munc13-3�/� ter-minals (Fig. 3A). GCs were equilibratedfor 20 min in the whole-cell configurationwith the high-affinity Ca 2� indicatorOGB-1 (100 �M), a loading time that al-lowed visualizing putative presynapticboutons (Fig. 3A, left inset). Single APsevoked nonsaturated fluorescent signals(F/F0) (Schmidt et al., 2003) with littlevariability per bouton (Fig. 3A, right in-set) and between cells (Fig. 3B). On aver-age, F/F0 amplitudes were not differentin WT and Munc13-3�/� boutons (0.84 �0.11 vs 0.83 � 0.16, mean � SEM; n 6cells each, 34 and 33 boutons in total; p 0.97, t test; Fig. 3B).
The boutons on which Ca 2� imagingexperiments were performed most likelyrepresent contacts with different postsyn-aptic targets. Given that Munc13-3�/�
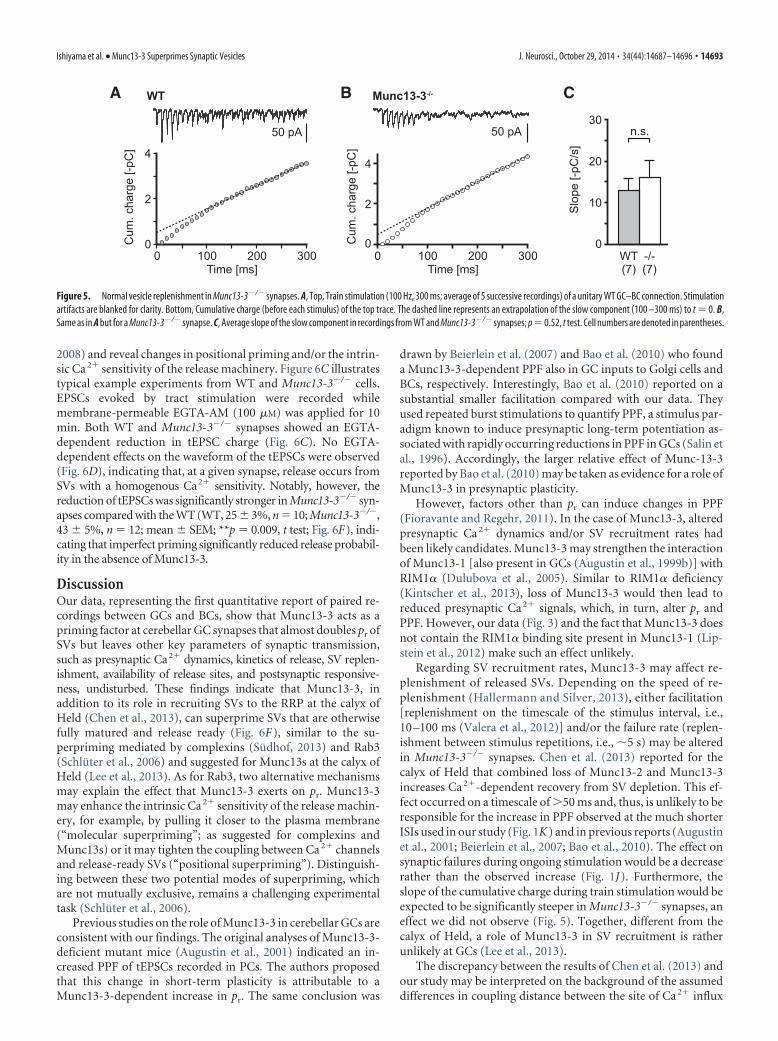
GCs show alterations in PPF that aretarget-cell specific (Beierlein et al., 2007;Bao et al., 2010), we tested the possibilitythat Munc13-3 locates to a subset of GCterminals only. Inadequate sampling ofsuch terminals could have biased ourCa2� imaging data. To this end, we per-formed a quantitative immunohistochem-istry analysis on cerebellar slices from micein which either Munc13-1 (Kalla et al.,2006) or Munc13-3 (Cooper et al., 2012)were tagged with EYFP or EGFP, respec-tively. Antibody staining for Bassoonserved as a marker for presynaptic activezones. Munc13-1–EYFP showed a ho-mogenous expression throughout themolecular layer of the cerebellar cortex(Fig. 4A,C). Munc13-3–EGFP showed aweaker but also homogenous staining(Fig. 4B,C). Importantly, Munc13-3 wasdetected at the majority of active zoneswithin the molecular layer (Fig. 4D) andshowed no indication of being specificallylocalized to distinct subclasses of termi-nals with exceptionally low or high pro-tein levels. Together, our Ca 2� imagingand immunohistochemistry data indicatethat the reduced pr in Munc13-3�/� cellsis not attributable to a decreased AP-evoked Ca 2� influx. Therefore, two otherplausible mechanisms explaining the dif-
ference in pr were addressed: a slower rate of SV replenishmentand imperfect molecular/positional priming leading to deterio-rated release process.
Replenishment of released SVs depends on members of theMunc13 family (Lipstein et al., 2012, 2013) and may affect repeat-edly evoked uEPSCs even at the long stimulus intervals (5 s) used
A B
C
D E
F
G H
Figure 2. Decreased pr but unaltered quantal size and binomial parameter at Munc13-3�/� synapses. A, Charges of GC-mediated uEPSCs in a WT BC recorded at different [Ca 2�]o (2 mM, n 99; 1 mM, n 83; 10 mM, n 95). Responses during thewash phases were omitted for clarity. B, Variance-mean plot of the data shown in A. Error bars denote the SD of the variance. Theline represents a parabolic fit, constrained through the origin, which yielded q, N, and pr. C, Histograms of the charges (includingfailures; bin size, 10 fC) recorded at the indicated Ca 2� concentrations. Superimposed (smooth curves) are the expected distribu-tions of failures and successes (for details, see Materials and Methods). D–F, Same as in A–C but for a Munc13-3�/� connection.G, Average q, N, and pr values of WT and Munc13-3�/� synapses (mean � SEM). The p values are 0.402, 0.678, and 0.043 for q,N, and pr, respectively; t test. Cell numbers are denoted in parentheses. H, Average pr at 2 mM [Ca 2�]o in the WT in the absence (Ctr)or presence of 1 mM kynurenic acid in the extracellular solution (Kyn). Mean � SEM; p 0.717, t test; cell numbers are denoted inparentheses. EPSCs were evoked by tract stimulation.
Ishiyama et al. • Munc13-3 Superprimes Synaptic Vesicles J. Neurosci., October 29, 2014 • 34(44):14687–14696 • 14691
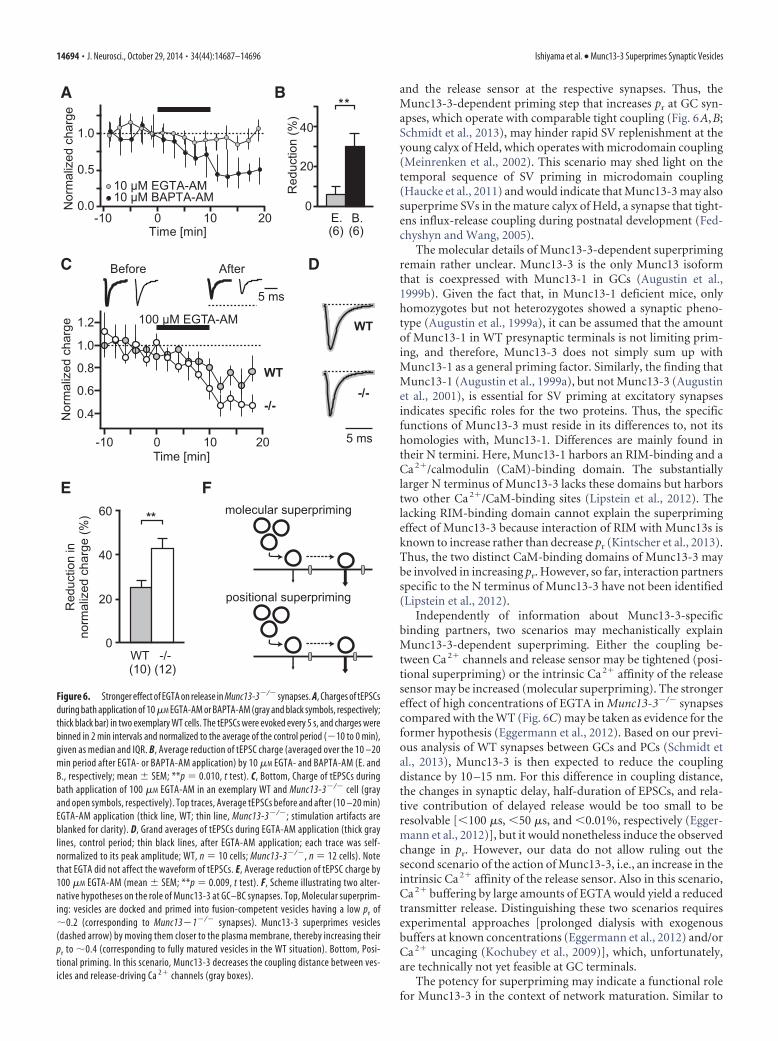
in the MPFA (Valera et al., 2012). To com-pare replenishment rates at WT andMunc13-3�/� synapses, we performedtrain stimulations (100 Hz for 300 ms) atunitary GC–BC connections (Fig. 5A,B).In both genotypes, the cumulative chargeduring the train showed two distinct com-ponents. A rapid, initial component (last-ing �100 ms), representing release ofreadily releasable SVs, and a second, slowcomponent determined by replenishmentofSVsand,possibly,postsynaptic receptorde-sensitization (Schneggenburger et al., 1999).Extrapolating the second, slower compo-nent to the beginning of the train stimu-lation (Fig. 5A,B, y-intercepts of dashedlines) allowed estimating the amountof release from the readily releasableSV pool (RRP). On average, WT andMunc13-3�/� synapses showed similary-intercepts [WT, �0.69 pC (�0.51 to�5.66 pC), Munc13-3�/�, �1.25 pC(�0.62 to �2.27 pC); n 7 each; p �0.05, Wrs test]. Considering the average qand N obtained from the MPFAs (Fig. 2),the y-intercepts are approximately two-fold larger than expected in both geno-types. In agreement with Valera et al.(2012), this indicates that additional re-lease sites may have been recruited duringthe high-frequency trains, importantly tothe same degree in WT and Munc13-3�/�
synapses.The slope of the slow component was
also not different between the genotypes(WT, �12.9 � 8.0 pC/s and Munc13-3�/�,�16.2 � 10.6 pC/s, respectively, mean �SEM; n 7 each; p 0.52, t test; Fig. 5C).Assuming that postsynaptic effects affectthe slow component to the same degree inboth genotypes, the train experiments in-dicate that replenishment of released SVsis not affected by the absence of Munc13-3�/�. This leaves imperfect priming as theremaining explanation for the functionaldeficit in Munc13-3�/� synapses.
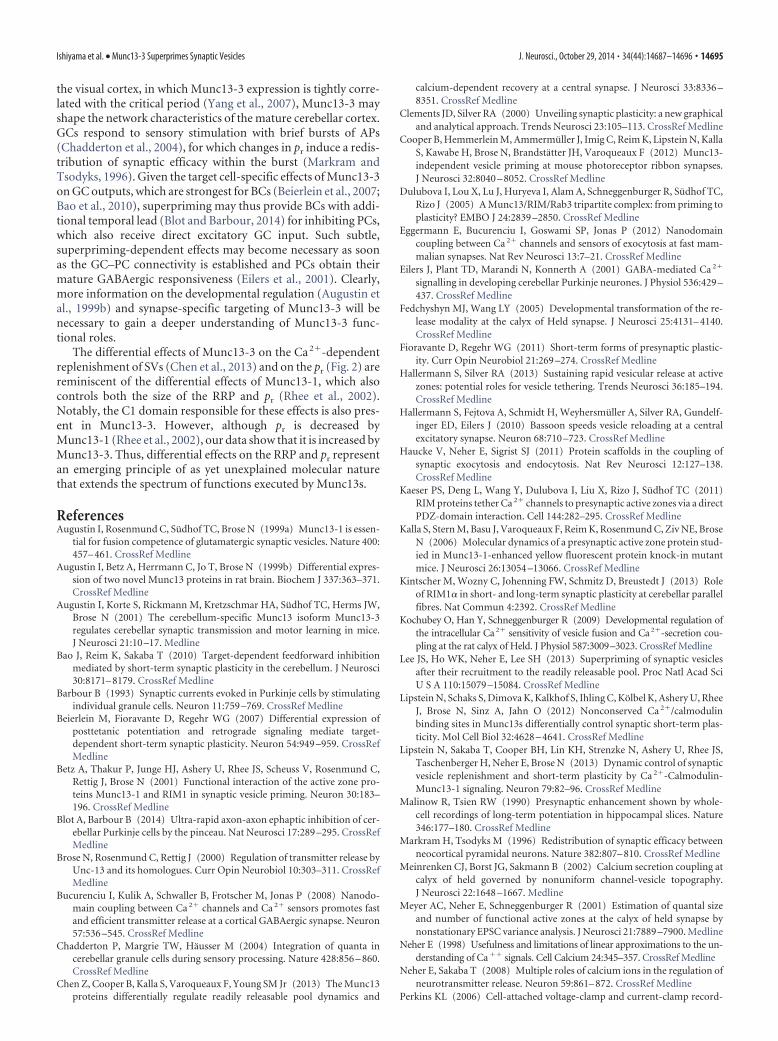
To this end, we quantified the degreeby which high concentrations of the slowCa2� buffer EGTA (Eggermann et al., 2012)affects release in WT and Munc13-3�/� syn-apses. GC synapses, at least when contactingPCs, most likely operate at nanodomaincoupling and, therefore, are insensitive to10 �M EGTA-AM but not to 10 �M of thefast Ca 2� buffer BAPTA-AM (Schmidt etal., 2013). We found a similar buffer sen-sitivity at GC–BC connections (Fig.6A,B), suggesting that they also operatewith tight influx-release coupling. Buffer-ing effects in the nanodomain are determined by the product ofthe on-rate and the buffer concentration (“buffer product”; Ne-her, 1998). Assuming similar effectiveness of loading and de-esterification for BAPTA- and EGTA-AM, we reasoned that 100
�M EGTA-AM would be comparable with 1–10 �M BAPTA-AM(Neher, 1998; Eggermann et al., 2012). At this high concentra-tion, the buffer product of EGTA would be strong enough tointerfere even with nanodomain coupling (Bucurenciu et al.,
A B
Figure 3. Normal Ca 2� transient in Munc13-3�/� terminals. A, Two-photon image of a Munc13-3�/� GC filled with theCa 2� indicator dye OGB-1 (100 �M) via a somatic patch pipette. The box indicates the axonal region enlarged in the left inset inwhich Ca 2� imaging (point mode) on single boutons were performed. The crosshairs indicate a single bouton and the correspond-ing background region (bg). Right top trace, AP evoked by somatic depolarization. Right bottom trace, Single-AP evoked fluores-cent transient from the bouton indicated in the left inset (gray, n 3 repetitions; average in black). Scale bars: 20 and 5 �m. B,Peak F/F0 averaged over all boutons (�2) per cell (mean � SEM; p 0.97, t test). Cell numbers are denoted in parentheses.
A B
C D
Figure 4. Homogenous distribution of Munc13-1 and Munc13-3 in the molecular layer. A, B, Sagittal cerebellar sections from apair of Munc13-1–EYFP (A) and Munc13-3–EGFP (B) knock-in mice. Respective Munc13 isoforms were labeled with an anti-GFPantibody (green), and the active zone protein Bassoon was labeled with an anti-Bassoon antibody (red). Each image was assem-bled from tiles (26 � 26 �m, 512 � 512 pixels) throughout the cerebellar molecular layer. The boxed regions in the mergedimages are shown at higher magnification as ratio images. Here, putative active zones (identified by thresholding the Bassoon signal) aredelineated, and the color coding represents the respective Munc13 isoform/Bassoon ratio. Light blue indicates higher and dark blue lowerrelative Munc13 contents. Scale bars: Merge, 20 �m; Ratio, 5 �m. ML, Molecular layer; PCL, Purkinje cell layer. C, Cumulative frequencydistribution of the Munc13-1/Bassoon and Munc13-3/Bassoon ratios (dark and light gray, n 5593 and 5170, respectively) of putativeactive zones. D, Bar graphs illustrating the percentages of putative active zones in which Bassoon colocalized with Munc13-1 or Munc13-3(top graph) and in which Munc13-1 or Munc13-3 puncta colocalized with Bassoon (bottom graph). The black bars indicate the respectivecontribution of coincidental colocalization, calculated by horizontally flipping the Bassoon channel before top analysis.
14692 • J. Neurosci., October 29, 2014 • 34(44):14687–14696 Ishiyama et al. • Munc13-3 Superprimes Synaptic Vesicles
2008) and reveal changes in positional priming and/or the intrin-sic Ca 2� sensitivity of the release machinery. Figure 6C illustratestypical example experiments from WT and Munc13-3�/� cells.EPSCs evoked by tract stimulation were recorded whilemembrane-permeable EGTA-AM (100 �M) was applied for 10min. Both WT and Munc13-3�/� synapses showed an EGTA-dependent reduction in tEPSC charge (Fig. 6C). No EGTA-dependent effects on the waveform of the tEPSCs were observed(Fig. 6D), indicating that, at a given synapse, release occurs fromSVs with a homogenous Ca2� sensitivity. Notably, however, thereduction of tEPSCs was significantly stronger in Munc13-3�/� syn-apses compared with the WT (WT, 25 � 3%, n 10; Munc13-3�/�,43 � 5%, n 12; mean � SEM; **p 0.009, t test; Fig. 6F), indi-cating that imperfect priming significantly reduced release probabil-ity in the absence of Munc13-3.
DiscussionOur data, representing the first quantitative report of paired re-cordings between GCs and BCs, show that Munc13-3 acts as apriming factor at cerebellar GC synapses that almost doubles pr ofSVs but leaves other key parameters of synaptic transmission,such as presynaptic Ca2� dynamics, kinetics of release, SV replen-ishment, availability of release sites, and postsynaptic responsive-ness, undisturbed. These findings indicate that Munc13-3, inaddition to its role in recruiting SVs to the RRP at the calyx ofHeld (Chen et al., 2013), can superprime SVs that are otherwisefully matured and release ready (Fig. 6F), similar to the su-perpriming mediated by complexins (Sudhof, 2013) and Rab3(Schluter et al., 2006) and suggested for Munc13s at the calyx ofHeld (Lee et al., 2013). As for Rab3, two alternative mechanismsmay explain the effect that Munc13-3 exerts on pr. Munc13-3may enhance the intrinsic Ca 2� sensitivity of the release machin-ery, for example, by pulling it closer to the plasma membrane(“molecular superpriming”; as suggested for complexins andMunc13s) or it may tighten the coupling between Ca 2� channelsand release-ready SVs (“positional superpriming”). Distinguish-ing between these two potential modes of superpriming, whichare not mutually exclusive, remains a challenging experimentaltask (Schluter et al., 2006).
Previous studies on the role of Munc13-3 in cerebellar GCs areconsistent with our findings. The original analyses of Munc13-3-deficient mutant mice (Augustin et al., 2001) indicated an in-creased PPF of tEPSCs recorded in PCs. The authors proposedthat this change in short-term plasticity is attributable to aMunc13-3-dependent increase in pr. The same conclusion was
drawn by Beierlein et al. (2007) and Bao et al. (2010) who founda Munc13-3-dependent PPF also in GC inputs to Golgi cells andBCs, respectively. Interestingly, Bao et al. (2010) reported on asubstantial smaller facilitation compared with our data. Theyused repeated burst stimulations to quantify PPF, a stimulus par-adigm known to induce presynaptic long-term potentiation as-sociated with rapidly occurring reductions in PPF in GCs (Salin etal., 1996). Accordingly, the larger relative effect of Munc-13-3reported by Bao et al. (2010) may be taken as evidence for a role ofMunc13-3 in presynaptic plasticity.
However, factors other than pr can induce changes in PPF(Fioravante and Regehr, 2011). In the case of Munc13-3, alteredpresynaptic Ca 2� dynamics and/or SV recruitment rates hadbeen likely candidates. Munc13-3 may strengthen the interactionof Munc13-1 [also present in GCs (Augustin et al., 1999b)] withRIM1� (Dulubova et al., 2005). Similar to RIM1� deficiency(Kintscher et al., 2013), loss of Munc13-3 would then lead toreduced presynaptic Ca 2� signals, which, in turn, alter pr andPPF. However, our data (Fig. 3) and the fact that Munc13-3 doesnot contain the RIM1� binding site present in Munc13-1 (Lip-stein et al., 2012) make such an effect unlikely.
Regarding SV recruitment rates, Munc13-3 may affect re-plenishment of released SVs. Depending on the speed of re-plenishment (Hallermann and Silver, 2013), either facilitation[replenishment on the timescale of the stimulus interval, i.e.,10 –100 ms (Valera et al., 2012)] and/or the failure rate (replen-ishment between stimulus repetitions, i.e., �5 s) may be alteredin Munc13-3�/� synapses. Chen et al. (2013) reported for thecalyx of Held that combined loss of Munc13-2 and Munc13-3increases Ca 2�-dependent recovery from SV depletion. This ef-fect occurred on a timescale of �50 ms and, thus, is unlikely to beresponsible for the increase in PPF observed at the much shorterISIs used in our study (Fig. 1K) and in previous reports (Augustinet al., 2001; Beierlein et al., 2007; Bao et al., 2010). The effect onsynaptic failures during ongoing stimulation would be a decreaserather than the observed increase (Fig. 1J). Furthermore, theslope of the cumulative charge during train stimulation would beexpected to be significantly steeper in Munc13-3�/� synapses, aneffect we did not observe (Fig. 5). Together, different from thecalyx of Held, a role of Munc13-3 in SV recruitment is ratherunlikely at GCs (Lee et al., 2013).
The discrepancy between the results of Chen et al. (2013) andour study may be interpreted on the background of the assumeddifferences in coupling distance between the site of Ca 2� influx
A B C
Figure 5. Normal vesicle replenishment in Munc13-3�/� synapses. A, Top, Train stimulation (100 Hz, 300 ms; average of 5 successive recordings) of a unitary WT GC–BC connection. Stimulationartifacts are blanked for clarity. Bottom, Cumulative charge (before each stimulus) of the top trace. The dashed line represents an extrapolation of the slow component (100 –300 ms) to t 0. B,Same as in A but for a Munc13-3�/� synapse. C, Average slope of the slow component in recordings from WT and Munc13-3�/� synapses; p 0.52, t test. Cell numbers are denoted in parentheses.
Ishiyama et al. • Munc13-3 Superprimes Synaptic Vesicles J. Neurosci., October 29, 2014 • 34(44):14687–14696 • 14693
and the release sensor at the respective synapses. Thus, theMunc13-3-dependent priming step that increases pr at GC syn-apses, which operate with comparable tight coupling (Fig. 6A,B;Schmidt et al., 2013), may hinder rapid SV replenishment at theyoung calyx of Held, which operates with microdomain coupling(Meinrenken et al., 2002). This scenario may shed light on thetemporal sequence of SV priming in microdomain coupling(Haucke et al., 2011) and would indicate that Munc13-3 may alsosuperprime SVs in the mature calyx of Held, a synapse that tight-ens influx-release coupling during postnatal development (Fed-chyshyn and Wang, 2005).
The molecular details of Munc13-3-dependent superprimingremain rather unclear. Munc13-3 is the only Munc13 isoformthat is coexpressed with Munc13-1 in GCs (Augustin et al.,1999b). Given the fact that, in Munc13-1 deficient mice, onlyhomozygotes but not heterozygotes showed a synaptic pheno-type (Augustin et al., 1999a), it can be assumed that the amountof Munc13-1 in WT presynaptic terminals is not limiting prim-ing, and therefore, Munc13-3 does not simply sum up withMunc13-1 as a general priming factor. Similarly, the finding thatMunc13-1 (Augustin et al., 1999a), but not Munc13-3 (Augustinet al., 2001), is essential for SV priming at excitatory synapsesindicates specific roles for the two proteins. Thus, the specificfunctions of Munc13-3 must reside in its differences to, not itshomologies with, Munc13-1. Differences are mainly found intheir N termini. Here, Munc13-1 harbors an RIM-binding and aCa 2�/calmodulin (CaM)-binding domain. The substantiallylarger N terminus of Munc13-3 lacks these domains but harborstwo other Ca 2�/CaM-binding sites (Lipstein et al., 2012). Thelacking RIM-binding domain cannot explain the superprimingeffect of Munc13-3 because interaction of RIM with Munc13s isknown to increase rather than decrease pr (Kintscher et al., 2013).Thus, the two distinct CaM-binding domains of Munc13-3 maybe involved in increasing pr. However, so far, interaction partnersspecific to the N terminus of Munc13-3 have not been identified(Lipstein et al., 2012).
Independently of information about Munc13-3-specificbinding partners, two scenarios may mechanistically explainMunc13-3-dependent superpriming. Either the coupling be-tween Ca 2� channels and release sensor may be tightened (posi-tional superpriming) or the intrinsic Ca 2� affinity of the releasesensor may be increased (molecular superpriming). The strongereffect of high concentrations of EGTA in Munc13-3�/� synapsescompared with the WT (Fig. 6C) may be taken as evidence for theformer hypothesis (Eggermann et al., 2012). Based on our previ-ous analysis of WT synapses between GCs and PCs (Schmidt etal., 2013), Munc13-3 is then expected to reduce the couplingdistance by 10 –15 nm. For this difference in coupling distance,the changes in synaptic delay, half-duration of EPSCs, and rela-tive contribution of delayed release would be too small to beresolvable [�100 �s, �50 �s, and �0.01%, respectively (Egger-mann et al., 2012)], but it would nonetheless induce the observedchange in pr. However, our data do not allow ruling out thesecond scenario of the action of Munc13-3, i.e., an increase in theintrinsic Ca 2� affinity of the release sensor. Also in this scenario,Ca 2� buffering by large amounts of EGTA would yield a reducedtransmitter release. Distinguishing these two scenarios requiresexperimental approaches [prolonged dialysis with exogenousbuffers at known concentrations (Eggermann et al., 2012) and/orCa 2� uncaging (Kochubey et al., 2009)], which, unfortunately,are technically not yet feasible at GC terminals.
The potency for superpriming may indicate a functional rolefor Munc13-3 in the context of network maturation. Similar to
A B
C D
E F
Figure 6. Stronger effect of EGTA on release in Munc13-3�/� synapses. A, Charges of tEPSCsduring bath application of 10 �M EGTA-AM or BAPTA-AM (gray and black symbols, respectively;thick black bar) in two exemplary WT cells. The tEPSCs were evoked every 5 s, and charges werebinned in 2 min intervals and normalized to the average of the control period (�10 to 0 min),given as median and IQR. B, Average reduction of tEPSC charge (averaged over the 10 –20min period after EGTA- or BAPTA-AM application) by 10 �M EGTA- and BAPTA-AM (E. andB., respectively; mean � SEM; **p 0.010, t test). C, Bottom, Charge of tEPSCs duringbath application of 100 �M EGTA-AM in an exemplary WT and Munc13-3�/� cell (grayand open symbols, respectively). Top traces, Average tEPSCs before and after (10 –20 min)EGTA-AM application (thick line, WT; thin line, Munc13-3�/�; stimulation artifacts areblanked for clarity). D, Grand averages of tEPSCs during EGTA-AM application (thick graylines, control period; thin black lines, after EGTA-AM application; each trace was self-normalized to its peak amplitude; WT, n 10 cells; Munc13-3�/�, n 12 cells). Notethat EGTA did not affect the waveform of tEPSCs. E, Average reduction of tEPSC charge by100 �M EGTA-AM (mean � SEM; **p 0.009, t test). F, Scheme illustrating two alter-native hypotheses on the role of Munc13-3 at GC–BC synapses. Top, Molecular superprim-ing: vesicles are docked and primed into fusion-competent vesicles having a low pr of�0.2 (corresponding to Munc13�1�/� synapses). Munc13-3 superprimes vesicles(dashed arrow) by moving them closer to the plasma membrane, thereby increasing theirpr to �0.4 (corresponding to fully matured vesicles in the WT situation). Bottom, Posi-tional priming. In this scenario, Munc13-3 decreases the coupling distance between ves-icles and release-driving Ca 2� channels (gray boxes).
14694 • J. Neurosci., October 29, 2014 • 34(44):14687–14696 Ishiyama et al. • Munc13-3 Superprimes Synaptic Vesicles
the visual cortex, in which Munc13-3 expression is tightly corre-lated with the critical period (Yang et al., 2007), Munc13-3 mayshape the network characteristics of the mature cerebellar cortex.GCs respond to sensory stimulation with brief bursts of APs(Chadderton et al., 2004), for which changes in pr induce a redis-tribution of synaptic efficacy within the burst (Markram andTsodyks, 1996). Given the target cell-specific effects of Munc13-3on GC outputs, which are strongest for BCs (Beierlein et al., 2007;Bao et al., 2010), superpriming may thus provide BCs with addi-tional temporal lead (Blot and Barbour, 2014) for inhibiting PCs,which also receive direct excitatory GC input. Such subtle,superpriming-dependent effects may become necessary as soonas the GC–PC connectivity is established and PCs obtain theirmature GABAergic responsiveness (Eilers et al., 2001). Clearly,more information on the developmental regulation (Augustin etal., 1999b) and synapse-specific targeting of Munc13-3 will benecessary to gain a deeper understanding of Munc13-3 func-tional roles.
The differential effects of Munc13-3 on the Ca 2�-dependentreplenishment of SVs (Chen et al., 2013) and on the pr (Fig. 2) arereminiscent of the differential effects of Munc13-1, which alsocontrols both the size of the RRP and pr (Rhee et al., 2002).Notably, the C1 domain responsible for these effects is also pres-ent in Munc13-3. However, although pr is decreased byMunc13-1 (Rhee et al., 2002), our data show that it is increased byMunc13-3. Thus, differential effects on the RRP and pr representan emerging principle of as yet unexplained molecular naturethat extends the spectrum of functions executed by Munc13s.
ReferencesAugustin I, Rosenmund C, Sudhof TC, Brose N (1999a) Munc13-1 is essen-
tial for fusion competence of glutamatergic synaptic vesicles. Nature 400:457– 461. CrossRef Medline
Augustin I, Betz A, Herrmann C, Jo T, Brose N (1999b) Differential expres-sion of two novel Munc13 proteins in rat brain. Biochem J 337:363–371.CrossRef Medline
Augustin I, Korte S, Rickmann M, Kretzschmar HA, Sudhof TC, Herms JW,Brose N (2001) The cerebellum-specific Munc13 isoform Munc13-3regulates cerebellar synaptic transmission and motor learning in mice.J Neurosci 21:10 –17. Medline
Bao J, Reim K, Sakaba T (2010) Target-dependent feedforward inhibitionmediated by short-term synaptic plasticity in the cerebellum. J Neurosci30:8171– 8179. CrossRef Medline
Barbour B (1993) Synaptic currents evoked in Purkinje cells by stimulatingindividual granule cells. Neuron 11:759 –769. CrossRef Medline
Beierlein M, Fioravante D, Regehr WG (2007) Differential expression ofposttetanic potentiation and retrograde signaling mediate target-dependent short-term synaptic plasticity. Neuron 54:949 –959. CrossRefMedline
Betz A, Thakur P, Junge HJ, Ashery U, Rhee JS, Scheuss V, Rosenmund C,Rettig J, Brose N (2001) Functional interaction of the active zone pro-teins Munc13-1 and RIM1 in synaptic vesicle priming. Neuron 30:183–196. CrossRef Medline
Blot A, Barbour B (2014) Ultra-rapid axon-axon ephaptic inhibition of cer-ebellar Purkinje cells by the pinceau. Nat Neurosci 17:289 –295. CrossRefMedline
Brose N, Rosenmund C, Rettig J (2000) Regulation of transmitter release byUnc-13 and its homologues. Curr Opin Neurobiol 10:303–311. CrossRefMedline
Bucurenciu I, Kulik A, Schwaller B, Frotscher M, Jonas P (2008) Nanodo-main coupling between Ca 2� channels and Ca 2� sensors promotes fastand efficient transmitter release at a cortical GABAergic synapse. Neuron57:536 –545. CrossRef Medline
Chadderton P, Margrie TW, Hausser M (2004) Integration of quanta incerebellar granule cells during sensory processing. Nature 428:856 – 860.CrossRef Medline
Chen Z, Cooper B, Kalla S, Varoqueaux F, Young SM Jr (2013) The Munc13proteins differentially regulate readily releasable pool dynamics and
calcium-dependent recovery at a central synapse. J Neurosci 33:8336 –8351. CrossRef Medline
Clements JD, Silver RA (2000) Unveiling synaptic plasticity: a new graphicaland analytical approach. Trends Neurosci 23:105–113. CrossRef Medline
Cooper B, Hemmerlein M, Ammermuller J, Imig C, Reim K, Lipstein N, KallaS, Kawabe H, Brose N, Brandstatter JH, Varoqueaux F (2012) Munc13-independent vesicle priming at mouse photoreceptor ribbon synapses.J Neurosci 32:8040 – 8052. CrossRef Medline
Dulubova I, Lou X, Lu J, Huryeva I, Alam A, Schneggenburger R, Sudhof TC,Rizo J (2005) A Munc13/RIM/Rab3 tripartite complex: from priming toplasticity? EMBO J 24:2839 –2850. CrossRef Medline
Eggermann E, Bucurenciu I, Goswami SP, Jonas P (2012) Nanodomaincoupling between Ca 2� channels and sensors of exocytosis at fast mam-malian synapses. Nat Rev Neurosci 13:7–21. CrossRef Medline
Eilers J, Plant TD, Marandi N, Konnerth A (2001) GABA-mediated Ca 2�
signalling in developing cerebellar Purkinje neurones. J Physiol 536:429 –437. CrossRef Medline
Fedchyshyn MJ, Wang LY (2005) Developmental transformation of the re-lease modality at the calyx of Held synapse. J Neurosci 25:4131– 4140.CrossRef Medline
Fioravante D, Regehr WG (2011) Short-term forms of presynaptic plastic-ity. Curr Opin Neurobiol 21:269 –274. CrossRef Medline
Hallermann S, Silver RA (2013) Sustaining rapid vesicular release at activezones: potential roles for vesicle tethering. Trends Neurosci 36:185–194.CrossRef Medline
Hallermann S, Fejtova A, Schmidt H, Weyhersmuller A, Silver RA, Gundelf-inger ED, Eilers J (2010) Bassoon speeds vesicle reloading at a centralexcitatory synapse. Neuron 68:710 –723. CrossRef Medline
Haucke V, Neher E, Sigrist SJ (2011) Protein scaffolds in the coupling ofsynaptic exocytosis and endocytosis. Nat Rev Neurosci 12:127–138.CrossRef Medline
Kaeser PS, Deng L, Wang Y, Dulubova I, Liu X, Rizo J, Sudhof TC (2011)RIM proteins tether Ca 2� channels to presynaptic active zones via a directPDZ-domain interaction. Cell 144:282–295. CrossRef Medline
Kalla S, Stern M, Basu J, Varoqueaux F, Reim K, Rosenmund C, Ziv NE, BroseN (2006) Molecular dynamics of a presynaptic active zone protein stud-ied in Munc13-1-enhanced yellow fluorescent protein knock-in mutantmice. J Neurosci 26:13054 –13066. CrossRef Medline
Kintscher M, Wozny C, Johenning FW, Schmitz D, Breustedt J (2013) Roleof RIM1� in short- and long-term synaptic plasticity at cerebellar parallelfibres. Nat Commun 4:2392. CrossRef Medline
Kochubey O, Han Y, Schneggenburger R (2009) Developmental regulation ofthe intracellular Ca 2� sensitivity of vesicle fusion and Ca 2�-secretion cou-pling at the rat calyx of Held. J Physiol 587:3009–3023. CrossRef Medline
Lee JS, Ho WK, Neher E, Lee SH (2013) Superpriming of synaptic vesiclesafter their recruitment to the readily releasable pool. Proc Natl Acad SciU S A 110:15079 –15084. CrossRef Medline
Lipstein N, Schaks S, Dimova K, Kalkhof S, Ihling C, Kolbel K, Ashery U, RheeJ, Brose N, Sinz A, Jahn O (2012) Nonconserved Ca 2�/calmodulinbinding sites in Munc13s differentially control synaptic short-term plas-ticity. Mol Cell Biol 32:4628 – 4641. CrossRef Medline
Lipstein N, Sakaba T, Cooper BH, Lin KH, Strenzke N, Ashery U, Rhee JS,Taschenberger H, Neher E, Brose N (2013) Dynamic control of synapticvesicle replenishment and short-term plasticity by Ca 2�-Calmodulin-Munc13-1 signaling. Neuron 79:82–96. CrossRef Medline
Malinow R, Tsien RW (1990) Presynaptic enhancement shown by whole-cell recordings of long-term potentiation in hippocampal slices. Nature346:177–180. CrossRef Medline
Markram H, Tsodyks M (1996) Redistribution of synaptic efficacy betweenneocortical pyramidal neurons. Nature 382:807– 810. CrossRef Medline
Meinrenken CJ, Borst JG, Sakmann B (2002) Calcium secretion coupling atcalyx of held governed by nonuniform channel-vesicle topography.J Neurosci 22:1648 –1667. Medline
Meyer AC, Neher E, Schneggenburger R (2001) Estimation of quantal sizeand number of functional active zones at the calyx of held synapse bynonstationary EPSC variance analysis. J Neurosci 21:7889 –7900. Medline
Neher E (1998) Usefulness and limitations of linear approximations to the un-derstanding of Ca�� signals. Cell Calcium 24:345–357. CrossRef Medline
Neher E, Sakaba T (2008) Multiple roles of calcium ions in the regulation ofneurotransmitter release. Neuron 59:861– 872. CrossRef Medline
Perkins KL (2006) Cell-attached voltage-clamp and current-clamp record-
Ishiyama et al. • Munc13-3 Superprimes Synaptic Vesicles J. Neurosci., October 29, 2014 • 34(44):14687–14696 • 14695
ing and stimulation techniques in brain slices. J Neurosci Methods 154:1–18. CrossRef Medline
Redman S (1990) Quantal analysis of synaptic potentials in neurons of thecentral nervous system. Physiol Rev 70:165–198. Medline
Rhee JS, Betz A, Pyott S, Reim K, Varoqueaux F, Augustin I, Hesse D, SudhofTC, Takahashi M, Rosenmund C, Brose N (2002) � phorbol ester- anddiacylglycerol-induced augmentation of transmitter release is mediatedby Munc13s and not by PKCs. Cell 108:121–133. CrossRef Medline
Salin PA, Malenka RC, Nicoll RA (1996) Cyclic AMP mediates a presynapticform of LTP at cerebellar parallel fiber synapses. Neuron 16:797– 803.CrossRef Medline
Schluter OM, Basu J, Sudhof TC, Rosenmund C (2006) Rab3 superprimessynaptic vesicles for release: implications for short-term synaptic plastic-ity. J Neurosci 26:1239 –1246. CrossRef Medline
Schmidt H, Stiefel KM, Racay P, Schwaller B, Eilers J (2003) Mutationalanalysis of dendritic Ca 2� kinetics in rodent Purkinje cells: role of parv-albumin and calbindin D28k. J Physiol 551:13-32. CrossRef Medline
Schmidt H, Brachtendorf S, Arendt O, Hallermann S, Ishiyama S, BornscheinG, Gall D, Schiffmann SN, Heckmann M, Eilers J (2013) Nanodomaincoupling at an excitatory cortical synapse. Curr Biol 23:244 –249.CrossRef Medline
Schneggenburger R, Meyer AC, Neher E (1999) Released fraction and total
size of a pool of immediately available transmitter quanta at a calyx syn-apse. Neuron 23:399 – 409. CrossRef Medline
Stevens CF, Wang Y (1994) Changes in reliability of synaptic function as amechanism for plasticity. Nature 371:704 –707. CrossRef Medline
Sudhof TC (2013) Neurotransmitter release: the last millisecond in the lifeof a synaptic vesicle. Neuron 80:675– 690. CrossRef Medline
Thorpe S, Fize D, Marlot C (1996) Speed of processing in the human visualsystem. Nature 381:520 –522. CrossRef Medline
Trigo FF, Sakaba T, Ogden D, Marty A (2012) Readily releasable pool ofsynaptic vesicles measured at single synaptic contacts. Proc Natl Acad SciU S A 109:18138 –18143. CrossRef Medline
Valera AM, Doussau F, Poulain B, Barbour B, Isope P (2012) Adaptation ofgranule cell to Purkinje cell synapses to high-frequency transmission.J Neurosci 32:3267–3280. CrossRef Medline
Yang CB, Zheng YT, Li GY, Mower GD (2002) Identification of Munc 13-3as a candidate gene for critical-period neuroplasticity in visual cortex.J Neurosci 22:8614 – 8618. Medline
Yang CB, Kiser PJ, Zheng YT, Varoqueaux F, Mower GD (2007) Bidirec-tional regulation of munc13-3 protein expression by age and dark rearingduring the critical period in mouse visual cortex. Neuroscience 150:603–608. CrossRef Medline
14696 • J. Neurosci., October 29, 2014 • 34(44):14687–14696 Ishiyama et al. • Munc13-3 Superprimes Synaptic Vesicles