Embed Size (px)
Citation preview
Chapter 17
Uplift and erosion of the greater Barents Sea: impact on prospectivityand petroleum systems
E. HENRIKSEN1*, H. M. BJØRNSETH2, T. K. HALS2, T. HEIDE2, T. KIRYUKHINA3, O. S. KLØVJAN2,
G. B. LARSSEN1, A. E. RYSETH2, K. RØNNING1, K. SOLLID2 & A. STOUPAKOVA1,3
1Statoil Global Exploration, Harstad, Norway2Statoil Exploration and Production Norway, Harstad, Norway
3Moscow State University (MGU), Moscow, Russia
*Corresponding author (e-mail: [email protected])
Abstract: A regional net erosion map for the greater Barents Sea shows that the different areas in the Barents Sea region have beensubject to different magnitudes of uplift and erosion. Net erosion values vary from 0 to more than 3000 m. The processes have importantconsequences for the petroleum systems. Reservoir quality, maturity of the source rocks and the migration of hydrocarbons are affectedby the processes. Owing to changes in the PVT conditions in a hydrocarbon-filled structure, uplift and erosion increase the risk of leakageand expansion of the gas cap in a structure. Understanding of the timing of uplift and re-migration of hydrocarbons has been increasinglyimportant in the exploration of the Barents Sea.
Ideas on uplift in the Barents Sea region can be traced back toFritjof Nansen (1904). During his expeditions in the Barents Seahe concluded from bathymetric investigations that the area hadbeen quite recently uplifted. A renewed focus on this issue in theNorwegian Barents Sea took place after the drilling of the firstexploration wells in the early 1980s. Since then, numerous articlesdiscussing uplift have been published. The Norwegian Journal ofGeology (Vol. 72, no. 3, 1992) gave a status of the discussionsalong the Norwegian shelf. Some major publications from thattime discussing the Barents Sea are: Eidvin & Riis (1989),Vorren et al. (1991), Nardin & Røssland (1992), Nyland et al.(1992), Riis & Fjeldskaar (1992), Riis (1992), Vagnes et al.(1992), Richardsen et al. (1993) and Sættem et al. (1994). Morerecent studies have increased our understanding further: Dore &Jensen (1996), Riis (1996), Grogan et al. (1999), Dore et al.(2000, 2002), Brekke et al. (2001), Ryseth et al. (2003), Cavanaghet al. (2006), Ohm et al. (2008) and Anell et al. (2009).
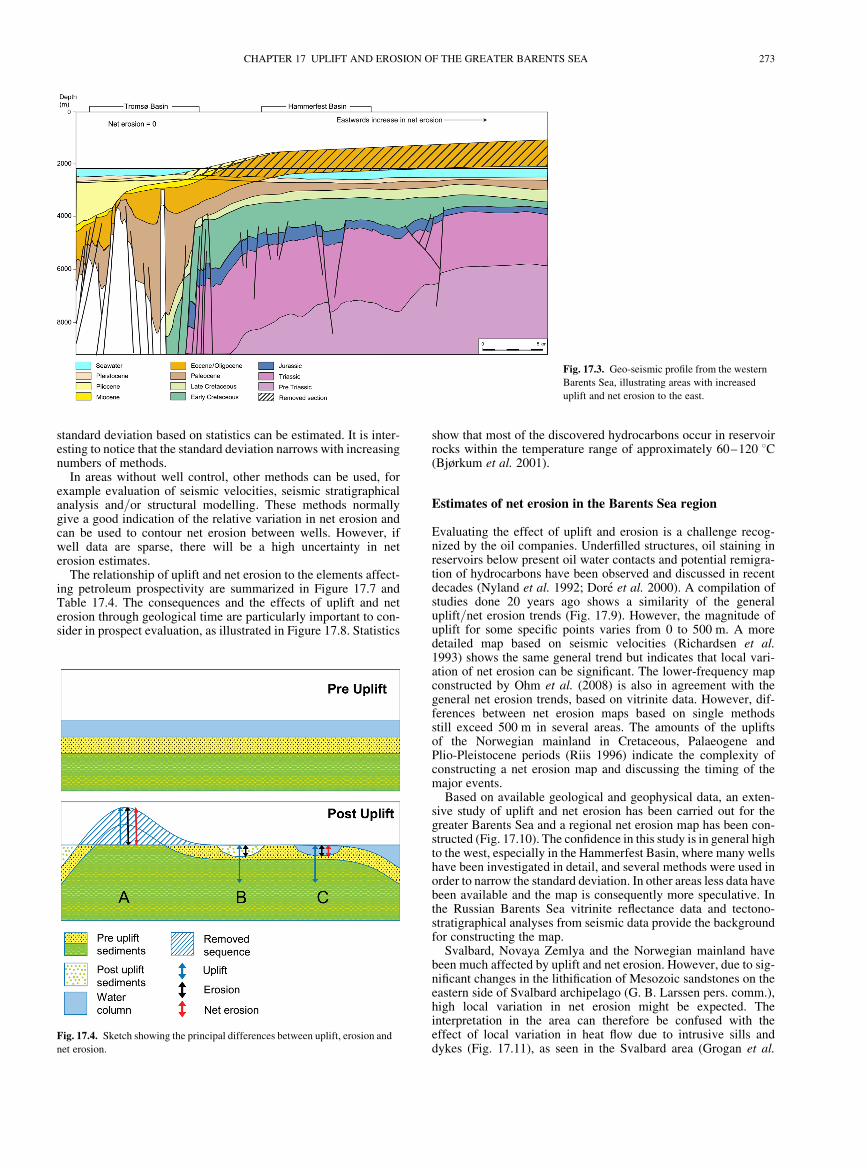
Understanding the uplift and erosion history of sedimentarybasins plays a central role in the evaluation of prospectivity.Several models have been used to try to calculate the maximumburial depths based on different methods (Cavanagh et al. 2006and references therein). Taking account of the magnitude ofuplift and erosion and the timing of such processes is, for someareas, crucial for exploration activity to succeed. Many hydro-carbon basins worldwide have been considerably upliftedthrough geological time, as most of the world petroleum reservesare located onshore. A compiled subcrop map below Quaternarysediments in the Barents Sea illustrates that the different areashave been subject to different magnitudes of erosion (Figs. 17.1& 17.2). Net erosion is defined as the difference betweenmaximal burial and the present day burial depth for a markerhorizon. The processes may, however, occur in several stages.The principles and the results of the net erosion processes are illus-trated by conceptual profiles from the Barents Sea (Figs 17.3 &17.4).
For some structures the removal of overburden has led to theleakage of hydrocarbons, causing the emptying of reservoirs orstructures not being filled to spill. For other structures the mainimpact has been changes in oil v. gas and PVT ratios. A compari-son of the Barents Sea with other areas subject to uplift and erosionprocesses indicates that the negative effects of these processes may
have been over-stressed (Dore & Jensen 1996; Ohm et al. 2008).The effects of uplift (former deeper burial) on reservoir propertiesand hydrocarbon migration were described by Bjørkum et al.(2001).
In most of the Barents Sea wells the upper section (most ofPalaeogene and the entire Neogene section) is absent (Figs 17.1& 17.2). The reservoir quality at a particular depth is generallylower than expected and it has also been noticed that the sourcerocks are more mature than expected from present temperaturegradients and burial depths (Dore et al. 2002; Ohm et al. 2008).Other observations in the area are that none of the discoveries inthe Norwegian and Russian parts of the Barents Sea seem to befilled to spill and that most wells in the Norwegian sectorcontain traces of oil below the present hydrocarbon–watercontact (Nyland et al. 1992) and some above the present gas–oilcontacts. These features demonstrate that erosion and uplift havehad a great effect on the petroleum systems and hydrocarbonaccumulations in the area.
Petroleum provinces with uplift
Examples of prolific petroleum provinces that have been upliftedduring the Cenozoic to compare with the greater Barents Searegion are listed in Table 17.1. In more detail, the WesternCanada and Sverdrup Basins seem to represent good analoguesto the Barents Sea. Table 17.2 shows their similarities in geologicaldevelopment. The magnitudes of uplift are estimated to be similarin amounts to the Barents Sea, but there are large differences in thenumbers of wells drilled and their proven reserves.
Measuring net erosion and its effect on petroleum
accumulations
The differences between uplift and net erosion have often not beenappreciated. They were previously described by Bjørnseth et al.(2004). Figure 17.4 illustrates the main differences.
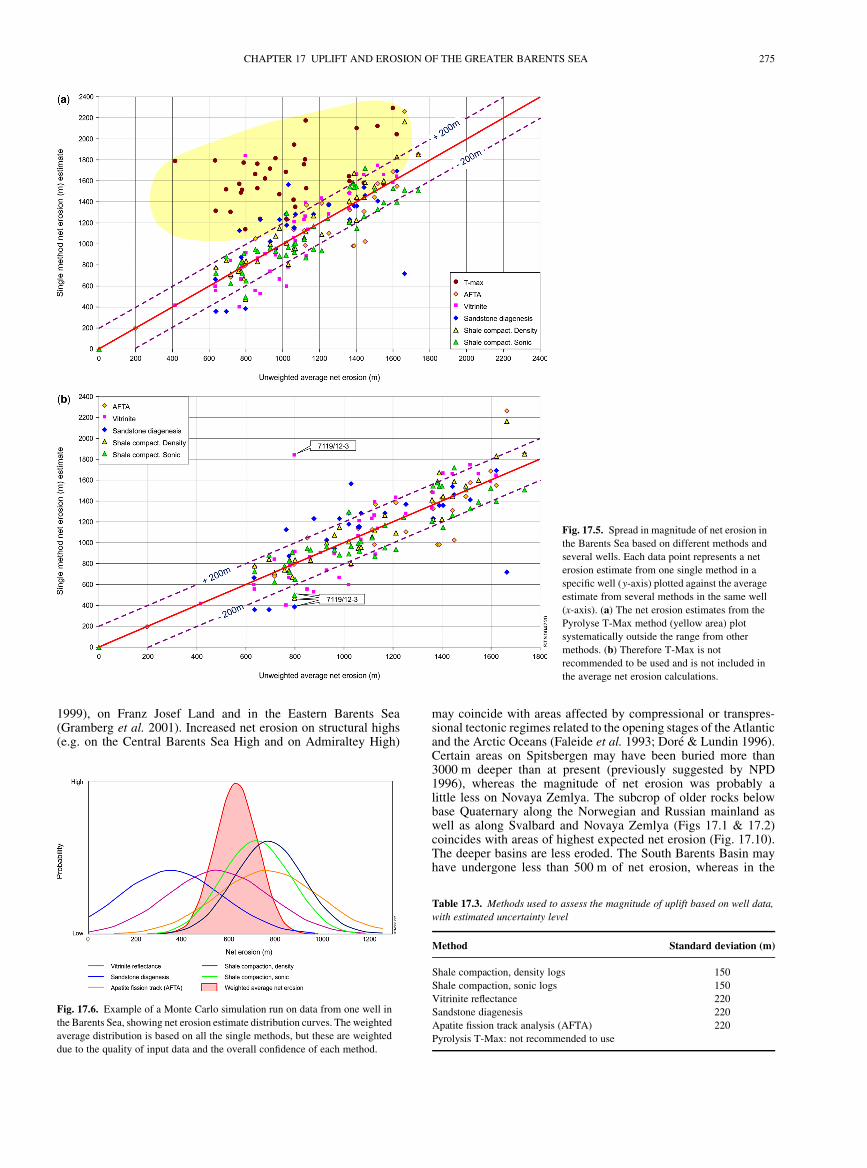
Several methods can been used to estimate uplift and net erosionusing well data (Figs 17.5 & 17.6 and Table 17.3). An average
From: Spencer, A. M., Embry, A. F., Gautier, D. L., Stoupakova, A. V. & Sørensen, K. (eds) Arctic Petroleum Geology. Geological Society, London, Memoirs,
35, 271–281. 0435-4052/11/$15.00 # The Geological Society of London 2011. DOI: 10.1144/M35.17
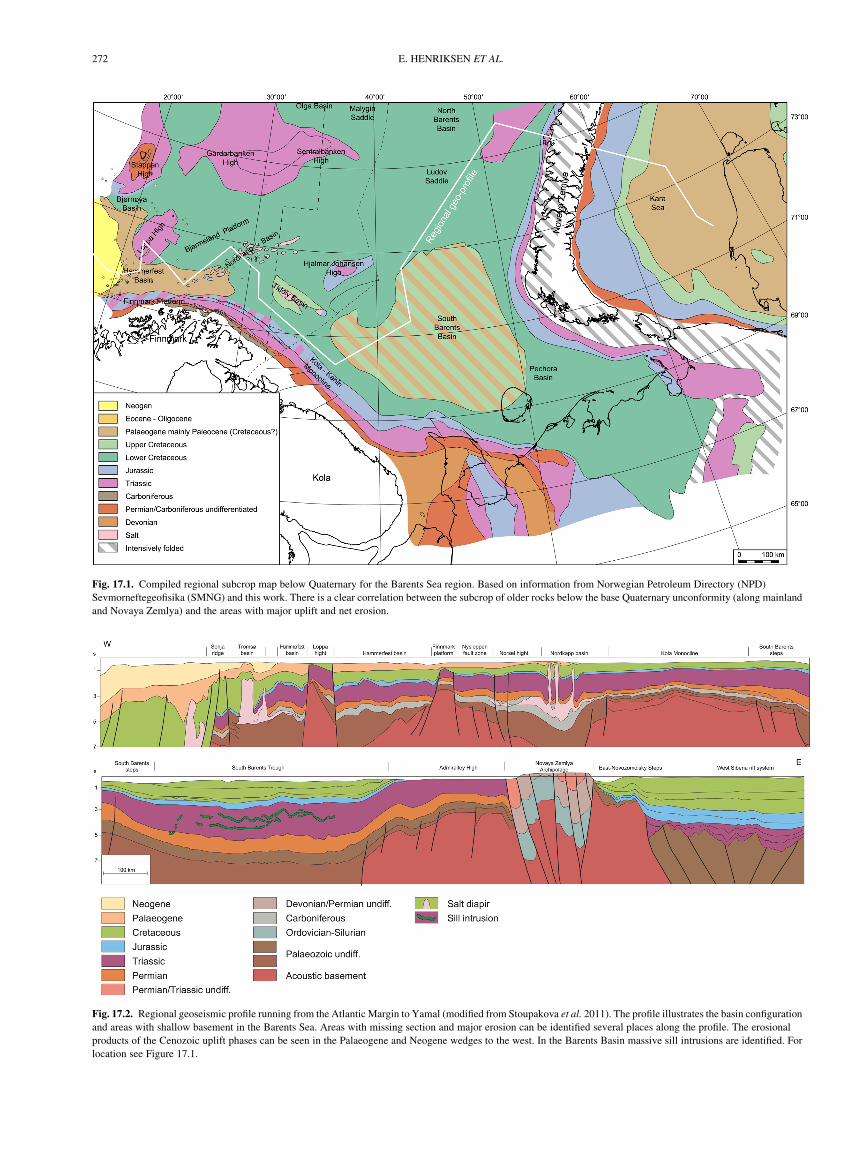
Fig. 17.1. Compiled regional subcrop map below Quaternary for the Barents Sea region. Based on information from Norwegian Petroleum Directory (NPD)
Sevmorneftegeofisika (SMNG) and this work. There is a clear correlation between the subcrop of older rocks below the base Quaternary unconformity (along mainland
and Novaya Zemlya) and the areas with major uplift and net erosion.
Fig. 17.2. Regional geoseismic profile running from the Atlantic Margin to Yamal (modified from Stoupakova et al. 2011). The profile illustrates the basin configuration
and areas with shallow basement in the Barents Sea. Areas with missing section and major erosion can be identified several places along the profile. The erosional
products of the Cenozoic uplift phases can be seen in the Palaeogene and Neogene wedges to the west. In the Barents Basin massive sill intrusions are identified. For
location see Figure 17.1.
E. HENRIKSEN ET AL.272
standard deviation based on statistics can be estimated. It is inter-esting to notice that the standard deviation narrows with increasingnumbers of methods.
In areas without well control, other methods can be used, forexample evaluation of seismic velocities, seismic stratigraphicalanalysis and/or structural modelling. These methods normallygive a good indication of the relative variation in net erosion andcan be used to contour net erosion between wells. However, ifwell data are sparse, there will be a high uncertainty in neterosion estimates.
The relationship of uplift and net erosion to the elements affect-ing petroleum prospectivity are summarized in Figure 17.7 andTable 17.4. The consequences and the effects of uplift and neterosion through geological time are particularly important to con-sider in prospect evaluation, as illustrated in Figure 17.8. Statistics
show that most of the discovered hydrocarbons occur in reservoirrocks within the temperature range of approximately 60–120 8C(Bjørkum et al. 2001).
Estimates of net erosion in the Barents Sea region
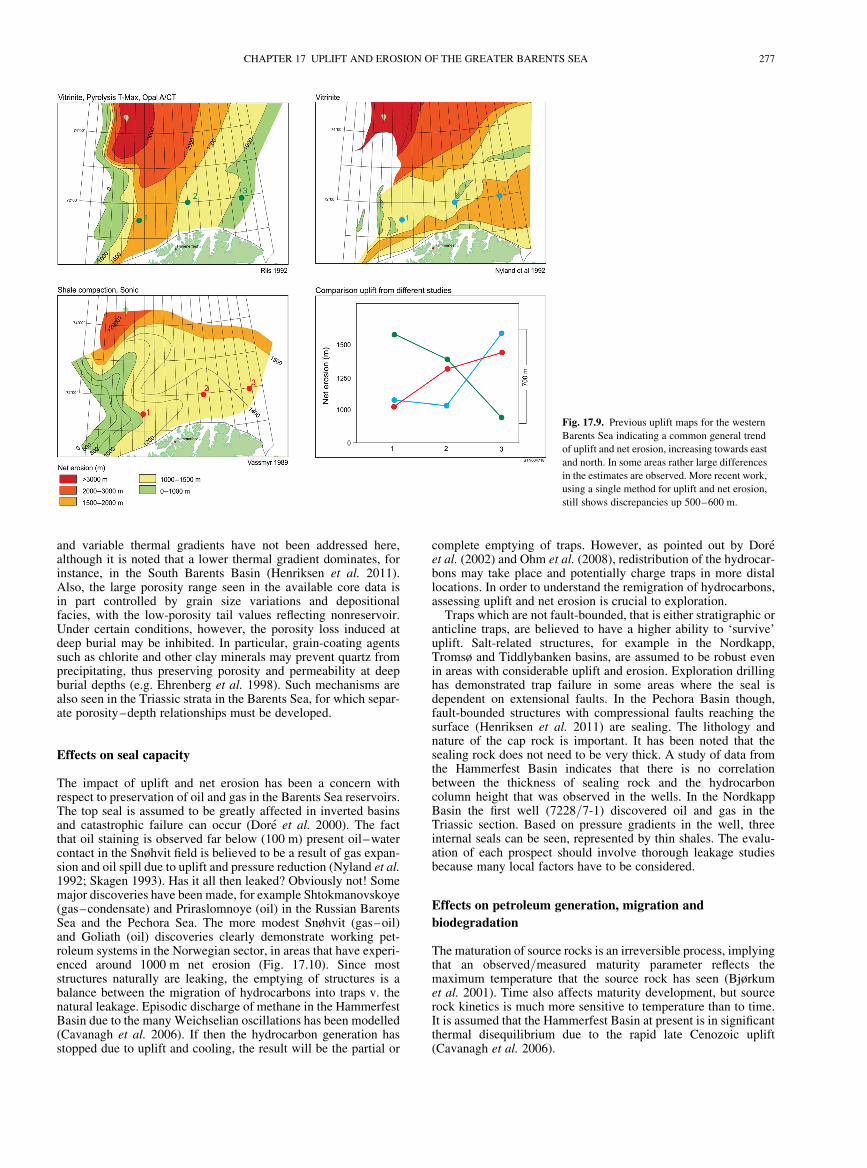
Evaluating the effect of uplift and erosion is a challenge recog-nized by the oil companies. Underfilled structures, oil staining inreservoirs below present oil water contacts and potential remigra-tion of hydrocarbons have been observed and discussed in recentdecades (Nyland et al. 1992; Dore et al. 2000). A compilation ofstudies done 20 years ago shows a similarity of the generaluplift/net erosion trends (Fig. 17.9). However, the magnitude ofuplift for some specific points varies from 0 to 500 m. A moredetailed map based on seismic velocities (Richardsen et al.1993) shows the same general trend but indicates that local vari-ation of net erosion can be significant. The lower-frequency mapconstructed by Ohm et al. (2008) is also in agreement with thegeneral net erosion trends, based on vitrinite data. However, dif-ferences between net erosion maps based on single methodsstill exceed 500 m in several areas. The amounts of the upliftsof the Norwegian mainland in Cretaceous, Palaeogene andPlio-Pleistocene periods (Riis 1996) indicate the complexity ofconstructing a net erosion map and discussing the timing of themajor events.
Based on available geological and geophysical data, an exten-sive study of uplift and net erosion has been carried out for thegreater Barents Sea and a regional net erosion map has been con-structed (Fig. 17.10). The confidence in this study is in general highto the west, especially in the Hammerfest Basin, where many wellshave been investigated in detail, and several methods were used inorder to narrow the standard deviation. In other areas less data havebeen available and the map is consequently more speculative. Inthe Russian Barents Sea vitrinite reflectance data and tectono-stratigraphical analyses from seismic data provide the backgroundfor constructing the map.
Svalbard, Novaya Zemlya and the Norwegian mainland havebeen much affected by uplift and net erosion. However, due to sig-nificant changes in the lithification of Mesozoic sandstones on theeastern side of Svalbard archipelago (G. B. Larssen pers. comm.),high local variation in net erosion might be expected. Theinterpretation in the area can therefore be confused with theeffect of local variation in heat flow due to intrusive sills anddykes (Fig. 17.11), as seen in the Svalbard area (Grogan et al.
Fig. 17.3. Geo-seismic profile from the western
Barents Sea, illustrating areas with increased
uplift and net erosion to the east.
Fig. 17.4. Sketch showing the principal differences between uplift, erosion and
net erosion.
CHAPTER 17 UPLIFT AND EROSION OF THE GREATER BARENTS SEA 273
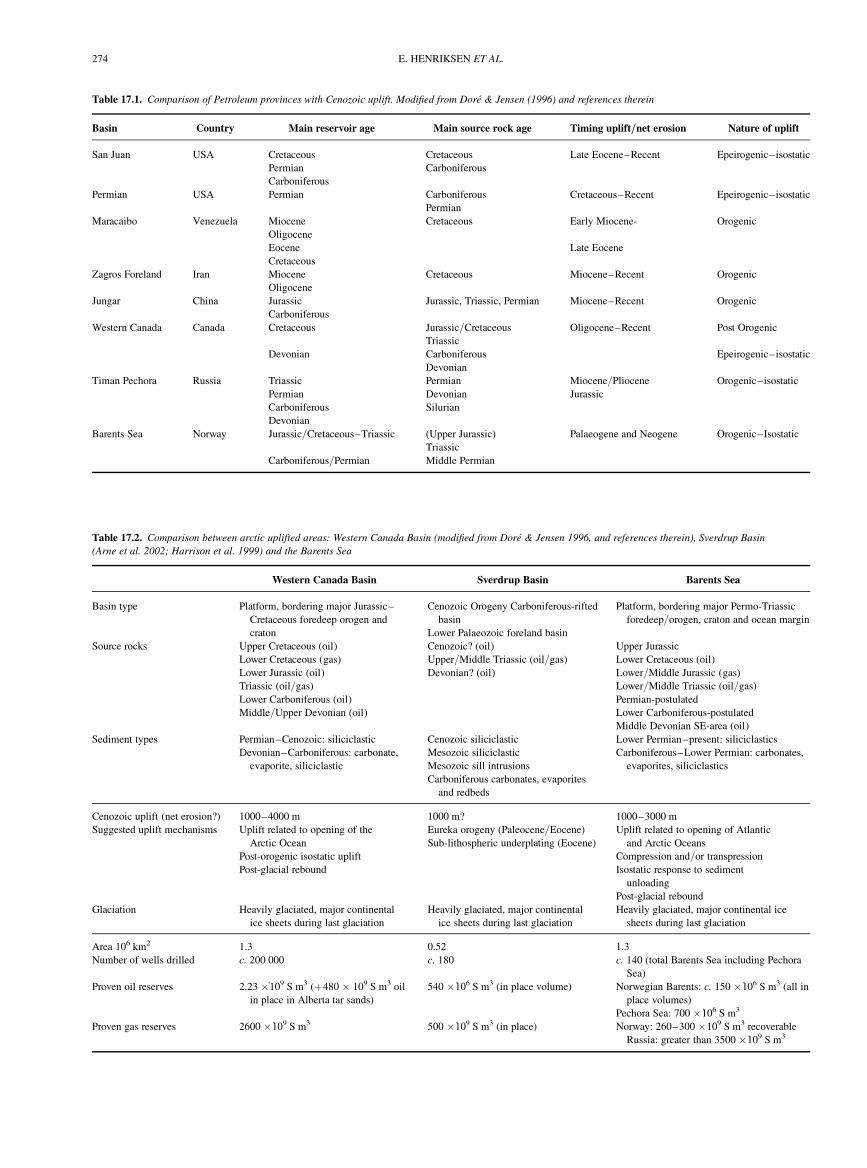
Table 17.2. Comparison between arctic uplifted areas: Western Canada Basin (modified from Dore & Jensen 1996, and references therein), Sverdrup Basin
(Arne et al. 2002; Harrison et al. 1999) and the Barents Sea
Western Canada Basin Sverdrup Basin Barents Sea
Basin type Platform, bordering major Jurassic–
Cretaceous foredeep orogen and
craton
Cenozoic Orogeny Carboniferous-rifted
basin
Lower Palaeozoic foreland basin
Platform, bordering major Permo-Triassic
foredeep/orogen, craton and ocean margin
Source rocks Upper Cretaceous (oil)
Lower Cretaceous (gas)
Lower Jurassic (oil)
Triassic (oil/gas)
Lower Carboniferous (oil)
Middle/Upper Devonian (oil)
Cenozoic? (oil)
Upper/Middle Triassic (oil/gas)
Devonian? (oil)
Upper Jurassic
Lower Cretaceous (oil)
Lower/Middle Jurassic (gas)
Lower/Middle Triassic (oil/gas)
Permian-postulated
Lower Carboniferous-postulated
Middle Devonian SE-area (oil)
Sediment types Permian–Cenozoic: siliciclastic
Devonian–Carboniferous: carbonate,
evaporite, siliciclastic
Cenozoic siliciclastic
Mesozoic siliciclastic
Mesozoic sill intrusions
Carboniferous carbonates, evaporites
and redbeds
Lower Permian–present: siliciclastics
Carboniferous–Lower Permian: carbonates,
evaporites, siliciclastics
Cenozoic uplift (net erosion?) 1000–4000 m 1000 m? 1000–3000 m
Suggested uplift mechanisms Uplift related to opening of the
Arctic Ocean
Post-orogenic isostatic uplift
Post-glacial rebound
Eureka orogeny (Paleocene/Eocene)
Sub-lithospheric underplating (Eocene)
Uplift related to opening of Atlantic
and Arctic Oceans
Compression and/or transpression
Isostatic response to sediment
unloading
Post-glacial rebound
Glaciation Heavily glaciated, major continental
ice sheets during last glaciation
Heavily glaciated, major continental
ice sheets during last glaciation
Heavily glaciated, major continental ice
sheets during last glaciation
Area 106 km2 1.3 0.52 1.3
Number of wells drilled c. 200 000 c. 180 c. 140 (total Barents Sea including Pechora
Sea)
Proven oil reserves 2.23 �109 S m3 (þ480 � 109 S m3 oil
in place in Alberta tar sands)
540 �106 S m3 (in place volume) Norwegian Barents: c. 150 �106 S m3 (all in
place volumes)
Pechora Sea: 700 �106 S m3
Proven gas reserves 2600 �109 S m3 500 �109 S m3 (in place) Norway: 260–300 �109 S m3 recoverable
Russia: greater than 3500 �109 S m3
Table 17.1. Comparison of Petroleum provinces with Cenozoic uplift. Modified from Dore & Jensen (1996) and references therein
Basin Country Main reservoir age Main source rock age Timing uplift/net erosion Nature of uplift
San Juan USA Cretaceous Cretaceous Late Eocene–Recent Epeirogenic–isostatic
Permian Carboniferous
Carboniferous
Permian USA Permian Carboniferous Cretaceous–Recent Epeirogenic–isostatic
Permian
Maracaibo Venezuela Miocene Cretaceous Early Miocene- Orogenic
Oligocene
Eocene Late Eocene
Cretaceous
Zagros Foreland Iran Miocene Cretaceous Miocene–Recent Orogenic
Oligocene
Jungar China Jurassic Jurassic, Triassic, Permian Miocene–Recent Orogenic
Carboniferous
Western Canada Canada Cretaceous Jurassic/Cretaceous Oligocene–Recent Post Orogenic
Triassic
Devonian Carboniferous Epeirogenic–isostatic
Devonian
Timan Pechora Russia Triassic Permian Miocene/Pliocene Orogenic–isostatic
Permian Devonian Jurassic
Carboniferous Silurian
Devonian
Barents Sea Norway Jurassic/Cretaceous–Triassic (Upper Jurassic) Palaeogene and Neogene Orogenic–Isostatic
Triassic
Carboniferous/Permian Middle Permian
E. HENRIKSEN ET AL.274
1999), on Franz Josef Land and in the Eastern Barents Sea(Gramberg et al. 2001). Increased net erosion on structural highs(e.g. on the Central Barents Sea High and on Admiraltey High)
may coincide with areas affected by compressional or transpres-sional tectonic regimes related to the opening stages of the Atlanticand the Arctic Oceans (Faleide et al. 1993; Dore & Lundin 1996).Certain areas on Spitsbergen may have been buried more than3000 m deeper than at present (previously suggested by NPD1996), whereas the magnitude of net erosion was probably alittle less on Novaya Zemlya. The subcrop of older rocks belowbase Quaternary along the Norwegian and Russian mainland aswell as along Svalbard and Novaya Zemlya (Figs 17.1 & 17.2)coincides with areas of highest expected net erosion (Fig. 17.10).The deeper basins are less eroded. The South Barents Basin mayhave undergone less than 500 m of net erosion, whereas in the
Fig. 17.5. Spread in magnitude of net erosion in
the Barents Sea based on different methods and
several wells. Each data point represents a net
erosion estimate from one single method in a
specific well (y-axis) plotted against the average
estimate from several methods in the same well
(x-axis). (a) The net erosion estimates from the
Pyrolyse T-Max method (yellow area) plot
systematically outside the range from other
methods. (b) Therefore T-Max is not
recommended to be used and is not included in
the average net erosion calculations.
Fig. 17.6. Example of a Monte Carlo simulation run on data from one well in
the Barents Sea, showing net erosion estimate distribution curves. The weighted
average distribution is based on all the single methods, but these are weighted
due to the quality of input data and the overall confidence of each method.
Table 17.3. Methods used to assess the magnitude of uplift based on well data,
with estimated uncertainty level
Method Standard deviation (m)
Shale compaction, density logs 150
Shale compaction, sonic logs 150
Vitrinite reflectance 220
Sandstone diagenesis 220
Apatite fission track analysis (AFTA) 220
Pyrolysis T-Max: not recommended to use
CHAPTER 17 UPLIFT AND EROSION OF THE GREATER BARENTS SEA 275
Norwegian sector, the sedimentary basins indicate net erosionvalues between 900 and 1400 m (Figs 17.3 & 17.10). Thechange of net erosion along the central axis of the Barents Sea(Fig. 17.10) may coincide with a north–south basement-relatedstructure trend (Henriksen et al. 2011). Further to the west a zeroline, where no net erosion has occurred, is suggested.
The timing of the major uplift and erosion periods has been adiscussion for many years. In the Barents–Kara Sea area evidenceof several tectonic events has been described (Gabrielsen et al.1984, 1993, 1997; Vagnes et al. 1992; Faleide et al. 1993; Anellet al. 2009). It is generally agreed that a late Neogene isostaticuplift affected the whole region (Vorren et al. 1990; Riis &Fjellskar 1992; Eidvin et al. 1993; Cavanagh et al. 2006). Com-pressional and transfer movements during Palaeogene time haveaffected areas around the Atlantic Margin and on Svalbard (Dore& Lundin 1996; Faleide et al. 1996; Vagnes 1997; Brekke et al.2001; Ohm et al. 2008). It seems likely that the Central BarentsHigh and Novaya Zemlya were affected by these movements,which led to uplifted areas (Fig. 17.10). Although most areashave experienced multiple phases of uplift, not all of them are con-tributing to the net erosion. For example areas affected by themajor uplift during Late Jurassic to Early Cretaceous time wereprobably buried deeper after the Jurassic/Cretaceous erosion.The timing of maximum burial is important in the evaluation ofsource rock maturity and migration (Riis 1996; Dore et al. 2000,2002; Cavanagh et al. 2006; Ohm et al. 2008). Different areas inthe Barents Sea achieved maximum burial at different times.High areas affected by Palaeogene uplift and erosion might nothave seen deeper burial after the Palaeogene tectonics, while inbasin areas continuous sedimentation may have occurred untilglacial erosion in Plio-Pleistocene times.
Effects on reservoir quality
Reservoir properties, in particular porosity, change in relation toincreasing burial depth and reservoir temperature. Studies fromthe North Sea basins and the mid-Norwegian continental shelfsuggest that the primary driving mechanisms are compaction atshallow depths, followed by precipitation of authigenic quartzcement as the temperature exceeds a threshold value of about60 8C. For instance, Jurassic sandstones in the Haltenbankenarea show a porosity reduction of about 8–9% per kilometre over-burden (e.g. Ehrenberg 1990; Ramm & Bjørlykke 1994).
Early studies of diagenetic processes in the Jurassic reservoirrocks in the Hammerfest Basin (Olaussen et al. 1984) showedthat quartz cement is the major porosity-reducing agent in thesesandstones. Furthermore, the studies also showed that solution ofquartz grains and extensive stylolitization has occurred, alongwith illitization of kaolins, at present day burial depths in the2–2.5 km range. Elsewhere on the Norwegian continental shelf,such processes are seen at much deeper levels, generally at3.5 km and deeper, suggesting that the reservoir rocks in theHammerfest Basin have experienced deeper burial and highertemperatures than today.
Subsequent petrographic studies (e.g. Walderhaug 1992) haveconfirmed that the Barents Sea has undergone severe uplift anderosion (Fig. 17.10). Uplift estimated from reservoir propertiesin the Hammerfest and Nordkapp basins ranges from about500 m in the west to about 1500 m to the east. Furthermore,uplift exceeding 1.5–2 km has been inferred for part of the Bjar-meland Platform. Accordingly, any prediction of reservoirquality (porosity) should take account of the maximum burialprior to uplift.
Figure 17.12 illustrates a porosity–depth relationship based oncore data for Late Triassic–Jurassic sandstones in the NorwegianBarents Sea. The plotted trend line is based on data from MiddleJurassic sandstones on the mid-Norwegian shelf (Halten Terrace)to the south, where no uplift/erosion has been inferred (Ramm& Bjørlykke 1994). These sandstones are of similar petrographiccomposition (typically sub-arkoses) to their Barents Sea equiva-lents, and provide a very reasonable comparison.
Porosity plotted v. present overburden (Fig. 17.12a) yields aweak depth trend and general loss of porosity with increasingdepth. However, the plot does not give a good comparison withthe trend line from the mid-Norway shelf. When restoring the por-osity measurements to the inferred maximum burial depths(Fig. 17.12b), a more reasonable fit with the mid-Norwegianshelf data is established. In essence, the better sandstones in theBarents Sea basins appear to fall on the reference trend, with ageneral porosity reduction of about 8% per km. For instance,data from Well 7125/1-1 show about 20–25% porosity at apresent day burial of approximately 1200 m relative seafloor,which is significantly lower than at similar depths on the mid-Norway shelf. When these data are shifted down to a maximumburial exceeding approximately 2500 m (inferring 1300 muplift/erosion), the porosity values fit with the establishedmid-Norway trend.
The plots can be used for assessing realistic porosity ranges forthe relevant formations in a given exploration prospect, once theactual uplift in the particular area has been estimated. However,possible variations related to different petrographic compositions
Fig. 17.8. Diagram to illustrate the effect of uplift on structures and the
consequences for generation, migration and trapping of hydrocarbons.
Fig. 17.7. Relationship of uplift and net erosion to the elements affecting
petroleum prospectivity.
Table 17.4. Effects due to uplift and erosion
Process Uplift Net-erosion
Reservoir quality �Reduction in hydrocarbon generation rates �Change of drainage pattern through time �Fracturing of cap-rock � �PVT changes in the reservoirs �Fault reactivation � �
E. HENRIKSEN ET AL.276
and variable thermal gradients have not been addressed here,although it is noted that a lower thermal gradient dominates, forinstance, in the South Barents Basin (Henriksen et al. 2011).Also, the large porosity range seen in the available core data isin part controlled by grain size variations and depositionalfacies, with the low-porosity tail values reflecting nonreservoir.Under certain conditions, however, the porosity loss induced atdeep burial may be inhibited. In particular, grain-coating agentssuch as chlorite and other clay minerals may prevent quartz fromprecipitating, thus preserving porosity and permeability at deepburial depths (e.g. Ehrenberg et al. 1998). Such mechanisms arealso seen in the Triassic strata in the Barents Sea, for which separ-ate porosity–depth relationships must be developed.
Effects on seal capacity
The impact of uplift and net erosion has been a concern withrespect to preservation of oil and gas in the Barents Sea reservoirs.The top seal is assumed to be greatly affected in inverted basinsand catastrophic failure can occur (Dore et al. 2000). The factthat oil staining is observed far below (100 m) present oil–watercontact in the Snøhvit field is believed to be a result of gas expan-sion and oil spill due to uplift and pressure reduction (Nyland et al.1992; Skagen 1993). Has it all then leaked? Obviously not! Somemajor discoveries have been made, for example Shtokmanovskoye(gas–condensate) and Priraslomnoye (oil) in the Russian BarentsSea and the Pechora Sea. The more modest Snøhvit (gas–oil)and Goliath (oil) discoveries clearly demonstrate working pet-roleum systems in the Norwegian sector, in areas that have experi-enced around 1000 m net erosion (Fig. 17.10). Since moststructures naturally are leaking, the emptying of structures is abalance between the migration of hydrocarbons into traps v. thenatural leakage. Episodic discharge of methane in the HammerfestBasin due to the many Weichselian oscillations has been modelled(Cavanagh et al. 2006). If then the hydrocarbon generation hasstopped due to uplift and cooling, the result will be the partial or
complete emptying of traps. However, as pointed out by Doreet al. (2002) and Ohm et al. (2008), redistribution of the hydrocar-bons may take place and potentially charge traps in more distallocations. In order to understand the remigration of hydrocarbons,assessing uplift and net erosion is crucial to exploration.
Traps which are not fault-bounded, that is either stratigraphic oranticline traps, are believed to have a higher ability to ‘survive’uplift. Salt-related structures, for example in the Nordkapp,Tromsø and Tiddlybanken basins, are assumed to be robust evenin areas with considerable uplift and erosion. Exploration drillinghas demonstrated trap failure in some areas where the seal isdependent on extensional faults. In the Pechora Basin though,fault-bounded structures with compressional faults reaching thesurface (Henriksen et al. 2011) are sealing. The lithology andnature of the cap rock is important. It has been noted that thesealing rock does not need to be very thick. A study of data fromthe Hammerfest Basin indicates that there is no correlationbetween the thickness of sealing rock and the hydrocarboncolumn height that was observed in the wells. In the NordkappBasin the first well (7228/7-1) discovered oil and gas in theTriassic section. Based on pressure gradients in the well, threeinternal seals can be seen, represented by thin shales. The evalu-ation of each prospect should involve thorough leakage studiesbecause many local factors have to be considered.
Effects on petroleum generation, migration and
biodegradation
The maturation of source rocks is an irreversible process, implyingthat an observed/measured maturity parameter reflects themaximum temperature that the source rock has seen (Bjørkumet al. 2001). Time also affects maturity development, but sourcerock kinetics is much more sensitive to temperature than to time.It is assumed that the Hammerfest Basin at present is in significantthermal disequilibrium due to the rapid late Cenozoic uplift(Cavanagh et al. 2006).
Fig. 17.9. Previous uplift maps for the western
Barents Sea indicating a common general trend
of uplift and net erosion, increasing towards east
and north. In some areas rather large differences
in the estimates are observed. More recent work,
using a single method for uplift and net erosion,
still shows discrepancies up 500–600 m.
CHAPTER 17 UPLIFT AND EROSION OF THE GREATER BARENTS SEA 277
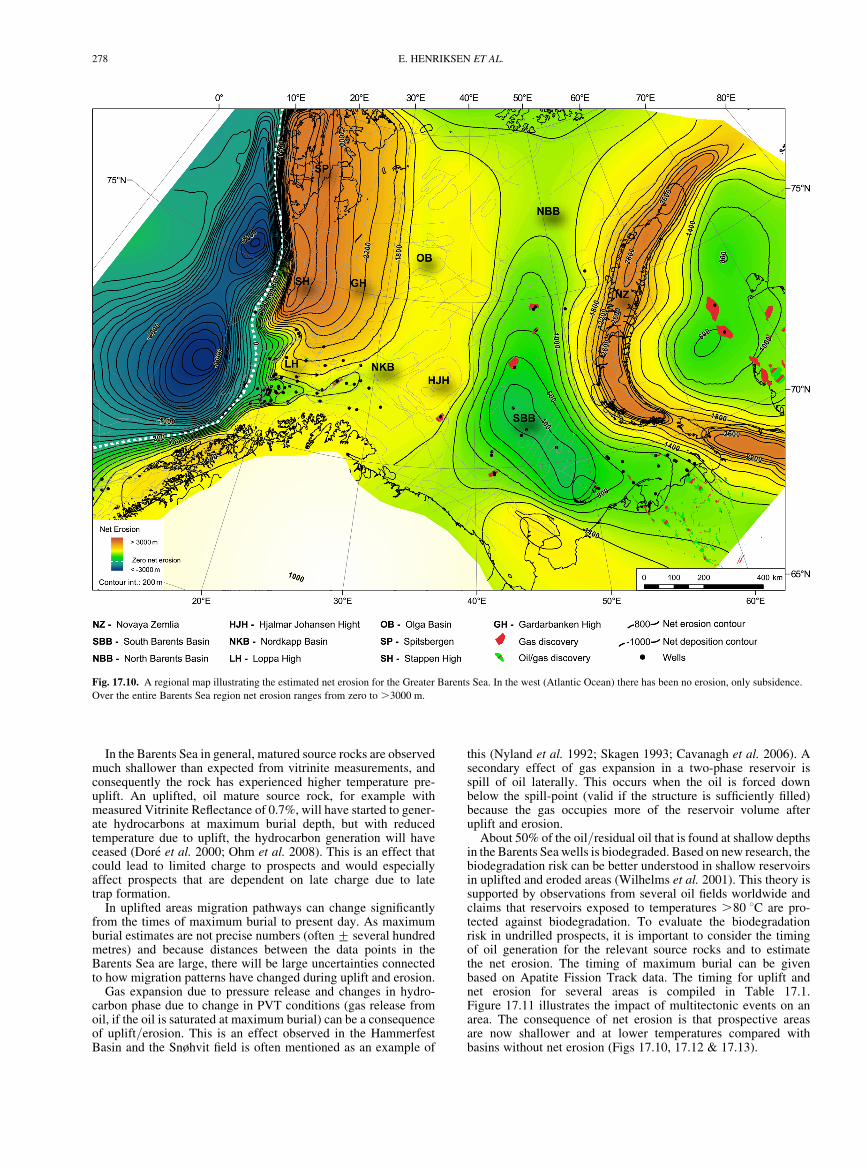
In the Barents Sea in general, matured source rocks are observedmuch shallower than expected from vitrinite measurements, andconsequently the rock has experienced higher temperature pre-uplift. An uplifted, oil mature source rock, for example withmeasured Vitrinite Reflectance of 0.7%, will have started to gener-ate hydrocarbons at maximum burial depth, but with reducedtemperature due to uplift, the hydrocarbon generation will haveceased (Dore et al. 2000; Ohm et al. 2008). This is an effect thatcould lead to limited charge to prospects and would especiallyaffect prospects that are dependent on late charge due to latetrap formation.
In uplifted areas migration pathways can change significantlyfrom the times of maximum burial to present day. As maximumburial estimates are not precise numbers (often + several hundredmetres) and because distances between the data points in theBarents Sea are large, there will be large uncertainties connectedto how migration patterns have changed during uplift and erosion.
Gas expansion due to pressure release and changes in hydro-carbon phase due to change in PVT conditions (gas release fromoil, if the oil is saturated at maximum burial) can be a consequenceof uplift/erosion. This is an effect observed in the HammerfestBasin and the Snøhvit field is often mentioned as an example of
this (Nyland et al. 1992; Skagen 1993; Cavanagh et al. 2006). Asecondary effect of gas expansion in a two-phase reservoir isspill of oil laterally. This occurs when the oil is forced downbelow the spill-point (valid if the structure is sufficiently filled)because the gas occupies more of the reservoir volume afteruplift and erosion.
About 50% of the oil/residual oil that is found at shallow depthsin the Barents Sea wells is biodegraded. Based on new research, thebiodegradation risk can be better understood in shallow reservoirsin uplifted and eroded areas (Wilhelms et al. 2001). This theory issupported by observations from several oil fields worldwide andclaims that reservoirs exposed to temperatures .80 8C are pro-tected against biodegradation. To evaluate the biodegradationrisk in undrilled prospects, it is important to consider the timingof oil generation for the relevant source rocks and to estimatethe net erosion. The timing of maximum burial can be givenbased on Apatite Fission Track data. The timing for uplift andnet erosion for several areas is compiled in Table 17.1.Figure 17.11 illustrates the impact of multitectonic events on anarea. The consequence of net erosion is that prospective areasare now shallower and at lower temperatures compared withbasins without net erosion (Figs 17.10, 17.12 & 17.13).
Fig. 17.10. A regional map illustrating the estimated net erosion for the Greater Barents Sea. In the west (Atlantic Ocean) there has been no erosion, only subsidence.
Over the entire Barents Sea region net erosion ranges from zero to .3000 m.
E. HENRIKSEN ET AL.278
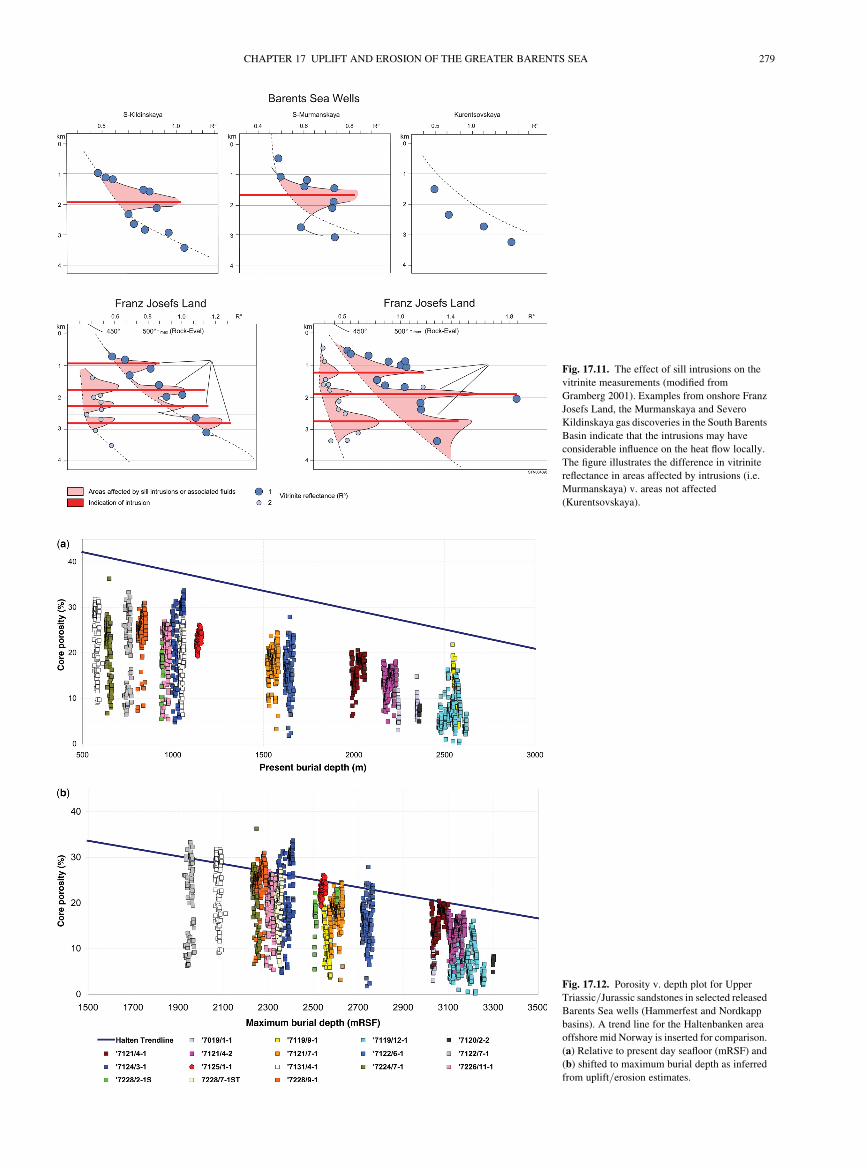
Fig. 17.11. The effect of sill intrusions on the
vitrinite measurements (modified from
Gramberg 2001). Examples from onshore Franz
Josefs Land, the Murmanskaya and Severo
Kildinskaya gas discoveries in the South Barents
Basin indicate that the intrusions may have
considerable influence on the heat flow locally.
The figure illustrates the difference in vitrinite
reflectance in areas affected by intrusions (i.e.
Murmanskaya) v. areas not affected
(Kurentsovskaya).
Fig. 17.12. Porosity v. depth plot for Upper
Triassic/Jurassic sandstones in selected released
Barents Sea wells (Hammerfest and Nordkapp
basins). A trend line for the Haltenbanken area
offshore mid Norway is inserted for comparison.
(a) Relative to present day seafloor (mRSF) and
(b) shifted to maximum burial depth as inferred
from uplift/erosion estimates.
CHAPTER 17 UPLIFT AND EROSION OF THE GREATER BARENTS SEA 279
Conclusions
Cenozoic uplift and net erosion has been subject to several studiesduring recent decades. The correlation between the subcrop mapand the net erosion map indicate that, as a first approach, theformer can be used to predict relative changes in net erosion. Inthis study several methods have been used to construct the regionalnet erosion map, showing major differences in the Greater BarentsSea. The confidence varies due to data coverage and quality. Byusing several methods (where available) in this study, the standarddeviation in net erosion estimates is reduced. For more detailedestimations, more work needs to be carried out in order toreduce the uncertainties further and to resolve the local variationsthat certainly exist.
The greater Barents Sea has experienced different amounts ofuplift and erosion that have important consequences for petroleum
systems. This has affected the reservoir quality, source rockmaturity/migration and reservoir pressure. Understanding there-migration of hydrocarbons will be important in order tosucceed in future exploration activity. Intrusions that have beenobserved in several places complicate the interpretation of neterosion further. Except for the western and northern margins ofthe greater Barents Sea, all areas have been subject to neterosion. This means that the rocks in many areas have undergonea temperature history quite different from what would be expectedbased on their present depths.
We are thankful to Statoil for being allowed to publish the data. Thanks to many
staff colleagues internally in Statoil that have contributed to the report which is
a background for this article. In particular we want to thank A. M. Spencer
and F. Riis for giving excellent advice to improve the manuscript. We also
thank M. R. Larsen, P. E. Eliassen, E. Lundin and P. Nadeau for comments and
advice. We are thankful to the Petroleum Department at Moscow State University
for their help and support and to the drafting department in Statoil for helping
with figures.
References
Anell, I., Thybo, H. & Artemieva, I. A. 2009. Cenozoic uplift and sub-sidence in the North Atlantic region: geological evidence revisited.Tectonophysics, 468, 169–184.
Arne, D. C., Grist, A. M., Zentilli, M., Collins, M., Embry, A. &Gentzis, T. 2002. Cooling of the Sverdrup Basin during tertiarybasin inversion: implications for hydrocarbon exploration. BasinResearch, 14, 183–205.
Bjørkum, P. A., Walderhaug, O. & Nadeau, P. H. 2001. Thermallydriven porosity reduction: impact on basin subsidence. In:Shannon, P. M., Haughton, P. D. W. & Corcoran, D. V. (eds)Petroleum Exploration of Ireland’s Offshore Basins. GeologicalSociety, London, Special Publications, 188, 385–392.
Bjørnseth, H. M., Eliassen, P. E. et al. 2004. Quantification of neterosion in the Barents Sea (Abstract). Norsk Geologisk Forening,Arctic Geological Conference, Tromsø.
Brekke, H., Sjulstad, H. I., Magnus, C. & Williams, R. W. 2001.Sedimentary environments offshore Norway – an overview. In:Martinsen, O. J. & Dreyer, T. (eds) Sedimentary EnvironmentsOffshore Norway – Palaeozoic to Recent. Elsevier, Amsterdam,NPF Special Publications, 10, 7–37.
Cavanagh, A. J., Di Primio, R., Scheck-Wenderoth, M. & Horsfield,B. 2006. Severity and timing of Cenozoic exhumation in the south-western Barents Sea. Journal of the Geological Society, 163,761–774.
Dore, A. G. & Jensen, L. N. 1996. The impact of late Cenozoic uplift anderosion on hydrocarbon exploration: offshore Norway and some otheruplifted basins. Global and Planetary Change, 12, 415–436.
Dore, A. G. & Lundin, E. R. 1996. Cenozoic compressional structures onthe NE Atlantic margin: nature, origin and potential significance forhydrocarbon exploration. Petroleum Geoscience, 2, 299–311.
Dore, A. G., Scotchman, I. C. & Corcoran, D. 2000. Cenozoicexhumation and prediction of the hydrocarbon system on the NWEuropean margin. Journal of Geochemical Exploration, 69–70,615–618.
Dore, A. G., Corcoran, D. V. & Scotchman, I. 2002. Exhumation ofNorth Atlantic Margins: timing, mechanisms and implications forhydrocarbon exploration. In: Dore, A. G., Cartwright, J. A.,Stoker, M. S., Turner, J. P. & White, N. J. (eds) Exhumation ofthe North Atlantic Margin: Timing, Mechanisms and Implicationsfor Hydrocarbon Exploration. Geological Society, London, SpecialPublications, 196, 401–429.
Ehrenberg, S. N. 1990. Relationship between diagenesis and reservoirquality in sandstones in the Garn Formation, Haltenbanken, mid-Norwegian continental shelf. American Association of PetroleumGeologists Bulletin, 74, 1538–1558.
Ehrenberg, S., Dalland, A., Nadeau, P., Mearns, E. W. & Amund-
sen, H. E. F. 1998. Origin of chlorite enrichment and neodymiumisotopic anomalies in Haltenbanken sandstones. Marine and Pet-roleum Geology, 15, 403–425.
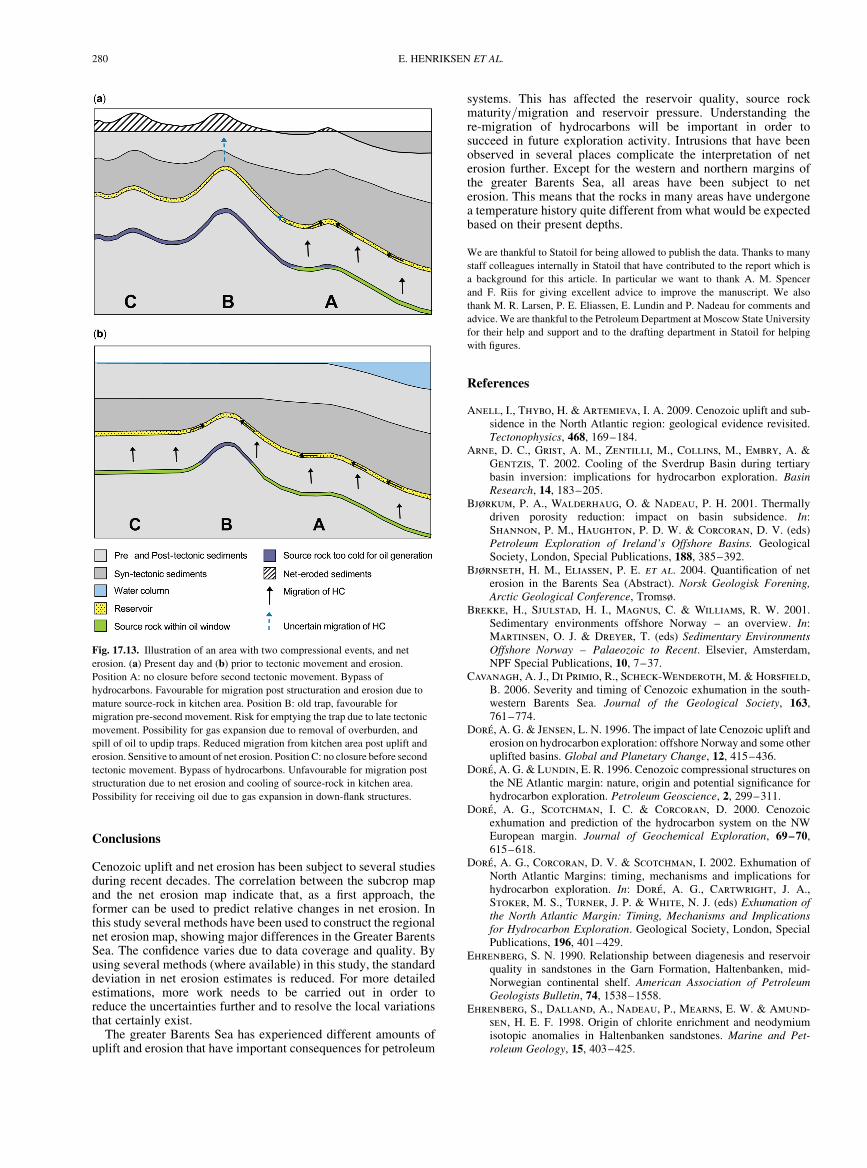
Fig. 17.13. Illustration of an area with two compressional events, and net
erosion. (a) Present day and (b) prior to tectonic movement and erosion.
Position A: no closure before second tectonic movement. Bypass of
hydrocarbons. Favourable for migration post structuration and erosion due to
mature source-rock in kitchen area. Position B: old trap, favourable for
migration pre-second movement. Risk for emptying the trap due to late tectonic
movement. Possibility for gas expansion due to removal of overburden, and
spill of oil to updip traps. Reduced migration from kitchen area post uplift and
erosion. Sensitive to amount of net erosion. Position C: no closure before second
tectonic movement. Bypass of hydrocarbons. Unfavourable for migration post
structuration due to net erosion and cooling of source-rock in kitchen area.
Possibility for receiving oil due to gas expansion in down-flank structures.
E. HENRIKSEN ET AL.280
Eidvin, T. & Riis, F. 1989. Nye dateringer av de tre vestligste borehullenei Barentshavet. Resultater og konsekvenser for den Tertiære hevin-gen. NPD contributions, 27.
Eidvin, T., Jansen, E. & Riis, F. 1993. Chronology of tertiary fan depositsoff western Barents Sea: implications for the uplift and erosionhistory of the Barents Sea shelf. Marine Geology, 112, 109–131.
Faleide, J. I., Vagnes, E. & Gudlaugsson, S. T. 1993. Late Mesozoic–Cenozoic evolution of the south-western Barents Sea in a regionalrift-shear tectonic setting. Marine and Petroleum Geology, 10,186–214.
Faleide, J. I., Solheim, A., Fiedler, A., Hjelstuen, B. O., Andersen,E. S. & Vanneste, K. 1996. Late Cenozoic evolution of the westernBarents Sea–Svalbard Continental Margin. Global and PlanetaryChange, 12, 53–74.
Gabrielsen, R. H., Færseth, R., Hamar, G. & Rønnevik, H. 1984.Nomenclature of the main structural features on the NorwegianContinental Shelf north of the 62nd parallel. In: Spencer, A. M.et al. (eds) Petroleum Geology of the North European Margin.Norwegian Petroleum Society/Graham & Trottman, London,41–60.
Gabrielsen, R. H., Grunnaleite, I. & Ottesen, S. 1993. Reactivationof fault complexes in the Loppa High area, southwestern Barents Sea.In: Vorren, et al. (eds) Arctic Geology and Petroleum Potential,Elsevier, Amsterdam, NPF Special Publications, 2, 631–641.
Gabrielsen, R. H., Grunnaleite, I. & Rasmussen, E. 1997. Cretaceousand tertiary inversion in the Bjørnøyrenna fault complex, south-western Barents Sea. Marine and Petroleum Geology, 14, 165–178.
Gramberg, I. S., Evdokimova, N. K. & Suprenenko, O. I. 2001.Maturation distribution (changes) in the Barents Sea sedimentarycover in relate of its oil and gas drilling. Geology and Geophysics,42, 1808–1820.
Grogan, P., Ostvedt-Ghazi, A. M. et al. 1999. Structural elements andpetroleum geology of the Norwegian sector of the northern BarentsSea. In: Fleet, A. J. & Boldy, S. A. R. (eds) Petroleum Geologyof Northwest Europe: Proceedings of the 5th Conference. TheGeological Society, London, 247–259.
Harrison, J. C., Mayr, U. et al. 1999. Correlation of Cenozoicsequences of the Canadian Arctic region and Greenland; implicationfor the tectonic history of northern North America. Bulletin ofCanadian Petroleum Geology, 47, 223–254.
Henriksen, E., Ryseth, A. E., Larssen, G. B., Heide, T., Rønning, K.,Sollid, K. & Stoupakova, A. V. 2011. Tectonostratigraphy of thegreater Barents Sea: implications for petroleum systems. In:Spencer, A. M., Embry, A. F., Gautier, D. L., Stoupakova, A.V. & Sørensen, K. (eds) Arctic Petroleum Geology. GeologicalSociety, London, Memoirs, 35, 163–195.
Nansen, F. 1904. The bathymetrical features of the north Polar Seas,with a discussion of the continental shelves and previous oscillationsof the shore-line. In: Nansen, F. (ed.) The Norwegian North PolarExpedition 1893–1896. Scientific Results. Jacob Dybwad,Christiania.
Nardin, T. R. & Røssland, K. G. 1992. Restoration of the erodedsection in western Barents Sea. In: Vorren, T. O., Bergsager, E.,Dahl-Stamnes, Ø. A., Holter, E., Johansen, B., Lie, E. &Lund, T. B. (eds) Arctic Geology and Petroleum Potential. Elsevier,Amsterdam, Norwegian Petroleum Society, Special Publications,2, 607–618.
NPD 1996. Geology and Petroleum resources in the Barents Sea. Specialpublication, Norwegian Petroleum Directory.
Nyland, B., Jensen, L. N., Skagen, J., Skarpnes, O. & Vorren, T.1992. Tertiary uplift and erosion in the Barents Sea: magnitude,timing and consequences. In: Larsen, R. M., Brekke, H., Larsen,B. T. & Talleraas, E. (eds) Structural and Tectonic Modellingand its Applications to Petroleum Geology. Elsevier, Amsterdam,NPF Special Publications, 1, 153–162.
Ohm, S. E., Karlsen, D. A. & Austin, T. J. F. 2008. Geochemicallydriven exploration models in uplifted areas: examples from the Nor-wegian Barents Sea. American Association of Petroleum GeologistsBulletin, 92, 1191–1223.
Olaussen, S., Dalland, A., Gloppen, T. G. & Johannessen, E. 1984.Depositional environments and diagenesis of Jurassic reservoir sand-stones in the eastern part of Troms I area. In: Spencer, A. M. et al.(eds) Petroleum Geology of the North European Margin. NorwegianPetroleum Society/Graham and Trotman, London, 61–79.
Ramm, M. & Bjørlykke, K. 1994. Porosity/depth trends in reservoirsandstones: assessing the quantitative effects of varying pore–pressure, temperature history and mineralogy, Norwegian shelfdata. Clay Minerals, 29, 475–490.
Richardsen, G., Vorren, T. O. & Tørudbakken, B. O. 1993. Cretac-eous uplift and erosion in the southern Barents Sea: a discussionbased on analysis of seismic interval velocities. Norsk GeologiskTidskrift, 73, 3–20.
Riis, F. 1992. Dating and measuring uplift and subsidence in Norway andthe Norwegian shelf in glacial periods. Norsk Geologisk Tidsskrift,72, 325–331.
Riis, F. 1996. Quantification of Cenozoic vertical movements of Scandi-navia by correlation of morphological surfaces with offshore data.Global and Planetary Change, 12, 331–357.
Riis, F. & Fjeldskaar, W. 1992. On the magnitude of the late Tertiary andQuaternary erosion and it significance for the uplift of Scandinaviaand the Barents Sea. In: Larsen, R. M., Brekke, H., Larsen,B. T. & Talleraas, E. (eds) Structural and Tectonic Modellingand its Application to Petroleum Geology. Elsevier, Amsterdam,NPF Special Publications, 1, 163–185.
Ryseth, A., Augustson, J. H. et al. 2003. Cenozoic stratigraphyand evolution of the Sørvestsnaget Basin, southwest Barents Sea.Norwegian Journal of Geology, 83, 107–130.
Sættem, J., Bugge, T. et al. 1994. Cenozoic margin development anderosion of the Barents Sea: core evidence from southwest ofBjørnøya. Marine Geology, 118, 257–281.
Skagen, J. I. 1993. Effects on hydrocarbon potential caused by Tertiaryuplift and erosion in the Barents Sea. In: Vorren, T. O. et al.(eds) Arctic Geology and Petroleum Potential. Elsevier, Amsterdam,NPF Special Publications, 2, 711–719.
Stoupakova, A. V., Henriksen, E. et al. 2011. The geological evolutionand hydrocarbon potential of the Barents and Kara shelves. In:Spencer, A. M., Embry, A. F., Gautier, D. L., Stoupakova, A.V. & Sørensen, K. (eds) Arctic Petroleum Geology. GeologicalSociety, London, Memoirs, 35, 325–344.
Vagnes, E., Faleide, J. I. & Gudlaugsson, S. T. 1992. Glacial erosionand tectonic uplift in the Barents Sea. Norsk Geologisk Tidsskrift,72, 333–338.
Vassmyr, S. 1989. Barents Sea Conference Work Shop. Harstad.Abstract.
Vorren, T. O., Richardsen, G., Knutsen, S.-M. & Henriksen, E. 1990.The Western Barents Sea during the Cenozoic. In: Blei, U. &Thiede, J. (eds) Geological History of the Polar Oceans: Arcticv. Antarctic. Kluver, Dordrecht, NATO ASI Series, 95–118.
Vorren, T. O., Richardsen, G., Knutsen, S. M. & Henriksen, E. 1991.Cenozoic erosion and sedimentation in the western Barents Sea.Marine Petroleum Geology, 8, 317–340.
Vagnes, E. 1997. Uplift at thermo-mechanically coupled ocean–continenttransforms: modeled at the Senja Fracture Zone, southwesternBarents Sea. Geo-Marine Letters, 17, 100–109.
Walderhaug, O. 1992. Magnitude of uplift of the Stø and Nordmelaformations in the Hammerfest Basin – a diagenetic approach.Norsk Geologisk Tidsskrift, 72, 321–323.
Wilhelms, A., Larter, S. R., Head, I., Farrimond, P., di-Primio, R. &Zwach, C. 2001. Biodegradation of oil in uplifted basins preventedby deep-burial sterilization. Nature, 411, 1034–1037.
CHAPTER 17 UPLIFT AND EROSION OF THE GREATER BARENTS SEA 281


![Welcome! [] · • Repair infrastructure at risk of being compromised by uplift and erosion; and • Improve risk communication to reduce consequences. ♦ Potential Failure Modes:](https://img.pdfslide.net/doc/110x75/5f58ea29819f04303c530812/welcome-a-repair-infrastructure-at-risk-of-being-compromised-by-uplift-and.jpg)