Embed Size (px)
Citation preview
Chapter 3
Load and Stress Analysis
Faculty of Engineering
Mechanical Dept.
Chapter Outline
Shigley’s Mechanical Engineering Design
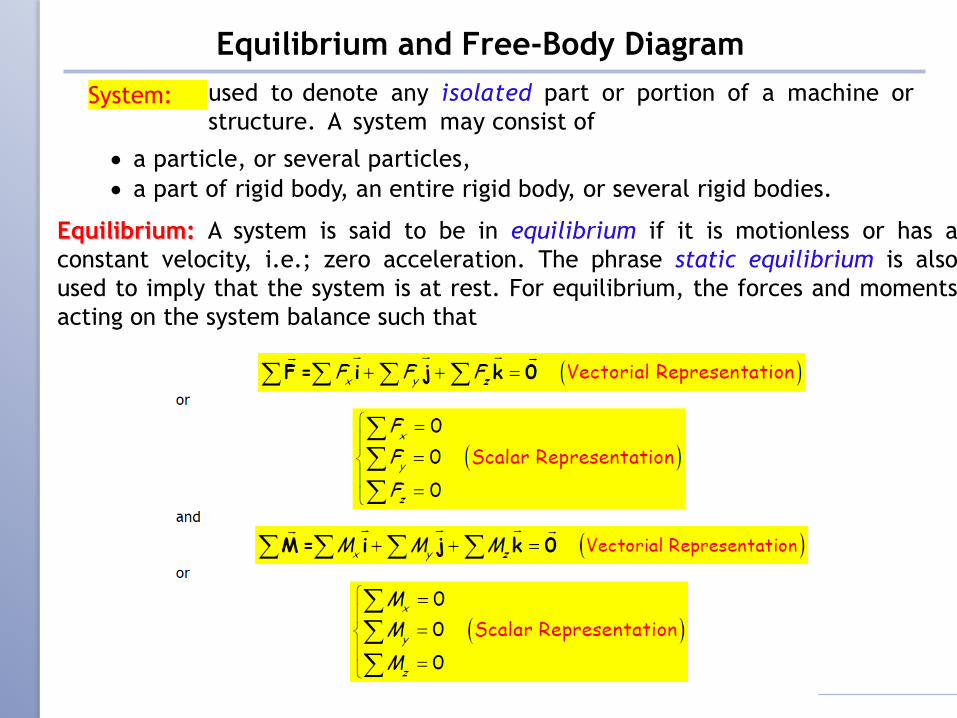
Equilibrium and Free-Body Diagram
System: used to denote any isolated part or portion of a machine or
structure. A system may consist of
a particle, or several particles,
a part of rigid body, an entire rigid body, or several rigid bodies.
Equilibrium: A system is said to be in equilibrium if it is motionless or has a
constant velocity, i.e.; zero acceleration. The phrase static equilibrium is also
used to imply that the system is at rest. For equilibrium, the forces and moments
acting on the system balance such that
Shigley’s Mechanical Engineering Design
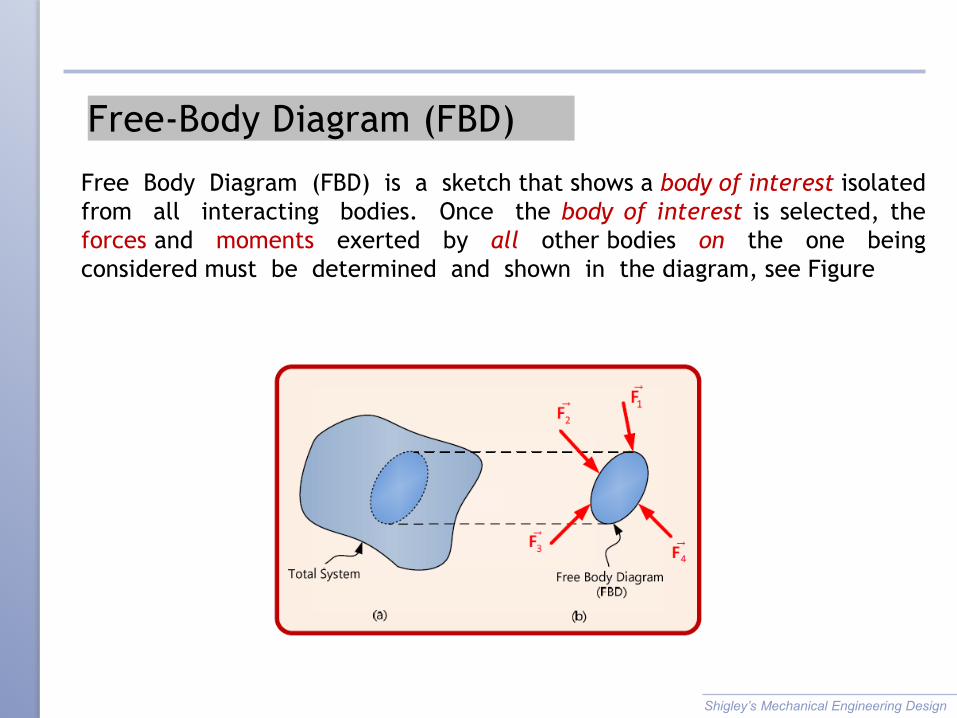
Free-Body Diagram (FBD)
Free Body Diagram (FBD) is a sketch that shows a body of interest isolated
from all interacting bodies. Once the body of interest is selected, the
forces and moments exerted by all other bodies on the one being
considered must be determined and shown in the diagram, see Figure
Free-Body Diagram
Shigley’s Mechanical Engineering Design
The diagram establishes the directions of reference axes, provides a place
to record the dimensions of the subsystem and the magnitudes and
directions of the known forces, and helps in assuming the directions of
unknown forces.
The diagram simplifies your thinking because it provides a place to store
one thought while proceeding to the next.
The diagram provides a means of communicating your thoughts clearly and
unambiguously to other people.
Careful and complete construction of the diagram clarifies fuzzy thinking by
bringing out various points that are not always apparent in the statement or
in the geometry of the total problem. Thus, the diagram aids in
understanding all facets of the problem.
The diagram helps in the planning of a logical attack on the problem and in
setting up the mathematical relations.
The diagram helps in recording progress in the solution and in illustrating
the methods used.
The diagram allows others to follow your reasoning, showing all forces.
Shigley’s Mechanical Engineering Design
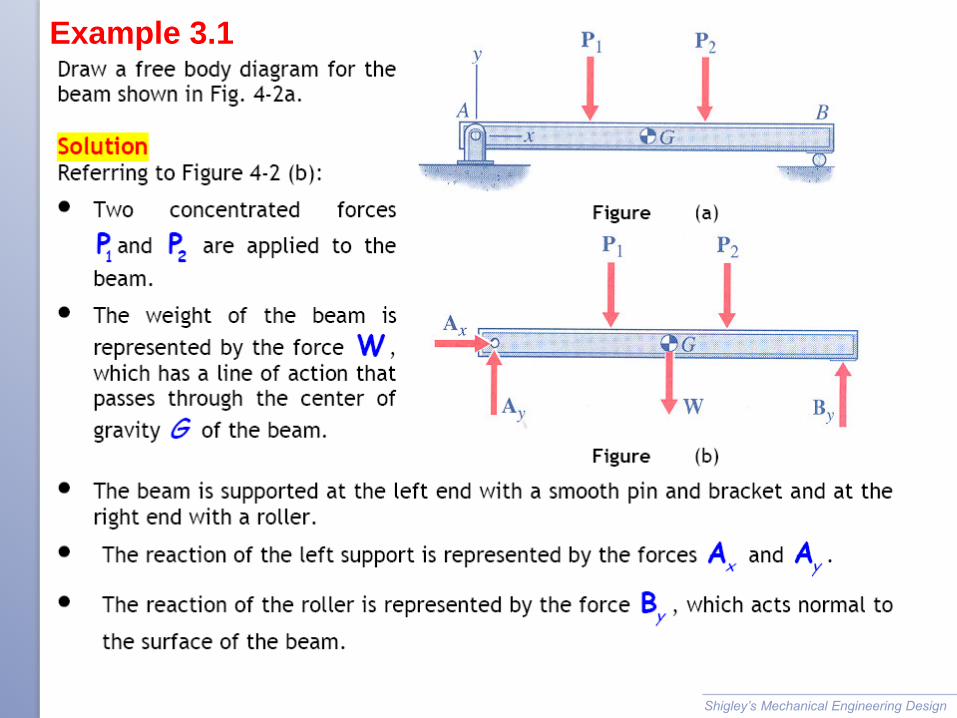
Example 3.1
Free-Body Diagram Example 3-2
Shigley’s Mechanical Engineering Design
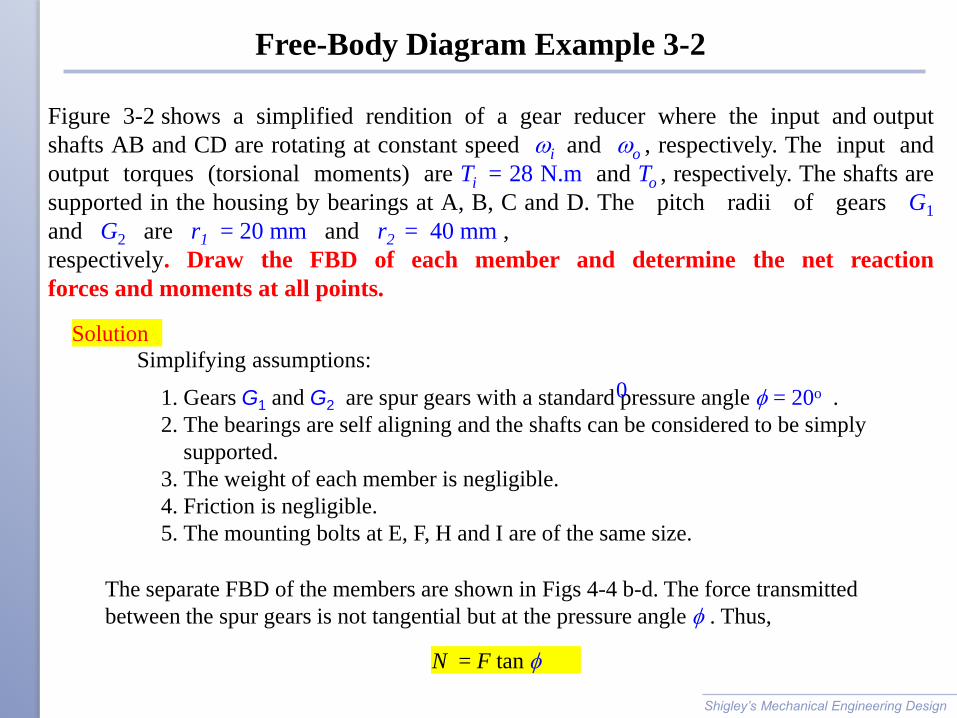
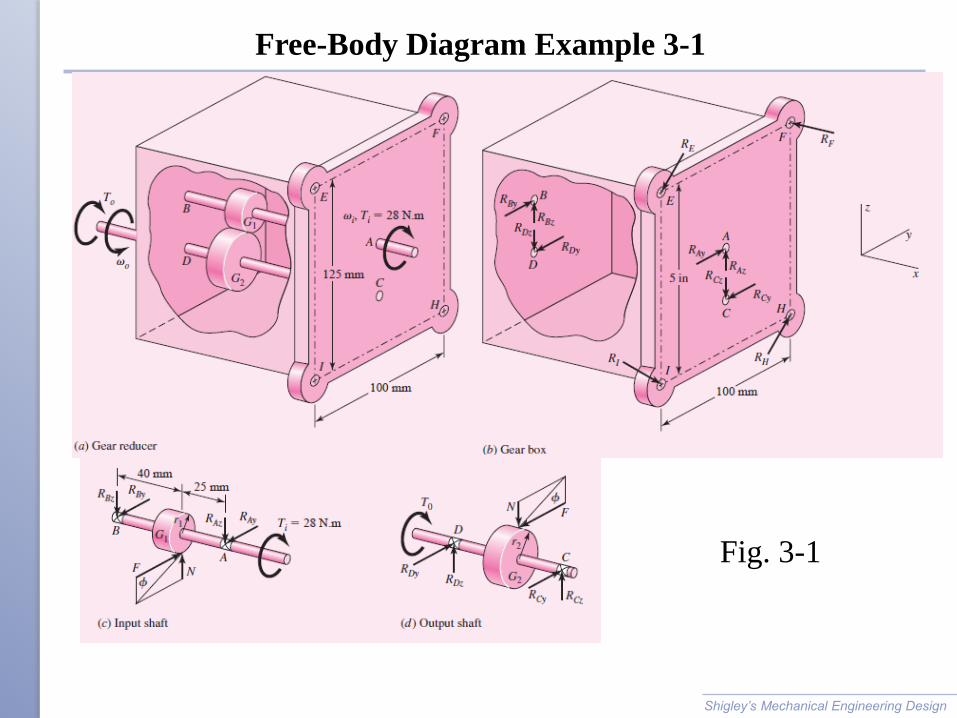
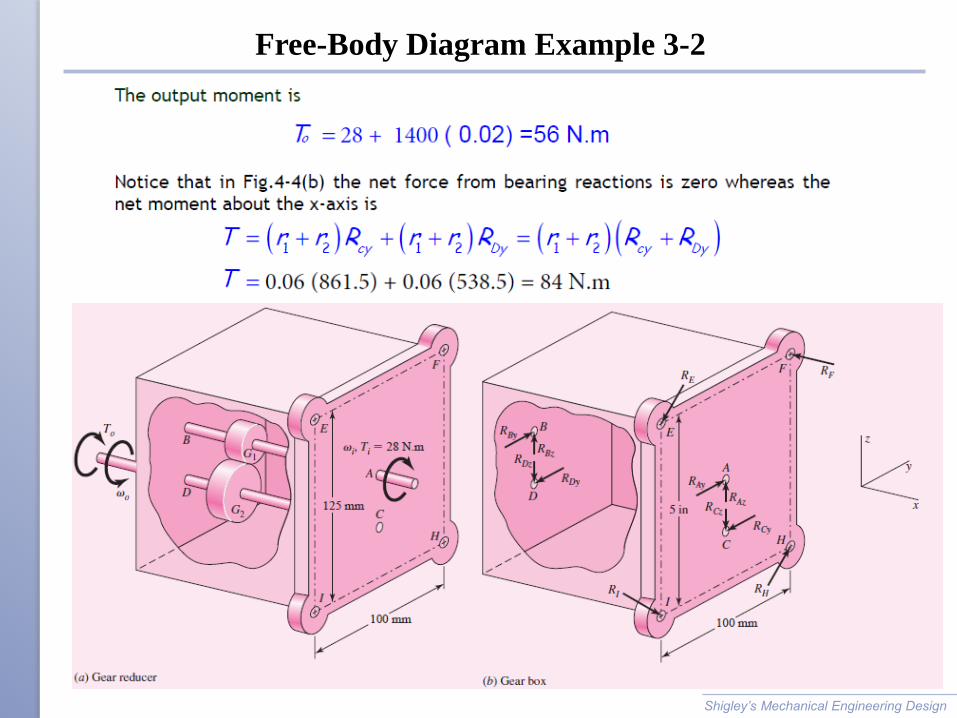
Figure 3-2 shows a simplified rendition of a gear reducer where the input and output
shafts AB and CD are rotating at constant speed i and o , respectively. The input and
output torques (torsional moments) are Ti = 28 N.m and To , respectively. The shafts are
supported in the housing by bearings at A, B, C and D. The pitch radii of gears G1
and G2 are r1 = 20 mm and r2 = 40 mm ,
respectively. Draw the FBD of each member and determine the net reaction
forces and moments at all points.
Solution
Simplifying assumptions:
1. Gears G1 and G2 are spur gears with a standard pressure angle = 20o .
2. The bearings are self aligning and the shafts can be considered to be simply
supported.
3. The weight of each member is negligible.
4. Friction is negligible.
5. The mounting bolts at E, F, H and I are of the same size.
0
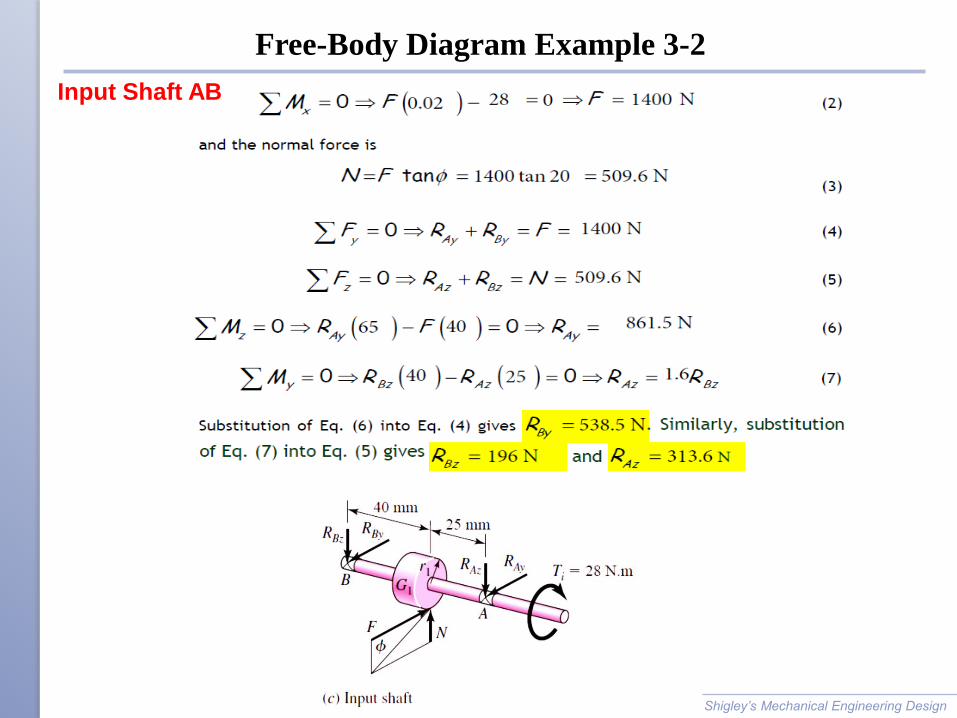
The separate FBD of the members are shown in Figs 4-4 b-d. The force transmitted
between the spur gears is not tangential but at the pressure angle . Thus,
N = F tan
Free-Body Diagram Example 3-1
Shigley’s Mechanical Engineering Design
Fig. 3-1
Free-Body Diagram Example 3-2
Shigley’s Mechanical Engineering Design
Input Shaft AB
Shigley’s Mechanical Engineering Design
Free-Body Diagram Example 3-2
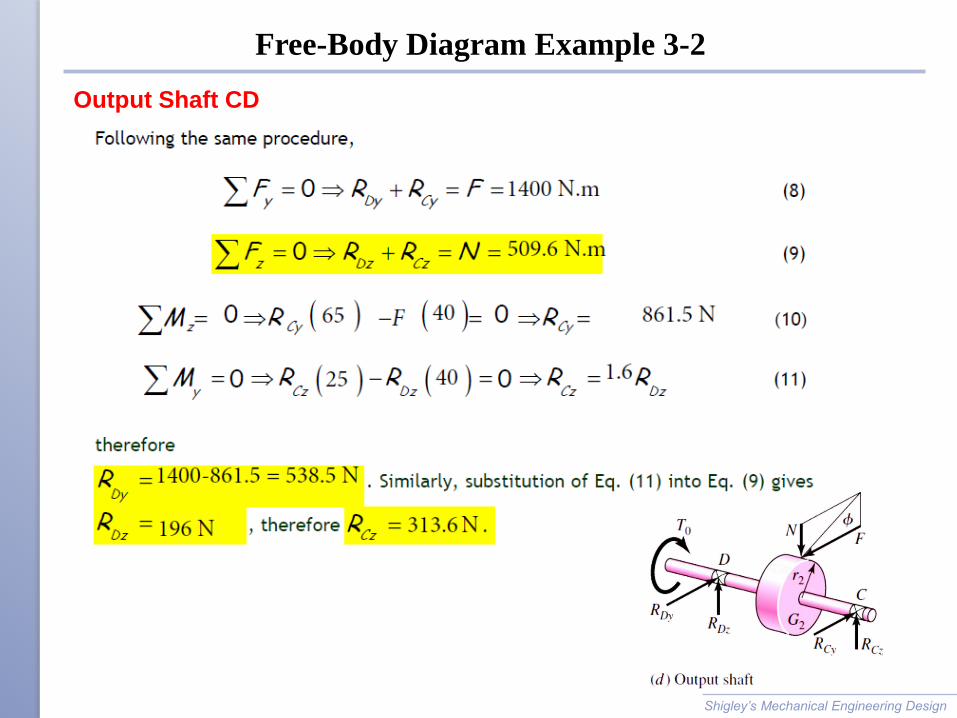
Output Shaft CD
Free-Body Diagram Example 3-2
Shigley’s Mechanical Engineering Design
Shigley’s Mechanical Engineering Design
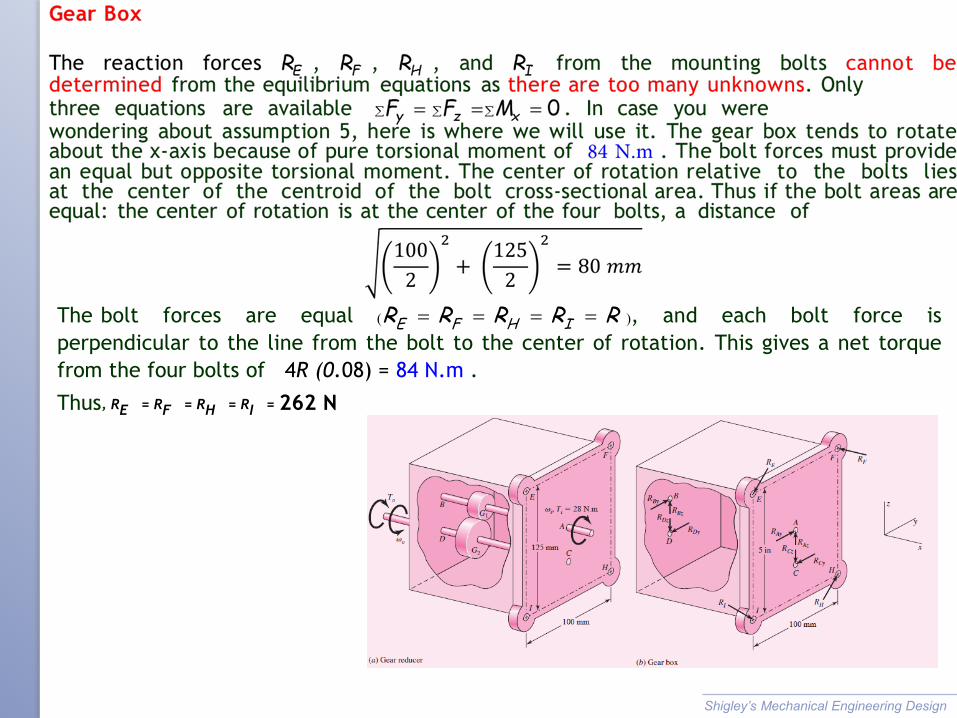
The bolt forces are equal RE RF RH RI R , and each bolt force is
perpendicular to the line from the bolt to the center of rotation. This gives a net torque
from the four bolts of 4R (0.08) = 84 N.m .
Thus, RE = RF = RH = RI = 262 N
Shear Force and Bending Moments in Beams
Shigley’s Mechanical Engineering Design
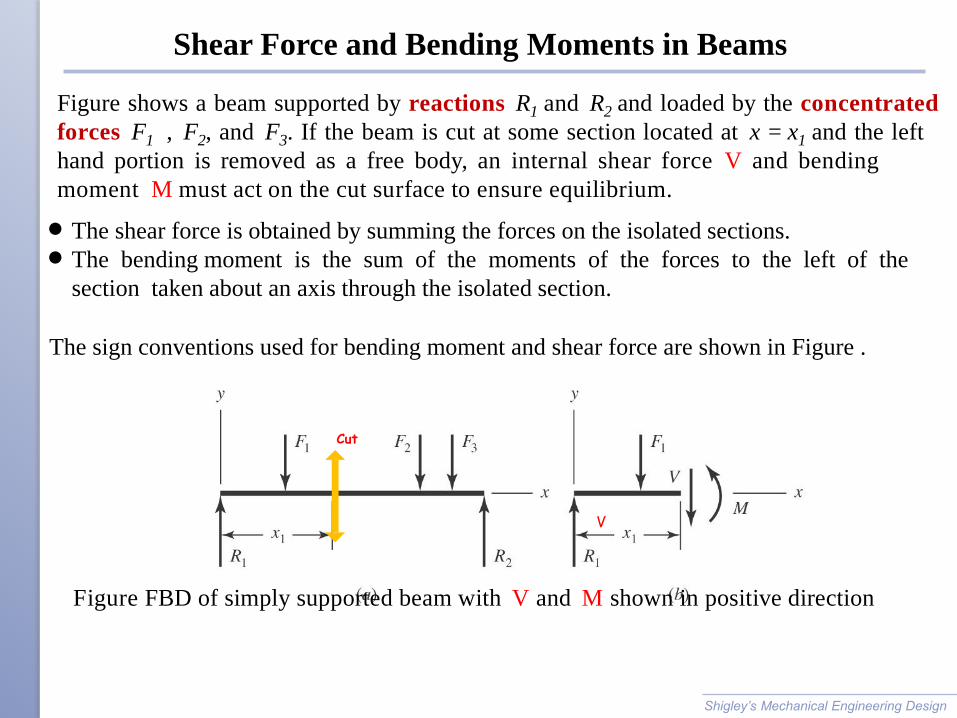
The shear force is obtained by summing the forces on the isolated sections.
The bending moment is the sum of the moments of the forces to the left of the
section taken about an axis through the isolated section.
The sign conventions used for bending moment and shear force are shown in Figure .
Figure shows a beam supported by reactions R1 and R2 and loaded by the concentrated
forces F1 , F2, and F3. If the beam is cut at some section located at x = x1 and the left
hand portion is removed as a free body, an internal shear force V and bending
moment M must act on the cut surface to ensure equilibrium.
Figure FBD of simply supported beam with V and M shown in positive direction
Cut
V
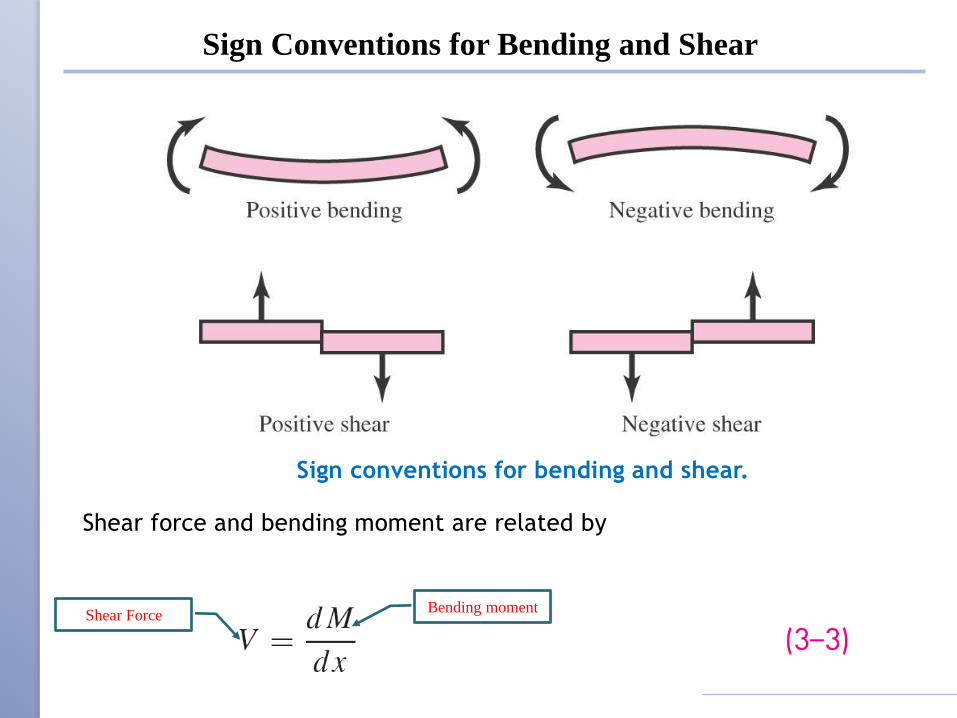
Sign Conventions for Bending and Shear
Sign conventions for bending and shear.
Shear force and bending moment are related by
Bending moment Shear Force
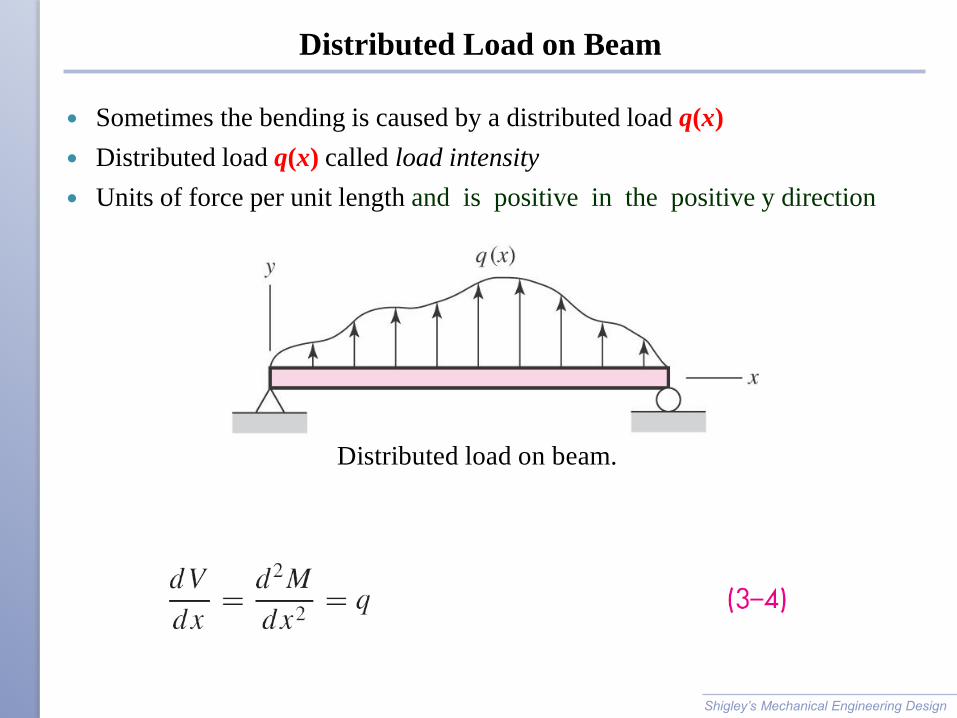
Distributed Load on Beam
Sometimes the bending is caused by a distributed load q(x)
Distributed load q(x) called load intensity
Units of force per unit length and is positive in the positive y direction
Shigley’s Mechanical Engineering Design
Distributed load on beam.
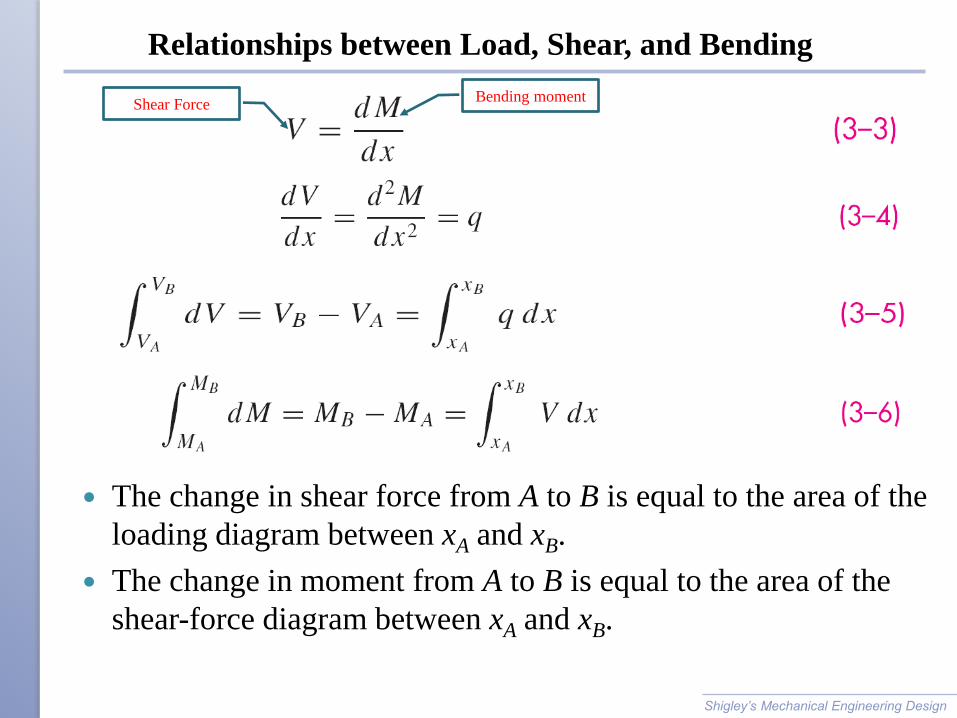
Relationships between Load, Shear, and Bending
The change in shear force from A to B is equal to the area of the
loading diagram between xA and xB.
The change in moment from A to B is equal to the area of the
shear-force diagram between xA and xB.
Shigley’s Mechanical Engineering Design
Bending moment Shear Force
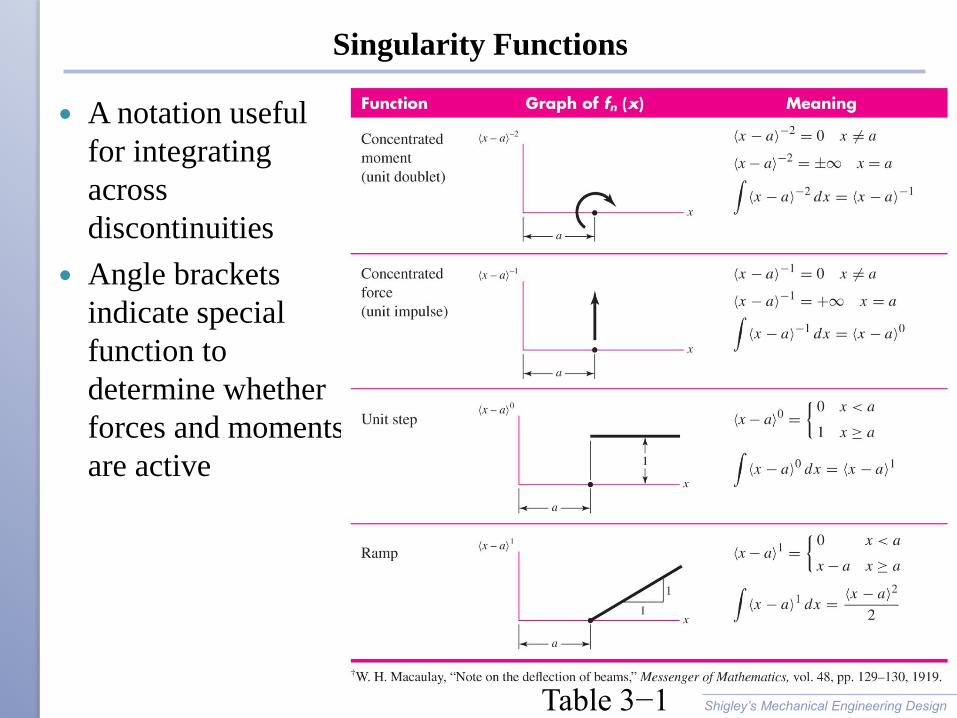
Singularity Functions
A notation useful
for integrating
across
discontinuities
Angle brackets
indicate special
function to
determine whether
forces and moments
are active
Shigley’s Mechanical Engineering Design Table 3−1
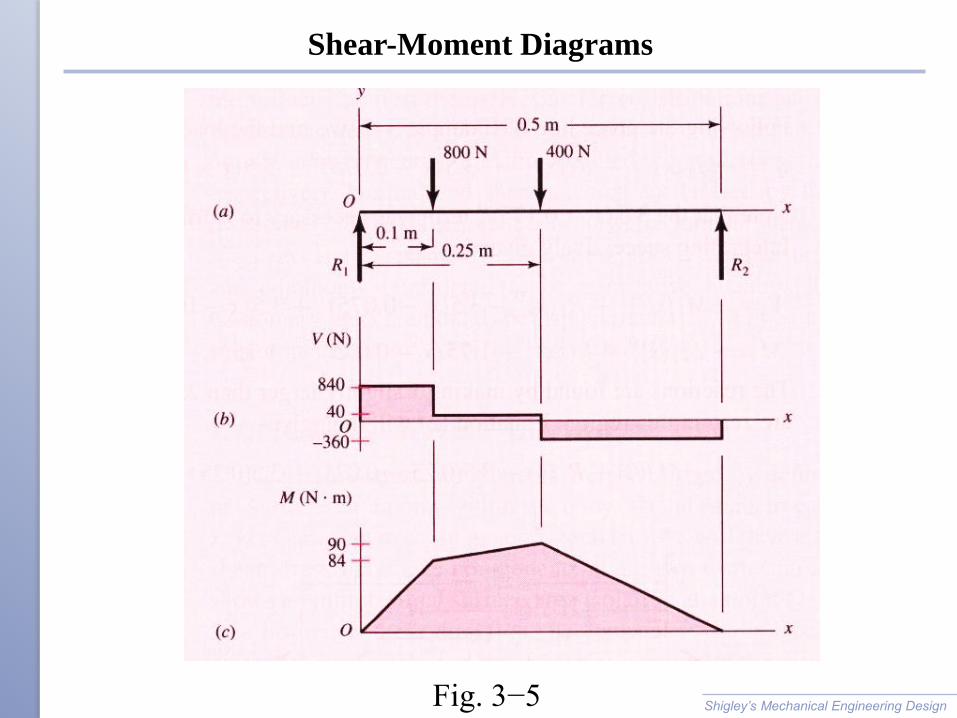
Shear-Moment Diagrams
Shigley’s Mechanical Engineering Design Fig. 3−5
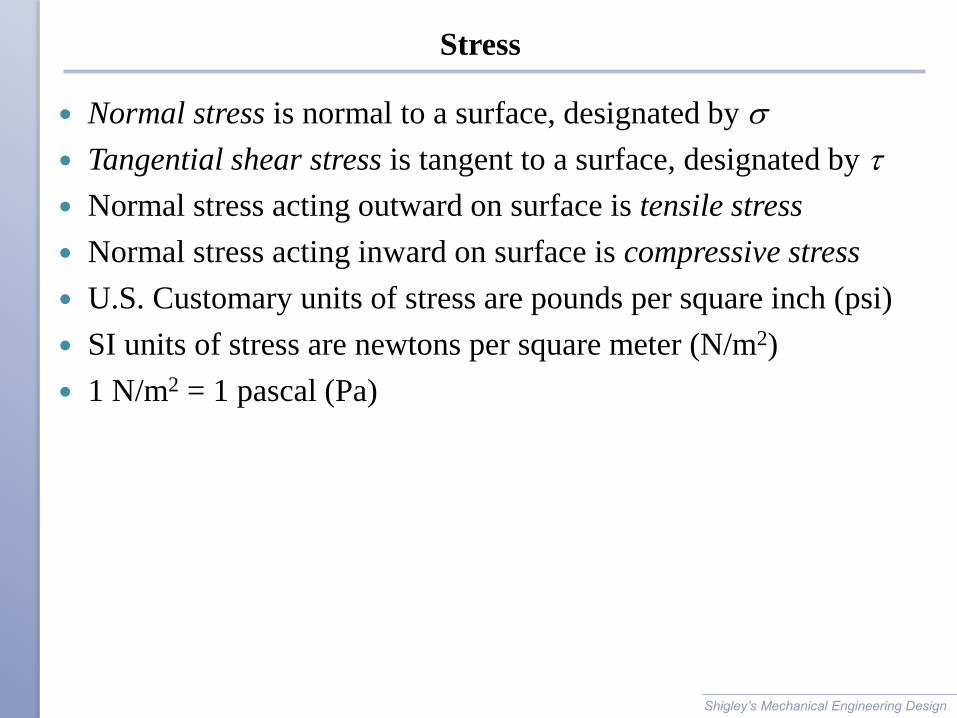
Stress
Normal stress is normal to a surface, designated by s
Tangential shear stress is tangent to a surface, designated by t
Normal stress acting outward on surface is tensile stress
Normal stress acting inward on surface is compressive stress
U.S. Customary units of stress are pounds per square inch (psi)
SI units of stress are newtons per square meter (N/m2)
1 N/m2 = 1 pascal (Pa)
Shigley’s Mechanical Engineering Design
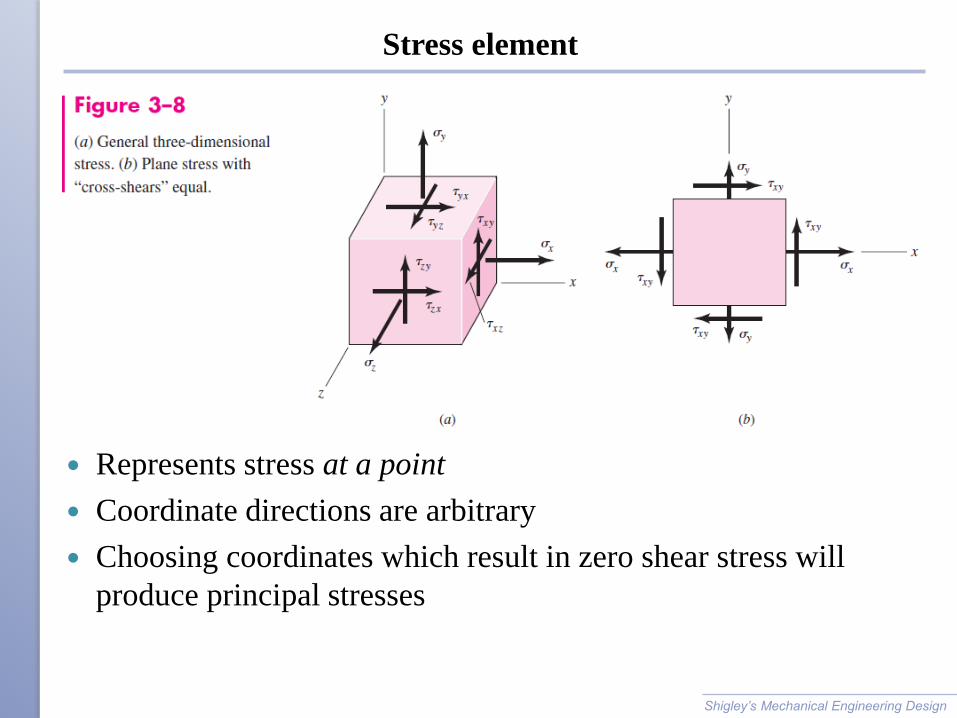
Stress element
Represents stress at a point
Coordinate directions are arbitrary
Choosing coordinates which result in zero shear stress will
produce principal stresses
Shigley’s Mechanical Engineering Design
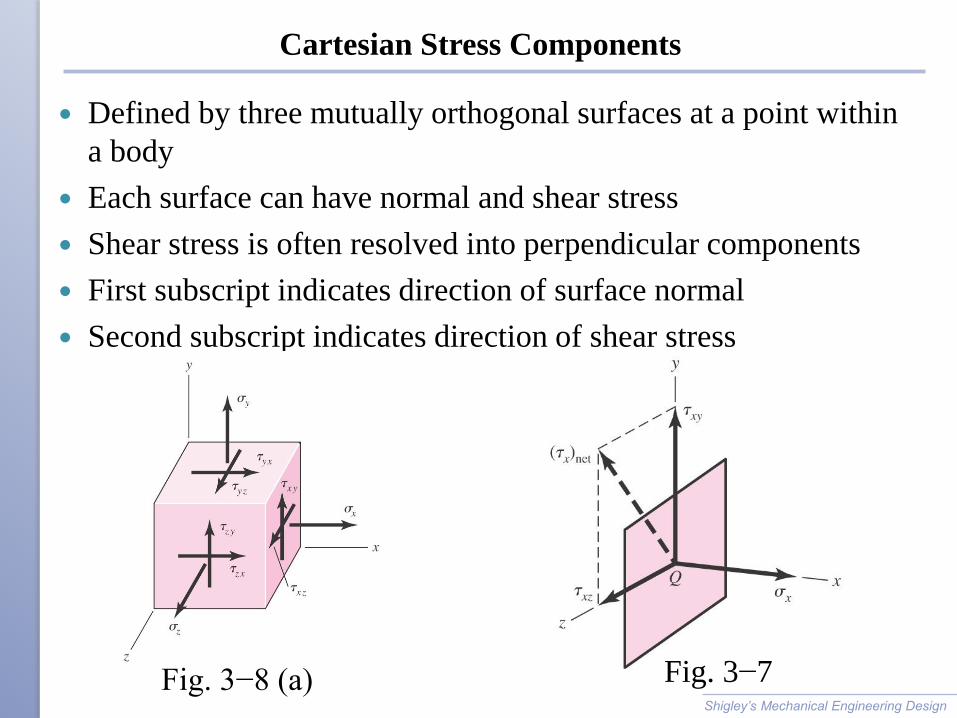
Cartesian Stress Components
Defined by three mutually orthogonal surfaces at a point within
a body
Each surface can have normal and shear stress
Shear stress is often resolved into perpendicular components
First subscript indicates direction of surface normal
Second subscript indicates direction of shear stress
Shigley’s Mechanical Engineering Design
Fig. 3−7 Fig. 3−8 (a)
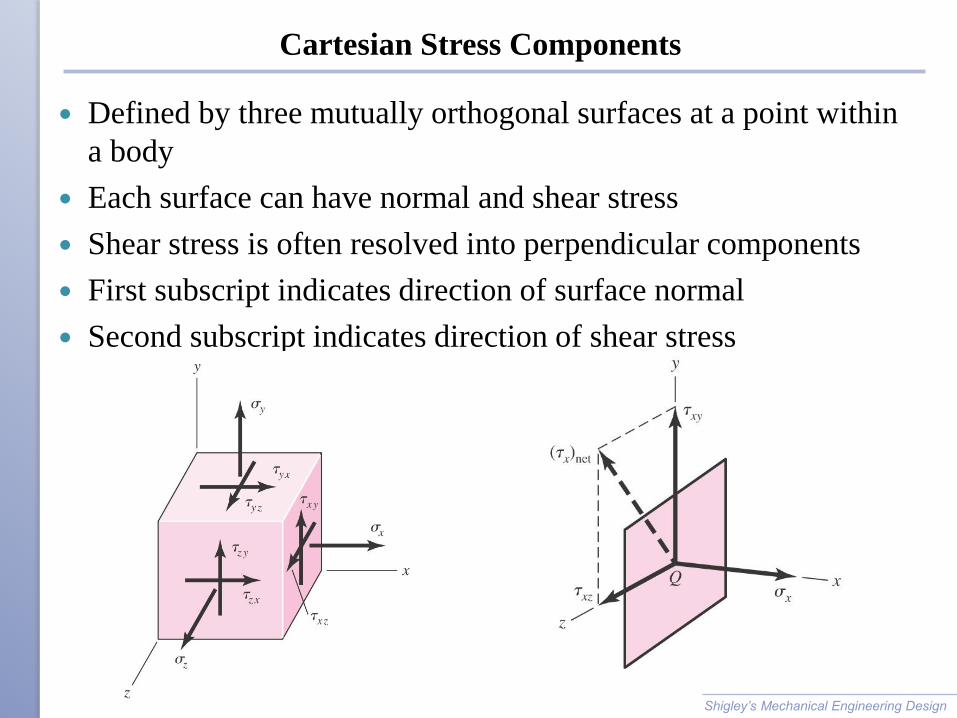
Cartesian Stress Components
Defined by three mutually orthogonal surfaces at a point within
a body
Each surface can have normal and shear stress
Shear stress is often resolved into perpendicular components
First subscript indicates direction of surface normal
Second subscript indicates direction of shear stress
Shigley’s Mechanical Engineering Design
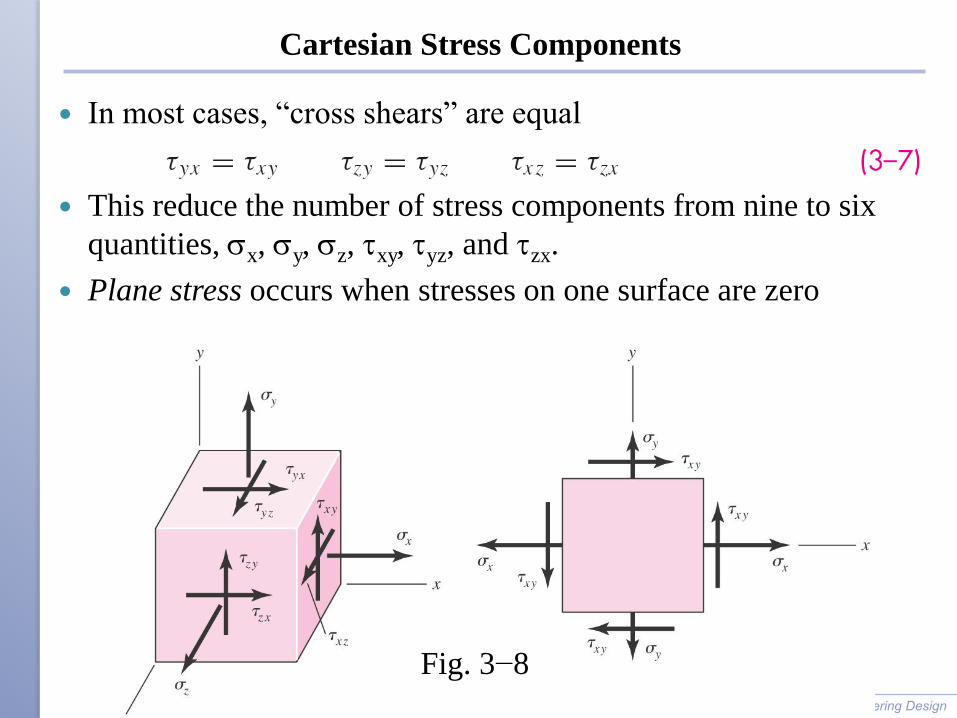
Cartesian Stress Components
In most cases, “cross shears” are equal
This reduce the number of stress components from nine to six
quantities, sx, sy, sz, txy, tyz, and tzx.
Plane stress occurs when stresses on one surface are zero
Shigley’s Mechanical Engineering Design
Fig. 3−8
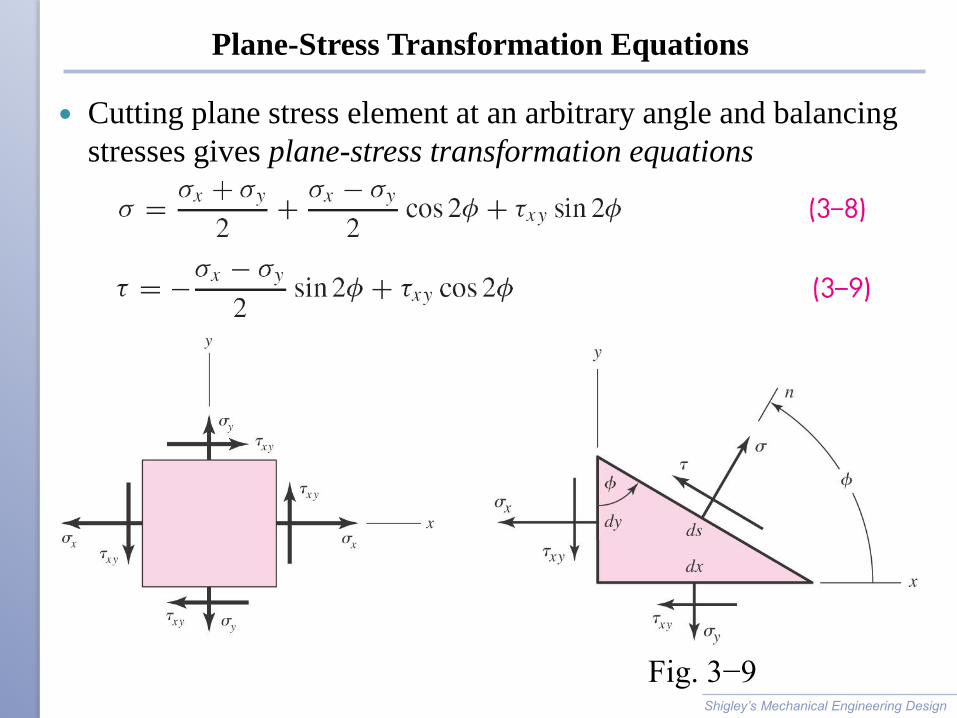
Plane-Stress Transformation Equations
Cutting plane stress element at an arbitrary angle and balancing
stresses gives plane-stress transformation equations
Shigley’s Mechanical Engineering Design
Fig. 3−9
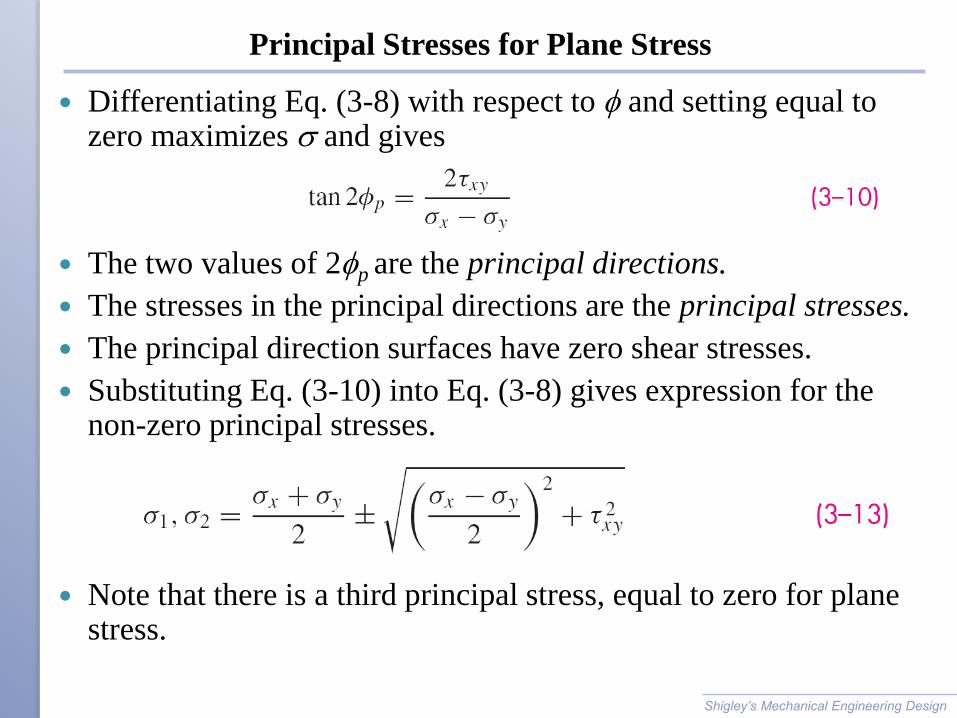
Principal Stresses for Plane Stress
Differentiating Eq. (3-8) with respect to and setting equal to zero maximizes s and gives
The two values of 2p are the principal directions.
The stresses in the principal directions are the principal stresses.
The principal direction surfaces have zero shear stresses.
Substituting Eq. (3-10) into Eq. (3-8) gives expression for the non-zero principal stresses.
Note that there is a third principal stress, equal to zero for plane stress.
Shigley’s Mechanical Engineering Design
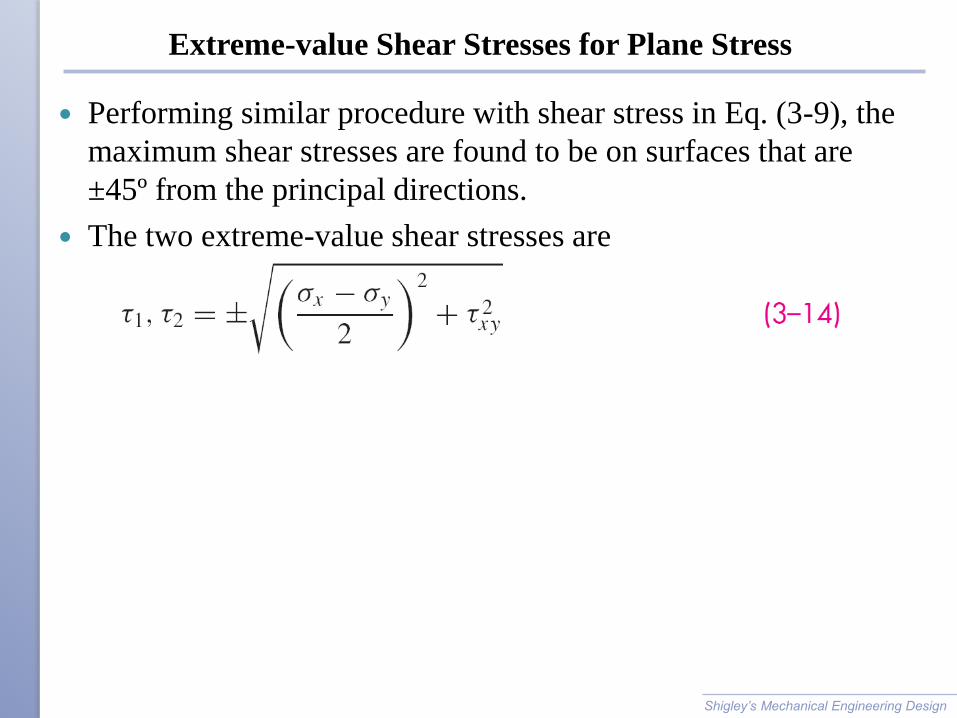
Extreme-value Shear Stresses for Plane Stress
Performing similar procedure with shear stress in Eq. (3-9), the
maximum shear stresses are found to be on surfaces that are
±45º from the principal directions.
The two extreme-value shear stresses are
Shigley’s Mechanical Engineering Design
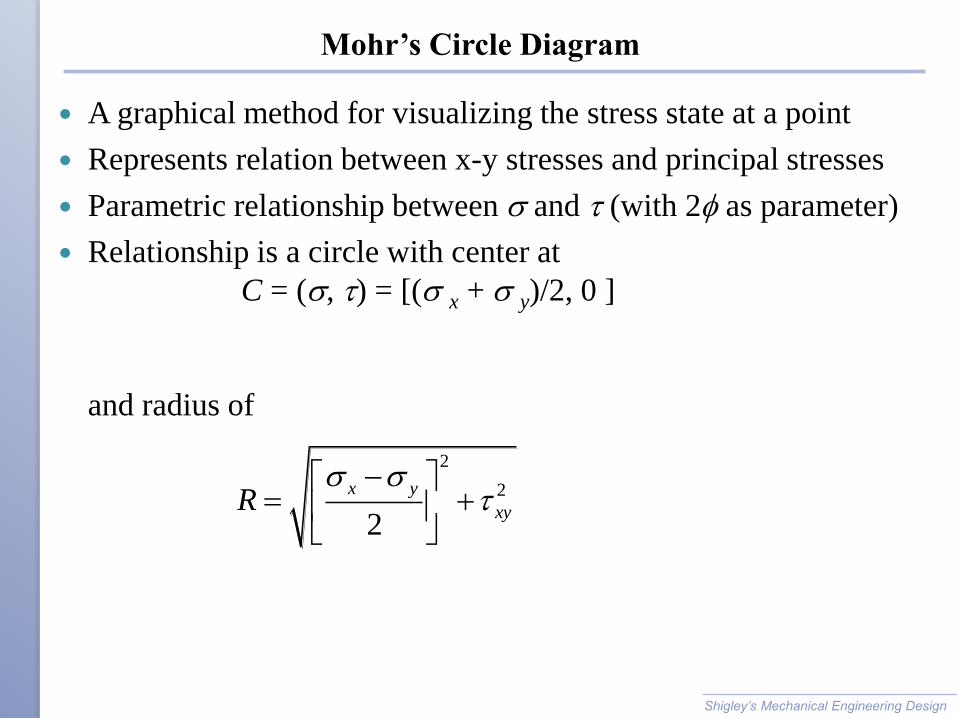
Mohr’s Circle Diagram
A graphical method for visualizing the stress state at a point
Represents relation between x-y stresses and principal stresses
Parametric relationship between s and t (with 2 as parameter)
Relationship is a circle with center at
C = (s, t) = [(s x + s y)/2, 0 ]
and radius of
Shigley’s Mechanical Engineering Design
2
2
2
x y
xyRs s
t
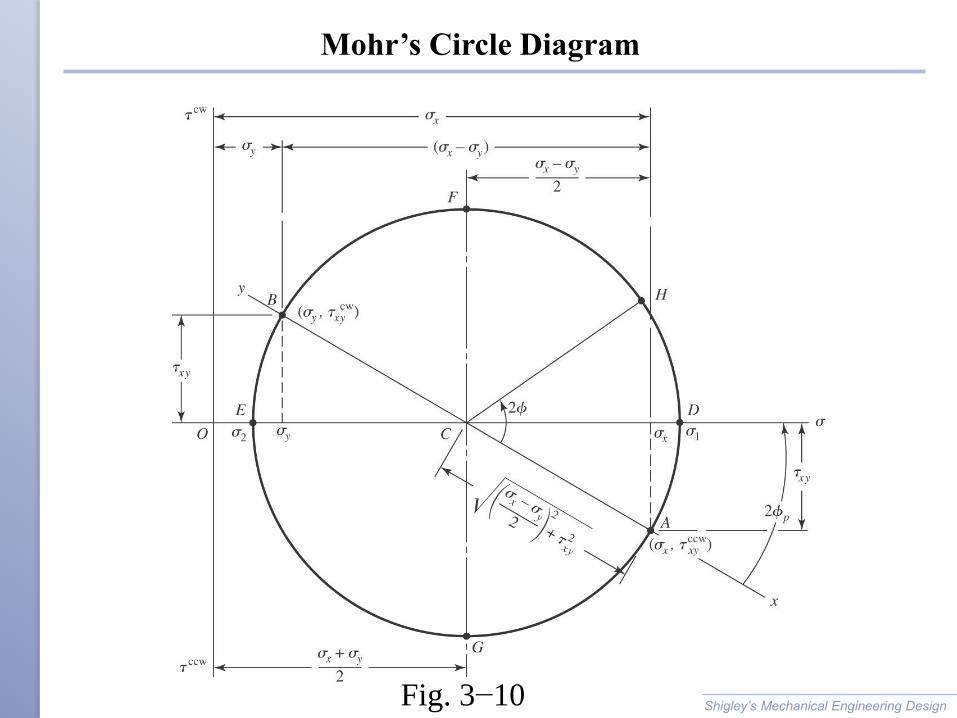
Mohr’s Circle Diagram
Shigley’s Mechanical Engineering Design Fig. 3−10
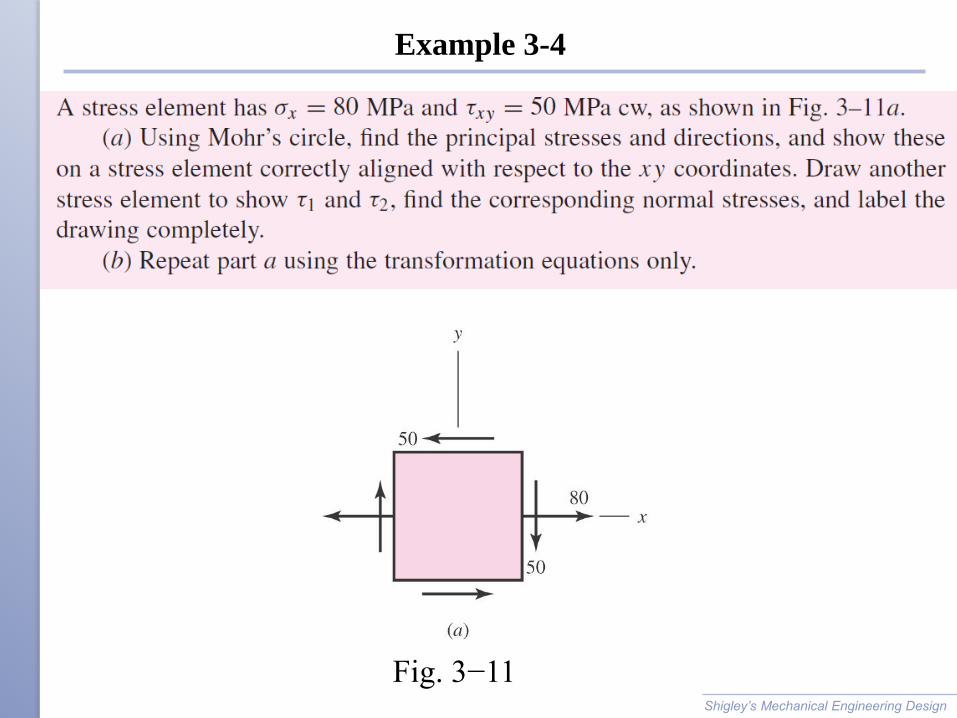
Example 3-4
Shigley’s Mechanical Engineering Design
Fig. 3−11
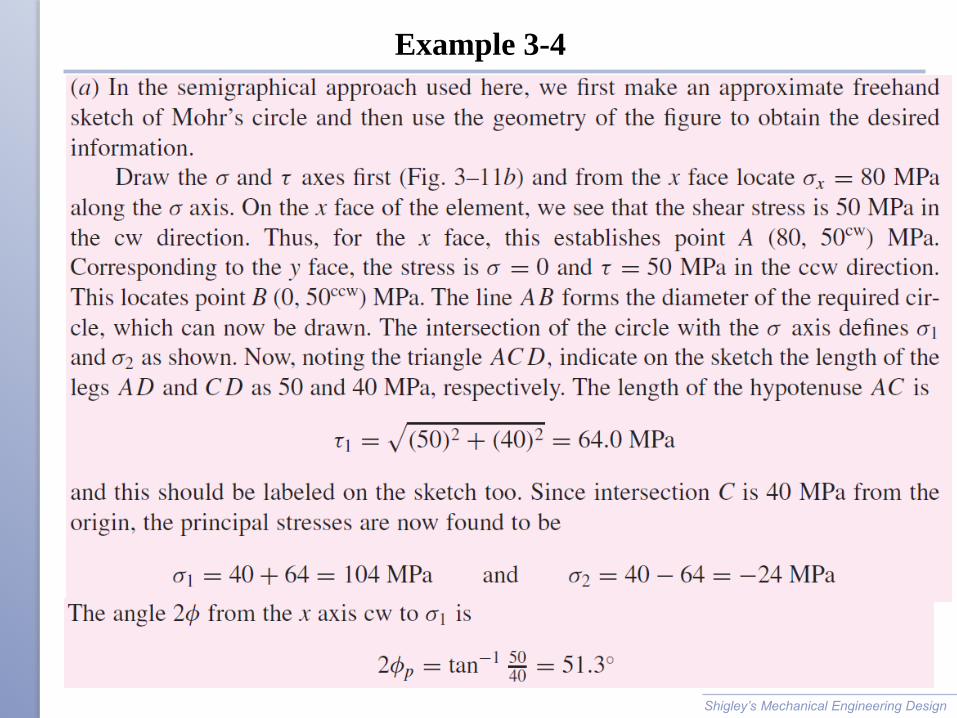
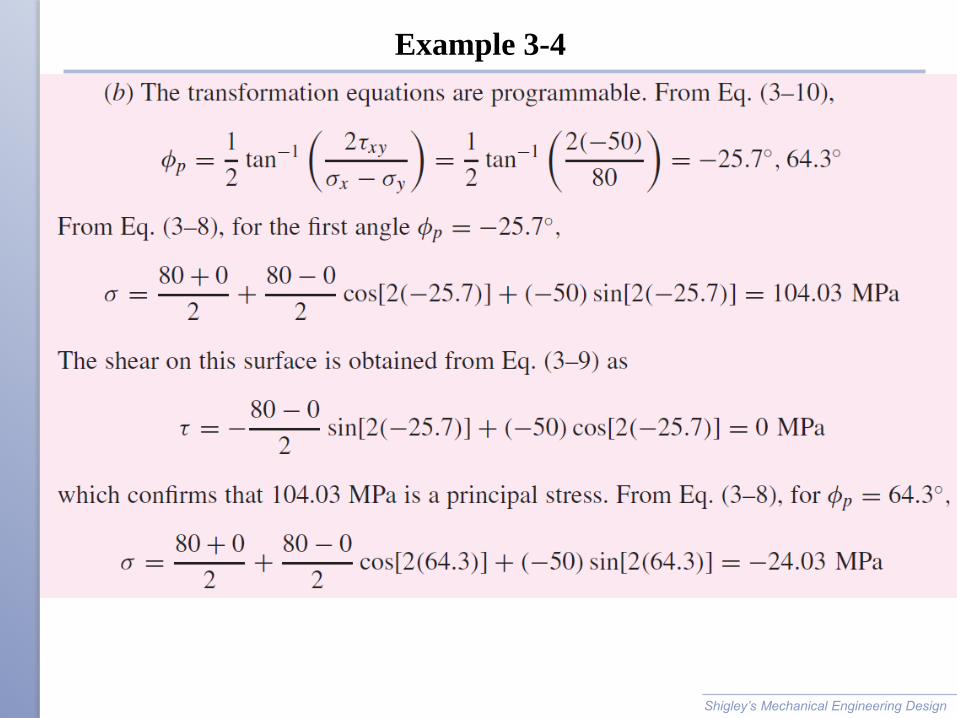
Example 3-4
Shigley’s Mechanical Engineering Design
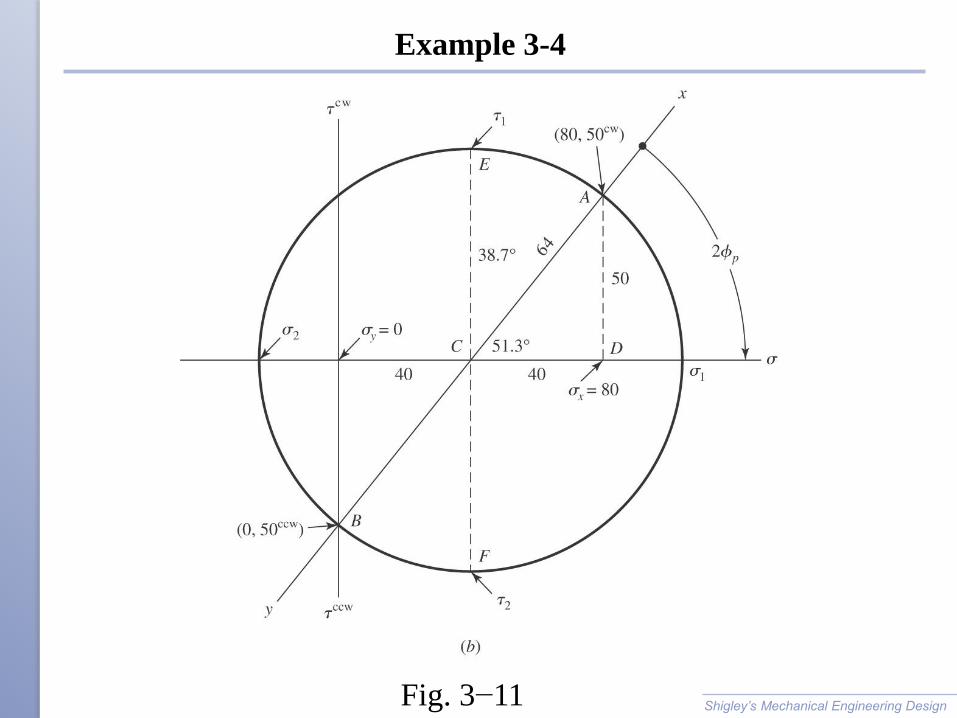
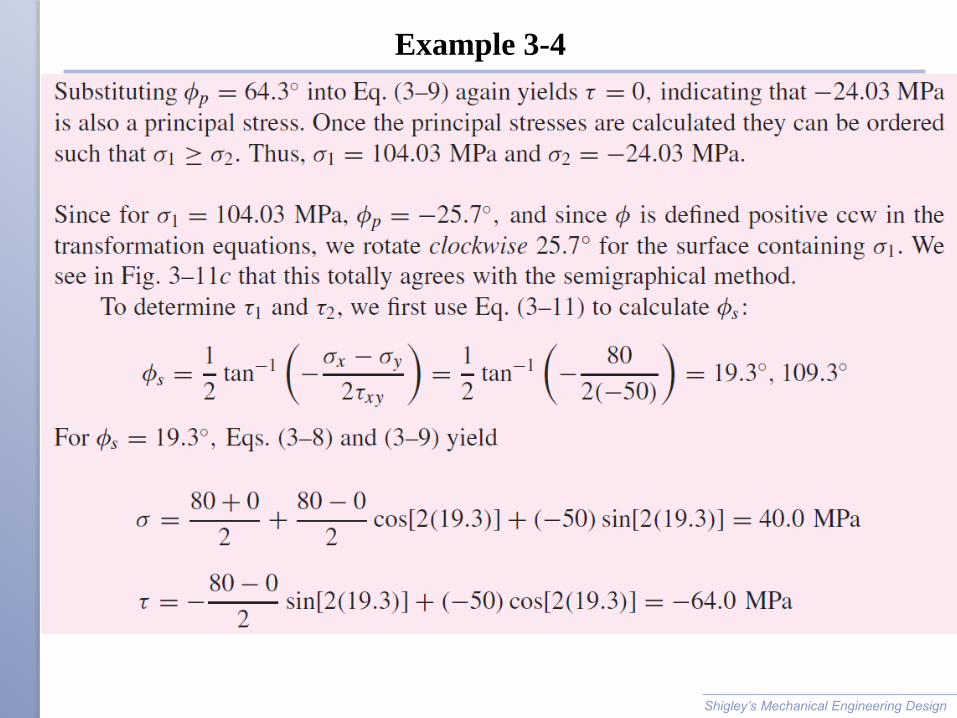
Example 3-4
Shigley’s Mechanical Engineering Design Fig. 3−11
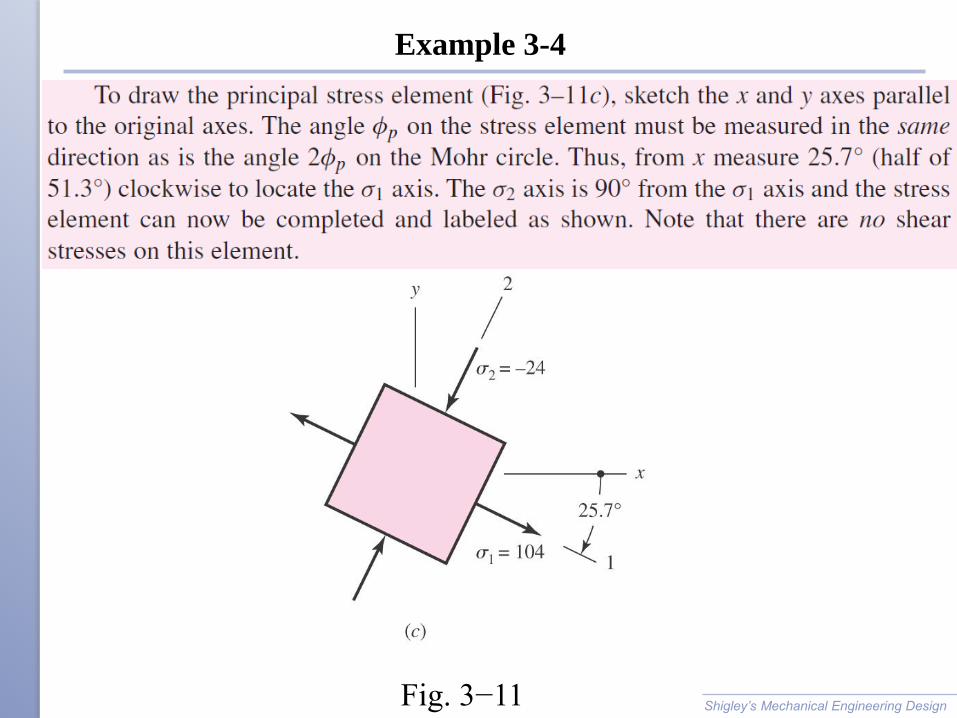
Example 3-4
Shigley’s Mechanical Engineering Design Fig. 3−11
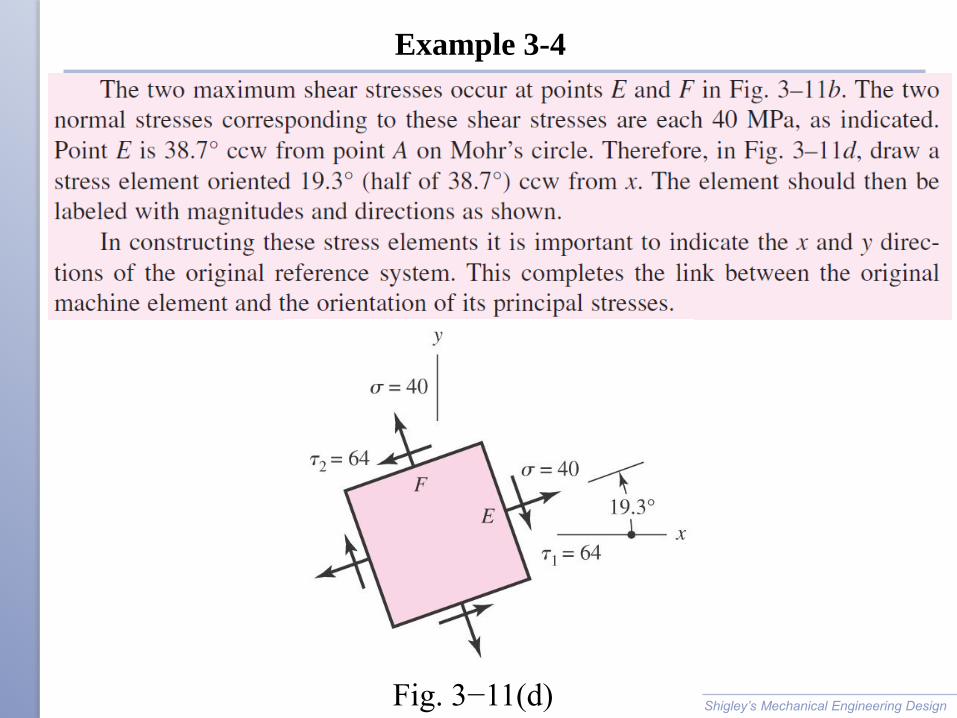
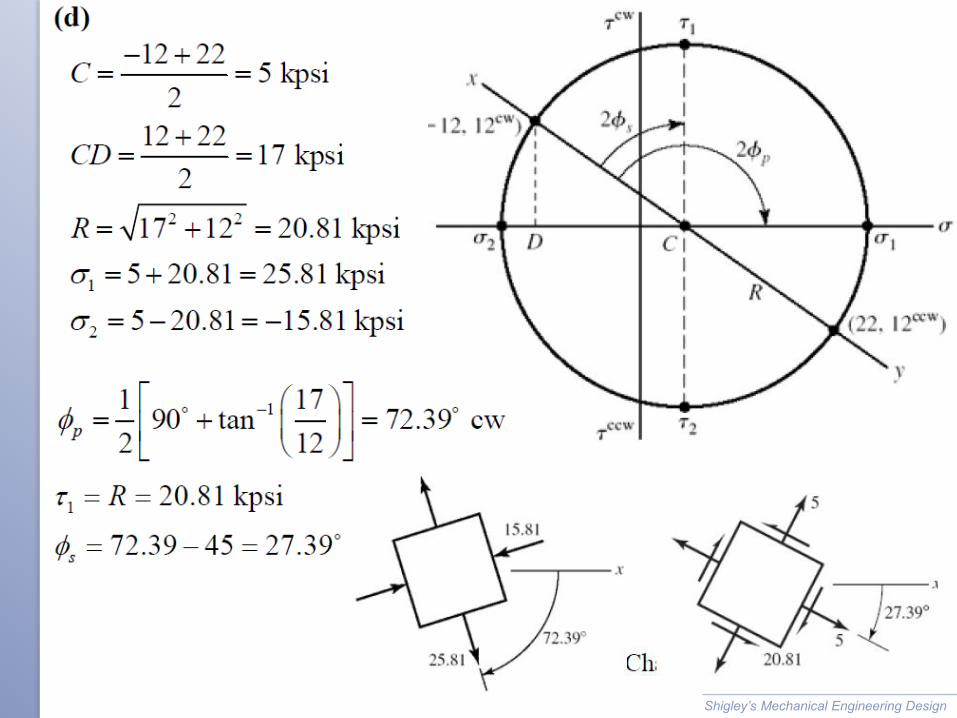
Example 3-4
Shigley’s Mechanical Engineering Design Fig. 3−11(d)
Example 3-4
Shigley’s Mechanical Engineering Design
Example 3-4
Shigley’s Mechanical Engineering Design
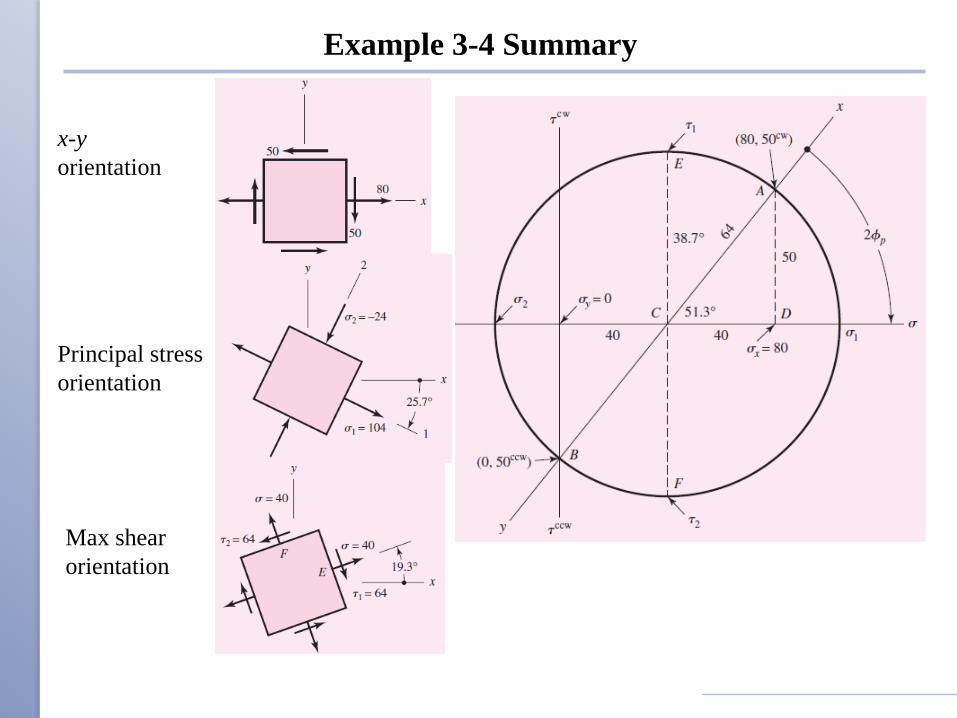
Example 3-4 Summary
x-y
orientation
Principal stress
orientation
Max shear
orientation
Shigley’s Mechanical Engineering Design
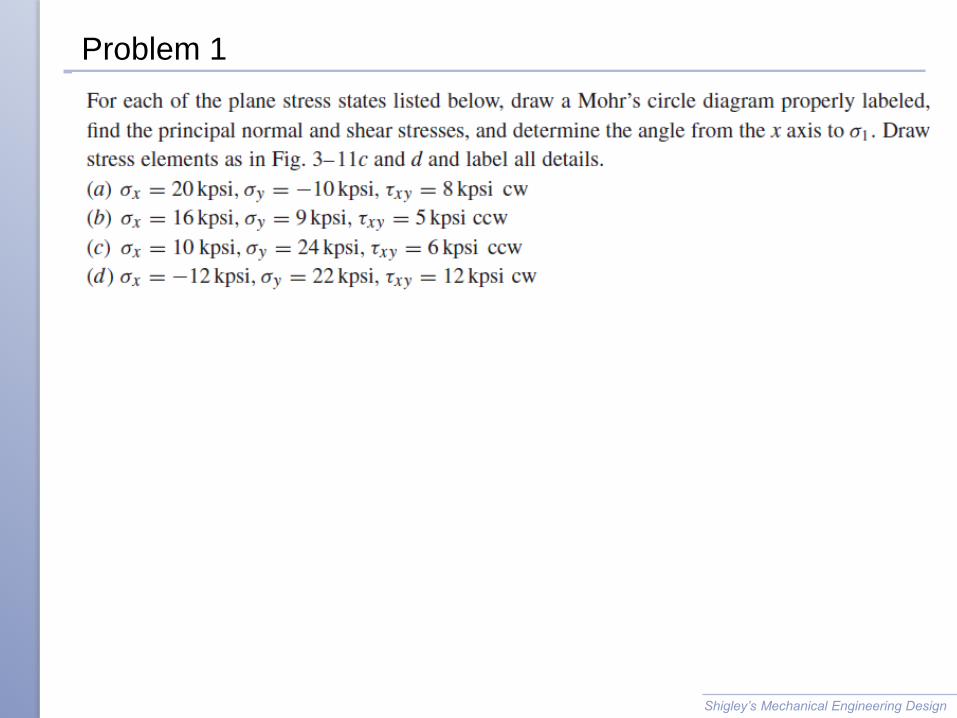
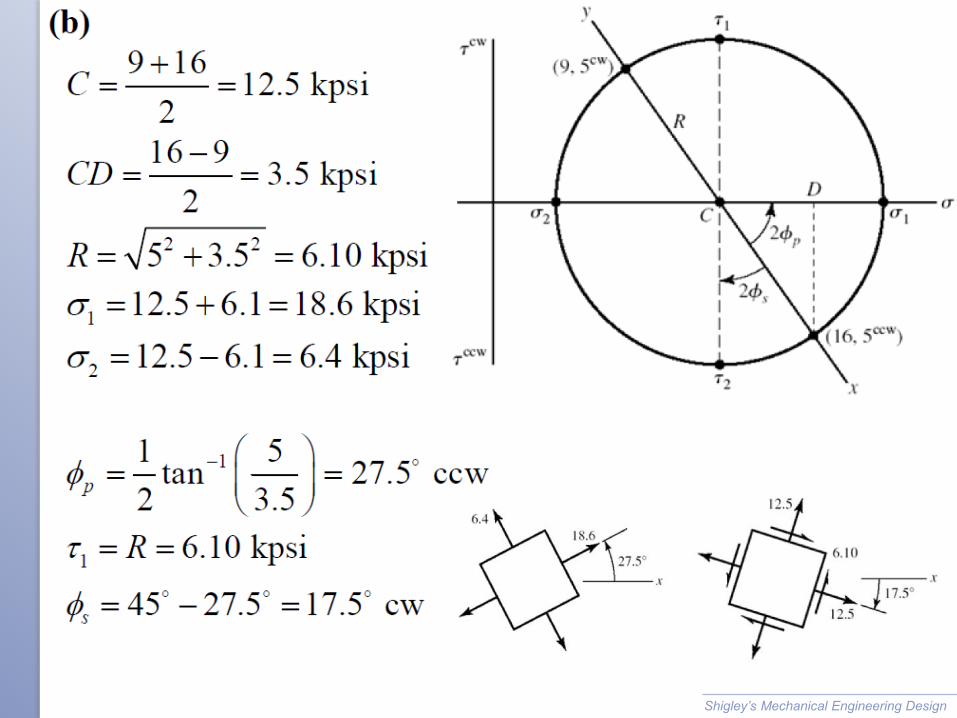
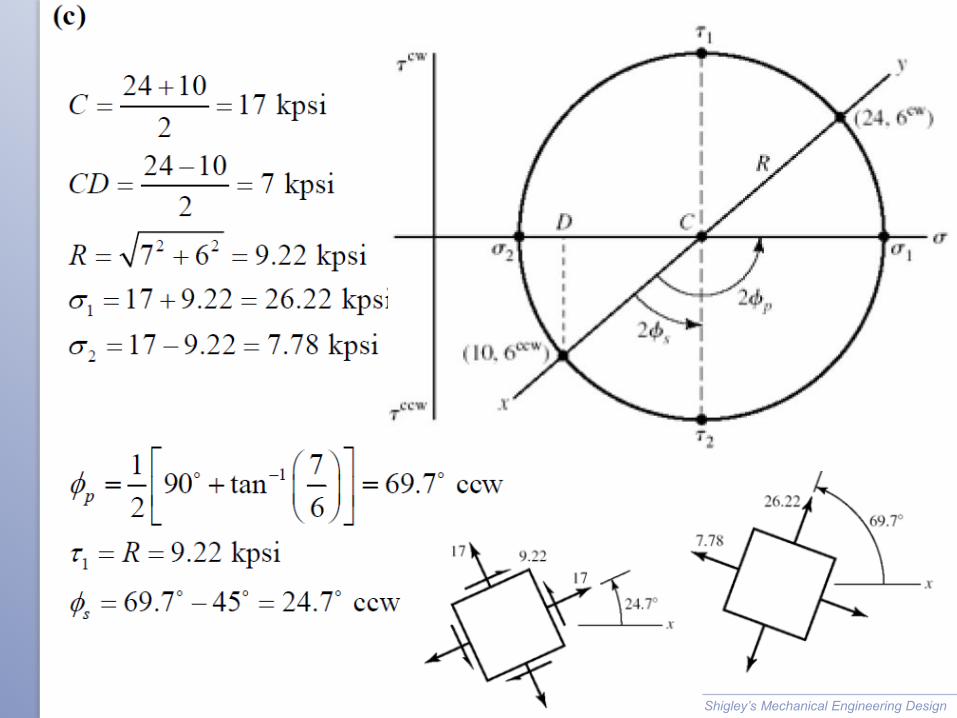
Problem 1
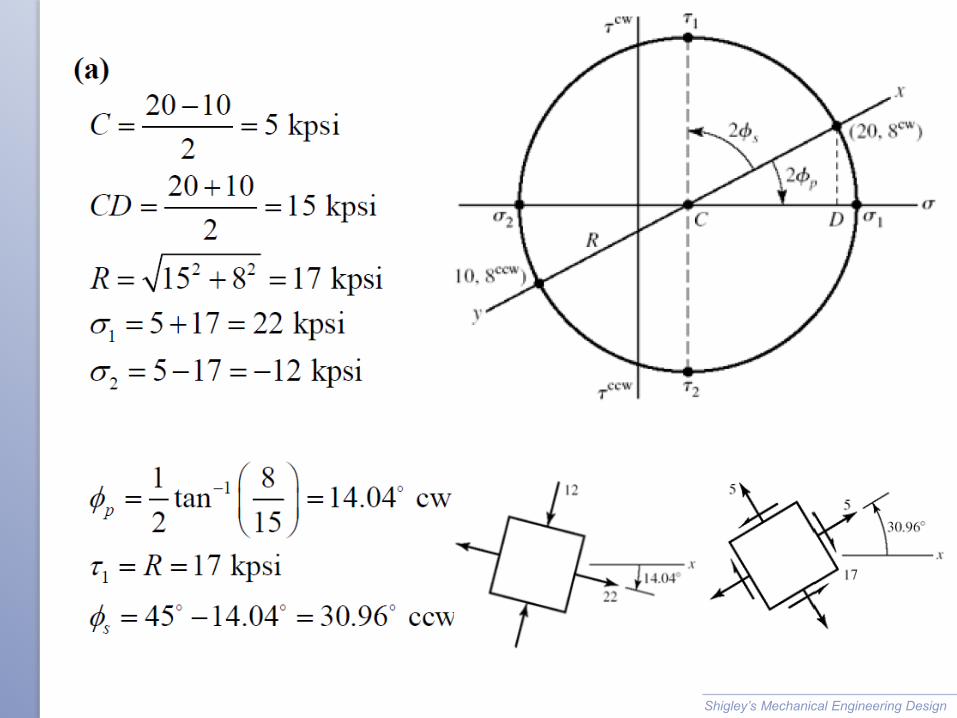
Shigley’s Mechanical Engineering Design
Shigley’s Mechanical Engineering Design
Shigley’s Mechanical Engineering Design
Shigley’s Mechanical Engineering Design
Shigley’s Mechanical Engineering Design
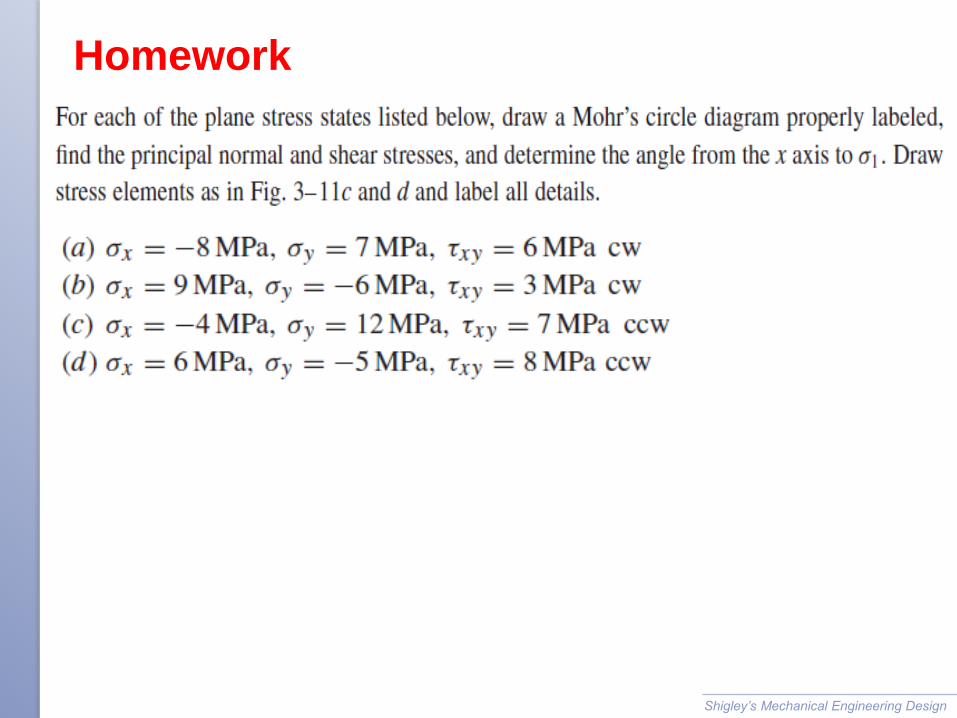
Homework