Embed Size (px)
Citation preview
Chapter Twelve
The Two-Sample
t-Test
Copyright © Houghton Mifflin Company. All rights reserved. Chapter 12 - 2
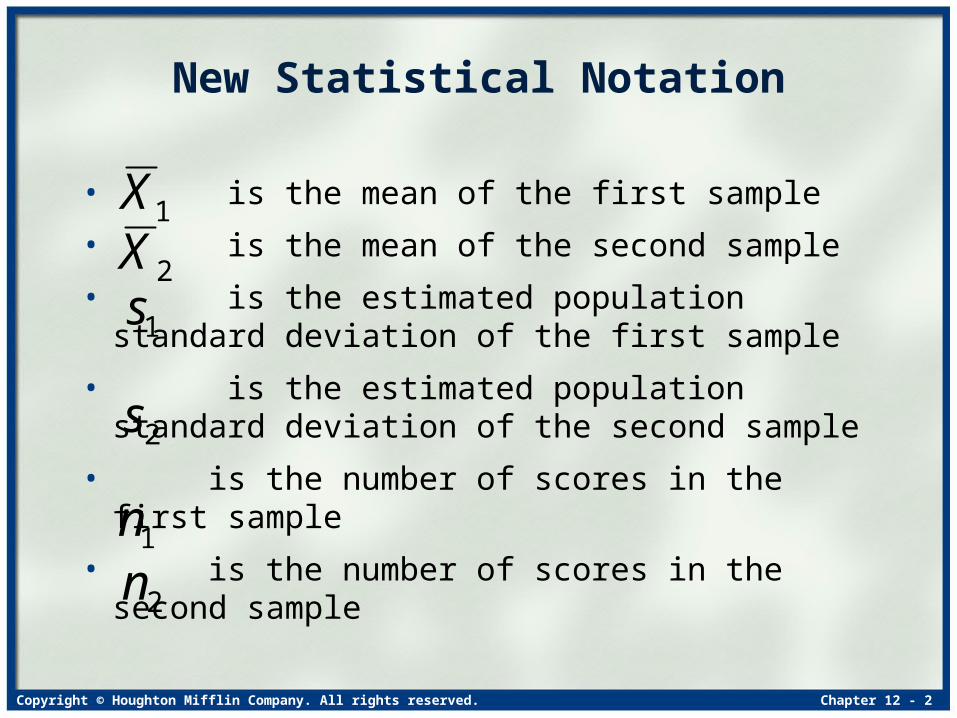
• is the mean of the first sample
• is the mean of the second sample
• is the estimated population standard deviation of the first sample
• is the estimated population standard deviation of the second sample
• is the number of scores in the first sample
• is the number of scores in the second sample
1X
2X1s
2s
1n
2n
New Statistical Notation

Copyright © Houghton Mifflin Company. All rights reserved. Chapter 12 - 3
Understanding the Two-Sample Experiment

Copyright © Houghton Mifflin Company. All rights reserved. Chapter 12 - 4
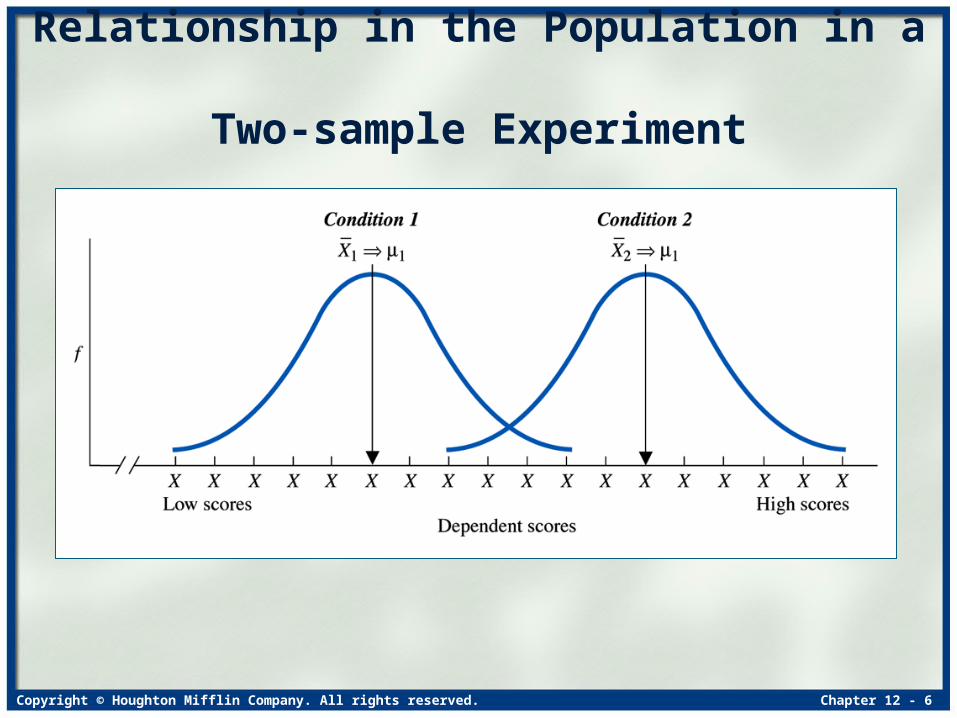
• Participants’ scores are measured under two conditions of the independent variable
• Condition 1 produces sample mean that represents
• Condition 2 produces sample mean that represents
1X
2X1
2
Two-Sample Experiment
Copyright © Houghton Mifflin Company. All rights reserved. Chapter 12 - 5
Two-Sample t-Test
• The parametric statistical procedure for determining whether the results of a two-sample experiment are significant is
the two-sample t-test
• There are two versions of the two-sample t-test– The independent samples t-test– The related samples t-test.
Copyright © Houghton Mifflin Company. All rights reserved. Chapter 12 - 6
Relationship in the Population in a Two-sample Experiment
Copyright © Houghton Mifflin Company. All rights reserved. Chapter 12 - 7
The Independent Samples t-Test

Copyright © Houghton Mifflin Company. All rights reserved. Chapter 12 - 8
Independent Samples t-Test
• The independent samples t-test is the parametric procedure used for significance testing of two sample means from independent samples
• Two samples are independent when we randomly select and assign a participant to a sample
Copyright © Houghton Mifflin Company. All rights reserved. Chapter 12 - 9
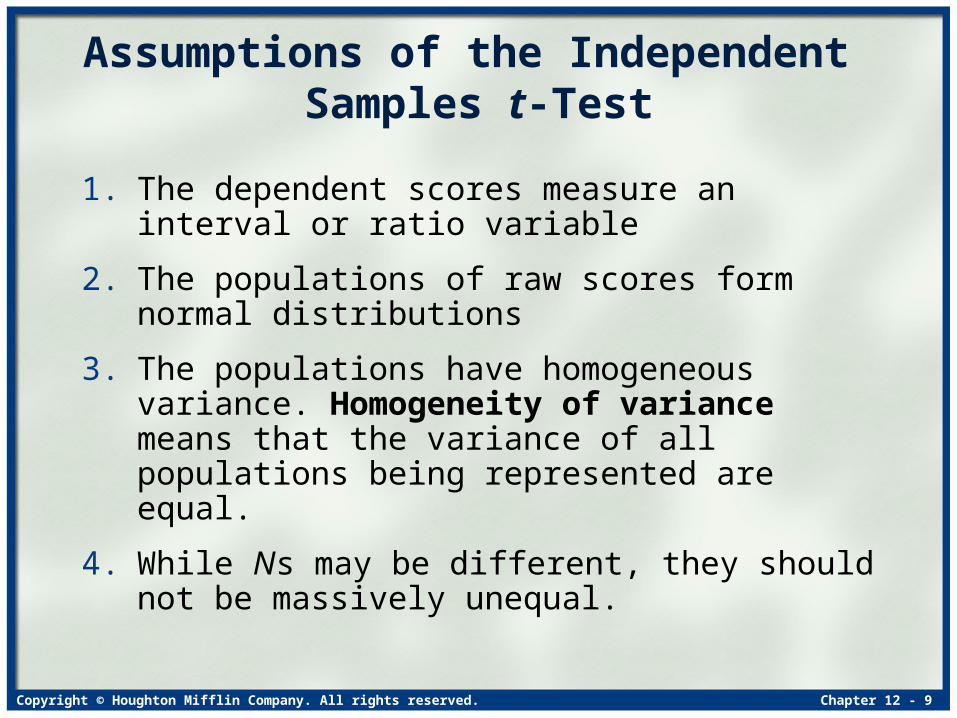
Assumptions of the Independent Samples t-Test
1. The dependent scores measure an interval or ratio variable
2. The populations of raw scores form normal distributions
3. The populations have homogeneous variance. Homogeneity of variance means that the variance of all populations being represented are equal.
4. While Ns may be different, they should not be massively unequal.
Copyright © Houghton Mifflin Company. All rights reserved. Chapter 12 - 10
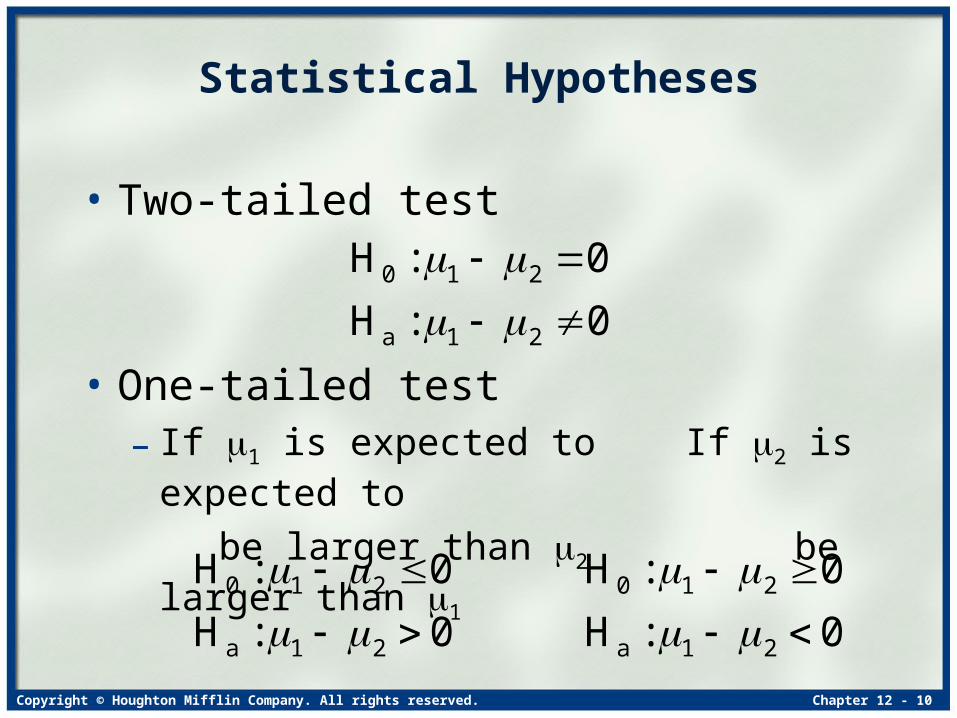
• Two-tailed test
• One-tailed test– If 1 is expected to If 2 is expected to
be larger than 2 be larger than 1
0:H
0:H
21a
210
0:H
0:H
21a
210
0:H
0:H
21a
210
Statistical Hypotheses
Copyright © Houghton Mifflin Company. All rights reserved. Chapter 12 - 11
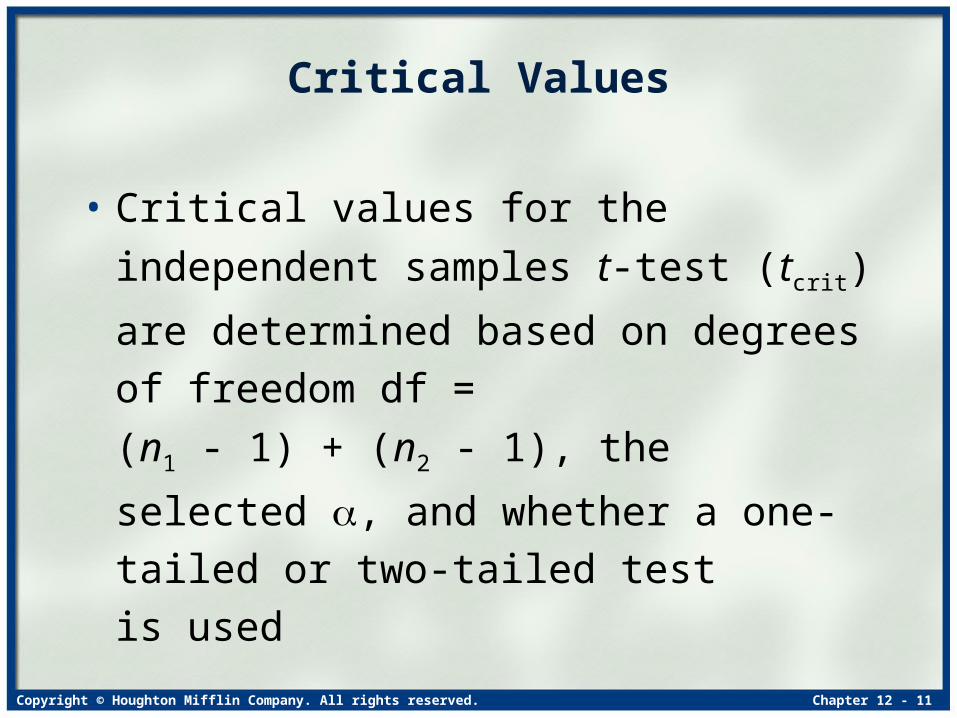
Critical Values
• Critical values for the independent
samples t-test (tcrit) are determined
based on degrees of freedom df =
(n1 - 1) + (n2 - 1), the selected , and
whether a one-tailed or two-tailed test
is used
Copyright © Houghton Mifflin Company. All rights reserved. Chapter 12 - 12
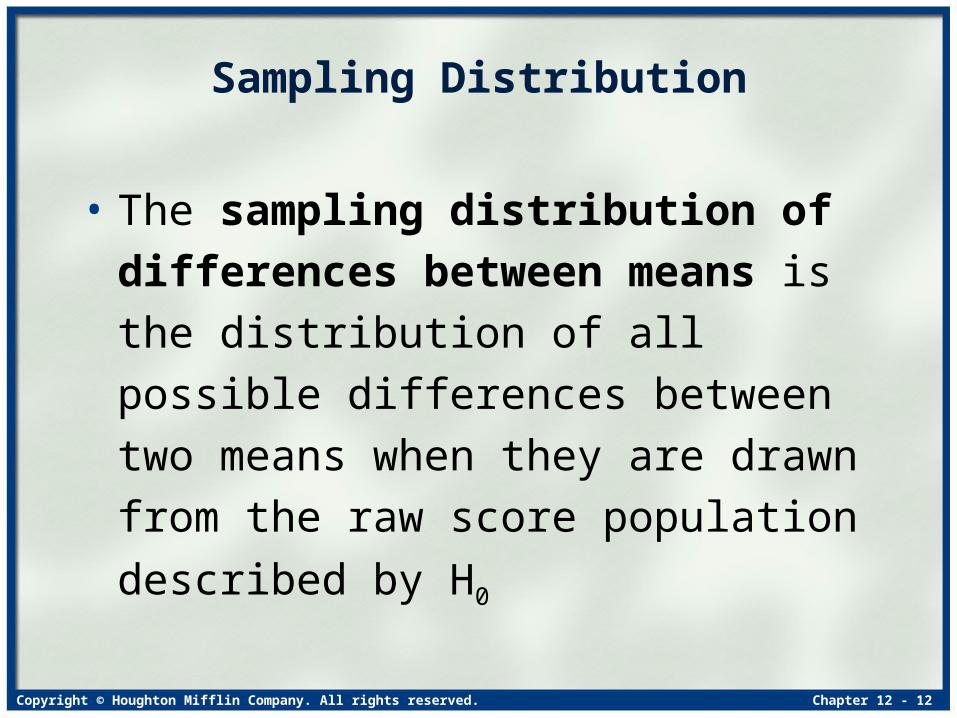
Sampling Distribution
• The sampling distribution of
differences between means is the
distribution of all possible differences
between two means when they are
drawn from the raw score population
described by H0
Copyright © Houghton Mifflin Company. All rights reserved. Chapter 12 - 13
1
)( 22
2
nnX
XsX
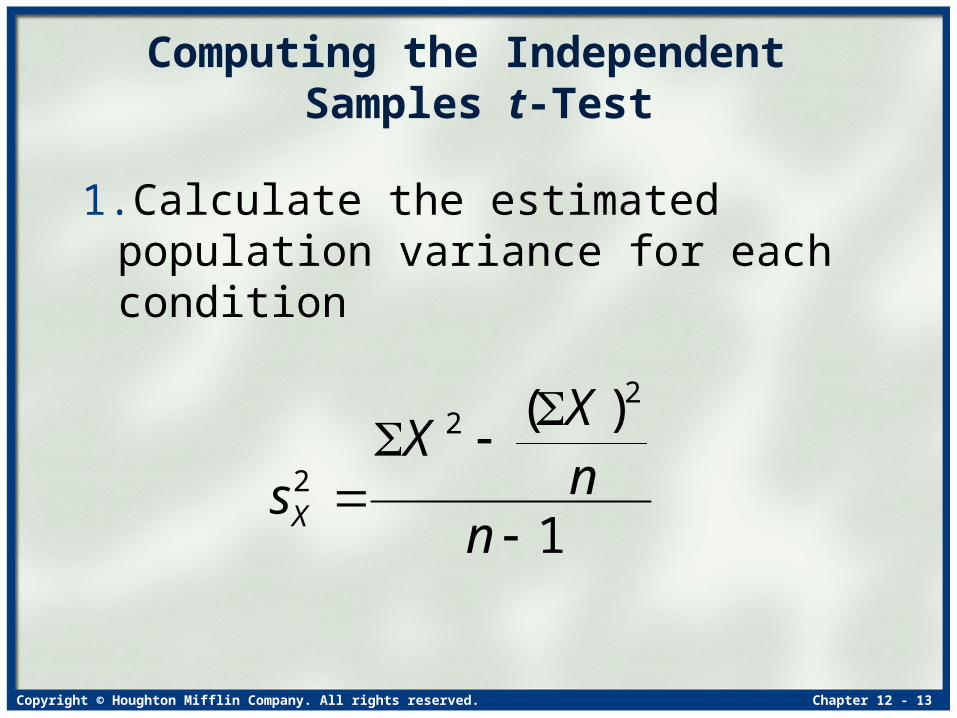
Computing the Independent Samples t-Test
1.Calculate the estimated population variance for each condition

Copyright © Houghton Mifflin Company. All rights reserved. Chapter 12 - 14
)1()1(
)1()1(
21
222
2112
pool
nn
snsns
Computing the Independent Samples t-Test
2.Compute the pooled variance
Copyright © Houghton Mifflin Company. All rights reserved. Chapter 12 - 15
21
2pool
11)(
21 nnss XX
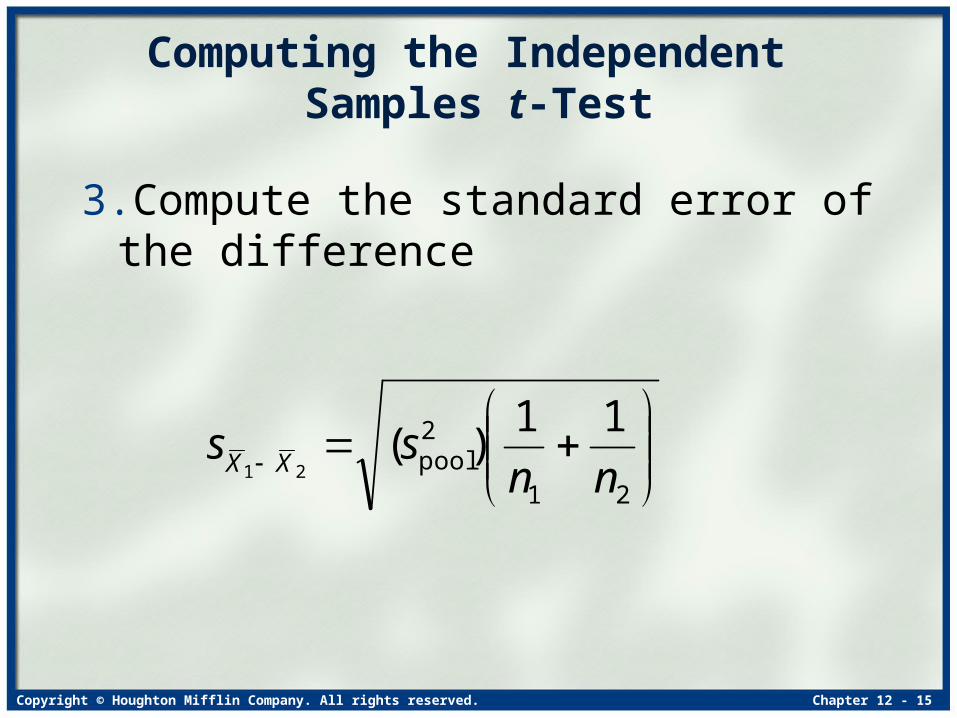
Computing the Independent Samples t-Test
3.Compute the standard error of the difference
Copyright © Houghton Mifflin Company. All rights reserved. Chapter 12 - 16
21
)()( 2121obt
XXs
XXt
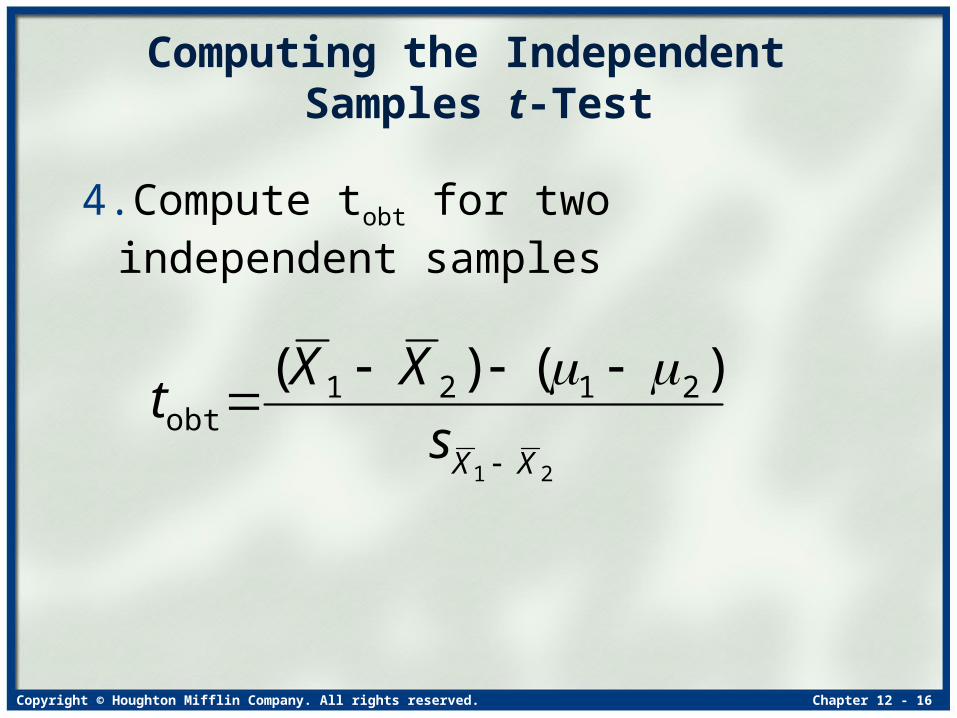
Computing the Independent Samples t-Test
4.Compute tobt for two independent samples

Copyright © Houghton Mifflin Company. All rights reserved. Chapter 12 - 17
2121
222
211
2121obt
11)1()1()1()1(
)()(
nnnnsnsn
XXt
Computing the Independent Samples t-Test
• These steps can be combined into the
following computational formula for the
independent samples t-test
Copyright © Houghton Mifflin Company. All rights reserved. Chapter 12 - 18
)())((
)())((
21crit
2121crit
21
21
XXts
XXts
XX
XX
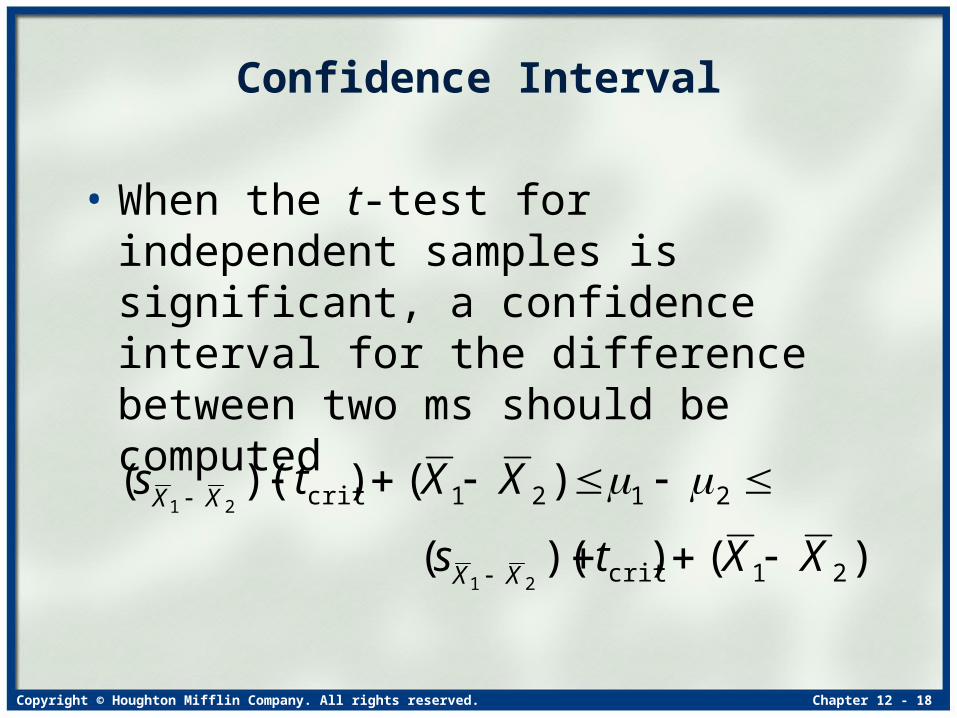
Confidence Interval
• When the t-test for independent samples is significant, a confidence interval for the difference between two ms should be computed

Copyright © Houghton Mifflin Company. All rights reserved. Chapter 12 - 19
Power
• To maximize power in the independent samples t-test, you should maximize the difference produced by the two conditions
• Minimize the variability of the raw scores
• Maximize the sample ns

Copyright © Houghton Mifflin Company. All rights reserved. Chapter 12 - 20
Related Samples t-Test
Copyright © Houghton Mifflin Company. All rights reserved. Chapter 12 - 21
Related Samples
• The related samples t-test is the parametric inferential procedure used when we have two sample means from two related samples
• Related samples occur when we pair each score in one sample with a particular score in the other sample
• Two types of research designs that produce related samples are matched samples design and repeated measures design
Copyright © Houghton Mifflin Company. All rights reserved. Chapter 12 - 22
Matched Samples Design
• In a matched samples design, the researcher matches each participant in one condition with a participant in the other condition
• We do this so that we have more comparable participants in the conditions
Copyright © Houghton Mifflin Company. All rights reserved. Chapter 12 - 23
Repeated Measures Design
In a repeated measures design, each
participant is tested under all conditions of
the independent variable.
Copyright © Houghton Mifflin Company. All rights reserved. Chapter 12 - 24
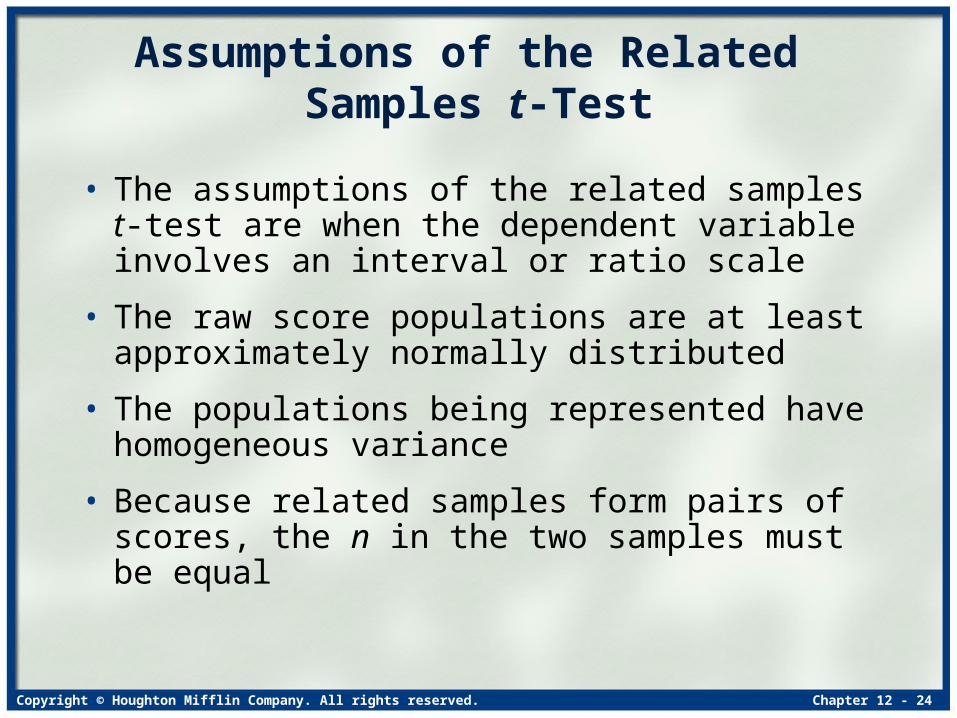
Assumptions of the Related Samples t-Test
• The assumptions of the related samples t-test are when the dependent variable involves an interval or ratio scale
• The raw score populations are at least approximately normally distributed
• The populations being represented have homogeneous variance
• Because related samples form pairs of scores, the n in the two samples must be equal

Copyright © Houghton Mifflin Company. All rights reserved. Chapter 12 - 25
Transforming the Raw Scores
• In a related samples t-test, the raw scores are transformed by finding each difference score
• The difference score is the difference between the two raw scores in a pair
• The symbol for a difference score is D
Copyright © Houghton Mifflin Company. All rights reserved. Chapter 12 - 26
0:H
0:H
a
0
D
D
0:H
0:H
a
0
D
D
0:H
0:H
a
0
D
D
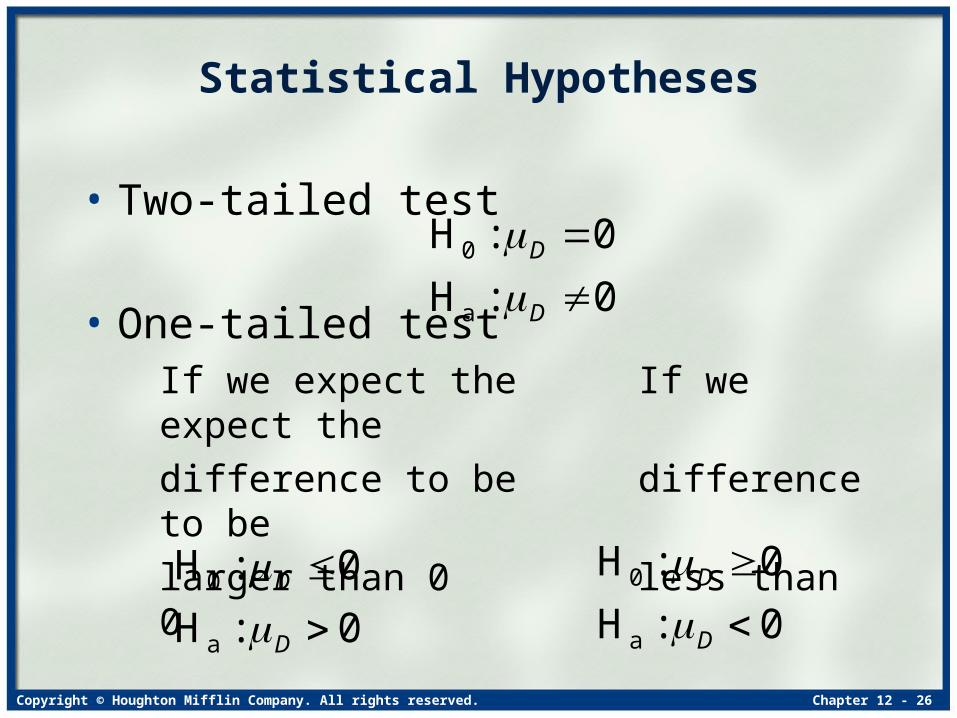
Statistical Hypotheses
• Two-tailed test
• One-tailed testIf we expect the If we expect the
difference to be difference to be
larger than 0 less than 0
Copyright © Houghton Mifflin Company. All rights reserved. Chapter 12 - 27
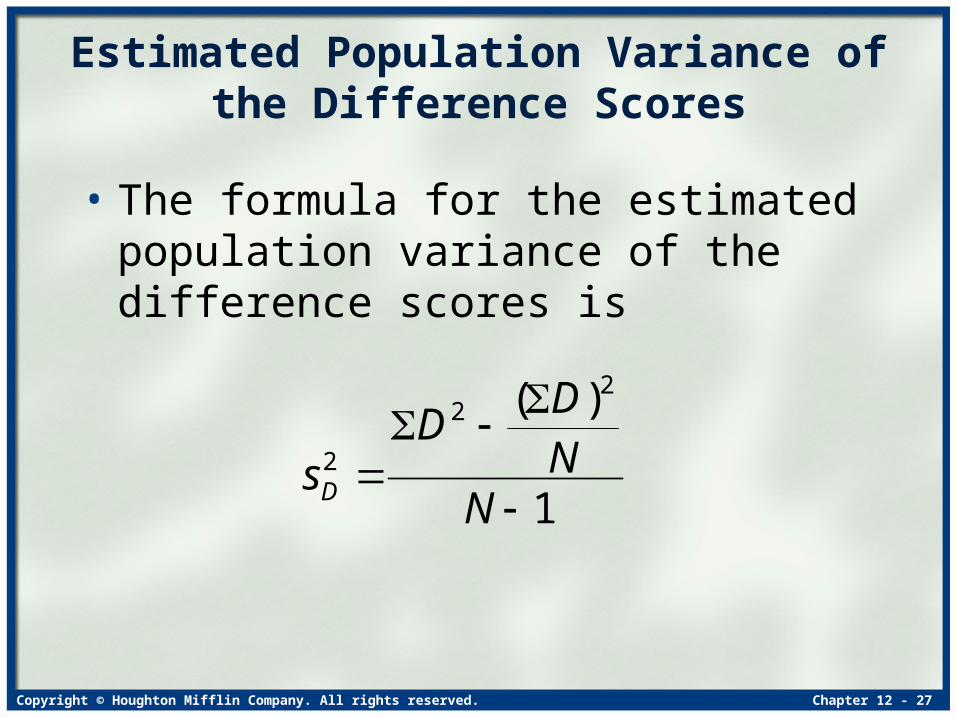
Estimated Population Variance of the Difference Scores
• The formula for the estimated population variance of the difference scores is
1
)( 22
2
NND
DsD
Copyright © Houghton Mifflin Company. All rights reserved. Chapter 12 - 28
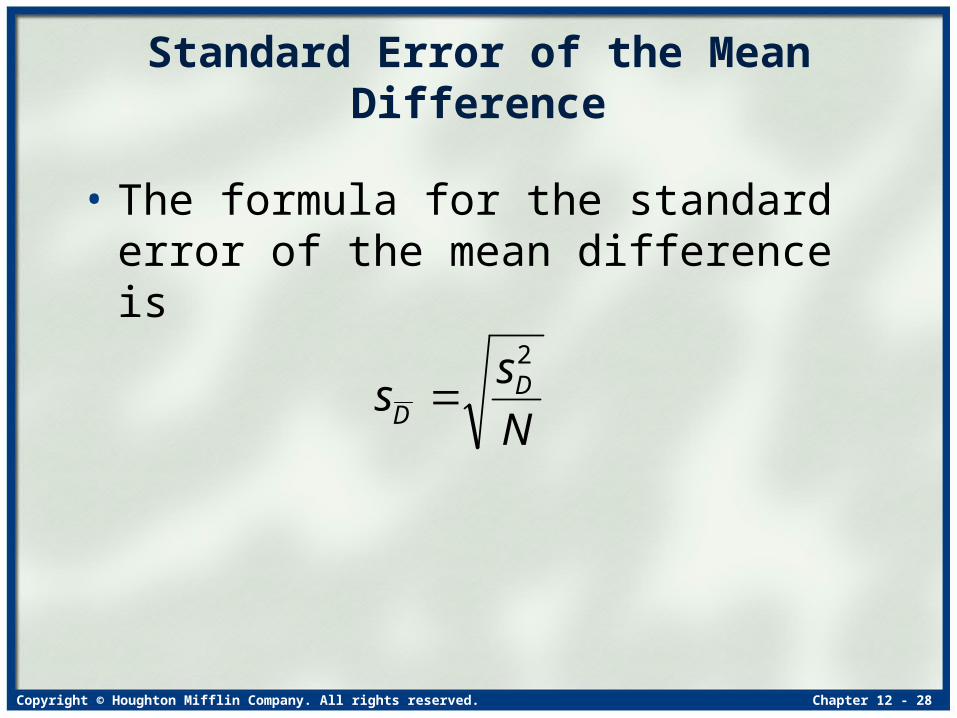
Standard Error of the Mean Difference
• The formula for the standard error of the mean difference is
N
ss DD
2
Copyright © Houghton Mifflin Company. All rights reserved. Chapter 12 - 29
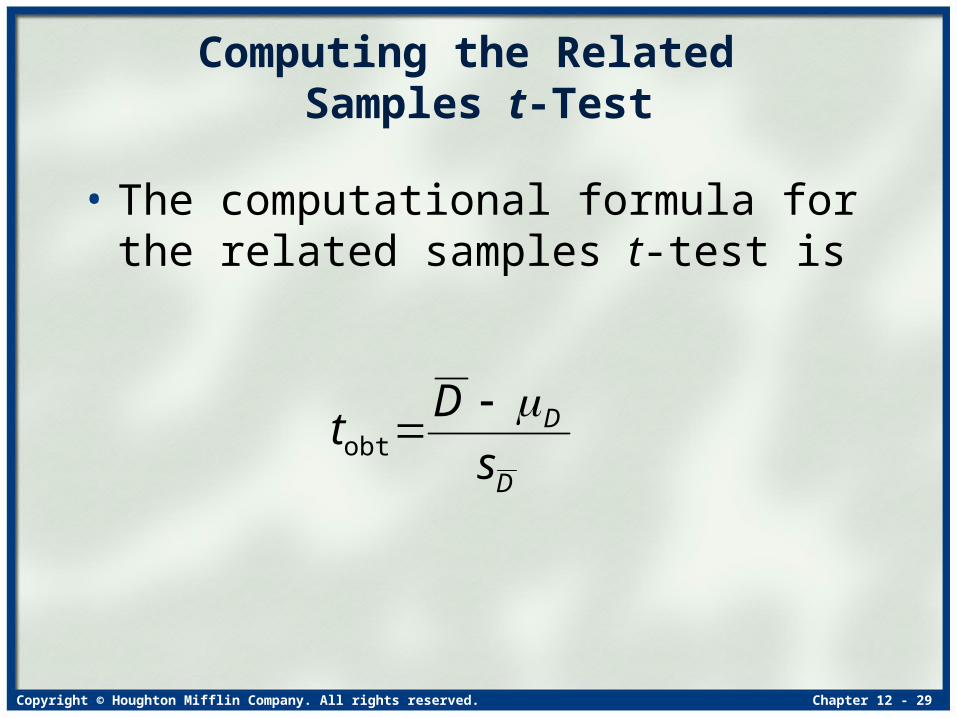
D
D
s
Dt
obt
Computing the Related Samples t-Test
• The computational formula for the related samples t-test is
Copyright © Houghton Mifflin Company. All rights reserved. Chapter 12 - 30
Critical Values
• The critical value (tcrit) is determined based on degrees of freedom df = N - 1
• The selected , and whether a one-tailed or two-tailed test is used
Copyright © Houghton Mifflin Company. All rights reserved. Chapter 12 - 31
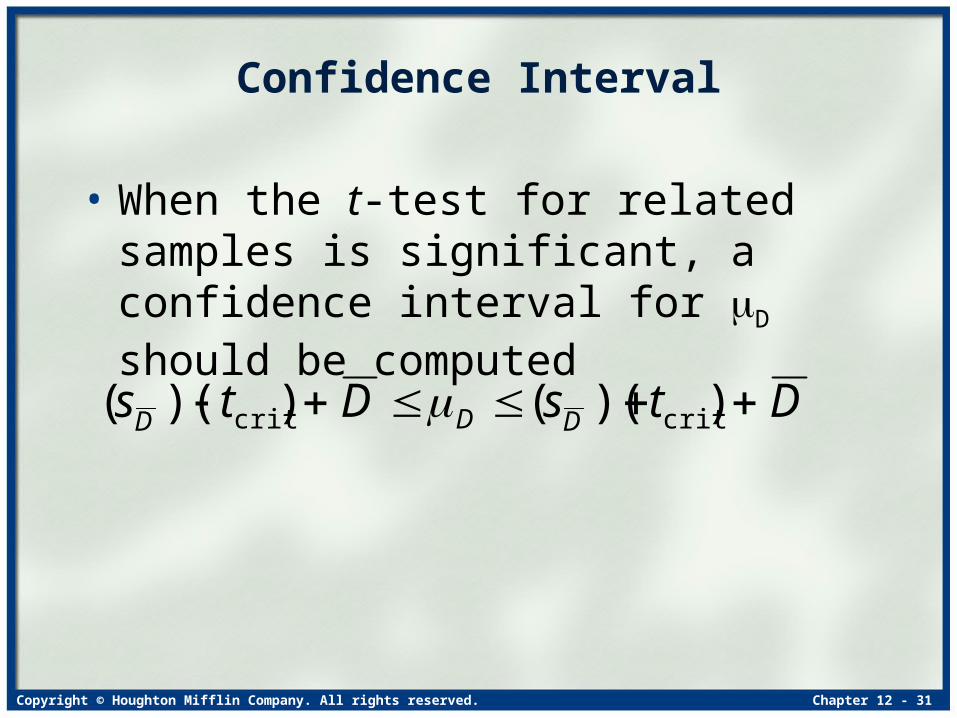
DtsDts DDD ))(())(( critcrit
Confidence Interval
• When the t-test for related samples is significant, a confidence interval for D should be computed

Copyright © Houghton Mifflin Company. All rights reserved. Chapter 12 - 32
Power
• The related samples t-test is intrinsically more powerful than an independent samples t-test
• To maximize the power you should– Maximize the differences in scores
between the conditions.– Minimize the variability of the scores within
each condition.– Maximize the size of N.
Copyright © Houghton Mifflin Company. All rights reserved. Chapter 12 - 33
Describing the Relationship in a Two-Sample Experiment

Copyright © Houghton Mifflin Company. All rights reserved. Chapter 12 - 34
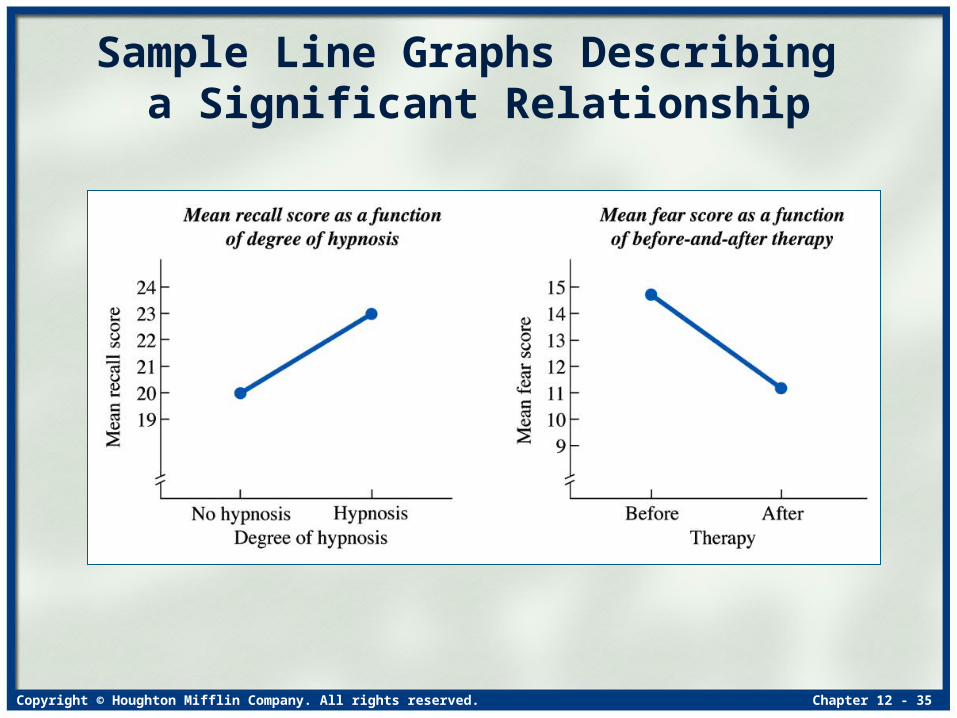
Describing the Relationship
• Once a t-test has been shown to be significant, the next step is to describe the relationship
• In order to describe the relationship, you should– Compute a confidence interval– Graph the relationship– Compute the effect size– Compute the appropriate correlation coefficient to
determine the strength of the relationship
Copyright © Houghton Mifflin Company. All rights reserved. Chapter 12 - 35
Sample Line Graphs Describing a Significant Relationship

Copyright © Houghton Mifflin Company. All rights reserved. Chapter 12 - 36
dft
tr
2obt
2obt
pb )(
)(
Using rpb
• Because a two-sample t-test involves
one dichotomous X variable (the two
conditions of the independent variable)
and one continuous interval or ratio Y
variable, the point-biserial correlation
coefficient is the appropriate coefficient
to use

Copyright © Houghton Mifflin Company. All rights reserved. Chapter 12 - 37
Degrees of Freedom for the rpb
• For independent samples, df = (n1 - 1) + (n2 - 1), where n is the number of scores in a sample
• For related samples, df = N - 1, where N is the number of difference scores
Copyright © Houghton Mifflin Company. All rights reserved. Chapter 12 - 38
• In a two-sample experiment, equals the proportion of the variance accounted for
• This proportion of variance accounted for also is called the effect size in an experiment
• Effect size indicates how big a role changing the conditions of the independent variable plays in determining differences in dependent scores
2pbr
Effect Size

Copyright © Houghton Mifflin Company. All rights reserved. Chapter 12 - 39
Sample 1 Sample 2
14 14 13 15 11 15
13 10 12 13 14 13
14 15 17 14 14 15
Example 1
• Using the following data set, conduct an independent samples t-test. Use = 0.05 and a two-tailed test.
Copyright © Houghton Mifflin Company. All rights reserved. Chapter 12 - 40
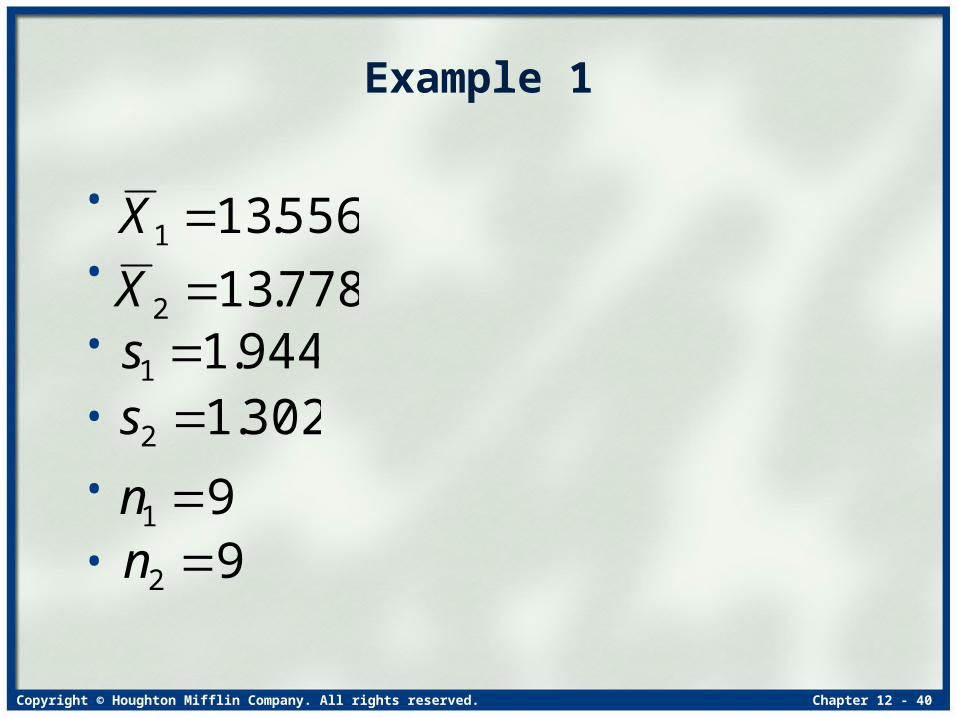
556.131 X
778.132 X944.11 s302.12 s
91 n92 n
Example 1
•
•
•
•
•
•
Copyright © Houghton Mifflin Company. All rights reserved. Chapter 12 - 41
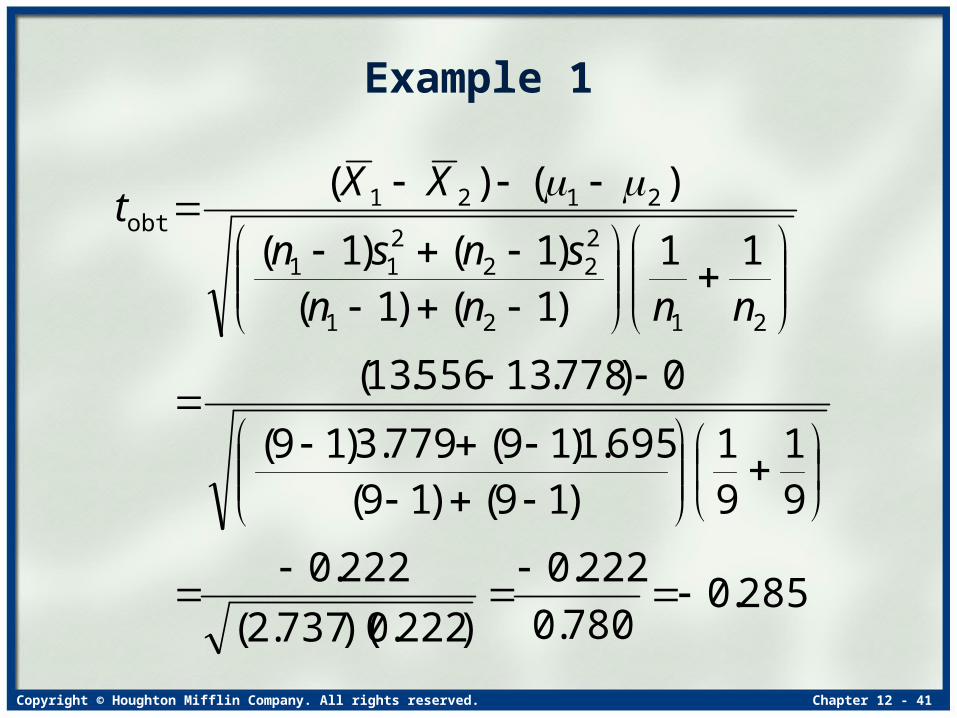
285.0780.0
222.0
)222.0)(737.2(
222.0
91
91
)19()19(695.1)19(779.3)19(
0)778.13556.13(
11)1()1()1()1(
)()(
2121
222
211
2121obt
nnnnsnsn
XXt
Example 1
Copyright © Houghton Mifflin Company. All rights reserved. Chapter 12 - 42
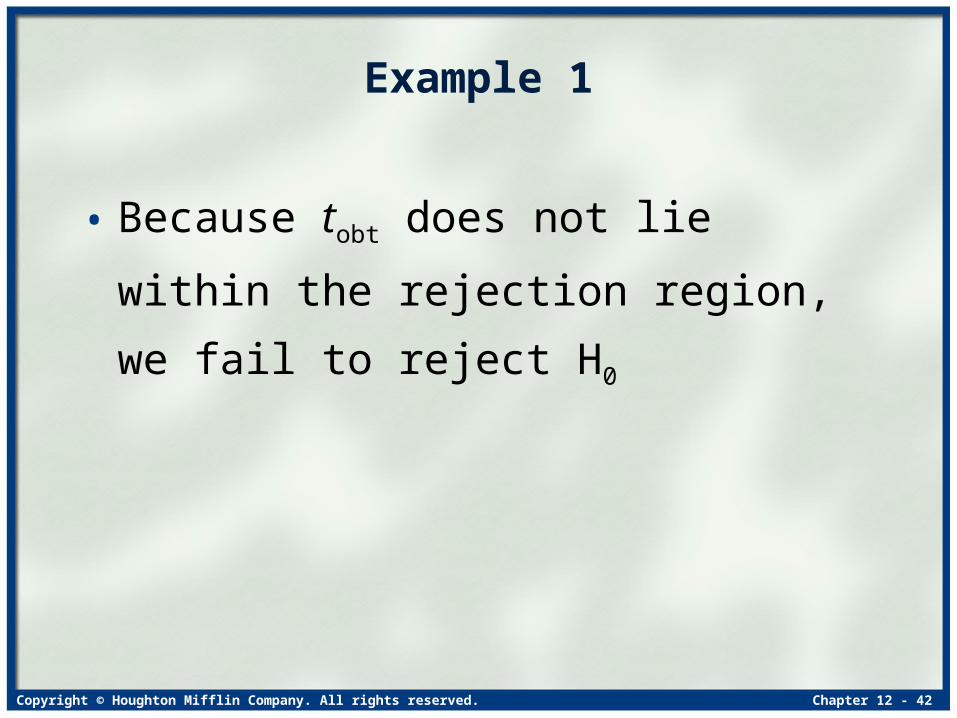
Example 1
• Because tobt does not lie within the
rejection region, we fail to reject H0
Copyright © Houghton Mifflin Company. All rights reserved. Chapter 12 - 43
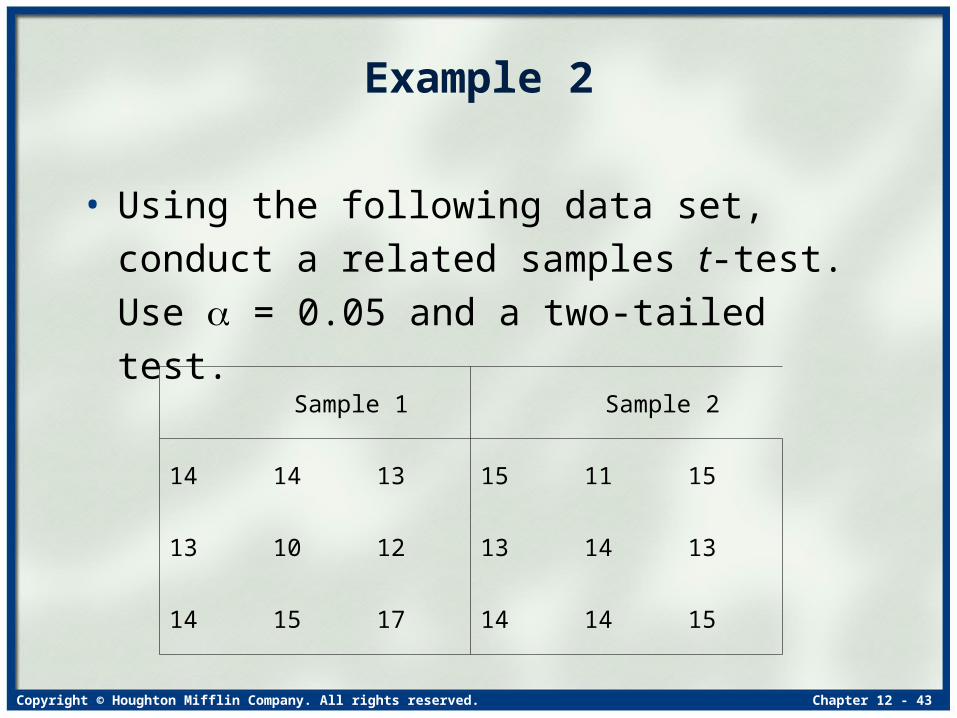
Sample 1 Sample 2
14 14 13 15 11 15
13 10 12 13 14 13
14 15 17 14 14 15
Example 2
• Using the following data set, conduct a
related samples t-test. Use = 0.05 and a
two-tailed test.
Copyright © Houghton Mifflin Company. All rights reserved. Chapter 12 - 44
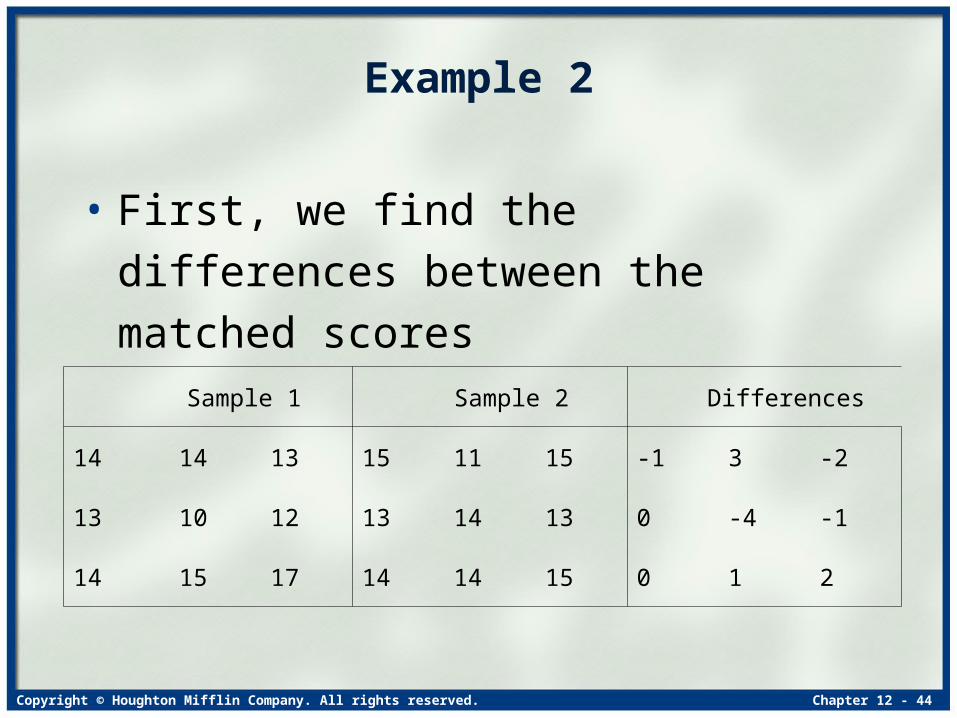
Sample 1 Sample 2 Differences
14 14 13 15 11 15 -1 3 -2
13 10 12 13 14 13 0 -4 -1
14 15 17 14 14 15 0 1 2
Example 2
• First, we find the differences between
the matched scores

Copyright © Houghton Mifflin Company. All rights reserved. Chapter 12 - 45
316.0703.0
222.0
91
444.4
0222.0
1)( 2
obt
Ns
Dt
D
D
Example 2

Copyright © Houghton Mifflin Company. All rights reserved. Chapter 12 - 46
Example 2
• Using = 0.05 and df = 8, tcrit = 2.306
• Because tobt does not lie within the rejection region, we fail to reject H0