Embed Size (px)
Citation preview
Characteristics and activities of foreign affiliates withand without intra-firm trade in sub-Saharan Africa∗
Sotiris Blanas† Adnan Seric‡
First draft: December 2013This draft: March 2014
Abstract
We juxtapose the main characteristics and activities of 2403 foreign affiliateswith and without intra-firm trade in 19 sub-Saharan-African countries in 2010.Affiliates with intra-firm trade tend to be bigger, more productive, more relianton their parent in terms of decision making and management, acquisition of cap-ital goods, finance of working capital, and receiving assistance in several areas.They are less likely to import inputs directly but more likely to have suppliers inmore distant and multiple countries/regions, and to cancel or not enter local pro-curement due to concerns over retention of intellectual property. The probabilityof having direct exports to contiguous and more distant markets, to a single andmultiple markets, of being export-starter, continuing exporter, importer-exporter,as well as engaging in indirect exports is higher for the same type of firm, whilethat of serving the domestic market, being non-exporter or export-exiter is lower.They also seem to face competition mostly from imports and less so from locally-owned firms in the host country. Parents which trade with their affiliate tend tohave a network of sister affiliates in the same country, as well as in neighbouringand non-neighbouring ones.
Keywords: foreign affiliates, intra-firm trade, complex FDI, sub-SaharanAfrica
JEL Classification: F14, F23, L21, L23, L24, L25
∗We would like to thank participants at the UCLouvain International Economics Group seminar fortheir comments and suggestions. Special thanks are extended to Amanda Jakobsson, Florian Mayneris,Mathieu Parenti, and Lucıa Perez-Villar. All errors are our own.†Universite catholique de Louvain (IRES), e-mail: [email protected]‡United Nations Industrial Development Organisation (UNIDO), e-mail: [email protected]
1 Introduction
Multinational Companies (henceforth MNCs) constitute the main locomotive in thecurrent process of internationalisation of production and markets. This stylised facthas spawned numerous theoretical and empirical studies on different types of FDI andMNC (i.e., horizontal1, vertical2, and export-platform3 FDI), as well as combinationsof these (Carr et al., 2001; Grossman et al., 2006; Irarrazabal et al., 2013). UNCTAD(1998) is the first to report empirical evidence on such combinations. In addition,Feinberg and Keane (2001) study US MNCs with affiliates in Canada and find thatonly 12% of these are of pure horizontal type and only 19% of pure vertical. Thus,terms such as “complex integration strategies” and “complex FDI” have been coined(UNCTAD, 1998; Yeaple, 2003a; Helpman, 2006).
The latest evidence generate a cascade of questions whose answers could allow for amore realistic approach of foreign affiliates’ main features and activities. Since foreignaffiliates with intra-firm trade are not necessarily of pure vertical type, then how dothey differ from those which do not trade with their parent or their sister affiliate(s)?Are there any differences in terms of main firm characteristics, their level of dependenceon their parent, international and local procurement activities, and local and exportmarket behaviour? To the best of our knowledge, such questions have not yet beenaddressed.4 The main objective of this paper is to fill this void in the extant literature.
To this purpose, by employing data from the UNIDO Africa Investor Survey 2010we juxtapose the main characteristics, behaviour and activities of 2403 foreign affiliateswith and without intra-firm trade located in 19 countries in sub-Saharan Africa (SSA) in2010. Their parent companies are based either in high-income, or non-SSA low/middle-income, or SSA countries. In contrast to the vast majority of previous theoreticaland empirical studies which take into consideration only the manufacturing sector,this study covers all three main sectors of the economy (i.e., primary, secondary, andtertiary). Our analysis allows us to shed light on many dimensions in which the two firmtypes differ, and elaborate further on their very existence and the business purposesthat they serve.
Africa and in particular, sub-Saharan Africa, still lag behind other developing regionslike Asia and Latin America, regarding their FDI inflows and their participation inregional and global value chains (UNCTAD, 2013, p. 39). However, since FDI could bean essential source of finance for industrialisation of the region, Africa is increasingly
1The MNC serves the foreign market by setting up a foreign affiliate rather than through exports.In doing so, the production process of the parent company is replicated in the foreign affiliate. Amongothers, see Caves (1982), Markusen (1984), Brainard (1997), Helpman et al. (2004), Horstmann andMarkusen (1992), Markusen and Venables (2000), Ramondo et al. (2013).
2The MNC takes advantage of international factor differentials by transferring part of its productionprocess to countries where factor prices are lower (Helpman, 1984; Helpman and Krugman, 1985,Yeaple, 2003b and Yeaple, 2008). In this case, intra-firm trade is created, as has been observed byseveral recent empirical studies (Hanson et al., 2001; Hanson et al., 2005; Borga and Zeile, 2004;OECD, 2002; Alfaro and Charlton, 2009).
3An affiliate located in a foreign country is used as platform for serving other markets nearby viaexports (Ekholm et al., 2007; Badinger and Egger, 2010).
4In this direction are Hanson et al. (2001) and Ramondo et al. (2011). The first examine imports offoreign affiliates from their US parent companies by using a measure of affiliate size, while the second,find that “vertical” affiliates are of bigger size than “horizontal” ones.
1
tapping into it. According to UNCTAD and UNIDO (2011, p. 77), its FDI inflowsincreased from $2.8 billion to $58.6 billion between 1990 and 2009, while the share of FDIin gross fixed capital formation increased from 3.2% to 24.1% between 1990 and 2007.Although most of FDI inflows by value is concentrated in Mining, important investmentactivities have taken place in Manufacturing between 2003 and 2009. UNCTAD (2010b)reports that 41% of the total number of Greenfield investment projects in Africa wereaccounted for by the manufacturing sector.
Although developed countries account for the bulk of the FDI flows into Africa,non-African developing countries – especially Brazil, China, India, and Turkey – areincreasingly important sources. Their share in total FDI inflows to Africa increasedfrom an average of 17.7% during the period 1995 - 1999 to 20.8% over the period2000 - 2008 (UNCTAD, 2010a, p. 81). According to the same study, FDI from non-African developing countries is mostly in natural resources but there are significantinvestments in infrastructure,5 finance, agriculture and light manufacturing. UNCTAD(2013, p. 127) reports that there has also been a remarkable increase over the pastdecade in intra-African investment, with 68% of Greenfield investment being accountedfor by the services sector.
As regards trade activity which is very closely linked to FDI, Africa has experienceda significant rise in total merchandise trade, from $217 billion in 1995 to $986 billion in2008. This has been accompanied by increasing trade with other non-African developingcountries. Also, its share of global trade rose from 2.2% in 2000 to 3.3% in 2008(UNCTAD, 2010a, p. 29).
The well-documented rise in MNC activity in Africa and especially, in sub-SaharanAfrica, renders our analysis even more intriguing and imperative, in the sense thatsome of our findings allow us to identify more precisely the effects of FDI on host-country economies, in this case, on sub-Saharan-African ones. The identification ofany differential effects from the presence of foreign affiliates with and without intra-firm trade could be very useful for policy makers in host countries to implement suchindustrial, trade, investment, and development policies so that their countries benefitthe most.
We describe our main findings, along with some economic-policy implications when-ever necessary, as follows. Foreign affiliates with intra-firm trade tend to be bigger andmore productive. The first finding is in accord with the main finding of Ramondo et al.(2011) according to which intra-firm trade is concentrated among a small number oflarge affiliates, while the median affiliate which is smaller in size, reports no shipmentsto its parent and directs the bulk of its sales to non-affiliated parties in the host coun-try. Also, it implies that their presence in the country can result in even more jobopportunities. The second implies that unaffiliated local firms which collaborate withthem (e.g. suppliers of specific inputs) and therefore, are part of the same supply chain,may benefit from productivity spillovers. They also tend to be more dependent on theirparent in terms of decision making and management, receiving assistance in several ar-eas, acquiring capital goods, and financing working capital and fixed assets. Affiliates
5Between 2001 and 2007, China’s infrastructure finance commitment in sub-Saharan Africa rosefrom $470 million to $ 4.5 billion. Other countries with significant investments in infrastucture areIndia, Kuwait, Saudi Arabia, and the United Arab Emirates (UNCTAD, 2010b, p. 81; UNCTAD,2010a).
2
without intra-firm trade are more likely to import capital goods directly themselves orto acquire them through local distributors. Hence, local distributors of capital goodscan benefit more from the presence of affiliates without intra-firm trade in the country.
Regarding international and local procerement, although affiliates without intra-firmtrade are more likely to import inputs directly, those with intra-firm trade are morelikely to have suppliers overseas (i.e., some of these suppliers may be their sister affiliatesand therefore, imports from them are recorded as intra-firm). Moreover, affiliates withintra-firm trade are more likely to engage in local procurement because of corporatecommitment to local supplier development in the region, and to cancel or not enter dueto concerns over reterntion of their intellectual property. The last two results indicatethat local firms can hardly benefit from technology and know-how spillovers unlessthey initiate a strategic collaboration with affiliates of this type, which may mean inpractice that they will be “absorbed” by the MNC. The same type of firm is more likelyto import from more distant and multiple countries/regions.
As regards market orientation, sources of competition and export activities, we findthat affiliates with intra-firm trade are more likely to engage in direct and indirect (e.g.through intermediaries in the host country) exports, and to face competition for theirmain product primarily from imports. Instead, firms without intra-firm trade are morelikely to have sales in the domestic market and face competition for their main productmostly from locally-owned firms in the host country. In addition, firms with intra-firmtrade are more likely to export to contiguous markets (i.e., sub-Saharan Africa, SouthAfrica, Middle-East and North Africa), more distant ones (i.e., EU, US, India, Asiaother than China and India, and the rest of the world), to a single market, as wellas to multiple ones. Firms with non-exporter and export-exiter status are more likelyto be those without intra-firm trade, while those with intra-firm trade are more likelyto be export-starters, continuing exporters, and importers-exporters. As affiliates withintra-firm trade are more export-oriented, the countries which manage to attract moreof these can become more export-oriented themselves and in general, more integratedinto the global economy. Nevertheless, since firms devoid of intra-firm trade seem to beoriented towards the domestic market, their presence in the country is more likely tointensify domestic competition, with an ensuing decrease in prices of goods and servicesand an increase in the number of varieties.
We also find that affiliates with intra-firm trade are more likely to consider generalinfrastructure problems, bureaucracy and regulation, and the high cost of productionfor export markets as the most important barriers to starting or expanding their ex-port activities within Africa. Firms of the same type are more likely to deem generalinfrastructure problems, tariff and non-tariff barriers, bureaucracy and regulation, andinadequate export support services as the most important barriers to starting or ex-panding their export activities outside Africa. Concerning the most important benefitsfrom RTAs, affiliates with intra-firm trade are more likely to reap the benefits froman RTA under the form of access to finance on better terms, improved transport andcommunications infrastructure, improved access to raw materials and other inputs, andincreased regional investment opportunities. Hence, the lift of export barriers and theformation of RTAs could help host countries to attract more affiliates with intra-firmtrade.
Parent companies which trade with their foreign affiliates are more likely to own
3
other affiliates either in the same host country, or in other sub-Saharan-African coun-tries, or in any country outside sub-Sahran Africa. Hence, the bigger the number ofaffiliates with intra-firm trade located in a country, the higher the likelihood that thiscountry will receive new foreign investment. They are also more likely to set up an affil-iate with which they trade as wholly-owned entreprise and benefit from tax exemptionfor their foreign investment. Instead, parents of firms without intra-firm trade are morelikely to receive grants for hiring as investment incentive. Thus, governments of hostcountries can attract more firms with intra-firm trade if they provide tax exemption asmain investment incentive. Finally, parents whose main motive to invest is to accessnew markets tend to trade with their foreign affiliates – possible evidence of complexFDI–, while those whose main motive is to join a specific partner in the host countrytend not to. The latter implies that local firms are more likely to benefit from thepresence of affiliates without intra-firm trade in the country.
The remainder of this paper is as follows. In Section 2 we describe the data andpresent some stylised facts which motivate the subsequent econometric analysis in Sec-tion 3. Section 4 discusses the empirical results, while Section 5 concludes.
2 Data and stylised facts
In this section we describe the data to be employed in our econometric analysis andjuxtapose foreign affiliates which trade with their parent (i.e., either intra-firm imports,or intra-firm exports, or both) and those which do not in terms of the host countriesin which they are located, the industries in which they operate, as well as the originof their parent company. We also provide some statistics on the percentage of foreignaffiliates with different combinations of intra-firm trade flows by industry and parentlocation. We draw all firm-level data from the UNIDO Africa Investor Survey 2010.6
This survey includes information about 2403 foreign-owned firms in 19 sub-Saharan-African countries for the last financial year (i.e., 2009).7
Table 1 portrays the 19 countries in sub-Saharan Africa where foreign affiliates withand without intra-firm trade are located. Among firms with inta-firm trade, the biggestnumber of these are based in Kenya, Uganda, Tanzania, Ghana and Cameroon (17.3%,16.2%, 8%, 5.9%, and 5.7%, respectively.), while the smallest number in Niger (0.8%),Burundi (1%), Burkina Faso (1.1%), Mali (2.5%), and Malawi (2.7%). Among firmswithout intra-firm trade, the biggest number of these are based in Uganda (17.1%),Kenya (10.7%), Ghana (8%), Nigeria (6.3%) and Mozambique (6.1%), and the smallestnumber in Niger (1%), Burkina Faso (1.2%), Malawi (1.8%), Burundi (2.2%), Lesothoand Rwanda (2.9% each).
Table 2 and Table 3 display the industries of foreign affiliates with and withoutintra-firm trade, respectively. They are aggregated at the 2-digit level (ISIC rev. 3)and cover all three main sectors of the economy (i.e., primary, secondary and tertiary).However, firms without intra-firm trade operate in more industries than those with
6The main aim of this survey is to collect information at the firm level directly from business ownersand senior managers about their business and their assessment of the current business environment.
7There is a very small number of firms which answered the questionnaire in 2009 and therefore,they provided data for 2008. However, each firm corresponds to a single year.
4
intra-firm trade (56 industries Vs 41 industries). This is mostly driven by the absenceof affiliates with intra-firm trade from many services industries.8 Among affiliates withintra-firm trade, the highest percentages of these are to be found in industries withISIC 15 (11.8%), 25 (8.6%), 1 (8.4%), 24 and 51 (8.2% each), 18 (7.6%), 52 (6.3%),and 45 (5.1%), while the lowest in industries with ISIC 2, 33, 41, 63, 71, 72, and 92(0.2% each). Among affiliates without intra-firm trade, the highest percentages of theseoperate in industries with ISIC 15 (8.4%), 51 (6.7%), 74 (5.6%), 45 (5.4%), 25 and 55(5.2% each), 65 (5.1%), and 28 (4.9%), while the lowest in industries with ISIC 12, 30,73, 85, and 93 (0.1% each).
Table 4 reports the number of firms with and without intra-firm trade by sector andparent location. Regarding sectors, we consider the whole economy (ISIC between 1 and99), Agriculture (ISIC between 1 and 5), Mining (ISIC between 10 and 14), Manufactur-ing (ISIC between 15 and 39), Resource-based manufacturing (ISIC: 15, 16, 20, 21, 23,25, 26, 27), Low-tech manufacturing (ISIC: 17, 18, 19, 22, 28, 36), Medium/High-techmanufacturing (ISIC: 24, 29, 30, 31, 32, 33, 34, 35, 37, 38), Transport and Construction(ISIC between 40 and 45), Services (ISIC between 50 and 99). We distinguish betweenthree different types of parent location based on the income level of the country in whichthe parent company is situated (i.e., high-income (HI), low/middle-income excludingthe sub-Saharan-African (LMI), and sub-Saharan African (SSA) countries). In orderto classify each parent location by the level of income we rely upon the World BankHistorical Country Classification for the year 2010.9
For the whole economy, the parent firms of the highest percentage of affiliateswith intra-firm trade are located in high-income countries, of the second highest inlow/middle-income countries, while those of the lowest in sub-Saharan Africa (52.4%,33.4%, and 14.2%, respectively).10 This is also true for Agriculture (74.5%, 12.8%,12.8%, respectively), Mining (53.3%, 46.7%, 0%, respectively), Manufacturing (50.6%,36.3%, 13.1%, respectively), Resource-based manufacturing (52.3%, 31.5%, 16.1%, re-spectively), Medium/High-tech manufacturing (66.7%, 22.2%, 11.1%, respectively),Transport and Construction (50%, 35.7%, 14.3%, respectively), and Services (47.9%,31.3%, 20.8%, respectively). The only exception is the low-tech manufacturing sectorin which the parents of the highest percentage of foreign affiliates with intra-firm tradeare based in low/middle-income countries (36.4%, 53.5%, and 10.1%, respectively). As
8This finding is in line with Ramondo et al. (2011) who use firm-level data from the US Bureau ofEconomic Analysis (BEA). The data cover the universe of US parents and their foreign affiliates forthe year 2004. According to them, intra-firm trade occurs primarily in goods, rather than services,and thus, their analysis is based only on manufacturing.
9For the very few firms which answered the questionnaire in 2009, the classification for the year2009 applies. Low/middle-income countries are those which are classified by the World Bank for thecorresponding year as either low-income, or lower-middle-income, or upper-middle-income.
10As for individual countries, parents of the highest percentage of affiliates with intra-firm tradeare located in India (10%), South Africa (9.5%), France and the United Kingdom (8.7% each), Kenya(6.9%), the US (4.8%), China and the Netherlands (4.1% each), Portugal (3.7%), Lebanon and Mau-ritius (2.5% each), Germany and Switzerland (2.5%), Hong Kong and Taiwan (1.9%), Italy (1.7%),Japan (1.5%), Denmark, Spain and the United Arab Emirates (1.4%), Belgium, Senegal, Uganda andTanzania (1%). Parents of the highest percentage of affiliates without intra-firm trade are locatedin India (14%), France (9.8%), the United Kingdom (9.7%), South Africa (6.3%), China and Kenya(6% each), Portugal (4.4%), Italy (4%), Lebanon (3.9%), the US (3.6%), the Netherlands (2.1%),Switzerland (1.8%), Mauritius (1.7%), Germany (1.6%), Canada (1.2%), and Belgium (0.9%).
5
foreign affiliates without intra-firm trade are concerned, the parents of the smallestpercentage of these are located in sub-Saharan Africa. This holds for the whole econ-omy and for any other sector examined. The differences in the percentages of affiliateswhose parents are located in high- and non-SSA low/middle-income countries are muchsmaller than before (Whole economy: 49.4% Vs 37%, Manufacturing: 44.9% Vs 43.3%,Resource-based manufacturing: 43.9% Vs 43.4%, Medium/High-tech manufacturing:47.8% Vs 40.8%) or even vanished (Low-tech manufacturing: 44.8% Vs 44.8%). Sec-tors which still have quite big differences are: Agriculture (60.7% Vs 21.3%), Mining(58.8% Vs 41.2%), Transport and Construction (56% Vs 35.8%) and Services (51.5%Vs 32.1%).
Panel A in Table 5 reports that 526 out of the 2403 foreign affiliates (21.9% ofthe total) trade with their parent company (i.e., either intra-firm exports or intra-firmimports, or both). The rest 1877 (78.1% of the total) do not have any intra-firm tradeflows. Among the firms with intra-firm trade, 77.8% of these have intra-firm imports(Panel B), 39.4% have intra-firm exports (Panel C), 17.1% have both intra-firm importsand exports (Panel D), 60.6% have only intra-firm imports (Panel E), while 22.2% haveonly intra-firm exports (Panel F).
In Table 6 we provide the same statistics by sector and parent location. In terms ofsectors, the highest percentage of foreign affiliates with intra-firm trade operate in Agri-culture (43%), Mining (32.7%), and Manufacturing (28.8%), while the lowest percentagein Services (10.7%) and Construction and Transport (19.3%). Within manufacturing,the percentage of the same type of affiliate in resource-based industries is a bit smallerthan the whole sector (27.7%), that in low-tech industries almost identical (28.7%), andthat in medium/high-tech industries slightly bigger (31.4%). In Panel A.1, the percent-ages of foreign affiliates with intra-firm trade whose parents are located in high-incomecountries are bigger than before in Agriculture (48.6%), Manufacturing (31.8%), and inparticular, in Resource-based manufacturing (32.1%) and Medium/High-tech manufac-turing (39%). Instead, they are smaller in Mining (28.6%) and Low-tech manufacturing(25.2%), and only slightly smaller in Construction and Transport (18.7%) and Services(10.2%). The pattern is a bit different for foreign affiliates whose parents are locatedin non-SSA low/middle-income countries and in SSA countries (Panel A.2 and PanelA.3). The percentages for the first, as compared to those in Panel A, are higher inMining (33.3%), Low-tech manufacturing (33.1%), and Construction and Transport(20.4%), while lower or roughly equal in Agriculure (31.6%), Manufacturing (25.8%),Resource-based and Medium/High-tech manufacturing (22.4% and 20%, respectively),and in Services (10.6%). The percentages for the second are smaller or roughly equalin Agriculture (35.3%), and in Low-tech and Medium/High-tech manufacturing (28.6%and 30.8%, respectively), while bigger in Manufacturing (31.6%), Resource-based man-ufacturing (33.3%), Construction and Transport (30.8%), and Services (13.4%). Thereare no foreign investors from sub-Saharan Africa with foreign affiliates in Mining.
Panel B shows that among firms with intra-firm trade, the highest percentages ofthose with intra-firm imports operate in Services (99%), Construction and Transport(96.4%), Mining (88.2%), Low-tech manufacturing (82.5%), Medium/High-tech manu-facturing (76.3%), Manufacturing (73.2%), while the lowest in Agriculture (51%) andResource-based manufacturing (65.4%). Panels B.1-B.3 reveal that the patterns forforeign affiliates with intra-firm imports whose parents are located in any of the three
6
country types are very similar to the one in Panel B. The main differences are observedin Agriculture in which there is a smaller percentage of foreign affiliates with intra-firmimports whose parents are located in high-income countries (42.9%), while a higherpercentage of those whose parents are located in non-SSA low/middle-income and SSAcountries (66.7% and 83.3%, respectively). In addition, while the percentage of firmswith intra-firm imports whose parents are located in non-SSA low/middle-income coun-tries is higher in Medium/High-tech manufacturing (87.5%), that of firms whose parentsare located in SSA countries is much smaller (62.5%).
According to Panel C, the highest percentages of foreign affiliates with intra-firmexports are found in Agriculture (73.5%), Mining (52.9%), and Resource-based manu-facturing (52.3%), while the lowest ones in Services (2%) and in Construction and Trans-port (7.1%). Panels C.1 to C.3 reveal that the percentage of firms with intra-firm ex-ports whose parents are located in high-income countries is higher than the one in PanelC in all industries except for Medium/High-tech manufacturing (37.5% Vs 38.2%),while the percentages of firms whose parents are located in non-SSA low/middle-income countries and SSA countries are lower in all industries except for Low-tech andMedium/High-tech manufacturing (Panel C.2: 50.9% Vs 47.6% and 43.8% Vs 38.2%,respectively) and for Construction and Transportation (Panel C.3: 25% Vs 7.1%).
Panel D indicates that the biggest percentages of foreign affiliates with both intra-firm imports and exports are in Mining (41.2%), Low-tech manufacturing (30.1%), andAgriculture (24.5%), while the smallest percentages in Services (1%) and Constructionand Trasnport (3.6%). The pattern in Panel D.1 (i.e., for firms whose parents arelocated in high-income countries) is very similar to the one in Panel D. The percent-ages though, of affiliates with both intra-firm imports and exports are much higher inMining (62.5%), and Resource-based and Low-tech manufacturing (24.4% and 36.1%,respectively). However, the percentage of affiliates in Services is zero. Panel D.2 (i.e.,foreign affiliates with both intra-firm imports and exports whose parents are located innon-SSA low/middle-income countries) displays a different pattern. The highest per-centages of these type of affiliates belong to Agriculture (33.3%), and Low-tech andMedium/High-tech manufacturing (32.1% and 31.3%, respectively), while the lowestones to Services (3.3%) and Resource-based manufacturing (6.4%). Construction andTransport includes no firms of this type. Panel D.3 (i.e., foreign affiliates with bothintra-firm imports and exports whose parents are based in SSA countries) shows thatthere are no firms of this type in Mining, Medium/High-tech manufacturing, Con-struction and Trasnport, and Services. Also, their percentages in Agriculture, andResource-based and Low-tech manufacturing are much smaller than those in Panel D.
Panel E displays for each sector the percentages of foreign affiliates which have onlyintra-firm imports. The highest ones are found in Services (98%) and Constructionand Transport (92.9%), in Manufacturing (52.4%), and in particular, in Low-tech andMedium/High-tech manufacturing (52.4% and 61.8%, respectively). The lowest ones arefound in Agriculture (26.5%) and Mining (47.1%). Most of these percentages declinein all industries but Services and Construction and Transport when the parents ofthese affiliates are based in high-income countries. The percentages of firms whoseparents are in non-SSA low/middle-income countries (Panel E.2) and in SSA countries(Panel E.3) remain as high as in Panel E in Services and Construction and Transport.The percentages of the first firm type are higher in Agriculture (33.3%) and in Mining
7
(71.4%). There are not any differences in Manufacturing. The percentages of the secondfirm type are much higher in Agriculture (66.7%) and in Low-tech manufacturing (80%).
As Panels F to F.3 are mirror images of Panels E to Panel E.3, they indicate thatthe lowest percentages of foreign affiliates which have only intra-firm exports are to befound in Services (1%) and Construction and Transport (3.6%), regardless of the originof the parent company. In most of the industries, the percentage of foreign affiliateswhose parents come from high-income countries is higher than that in Panel F. Theopposite is true for foreign affiliates whose parents come from non-SSA low/middle-income countries and SSA countries (Panels F.2 and F.3). The exceptions are firms inMining (14.3%), Resource-based manufacturing (36.2%), and Low-tech manufacturing(18.9%) in Panel F.2, and firms in Manufacturing (31%), and especially, in Resource-based manufacturing and Medium/High-tech manufacturing (37.5% each) in Panel F.3.
3 Econometric model
Since the main focus of this paper is to study any potential differences between for-eign affiliates with and without intra-firm trade in terms of their main characteristicsand activities, we build our econometric model accordingly. That is, we estimate aprobit model which shows which firm characteristics and activities are more likely tobe pertinent to the one of the two types of firm. To decide over which characteristicsand activities we should focus on, we rely upon the extant streams of the literature oninternational trade, FDI, and industrial organisation.
The benchmark probit model incorporates variables which capture the main firmcharacteristics. Variables which capture additional firm characteristics and activitiesare added separately to the benchmark model. For firm j in country c and industry k,whose parent company is located in country p, the estimating benchmark model is thefollowing:
Dift,jckp =α + β1 ∗ skillIntjckp + β2 ∗ capIntjckp + β3 ∗ numEmpjckp+ β4 ∗ wageEmpjckp + β5 ∗ labProdjckp + β6 ∗ inpIntjckp+ β7 ∗DformEmpTrainjckp
+ βc ∗Dc + βk ∗Dk + βp ∗Dp + εjckp
(1)
where the dependent variable, Dift,jcpk, is a dummy taking value 1 if firm j has anytype of intra-firm trade flows (i.e., either intra-firm imports, or intra-firm exports, orboth), and 0 otherwise; skillInt is the log of skill intensity (i.e., share of technical,supervisory and managerial employees in total number of employees), capInt is the logof capital intensity (i.e., ratio of capital stock to total number of employees), numEmpis the log of total number of employees as a proxy for firm size, wageEmp is the logof wage per employee (i.e., total wage bill over total number of employees), labProd isthe log of labour productivity (i.e., ratio of total sales to total number of employees),inpInt is the log of input intensity (i.e., ratio of value of inputs to total number ofemployees), DformEmpTrain is a dummy which takes value 1 if firm j provides formalinternal/external training to its employees and 0 otherwise, Dc is a set of host-countrydummies, Dk a set of industry dummies, and Dp a set of parent-location dummies.
8
The host-country dummies control for any unobserved heterogeneity across the coun-tries which receive foreign investment (e.g. cross-country differences in institutionalquality and business environment). By adding industry dummies, we control for anyunobserved heterogeneity across industries (e.g. technology and knowledge intensityof industries). The parent-location dummies account for any unobserved heterogeneityacross the countries of origin of the investors (e.g. cross-country differences in corporateculture).
In an attempt to study any differences between the two firm types in terms ofthe mode the initial investment took place, we incorporate in the benchmark modelseparately the following variables: a dummy with value 1 if the firm was created asa wholly-owned entreprise and 0 otherwise (DGreenfieldWO), a dummy with value 1 ifthe firm was created as a joint venture and 0 otherwise (DGreenfieldJV ), a dummy withvalue 1 if the firm was created through purchase of pre-existing assets from local privateowners and 0 otherwise (DAcqTakeovLocPr), a dummy with value 1 if the firm was createdthrough purchase of pre-existing assets from private foreign owners and 0 otherwise(DAcqTakeovForPr), and a dummy with value 1 if the firm was created through purchaseof pre-existing state-owned assets (DAcqTakeovState).
Then, we incorporate dummies which capture the principal motive behind foreigninvestor’s decision to invest in the host country. The first dummy takes value 1 ifthe principal motive is to access new markets and 0 otherwise (DMotAccMar), the sec-ond takes value 1 if the principal motive is to lower production costs and 0 otherwise(DMotLowProdCost), the third takes value 1 if the principal motive is to access naturalresources/inputs and 0 otherwise (DMotAccRes), the fourth takes value 1 if the princi-pal motive is to join a specific partner and 0 otherwise (DMotJoinPart), the fifth takesvalue 1 if the principal motive is to export back to home country and 0 otherwise(DMotExpBackHome), while the sixth takes value 1 if the principal motive is to reap thebenefits from a trade agreement and 0 otherwise (DMotBenTrAgr).
In order to study any differences in terms of the most crucial investment incentivethe company received, we add five dummies to the benchmark model. The first dummyis equal to 1 if the most crucial investment incentive was in the form of capital grantsand 0 otherwise (DIncCapGrants), the second is equal to 1 if it was in the form of taxexemption and 0 otherwise (DInctaxExempt), the third is equal to 1 if it was in the formof grants for hiring and 0 otherwise (DIncHireGrants), the fourth is equal to 1 if it was inthe form of provision of training to employees and 0 otherwise (DIncEmpTrain), and thefifth is equal to 1 if it was in the form of improvements in infrastructure and 0 otherwise(DIncInfrastr).
We examine any potential differences in terms of the level of dependence of the twotypes of affiliate on the parent company by adding to the benchmark model numerousvariables. The first variable is the log of the foreign ownership share at the time ofthe initial foreign investment (InitFOwnShare). The second is the log of a measureof the overall autonomy level of the firm (autonomyOverall). It is computed as theaverage level of autonomy of the firm based on its decision making power over 9 specificactivities for those in non-services sectors and over 10 actitivies for those in the servicessector.11 The third is the log of a measure of the overall assistance provided by the
11The autonomy level in decision making over all activities ranges between 1 (lowest level of auton-omy) and 5 (highest level of autonomy). Value 1 implies that all decisions regarding the local unit
9
parent company (assParOverall). Similar to the the measure of the autonomy level,it is computed as the average level of assistance provided by the parent in six differentareas.12 The fourth variable is a dummy with value 1 if capital goods are importeddirectly by the firm (DacqCapImp), the fifth a dummy with value 1 if capital goodsare acquired through local distributors (DacqCapLoc), while the sixth a dummy withvalue 1 if capital goods are imported through the parent company (DacqCapPar). Twoadditional proxies for the level of dependence on the parent company are: a dummywith value 1 if the foreign affiliate pays fees to the parent under a management contract(DmanagementFees), and a dummy with value 1 if the foreign affiliate pays fees to theparent under a licence agreement (DlicenceFees). The dummies are equal to 0 if therelevant statement is not valid.
The parent company as a source of finance of working capital can act as an ex-tra proxy for the level of dependence of the foreign affiliate on its parent. Thereare 7 additional sources. In total, we construct 8 dummies, one dummy per sourceof finance of working capital. The sources of finance are the following: 1) internalfunds/retained trainings (DsourWCIntFund), 2) borrow from banks in the host country(DsourWCBorBankIns), 3) borrow from banks outside the host country (DsourWCBorBankOuts),4) borrow from family/friends/individual lenders (DsourWCBorFam), 5) borrow from non-bank financial institutions (e.g. equity funds) (DsourWCBotNonBank), 6) purchases oncredit from suppliers and advances from customers (DsourWCPurchCredit), 7) issued newequity shares or new debt (including commercial paper and debentures) (DsourWCIssNewEq),8) the parent company (DsourWCParent). Each dummy takes value 1 if the firm makesuse of the corresponding source of finance of working capital and 0 otherwise.
An important aspect of foreign affiliates’ activities are those related to their local andinternational procurement. We add numerous proxies for such kind of activities. Thefirst three capture modes of sourcing inputs other than through the parent company.The first of the three is a dummy with value 1 if the firm imports itself productioninputs and 0 otherwise (DimpDirect), the second a dummy with value 1 if the firm sourcesproduction inputs through a local importer and 0 otherwise (DimpLocal), and the thirda dummy with value 1 if the firm sources production inputs which are manufacturedlocally (DprodLocal). The age of the foreign affiliate (i.e., number of years since its set-
come from the headquarters, value 2 that the foreign affiliate has a minor role in joint decision making,value 3 that the foreign affiliate and its parent have equal power in decision making, value 4 thatforeign affiliate dominates in decision making, and value 5 that foreign affiliate has absolute decisionmaking power. The 8 activities, common for all firms regardless of the sector they belong to, overwhich decisions are made, are the following: 1) introduction/modification of products and services, 2)generating new business in the host country, 3) capital expenditure, including acquisitions, 4) pricingpolicy, 5) entering new export markets, 6) supplier selection, 7) definition of marketing strategy, 8)recruitment/selection. For firms in non-servives sectors, the extra activity is: introduction of newproduction and processing systems. For firms in the services sector, the additional 2 activities are:retail/wholesale format (e.g. shop design) and introduction of new IT system (e.g. inventory system).
12The importance of the assistance from the parent ranges between 0 and 5. Value 0 indicatesthat the affiliated received no assistance from the parent, value 1 that the assistance received wasnot important, value 2 that it was slightly important, value 3 that it was important, value 4 that itwas very important, and value 5 that it was crucial. The areas in which the foreign affiliate may beassisted by its parent are the following: 1) use of patents, trademarks and brand names, 2) technologyand know-how tranfer, 3) upgrading quality of staff, 4) access to finance, 5) access to foreing suppliernetwork, 6) global market access.
10
up) could also proxy for local and international procurement. The intuition is thatthe older an affiliate, the more likely to develop backward linkages within or outsidethe host country and thus, substitute part of its procurement from the parent and/orthe sister affiliate(s), if any, for procurement from non-affiliated parties. We constructone dummy which takes value 1 if the firm was set up no more than 5 years ago and0 otherwise (DfAgeLEQ5), and a second one which takes value 1 if the firm was set upmore than 5 years ago and 0 otherwise (DfAgeGT5).
The next four dummies capture the availability of suppliers of raw materials, com-ponents or finished goods within the host country or overseas and with or withoutlong-term arrangement. The first of the four takes value 1 if the firm has domestic sup-pliers and 0 otherwise (DdomSuppliers), the second takes value 1 if it has suppliers overseasand 0 otherwise (DoverseasSuppliers), the third if it has domestic suppliers with long-termarrangement and 0 otherwise (DdomLTsuppliers), and the fourth if it has suppliers withlong-term arrangement overseas (DoverseasLTSuppliers). A fifth dummy is equal to 1 if thefirm runs a special department for local sourcing and 0 otherwise (DdptLS), and a sixthis equal to 1 if the firm has a special department for local supplier development and 0otherwise (DdptLSD).
We also add to the benchmark model three more groups of dummies. The firstgroup comprises nine dummies for factors which are in favour of local procurement,the second group nine dummies for factors which deter local procurement, and thethird group six dummies for the type of assistance the foreign affiliate may provideto its local suppliers. The nine factors in favour of local procurement and their cor-responding dummies are: 1) local content is mandated or strongly encouraged by theultimate customer (DlocProcCustPref ), 2) improved local market acceptability or localcustomisation of the product (DlocProcProdCust), 3) easier logistics or reduced inventory(DlocProcLogistics), 4) access to local raw materials sources (DlocProcRawMat), 5) closersupplier relationship (DlocProcSuppRel), 6) environmental responsibility (DlocProcEnvResp),7) corporate commitment to local supplier development in the region (DlocProcCorpCom),8) fiscal or tax efficient supply chain reasons (DlocProcSuppChain), 9) reduced tariff costs(DlocProcRedTar). The nine deterrent factors regarding local procurement and their corre-sponding dummies are: 1) uncompetitive local input prices (DcancProcLocPr), 2) unsatis-factory product and/or service quality (DcancProcProdQual), 3) concerns over retention ofintellectual property (DcancProcIntProp), 4) local infrastructure issues (DcancProcLocInfr),5) concerns over labour relations (DcancProcLabRel), 6) technical or management skillsissues (DcancProcMgmSkill), 7) concerns over age, quality of plant and equipment of sup-pliers (DcancProcQualP lant), 8) concerns over plant or process capacity (DcancProcP lantCap),and 9) environmental responsibility (DcancProcEnvResp). The dummy for each factor infavour of and against local procurement takes value 1 if it is deemed by the firm as themost important, and 0 otherwise.
The types of assistance provided by foreign affiliates to local suppliers and sub-contractors with whom they collaborate are the following six: 1) efficiency upgradeof production process of supplier (DassLocSuppUpgEffic), 2) quality upgrade of supplier’sproducts (DassLocSuppUpgQualProd), 3) improved access of supplier to working capital,finance, and equity (DassLocSuppAccWC), 4) quality upgrade of supplier’s workforce(DassLocSuppUpgQualWorkf ), 5) transfer of technology or know-how through designs orprocess know-how to supplier (DassLocTransfTech), 6) conduct product design/production
11
development/specification jointly with supplier (DassLocSuppJointProd). If a firm providesany of the following types of assistance to its local suppliers, the corresponding dummytakes value 1 and 0 otherwise.
In order to capture the proximity and number of countries and/or regions from whicha foreign affiliate imports, we construct four dummy variables. The first takes value 1 ifthe firm imports from contiguous countries/regions such as sub-Saharan Africa (SSA),South Africa (SA), and Middle-East and North Africa (MENA) (Dimpcontiguous). Thesecond takes value 1 if the firm imports from more distant countries/regions such as theEuropean Union (EU), the US, China, India, Asia other China and India (Other Asia– OA), and the rest of the world (Other) (Dimpdistant). The third dummy takes value 1if the firm imports from a single country/region (i.e., only from one among SSA, SA,MENA, EU, US, China, India, OA, Other) (Dimpsingle). The fourth dummy takes value1 if the firm imports from more than one countries or regions (i.e., at least from twoamong SSA, SA, MENA, EU, US, China, India, OA, Other) (Dimpmultiple). Each of thefour dummies is equal to 0 if the corresponding statement is not valid.
In an attempt to study any differences between the two types of affiliate regardingtheir sales activities in the domestic and export markets, we augment the benchmarkmodel with two groups of dummy variables. In the first group, the first dummy equals1 if the firm has sales in the domestic (i.e., host-country) market (DsalesDomMarket), thesecond equals 1 if the firm has direct sales in an export market (DsalesExpDirect), and thethird equals 1 if the firm has indirect sales (e.g. through intermediaries) in an exportmarket (DsalesExpIndirect). In the second group, the first dummy equals 1 if competitionfor the main product of the firm comes mostly from imports (DsourCompImports), the sec-ond equals 1 if competition comes mostly from locally-owned firms (DsourCompLocOwnFirms),and the third equals 1 if competition comes mostly from other foreign-owned firms basedin the country (DsourCompForOwnFirms). Each dummy is equal to 0 if the relevant state-ment does not hold.
Focusing exclusively on direct export activities, we construct several additional dum-mies. The first nine capture the geographical breakdown of direct exports. The 9available destinations and the corresponding dummies are: South Africa (DexpSA), sub-Saharan Africa (DexpSSA), European Union (DexpEU), US (DexpUS), China (DexpChina),India (DexpIndia), Other Asia (DexpOA), Middle-East and North Africa (DexpMENA), andthe rest of the world (DexpOther). Each dummy takes value 1 if the firm has export salesinto the corresponding country/region and 0 otherwise. We also construct dummiesfor the proximity and number of export markets served by foreign affiliates. The firsttakes value 1 if the firm exports to contiguous countries/regions such as sub-SaharanAfrica (SSA), South Africa (SA), Middle-East and North Africa (MENA) and 0 oth-erwise (Dexpcontiguous). The second takes value 1 if the firm exports to more distantcountries/regions such as the European Union (EU), the US, China, India, Asia otherthan China and India (OA), and the rest of the world (Other) (Dexpdistant). The thirddummy takes value 1 if the firm exports to a single country/region (i.e., only to onedestination among SSA, SA, MENA, EU, US, China, India, OA, Other) and 0 other-wise (Dexpsingle). The fourth dummy takes value 1 if the firm exports to more than onedestinations (i.e., at least to two destinations among SSA, SA, MENA, EU, US, China,India, OA, Other) and 0 otherwise (Dexpmultiple).
Exploiting information on direct export sales of firms for the last two financial years,
12
we can capture the export status of the firms. In particular, we construct a dummywith value 1 if the firm is not an exporter (i.e., no export sales in any of the last twofinancial years), and 0 otherwise (Dnoexporter), a dummy with value 1 if the firm is anexport starter (i.e., the firm had direct export sales during the last financial year butnot two financial years ago) and 0 otherwise (Dexpstarter), a dummy with value 1 if thefirm is an export exiter (i.e., the firm had direct export sales two financial years ago butnot during the last financial year) and 0 otherwise (Dexpexiter), and a dummy with value1 if the firm is a continuing exporter (i.e., the firm had direct export sales during thepast two financial years) and 0 otherwise (Dexpcontinue). The importer-exporter statusof the firm (i.e., a firm enganged simultaneously in export and import activities duringthe last financial year) is captured by an additional dummy (Dimpexp).
In order to examine any potential differences in terms of how the two types ofaffiliate can be impacted by barriers to export or Regional Trade Agreements (RTAs)which can facilitate exports, we augment the benchmark model with the following dum-mies. The barriers to export within and outside Africa and their corresponding dum-mies are the following: 1) general infrastructure problems (e.g. communication, IT)(DexpBarWAInfrastr and DexpBarOAInfrastr), 2) tariff trade barriers (DexpBarWATariff andDexpBarOATariff ), 3) non-tariff trade barriers (DexpBarWANTariff and DexpBarOANTariff ),4) cost and access to finance (DexpBarWAAccF in and DexpBarOAAccF in), 5) bureaucracyand regulation (e.g. export permits, border procedures, etc.) (DexpBarWABureaucracy andDexpBarOABureaucracy), 6) inadequate export support services (DexpBarWAInadExpServ andDexpBarOAInadExpServ), 7) high cost of production for export markets (DexpBarWAHighCost
and DexpBarOAHighCost), 8) difficulties in meeting high levels of standards (DexpBarWAHSt
and DexpBarOAHSt). The main benefits from an RTA and the corresponding dummiesare the following: 1) access to finance on better terms (DbenRTAAccF in), 2) greateravailability of skilled labour (DbenRTASkillLab), 3) improved transport and communi-cations infrastructure (DbenRTAInfrastr), 4) access to raw materials and other inputs(DbenRTAAccMatInp), 5) increased regional investment opportunities (DbenRTAInvOpp), 6)reduction in costs of cross-border trade within the region (DbenRTATradeCosts), 7) no ben-efits (DbenRTANo). Each dummy takes value 1 if the statement holds, and 0 otherwise.
Finally, in order to examine for which of the two types of affiliate, there is a higherprobability of their parent running operations in the same host country, in another sub-Saharan-African country, or in any country outside sub-Saharan Africa, we constructthree additional dummies. The first is equal to 1 if the parent company of the foreignaffiliate examined owns at least one more affiliate in the same host country and 0otherwise (DotherSubInCountry), the second is equal to 1 if it owns at least one in anothersub-Saharan-African country and 0 otherwise (DotherSubInSSA), while the third is equalto 1 if it owns at least one in any country outside sub-Saharan-Africa (i.e., in the restof the world) and 0 otherwise (DotherSubOutSSA).
4 Empirical results
The results from the probit estimation of equation 1 are portrayed in column 1 ofTable 7. The coefficient estimates of firm size and labour productivity are positive andsignificant at the level of 1%. The estimated coefficients of skill and capital intensity
13
are negative but not statistically significant. Those of the average wage, input intensity,and the dummy for provision of training to employees are all positive and insignificant.
In column 2 we replace the parent-location dummies with dummies for whether theparent is domiciled in a high-income, or non-SSA low/middle-income, or SSA country.The results are very similar to those in column 1. The main difference is that thecoefficient estimate of the average wage becomes significant at the level of 5%. Incolumn 3, we run the same probit regression as in column 1, with the only differencethat we substitute labour productivity for total factor productivity. By and large, theresults are the same. The size of the coefficient estimate of the firm size is smaller andsignificant only at 5%.
By definition, foreign affiliates of vertical type have exports to their parent (i.e.,intra-firm exports). Hence, in column 4 we re-estimate the benchmark model by havingas dependent variable a dummy which takes value 1 if the foreign affiliate has intra-firmexports and 0 otherwise. The results are very similar to those in column 1. Affiliateswith intra-firm exports are bigger and more productive than those without intra-firmexports. Importantly, the magnitude of the relevant coefficient estimates is greater. Thefirst finding is in line with that of Ramondo et al. (2011). According to the authors, akey difference between “horizontal” and “vertical” affiliates is their size. In particular,they find that only a small number of large affiliates have intra-firm trade. In contrast,the median affiliate, which is smaller in size, has no sales to its parent but mostly salesto unaffiliated parties in the host country. Using an even narrower definition of the“vertical” affiliate, in column 5 the dependent variable of the estimating probit modelis a dummy which takes value 1 if the foreign affiliate has both intra-firm imports andexports, and 0 otherwise. The main results of column 1 still hold. As in column 4, therelevant coefficient estimates are bigger in size.
Among affiliates with intra-firm trade, the number of these with intra-firm imports(i.e., imports from the parent) is exceptionally high in many sectors of the economy(Mining, Low-tech and Medium/High-tech manufacturing, Construction and Transport,Services), as already discussed in Section 2. In addition, Hanson et al. (2001) studythe flows of intermediate goods from the parent to the foreign affiliate (i.e., intra-firmimports from the perspective of the affiliate) by using a measure of the affiliate size.In order to be consistent with both the stylised facts and the paper, in column 6 were-estimate the benchmark model with a dummy as dependent variable which takesvalue 1 if the affiliate has intra-firm imports, and 0 otherwise. We still find premia interms of size and productivity, in spite of the fact that the corresponding coefficientestimates are significant only at 5% and of smaller magnitude.
From Table 7 we conclude that foreign affiliates with intra-firm trade tend to bebigger and more productive13 than firms without intra-firm trade. Based on column 2,
13In the Online Appendix we examine any differences regarding the most important reason forproduction capacity under-utilisation under normal circumstances. We find that the probability offoreign affiliates with intra-firm trade not to have their production capacity under-utilised under normalcircumstances is higher. We also examine any differences in the change in their performance afterthe financial crisis of 2007-2008. We use two different measures. The first is based on the firm’sperformance compared to overall expectations before the crisis and compared to revised expectationsafter the crisis. The second is the average level of capacity utilisation of the firm three years beforethe crisis and immediately after. We find no statistically singnificant differences in terms of firmperformance either before or after the global financial crisis.
14
they also seem to pay higher average wage. We fail to find any statistically significantdifferences between the two firm types in terms of skill intensity, capital intensity, inputintensity, and provision of training to employees.
In Table 8 we examine whether there are any differences between the two firm typesin terms of the way the initial investment took place. The coefficient estimate of thedummy for the first mode of investment in column 1 is positive and significant onlyat 10%. This implies that affiliates with intra-firm trade are more likely to be set upas wholly-owned entreprises. In the next four columns, the coefficient estimates of thedummies which capture the rest four modes of investment are negative but insignificantat all conventional levels.
Table 9 reports the results from the estimation of the benchmark model augmentedwith dummies which capture the principal motive of the foreign investor (i.e., parentcompany) to set up a foreign affiliate. Column 1 shows that parent companies whosemain motive is to penetrate new foreign markets tend to set up affiliates with whichthey trade. In contrast, column 4, even though the coefficient estimate of the relevantdummy is significant only at 10%, shows that parent companies whose principal motiveto invest is to join a specific partner tend to set up affiliates with which they do nottrade. In the rest three columns the coefficient estimates are statistically insignificant.
In Table 10 we report the results from the estimation of the benchmark modelaugmented with dummies which capture the most critical investment incentive that theforeign investor received. Parent companies with affiliates with which they trade aremore likely to receive tax exemption as the most critical incentive for their investment(column 2), while parent companies with affiliates with which they do not trade aremore likely to receive grants for hiring (column 4).
Table 11 portrays the probit estimations with proxies for the level of dependence ofthe foreign affiliate on the parent company. We find that affiliates without intra-firmtrade tend to have a higher level of autonomy (column 2)14 and are more likely toacquire capital goods through direct imports (column 4) and through distributors inthe host country (column 5). In contrast, affiliates with intra-firm trade seem to receivemore assistance from their parents (column 3)15, are more likely to import capital goodsfrom them (column 6) and to pay to them management fees (column 7). We fail tofind any statistically significant differences between the two firm types in terms of theirinitial share of foreign ownership (column 1) and the fees to be paid to the parent underlicence agreement (column 8).
The results in Table 12 reveal that affiliates without intra-firm trade are more likelyto finance their working capital through internal funds and retained earnings (column 1)and through borrowing from banks in the host country (column 2). Instead, affiliateswith intra-firm trade are more likely to have the parent company as their source of
14For robustness checks, in the Online Appendix we show the results from the estimations of theprobit model augmented with the measure of the level of autonomy in decision making over each ofthe 11 activities described in Section 3. We find that foreign affiliates without intra-firm trade tend tohave greater decision making power over 10 out of 11 activities.
15For robustness checks, in the Online Appendix we show the results from the estimations of theprobit model augmented with the measure of parent assistance in each of the 6 areas described inSection 3. We find that foreign affiliates with intra-firm trade are more likely to be assisted by theirparent in 4 out of 6 areas. That is, in the use of patents, trademarks, and brandnames, in technologyand know-how, and in accessing foreign supplier networks and global markets.
15
finance of working capital (column 8). Given that the coefficient estimates of therelevant dummies in the rest of the columns are not significant, we do not observeany differences between the two types of affiliate regarding other sources of finance ofworking capital.16
In Table 13 we study the differences between the two firm types with respect totheir local and international procurement activities. The results indicate that affiliateswithout intra-firm trade are more likely to import inputs directly (column 1). Regardingfirm age, firms up to 5 years old are more likely to be those with intra-firm trade (column4), while those of more than 5 years are more likely to be those without intra-firm trade(column 5). As already mentioned in Section 3, assuming that firm age can proxy forinternational and local procurement (i.e., the older a firm, the more integrated canbecome into local supply chains, as well as into international ones as an alternative tosourcing from the parent company and/or sister affiliates), affiliates without intra-firmtrade are more likely to source inputs from third parties, while affiliates with intra-firmtrade are more likely to source inputs from their parent.17 Also, affiliates with intra-firmtrade are more likely to have suppliers of raw materials, components or finished goodsoverseas (column 7), as well as suppliers overseas with long-term arrangement (column9). We fail to find any statistically significant differences in terms of sourcing inputsfrom local importers (column 2) and inputs which are manufactured locally (column3), in terms of all domestic suppliers and those with long-term arrangement (columns6 and 8), as well as in terms of availability of departments for local sourcing and forlocal supplier development (columns 10 and 11, respectively).
In Table 14 we study any differences regarding the most important factors whichfavour local procurement. The coefficient estimates of dummies capturing these factorsare not statistically significant in all columns except for column 7. Firms which deemthe corporate commitment to local supplier development in the region as the mostimportant factor in favour of local procurement are more likely to be those with intra-firm trade. Any differences regarding the most important deterrent factors of localprocurement are examined in Table 15. All coefficient estimates of the correspondingdummies are statistically insignificant except for the one in column 3. The positive andhighly significant coefficient estimate of the relevant dummy in that column impliesthat firms with intra-firm trade are more likely to cancel or not enter local procurementdue to concerns over retention of intellectual property. Based on the results in Table 16we argue that there are no statistically significant differences between the two types of
16For robustness checks, we examine any differences regarding sources of finance of fixed assets.The available sources of finance are identical to those of working capital. The two main resultsstill hold. Although the corresponding coefficient is significant only at 10%, we also find that foreignaffiliates without intra-firm trade are more likely to finance their fixed assets through non-bank financialinstitutions (e.g. equity funds). In additional robustness checks we show that foreign affiliates withintra-firm trade are more likely to have their parent as the main source of information for (new)investment opportunities. See the Online Appendix for the tables with the two groups of robustnesschecks.
17The firm age may also capture how fast a foreign affiliate can respond to local and regionalsales opportunities (i.e., the older a firm, the more integrated into the local economy, and the fasterits response). Hence, affiliates without intra-firm trade tend to be more responsive to local salesopportunities. Similar findings with better proxies for the swiftness of response of affiliates to localdemand are reported in Table 18.
16
affiliate in terms of the assistance they may provide to their local suppliers.The results from the estimation of the benchmark probit model augmented with
dummies which capture the proximity and number of countries and regions from wihcha firm imports are displayed in Table 17. We find that firms with intra-firm trade aremore likely to have imports from more distant and more than one countries/regions(columns 2 and 4, respectively).
As regards the domestic and export sales of the firm and the source of competitionfor its main product, the coefficient estimates of the corresponding variables in Table 18indicate that firms with intra-firm trade are more likely to have both direct and indirectexport sales (columns 2 and 3), while less likely to have sales in the domestic market(column 1). In addition, affiliates with intra-firm trade are more likely to face com-petition for their main product mostly from imports (column 4), while those withoutintra-firm trade from locally-owned firms (column 5). There do not seem to be anydifferences regarding competition from other foreign-owned firms domiciled in the hostcountry.18
In Table 19 we study any differences in terms of the geography of exports of thetwo types of affiliate. We find that firms with intra-firm trade are more likely to exportto contiguous countries and regions such as sub-Saharan-Africa (SSA), South Africa(SA), Middle-East and North Africa (MENA), as well as to more distant countries andregions such as the European Union (EU), the US, India, Asia save of China and India,and the rest of the world (Other). We fail to find any statistically significant differencein terms of exports to China (column 5). The same conclusions are drawn from the firsttwo columns of Table 20 (i.e., the coefficient estimates of the dummies for contiguousand distant export markets are both positive and highly significant). Columns 3 and4 indicate that affiliates with intra-firm trade are also more likely to export to a singleand to more than one market.
Table 21 shows that firms without intra-firm trade are more likely to be non-exporters (i.e., no exports in the previous two financial years) and export-exiters (i.e.,firm exported two financial years ago and stopped exporting thenceforth) (columns 1and 3, respectively). Instead, firms with intra-firm trade are more likely to be export-starters (i.e., firm had no exports two financial years ago but started to export theprevious financial year) (column 2), and continuing exporters (i.e., firm with exportactivities in the previous two financial years) (column 4). Finally, the same type of firmis more likely to engage simultaneously in export and import activities (column 5).
In the next two tables we study any differential impact of barriers to export withinand outside Africa on the two firm types, while in a third one any differential impact ofRegional Trade Agreements (RTAs) on them. Table 22 reveals that affiliates with intra-firm trade are more likely to consider general infrastructure problems, bureaucracy andregulation, and the high cost of production for export markets as the most importantbarriers to starting or expanding their export activities within Africa (columns 1, 5 and7, respectively). Table 23 indicates that affiliates with intra-firm trade are also more
18In the Online Appendix, we also show the findings on the differences with respect to forwardlinkages (i.e., firm undertakes sub-contract work for other companies in the country) and buyer types(i.e., retailers, distributors/wholesalers, manufacturers, government, consumers/end users, NGOs andinternational agencies). We fail to find any statistically significant differences except for one. Firmswith intra-firm trade are more likely to have sales to NGOs and international agencies.
17
likely to deem general infrastructure probles, tariff and non-tariff barriers, bureaucracyand regulation, and inadequate export support services as the most important barriersto starting or expanding their export activities outside Africa (columns 1, 2, 3, 5,and 6, respectively). As regards the most important benefits from RTAs, Table 24shows that affiliates with intra-firm trade are more likely to reap the benefits from anRTA in the form of access to finance on better terms (column 1), improved transportand communications infrastructure (column 3), improved access to raw materials andother inputs (column 4), and increased regional investment opportunities (column 5).The only dummy whose coefficient estimate is negative, albeit insignificant, is the oneaccording to which the firm reaps no benefits from an RTA (column 7).
The last table in this section, Table 25, reports the results from the estimation ofthe probit model augmented with dummies for the availability of sister affiliates withinthe same host country, in other country in sub-Saharan Africa, or outside sub-SaharanAfrica (i.e., rest of the world). Affiliates with intra-firm trade are more likely to havesister affiliates in the same country (column 1), in another country in sub-SaharanAfrica (column 2), as well as outside sub-Saharan Africa (column 3). One possibleexplanation for these findings is that parent companies with intra-firm trade tend tobuild a relatively large network of foreign affiliates which may be dispersed around theglobe.19
We boil down the main findings as follows. Foreign affiliates with intra-firm tradetend to be bigger and more productive. They also tend to rely more on their parent fordecision making and management, for assistance in several crucial areas, for acquisitionof capital goods, and finance of working capital. Affiliates without intra-firm tradeare more likely to import themselves capital goods or to acquire them through localdistributors. Although affiliates without intra-firm trade are more likely to importinputs directly, those with intra-firm trade are more likely to have suppliers overseas.The combination of these two findings implies that some of these suppliers overseas aresister affiliates of firms with intra-firm trade. What is more, affiliates with intra-firmtrade are more likely to engage in local procurement because of corporate commitmentto local supplier development in the region, and to cancel or not enter local procurementdue to concerns over reterntion of their intellectual property. The same type of firm ismore likely to import from more distant and multiple countries/regions.
As regards market orientation, sources of competition and export activities, we findthat affiliates with intra-firm trade are more likely to engage in direct and indirect (e.g.through intermediaries in the host country) exports, and to face competition for theirmain product primarily from imports. Instead, firms without intra-firm trade are morelikely to have sales in the domestic market and face competition for their main productmostly from locally-owned firms in the host country. In addition, firms with intra-firmtrade are more likely to export to contiguous markets (i.e., sub-Saharan Africa, SouthAfrica, Middle-East and North Africa), more distant ones (i.e., EU, US, India, Asia
19In the Online Appendix, we provide results from estimations of the probit model augmented withdummies capturing expectations for new investment and disinvestment, as well as for expansion inneighbouring and non-neighbouring SSA countries over the next three years. We fail to find anystatistically significant differences in terms of expectations for new investment/disinvestment. Instead,we find strong evidence on parents of foreign affiliates with intra-firm trade being more likely to haveplans for expanding their operations in neighbouring and non-neighbouring SSA countries.
18
other than China and India, and the rest of the world), to a single market, as well asto multiple ones. Firms with non-exporter and export-exiter status are more likely tobe those without intra-firm trade, while those with intra-firm trade are more likely tobe export-starters, continuing exporters, and importers-exporters.
Since our findings reveal that firms with intra-firm trade are more export-oriented,one would expect that they would be impacted disproportionately by several exportbarriers and by the formation of RTAs. Indeed, we find that affiliates with intra-firm trade are more likely to consider general infrastructure problems, bureaucracy andregulation, and the high cost of production for export markets as the most importantbarriers to starting or expanding their export activities within Africa. Firms of thesame type are more likely to deem general infrastructure probles, tariff and non-tariffbarriers, bureaucracy and regulation, and inadequate export support services as themost important barriers to starting or expanding their export activities outside Africa.Concerning the most important benefits from RTAs, affiliates with intra-firm trade aremore likely to benefit from RTAs through access to finance on better terms, improvedtransport and communications infrastructure, improved access to raw materials andother inputs, and increased regional investment opportunities.
Parent companies which trade with their foreign affiliates are more likely to ownother affiliates either in the same host country, or in other sub-Saharan-African coun-tries, or in any country outside sub-Sahran Africa. They are also more likely to set upan affiliate with which they trade as wholly-owned entreprise, and the most importantincentive that they receive in order to do so is tax exemption. Instead, firms withoutintra-firm trade are more likely to receive grants for hiring as main investment incentive.Finally, parents whose main motive to invest is to access new markets tend to tradewith their foreign affiliates – possible evidence of complex FDI–, while those whosemain motive is to join a specific partner in the host country tend not to.
5 Concluding remarks
In this paper we study the differences in terms of main firm characteristics and activitiesbetween foreing affiliates with and without intra-firm trade located in 19 countries insub-Saharan African in 2010.
We find strong evidence on affiliates with intra-firm trade being bigger, more pro-ductive, and more dependent on their parent company in terms of decision making andmanagement, receiving assistance in several areas, acquiring capital goods, and financ-ing working capital. Affiliates without intra-firm trade are more likely to import capitalgoods directly themselves or to acquire them through local distributors.
Regarding international and local procerement, although affiliates without intra-firmtrade are more likely to import inputs directly, those with intra-firm trade are morelikely to have suppliers overseas (i.e., some of these suppliers may be their sister affiliatesand therefore, imports from them are recorded as intra-firm). Moreover, affiliates withintra-firm trade are more likely to engage in local procurement because of corporatecommitment to local supplier development in the region, and to cancel or not enter dueto concerns over reterntion of their intellectual property. The same type of firm is morelikely to import from more distant and multiple countries/regions.
19
As regards market orientation, sources of competition and export activities, we findthat affiliates with intra-firm trade are more likely to engage in direct and indirect (e.g.through intermediaries in the host country) exports, and to face competition for theirmain product primarily from imports. Instead, firms without intra-firm trade are morelikely to have sales in the domestic market and face competition for their main productmostly from locally-owned firms in the host country. In addition, firms with intra-firmtrade are more likely to export to contiguous markets (i.e., sub-Saharan Africa, SouthAfrica, Middle-East and North Africa), more distant ones (i.e., EU, US, India, Asiaother than China and India, and the rest of the world), to a single market, as well asto multiple ones. Firms with non-exporter and export-exiter status are more likely tobe those without intra-firm trade, while those with intra-firm trade are more likely tobe export-starters, continuing exporters, and importers-exporters.
We also find that affiliates with intra-firm trade are more likely to consider generalinfrastructure problems, bureaucracy and regulation, and the high cost of productionfor export markets as the most important barriers to starting or expanding their ex-port activities within Africa. Firms of the same type are more likely to deem generalinfrastructure problems, tariff and non-tariff barriers, bureaucracy and regulation, andinadequate export support services as the most important barriers to starting or ex-panding their export activities outside Africa. Concerning the most important benefitsfrom RTAs, affiliates with intra-firm trade are more likely to reap the benefits froman RTA through improved access to finance on better terms, improved transport andcommunications infrastructure, improved access to raw materials and other inputs, andincreased regional investment opportunities.
Parent companies which trade with their foreign affiliates are more likely to ownother affiliates either in the same host country, or in other sub-Saharan-African coun-tries, or in any country outside sub-Sahran Africa. They are also more likely to setup an affiliate with which they trade as wholly-owned entreprise and benefit from taxexemption for their foreign investment. Instead, parents of firms without intra-firmtrade are more likely to receive grants for hiring as investment incentive. Furthermore,parents whose main motive to invest is to access new markets tend to trade with theirforeign affiliates – possible evidence of complex FDI–, while those whose main motiveis to join a specific partner in the host country tend not to.
Our main findings allow us to draw some useful economic-policy conclusions. Sinceforeign affiliates with intra-firm trade tend to be of bigger size (i.e., employ a highernumber of workers), their presence in the host country implies a higher number of jobopportunities. Secondly, their tendency to be more productive suggests that unaffili-ated local firms which collaborate with them (e.g. as suppliers of specific inputs) andtherefore, are part of the same supply chain, may benefit from productivity spillovers.As regards capital goods, local distributors of such goods can benefit more from thepresence of affiliates without intra-firm trade in the country.
From our findings on favourable and deterrent factors of local procurement, localfirms can hardly benefit from technology and know-how spillovers unless they initiate astrategic collaboration with affiliates with intra-firm trade, which may mean in practicethat they will be “absorbed” by the MNC. In contrast, they are more likely to have thiskind of benefits through special partnerships with affiliates without intra-firm trade.Furthermore, as affiliates with intra-firm trade are more export-oriented, the countries
20
which manage to attract more of these can become themselves more export-oriented andin general, more integrated into the global economy. However, the lift of export barriersand the formation of RTAs seem to be prerequisites for these countries to attract moreaffiliates with intra-firm trade. Since firms devoid of intra-firm trade are prone to havesales in the domestic market, their presence in the country is more likely to intensifydomestic competition, with an ensuing decrease in prices of goods and services and anincrease in the number of varieties.
As parents of affiliates with intra-firm trade are more likely to build a networkof affiliates in a specific host country, the presence of such an affiliate increases theprobability for a new foreign investment in the country. Finally, governments of hostcountries can attract more firms with intra-firm trade if they provide tax exemption asmain investment incentive.
Upon data availability at the foreign affiliate-product level in terms of imports andexports within and outside the boundaries of the MNC, as well as in terms of pro-curement from local affiliated and non-affiliated parties, one could study in more detailthe differences between the two types of affiliates regarding these essential businessactivities.
References
Alfaro, L. and Charlton, A. (2009). Intra-industry Foreign Direct Investment. AmericanEconomic Review, 99(5):2096–2119.
Badinger, H. and Egger, P. (2010). Horizontal vs. vertical interdependence in multina-tional activity. Oxford Bulletin of Economics and Statistics, 72(6):744–768.
Borga, M. and Zeile, W. J. (2004). International fragmentation of production andthe intrafirm trade of u.s. multinational companies. BEA Papers 0035, Bureau ofEconomic Analysis.
Brainard, S. L. (1997). An Empirical Assessment of the Proximity-Concentration Trade-off between Multinational Sales and Trade. American Economic Review, 87(4):520–44.
Carr, D. L., Markusen, J. R., and Maskus, K. E. (2001). Estimating the knowledge-capital model of the multinational enterprise. The American Economic Review,91(3):pp. 693–708.
Caves, R. (1982). Multinational Enterprise and Economic Analysis. Cambridge, UK:Cambridge University Press.
Ekholm, K., Forslid, R., and Markusen, J. R. (2007). Export-platform foreign directinvestment. Journal of the European Economic Association, 5(4):776–795.
Feinberg, S. E. and Keane, M. P. (2001). U.S.-Canada Trade Liberalization And MncProduction Location. The Review of Economics and Statistics, 83(1):118–132.
21
Grossman, G. M., Helpman, E., and Szeidl, A. (2006). Optimal integration strategiesfor the multinational firm. Journal of International Economics, 70(1):216–238.
Hanson, G. H., Mataloni, Raymond J., J., and Slaughter, M. J. (2001). Expansionstrategies of u.s. multinational firms. Brookings Trade Forum, pages pp. 245–294.
Hanson, G. H., Mataloni, R. J., and Slaughter, M. J. (2005). Vertical productionnetworks in multinational firms. The Review of Economics and Statistics, 87(4):664–678.
Helpman, E. (1984). A simple theory of international trade with multinational corpo-rations. Journal of Political Economy, 92(3):pp. 451–471.
Helpman, E. (2006). Trade, fdi, and the organization of firms. Journal of EconomicLiterature, 44(3):589–630.
Helpman, E. and Krugman, P. (1985). Market Structure and Foreign Trade. Cambridge,Massachusetts: MIT Press.
Helpman, E., Melitz, M. J., and Yeaple, S. R. (2004). Export Versus FDI with Hetero-geneous Firms. American Economic Review, 94(1):300–316.
Horstmann, I. J. and Markusen, J. R. (1992). Endogenous market structures in inter-national trade (natura facit saltum). Journal of International Economics, 32(12):109– 129.
Irarrazabal, A., Moxnes, A., and Opromolla, L. D. (2013). The Margins of MultinationalProduction and the Role of Intrafirm Trade. Journal of Political Economy, 121(1):74– 126.
Markusen, J. R. (1984). Multinationals, multi-plant economies, and the gains fromtrade. Journal of International Economics, 16(3-4):205–226.
Markusen, J. R. and Venables, A. J. (2000). The theory of endowment, intra-industryand multi-national trade. Journal of International Economics, 52(2):209–234.
OECD (2002). Intra-industry and intra-firm trade and the internationalisation of pro-duction. OECD Economic Outlook 71.
Ramondo, N., Rappoport, V., and Ruhl, K. J. (2011). Horizontal Vs. Vertical FDI :Revisiting Evidence from U.S. Multinationals. Technical report.
Ramondo, N., Rappoport, V., and Ruhl, K. J. (2013). The proximity-concentrationtradeoff under uncertainty. The Review of Economic Studies, 80(4):1582–1621.
UNCTAD (1998). World investment report 2010. trends and determinants. UnitedNations Publication, New York and Geneva.
UNCTAD (2010a). Economic development in africa report 2010. south-south coopera-tion: Africa and the new forms of development partnership. United Nations Publica-tion, New York and Geneva.
22
UNCTAD (2010b). World investment report 2010. investing in a low carbon economy.United Nations Publication, New York and Geneva.
UNCTAD (2013). Economic development in africa report 2013. intra-african trade: Un-locking private sector dynamism. United Nations Publication, New York and Geneva.
UNCTAD and UNIDO (2011). Economic development in africa report 2011. fosteringindustrial development in africa in the new global environment. United NationsPublication, New York and Geneva.
Yeaple, S. R. (2003a). The complex integration strategies of multinationals and crosscountry dependencies in the structure of foreign direct investment. Journal of Inter-national Economics, 60(2):293–314.
Yeaple, S. R. (2003b). The Role of Skill Endowments in the Structure of U.S. OutwardForeign Direct Investment. The Review of Economics and Statistics, 85(3):726–734.
Yeaple, S. R. (2008). Multinational enterprise and economic analysis, 3rd edition,richard caves. cambridge university press (2007). Journal of International Economics,75(2):383 – 385.
23
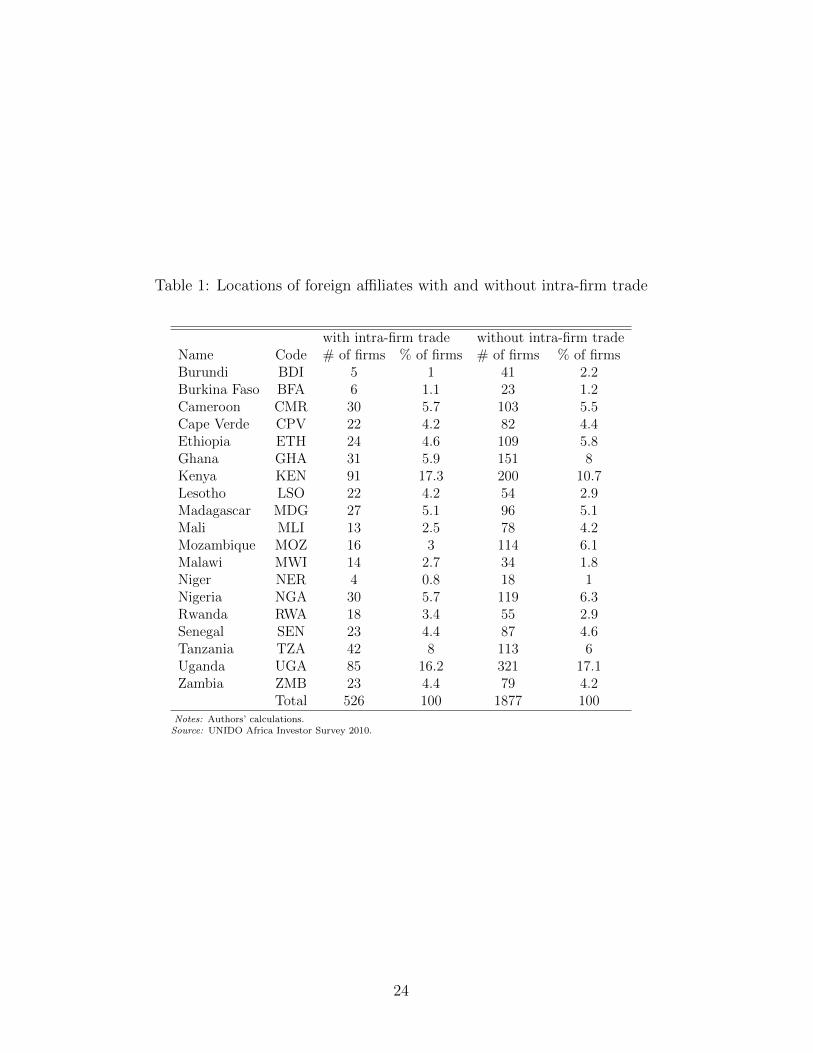
Table 1: Locations of foreign affiliates with and without intra-firm trade
with intra-firm trade without intra-firm tradeName Code # of firms % of firms # of firms % of firmsBurundi BDI 5 1 41 2.2Burkina Faso BFA 6 1.1 23 1.2Cameroon CMR 30 5.7 103 5.5Cape Verde CPV 22 4.2 82 4.4Ethiopia ETH 24 4.6 109 5.8Ghana GHA 31 5.9 151 8Kenya KEN 91 17.3 200 10.7Lesotho LSO 22 4.2 54 2.9Madagascar MDG 27 5.1 96 5.1Mali MLI 13 2.5 78 4.2Mozambique MOZ 16 3 114 6.1Malawi MWI 14 2.7 34 1.8Niger NER 4 0.8 18 1Nigeria NGA 30 5.7 119 6.3Rwanda RWA 18 3.4 55 2.9Senegal SEN 23 4.4 87 4.6Tanzania TZA 42 8 113 6Uganda UGA 85 16.2 321 17.1Zambia ZMB 23 4.4 79 4.2
Total 526 100 1877 100Notes: Authors’ calculations.Source: UNIDO Africa Investor Survey 2010.
24
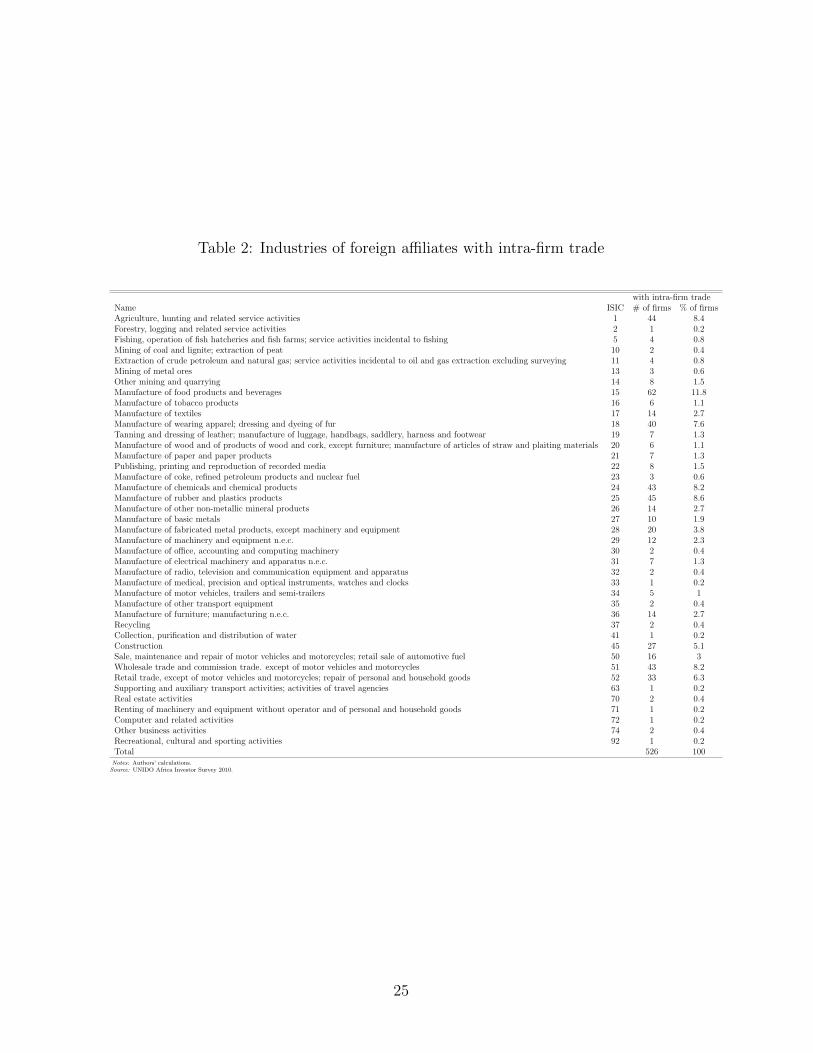
Table 2: Industries of foreign affiliates with intra-firm trade
with intra-firm tradeName ISIC # of firms % of firmsAgriculture, hunting and related service activities 1 44 8.4Forestry, logging and related service activities 2 1 0.2Fishing, operation of fish hatcheries and fish farms; service activities incidental to fishing 5 4 0.8Mining of coal and lignite; extraction of peat 10 2 0.4Extraction of crude petroleum and natural gas; service activities incidental to oil and gas extraction excluding surveying 11 4 0.8Mining of metal ores 13 3 0.6Other mining and quarrying 14 8 1.5Manufacture of food products and beverages 15 62 11.8Manufacture of tobacco products 16 6 1.1Manufacture of textiles 17 14 2.7Manufacture of wearing apparel; dressing and dyeing of fur 18 40 7.6Tanning and dressing of leather; manufacture of luggage, handbags, saddlery, harness and footwear 19 7 1.3Manufacture of wood and of products of wood and cork, except furniture; manufacture of articles of straw and plaiting materials 20 6 1.1Manufacture of paper and paper products 21 7 1.3Publishing, printing and reproduction of recorded media 22 8 1.5Manufacture of coke, refined petroleum products and nuclear fuel 23 3 0.6Manufacture of chemicals and chemical products 24 43 8.2Manufacture of rubber and plastics products 25 45 8.6Manufacture of other non-metallic mineral products 26 14 2.7Manufacture of basic metals 27 10 1.9Manufacture of fabricated metal products, except machinery and equipment 28 20 3.8Manufacture of machinery and equipment n.e.c. 29 12 2.3Manufacture of office, accounting and computing machinery 30 2 0.4Manufacture of electrical machinery and apparatus n.e.c. 31 7 1.3Manufacture of radio, television and communication equipment and apparatus 32 2 0.4Manufacture of medical, precision and optical instruments, watches and clocks 33 1 0.2Manufacture of motor vehicles, trailers and semi-trailers 34 5 1Manufacture of other transport equipment 35 2 0.4Manufacture of furniture; manufacturing n.e.c. 36 14 2.7Recycling 37 2 0.4Collection, purification and distribution of water 41 1 0.2Construction 45 27 5.1Sale, maintenance and repair of motor vehicles and motorcycles; retail sale of automotive fuel 50 16 3Wholesale trade and commission trade. except of motor vehicles and motorcycles 51 43 8.2Retail trade, except of motor vehicles and motorcycles; repair of personal and household goods 52 33 6.3Supporting and auxiliary transport activities; activities of travel agencies 63 1 0.2Real estate activities 70 2 0.4Renting of machinery and equipment without operator and of personal and household goods 71 1 0.2Computer and related activities 72 1 0.2Other business activities 74 2 0.4Recreational, cultural and sporting activities 92 1 0.2Total 526 100Notes: Authors’ calculations.Source: UNIDO Africa Investor Survey 2010.
25
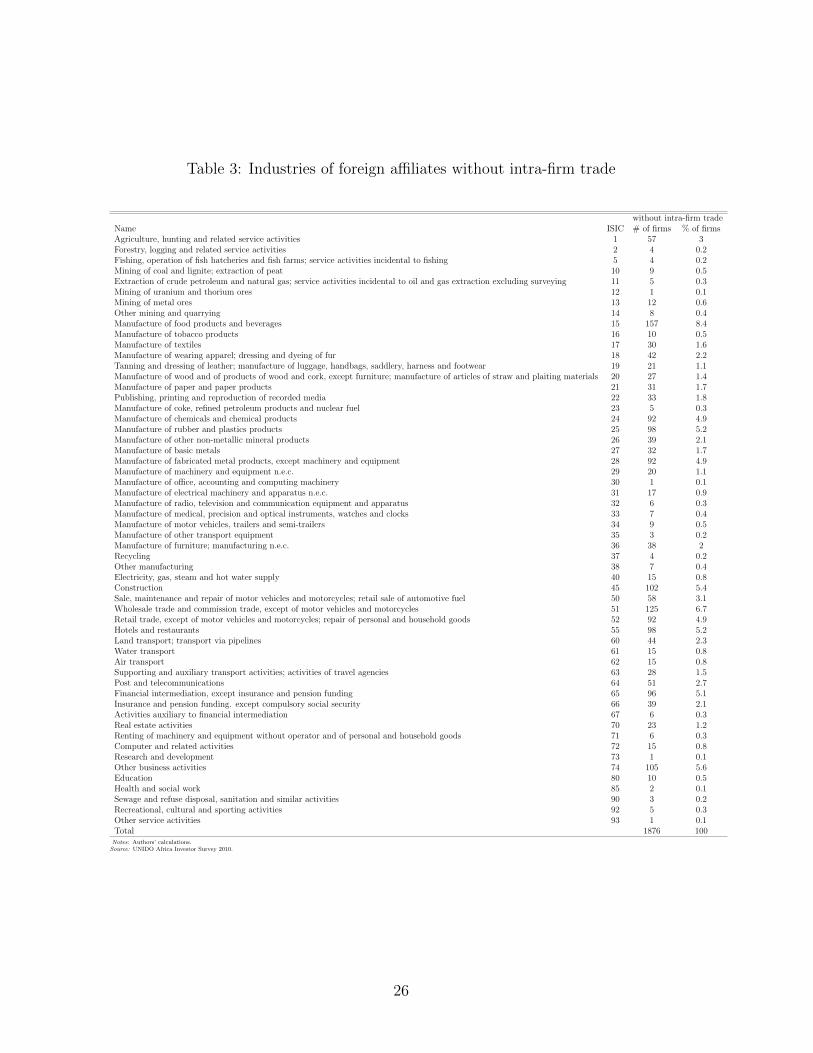
Table 3: Industries of foreign affiliates without intra-firm trade
without intra-firm tradeName ISIC # of firms % of firmsAgriculture, hunting and related service activities 1 57 3Forestry, logging and related service activities 2 4 0.2Fishing, operation of fish hatcheries and fish farms; service activities incidental to fishing 5 4 0.2Mining of coal and lignite; extraction of peat 10 9 0.5Extraction of crude petroleum and natural gas; service activities incidental to oil and gas extraction excluding surveying 11 5 0.3Mining of uranium and thorium ores 12 1 0.1Mining of metal ores 13 12 0.6Other mining and quarrying 14 8 0.4Manufacture of food products and beverages 15 157 8.4Manufacture of tobacco products 16 10 0.5Manufacture of textiles 17 30 1.6Manufacture of wearing apparel; dressing and dyeing of fur 18 42 2.2Tanning and dressing of leather; manufacture of luggage, handbags, saddlery, harness and footwear 19 21 1.1Manufacture of wood and of products of wood and cork, except furniture; manufacture of articles of straw and plaiting materials 20 27 1.4Manufacture of paper and paper products 21 31 1.7Publishing, printing and reproduction of recorded media 22 33 1.8Manufacture of coke, refined petroleum products and nuclear fuel 23 5 0.3Manufacture of chemicals and chemical products 24 92 4.9Manufacture of rubber and plastics products 25 98 5.2Manufacture of other non-metallic mineral products 26 39 2.1Manufacture of basic metals 27 32 1.7Manufacture of fabricated metal products, except machinery and equipment 28 92 4.9Manufacture of machinery and equipment n.e.c. 29 20 1.1Manufacture of office, accounting and computing machinery 30 1 0.1Manufacture of electrical machinery and apparatus n.e.c. 31 17 0.9Manufacture of radio, television and communication equipment and apparatus 32 6 0.3Manufacture of medical, precision and optical instruments, watches and clocks 33 7 0.4Manufacture of motor vehicles, trailers and semi-trailers 34 9 0.5Manufacture of other transport equipment 35 3 0.2Manufacture of furniture; manufacturing n.e.c. 36 38 2Recycling 37 4 0.2Other manufacturing 38 7 0.4Electricity, gas, steam and hot water supply 40 15 0.8Construction 45 102 5.4Sale, maintenance and repair of motor vehicles and motorcycles; retail sale of automotive fuel 50 58 3.1Wholesale trade and commission trade, except of motor vehicles and motorcycles 51 125 6.7Retail trade, except of motor vehicles and motorcycles; repair of personal and household goods 52 92 4.9Hotels and restaurants 55 98 5.2Land transport; transport via pipelines 60 44 2.3Water transport 61 15 0.8Air transport 62 15 0.8Supporting and auxiliary transport activities; activities of travel agencies 63 28 1.5Post and telecommunications 64 51 2.7Financial intermediation, except insurance and pension funding 65 96 5.1Insurance and pension funding. except compulsory social security 66 39 2.1Activities auxiliary to financial intermediation 67 6 0.3Real estate activities 70 23 1.2Renting of machinery and equipment without operator and of personal and household goods 71 6 0.3Computer and related activities 72 15 0.8Research and development 73 1 0.1Other business activities 74 105 5.6Education 80 10 0.5Health and social work 85 2 0.1Sewage and refuse disposal, sanitation and similar activities 90 3 0.2Recreational, cultural and sporting activities 92 5 0.3Other service activities 93 1 0.1Total 1876 100Notes: Authors’ calculations.Source: UNIDO Africa Investor Survey 2010.
26
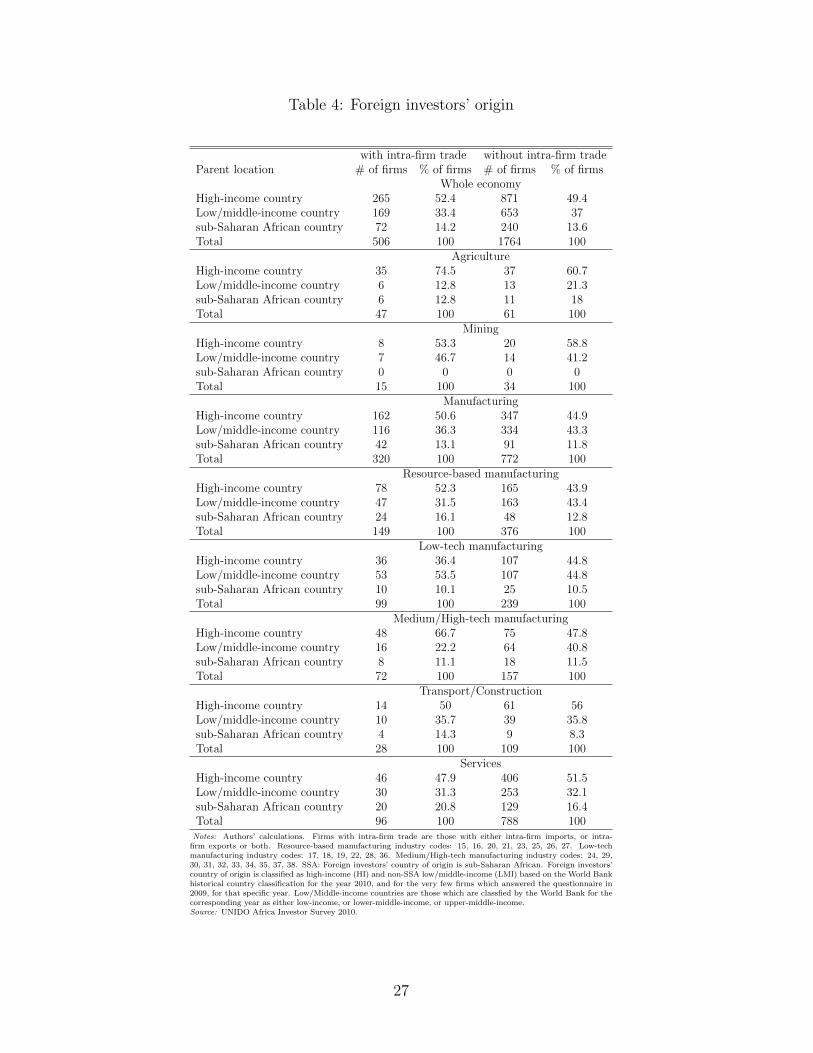
Table 4: Foreign investors’ origin
with intra-firm trade without intra-firm tradeParent location # of firms % of firms # of firms % of firms
Whole economyHigh-income country 265 52.4 871 49.4Low/middle-income country 169 33.4 653 37sub-Saharan African country 72 14.2 240 13.6Total 506 100 1764 100
AgricultureHigh-income country 35 74.5 37 60.7Low/middle-income country 6 12.8 13 21.3sub-Saharan African country 6 12.8 11 18Total 47 100 61 100
MiningHigh-income country 8 53.3 20 58.8Low/middle-income country 7 46.7 14 41.2sub-Saharan African country 0 0 0 0Total 15 100 34 100
ManufacturingHigh-income country 162 50.6 347 44.9Low/middle-income country 116 36.3 334 43.3sub-Saharan African country 42 13.1 91 11.8Total 320 100 772 100
Resource-based manufacturingHigh-income country 78 52.3 165 43.9Low/middle-income country 47 31.5 163 43.4sub-Saharan African country 24 16.1 48 12.8Total 149 100 376 100
Low-tech manufacturingHigh-income country 36 36.4 107 44.8Low/middle-income country 53 53.5 107 44.8sub-Saharan African country 10 10.1 25 10.5Total 99 100 239 100
Medium/High-tech manufacturingHigh-income country 48 66.7 75 47.8Low/middle-income country 16 22.2 64 40.8sub-Saharan African country 8 11.1 18 11.5Total 72 100 157 100
Transport/ConstructionHigh-income country 14 50 61 56Low/middle-income country 10 35.7 39 35.8sub-Saharan African country 4 14.3 9 8.3Total 28 100 109 100
ServicesHigh-income country 46 47.9 406 51.5Low/middle-income country 30 31.3 253 32.1sub-Saharan African country 20 20.8 129 16.4Total 96 100 788 100Notes: Authors’ calculations. Firms with intra-firm trade are those with either intra-firm imports, or intra-
firm exports or both. Resource-based manufacturing industry codes: 15, 16, 20, 21, 23, 25, 26, 27. Low-techmanufacturing industry codes: 17, 18, 19, 22, 28, 36. Medium/High-tech manufacturing industry codes: 24, 29,30, 31, 32, 33, 34, 35, 37, 38. SSA: Foreign investors’ country of origin is sub-Saharan African. Foreign investors’country of origin is classified as high-income (HI) and non-SSA low/middle-income (LMI) based on the World Bankhistorical country classification for the year 2010, and for the very few firms which answered the questionnaire in2009, for that specific year. Low/Middle-income countries are those which are classfied by the World Bank for thecorresponding year as either low-income, or lower-middle-income, or upper-middle-income.Source: UNIDO Africa Investor Survey 2010.
27
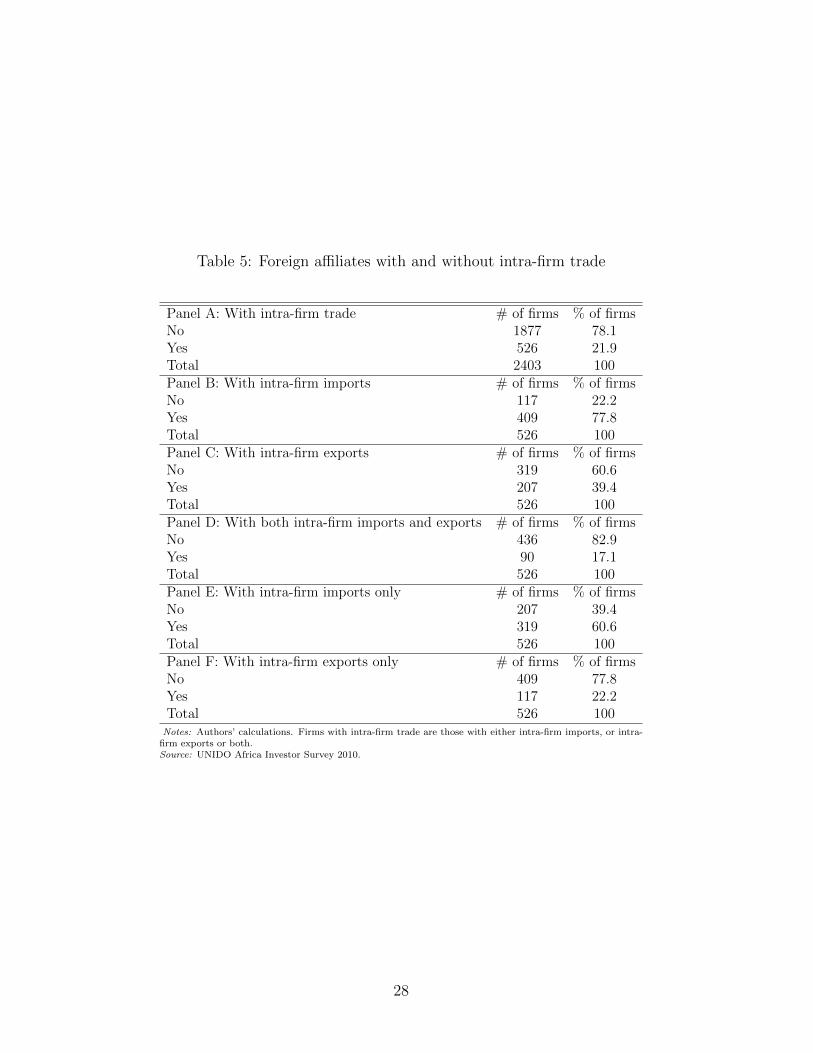
Table 5: Foreign affiliates with and without intra-firm trade
Panel A: With intra-firm trade # of firms % of firmsNo 1877 78.1Yes 526 21.9Total 2403 100Panel B: With intra-firm imports # of firms % of firmsNo 117 22.2Yes 409 77.8Total 526 100Panel C: With intra-firm exports # of firms % of firmsNo 319 60.6Yes 207 39.4Total 526 100Panel D: With both intra-firm imports and exports # of firms % of firmsNo 436 82.9Yes 90 17.1Total 526 100Panel E: With intra-firm imports only # of firms % of firmsNo 207 39.4Yes 319 60.6Total 526 100Panel F: With intra-firm exports only # of firms % of firmsNo 409 77.8Yes 117 22.2Total 526 100Notes: Authors’ calculations. Firms with intra-firm trade are those with either intra-firm imports, or intra-
firm exports or both.Source: UNIDO Africa Investor Survey 2010.
28
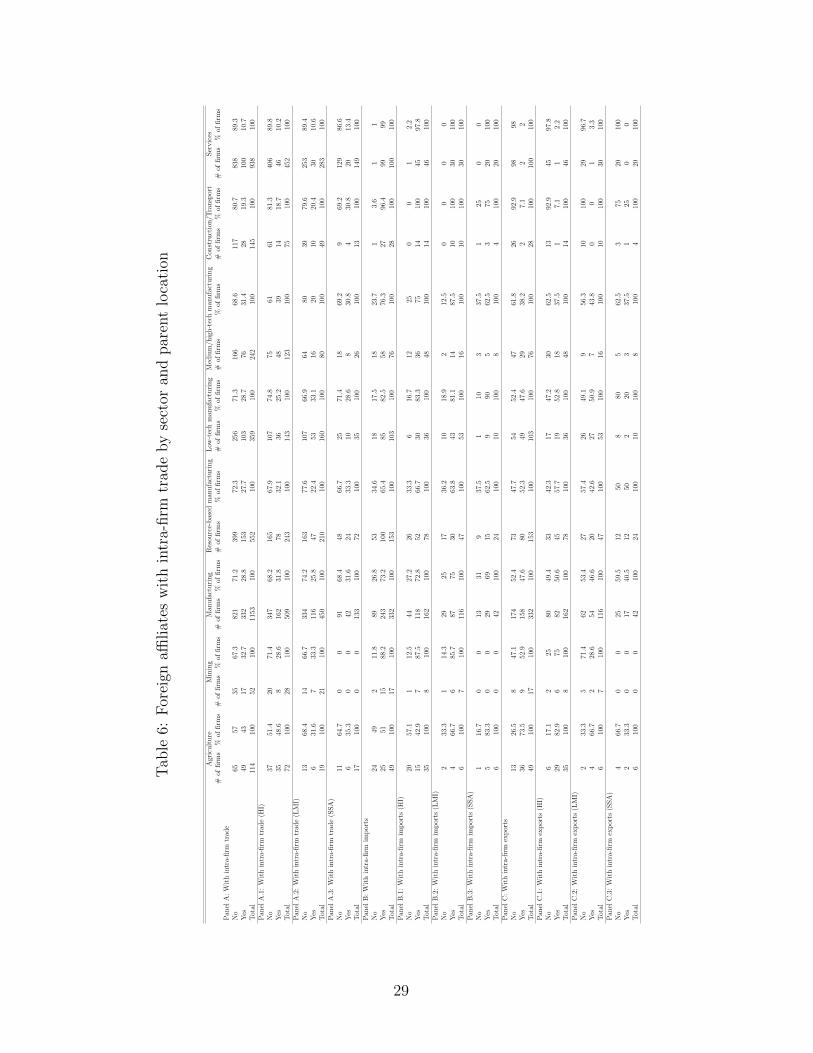
Tab
le6:
For
eign
affiliat
esw
ith
intr
a-firm
trad
eby
sect
oran
dpar
ent
loca
tion
Agr
icult
ure
Min
ing
Man
ufa
cturi
ng
Res
ourc
e-bas
edm
anufa
cturi
ng
Low
-tec
hm
anufa
cturi
ng
Med
ium
/hig
h-t
ech
man
ufa
cturi
ng
Con
stru
ctio
n/T
ransp
ort
Ser
vic
es#
offirm
s%
offirm
s#
offirm
s%
offirm
s#
offirm
s%
offirm
s#
offirm
s%
offirm
s#
offirm
s%
offirm
s#
offirm
s%
offirm
s#
offirm
s%
offirm
s#
offirm
s%
offirm
sP
anel
A:
Wit
hin
tra-
firm
trad
eN
o65
5735
67.3
821
71.2
399
72.3
256
71.3
166
68.6
117
80.7
838
89.3
Yes
4943
1732
.733
228
.815
327
.710
328
.776
31.4
2819
.310
010
.7T
otal
114
100
5210
011
5310
055
210
035
910
024
210
014
510
093
810
0P
anel
A.1
:W
ith
intr
a-firm
trad
e(H
I)N
o37
51.4
2071
.434
768
.216
567
.910
774
.875
6161
81.3
406
89.8
Yes
3548
.68
28.6
162
31.8
7832
.136
25.2
4839
1418
.746
10.2
Tot
al72
100
2810
050
910
024
310
014
310
012
310
075
100
452
100
Pan
elA
.2:
Wit
hin
tra-
firm
trad
e(L
MI)
No
1368
.414
66.7
334
74.2
163
77.6
107
66.9
6480
3979
.625
389
.4Y
es6
31.6
733
.311
625
.847
22.4
5333
.116
2010
20.4
3010
.6T
otal
1910
021
100
450
100
210
100
160
100
8010
049
100
283
100
Pan
elA
.3:
Wit
hin
tra-
firm
trad
e(S
SA
)N
o11
64.7
00
9168
.448
66.7
2571
.418
69.2
969
.212
986
.6Y
es6
35.3
00
4231
.624
33.3
1028
.68
30.8
430
.820
13.4
Tot
al17
100
00
133
100
7210
035
100
2610
013
100
149
100
Pan
elB
:W
ith
intr
a-firm
imp
orts
No
2449
211
.889
26.8
5334
.618
17.5
1823
.71
3.6
11
Yes
2551
1588
.224
373
.210
065
.485
82.5
5876
.327
96.4
9999
Tot
al49
100
1710
033
210
015
310
010
310
076
100
2810
010
010
0P
anel
B.1
:W
ith
intr
a-firm
imp
orts
(HI)
No
2057
.11
12.5
4427
.226
33.3
616
.712
250
01
2.2
Yes
1542
.97
87.5
118
72.8
5266
.730
83.3
3675
1410
045
97.8
Tot
al35
100
810
016
210
078
100
3610
048
100
1410
046
100
Pan
elB
.2:
Wit
hin
tra-
firm
imp
orts
(LM
I)N
o2
33.3
114
.329
2517
36.2
1018
.92
12.5
00
00
Yes
466
.76
85.7
8775
3063
.843
81.1
1487
.510
100
3010
0T
otal
610
07
100
116
100
4710
053
100
1610
010
100
3010
0P
anel
B.3
:W
ith
intr
a-firm
imp
orts
(SSA
)N
o1
16.7
00
1331
937
.51
103
37.5
125
00
Yes
583
.30
029
6915
62.5
990
562
.53
7520
100
Tot
al6
100
00
4210
024
100
1010
08
100
410
020
100
Pan
elC
:W
ith
intr
a-firm
exp
orts
No
1326
.58
47.1
174
52.4
7347
.754
52.4
4761
.826
92.9
9898
Yes
3673
.59
52.9
158
47.6
8052
.349
47.6
2938
.22
7.1
22
Tot
al49
100
1710
033
210
015
310
010
310
076
100
2810
010
010
0P
anel
C.1
:W
ith
intr
a-firm
exp
orts
(HI)
No
617
.12
2580
49.4
3342
.317
47.2
3062
.513
92.9
4597
.8Y
es29
82.9
675
8250
.645
57.7
1952
.818
37.5
17.
11
2.2
Tot
al35
100
810
016
210
078
100
3610
048
100
1410
046
100
Pan
elC
.2:
Wit
hin
tra-
firm
exp
orts
(LM
I)N
o2
33.3
571
.462
53.4
2757
.426
49.1
956
.310
100
2996
.7Y
es4
66.7
228
.654
46.6
2042
.627
50.9
743
.80
01
3.3
Tot
al6
100
710
011
610
047
100
5310
016
100
1010
030
100
Pan
elC
.3:
Wit
hin
tra-
firm
exp
orts
(SSA
)N
o4
66.7
00
2559
.512
508
805
62.5
375
2010
0Y
es2
33.3
00
1740
.512
502
203
37.5
125
00
Tot
al6
100
00
4210
024
100
1010
08
100
410
020
100
29
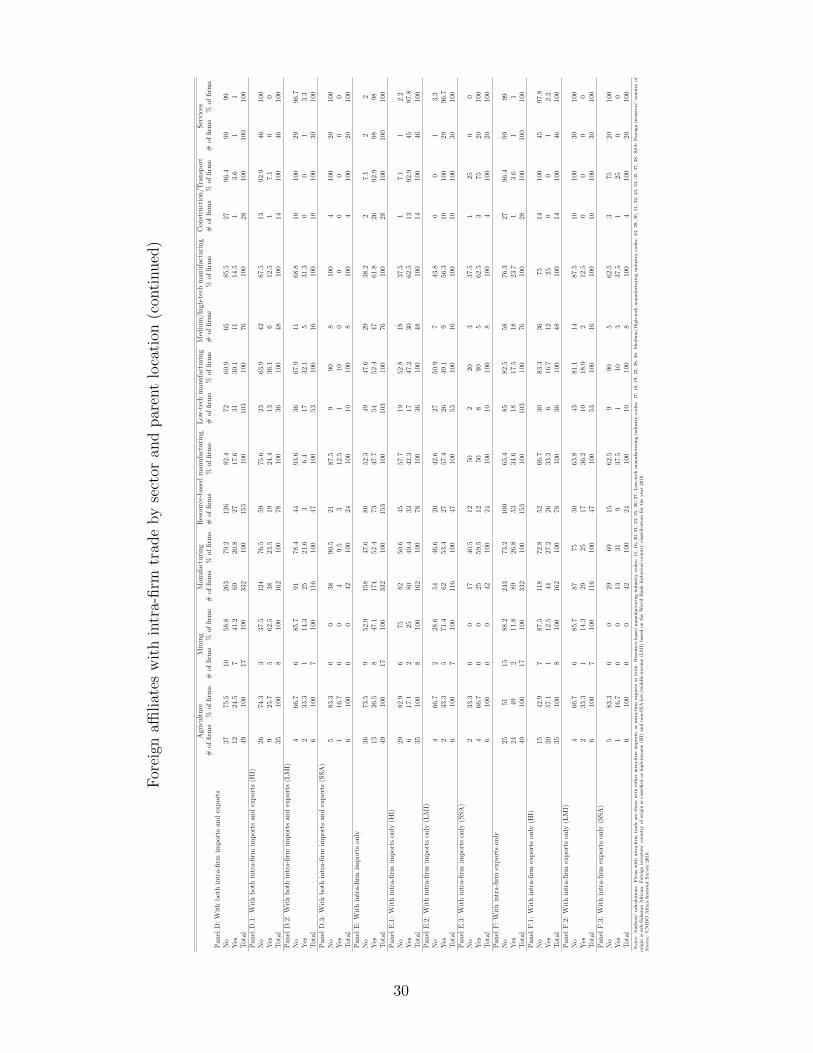
For
eign
affiliat
esw
ith
intr
a-firm
trad
eby
sect
oran
dpar
ent
loca
tion
(con
tinued
)
Agr
icult
ure
Min
ing
Man
ufa
cturi
ng
Res
ourc
e-bas
edm
anufa
cturi
ng
Low
-tec
hm
anufa
cturi
ng
Med
ium
/hig
h-t
ech
man
ufa
cturi
ng
Con
stru
ctio
n/T
ransp
ort
Ser
vic
es#
offirm
s%
offirm
s#
offirm
s%
offirm
s#
offirm
s%
offirm
s#
offirm
s%
offirm
s#
offirm
s%
offirm
s#
offirm
s%
offirm
s#
offirm
s%
offirm
s#
offirm
s%
offirm
sP
anel
D:
Wit
hb
oth
intr
a-firm
imp
orts
and
exp
orts
No
3775
.510
58.8
263
79.2
126
82.4
7269
.965
85.5
2796
.499
99Y
es12
24.5
741
.269
20.8
2717
.631
30.1
1114
.51
3.6
11
Tot
al49
100
1710
033
210
015
310
010
310
076
100
2810
010
010
0P
anel
D.1
:W
ith
bot
hin
tra-
firm
imp
orts
and
exp
orts
(HI)
No
2674
.33
37.5
124
76.5
5975
.623
63.9
4287
.513
92.9
4610
0Y
es9
25.7
562
.538
23.5
1924
.413
36.1
612
.51
7.1
00
Tot
al35
100
810
016
210
078
100
3610
048
100
1410
046
100
Pan
elD
.2:
Wit
hb
oth
intr
a-firm
imp
orts
and
exp
orts
(LM
I)N
o4
66.7
685
.791
78.4
4493
.636
67.9
1168
.810
100
2996
.7Y
es2
33.3
114
.325
21.6
36.
417
32.1
531
.30
01
3.3
Tot
al6
100
710
011
610
047
100
5310
016
100
1010
030
100
Pan
elD
.3:
Wit
hb
oth
intr
a-firm
imp
orts
and
exp
orts
(SSA
)N
o5
83.3
00
3890
.521
87.5
990
810
04
100
2010
0Y
es1
16.7
00
49.
53
12.5
110
00
00
00
Tot
al6
100
00
4210
024
100
1010
08
100
410
020
100
Pan
elE
:W
ith
intr
a-firm
imp
orts
only
No
3673
.59
52.9
158
47.6
8052
.349
47.6
2938
.22
7.1
22
Yes
1326
.58
47.1
174
52.4
7347
.754
52.4
4761
.826
92.9
9898
Tot
al49
100
1710
033
210
015
310
010
310
076
100
2810
010
010
0P
anel
E.1
:W
ith
intr
a-firm
imp
orts
only
(HI)
No
2982
.96
7582
50.6
4557
.719
52.8
1837
.51
7.1
12.
2Y
es6
17.1
225
8049
.433
42.3
1747
.230
62.5
1392
.945
97.8
Tot
al35
100
810
016
210
078
100
3610
048
100
1410
046
100
Pan
elE
.2:
Wit
hin
tra-
firm
imp
orts
only
(LM
I)N
o4
66.7
228
.654
46.6
2042
.627
50.9
743
.80
01
3.3
Yes
233
.35
71.4
6253
.427
57.4
2649
.19
56.3
1010
029
96.7
Tot
al6
100
710
011
610
047
100
5310
016
100
1010
030
100
Pan
elE
.3:
Wit
hin
tra-
firm
imp
orts
only
(SSA
)N
o2
33.3
00
1740
.512
502
203
37.5
125
00
Yes
466
.70
025
59.5
1250
880
562
.53
7520
100
Tot
al6
100
00
4210
024
100
1010
08
100
410
020
100
Pan
elF
:W
ith
intr
a-firm
exp
orts
only
No
2551
1588
.224
373
.210
065
.485
82.5
5876
.327
96.4
9999
Yes
2449
211
.889
26.8
5334
.618
17.5
1823
.71
3.6
11
Tot
al49
100
1710
033
210
015
310
010
310
076
100
2810
010
010
0P
anel
F.1
:W
ith
intr
a-firm
exp
orts
only
(HI)
No
1542
.97
87.5
118
72.8
5266
.730
83.3
3675
1410
045
97.8
Yes
2057
.11
12.5
4427
.226
33.3
616
.712
250
01
2.2
Tot
al35
100
810
016
210
078
100
3610
048
100
1410
046
100
Pan
elF
.2:
Wit
hin
tra-
firm
exp
orts
only
(LM
I)N
o4
66.7
685
.787
7530
63.8
4381
.114
87.5
1010
030
100
Yes
233
.31
14.3
2925
1736
.210
18.9
212
.50
00
0T
otal
610
07
100
116
100
4710
053
100
1610
010
100
3010
0P
anel
F.3
:W
ith
intr
a-firm
exp
orts
only
(SSA
)N
o5
83.3
00
2969
1562
.59
905
62.5
375
2010
0Y
es1
16.7
00
1331
937
.51
103
37.5
125
00
Tot
al6
100
00
4210
024
100
1010
08
100
410
020
100
Notes:
Au
thors
’ca
lcu
lati
on
s.F
irm
sw
ith
intr
a-fi
rmtr
ad
eare
those
wit
hei
ther
intr
a-fi
rmim
port
s,or
intr
a-fi
rmex
port
sor
both
.R
esou
rce-
base
dm
anu
fact
uri
ng
ind
ust
ryco
des
:15,
16,
20,
21,
23,
25,
26,
27.
Low
-tec
hm
anu
fact
uri
ng
ind
ust
ryco
des
:17,
18,
19,
22,
28,
36.
Med
ium
/H
igh
-tec
hm
anu
fact
uri
ng
ind
ust
ryco
des
:24,
29,
30,
31,
32,
33,
34,
35,
37,
38.
SS
A:
Fore
ign
inves
tors
’co
untr
yof
ori
gin
issu
b-S
ah
ara
nA
fric
an
.F
ore
ign
inves
tors
’co
untr
yof
ori
gin
iscl
ass
ified
as
hig
h-i
nco
me
(HI)
an
dn
on
-SS
Alo
w/m
idd
le-i
nco
me
(LM
I)b
ase
don
the
Worl
dB
an
kh
isto
rica
lco
untr
ycl
ass
ifica
tion
for
the
yea
r2010.
Source:
UN
IDO
Afr
ica
Inves
tor
Su
rvey
2010.
30
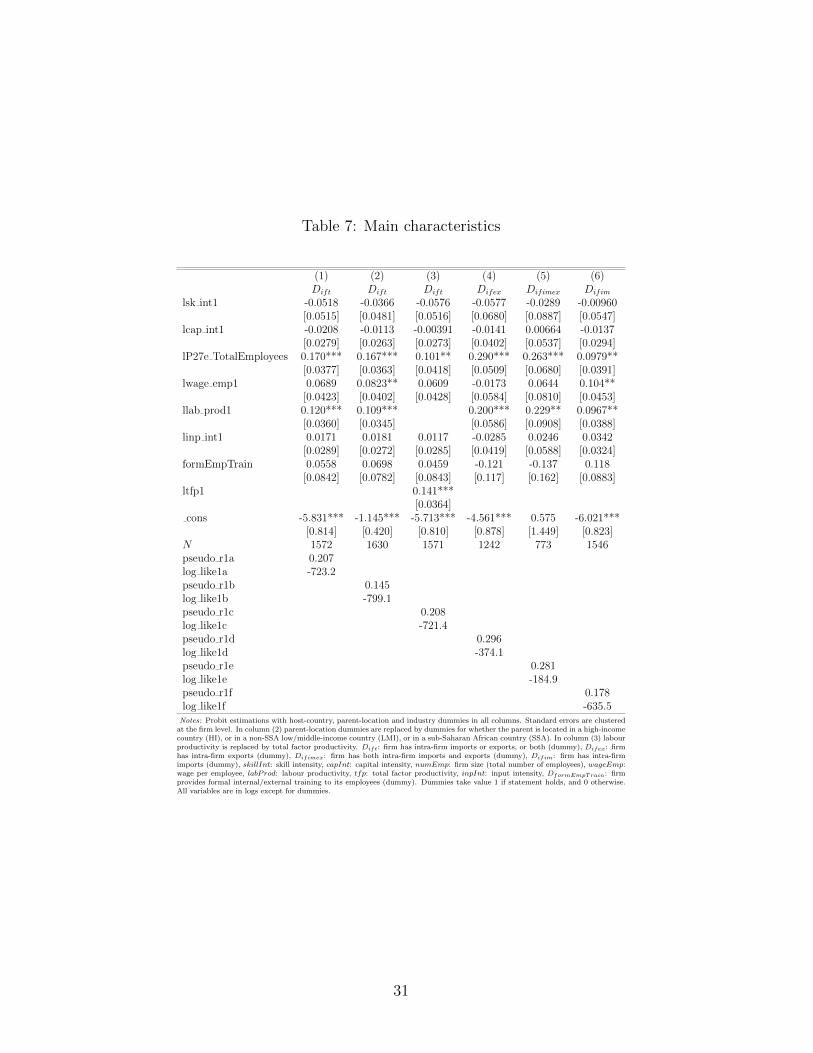
Table 7: Main characteristics
(1) (2) (3) (4) (5) (6)Dift Dift Dift Difex Difimex Difim
lsk int1 -0.0518 -0.0366 -0.0576 -0.0577 -0.0289 -0.00960[0.0515] [0.0481] [0.0516] [0.0680] [0.0887] [0.0547]
lcap int1 -0.0208 -0.0113 -0.00391 -0.0141 0.00664 -0.0137[0.0279] [0.0263] [0.0273] [0.0402] [0.0537] [0.0294]
lP27e TotalEmployees 0.170*** 0.167*** 0.101** 0.290*** 0.263*** 0.0979**[0.0377] [0.0363] [0.0418] [0.0509] [0.0680] [0.0391]
lwage emp1 0.0689 0.0823** 0.0609 -0.0173 0.0644 0.104**[0.0423] [0.0402] [0.0428] [0.0584] [0.0810] [0.0453]
llab prod1 0.120*** 0.109*** 0.200*** 0.229** 0.0967**[0.0360] [0.0345] [0.0586] [0.0908] [0.0388]
linp int1 0.0171 0.0181 0.0117 -0.0285 0.0246 0.0342[0.0289] [0.0272] [0.0285] [0.0419] [0.0588] [0.0324]
formEmpTrain 0.0558 0.0698 0.0459 -0.121 -0.137 0.118[0.0842] [0.0782] [0.0843] [0.117] [0.162] [0.0883]
ltfp1 0.141***[0.0364]
cons -5.831*** -1.145*** -5.713*** -4.561*** 0.575 -6.021***[0.814] [0.420] [0.810] [0.878] [1.449] [0.823]
N 1572 1630 1571 1242 773 1546pseudo r1a 0.207log like1a -723.2pseudo r1b 0.145log like1b -799.1pseudo r1c 0.208log like1c -721.4pseudo r1d 0.296log like1d -374.1pseudo r1e 0.281log like1e -184.9pseudo r1f 0.178log like1f -635.5Notes: Probit estimations with host-country, parent-location and industry dummies in all columns. Standard errors are clustered
at the firm level. In column (2) parent-location dummies are replaced by dummies for whether the parent is located in a high-incomecountry (HI), or in a non-SSA low/middle-income country (LMI), or in a sub-Saharan African country (SSA). In column (3) labourproductivity is replaced by total factor productivity. Dift: firm has intra-firm imports or exports, or both (dummy), Difex: firmhas intra-firm exports (dummy), Difimex: firm has both intra-firm imports and exports (dummy), Difim: firm has intra-firmimports (dummy), skillInt: skill intensity, capInt: capital intensity, numEmp: firm size (total number of employees), wageEmp:wage per employee, labProd: labour productivity, tfp: total factor productivity, inpInt: input intensity, DformEmpTrain: firmprovides formal internal/external training to its employees (dummy). Dummies take value 1 if statement holds, and 0 otherwise.All variables are in logs except for dummies.
31
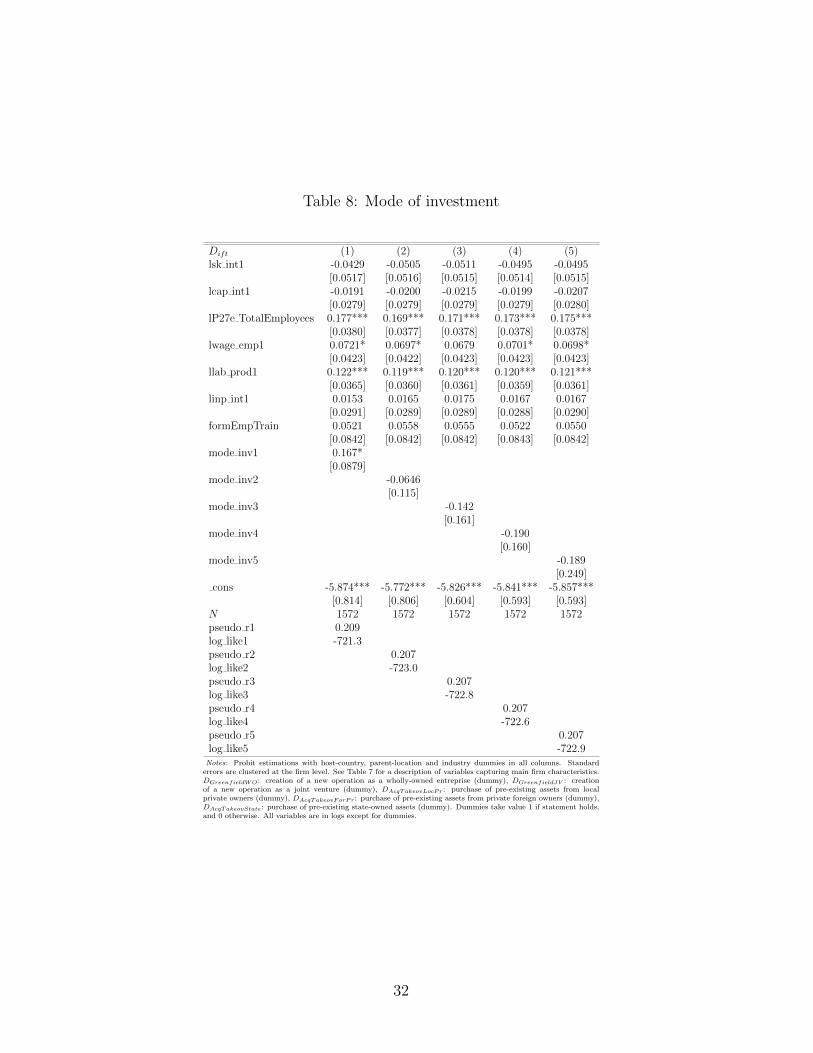
Table 8: Mode of investment
Dift (1) (2) (3) (4) (5)lsk int1 -0.0429 -0.0505 -0.0511 -0.0495 -0.0495
[0.0517] [0.0516] [0.0515] [0.0514] [0.0515]lcap int1 -0.0191 -0.0200 -0.0215 -0.0199 -0.0207
[0.0279] [0.0279] [0.0279] [0.0279] [0.0280]lP27e TotalEmployees 0.177*** 0.169*** 0.171*** 0.173*** 0.175***
[0.0380] [0.0377] [0.0378] [0.0378] [0.0378]lwage emp1 0.0721* 0.0697* 0.0679 0.0701* 0.0698*
[0.0423] [0.0422] [0.0423] [0.0423] [0.0423]llab prod1 0.122*** 0.119*** 0.120*** 0.120*** 0.121***
[0.0365] [0.0360] [0.0361] [0.0359] [0.0361]linp int1 0.0153 0.0165 0.0175 0.0167 0.0167
[0.0291] [0.0289] [0.0289] [0.0288] [0.0290]formEmpTrain 0.0521 0.0558 0.0555 0.0522 0.0550
[0.0842] [0.0842] [0.0842] [0.0843] [0.0842]mode inv1 0.167*
[0.0879]mode inv2 -0.0646
[0.115]mode inv3 -0.142
[0.161]mode inv4 -0.190
[0.160]mode inv5 -0.189
[0.249]cons -5.874*** -5.772*** -5.826*** -5.841*** -5.857***
[0.814] [0.806] [0.604] [0.593] [0.593]N 1572 1572 1572 1572 1572pseudo r1 0.209log like1 -721.3pseudo r2 0.207log like2 -723.0pseudo r3 0.207log like3 -722.8pseudo r4 0.207log like4 -722.6pseudo r5 0.207log like5 -722.9Notes: Probit estimations with host-country, parent-location and industry dummies in all columns. Standard
errors are clustered at the firm level. See Table 7 for a description of variables capturing main firm characteristics.DGreenfieldWO: creation of a new operation as a wholly-owned entreprise (dummy), DGreenfieldJV : creationof a new operation as a joint venture (dummy), DAcqTakeovLocPr: purchase of pre-existing assets from localprivate owners (dummy), DAcqTakeovForPr: purchase of pre-existing assets from private foreign owners (dummy),DAcqTakeovState: purchase of pre-existing state-owned assets (dummy). Dummies take value 1 if statement holds,and 0 otherwise. All variables are in logs except for dummies.
32
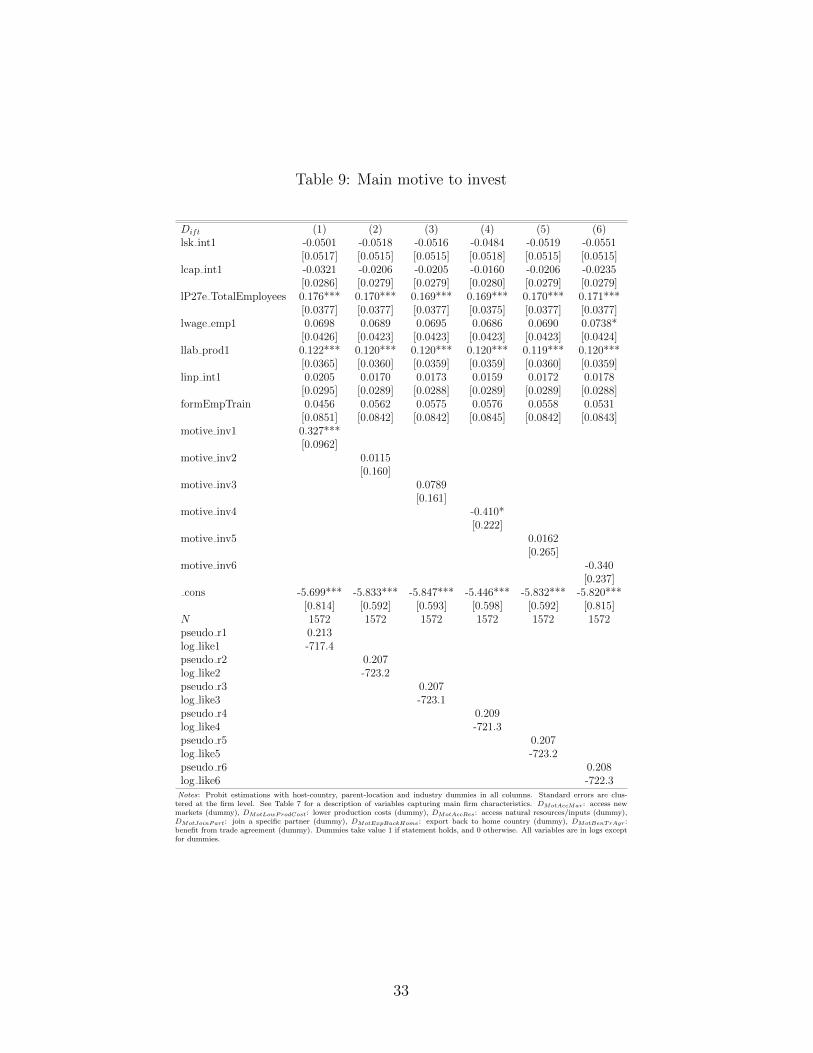
Table 9: Main motive to invest
Dift (1) (2) (3) (4) (5) (6)lsk int1 -0.0501 -0.0518 -0.0516 -0.0484 -0.0519 -0.0551
[0.0517] [0.0515] [0.0515] [0.0518] [0.0515] [0.0515]lcap int1 -0.0321 -0.0206 -0.0205 -0.0160 -0.0206 -0.0235
[0.0286] [0.0279] [0.0279] [0.0280] [0.0279] [0.0279]lP27e TotalEmployees 0.176*** 0.170*** 0.169*** 0.169*** 0.170*** 0.171***
[0.0377] [0.0377] [0.0377] [0.0375] [0.0377] [0.0377]lwage emp1 0.0698 0.0689 0.0695 0.0686 0.0690 0.0738*
[0.0426] [0.0423] [0.0423] [0.0423] [0.0423] [0.0424]llab prod1 0.122*** 0.120*** 0.120*** 0.120*** 0.119*** 0.120***
[0.0365] [0.0360] [0.0359] [0.0359] [0.0360] [0.0359]linp int1 0.0205 0.0170 0.0173 0.0159 0.0172 0.0178
[0.0295] [0.0289] [0.0288] [0.0289] [0.0289] [0.0288]formEmpTrain 0.0456 0.0562 0.0575 0.0576 0.0558 0.0531
[0.0851] [0.0842] [0.0842] [0.0845] [0.0842] [0.0843]motive inv1 0.327***
[0.0962]motive inv2 0.0115
[0.160]motive inv3 0.0789
[0.161]motive inv4 -0.410*
[0.222]motive inv5 0.0162
[0.265]motive inv6 -0.340
[0.237]cons -5.699*** -5.833*** -5.847*** -5.446*** -5.832*** -5.820***
[0.814] [0.592] [0.593] [0.598] [0.592] [0.815]N 1572 1572 1572 1572 1572 1572pseudo r1 0.213log like1 -717.4pseudo r2 0.207log like2 -723.2pseudo r3 0.207log like3 -723.1pseudo r4 0.209log like4 -721.3pseudo r5 0.207log like5 -723.2pseudo r6 0.208log like6 -722.3Notes: Probit estimations with host-country, parent-location and industry dummies in all columns. Standard errors are clus-
tered at the firm level. See Table 7 for a description of variables capturing main firm characteristics. DMotAccMar: access newmarkets (dummy), DMotLowProdCost: lower production costs (dummy), DMotAccRes: access natural resources/inputs (dummy),DMotJoinPart: join a specific partner (dummy), DMotExpBackHome: export back to home country (dummy), DMotBenTrAgr:benefit from trade agreement (dummy). Dummies take value 1 if statement holds, and 0 otherwise. All variables are in logs exceptfor dummies.
33
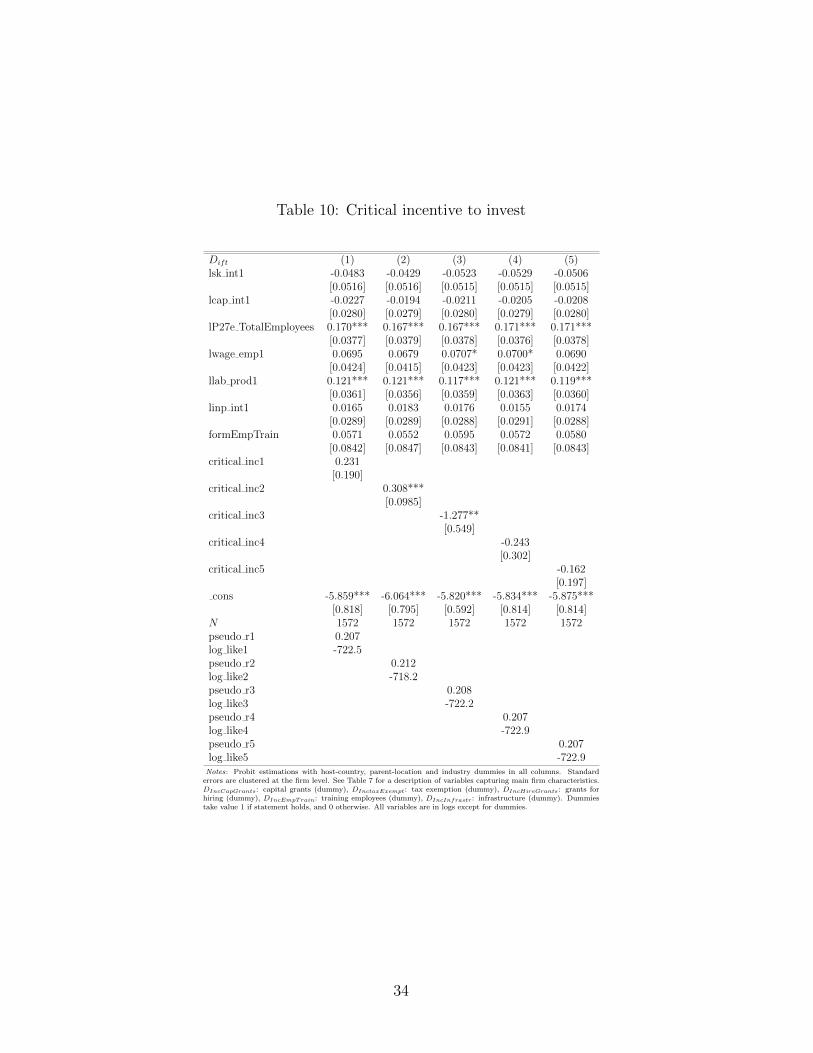
Table 10: Critical incentive to invest
Dift (1) (2) (3) (4) (5)lsk int1 -0.0483 -0.0429 -0.0523 -0.0529 -0.0506
[0.0516] [0.0516] [0.0515] [0.0515] [0.0515]lcap int1 -0.0227 -0.0194 -0.0211 -0.0205 -0.0208
[0.0280] [0.0279] [0.0280] [0.0279] [0.0280]lP27e TotalEmployees 0.170*** 0.167*** 0.167*** 0.171*** 0.171***
[0.0377] [0.0379] [0.0378] [0.0376] [0.0378]lwage emp1 0.0695 0.0679 0.0707* 0.0700* 0.0690
[0.0424] [0.0415] [0.0423] [0.0423] [0.0422]llab prod1 0.121*** 0.121*** 0.117*** 0.121*** 0.119***
[0.0361] [0.0356] [0.0359] [0.0363] [0.0360]linp int1 0.0165 0.0183 0.0176 0.0155 0.0174
[0.0289] [0.0289] [0.0288] [0.0291] [0.0288]formEmpTrain 0.0571 0.0552 0.0595 0.0572 0.0580
[0.0842] [0.0847] [0.0843] [0.0841] [0.0843]critical inc1 0.231
[0.190]critical inc2 0.308***
[0.0985]critical inc3 -1.277**
[0.549]critical inc4 -0.243
[0.302]critical inc5 -0.162
[0.197]cons -5.859*** -6.064*** -5.820*** -5.834*** -5.875***
[0.818] [0.795] [0.592] [0.814] [0.814]N 1572 1572 1572 1572 1572pseudo r1 0.207log like1 -722.5pseudo r2 0.212log like2 -718.2pseudo r3 0.208log like3 -722.2pseudo r4 0.207log like4 -722.9pseudo r5 0.207log like5 -722.9Notes: Probit estimations with host-country, parent-location and industry dummies in all columns. Standard
errors are clustered at the firm level. See Table 7 for a description of variables capturing main firm characteristics.DIncCapGrants: capital grants (dummy), DInctaxExempt: tax exemption (dummy), DIncHireGrants: grants forhiring (dummy), DIncEmpTrain: training employees (dummy), DIncInfrastr: infrastructure (dummy). Dummiestake value 1 if statement holds, and 0 otherwise. All variables are in logs except for dummies.
34
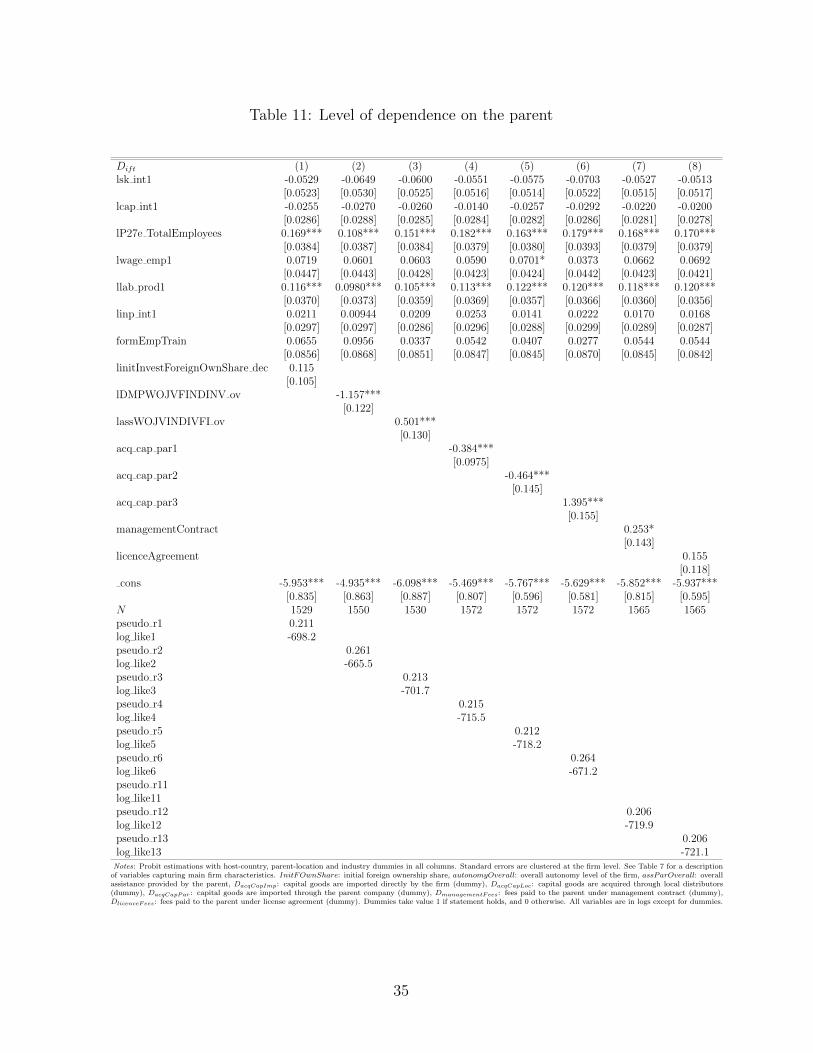
Table 11: Level of dependence on the parent
Dift (1) (2) (3) (4) (5) (6) (7) (8)lsk int1 -0.0529 -0.0649 -0.0600 -0.0551 -0.0575 -0.0703 -0.0527 -0.0513
[0.0523] [0.0530] [0.0525] [0.0516] [0.0514] [0.0522] [0.0515] [0.0517]lcap int1 -0.0255 -0.0270 -0.0260 -0.0140 -0.0257 -0.0292 -0.0220 -0.0200
[0.0286] [0.0288] [0.0285] [0.0284] [0.0282] [0.0286] [0.0281] [0.0278]lP27e TotalEmployees 0.169*** 0.108*** 0.151*** 0.182*** 0.163*** 0.179*** 0.168*** 0.170***
[0.0384] [0.0387] [0.0384] [0.0379] [0.0380] [0.0393] [0.0379] [0.0379]lwage emp1 0.0719 0.0601 0.0603 0.0590 0.0701* 0.0373 0.0662 0.0692
[0.0447] [0.0443] [0.0428] [0.0423] [0.0424] [0.0442] [0.0423] [0.0421]llab prod1 0.116*** 0.0980*** 0.105*** 0.113*** 0.122*** 0.120*** 0.118*** 0.120***
[0.0370] [0.0373] [0.0359] [0.0369] [0.0357] [0.0366] [0.0360] [0.0356]linp int1 0.0211 0.00944 0.0209 0.0253 0.0141 0.0222 0.0170 0.0168
[0.0297] [0.0297] [0.0286] [0.0296] [0.0288] [0.0299] [0.0289] [0.0287]formEmpTrain 0.0655 0.0956 0.0337 0.0542 0.0407 0.0277 0.0544 0.0544
[0.0856] [0.0868] [0.0851] [0.0847] [0.0845] [0.0870] [0.0845] [0.0842]linitInvestForeignOwnShare dec 0.115
[0.105]lDMPWOJVFINDINV ov -1.157***
[0.122]lassWOJVINDIVFI ov 0.501***
[0.130]acq cap par1 -0.384***
[0.0975]acq cap par2 -0.464***
[0.145]acq cap par3 1.395***
[0.155]managementContract 0.253*
[0.143]licenceAgreement 0.155
[0.118]cons -5.953*** -4.935*** -6.098*** -5.469*** -5.767*** -5.629*** -5.852*** -5.937***
[0.835] [0.863] [0.887] [0.807] [0.596] [0.581] [0.815] [0.595]N 1529 1550 1530 1572 1572 1572 1565 1565pseudo r1 0.211log like1 -698.2pseudo r2 0.261log like2 -665.5pseudo r3 0.213log like3 -701.7pseudo r4 0.215log like4 -715.5pseudo r5 0.212log like5 -718.2pseudo r6 0.264log like6 -671.2pseudo r11log like11pseudo r12 0.206log like12 -719.9pseudo r13 0.206log like13 -721.1Notes: Probit estimations with host-country, parent-location and industry dummies in all columns. Standard errors are clustered at the firm level. See Table 7 for a description
of variables capturing main firm characteristics. InitFOwnShare: initial foreign ownership share, autonomyOverall: overall autonomy level of the firm, assParOverall: overallassistance provided by the parent, DacqCapImp: capital goods are imported directly by the firm (dummy), DacqCapLoc: capital goods are acquired through local distributors(dummy), DacqCapPar: capital goods are imported through the parent company (dummy), DmanagementFees: fees paid to the parent under management contract (dummy),DlicenceFees: fees paid to the parent under license agreement (dummy). Dummies take value 1 if statement holds, and 0 otherwise. All variables are in logs except for dummies.
35
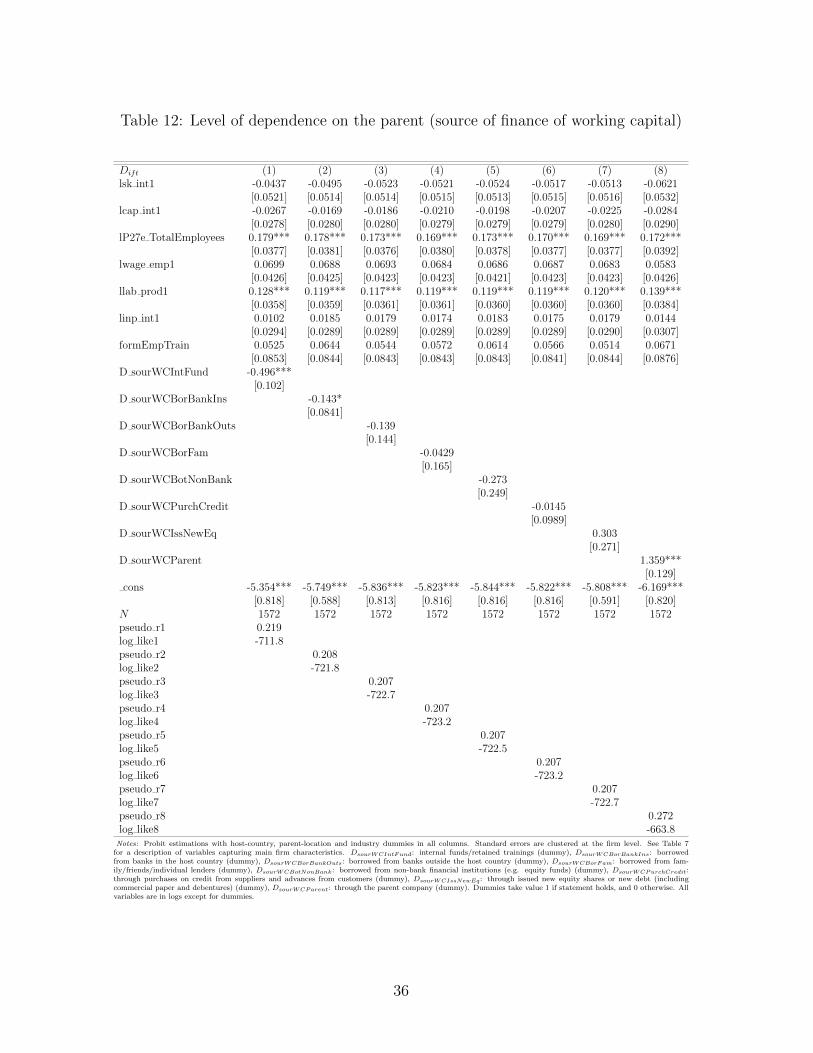
Table 12: Level of dependence on the parent (source of finance of working capital)
Dift (1) (2) (3) (4) (5) (6) (7) (8)lsk int1 -0.0437 -0.0495 -0.0523 -0.0521 -0.0524 -0.0517 -0.0513 -0.0621
[0.0521] [0.0514] [0.0514] [0.0515] [0.0513] [0.0515] [0.0516] [0.0532]lcap int1 -0.0267 -0.0169 -0.0186 -0.0210 -0.0198 -0.0207 -0.0225 -0.0284
[0.0278] [0.0280] [0.0280] [0.0279] [0.0279] [0.0279] [0.0280] [0.0290]lP27e TotalEmployees 0.179*** 0.178*** 0.173*** 0.169*** 0.173*** 0.170*** 0.169*** 0.172***
[0.0377] [0.0381] [0.0376] [0.0380] [0.0378] [0.0377] [0.0377] [0.0392]lwage emp1 0.0699 0.0688 0.0693 0.0684 0.0686 0.0687 0.0683 0.0583
[0.0426] [0.0425] [0.0423] [0.0423] [0.0421] [0.0423] [0.0423] [0.0426]llab prod1 0.128*** 0.119*** 0.117*** 0.119*** 0.119*** 0.119*** 0.120*** 0.139***
[0.0358] [0.0359] [0.0361] [0.0361] [0.0360] [0.0360] [0.0360] [0.0384]linp int1 0.0102 0.0185 0.0179 0.0174 0.0183 0.0175 0.0179 0.0144
[0.0294] [0.0289] [0.0289] [0.0289] [0.0289] [0.0289] [0.0290] [0.0307]formEmpTrain 0.0525 0.0644 0.0544 0.0572 0.0614 0.0566 0.0514 0.0671
[0.0853] [0.0844] [0.0843] [0.0843] [0.0843] [0.0841] [0.0844] [0.0876]D sourWCIntFund -0.496***
[0.102]D sourWCBorBankIns -0.143*
[0.0841]D sourWCBorBankOuts -0.139
[0.144]D sourWCBorFam -0.0429
[0.165]D sourWCBotNonBank -0.273
[0.249]D sourWCPurchCredit -0.0145
[0.0989]D sourWCIssNewEq 0.303
[0.271]D sourWCParent 1.359***
[0.129]cons -5.354*** -5.749*** -5.836*** -5.823*** -5.844*** -5.822*** -5.808*** -6.169***
[0.818] [0.588] [0.813] [0.816] [0.816] [0.816] [0.591] [0.820]N 1572 1572 1572 1572 1572 1572 1572 1572pseudo r1 0.219log like1 -711.8pseudo r2 0.208log like2 -721.8pseudo r3 0.207log like3 -722.7pseudo r4 0.207log like4 -723.2pseudo r5 0.207log like5 -722.5pseudo r6 0.207log like6 -723.2pseudo r7 0.207log like7 -722.7pseudo r8 0.272log like8 -663.8Notes: Probit estimations with host-country, parent-location and industry dummies in all columns. Standard errors are clustered at the firm level. See Table 7
for a description of variables capturing main firm characteristics. DsourWCIntFund: internal funds/retained trainings (dummy), DsourWCBorBankIns: borrowedfrom banks in the host country (dummy), DsourWCBorBankOuts: borrowed from banks outside the host country (dummy), DsourWCBorFam: borrowed from fam-ily/friends/individual lenders (dummy), DsourWCBotNonBank: borrowed from non-bank financial institutions (e.g. equity funds) (dummy), DsourWCPurchCredit:through purchases on credit from suppliers and advances from customers (dummy), DsourWCIssNewEq : through issued new equity shares or new debt (includingcommercial paper and debentures) (dummy), DsourWCParent: through the parent company (dummy). Dummies take value 1 if statement holds, and 0 otherwise. Allvariables are in logs except for dummies.
36
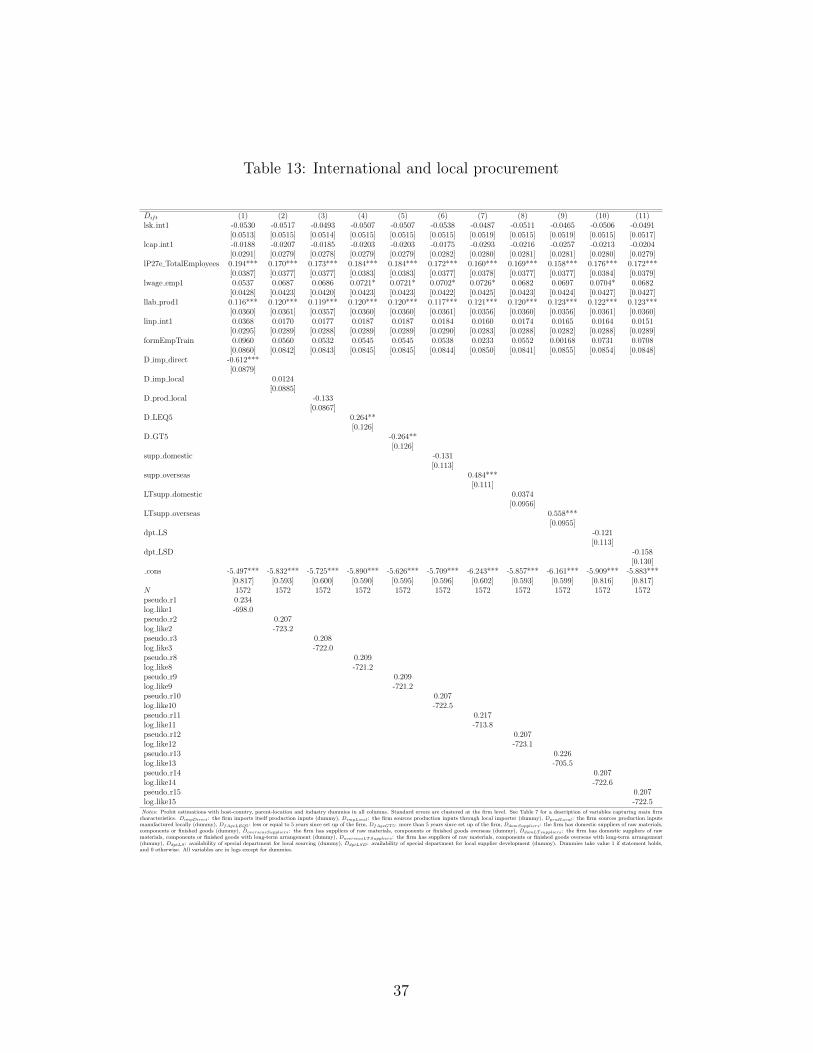
Table 13: International and local procurement
Dift (1) (2) (3) (4) (5) (6) (7) (8) (9) (10) (11)lsk int1 -0.0530 -0.0517 -0.0493 -0.0507 -0.0507 -0.0538 -0.0487 -0.0511 -0.0465 -0.0506 -0.0491
[0.0513] [0.0515] [0.0514] [0.0515] [0.0515] [0.0515] [0.0519] [0.0515] [0.0519] [0.0515] [0.0517]lcap int1 -0.0188 -0.0207 -0.0185 -0.0203 -0.0203 -0.0175 -0.0293 -0.0216 -0.0257 -0.0213 -0.0204
[0.0291] [0.0279] [0.0278] [0.0279] [0.0279] [0.0282] [0.0280] [0.0281] [0.0281] [0.0280] [0.0279]lP27e TotalEmployees 0.194*** 0.170*** 0.173*** 0.184*** 0.184*** 0.172*** 0.160*** 0.169*** 0.158*** 0.176*** 0.172***
[0.0387] [0.0377] [0.0377] [0.0383] [0.0383] [0.0377] [0.0378] [0.0377] [0.0377] [0.0384] [0.0379]lwage emp1 0.0537 0.0687 0.0686 0.0721* 0.0721* 0.0702* 0.0726* 0.0682 0.0697 0.0704* 0.0682
[0.0428] [0.0423] [0.0420] [0.0423] [0.0423] [0.0422] [0.0425] [0.0423] [0.0424] [0.0427] [0.0427]llab prod1 0.116*** 0.120*** 0.119*** 0.120*** 0.120*** 0.117*** 0.121*** 0.120*** 0.123*** 0.122*** 0.123***
[0.0360] [0.0361] [0.0357] [0.0360] [0.0360] [0.0361] [0.0356] [0.0360] [0.0356] [0.0361] [0.0360]linp int1 0.0368 0.0170 0.0177 0.0187 0.0187 0.0184 0.0160 0.0174 0.0165 0.0164 0.0151
[0.0295] [0.0289] [0.0288] [0.0289] [0.0289] [0.0290] [0.0283] [0.0288] [0.0282] [0.0288] [0.0289]formEmpTrain 0.0960 0.0560 0.0532 0.0545 0.0545 0.0538 0.0233 0.0552 0.00168 0.0731 0.0708
[0.0860] [0.0842] [0.0843] [0.0845] [0.0845] [0.0844] [0.0850] [0.0841] [0.0855] [0.0854] [0.0848]D imp direct -0.612***
[0.0879]D imp local 0.0124
[0.0885]D prod local -0.133
[0.0867]D LEQ5 0.264**
[0.126]D GT5 -0.264**
[0.126]supp domestic -0.131
[0.113]supp overseas 0.484***
[0.111]LTsupp domestic 0.0374
[0.0956]LTsupp overseas 0.558***
[0.0955]dpt LS -0.121
[0.113]dpt LSD -0.158
[0.130]cons -5.497*** -5.832*** -5.725*** -5.890*** -5.626*** -5.709*** -6.243*** -5.857*** -6.161*** -5.909*** -5.883***
[0.817] [0.593] [0.600] [0.590] [0.595] [0.596] [0.602] [0.593] [0.599] [0.816] [0.817]N 1572 1572 1572 1572 1572 1572 1572 1572 1572 1572 1572pseudo r1 0.234log like1 -698.0pseudo r2 0.207log like2 -723.2pseudo r3 0.208log like3 -722.0pseudo r8 0.209log like8 -721.2pseudo r9 0.209log like9 -721.2pseudo r10 0.207log like10 -722.5pseudo r11 0.217log like11 -713.8pseudo r12 0.207log like12 -723.1pseudo r13 0.226log like13 -705.5pseudo r14 0.207log like14 -722.6pseudo r15 0.207log like15 -722.5Notes: Probit estimations with host-country, parent-location and industry dummies in all columns. Standard errors are clustered at the firm level. See Table 7 for a description of variables capturing main firm
characteristics. DimpDirect: the firm imports itself production inputs (dummy), DimpLocal: the firm sources production inputs through local importer (dummy), DprodLocal: the firm sources production inputsmanufactured locally (dummy), DfAgeLEQ5: less or equal to 5 years since set up of the firm, DfAgeGT5: more than 5 years since set up of the firm, DdomSuppliers: the firm has domestic suppliers of raw materials,components or finished goods (dummy), DoverseasSuppliers: the firm has suppliers of raw materials, components or finished goods overseas (dummy), DdomLTsuppliers: the firm has domestic suppliers of rawmaterials, components or finished goods with long-term arrangement (dummy), DoverseasLTSuppliers: the firm has suppliers of raw materials, components or finished goods overseas with long-term arrangement(dummy), DdptLS : availability of special department for local sourcing (dummy), DdptLSD: availability of special department for local supplier development (dummy). Dummies take value 1 if statement holds,and 0 otherwise. All variables are in logs except for dummies.
37

Table 14: Most important factor in favour of local procurement
Dift (1) (2) (3) (4) (5) (6) (7) (8) (9)lsk int1 -0.0516 -0.0538 -0.0542 -0.0518 -0.0507 -0.0511 -0.0481 -0.0541 -0.0553
[0.0515] [0.0515] [0.0515] [0.0515] [0.0515] [0.0515] [0.0516] [0.0515] [0.0518]lcap int1 -0.0205 -0.0184 -0.0197 -0.0207 -0.0217 -0.0210 -0.0262 -0.0192 -0.0213
[0.0279] [0.0281] [0.0280] [0.0280] [0.0280] [0.0279] [0.0280] [0.0280] [0.0279]lP27e TotalEmployees 0.170*** 0.170*** 0.166*** 0.170*** 0.169*** 0.169*** 0.173*** 0.168*** 0.169***
[0.0377] [0.0377] [0.0377] [0.0377] [0.0378] [0.0377] [0.0377] [0.0377] [0.0377]lwage emp1 0.0693 0.0671 0.0692 0.0688 0.0684 0.0684 0.0649 0.0664 0.0703*
[0.0422] [0.0423] [0.0424] [0.0423] [0.0422] [0.0423] [0.0423] [0.0422] [0.0422]llab prod1 0.119*** 0.118*** 0.120*** 0.120*** 0.120*** 0.118*** 0.120*** 0.119*** 0.119***
[0.0360] [0.0359] [0.0362] [0.0360] [0.0360] [0.0361] [0.0358] [0.0357] [0.0360]linp int1 0.0171 0.0178 0.0166 0.0171 0.0180 0.0172 0.0201 0.0173 0.0184
[0.0289] [0.0289] [0.0290] [0.0289] [0.0289] [0.0289] [0.0291] [0.0288] [0.0290]formEmpTrain 0.0560 0.0493 0.0560 0.0562 0.0458 0.0581 0.0487 0.0548 0.0556
[0.0842] [0.0841] [0.0842] [0.0842] [0.0849] [0.0843] [0.0844] [0.0842] [0.0841]locProc1 0.0388
[0.159]locProc2 -0.159
[0.161]locProc3 0.186
[0.120]locProc4 -0.0175
[0.106]locProc5 -0.254
[0.163]locProc6 -0.293
[0.330]locProc7 0.493**
[0.230]locProc8 0.302
[0.308]locProc9 -0.117
[0.174]cons -5.818*** -5.844*** -5.832*** -5.829*** -5.547*** -5.831*** -5.859*** -5.820*** -5.804***
[0.814] [0.589] [0.592] [0.815] [0.593] [0.592] [0.817] [0.815] [0.594]N 1572 1572 1572 1572 1572 1572 1572 1572 1572pseudo r1 0.207log like1 -723.2pseudo r2 0.207log like2 -722.7pseudo r3 0.208log like3 -722.1pseudo r4 0.207log like4 -723.2pseudo r5 0.208log like5 -722.0pseudo r6 0.207log like6 -722.9pseudo r7 0.209log like7 -721.1pseudo r8 0.207log like8 -722.8pseudo r9 0.207log like9 -723.0Notes: Probit estimations with host-country, parent-location and industry dummies in all columns. Standard errors are clustered at the firm level. See Table 7 for a description of
variables capturing main firm characteristics. DlocProcCustPref : local content is mandated or strongly encouraged by the ultimate customer (dummy), DlocProcProdCust: improvedlocal market acceptability or local customisation of the product (dummy), DlocProcLogistics: easier logistics or reduced inventory (dummy), DlocProcRawMat: access to localraw materials sources (dummy), DlocProcSuppRel: closer supplier relationship (dummy), DlocProcEnvResp: environmental responsibility (dummy), DlocProcCorpCom: corporatecommitment to local supplier development in the region (dummy), DlocProcSuppChain: fiscal or tax efficient supply chain reasons (dummy), DlocProcRedTar: reduced tariff costs(dummy). Dummies take value 1 if statement holds, and 0 otherwise. All variables are in logs except for dummies.
38
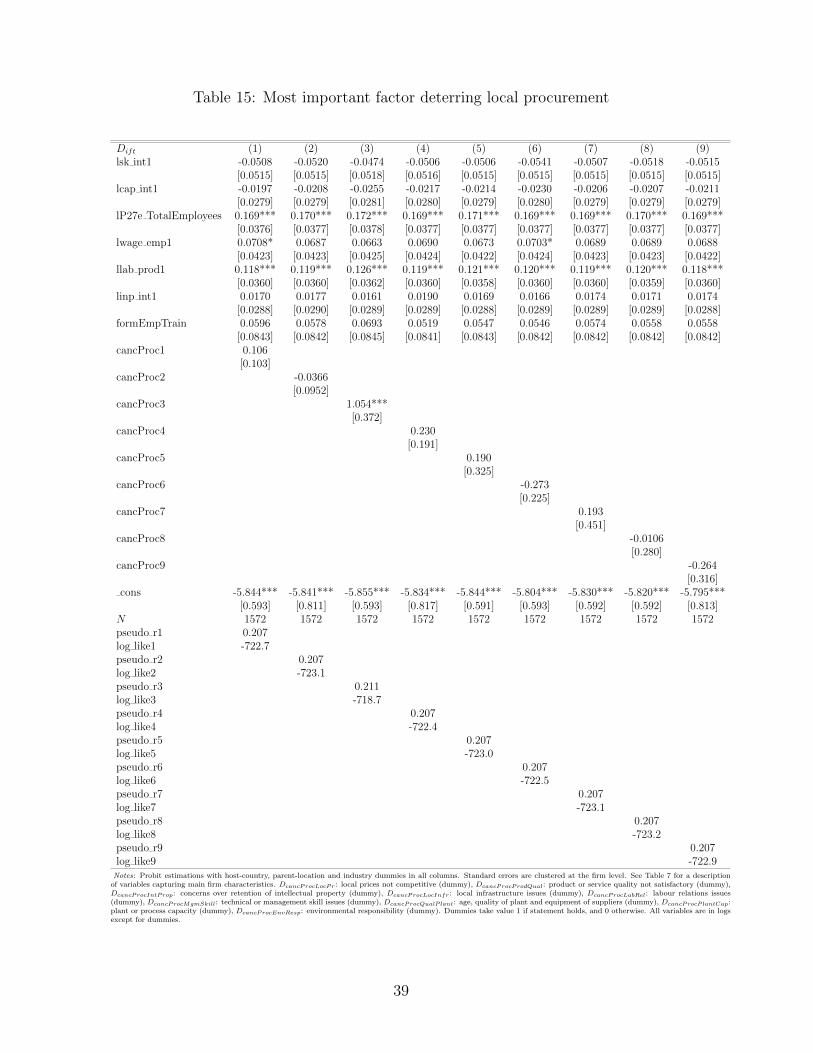
Table 15: Most important factor deterring local procurement
Dift (1) (2) (3) (4) (5) (6) (7) (8) (9)lsk int1 -0.0508 -0.0520 -0.0474 -0.0506 -0.0506 -0.0541 -0.0507 -0.0518 -0.0515
[0.0515] [0.0515] [0.0518] [0.0516] [0.0515] [0.0515] [0.0515] [0.0515] [0.0515]lcap int1 -0.0197 -0.0208 -0.0255 -0.0217 -0.0214 -0.0230 -0.0206 -0.0207 -0.0211
[0.0279] [0.0279] [0.0281] [0.0280] [0.0279] [0.0280] [0.0279] [0.0279] [0.0279]lP27e TotalEmployees 0.169*** 0.170*** 0.172*** 0.169*** 0.171*** 0.169*** 0.169*** 0.170*** 0.169***
[0.0376] [0.0377] [0.0378] [0.0377] [0.0377] [0.0377] [0.0377] [0.0377] [0.0377]lwage emp1 0.0708* 0.0687 0.0663 0.0690 0.0673 0.0703* 0.0689 0.0689 0.0688
[0.0423] [0.0423] [0.0425] [0.0424] [0.0422] [0.0424] [0.0423] [0.0423] [0.0422]llab prod1 0.118*** 0.119*** 0.126*** 0.119*** 0.121*** 0.120*** 0.119*** 0.120*** 0.118***
[0.0360] [0.0360] [0.0362] [0.0360] [0.0358] [0.0360] [0.0360] [0.0359] [0.0360]linp int1 0.0170 0.0177 0.0161 0.0190 0.0169 0.0166 0.0174 0.0171 0.0174
[0.0288] [0.0290] [0.0289] [0.0289] [0.0288] [0.0289] [0.0289] [0.0289] [0.0288]formEmpTrain 0.0596 0.0578 0.0693 0.0519 0.0547 0.0546 0.0574 0.0558 0.0558
[0.0843] [0.0842] [0.0845] [0.0841] [0.0843] [0.0842] [0.0842] [0.0842] [0.0842]cancProc1 0.106
[0.103]cancProc2 -0.0366
[0.0952]cancProc3 1.054***
[0.372]cancProc4 0.230
[0.191]cancProc5 0.190
[0.325]cancProc6 -0.273
[0.225]cancProc7 0.193
[0.451]cancProc8 -0.0106
[0.280]cancProc9 -0.264
[0.316]cons -5.844*** -5.841*** -5.855*** -5.834*** -5.844*** -5.804*** -5.830*** -5.820*** -5.795***
[0.593] [0.811] [0.593] [0.817] [0.591] [0.593] [0.592] [0.592] [0.813]N 1572 1572 1572 1572 1572 1572 1572 1572 1572pseudo r1 0.207log like1 -722.7pseudo r2 0.207log like2 -723.1pseudo r3 0.211log like3 -718.7pseudo r4 0.207log like4 -722.4pseudo r5 0.207log like5 -723.0pseudo r6 0.207log like6 -722.5pseudo r7 0.207log like7 -723.1pseudo r8 0.207log like8 -723.2pseudo r9 0.207log like9 -722.9Notes: Probit estimations with host-country, parent-location and industry dummies in all columns. Standard errors are clustered at the firm level. See Table 7 for a description
of variables capturing main firm characteristics. DcancProcLocPr: local prices not competitive (dummy), DcancProcProdQual: product or service quality not satisfactory (dummy),DcancProcIntProp: concerns over retention of intellectual property (dummy), DcancProcLocInfr: local infrastructure issues (dummy), DcancProcLabRel: labour relations issues(dummy), DcancProcMgmSkill: technical or management skill issues (dummy), DcancProcQualP lant: age, quality of plant and equipment of suppliers (dummy), DcancProcPlantCap:plant or process capacity (dummy), DcancProcEnvResp: environmental responsibility (dummy). Dummies take value 1 if statement holds, and 0 otherwise. All variables are in logsexcept for dummies.
39
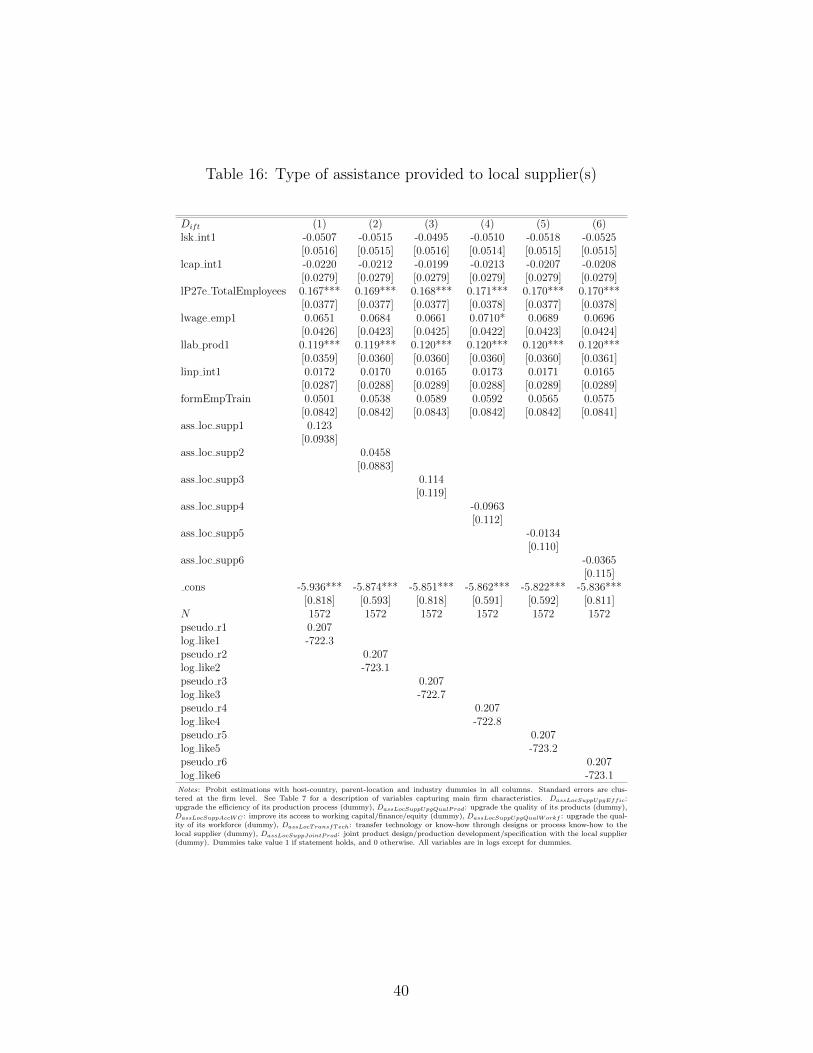
Table 16: Type of assistance provided to local supplier(s)
Dift (1) (2) (3) (4) (5) (6)lsk int1 -0.0507 -0.0515 -0.0495 -0.0510 -0.0518 -0.0525
[0.0516] [0.0515] [0.0516] [0.0514] [0.0515] [0.0515]lcap int1 -0.0220 -0.0212 -0.0199 -0.0213 -0.0207 -0.0208
[0.0279] [0.0279] [0.0279] [0.0279] [0.0279] [0.0279]lP27e TotalEmployees 0.167*** 0.169*** 0.168*** 0.171*** 0.170*** 0.170***
[0.0377] [0.0377] [0.0377] [0.0378] [0.0377] [0.0378]lwage emp1 0.0651 0.0684 0.0661 0.0710* 0.0689 0.0696
[0.0426] [0.0423] [0.0425] [0.0422] [0.0423] [0.0424]llab prod1 0.119*** 0.119*** 0.120*** 0.120*** 0.120*** 0.120***
[0.0359] [0.0360] [0.0360] [0.0360] [0.0360] [0.0361]linp int1 0.0172 0.0170 0.0165 0.0173 0.0171 0.0165
[0.0287] [0.0288] [0.0289] [0.0288] [0.0289] [0.0289]formEmpTrain 0.0501 0.0538 0.0589 0.0592 0.0565 0.0575
[0.0842] [0.0842] [0.0843] [0.0842] [0.0842] [0.0841]ass loc supp1 0.123
[0.0938]ass loc supp2 0.0458
[0.0883]ass loc supp3 0.114
[0.119]ass loc supp4 -0.0963
[0.112]ass loc supp5 -0.0134
[0.110]ass loc supp6 -0.0365
[0.115]cons -5.936*** -5.874*** -5.851*** -5.862*** -5.822*** -5.836***
[0.818] [0.593] [0.818] [0.591] [0.592] [0.811]N 1572 1572 1572 1572 1572 1572pseudo r1 0.207log like1 -722.3pseudo r2 0.207log like2 -723.1pseudo r3 0.207log like3 -722.7pseudo r4 0.207log like4 -722.8pseudo r5 0.207log like5 -723.2pseudo r6 0.207log like6 -723.1Notes: Probit estimations with host-country, parent-location and industry dummies in all columns. Standard errors are clus-
tered at the firm level. See Table 7 for a description of variables capturing main firm characteristics. DassLocSuppUpgEffic:upgrade the efficiency of its production process (dummy), DassLocSuppUpgQualProd: upgrade the quality of its products (dummy),DassLocSuppAccWC : improve its access to working capital/finance/equity (dummy), DassLocSuppUpgQualWorkf : upgrade the qual-ity of its workforce (dummy), DassLocTransfTech: transfer technology or know-how through designs or process know-how to thelocal supplier (dummy), DassLocSuppJointProd: joint product design/production development/specification with the local supplier(dummy). Dummies take value 1 if statement holds, and 0 otherwise. All variables are in logs except for dummies.
40
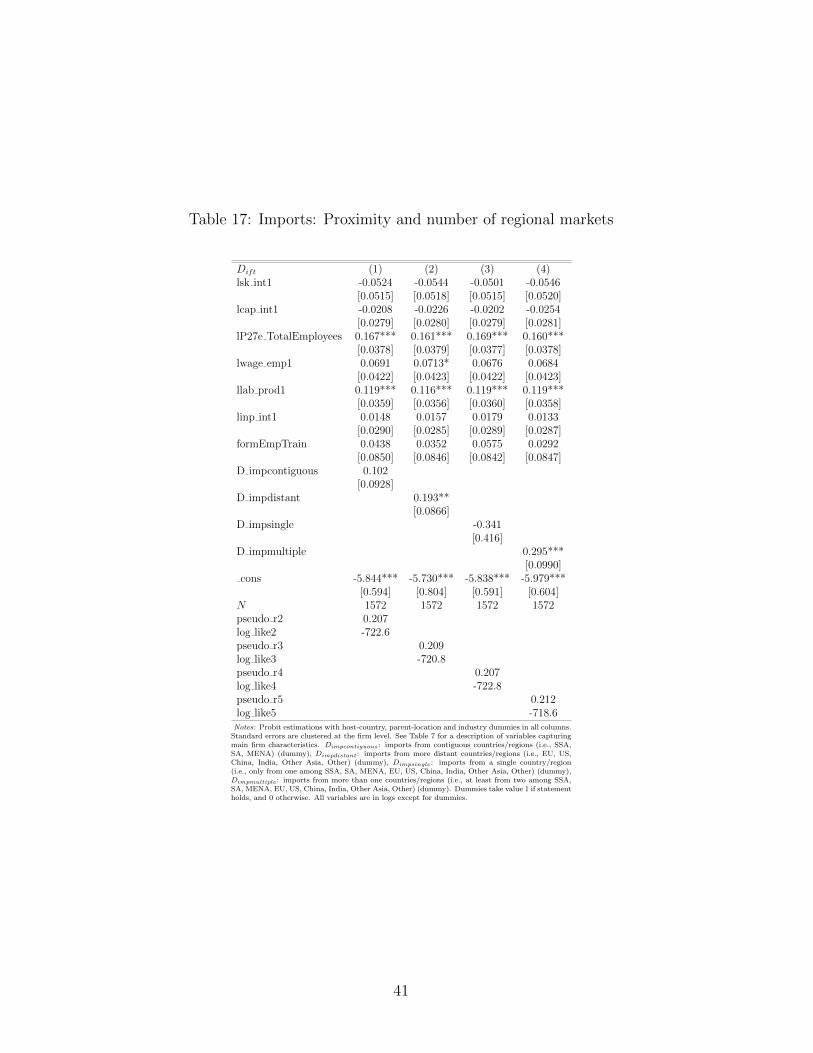
Table 17: Imports: Proximity and number of regional markets
Dift (1) (2) (3) (4)lsk int1 -0.0524 -0.0544 -0.0501 -0.0546
[0.0515] [0.0518] [0.0515] [0.0520]lcap int1 -0.0208 -0.0226 -0.0202 -0.0254
[0.0279] [0.0280] [0.0279] [0.0281]lP27e TotalEmployees 0.167*** 0.161*** 0.169*** 0.160***
[0.0378] [0.0379] [0.0377] [0.0378]lwage emp1 0.0691 0.0713* 0.0676 0.0684
[0.0422] [0.0423] [0.0422] [0.0423]llab prod1 0.119*** 0.116*** 0.119*** 0.119***
[0.0359] [0.0356] [0.0360] [0.0358]linp int1 0.0148 0.0157 0.0179 0.0133
[0.0290] [0.0285] [0.0289] [0.0287]formEmpTrain 0.0438 0.0352 0.0575 0.0292
[0.0850] [0.0846] [0.0842] [0.0847]D impcontiguous 0.102
[0.0928]D impdistant 0.193**
[0.0866]D impsingle -0.341
[0.416]D impmultiple 0.295***
[0.0990]cons -5.844*** -5.730*** -5.838*** -5.979***
[0.594] [0.804] [0.591] [0.604]N 1572 1572 1572 1572pseudo r2 0.207log like2 -722.6pseudo r3 0.209log like3 -720.8pseudo r4 0.207log like4 -722.8pseudo r5 0.212log like5 -718.6Notes: Probit estimations with host-country, parent-location and industry dummies in all columns.
Standard errors are clustered at the firm level. See Table 7 for a description of variables capturingmain firm characteristics. Dimpcontiguous: imports from contiguous countries/regions (i.e., SSA,SA, MENA) (dummy), Dimpdistant: imports from more distant countries/regions (i.e., EU, US,China, India, Other Asia, Other) (dummy), Dimpsingle: imports from a single country/region(i.e., only from one among SSA, SA, MENA, EU, US, China, India, Other Asia, Other) (dummy),Dimpmultiple: imports from more than one countries/regions (i.e., at least from two among SSA,SA, MENA, EU, US, China, India, Other Asia, Other) (dummy). Dummies take value 1 if statementholds, and 0 otherwise. All variables are in logs except for dummies.
41
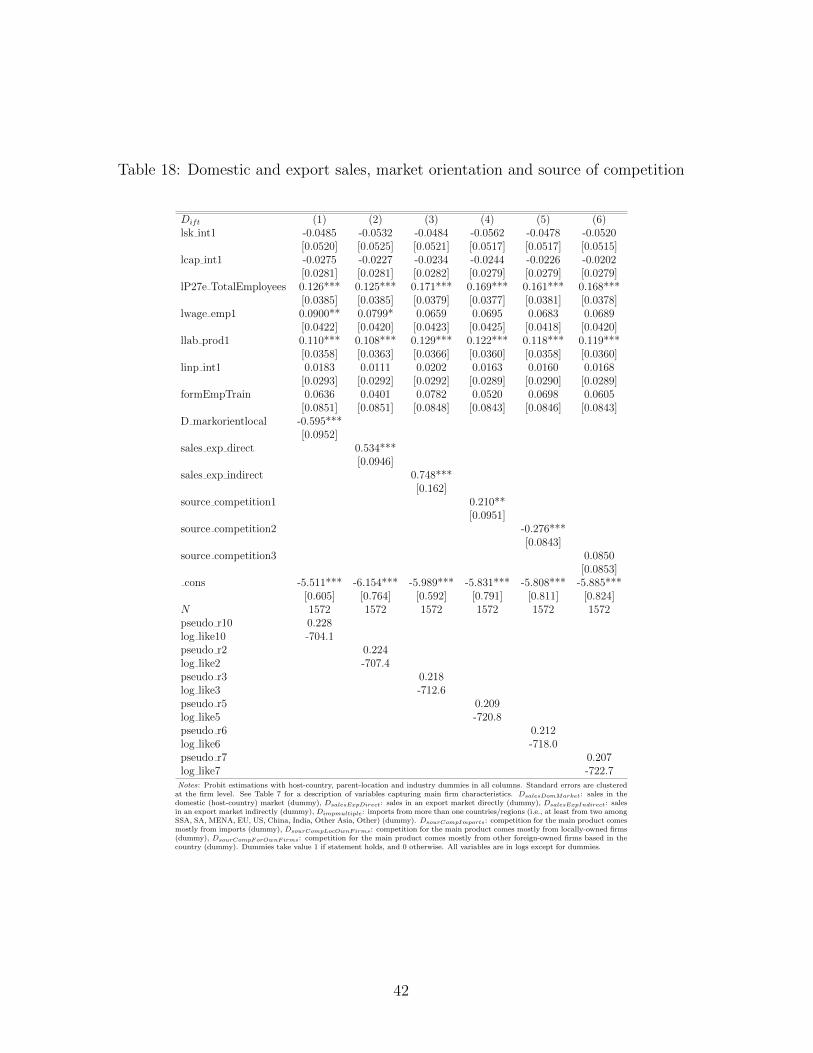
Table 18: Domestic and export sales, market orientation and source of competition
Dift (1) (2) (3) (4) (5) (6)lsk int1 -0.0485 -0.0532 -0.0484 -0.0562 -0.0478 -0.0520
[0.0520] [0.0525] [0.0521] [0.0517] [0.0517] [0.0515]lcap int1 -0.0275 -0.0227 -0.0234 -0.0244 -0.0226 -0.0202
[0.0281] [0.0281] [0.0282] [0.0279] [0.0279] [0.0279]lP27e TotalEmployees 0.126*** 0.125*** 0.171*** 0.169*** 0.161*** 0.168***
[0.0385] [0.0385] [0.0379] [0.0377] [0.0381] [0.0378]lwage emp1 0.0900** 0.0799* 0.0659 0.0695 0.0683 0.0689
[0.0422] [0.0420] [0.0423] [0.0425] [0.0418] [0.0420]llab prod1 0.110*** 0.108*** 0.129*** 0.122*** 0.118*** 0.119***
[0.0358] [0.0363] [0.0366] [0.0360] [0.0358] [0.0360]linp int1 0.0183 0.0111 0.0202 0.0163 0.0160 0.0168
[0.0293] [0.0292] [0.0292] [0.0289] [0.0290] [0.0289]formEmpTrain 0.0636 0.0401 0.0782 0.0520 0.0698 0.0605
[0.0851] [0.0851] [0.0848] [0.0843] [0.0846] [0.0843]D markorientlocal -0.595***
[0.0952]sales exp direct 0.534***
[0.0946]sales exp indirect 0.748***
[0.162]source competition1 0.210**
[0.0951]source competition2 -0.276***
[0.0843]source competition3 0.0850
[0.0853]cons -5.511*** -6.154*** -5.989*** -5.831*** -5.808*** -5.885***
[0.605] [0.764] [0.592] [0.791] [0.811] [0.824]N 1572 1572 1572 1572 1572 1572pseudo r10 0.228log like10 -704.1pseudo r2 0.224log like2 -707.4pseudo r3 0.218log like3 -712.6pseudo r5 0.209log like5 -720.8pseudo r6 0.212log like6 -718.0pseudo r7 0.207log like7 -722.7Notes: Probit estimations with host-country, parent-location and industry dummies in all columns. Standard errors are clustered
at the firm level. See Table 7 for a description of variables capturing main firm characteristics. DsalesDomMarket: sales in thedomestic (host-country) market (dummy), DsalesExpDirect: sales in an export market directly (dummy), DsalesExpIndirect: salesin an export market indirectly (dummy), Dimpmultiple: imports from more than one countries/regions (i.e., at least from two amongSSA, SA, MENA, EU, US, China, India, Other Asia, Other) (dummy). DsourCompImports: competition for the main product comesmostly from imports (dummy), DsourCompLocOwnFirms: competition for the main product comes mostly from locally-owned firms(dummy), DsourCompForOwnFirms: competition for the main product comes mostly from other foreign-owned firms based in thecountry (dummy). Dummies take value 1 if statement holds, and 0 otherwise. All variables are in logs except for dummies.
42
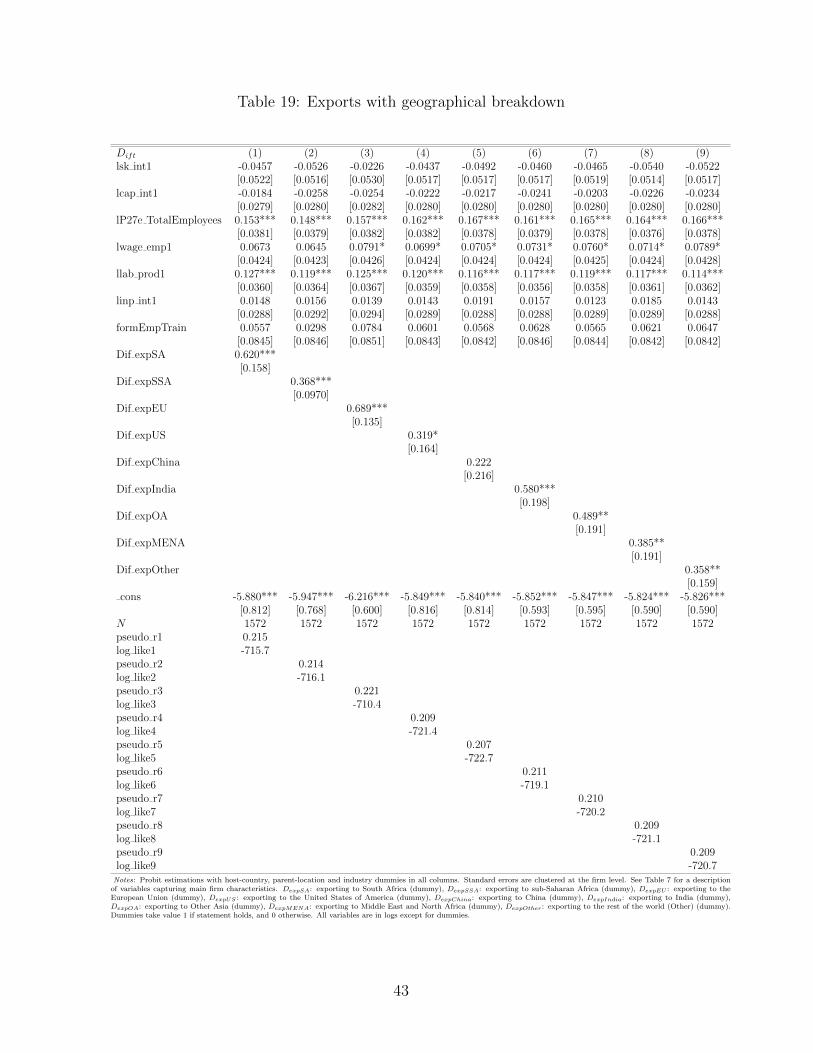
Table 19: Exports with geographical breakdown
Dift (1) (2) (3) (4) (5) (6) (7) (8) (9)lsk int1 -0.0457 -0.0526 -0.0226 -0.0437 -0.0492 -0.0460 -0.0465 -0.0540 -0.0522
[0.0522] [0.0516] [0.0530] [0.0517] [0.0517] [0.0517] [0.0519] [0.0514] [0.0517]lcap int1 -0.0184 -0.0258 -0.0254 -0.0222 -0.0217 -0.0241 -0.0203 -0.0226 -0.0234
[0.0279] [0.0280] [0.0282] [0.0280] [0.0280] [0.0280] [0.0280] [0.0280] [0.0280]lP27e TotalEmployees 0.153*** 0.148*** 0.157*** 0.162*** 0.167*** 0.161*** 0.165*** 0.164*** 0.166***
[0.0381] [0.0379] [0.0382] [0.0382] [0.0378] [0.0379] [0.0378] [0.0376] [0.0378]lwage emp1 0.0673 0.0645 0.0791* 0.0699* 0.0705* 0.0731* 0.0760* 0.0714* 0.0789*
[0.0424] [0.0423] [0.0426] [0.0424] [0.0424] [0.0424] [0.0425] [0.0424] [0.0428]llab prod1 0.127*** 0.119*** 0.125*** 0.120*** 0.116*** 0.117*** 0.119*** 0.117*** 0.114***
[0.0360] [0.0364] [0.0367] [0.0359] [0.0358] [0.0356] [0.0358] [0.0361] [0.0362]linp int1 0.0148 0.0156 0.0139 0.0143 0.0191 0.0157 0.0123 0.0185 0.0143
[0.0288] [0.0292] [0.0294] [0.0289] [0.0288] [0.0288] [0.0289] [0.0289] [0.0288]formEmpTrain 0.0557 0.0298 0.0784 0.0601 0.0568 0.0628 0.0565 0.0621 0.0647
[0.0845] [0.0846] [0.0851] [0.0843] [0.0842] [0.0846] [0.0844] [0.0842] [0.0842]Dif expSA 0.620***
[0.158]Dif expSSA 0.368***
[0.0970]Dif expEU 0.689***
[0.135]Dif expUS 0.319*
[0.164]Dif expChina 0.222
[0.216]Dif expIndia 0.580***
[0.198]Dif expOA 0.489**
[0.191]Dif expMENA 0.385**
[0.191]Dif expOther 0.358**
[0.159]cons -5.880*** -5.947*** -6.216*** -5.849*** -5.840*** -5.852*** -5.847*** -5.824*** -5.826***
[0.812] [0.768] [0.600] [0.816] [0.814] [0.593] [0.595] [0.590] [0.590]N 1572 1572 1572 1572 1572 1572 1572 1572 1572pseudo r1 0.215log like1 -715.7pseudo r2 0.214log like2 -716.1pseudo r3 0.221log like3 -710.4pseudo r4 0.209log like4 -721.4pseudo r5 0.207log like5 -722.7pseudo r6 0.211log like6 -719.1pseudo r7 0.210log like7 -720.2pseudo r8 0.209log like8 -721.1pseudo r9 0.209log like9 -720.7Notes: Probit estimations with host-country, parent-location and industry dummies in all columns. Standard errors are clustered at the firm level. See Table 7 for a description
of variables capturing main firm characteristics. DexpSA: exporting to South Africa (dummy), DexpSSA: exporting to sub-Saharan Africa (dummy), DexpEU : exporting to theEuropean Union (dummy), DexpUS : exporting to the United States of America (dummy), DexpChina: exporting to China (dummy), DexpIndia: exporting to India (dummy),DexpOA: exporting to Other Asia (dummy), DexpMENA: exporting to Middle East and North Africa (dummy), DexpOther: exporting to the rest of the world (Other) (dummy).Dummies take value 1 if statement holds, and 0 otherwise. All variables are in logs except for dummies.
43
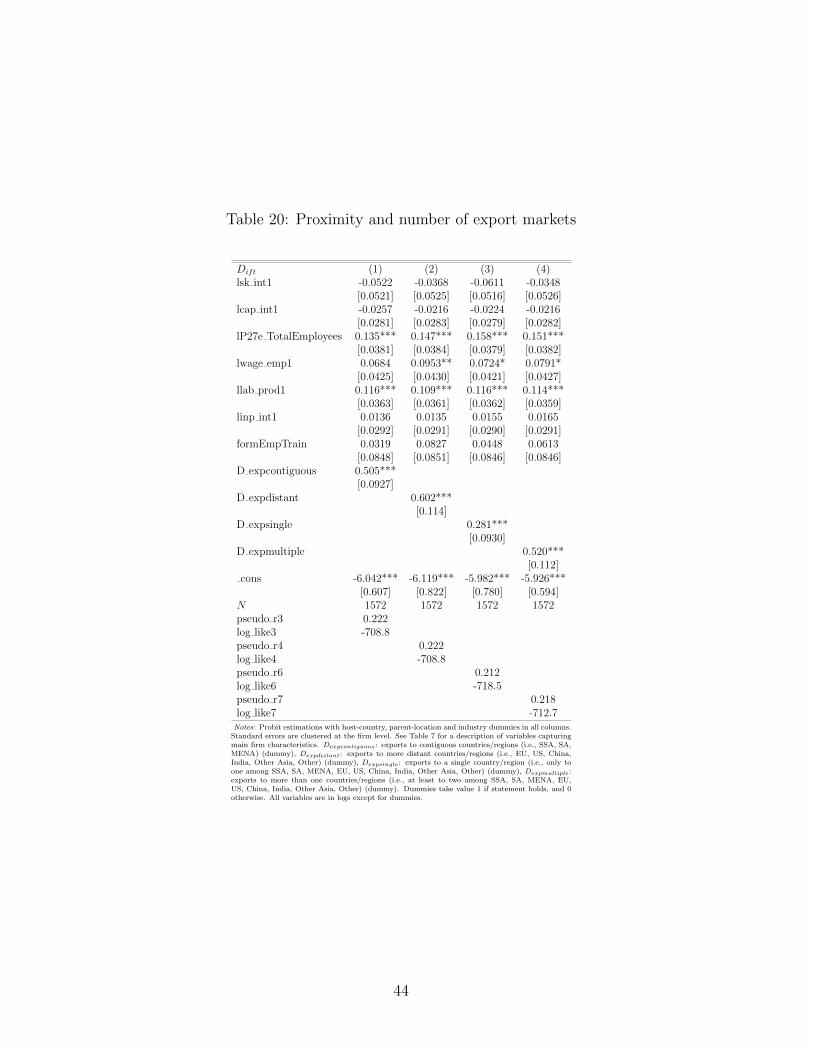
Table 20: Proximity and number of export markets
Dift (1) (2) (3) (4)lsk int1 -0.0522 -0.0368 -0.0611 -0.0348
[0.0521] [0.0525] [0.0516] [0.0526]lcap int1 -0.0257 -0.0216 -0.0224 -0.0216
[0.0281] [0.0283] [0.0279] [0.0282]lP27e TotalEmployees 0.135*** 0.147*** 0.158*** 0.151***
[0.0381] [0.0384] [0.0379] [0.0382]lwage emp1 0.0684 0.0953** 0.0724* 0.0791*
[0.0425] [0.0430] [0.0421] [0.0427]llab prod1 0.116*** 0.109*** 0.116*** 0.114***
[0.0363] [0.0361] [0.0362] [0.0359]linp int1 0.0136 0.0135 0.0155 0.0165
[0.0292] [0.0291] [0.0290] [0.0291]formEmpTrain 0.0319 0.0827 0.0448 0.0613
[0.0848] [0.0851] [0.0846] [0.0846]D expcontiguous 0.505***
[0.0927]D expdistant 0.602***
[0.114]D expsingle 0.281***
[0.0930]D expmultiple 0.520***
[0.112]cons -6.042*** -6.119*** -5.982*** -5.926***
[0.607] [0.822] [0.780] [0.594]N 1572 1572 1572 1572pseudo r3 0.222log like3 -708.8pseudo r4 0.222log like4 -708.8pseudo r6 0.212log like6 -718.5pseudo r7 0.218log like7 -712.7Notes: Probit estimations with host-country, parent-location and industry dummies in all columns.
Standard errors are clustered at the firm level. See Table 7 for a description of variables capturingmain firm characteristics. Dexpcontiguous: exports to contiguous countries/regions (i.e., SSA, SA,MENA) (dummy), Dexpdistant: exports to more distant countries/regions (i.e., EU, US, China,India, Other Asia, Other) (dummy), Dexpsingle: exports to a single country/region (i.e., only toone among SSA, SA, MENA, EU, US, China, India, Other Asia, Other) (dummy), Dexpmultiple:exports to more than one countries/regions (i.e., at least to two among SSA, SA, MENA, EU,US, China, India, Other Asia, Other) (dummy). Dummies take value 1 if statement holds, and 0otherwise. All variables are in logs except for dummies.
44
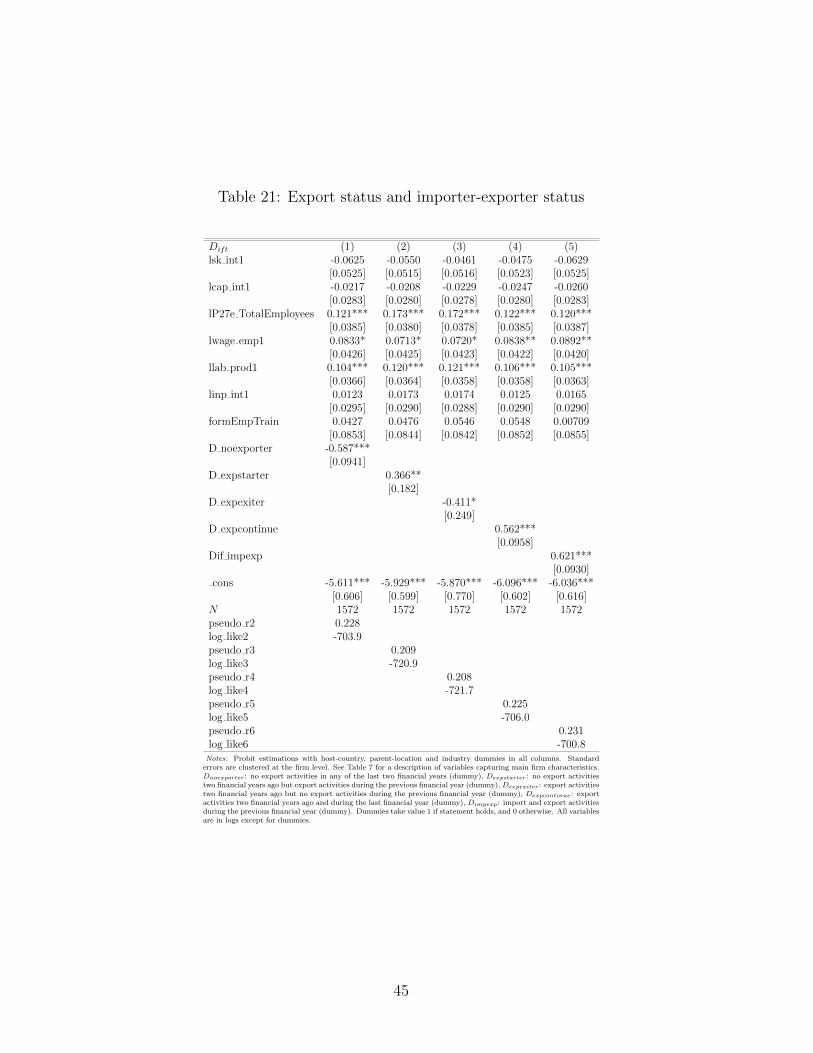
Table 21: Export status and importer-exporter status
Dift (1) (2) (3) (4) (5)lsk int1 -0.0625 -0.0550 -0.0461 -0.0475 -0.0629
[0.0525] [0.0515] [0.0516] [0.0523] [0.0525]lcap int1 -0.0217 -0.0208 -0.0229 -0.0247 -0.0260
[0.0283] [0.0280] [0.0278] [0.0280] [0.0283]lP27e TotalEmployees 0.121*** 0.173*** 0.172*** 0.122*** 0.120***
[0.0385] [0.0380] [0.0378] [0.0385] [0.0387]lwage emp1 0.0833* 0.0713* 0.0720* 0.0838** 0.0892**
[0.0426] [0.0425] [0.0423] [0.0422] [0.0420]llab prod1 0.104*** 0.120*** 0.121*** 0.106*** 0.105***
[0.0366] [0.0364] [0.0358] [0.0358] [0.0363]linp int1 0.0123 0.0173 0.0174 0.0125 0.0165
[0.0295] [0.0290] [0.0288] [0.0290] [0.0290]formEmpTrain 0.0427 0.0476 0.0546 0.0548 0.00709
[0.0853] [0.0844] [0.0842] [0.0852] [0.0855]D noexporter -0.587***
[0.0941]D expstarter 0.366**
[0.182]D expexiter -0.411*
[0.249]D expcontinue 0.562***
[0.0958]Dif impexp 0.621***
[0.0930]cons -5.611*** -5.929*** -5.870*** -6.096*** -6.036***
[0.606] [0.599] [0.770] [0.602] [0.616]N 1572 1572 1572 1572 1572pseudo r2 0.228log like2 -703.9pseudo r3 0.209log like3 -720.9pseudo r4 0.208log like4 -721.7pseudo r5 0.225log like5 -706.0pseudo r6 0.231log like6 -700.8Notes: Probit estimations with host-country, parent-location and industry dummies in all columns. Standard
errors are clustered at the firm level. See Table 7 for a description of variables capturing main firm characteristics.Dnoexporter: no export activities in any of the last two financial years (dummy), Dexpstarter: no export activitiestwo financial years ago but export activities during the previous financial year (dummy), Dexpexiter: export activitiestwo financial years ago but no export activities during the previous financial year (dummy), Dexpcontinue: exportactivities two financial years ago and during the last financial year (dummy), Dimpexp: import and export activitiesduring the previous financial year (dummy). Dummies take value 1 if statement holds, and 0 otherwise. All variablesare in logs except for dummies.
45
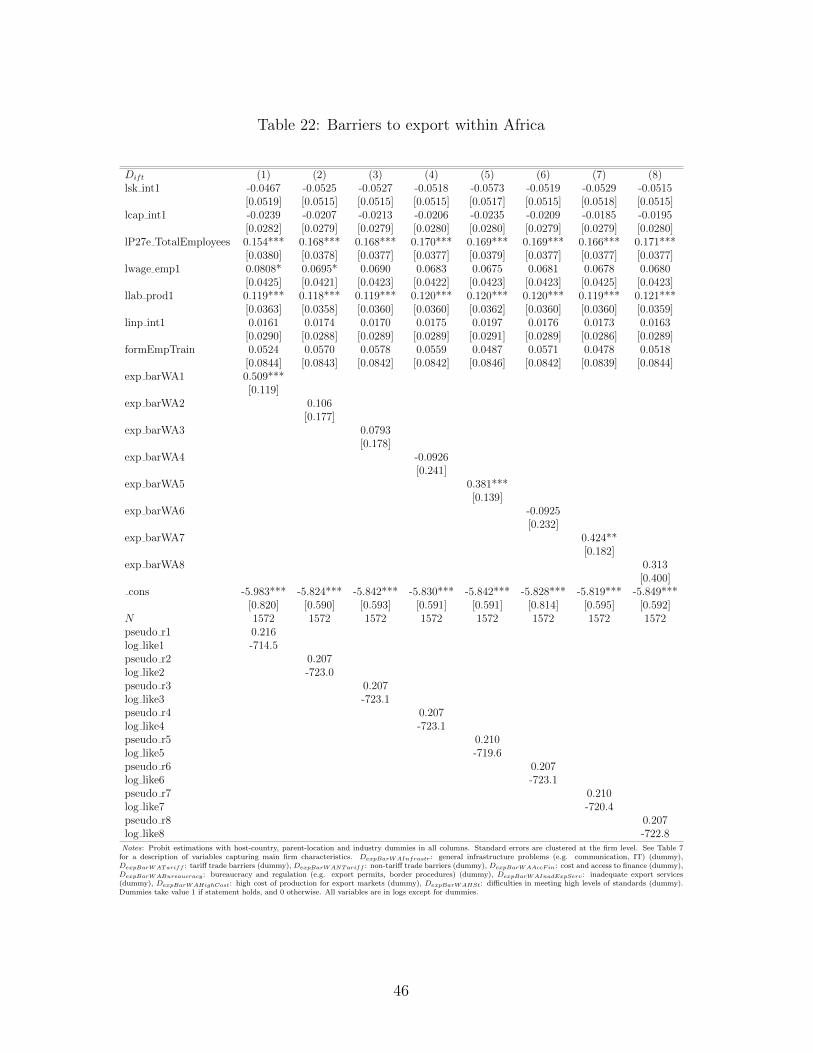
Table 22: Barriers to export within Africa
Dift (1) (2) (3) (4) (5) (6) (7) (8)lsk int1 -0.0467 -0.0525 -0.0527 -0.0518 -0.0573 -0.0519 -0.0529 -0.0515
[0.0519] [0.0515] [0.0515] [0.0515] [0.0517] [0.0515] [0.0518] [0.0515]lcap int1 -0.0239 -0.0207 -0.0213 -0.0206 -0.0235 -0.0209 -0.0185 -0.0195
[0.0282] [0.0279] [0.0279] [0.0280] [0.0280] [0.0279] [0.0279] [0.0280]lP27e TotalEmployees 0.154*** 0.168*** 0.168*** 0.170*** 0.169*** 0.169*** 0.166*** 0.171***
[0.0380] [0.0378] [0.0377] [0.0377] [0.0379] [0.0377] [0.0377] [0.0377]lwage emp1 0.0808* 0.0695* 0.0690 0.0683 0.0675 0.0681 0.0678 0.0680
[0.0425] [0.0421] [0.0423] [0.0422] [0.0423] [0.0423] [0.0425] [0.0423]llab prod1 0.119*** 0.118*** 0.119*** 0.120*** 0.120*** 0.120*** 0.119*** 0.121***
[0.0363] [0.0358] [0.0360] [0.0360] [0.0362] [0.0360] [0.0360] [0.0359]linp int1 0.0161 0.0174 0.0170 0.0175 0.0197 0.0176 0.0173 0.0163
[0.0290] [0.0288] [0.0289] [0.0289] [0.0291] [0.0289] [0.0286] [0.0289]formEmpTrain 0.0524 0.0570 0.0578 0.0559 0.0487 0.0571 0.0478 0.0518
[0.0844] [0.0843] [0.0842] [0.0842] [0.0846] [0.0842] [0.0839] [0.0844]exp barWA1 0.509***
[0.119]exp barWA2 0.106
[0.177]exp barWA3 0.0793
[0.178]exp barWA4 -0.0926
[0.241]exp barWA5 0.381***
[0.139]exp barWA6 -0.0925
[0.232]exp barWA7 0.424**
[0.182]exp barWA8 0.313
[0.400]cons -5.983*** -5.824*** -5.842*** -5.830*** -5.842*** -5.828*** -5.819*** -5.849***
[0.820] [0.590] [0.593] [0.591] [0.591] [0.814] [0.595] [0.592]N 1572 1572 1572 1572 1572 1572 1572 1572pseudo r1 0.216log like1 -714.5pseudo r2 0.207log like2 -723.0pseudo r3 0.207log like3 -723.1pseudo r4 0.207log like4 -723.1pseudo r5 0.210log like5 -719.6pseudo r6 0.207log like6 -723.1pseudo r7 0.210log like7 -720.4pseudo r8 0.207log like8 -722.8Notes: Probit estimations with host-country, parent-location and industry dummies in all columns. Standard errors are clustered at the firm level. See Table 7
for a description of variables capturing main firm characteristics. DexpBarWAInfrastr: general infrastructure problems (e.g. communication, IT) (dummy),DexpBarWATariff : tariff trade barriers (dummy), DexpBarWANTariff : non-tariff trade barriers (dummy), DexpBarWAAccFin: cost and access to finance (dummy),DexpBarWABureaucracy : bureaucracy and regulation (e.g. export permits, border procedures) (dummy), DexpBarWAInadExpServ : inadequate export services(dummy), DexpBarWAHighCost: high cost of production for export markets (dummy), DexpBarWAHSt: difficulties in meeting high levels of standards (dummy).Dummies take value 1 if statement holds, and 0 otherwise. All variables are in logs except for dummies.
46

Table 23: Barriers to export outside Africa
Dift (1) (2) (3) (4) (5) (6) (7) (8)lsk int1 -0.0506 -0.0552 -0.0544 -0.0515 -0.0457 -0.0672 -0.0516 -0.0519
[0.0516] [0.0514] [0.0515] [0.0515] [0.0518] [0.0521] [0.0515] [0.0516]lcap int1 -0.0195 -0.0243 -0.0215 -0.0197 -0.0226 -0.0165 -0.0209 -0.0217
[0.0279] [0.0280] [0.0280] [0.0280] [0.0280] [0.0281] [0.0279] [0.0280]lP27e TotalEmployees 0.166*** 0.166*** 0.167*** 0.170*** 0.169*** 0.158*** 0.171*** 0.168***
[0.0379] [0.0378] [0.0377] [0.0377] [0.0379] [0.0374] [0.0379] [0.0378]lwage emp1 0.0755* 0.0701* 0.0681 0.0681 0.0698* 0.0698 0.0686 0.0704*
[0.0423] [0.0424] [0.0423] [0.0422] [0.0411] [0.0426] [0.0423] [0.0425]llab prod1 0.109*** 0.122*** 0.118*** 0.120*** 0.122*** 0.124*** 0.120*** 0.121***
[0.0359] [0.0361] [0.0360] [0.0359] [0.0359] [0.0367] [0.0360] [0.0359]linp int1 0.0210 0.0146 0.0167 0.0173 0.0176 0.0142 0.0172 0.0143
[0.0289] [0.0290] [0.0290] [0.0289] [0.0290] [0.0290] [0.0289] [0.0289]formEmpTrain 0.0611 0.0629 0.0586 0.0581 0.0553 0.0617 0.0564 0.0557
[0.0842] [0.0845] [0.0843] [0.0843] [0.0844] [0.0842] [0.0842] [0.0843]exp barOA1 0.506**
[0.243]exp barOA2 0.452**
[0.179]exp barOA3 0.425*
[0.242]exp barOA4 -0.144
[0.239]exp barOA5 0.456***
[0.171]exp barOA6 0.821***
[0.203]exp barOA7 -0.0357
[0.135]exp barOA8 0.223
[0.166]cons -5.846*** -5.927*** -5.832*** -5.832*** -5.899*** -5.786*** -5.833*** -5.833***
[0.822] [0.809] [0.816] [0.592] [0.867] [0.589] [0.591] [0.593]N 1572 1572 1572 1572 1572 1572 1572 1572pseudo r1 0.209log like1 -721.0pseudo r2 0.210log like2 -720.0pseudo r3 0.208log like3 -722.0pseudo r4 0.207log like4 -723.0pseudo r5 0.211log like5 -719.5pseudo r6 0.217log like6 -714.0pseudo r7 0.207log like7 -723.2pseudo r8 0.208log like8 -722.2Notes: Probit estimations with host-country, parent-location and industry dummies in all columns. Standard errors are clustered at the firm level. See Table 7
for a description of variables capturing main firm characteristics. DexpBarOAInfrastr: general infrastructure problems (e.g. communication, IT) (dummy),DexpBarOATariff : tariff trade barriers (dummy), DexpBarOANTariff : non-tariff trade barriers (dummy), DexpBarOAAccFin: cost and access to finance (dummy),DexpBarOABureaucracy : bureaucracy and regulation (e.g. export permits, border procedures) (dummy), DexpBarOAInadExpServ : inadequate export services(dummy), DexpBarOAHighCost: high cost of production for export markets (dummy), DexpBarOAHSt: difficulties in meeting high levels of standards (dummy).Dummies take value 1 if statement holds, and 0 otherwise. All variables are in logs except for dummies.
47
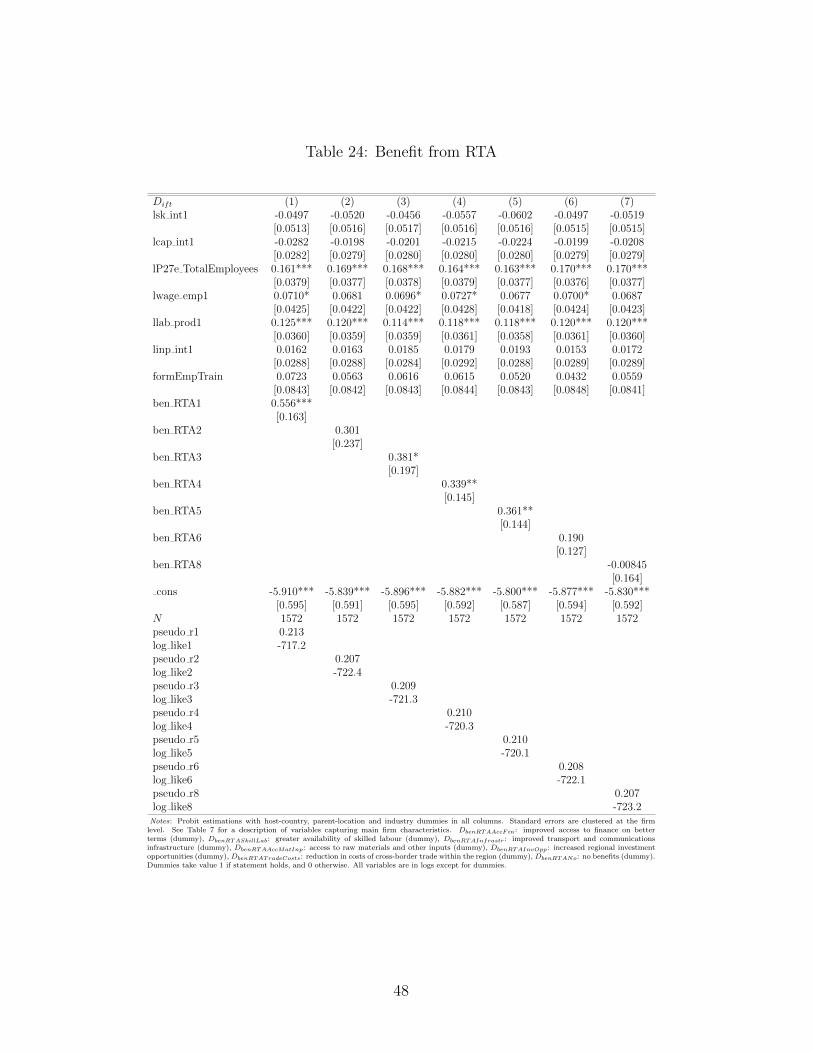
Table 24: Benefit from RTA
Dift (1) (2) (3) (4) (5) (6) (7)lsk int1 -0.0497 -0.0520 -0.0456 -0.0557 -0.0602 -0.0497 -0.0519
[0.0513] [0.0516] [0.0517] [0.0516] [0.0516] [0.0515] [0.0515]lcap int1 -0.0282 -0.0198 -0.0201 -0.0215 -0.0224 -0.0199 -0.0208
[0.0282] [0.0279] [0.0280] [0.0280] [0.0280] [0.0279] [0.0279]lP27e TotalEmployees 0.161*** 0.169*** 0.168*** 0.164*** 0.163*** 0.170*** 0.170***
[0.0379] [0.0377] [0.0378] [0.0379] [0.0377] [0.0376] [0.0377]lwage emp1 0.0710* 0.0681 0.0696* 0.0727* 0.0677 0.0700* 0.0687
[0.0425] [0.0422] [0.0422] [0.0428] [0.0418] [0.0424] [0.0423]llab prod1 0.125*** 0.120*** 0.114*** 0.118*** 0.118*** 0.120*** 0.120***
[0.0360] [0.0359] [0.0359] [0.0361] [0.0358] [0.0361] [0.0360]linp int1 0.0162 0.0163 0.0185 0.0179 0.0193 0.0153 0.0172
[0.0288] [0.0288] [0.0284] [0.0292] [0.0288] [0.0289] [0.0289]formEmpTrain 0.0723 0.0563 0.0616 0.0615 0.0520 0.0432 0.0559
[0.0843] [0.0842] [0.0843] [0.0844] [0.0843] [0.0848] [0.0841]ben RTA1 0.556***
[0.163]ben RTA2 0.301
[0.237]ben RTA3 0.381*
[0.197]ben RTA4 0.339**
[0.145]ben RTA5 0.361**
[0.144]ben RTA6 0.190
[0.127]ben RTA8 -0.00845
[0.164]cons -5.910*** -5.839*** -5.896*** -5.882*** -5.800*** -5.877*** -5.830***
[0.595] [0.591] [0.595] [0.592] [0.587] [0.594] [0.592]N 1572 1572 1572 1572 1572 1572 1572pseudo r1 0.213log like1 -717.2pseudo r2 0.207log like2 -722.4pseudo r3 0.209log like3 -721.3pseudo r4 0.210log like4 -720.3pseudo r5 0.210log like5 -720.1pseudo r6 0.208log like6 -722.1pseudo r8 0.207log like8 -723.2Notes: Probit estimations with host-country, parent-location and industry dummies in all columns. Standard errors are clustered at the firm
level. See Table 7 for a description of variables capturing main firm characteristics. DbenRTAAccFin: improved access to finance on betterterms (dummy), DbenRTASkillLab: greater availability of skilled labour (dummy), DbenRTAInfrastr: improved transport and communicationsinfrastructure (dummy), DbenRTAAccMatInp: access to raw materials and other inputs (dummy), DbenRTAInvOpp: increased regional investmentopportunities (dummy), DbenRTATradeCosts: reduction in costs of cross-border trade within the region (dummy), DbenRTANo: no benefits (dummy).Dummies take value 1 if statement holds, and 0 otherwise. All variables are in logs except for dummies.
48
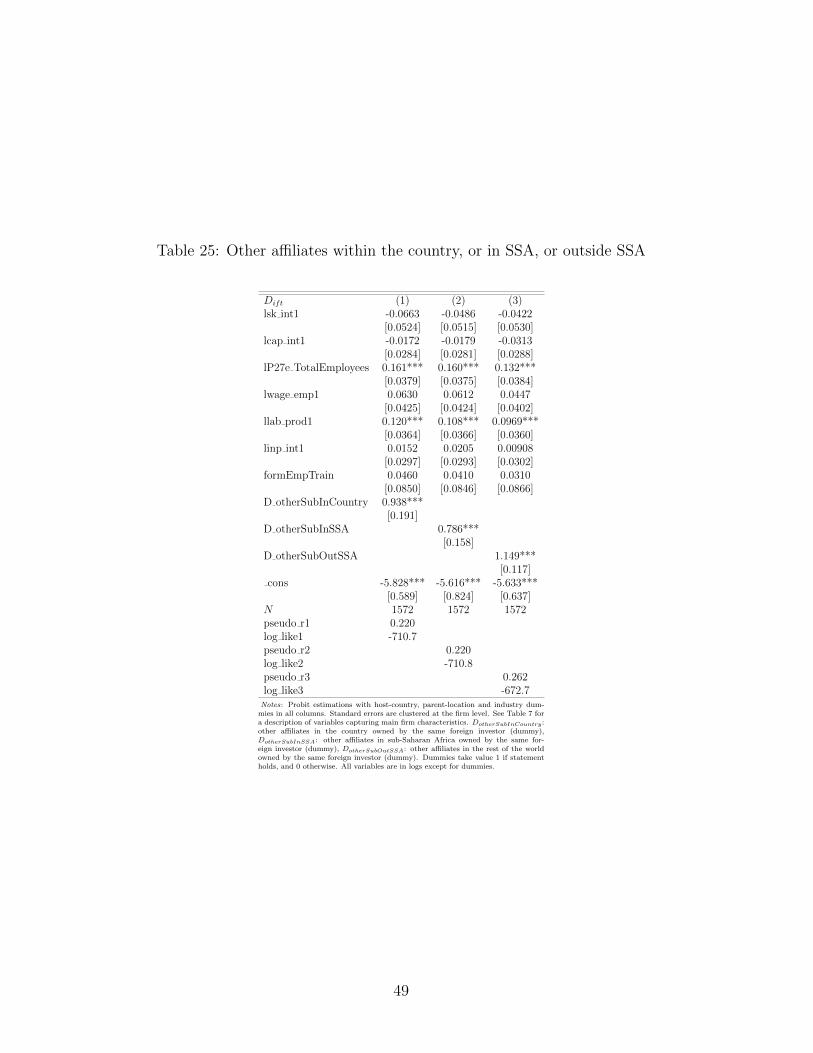
Table 25: Other affiliates within the country, or in SSA, or outside SSA
Dift (1) (2) (3)lsk int1 -0.0663 -0.0486 -0.0422
[0.0524] [0.0515] [0.0530]lcap int1 -0.0172 -0.0179 -0.0313
[0.0284] [0.0281] [0.0288]lP27e TotalEmployees 0.161*** 0.160*** 0.132***
[0.0379] [0.0375] [0.0384]lwage emp1 0.0630 0.0612 0.0447
[0.0425] [0.0424] [0.0402]llab prod1 0.120*** 0.108*** 0.0969***
[0.0364] [0.0366] [0.0360]linp int1 0.0152 0.0205 0.00908
[0.0297] [0.0293] [0.0302]formEmpTrain 0.0460 0.0410 0.0310
[0.0850] [0.0846] [0.0866]D otherSubInCountry 0.938***
[0.191]D otherSubInSSA 0.786***
[0.158]D otherSubOutSSA 1.149***
[0.117]cons -5.828*** -5.616*** -5.633***
[0.589] [0.824] [0.637]N 1572 1572 1572pseudo r1 0.220log like1 -710.7pseudo r2 0.220log like2 -710.8pseudo r3 0.262log like3 -672.7Notes: Probit estimations with host-country, parent-location and industry dum-
mies in all columns. Standard errors are clustered at the firm level. See Table 7 fora description of variables capturing main firm characteristics. DotherSubInCountry :other affiliates in the country owned by the same foreign investor (dummy),DotherSubInSSA: other affiliates in sub-Saharan Africa owned by the same for-eign investor (dummy), DotherSubOutSSA: other affiliates in the rest of the worldowned by the same foreign investor (dummy). Dummies take value 1 if statementholds, and 0 otherwise. All variables are in logs except for dummies.
49
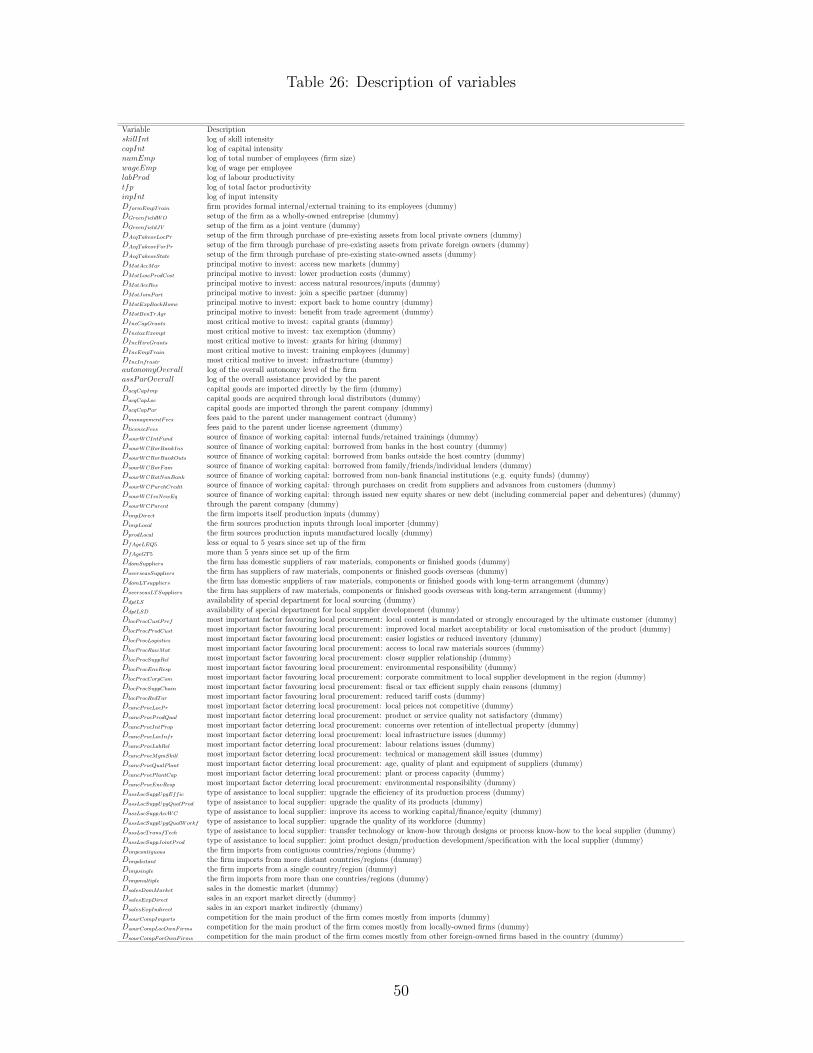
Table 26: Description of variables
Variable DescriptionskillInt log of skill intensitycapInt log of capital intensitynumEmp log of total number of employees (firm size)wageEmp log of wage per employeelabProd log of labour productivitytfp log of total factor productivityinpInt log of input intensityDformEmpTrain firm provides formal internal/external training to its employees (dummy)DGreenfieldWO setup of the firm as a wholly-owned entreprise (dummy)DGreenfieldJV setup of the firm as a joint venture (dummy)DAcqTakeovLocPr setup of the firm through purchase of pre-existing assets from local private owners (dummy)DAcqTakeovForPr setup of the firm through purchase of pre-existing assets from private foreign owners (dummy)DAcqTakeovState setup of the firm through purchase of pre-existing state-owned assets (dummy)DMotAccMar principal motive to invest: access new markets (dummy)DMotLowProdCost principal motive to invest: lower production costs (dummy)DMotAccRes principal motive to invest: access natural resources/inputs (dummy)DMotJoinPart principal motive to invest: join a specific partner (dummy)DMotExpBackHome principal motive to invest: export back to home country (dummy)DMotBenTrAgr principal motive to invest: benefit from trade agreement (dummy)DIncCapGrants most critical motive to invest: capital grants (dummy)DInctaxExempt most critical motive to invest: tax exemption (dummy)DIncHireGrants most critical motive to invest: grants for hiring (dummy)DIncEmpTrain most critical motive to invest: training employees (dummy)DIncInfrastr most critical motive to invest: infrastructure (dummy)autonomyOverall log of the overall autonomy level of the firmassParOverall log of the overall assistance provided by the parentDacqCapImp capital goods are imported directly by the firm (dummy)DacqCapLoc capital goods are acquired through local distributors (dummy)DacqCapPar capital goods are imported through the parent company (dummy)DmanagementFees fees paid to the parent under management contract (dummy)DlicenceFees fees paid to the parent under license agreement (dummy)DsourWCIntFund source of finance of working capital: internal funds/retained trainings (dummy)DsourWCBorBankIns source of finance of working capital: borrowed from banks in the host country (dummy)DsourWCBorBankOuts source of finance of working capital: borrowed from banks outside the host country (dummy)DsourWCBorFam source of finance of working capital: borrowed from family/friends/individual lenders (dummy)DsourWCBotNonBank source of finance of working capital: borrowed from non-bank financial institutions (e.g. equity funds) (dummy)DsourWCPurchCredit source of finance of working capital: through purchases on credit from suppliers and advances from customers (dummy)DsourWCIssNewEq source of finance of working capital: through issued new equity shares or new debt (including commercial paper and debentures) (dummy)DsourWCParent through the parent company (dummy)DimpDirect the firm imports itself production inputs (dummy)DimpLocal the firm sources production inputs through local importer (dummy)DprodLocal the firm sources production inputs manufactured locally (dummy)DfAgeLEQ5 less or equal to 5 years since set up of the firmDfAgeGT5 more than 5 years since set up of the firmDdomSuppliers the firm has domestic suppliers of raw materials, components or finished goods (dummy)DoverseasSuppliers the firm has suppliers of raw materials, components or finished goods overseas (dummy)DdomLTsuppliers the firm has domestic suppliers of raw materials, components or finished goods with long-term arrangement (dummy)DoverseasLTSuppliers the firm has suppliers of raw materials, components or finished goods overseas with long-term arrangement (dummy)DdptLS availability of special department for local sourcing (dummy)DdptLSD availability of special department for local supplier development (dummy)DlocProcCustPref most important factor favouring local procurement: local content is mandated or strongly encouraged by the ultimate customer (dummy)DlocProcProdCust most important factor favouring local procurement: improved local market acceptability or local customisation of the product (dummy)DlocProcLogistics most important factor favouring local procurement: easier logistics or reduced inventory (dummy)DlocProcRawMat most important factor favouring local procurement: access to local raw materials sources (dummy)DlocProcSuppRel most important factor favouring local procurement: closer supplier relationship (dummy)DlocProcEnvResp most important factor favouring local procurement: environmental responsibility (dummy)DlocProcCorpCom most important factor favouring local procurement: corporate commitment to local supplier development in the region (dummy)DlocProcSuppChain most important factor favouring local procurement: fiscal or tax efficient supply chain reasons (dummy)DlocProcRedTar most important factor favouring local procurement: reduced tariff costs (dummy)DcancProcLocPr most important factor deterring local procurement: local prices not competitive (dummy)DcancProcProdQual most important factor deterring local procurement: product or service quality not satisfactory (dummy)DcancProcIntProp most important factor deterring local procurement: concerns over retention of intellectual property (dummy)DcancProcLocInfr most important factor deterring local procurement: local infrastructure issues (dummy)DcancProcLabRel most important factor deterring local procurement: labour relations issues (dummy)DcancProcMgmSkill most important factor deterring local procurement: technical or management skill issues (dummy)DcancProcQualP lant most important factor deterring local procurement: age, quality of plant and equipment of suppliers (dummy)DcancProcP lantCap most important factor deterring local procurement: plant or process capacity (dummy)DcancProcEnvResp most important factor deterring local procurement: environmental responsibility (dummy)DassLocSuppUpgEffic type of assistance to local supplier: upgrade the efficiency of its production process (dummy)DassLocSuppUpgQualProd type of assistance to local supplier: upgrade the quality of its products (dummy)DassLocSuppAccWC type of assistance to local supplier: improve its access to working capital/finance/equity (dummy)DassLocSuppUpgQualWorkf type of assistance to local supplier: upgrade the quality of its workforce (dummy)DassLocTransfTech type of assistance to local supplier: transfer technology or know-how through designs or process know-how to the local supplier (dummy)DassLocSuppJointProd type of assistance to local supplier: joint product design/production development/specification with the local supplier (dummy)Dimpcontiguous the firm imports from contiguous countries/regions (dummy)Dimpdistant the firm imports from more distant countries/regions (dummy)Dimpsingle the firm imports from a single country/region (dummy)Dimpmultiple the firm imports from more than one countries/regions (dummy)DsalesDomMarket sales in the domestic market (dummy)DsalesExpDirect sales in an export market directly (dummy)DsalesExpIndirect sales in an export market indirectly (dummy)DsourCompImports competition for the main product of the firm comes mostly from imports (dummy)DsourCompLocOwnFirms competition for the main product of the firm comes mostly from locally-owned firms (dummy)DsourCompForOwnFirms competition for the main product of the firm comes mostly from other foreign-owned firms based in the country (dummy)
50

Description of variables (continue)
Variable DescriptionDexpSA the firm exports to South Africa (dummy)DexpSSA the firm exports to sub-Saharan Africa (dummy)DexpEU the firm exports to the European Union (dummy)DexpUS the firm exports to the United States of America (dummy)DexpChina the firm exports to China (dummy)DexpIndia the firm exports to India (dummy)DexpOA the firm exports to Other Asia (dummy)DexpMENA the firm exports to Middle East and North Africa (dummy)DexpOther the firm exports to the rest of the world (Other) (dummy)Dexpcontiguous the firm exports to contiguous countries/regions (i.e., SSA, SA, MENA) (dummy)Dexpdistant the firm exports to more distant countries/regions (dummy)Dexpsingle the firm exports to a single country/region (dummy)Dexpmultiple the firm exports to more than one countries/regions (dummy)Dnoexporter the firm had no exports in the last two financial years (dummy)Dexpstarter the firm had exports during the last financial year but not two financial years ago (dummy)Dexpexiter the firms had exports two financial years ago but not during the previous financial year (dummy)Dexpcontinue the firm had exports during the previous two financial years (dummy)Dimpexp the firm has simultaneously import and export activities during the previous financial year (dummy)DexpBarWAInfrastr most important barrier to export within Africa: general infrastructure problems (e.g. communication, IT) (dummy)DexpBarWATariff most important barrier to export within Africa: tariff trade barriers (dummy)DexpBarWANonTariff most important barrier to export within Africa: non-tariff trade barriers (dummy)DexpBarWAAccF in most important barrier to export within Africa: cost and access to finance (dummy)DexpBarWABureaucracy most important barrier to export within Africa: bureaucracy and regulation (e.g. export permits, border procedures) (dummy)DexpBarWAInadExpServ most important barrier to export within Africa: inadequate export services (dummy)DexpBarWAHighCost most important barrier to export within Africa: high cost of production for export markets (dummy)DexpBarWAHighStandards most important barrier to export within Africa: difficulties in meeting high levels of standards (dummy)DexpBarOATariff most important barrier to export outside Africa: tariff trade barriers (dummy)DexpBarOANonTariff most important barrier to export outside Africa: non-tariff trade barriers (dummy)DexpBarOAAccF in most important barrier to export outside Africa: cost and access to finance (dummy)DexpBarOABureaucracy most important barrier to export outside Africa: bureaucracy and regulation (e.g. export permits, border procedures) (dummy)DexpBarOAInadExpServ most important barrier to export outside Africa: inadequate export services (dummy)DexpBarOAHighCost most important barrier to export outside Africa: high cost of production for export markets (dummy)DexpBarOAHighStandards most important barrier to export outside Africa: difficulties in meeting high levels of standards (dummy)DbenRTAAccF in most important benefit from RTA: improved access to finance on better terms (dummy)DbenRTASkillLab most important benefit from RTA: greater availability of skilled labour (dummy)DbenRTAInfrastr most important benefit from RTA: improved transport and communications infrastructure (dummy)DbenRTAAccMatInp most important benefit from RTA: access to raw materials and other inputs (dummy)DbenRTAInvOpp most important benefit from RTA: increased regional investment opportunities (dummy)DbenRTATradeCosts most important benefit from RTA: reduction in costs of cross-border trade within the region (dummy)DbenRTANo most important benefit from RTA: no benefits (dummy)DotherSubInCountry other affiliates in the country owned by the same foreign investor (dummy)DotherSubInSSA other affiliates in sub-Saharan Africa owned by the same foreign investor (dummy)DotherSubOutSSA other affiliates in the rest of the world owned by the same foreign investor (dummy)Notes: Authors’ notation. Each dummy takes value 1 if the statement holds, and 0 otherwise.
51