Embed Size (px)
Citation preview
abcGlobal Research
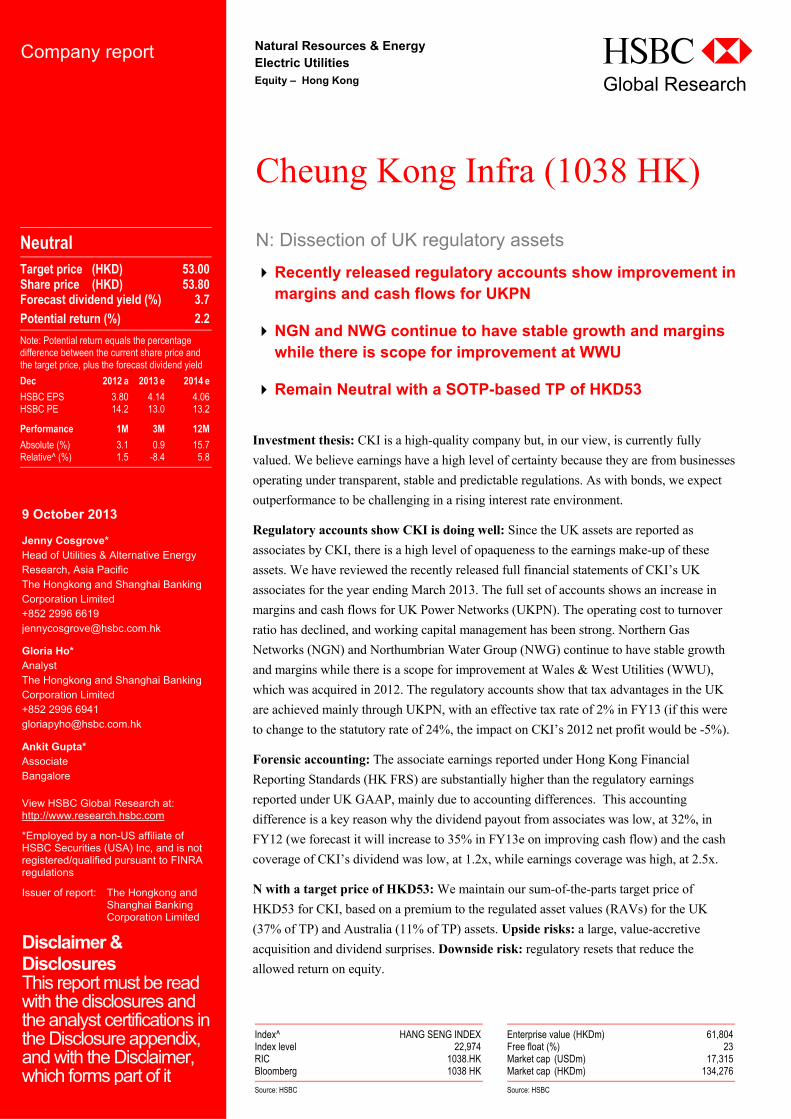
Investment thesis: CKI is a high-quality company but, in our view, is currently fully
valued. We believe earnings have a high level of certainty because they are from businesses
operating under transparent, stable and predictable regulations. As with bonds, we expect
outperformance to be challenging in a rising interest rate environment.
Regulatory accounts show CKI is doing well: Since the UK assets are reported as
associates by CKI, there is a high level of opaqueness to the earnings make-up of these
assets. We have reviewed the recently released full financial statements of CKI’s UK
associates for the year ending March 2013. The full set of accounts shows an increase in
margins and cash flows for UK Power Networks (UKPN). The operating cost to turnover
ratio has declined, and working capital management has been strong. Northern Gas
Networks (NGN) and Northumbrian Water Group (NWG) continue to have stable growth
and margins while there is a scope for improvement at Wales & West Utilities (WWU),
which was acquired in 2012. The regulatory accounts show that tax advantages in the UK
are achieved mainly through UKPN, with an effective tax rate of 2% in FY13 (if this were
to change to the statutory rate of 24%, the impact on CKI’s 2012 net profit would be -5%).
Forensic accounting: The associate earnings reported under Hong Kong Financial
Reporting Standards (HK FRS) are substantially higher than the regulatory earnings
reported under UK GAAP, mainly due to accounting differences. This accounting
difference is a key reason why the dividend payout from associates was low, at 32%, in
FY12 (we forecast it will increase to 35% in FY13e on improving cash flow) and the cash
coverage of CKI’s dividend was low, at 1.2x, while earnings coverage was high, at 2.5x.
N with a target price of HKD53: We maintain our sum-of-the-parts target price of
HKD53 for CKI, based on a premium to the regulated asset values (RAVs) for the UK
(37% of TP) and Australia (11% of TP) assets. Upside risks: a large, value-accretive
acquisition and dividend surprises. Downside risk: regulatory resets that reduce the
allowed return on equity.
Cheung Kong Infra (1038 HK)
N: Dissection of UK regulatory assets
Recently released regulatory accounts show improvement in margins and cash flows for UKPN
NGN and NWG continue to have stable growth and margins while there is scope for improvement at WWU
Remain Neutral with a SOTP-based TP of HKD53
Natural Resources & Energy Electric Utilities Equity – Hong Kong
Company report
Index^ HANG SENG INDEXIndex level 22,974RIC 1038.HKBloomberg 1038 HK
Source: HSBC
Neutral Target price (HKD) 53.00 Share price (HKD) 53.80 Forecast dividend yield (%) 3.7 Potential return (%) 2.2
Note: Potential return equals the percentage difference between the current share price and the target price, plus the forecast dividend yield
Dec 2012 a 2013 e 2014 e
HSBC EPS 3.80 4.14 4.06 HSBC PE 14.2 13.0 13.2
Performance 1M 3M 12M
Absolute (%) 3.1 0.9 15.7 Relative^ (%) 1.5 -8.4 5.8
Enterprise value (HKDm) 61,804Free float (%) 23Market cap (USDm) 17,315Market cap (HKDm) 134,276
Source: HSBC
9 October 2013
Jenny Cosgrove* Head of Utilities & Alternative Energy Research, Asia Pacific The Hongkong and Shanghai Banking Corporation Limited +852 2996 6619 [email protected]
Gloria Ho* Analyst The Hongkong and Shanghai Banking Corporation Limited +852 2996 6941 [email protected]
Ankit Gupta* Associate Bangalore View HSBC Global Research at: http://www.research.hsbc.com
*Employed by a non-US affiliate of HSBC Securities (USA) Inc, and is not registered/qualified pursuant to FINRA regulations
Issuer of report: The Hongkong and Shanghai Banking Corporation Limited
Disclaimer & Disclosures This report must be read with the disclosures and the analyst certifications in the Disclosure appendix, and with the Disclaimer, which forms part of it
2
Cheung Kong Infra (1038 HK) Electric Utilities 9 October 2013
abc
Financials & valuation Financial statements
Year to 12/2012a 12/2013e 12/2014e 12/2015e
Profit & loss summary (HKDm)
Revenue 4,105 4,923 5,500 5,629EBITDA 1,077 1,325 1,427 1,498Depreciation & amortisation -54 -143 -188 -192Operating profit/EBIT 1,023 1,182 1,239 1,306Net interest -327 -333 -486 -498PBT 9,399 10,697 10,019 10,442HSBC PBT 9,399 10,697 10,019 10,442Taxation 19 -5 0 -3Net profit 9,425 10,687 10,016 10,435HSBC net profit 9,103 10,338 10,138 10,435
Cash flow summary (HKDm)
Cash flow from operations 5,544 6,223 6,071 6,191Capex -680 -172 -218 -218Cash flow from investment 271 1,770 3,903 3,978Dividends -4,359 -5,036 -5,622 -5,838Change in net debt -4,388 900 -128 534FCF equity 501 872 942 840
Balance sheet summary (HKDm)
Intangible fixed assets 0 2,479 2,479 2,479Tangible fixed assets 1,477 1,507 1,537 1,563Current assets 8,191 7,497 7,891 7,547Cash & others 6,980 6,196 6,452 6,065Total assets 88,542 95,543 101,099 106,627Operating liabilities 3,766 3,943 4,293 4,395Gross debt 11,113 11,230 11,357 11,504Net debt 4,133 5,034 4,906 5,439Shareholders funds 73,292 79,994 85,068 90,344Invested capital 71,337 78,946 83,894 89,708
Ratio, growth and per share analysis
Year to 12/2012a 12/2013e 12/2014e 12/2015e
Y-o-y % change
Revenue 17.5 19.9 11.7 2.3EBITDA 16.8 23.0 7.7 5.0Operating profit 19.9 15.6 4.8 5.4PBT 21.3 13.8 -6.3 4.2HSBC EPS 14.5 9.1 -1.9 2.9
Ratios (%)
Revenue/IC (x) 0.6 0.6 0.6 0.5ROIC 15.0 15.1 13.9 13.4ROE 13.7 13.5 12.3 11.9ROA 12.3 12.5 11.1 10.9EBITDA margin 26.2 26.9 25.9 26.6Operating profit margin 24.9 24.0 22.5 23.2EBITDA/net interest (x) 3.3 4.0 2.9 3.0Net debt/equity 5.6 6.3 5.8 6.0Net debt/EBITDA (x) 3.8 3.8 3.4 3.6CF from operations/net debt 134.1 123.7 123.8 113.8
Per share data (HKD)
EPS reported (fully diluted) 3.93 4.28 4.01 4.18HSBC EPS (fully diluted) 3.80 4.14 4.06 4.18DPS 1.66 2.01 2.05 2.13Book value 29.37 32.05 34.08 36.20
Valuation data
Year to 12/2012a 12/2013e 12/2014e 12/2015e
EV/sales 16.1 12.6 10.3 9.1EV/EBITDA 61.4 46.6 39.6 34.2EV/IC 0.9 0.8 0.7 0.6PE* 14.2 13.0 13.2 12.9P/Book value 1.8 1.7 1.6 1.5FCF yield (%) 0.8 1.5 1.8 1.8Dividend yield (%) 3.1 3.7 3.8 4.0
Note: * = Based on HSBC EPS (fully diluted)
Price relative
Source: HSBC Note: price at close of 07 Oct 2013
31
36
41
46
51
56
61
66
31
36
41
46
51
56
61
66
2011 2012 2013 2014Cheung Kong Infrastructur Rel to HANG SENG INDEX
3
Cheung Kong Infra (1038 HK) Electric Utilities 9 October 2013
abc
No place to hide
CKI has invested HKD28.5bn in associates over
the last three years (mainly in UK assets) –
summarised in the Appendix. The UK associates
contributed 49% to the CKI’s earnings in
2012.The effective contribution is 62% after
including its ownership interest in Power Assets
Holdings (PAH) who jointly owns a number of
UK assets. Due to the use of associate accounting,
this significant investment is disclosed through
only four lines of CKI’s financial statements.
Regulatory disclosures
We have reviewed the recently released regulatory accounts of
the CKI’s UK associates for the year ending March 2013
In FY13, UKPN has continued to improve its margins and
cash flows
Stable performance of NGN and NWG continues, with scope for
improvement at WWU which was acquired last year
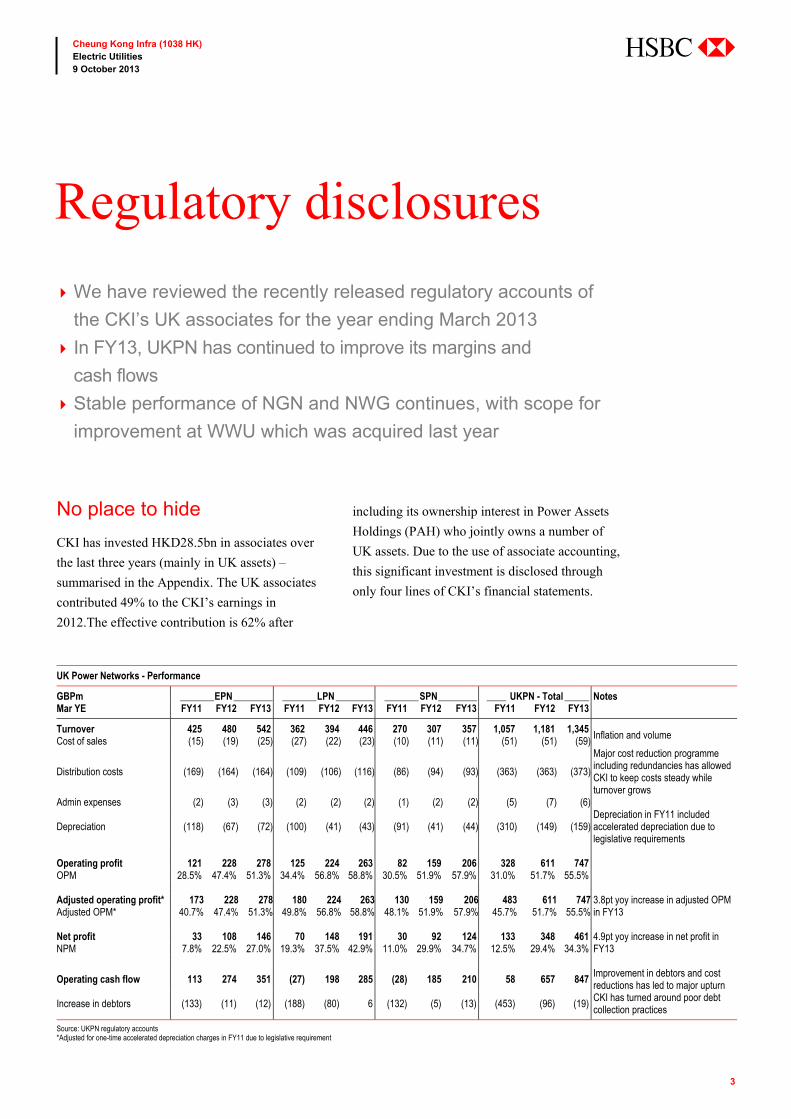
UK Power Networks - Performance
GBPm _______ EPN ________ _______ LPN ________ _______ SPN ________ ____ UKPN - Total _____ Notes Mar YE FY11 FY12 FY13 FY11 FY12 FY13 FY11 FY12 FY13 FY11 FY12 FY13
Turnover 425 480 542 362 394 446 270 307 357 1,057 1,181 1,345 Inflation and volume Cost of sales (15) (19) (25) (27) (22) (23) (10) (11) (11) (51) (51) (59)
Distribution costs (169) (164) (164) (109) (106) (116) (86) (94) (93) (363) (363) (373)
Major cost reduction programme including redundancies has allowed CKI to keep costs steady while turnover grows
Admin expenses (2) (3) (3) (2) (2) (2) (1) (2) (2) (5) (7) (6)
Depreciation (118) (67) (72) (100) (41) (43) (91) (41) (44) (310) (149) (159)Depreciation in FY11 included accelerated depreciation due to legislative requirements
Operating profit 121 228 278 125 224 263 82 159 206 328 611 747
OPM 28.5% 47.4% 51.3% 34.4% 56.8% 58.8% 30.5% 51.9% 57.9% 31.0% 51.7% 55.5% Adjusted operating profit* 173 228 278 180 224 263 130 159 206 483 611 747 3.8pt yoy increase in adjusted OPM
in FY13 Adjusted OPM* 40.7% 47.4% 51.3% 49.8% 56.8% 58.8% 48.1% 51.9% 57.9% 45.7% 51.7% 55.5% Net profit 33 108 146 70 148 191 30 92 124 133 348 461 4.9pt yoy increase in net profit in
FY13 NPM 7.8% 22.5% 27.0% 19.3% 37.5% 42.9% 11.0% 29.9% 34.7% 12.5% 29.4% 34.3%
Operating cash flow 113 274 351 (27) 198 285 (28) 185 210 58 657 847 Improvement in debtors and cost reductions has led to major upturn
Increase in debtors (133) (11) (12) (188) (80) 6 (132) (5) (13) (453) (96) (19) CKI has turned around poor debt collection practices
Source: UKPN regulatory accounts *Adjusted for one-time accelerated depreciation charges in FY11 due to legislative requirement
4
Cheung Kong Infra (1038 HK) Electric Utilities 9 October 2013
abc
However, UK regulators – Ofgem (Office of Gas &
Electricity Markets) and Ofwat (Office of Water
Services) – require full financial statements from
the regulated businesses to be publically released.
We have reviewed and analysed the recently
released regulatory accounts of the Cheung Kong
Group’s UK associates for the year ending
March 2013.
UK Power Networks
FY13 result was strong which highlights a 3.8pt
y-o-y increase in operating profits, as costs remain
stable on higher turnover and a significant
increase in cash flow.
Good cost control
UK Power Networks’ (UKPN) regulatory
accounts show strong cost control and rising
turnover (due to inflation and volumes) in FY13,
which led to a 3.8pt expansion in the operating
profit margin.
Distribution costs (excluding depreciation) as a % of
turnover decreased from 34.4% in FY11 to 27.7% in
FY13. Moving this ratio by so much is a very strong
performance from a stable regulated utility.
In 2011, there was a one-time accelerated
depreciation charge following the legislative
requirement for energy suppliers to replace
domestic meters with smart meters by 2020. In
2012, earnings increased substantially as
depreciation returned to a more sustainable level.
Cash flow improvement
CKI has also overhauled the poor debt collection
practices of UKPN, with the addition in debtors
decreasing from GBP453m in FY11 to GBP19m
in FY13. Improvement in debtors combined with
cost reduction and increase in profitability have
led to large upturn in cash flow from operating
activities, which increased from GBP58m in
FY11 to GBP847m in FY13. In FY13, cash flow
from operating activities increased by 29%.
Asset description
UKPN owns, operates and manages three of the
14 regulated electricity distribution networks in
the UK – the London, the South East and the East
of England – spanning a total length of
186,000km. It is one of the largest electricity
distribution network owners in the country, with
service area of 30,000 sq km and over 8m
connected customers. CKI and PAH each own a
40% interest in the company.
Northern Gas Networks
Stable margins and cash flows
Northern Gas Networks (NGN) has generated
stable margins and cash flows over the last three
years. Reported operating and net profit declined
in FY12 primarily due to exceptional restructuring
cost of GBP11.9m (GBP8.9m post-tax) related to
the organisational structure following the
acquisition of Northern Gas Networks Operations
in 2010 to realign core activities and remove
duplication. This restructuring resulted in
efficiency gains for the company in FY13 with
adjusted OPM increasing 1.5% mainly through
voluntary severance programme.
The company has also generated a steady cash
flow of GBP125-140m from operating activities
over the last three years.
5
Cheung Kong Infra (1038 HK) Electric Utilities 9 October 2013
abc
Northern Gas Networks - Performance
Mar YE (GBPm) FY11 FY12 FY13
Turnover 341 353 385 Operating profit – reported 87 75 101 OPM 25.4% 21.3% 26.2% Adjusted operating profit 87 87 101 Adjusted OPM 25.4% 24.7% 26.2% Net profit - reported 24 13 28 NPM 7.0% 3.6% 7.3% Adjusted net profit 24 22 28 Adjusted NPM 7.0% 6.1% 7.3%
Operating cash flow 125 140 133
Source: NGN regulatory accounts
Asset description
NGN operates, maintains, repairs and develops
the North of England – one of the eight gas
distribution networks – in the UK. The company
covers a service area of 25,000 sq km serving
6.7m customers with a gas pipeline network of
37,000km. CKI and PAH own 47.1% and 41.3%
interest in NGN, respectively.
Wales & West Utilities
Scope for improvement
Wales & West Utilities (WWU) has been
reporting a net loss under the UK GAAP (due to
non-cash mark-to-market impact on derivative
instruments), although magnitude of loss declined
in FY13.
Cheung Kong Group acquired WWU in July 2012
and it contributed 2.5 months of earnings to the
group. It is too early to assess the impact of
Cheung Kong Group on the performance of
WWU, but given the good track record in turning
around regulated assets, we expect to see some
improvement in WWU’s profitability and
cash flows.
Wales & West Utilities - Performance
Mar YE (GBPm) FY11 FY12 FY13
Turnover 313 351 372
Operating profit 51 66 60 OPM 16.4% 18.7% 16.0%
Net profit (115) (120) (103) NPM -36.6% -34.1% -27.8%
Operating cash flow 117 116 92
Source: WWU regulatory accounts
Asset description
WWU is also one of the eight major gas distribution
networks in the UK serving 7.5m customers in the
Wales and the South West of England. The
company covers an area of 42,000 sq km with a
pipeline network of 35,000km. CKI and PAH each
own a 30% interest in the company.
Northumbrian Water Group
The big water asset
Northumbrian Water Group (NWG) is another
large and stable UK asset acquired by the Cheung
Kong Group in October 2011. NWG was the
second largest contributor to CKI’s UK earnings
in 2012 after UKPN. The below table shows the
financials for Northumbrian Water Limited
(NWL), which doesn’t include the small
unregulated business of NWG. Operating margin
of NWL has been stable while net profit margin
declined from FY12 to FY13 due to an increase in
the effective tax rate owing to certain adjustments.
6
Cheung Kong Infra (1038 HK) Electric Utilities 9 October 2013
abc
Northumbrian Water Limited - Performance
Mar YE FY11 FY12 FY13
Turnover 681 729 757 Operating profit 280 319 329OPM 41.2% 43.7% 43.5% Net profit 154 143 150NPM 22.6% 19.5% 19.8%Source: MWL regulatory accounts
Asset description
NWG is one of the ten regulated water and
sewerage companies in England and Wales.
It supplies drinking water to 4.5m people in the
North East and South East of England and collects
and treats wastewater from 2.7m people in the
North East with a network comprising 25,500km
of mains and 29,700km of sewers. It also owns a
number of special purpose water and waste
companies as a part of its unregulated business.
CKI owns a 40% interest in NWG.
Level of tax paid by UK assets
The regulatory accounts show the effective tax
rates of CKI’s regulated assets. Investors appear
to see the tax relief in the UK as a risk for CKI.
This risk has heightened since, as reported by The
Australian on 3 October 2013, the Federal Court has
upheld the Australian Tax Office that CKI should
pay back AUD380m – an amount that included
unpaid income tax from 2000 to 2009, as well as
penalties for not lodging documents and interest,
which have continued to accrue. In 2012, CKI paid
AUD58m to the Australian Tax Office, being an
amount equivalent to 50% of the tax in dispute
regarding the deductibility of certain fees paid.
The table below shows that CKI has achieved the
majority of the tax relief in the UK through
UKPN (and WWU, but this has an unusual
structure because deferred tax assets are not
recognized as there is insufficient evidence that
the assets will be recoverable).
Hypothetically, if UKPN were at a 26%/24%
effective tax rate in FY12/13 (end-March), then
net profit would have been reduced by 21% or
GBP100m. This would be equivalent to 5% of
CKI’s 2012 reported net profit (i.e. GBP100m x
FX rate of 12.35 x 40% (UKPN’s stake) =
HKD494m, which is 5% of reported 2012 net
profit of HKD9,425m.
Corporate tax rate comparison
FY11 FY12 FY13
Statutory UK tax rate 28.0% 26.0% 24.0%
Effective tax rates EPN -56.8% -10.3% -7.0% LPN 7.8% 6.7% 6.0% SPN -19.8% 1.3% 6.0% UKPN -9.0% 0.5% 2.2% NGN 17.5% 4.7% 25.9% WWU 6.0% 6.0% 6.2% NWG 14.9% 35.8% 30.0%
Effective current year tax rates (excluding deferred tax) EPN 73.0% 6.5% 8.9% LPN 30.5% 5.3% 6.8% SPN 46.6% 0.5% 3.4% UKPN 41.2% 4.4% 6.5% NGN 32.4% 60.0% 32.3% WWU 6.0% 6.0% 6.2% NWG 19.7% 18.8% 24.6%
Source: Regulatory accounts
7
Cheung Kong Infra (1038 HK) Electric Utilities 9 October 2013
abc
UK vs HK earnings
In this section, we do some forensic accounting,
comparing the UK regulatory accounts (recently
released for year ending March FY13) to CKI’s
associate accounting.
Our conclusions are:
earnings reported in HK from the UK assets
are substantially higher than the earnings
reported in the UK regulatory accounts
the earnings difference is largely due to
accounting differences but this does not fully
explain the gap
the accounting differences are a major reason
why the dividend payout from non-PAH
associates was relatively low at 32% of
earnings in FY12 (we forecast an increase to
35% in FY13e on stronger cash flows).
Because of the low dividend payout from
associate, CKI has high earnings coverage
(2.5x) but a low cash coverage (1.2x)
Because earnings are inflated into Hong Kong,
CKI’s UK assets should trade with a lower PE.
In our SOTP valuation on page 11, the implied
FY14e PE for the UK assets is 8.4x. Our
valuation compared to the earnings reported in
the UK would imply a PE of 12.7x.
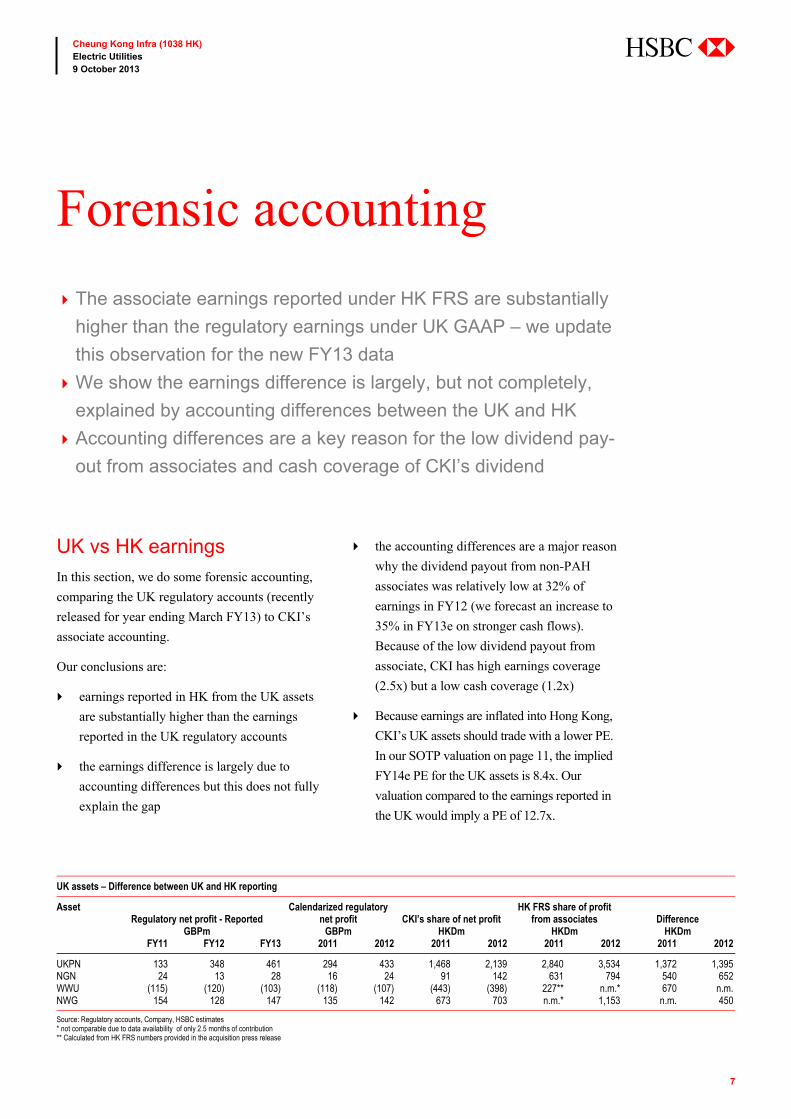
Forensic accounting
The associate earnings reported under HK FRS are substantially
higher than the regulatory earnings under UK GAAP – we update
this observation for the new FY13 data
We show the earnings difference is largely, but not completely,
explained by accounting differences between the UK and HK
Accounting differences are a key reason for the low dividend pay-
out from associates and cash coverage of CKI’s dividend
UK assets – Difference between UK and HK reporting
Asset Regulatory net profit - Reported
Calendarized regulatory net profit
CKI’s share of net profit
HK FRS share of profit from associates
Difference
GBPm GBPm HKDm HKDm HKDm FY11 FY12 FY13 2011 2012 2011 2012 2011 2012 2011 2012
UKPN 133 348 461 294 433 1,468 2,139 2,840 3,534 1,372 1,395NGN 24 13 28 16 24 91 142 631 794 540 652WWU (115) (120) (103) (118) (107) (443) (398) 227** n.m.* 670 n.m.NWG 154 128 147 135 142 673 703 n.m.* 1,153 n.m. 450
Source: Regulatory accounts, Company, HSBC estimates * not comparable due to data availability of only 2.5 months of contribution ** Calculated from HK FRS numbers provided in the acquisition press release
8
Cheung Kong Infra (1038 HK) Electric Utilities 9 October 2013
abc
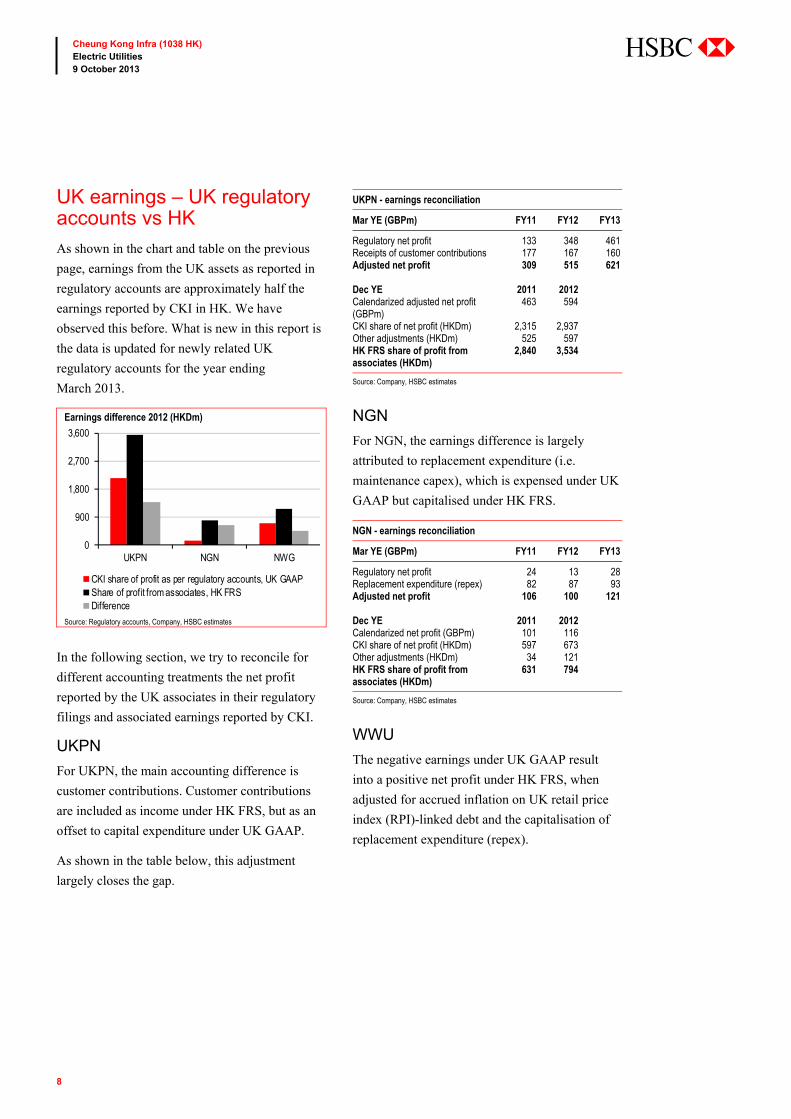
UK earnings – UK regulatory accounts vs HK
As shown in the chart and table on the previous
page, earnings from the UK assets as reported in
regulatory accounts are approximately half the
earnings reported by CKI in HK. We have
observed this before. What is new in this report is
the data is updated for newly related UK
regulatory accounts for the year ending
March 2013.
Earnings difference 2012 (HKDm)
Source: Regulatory accounts, Company, HSBC estimates
In the following section, we try to reconcile for
different accounting treatments the net profit
reported by the UK associates in their regulatory
filings and associated earnings reported by CKI.
UKPN
For UKPN, the main accounting difference is
customer contributions. Customer contributions
are included as income under HK FRS, but as an
offset to capital expenditure under UK GAAP.
As shown in the table below, this adjustment
largely closes the gap.
UKPN - earnings reconciliation
Mar YE (GBPm) FY11 FY12 FY13
Regulatory net profit 133 348 461 Receipts of customer contributions 177 167 160 Adjusted net profit 309 515 621
Dec YE 2011 2012 Calendarized adjusted net profit (GBPm)
463 594
CKI share of net profit (HKDm) 2,315 2,937 Other adjustments (HKDm) 525 597 HK FRS share of profit from associates (HKDm)
2,840 3,534
Source: Company, HSBC estimates
NGN
For NGN, the earnings difference is largely
attributed to replacement expenditure (i.e.
maintenance capex), which is expensed under UK
GAAP but capitalised under HK FRS.
NGN - earnings reconciliation
Mar YE (GBPm) FY11 FY12 FY13
Regulatory net profit 24 13 28 Replacement expenditure (repex) 82 87 93 Adjusted net profit 106 100 121
Dec YE 2011 2012 Calendarized net profit (GBPm) 101 116 CKI share of net profit (HKDm) 597 673 Other adjustments (HKDm) 34 121 HK FRS share of profit from associates (HKDm)
631 794
Source: Company, HSBC estimates
WWU
The negative earnings under UK GAAP result
into a positive net profit under HK FRS, when
adjusted for accrued inflation on UK retail price
index (RPI)-linked debt and the capitalisation of
replacement expenditure (repex).
0
900
1,800
2,700
3,600
UKPN NGN NWG
CKI share of profit as per regulatory accounts, UK GAAPShare of profit from associates, HK FRSDifference
9
Cheung Kong Infra (1038 HK) Electric Utilities 9 October 2013
abc
WWU - earnings reconciliation
Mar YE (GBPm) FY11 FY12 FY13
Regulatory net profit (115) (120) (103) Replacement expenditure (repex) 80 97 97 Accrued inflation on UK RPI linked debt 56 69 38 Adjusted net profit 21 47 32 Dec YE 2011 2012 Calendarized net profit (GBPm) 40 36 CKI share of net profit (HKDm) 151 133 Other adjustments (HKDm) 76 n.m.* HK FRS share of profit from associates (HKDm)
227** n.m.*
Source: Company, HSBC estimates * not comparable due to data availability of only 2.5 months of contribution ** Calculated from HK FRS numbers provided in the acquisition press release
NWG
The difference in reported earnings is less
material for NWG than other assets.
One accounting difference for NWG is an
infrastructure renewal charge which is capitalized
under HK FRS. Adjusting for this, the two sets of
earnings are relatively consistent.
NWG - earnings reconciliation
Mar YE (GBPm) FY11 FY12 FY13
Regulatory net profit 154 128 147 Infrastructure renewals charge 41 45 50 Adjusted net profit 195 174 197 Dec YE 2011 2012 Calendarized net profit (GBPm) 179 191 CKI share of net profit (HKDm) 893 944 Other adjustments (HKDm) n.m.* 209 HK FRS share of profit from associates (HKDm)
n.m.* 1,153
Source: Company, HSBC estimates * not comparable due to data availability of only 2.5months of contribution
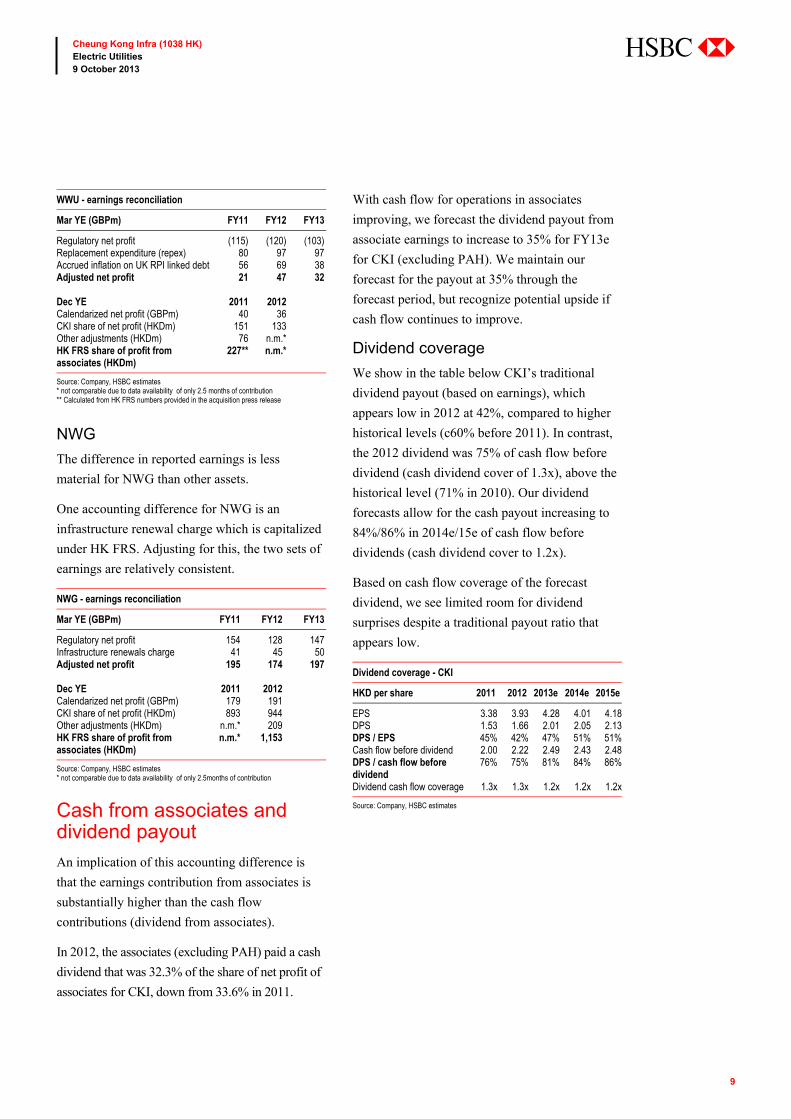
Cash from associates and dividend payout
An implication of this accounting difference is
that the earnings contribution from associates is
substantially higher than the cash flow
contributions (dividend from associates).
In 2012, the associates (excluding PAH) paid a cash
dividend that was 32.3% of the share of net profit of
associates for CKI, down from 33.6% in 2011.
With cash flow for operations in associates
improving, we forecast the dividend payout from
associate earnings to increase to 35% for FY13e
for CKI (excluding PAH). We maintain our
forecast for the payout at 35% through the
forecast period, but recognize potential upside if
cash flow continues to improve.
Dividend coverage
We show in the table below CKI’s traditional
dividend payout (based on earnings), which
appears low in 2012 at 42%, compared to higher
historical levels (c60% before 2011). In contrast,
the 2012 dividend was 75% of cash flow before
dividend (cash dividend cover of 1.3x), above the
historical level (71% in 2010). Our dividend
forecasts allow for the cash payout increasing to
84%/86% in 2014e/15e of cash flow before
dividends (cash dividend cover to 1.2x).
Based on cash flow coverage of the forecast
dividend, we see limited room for dividend
surprises despite a traditional payout ratio that
appears low.
Dividend coverage - CKI
HKD per share 2011 2012 2013e 2014e 2015e
EPS 3.38 3.93 4.28 4.01 4.18DPS 1.53 1.66 2.01 2.05 2.13DPS / EPS 45% 42% 47% 51% 51%Cash flow before dividend 2.00 2.22 2.49 2.43 2.48DPS / cash flow before dividend
76% 75% 81% 84% 86%
Dividend cash flow coverage 1.3x 1.3x 1.2x 1.2x 1.2x
Source: Company, HSBC estimates
10
Cheung Kong Infra (1038 HK) Electric Utilities 9 October 2013
abc
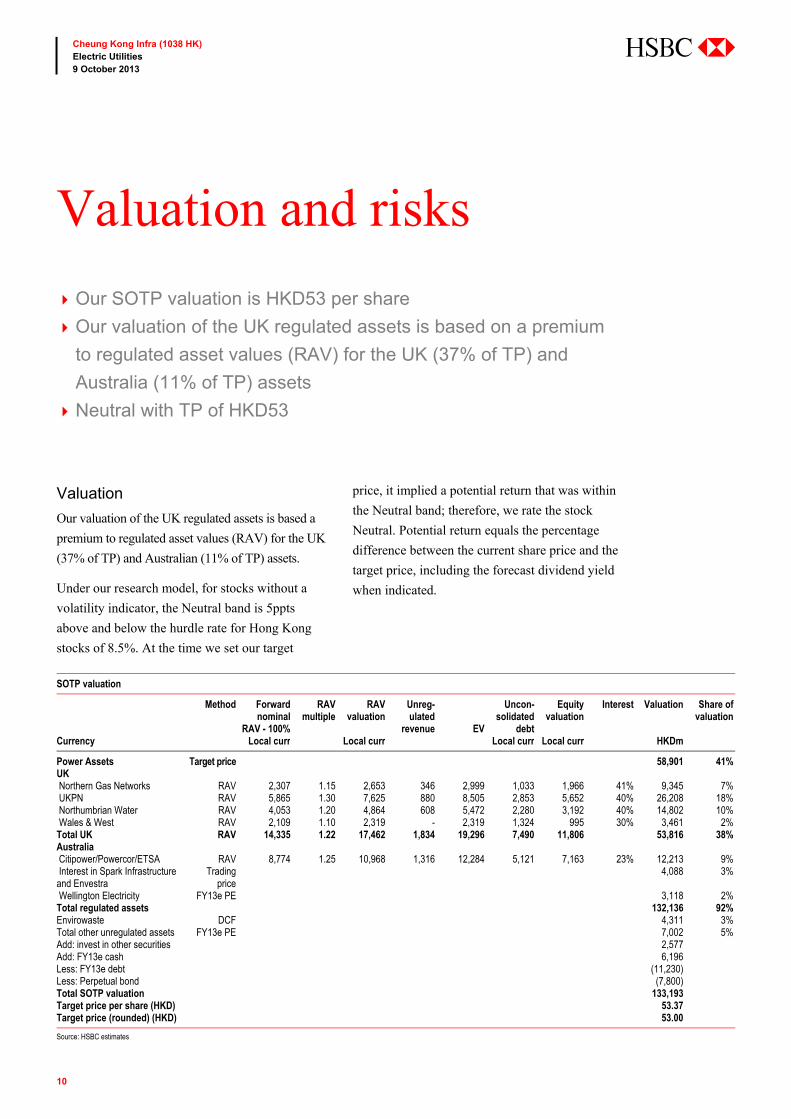
Valuation
Our valuation of the UK regulated assets is based a
premium to regulated asset values (RAV) for the UK
(37% of TP) and Australian (11% of TP) assets.
Under our research model, for stocks without a
volatility indicator, the Neutral band is 5ppts
above and below the hurdle rate for Hong Kong
stocks of 8.5%. At the time we set our target
price, it implied a potential return that was within
the Neutral band; therefore, we rate the stock
Neutral. Potential return equals the percentage
difference between the current share price and the
target price, including the forecast dividend yield
when indicated.
SOTP valuation
Method Forward nominal
RAV - 100%
RAV multiple
RAV valuation
Unreg-ulated
revenue EV
Uncon-solidated
debt
Equity valuation
Interest Valuation Share of valuation
Currency Local curr Local curr Local curr Local curr HKDm
Power Assets Target price 58,901 41%UK Northern Gas Networks RAV 2,307 1.15 2,653 346 2,999 1,033 1,966 41% 9,345 7% UKPN RAV 5,865 1.30 7,625 880 8,505 2,853 5,652 40% 26,208 18% Northumbrian Water RAV 4,053 1.20 4,864 608 5,472 2,280 3,192 40% 14,802 10% Wales & West RAV 2,109 1.10 2,319 - 2,319 1,324 995 30% 3,461 2%Total UK RAV 14,335 1.22 17,462 1,834 19,296 7,490 11,806 53,816 38%Australia Citipower/Powercor/ETSA RAV 8,774 1.25 10,968 1,316 12,284 5,121 7,163 23% 12,213 9% Interest in Spark Infrastructure and Envestra
Trading price
4,088 3%
Wellington Electricity FY13e PE 3,118 2%Total regulated assets 132,136 92%Envirowaste DCF 4,311 3%Total other unregulated assets FY13e PE 7,002 5%Add: invest in other securities 2,577Add: FY13e cash 6,196Less: FY13e debt (11,230)Less: Perpetual bond (7,800)Total SOTP valuation 133,193Target price per share (HKD) 53.37Target price (rounded) (HKD) 53.00
Source: HSBC estimates
Valuation and risks
Our SOTP valuation is HKD53 per share
Our valuation of the UK regulated assets is based on a premium
to regulated asset values (RAV) for the UK (37% of TP) and
Australia (11% of TP) assets
Neutral with TP of HKD53

11
Cheung Kong Infra (1038 HK) Electric Utilities 9 October 2013
abc
Risks
Upside risks: a large and value-accretive
acquisition and dividend surprises.
Downside risk: regulatory resets that reduce the
allowed return on equity.
12
Cheung Kong Infra (1038 HK) Electric Utilities 9 October 2013
abc
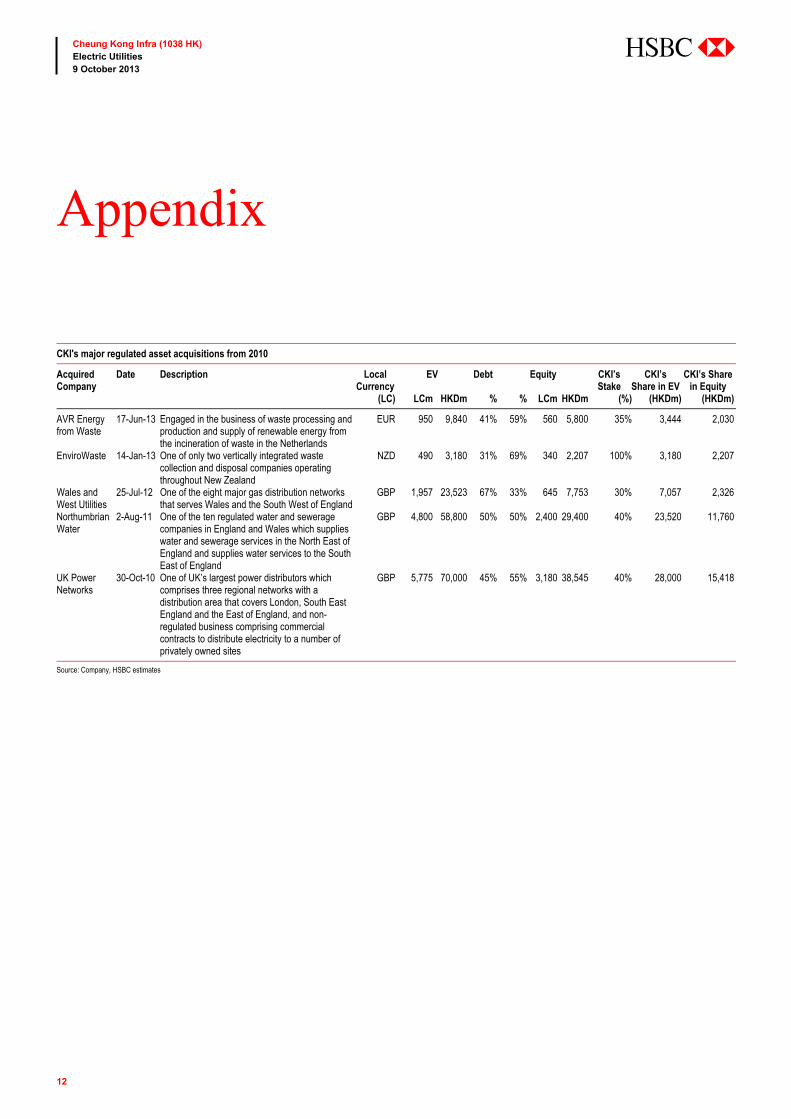
Appendix
CKI's major regulated asset acquisitions from 2010
Acquired Company
Date Description Local Currency
EV Debt Equity CKI’s Stake
CKI’s Share in EV
CKI’s Share in Equity
(LC) LCm HKDm % % LCm HKDm (%) (HKDm) (HKDm)
AVR Energy from Waste
17-Jun-13 Engaged in the business of waste processing and production and supply of renewable energy from the incineration of waste in the Netherlands
EUR 950 9,840 41% 59% 560 5,800 35% 3,444 2,030
EnviroWaste 14-Jan-13 One of only two vertically integrated waste collection and disposal companies operating throughout New Zealand
NZD 490 3,180 31% 69% 340 2,207 100% 3,180 2,207
Wales and West Utilities
25-Jul-12 One of the eight major gas distribution networks that serves Wales and the South West of England
GBP 1,957 23,523 67% 33% 645 7,753 30% 7,057 2,326
Northumbrian Water
2-Aug-11 One of the ten regulated water and sewerage companies in England and Wales which supplies water and sewerage services in the North East of England and supplies water services to the South East of England
GBP 4,800 58,800 50% 50% 2,400 29,400 40% 23,520 11,760
UK Power Networks
30-Oct-10 One of UK’s largest power distributors whichcomprises three regional networks with a distribution area that covers London, South East England and the East of England, and non-regulated business comprising commercial contracts to distribute electricity to a number of privately owned sites
GBP 5,775 70,000 45% 55% 3,180 38,545 40% 28,000 15,418
Source: Company, HSBC estimates
13
Cheung Kong Infra (1038 HK) Electric Utilities 9 October 2013
abc
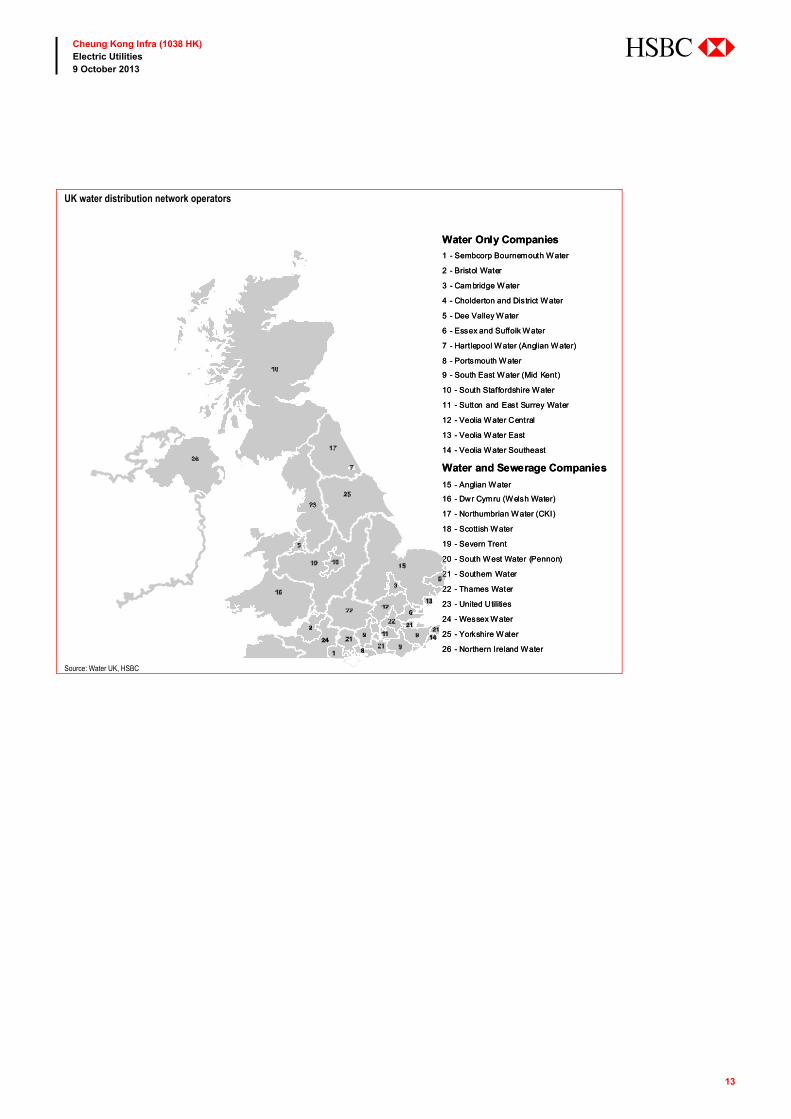
UK water distribution network operators
Source: Water UK, HSBC
Water Only Companies
1 - Sembcorp Bournemouth Water
2 - Bristol Water
3 - Cambridge Water
4 - Cholderton and District Water
5 - Dee Valley Water
6 - Essex and Suffolk Water
7 - Hartlepool Water (Anglian Water)
8 - Portsmouth Water
9 - South East Water (Mid Kent)
10 - South Staffordshire Water
11 - Sutton and East Surrey Water
12 - Veolia Water Central
13 - Veolia Water East
14 - Veolia Water Southeast
Water and Sewerage Companies
15 - Anglian Water
16 - Dwr Cymru (Welsh Water)
17 - Northumbrian Water (CKI)
18 - Scottish Water
19 - Severn Trent
20 - South West Water (Pennon)
21 - Southern Water
22 - Thames Water
23 - United Utilities
24 - Wessex Water
25 - Yorkshire Water
26 - Northern Ireland Water
14
Cheung Kong Infra (1038 HK) Electric Utilities 9 October 2013
abc
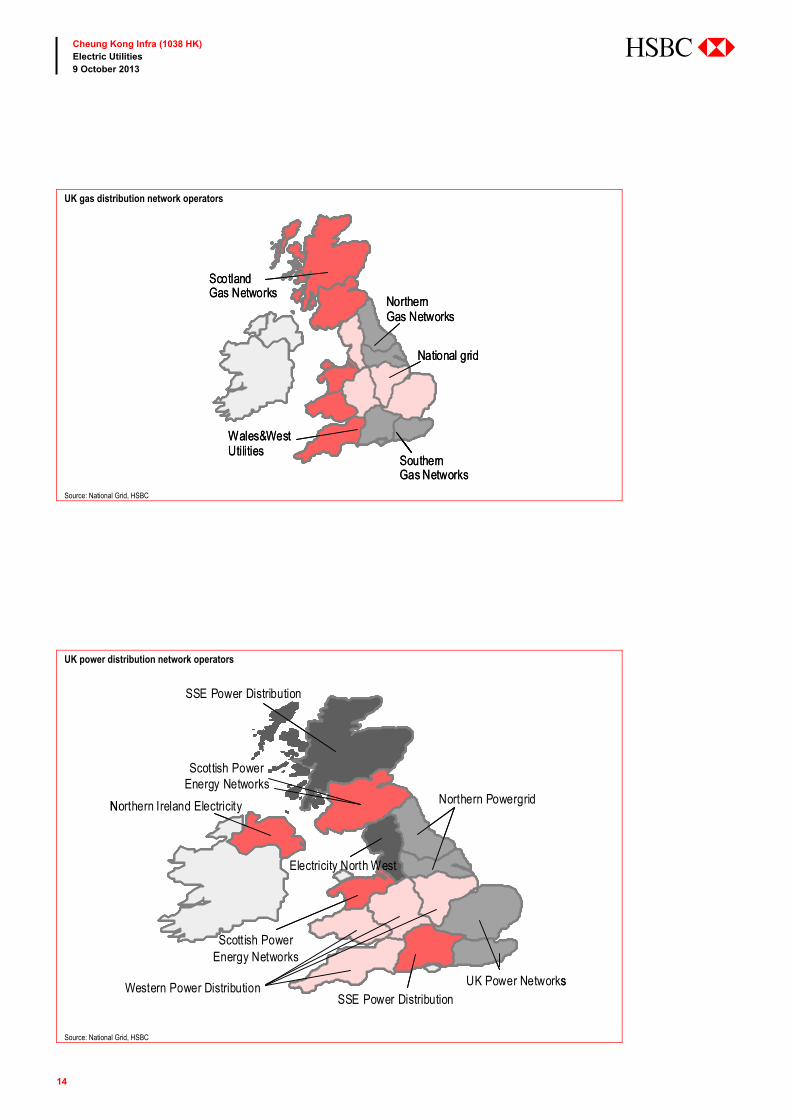
UK gas distribution network operators
Source: National Grid, HSBC
UK power distribution network operators
Source: National Grid, HSBC
NorthernGas Networks
SouthernGas Networks
ScotlandGas Networks
National grid
Wales&WestUtilities
NorthernGas Networks
SouthernGas Networks
ScotlandGas Networks
National grid
Wales&WestUtilities
SSE Power Distribution
CE Electric UK
SSE Power Distribution
Scottish PowerEnergy Networks
Electr icity
enwe-on
eDFENERGYnetworks
Scottish PowerEnergy Networks
Western Power Distribution
SSE Power Distribution
CE Electric UK
SSE Power Distribution
Scottish PowerEnergy Networks
Electr icity
ENW
E.ON Central Networks
EDFEnergyNetworks
Scottish PowerEnergy Networks
Western Power Distribution
SSE Power Distribution
CE Electric UK
SSE Power Distribution
Scottish PowerEnergy Networks
Electr icity
enwe-on
eDFENERGYnetworks
Scottish PowerEnergy Networks
Western Power Distribution
SSE Power Distribution
Northern Powergrid
SSE Power Distribution
Scottish PowerEnergy Networks
UK Power Networks
Scottish PowerEnergy Networks
Western Power Distribution
Northern Ireland Electricity
Electricity North West
SSE Power Distribution
CE Electric UK
SSE Power Distribution
Scottish PowerEnergy Networks
Electr icity
enwe-on
eDFENERGYnetworks
Scottish PowerEnergy Networks
Western Power Distribution
SSE Power Distribution
CE Electric UK
SSE Power Distribution
Scottish PowerEnergy Networks
Electr icity
ENW
E.ON Central Networks
EDFEnergyNetworks
Scottish PowerEnergy Networks
Western Power Distribution
SSE Power Distribution
CE Electric UK
SSE Power Distribution
Scottish PowerEnergy Networks
Electr icity
enwe-on
eDFENERGYnetworks
Scottish PowerEnergy Networks
Western Power Distribution
SSE Power Distribution
Northern Powergrid
SSE Power Distribution
Scottish PowerEnergy Networks
UK Power Networks
Scottish PowerEnergy Networks
Western Power Distribution
Northern Ireland Electricity
Electricity North West
15
Cheung Kong Infra (1038 HK) Electric Utilities 9 October 2013
abc
Disclosure appendix Analyst Certification The following analyst(s), economist(s), and/or strategist(s) who is(are) primarily responsible for this report, certifies(y) that the opinion(s) on the subject security(ies) or issuer(s) and/or any other views or forecasts expressed herein accurately reflect their personal view(s) and that no part of their compensation was, is or will be directly or indirectly related to the specific recommendation(s) or views contained in this research report: Jenny Cosgrove and Gloria Ho
Important disclosures
Equities: Stock ratings and basis for financial analysis
HSBC believes that investors utilise various disciplines and investment horizons when making investment decisions, which depend largely on individual circumstances such as the investor's existing holdings, risk tolerance and other considerations. Given these differences, HSBC has two principal aims in its equity research: 1) to identify long-term investment opportunities based on particular themes or ideas that may affect the future earnings or cash flows of companies on a 12 month time horizon; and 2) from time to time to identify short-term investment opportunities that are derived from fundamental, quantitative, technical or event-driven techniques on a 0-3 month time horizon and which may differ from our long-term investment rating. HSBC has assigned ratings for its long-term investment opportunities as described below.
This report addresses only the long-term investment opportunities of the companies referred to in the report. As and when HSBC publishes a short-term trading idea the stocks to which these relate are identified on the website at www.hsbcnet.com/research. Details of these short-term investment opportunities can be found under the Reports section of this website.
HSBC believes an investor's decision to buy or sell a stock should depend on individual circumstances such as the investor's existing holdings and other considerations. Different securities firms use a variety of ratings terms as well as different rating systems to describe their recommendations. Investors should carefully read the definitions of the ratings used in each research report. In addition, because research reports contain more complete information concerning the analysts' views, investors should carefully read the entire research report and should not infer its contents from the rating. In any case, ratings should not be used or relied on in isolation as investment advice.
Rating definitions for long-term investment opportunities
Stock ratings HSBC assigns ratings to its stocks in this sector on the following basis:
For each stock we set a required rate of return calculated from the cost of equity for that stock’s domestic or, as appropriate, regional market established by our strategy team. The price target for a stock represents the value the analyst expects the stock to reach over our performance horizon. The performance horizon is 12 months. For a stock to be classified as Overweight, the potential return, which equals the percentage difference between the current share price and the target price, including the forecast dividend yield when indicated, must exceed the required return by at least 5 percentage points over the next 12 months (or 10 percentage points for a stock classified as Volatile*). For a stock to be classified as Underweight, the stock must be expected to underperform its required return by at least 5 percentage points over the next 12 months (or 10 percentage points for a stock classified as Volatile*). Stocks between these bands are classified as Neutral.
Our ratings are re-calibrated against these bands at the time of any 'material change' (initiation of coverage, change of volatility status or change in price target). Notwithstanding this, and although ratings are subject to ongoing management review, expected returns will be permitted to move outside the bands as a result of normal share price fluctuations without necessarily triggering a rating change.
16
Cheung Kong Infra (1038 HK) Electric Utilities 9 October 2013
abc
*A stock will be classified as volatile if its historical volatility has exceeded 40%, if the stock has been listed for less than 12 months (unless it is in an industry or sector where volatility is low) or if the analyst expects significant volatility. However, stocks which we do not consider volatile may in fact also behave in such a way. Historical volatility is defined as the past month's average of the daily 365-day moving average volatilities. In order to avoid misleadingly frequent changes in rating, however, volatility has to move 2.5 percentage points past the 40% benchmark in either direction for a stock's status to change.
Rating distribution for long-term investment opportunities
As of 08 October 2013, the distribution of all ratings published is as follows: Overweight (Buy) 45% (33% of these provided with Investment Banking Services)
Neutral (Hold) 38% (34% of these provided with Investment Banking Services)
Underweight (Sell) 17% (25% of these provided with Investment Banking Services)
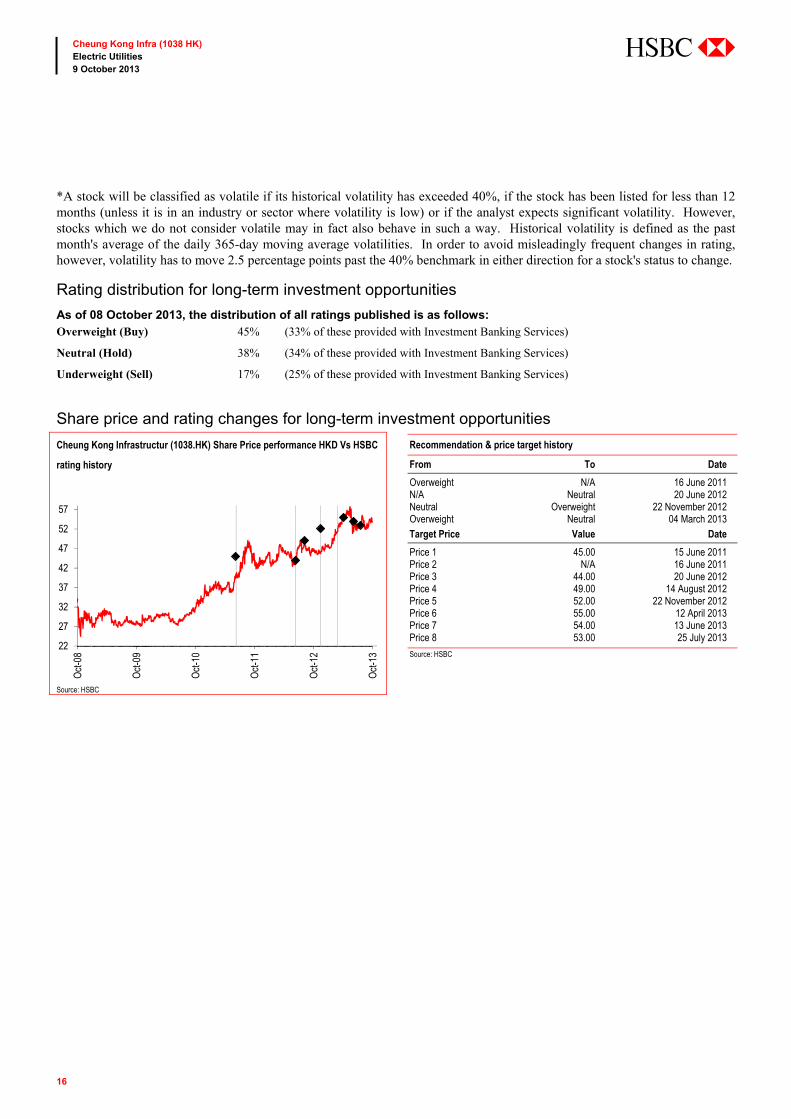
Share price and rating changes for long-term investment opportunities
Cheung Kong Infrastructur (1038.HK) Share Price performance HKD Vs HSBC
rating history
Recommendation & price target history
From To Date
Overweight N/A 16 June 2011 N/A Neutral 20 June 2012 Neutral Overweight 22 November 2012 Overweight Neutral 04 March 2013 Target Price Value Date
Price 1 45.00 15 June 2011 Price 2 N/A 16 June 2011 Price 3 44.00 20 June 2012 Price 4 49.00 14 August 2012 Price 5 52.00 22 November 2012 Price 6 55.00 12 April 2013 Price 7 54.00 13 June 2013 Price 8 53.00 25 July 2013
Source: HSBC
Source: HSBC
22
27
32
37
42
47
52
57
Oct
-08
Oct
-09
Oct
-10
Oct
-11
Oct
-12
Oct
-13
17
Cheung Kong Infra (1038 HK) Electric Utilities 9 October 2013
abc
HSBC & Analyst disclosures Disclosure checklist
Company Ticker Recent price Price Date Disclosure
CHEUNG KONG INFRASTRUCTUR 1038.HK 53.80 07-Oct-2013 1, 2, 5, 6, 7, 11Source: HSBC
1 HSBC has managed or co-managed a public offering of securities for this company within the past 12 months. 2 HSBC expects to receive or intends to seek compensation for investment banking services from this company in the next
3 months. 3 At the time of publication of this report, HSBC Securities (USA) Inc. is a Market Maker in securities issued by this
company. 4 As of 31 August 2013 HSBC beneficially owned 1% or more of a class of common equity securities of this company. 5 As of 31 August 2013, this company was a client of HSBC or had during the preceding 12 month period been a client of
and/or paid compensation to HSBC in respect of investment banking services. 6 As of 31 August 2013, this company was a client of HSBC or had during the preceding 12 month period been a client of
and/or paid compensation to HSBC in respect of non-investment banking securities-related services. 7 As of 31 August 2013, this company was a client of HSBC or had during the preceding 12 month period been a client of
and/or paid compensation to HSBC in respect of non-securities services. 8 A covering analyst/s has received compensation from this company in the past 12 months. 9 A covering analyst/s or a member of his/her household has a financial interest in the securities of this company, as
detailed below. 10 A covering analyst/s or a member of his/her household is an officer, director or supervisory board member of this
company, as detailed below. 11 At the time of publication of this report, HSBC is a non-US Market Maker in securities issued by this company and/or in
securities in respect of this company HSBC and its affiliates will from time to time sell to and buy from customers the securities/instruments (including derivatives) of companies covered in HSBC Research on a principal or agency basis.
Analysts, economists, and strategists are paid in part by reference to the profitability of HSBC which includes investment banking revenues.
For disclosures in respect of any company mentioned in this report, please see the most recently published report on that company available at www.hsbcnet.com/research.
Additional disclosures 1 This report is dated as at 09 October 2013. 2 All market data included in this report are dated as at close 07 October 2013, unless otherwise indicated in the report. 3 HSBC has procedures in place to identify and manage any potential conflicts of interest that arise in connection with its
Research business. HSBC's analysts and its other staff who are involved in the preparation and dissemination of Research operate and have a management reporting line independent of HSBC's Investment Banking business. Information Barrier procedures are in place between the Investment Banking and Research businesses to ensure that any confidential and/or price sensitive information is handled in an appropriate manner.
4 HSBC is acting as Joint Sponsor, Joint Global Co-ordinator and Joint Bookrunner regarding the proposed listing of Power Asset Holding's Hong Kong Electric assets.
18
Cheung Kong Infra (1038 HK) Electric Utilities 9 October 2013
abc
Disclaimer * Legal entities as at 8 August 2012 ‘UAE’ HSBC Bank Middle East Limited, Dubai; ‘HK’ The Hongkong and Shanghai Banking Corporation Limited, Hong Kong; ‘TW’ HSBC Securities (Taiwan) Corporation Limited; 'CA' HSBC Bank Canada, Toronto; HSBC Bank, Paris Branch; HSBC France; ‘DE’ HSBC Trinkaus & Burkhardt AG, Düsseldorf; 000 HSBC Bank (RR), Moscow; ‘IN’ HSBC Securities and Capital Markets (India) Private Limited, Mumbai; ‘JP’ HSBC Securities (Japan) Limited, Tokyo; ‘EG’ HSBC Securities Egypt SAE, Cairo; ‘CN’ HSBC Investment Bank Asia Limited, Beijing Representative Office; The Hongkong and Shanghai Banking Corporation Limited, Singapore Branch; The Hongkong and Shanghai Banking Corporation Limited, Seoul Securities Branch; The Hongkong and Shanghai Banking Corporation Limited, Seoul Branch; HSBC Securities (South Africa) (Pty) Ltd, Johannesburg; HSBC Bank plc, London, Madrid, Milan, Stockholm, Tel Aviv; ‘US’ HSBC Securities (USA) Inc, New York; HSBC Yatirim Menkul Degerler AS, Istanbul; HSBC México, SA, Institución de Banca Múltiple, Grupo Financiero HSBC; HSBC Bank Brasil SA – Banco Múltiplo; HSBC Bank Australia Limited; HSBC Bank Argentina SA; HSBC Saudi Arabia Limited; The Hongkong and Shanghai Banking Corporation Limited, New Zealand Branch incorporated in Hong Kong SAR
Issuer of report
The Hongkong and Shanghai Banking Corporation Limited Level 19, 1 Queen’s Road Central
Hong Kong SAR
Telephone: +852 2843 9111
Telex: 75100 CAPEL HX
Fax: +852 2596 0200
Website: www.research.hsbc.com
This document has been issued by The Hongkong and Shanghai Banking Corporation Limited (“HSBC”) in the conduct of its Hong Kong regulated business for the information of its institutional and professional investor (as defined by Securities and Future Ordinance (Chapter 571)) customers; it is not intended for and should not be distributed to retail customers in Hong Kong. The Hongkong and Shanghai Banking Corporation Limited is regulated by the Hong Kong Monetary Authority. All enquires by recipients in Hong Kong must be directed to your HSBC contact in Hong Kong. If it is received by a customer of an affiliate of HSBC, its provision to the recipient is subject to the terms of business in place between the recipient and such affiliate. This document is not and should not be construed as an offer to sell or the solicitation of an offer to purchase or subscribe for any investment. HSBC has based this document on information obtained from sources it believes to be reliable but which it has not independently verified; HSBC makes no guarantee, representation or warranty and accepts no responsibility or liability as to its accuracy or completeness. Expressions of opinion are those of the Research Division of HSBC only and are subject to change without notice. HSBC and its affiliates and/or their officers, directors and employees may have positions in any securities mentioned in this document (or in any related investment) and may from time to time add to or dispose of any such securities (or investment). HSBC and its affiliates may act as market maker or have assumed an underwriting commitment in the securities of companies discussed in this document (or in related investments), may sell them to or buy them from customers on a principal basis and may also perform or seek to perform investment banking or underwriting services for or relating to those companies. HSBC Securities (USA) Inc. accepts responsibility for the content of this research report prepared by its non-US foreign affiliate. All U.S. persons receiving and/or accessing this report and wishing to effect transactions in any security discussed herein should do so with HSBC Securities (USA) Inc. in the United States and not with its non-US foreign affiliate, the issuer of this report. In the UK this report may only be distributed to persons of a kind described in Article 19(5) of the Financial Services and Markets Act 2000 (FinancialPromotion) Order 2005. The protections afforded by the UK regulatory regime are available only to those dealing with a representative of HSBC Bank plc in the UK. In Singapore, this publication is distributed by The Hongkong and Shanghai Banking Corporation Limited, Singapore Branch for the general information of institutional investors or other persons specified in Sections 274 and 304 of the Securities and Futures Act (Chapter 289) (“SFA”) and accredited investors and other persons in accordance with the conditions specified in Sections 275 and 305 of the SFA. This publication is not a prospectus as defined in the SFA. It may not be further distributed in whole or in part for any purpose. The Hongkong and Shanghai Banking Corporation Limited Singapore Branch is regulated by the Monetary Authority of Singapore. Recipients in Singapore should contact a "Hongkong and Shanghai Banking Corporation Limited, Singapore Branch" representative in respect of any matters arising from, or in connection with this report. In Australia, this publication has been distributed by The Hongkong and Shanghai Banking Corporation Limited (ABN 65 117 925 970, AFSL 301737) for the general information of its “wholesale” customers (as defined in the Corporations Act 2001). Where distributed to retail customers, this research is distributed by HSBC Bank Australia Limited (AFSL No. 232595). These respective entities make no representations that the products or services mentioned in this document are available to persons in Australia or are necessarily suitable for any particular person or appropriate in accordance with local law. No consideration has been given to the particular investment objectives, financial situation or particular needs of any recipient. This publication is distributed in New Zealand by The Hongkong and Shanghai Banking Corporation Limited, New Zealand Branch incorporated in Hong Kong SAR. In Japan, this publication has been distributed by HSBC Securities (Japan) Limited. It may not be further distributed in whole or in part for any purpose. In Korea, this publication is distributed by The Hongkong and Shanghai Banking Corporation Limited, Seoul Securities Branch ("HBAP SLS") for the general information of professional investors specified in Article 9 of the Financial Investment Services and Capital Markets Act (“FSCMA”). This publication is not a prospectus as defined in the FSCMA. It may not be further distributed in whole or in part for any purpose. HBAP SLS is regulated by the Financial Services Commission and the Financial Supervisory Service of Korea. In Canada, this document has been distributed by HSBC Bank Canada and/or its affiliates. Where this document contains market updates/overviews, or similar materials (collectively deemed “Commentary” in Canada although other affiliate jurisdictions may term “Commentary” as either “macro-research” or “research”), the Commentary is not an offer to sell, or a solicitation of an offer to sell or subscribe for, any financial product or instrument (including, without limitation, any currencies, securities, commodities or other financial instruments). © Copyright 2013, The Hongkong and Shanghai Banking Corporation Limited, ALL RIGHTS RESERVED. No part of this publication may be reproduced, stored in a retrieval system, or transmitted, on any form or by any means, electronic, mechanical, photocopying, recording, or otherwise, without the prior written permission of The Hongkong and Shanghai Banking Corporation Limited. MICA (P) 118/04/2013, MICA (P) 068/04/2013 and MICA (P) 110/01/2013
abc
Metals and Mining
EMEA Andrew Keen Global Sector Head, Metals and Mining +44 20 7991 6764 [email protected]
Thorsten Zimmermann, CFA +44 20 7991 6835 [email protected]
Vladimir Zhukov +7 495 783 8316 [email protected]
Emma Townshend +27 21 794 8345 [email protected]
Derryn Maade + 27 11 676 4519 [email protected]
North America & Latin America James Steel +1 212 525 3117 [email protected]
Patrick Chidley, CFA +1 212 525 4915 [email protected]
Botir Sharipov, CFA +1 212 525 5150 [email protected]
Howard Wen +1 212 525 3726 [email protected]
Leonardo A Correa +55 11 3847 5433 [email protected]
Luiz G Fornari + 55 11 3847 5436 [email protected]
Asia Simon Francis Regional Head of Metals and Mining, Asia Pacific +852 2996 6620 [email protected]
Thomas Zhu, CFA +852 2822 4325 [email protected]
Chris Chen +852 2822 4277 [email protected]
Jeff Yuan +852 3941 7010 [email protected]
Brian Cho +822 3706 8750 [email protected]
Jigar Mistry, CFA +91 22 2268 1079 [email protected]
Jena Han +822 3706 8772 [email protected]
Energy
Europe David Phillips Global Sector Co-head, Oil and Gas +44 20 7991 2344 [email protected]
Peter Hitchens +44 20 7991 6822 [email protected]
Phillip Lindsay +44 207 991 2577 [email protected]
Kirtan Mehta, CFA +91 80 3001 3779 [email protected]
CEEMEA Bülent Yurdagül +90 212 376 46 12 [email protected]
Ildar Khaziev, CFA +7 495 645 4549 [email protected]
Latam Luiz F Carvalho + 55 11 3371 8178 [email protected]
Filipe M Gouveia + 55 11 3847 5451 [email protected]
Asia Thomas Hilboldt Regional Head of Oil, Gas and Petrochemical Research, Asia Pacific +852 2822 2922 [email protected]
Dennis Yoo, CFA +852 2996 6917 [email protected]
Kumar Manish +91 22 2268 1238 [email protected]
Alok P Deshpande +91 22 681245 [email protected]
SI Tingting +852 2996 6590 [email protected]
Chemicals
Europe Dr Geoff Haire +44 20 7991 6892 [email protected]
Sebastian Satz, CFA +44 20 7991 6894 [email protected]
Jesko Mayer-Wegelin, CFA +49 211 910 3719 [email protected]
CEEMEA Yonah Weisz +972 3 710 1198 [email protected]
Sriharsha Pappu, CFA +971 4 423 6924 [email protected]
Nicholas Paton, CFA + 971 4 423 6923 [email protected]
Asia Dennis Yoo, CFA +852 2996 6917 [email protected]
Utilities
Europe Adam Dickens +44 20 7991 6798 [email protected]
Verity Mitchell +44 20 7991 6840 [email protected]
Asia Jenny Cosgrove Regional Head of Utilities and Alternative Energy, Asia Pacific +852 2996 6619 [email protected]
Arun Kumar Singh Analyst +91 22 2268 1778 [email protected]
Gloria Ho +852 2996 6941 [email protected]
Summer Y Y Huang +852 2996 6976 [email protected]
Latin America Sandra Boente +1 212 525 4441 [email protected]
Osmar Camilo +55 11 3847 9502 [email protected]
CEEMEA Levent Bayar Analyst +90 212 376 46 17 [email protected]
Dmytro Konovalov +7 495 258 3152 [email protected]
Alternative Energy
Jenny Cosgrove Regional Head of Utilities and Alternative Energy, Asia Pacific +852 2996 6619 [email protected]
Charanjit Singh +91 80 3001 3776 [email protected]
Gloria Ho +852 2996 6941 [email protected]
Specialist Sales
Annabelle O'Connor +44 20 7991 5040 [email protected]
James Lesser +44 207 991 1382 [email protected]
Global Natural Resources & Energy Research Team