Embed Size (px)
Citation preview
I
Gold/TiO2 nanocomposites as photoactive materials for environmental remediation
Chiara Seghetti
Dissertação para obtenção do Grau de Mestre em Química
Orientadores Doutora Suzana Maria de Andrade Sousa Paiva
Doutora Rita Giovannetti
Juri
Presidente: Maria Matilde Soares Duarte Marques
Orientadora: Pedro Miguel Neves Ribeiro Paulo
Vogal: Doutor Corrado Bacciocchi
Janeiro 2016
II
Abstract
The effects of gold nanoparticles (AuNPs), deposited on two commercial types of titanium dioxide (TiO2
Anatase and TiO2 Evonik P-25) in order to obtain AuNPs@TiO2, have been investigated on the
photodegradation of water solutions of alizarin red S under visible light irradiation. The study started with the
formation of AuNPs by reduction of Au(III) to Au(0) using acetylacetone as reducing agent. The characteristics
of the synthesized gold nanoparticles were studied by diffraction light scattering (DLS) and optical microscopy.
The studies of the optical properties and the variation of size and colour of the gold nanoparticles were
monitored by UV-Vis spectrophotometry measurements. Informations about the morphological structure of
polypropylene coated with AuNPs@TiO2 were obtained with atomic-force microscopy (AFM) measurements.
The photocatalytical activity of polypropylene coated with AuNPs@TiO2 was compared with TiO2 without
doping in order to verify the effects of AuNPs on the rate of the photocatalytic process.
Key Words: Gold Nanoparticles, Photocatalytic Activity, Titanium Dioxide
Palavras-chave: actividade fotocatalítica, dióxido de titânio, nanopartículas de ouro
III
Contents
1. INTRODUCTION 1
1.1. Environmental Pollution 1
1.2. Water Pollution 2
1.3. Dye Pollution 3
2. STATE OF THE ART 6
2.1. Advanced Oxidation Process 6
2.1.1 Semiconductor Photocatalysis 6
2.1.2 Photocatalytic Reaction 7
2.2. Titanium Dioxide (TiO2) 10
2.2.1. Evonik P-25 12
2.2.2. TiO2 Photocatalytic Process 13
2.2.3. Superhydrophilic Effect 15
2.2.4. TiO2 Support 16
2.2.5. Preparation of TiO2 Films 16
2.2.6. Application of TiO2 17
2.3. Gold Nanoparticles 19
2.3.1. Synthesis of Gold Nanoparticles 23
2.3.2. Characterization of Nanoparticle 26
2.3.3. Application of Gold Nanoparticles 27
2.4. Doping of TiO2 with Gold Nanoparticles 28
2.5. Factors Influencing Photocatalytic Process 30
2.6. Reactors 32
2.7. Dyes: Structure and Properties 33
2.8. Aim of Research Work 35
3. EXPERIMENTAL SECTION 36
3.1. Instrumentation 36
3.1.1. UV-Vis Spectroscopy 36
3.1.2. Optical Microscope 39
3.1.3. Atomic Force Microscopy 40
3.1.4. Dynamic Light Scattering 42
3.2. Materials and Methods 44
3.3. Operative Procedure to Synthetized Gold Nanoparticles 44
3.4. Operative Procedure for Kinetic Study 45
3.4.1. TiO2@AuNPs Paste Preparation 46
3.4.2. Strips Preparation 47
3.4.3. Photocatalytic Process 48
3.5. Operative Procedure for Kinetics Studies of AuNPs formation 49
4. EXPERIMENTAL RESULTS 50
4.1. AuNPs Synthetized by Citrate 50

IV
4.2. Characterization and Kinetic Study of [PPTiO2@AuNPs]-procedure 1 51
4.2.1. AFM Measurements 51
4.2.2. Molar Absorptivity (ε)of Alizarin Red S 53
4.2.3. Kinetic Studies 54
4.3. Gold Nanoparticles Study and Characterization using Acetylacetone as Reducing
Agent 57
4.3.1. Kinetic Studies of AuNPs Formation 60
4.4. Kinetic Study of TiO2@AuNPs-procedure 2 66
5. CONCLUSIONS 70
REFERENCES 71

V
INDEX OF FIGURES AND SCHEMES
Figures
Figure 1.1 1
Figure 1.2 3
Figure 1.3 3
Figure 1.4 4
Figure 2.1 7
Figure 2.2 8
Figure 2.3 9
Figure 2.4 11
Figure 2.5 11
Figure 2.6 12
Figure 2.7 13
Figure 2.8 15
Figure 2.9 15
Figure 2.10 17
Figure 2.11 18
Figure 2.12 19
Figure 2.13 20
Figure 2.14 21
Figure 2.15 22
Figure 2.16 22
Figure 2.17 23
Figure 2.18 23
Figure 2.19 24
Figure 2.20 25
Figure 2.21 25
Figure 2.22 26
VI
Figure 2.23 29
Figure 2.24 29
Figure 2.25 31
Figure 2.26 32
Figure 2.27 33
Figure 2.28 34
Figure 2.29 34
Figure 2.30 34
Figure 2.31 35
Figure 2.32 35
Figure 3.1 36
Figure 3.2 36
Figure 3.3 37
Figure 3.4 38
Figure 3.5 40
Figure 3.6 41
Figure 3.7 43
Figure 3.8 46
Figure 3.9 47
Figure 3.10 47
Figure 3.11 48
Figure 4.1 50
Figure 4.2 51
Figure 4.3 52
Figure 4.4 52
Figure 4.5 53
Figure 4.6 53
Figure 4.7 54
Figure 4.8 55
Figure 4.9 55
Figure 4.10 56
Figure 4.11 56
Figure 4.12 58
Figure 4.13 58
Figure 4.14 59
Figure 4.15 60
Figure 4.16 61
Figure 4.17 61
Figure 4.18 61
Figure 4.19 62
Figure 4.20 63
VII
Figure 4.21 63
Figure 4.22 64
Figure 4.23 64
Figure 4.24 64
Figure 4.25 64
Figure 4.26 65
Figure 4.27 65
Figure 4.28 66
Figure 4.29 68
Figure 4.30 68
Figure 4.31 68
Figure 4.32 68
Tables
Table 1.1 24
Table 3.1 44
Table 3.2 45
Table 3.3 49
Table 4.1 54
Table 4.2 57
Table 4.3 57
Table 4.4 59
Table 4.5 62
Table 4.6 67
Table 4,7 67
1
1. INTRODUCTION
1.1. Environmental Pollution
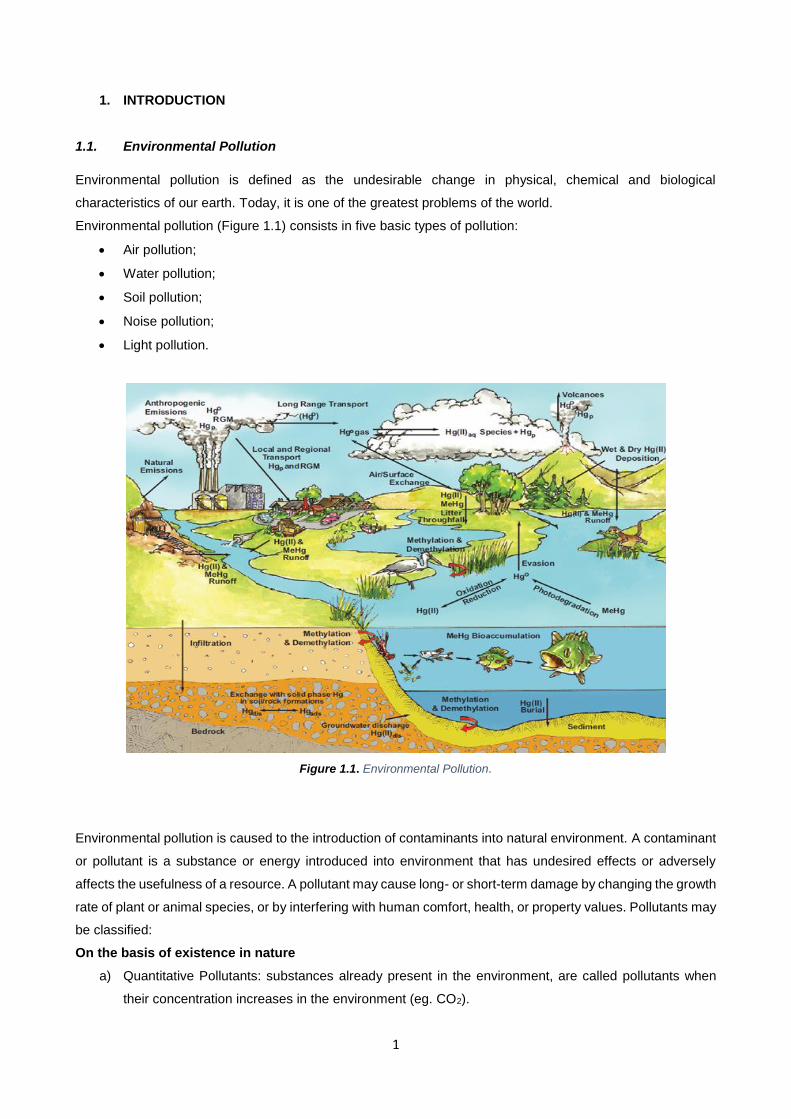
Environmental pollution is defined as the undesirable change in physical, chemical and biological
characteristics of our earth. Today, it is one of the greatest problems of the world.
Environmental pollution (Figure 1.1) consists in five basic types of pollution:
Air pollution;
Water pollution;
Soil pollution;
Noise pollution;
Light pollution.
Figure 1.1. Environmental Pollution.
Environmental pollution is caused to the introduction of contaminants into natural environment. A contaminant
or pollutant is a substance or energy introduced into environment that has undesired effects or adversely
affects the usefulness of a resource. A pollutant may cause long- or short-term damage by changing the growth
rate of plant or animal species, or by interfering with human comfort, health, or property values. Pollutants may
be classified:
On the basis of existence in nature
a) Quantitative Pollutants: substances already present in the environment, are called pollutants when
their concentration increases in the environment (eg. CO2).
2
b) Qualitative Pollutants: substances which are not normally present in the environment but they are
added by human beings and are pollutants by nature (eg. pesticides).
On the basis of the form in which they persist
a) Primary Pollutants: substances which are directly emitted from the source and remain in that form (eg.
smoke, dust, nitric oxide and sulphur oxide).
b) Secondary Pollutants: substances which are formed by chemical reaction between the primary
pollutants and constituents of the environment (eg. smog, ozone, nitrogen dioxide).
On the basis of disposal
a) Bio-degradable Pollutants: contaminants which are decomposed by natural processes (eg. domestic
sewage).
b) Non Bio-degradable Pollutants: contaminants which don’t decompose naturally or decompose slowly.
Environmental pollution is caused by different sources, for example, industrial waste and products used in
agriculture. In the last years, many solutions have been developed to remove the pollutant from one phase to
another one and to eliminate toxic compounds. Unluckily only few of them are really capable to remove
pollutants from the environment and the usual methods used to clean-up water and air system, even if effective,
are often intensive from a chemical point of view and their residues can add some contamination problems.
For those reasons, environmental protection and resolution of environmental problems are important factors
for an effective improvement of life quality and for a sustainable development.
1.2. Water Pollution
Water is for life on earth, indeed two thirds of the earth's surface are covered by water and the human body
consisting of 75 percent of it.
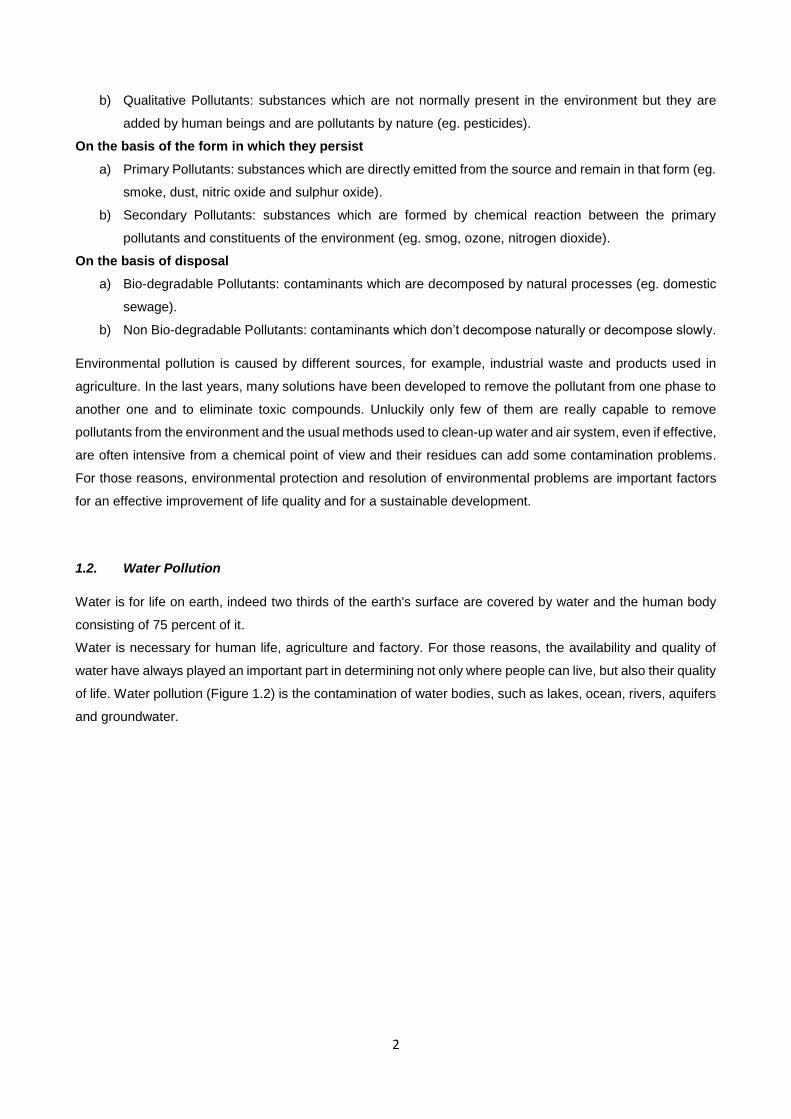
Water is necessary for human life, agriculture and factory. For those reasons, the availability and quality of
water have always played an important part in determining not only where people can live, but also their quality
of life. Water pollution (Figure 1.2) is the contamination of water bodies, such as lakes, ocean, rivers, aquifers
and groundwater.
3
Figure 1.2. Water Pollution.
Water pollution is a major problem in the global context; it affects the entire biosphere – plants and organisms
living in these bodies of water. Chemical water pollutants are generally atoms or molecules, which have been
discharged into natural water bodies, usually by activities of humans. Common examples of such chemical
water pollutants are mercury emanating from mining activity, certain nitrogen compounds used in agriculture,
chlorinated organic molecules arising from sewage or water treatment plants[1] or various acids which are the
externalities of various manufacturing activities.
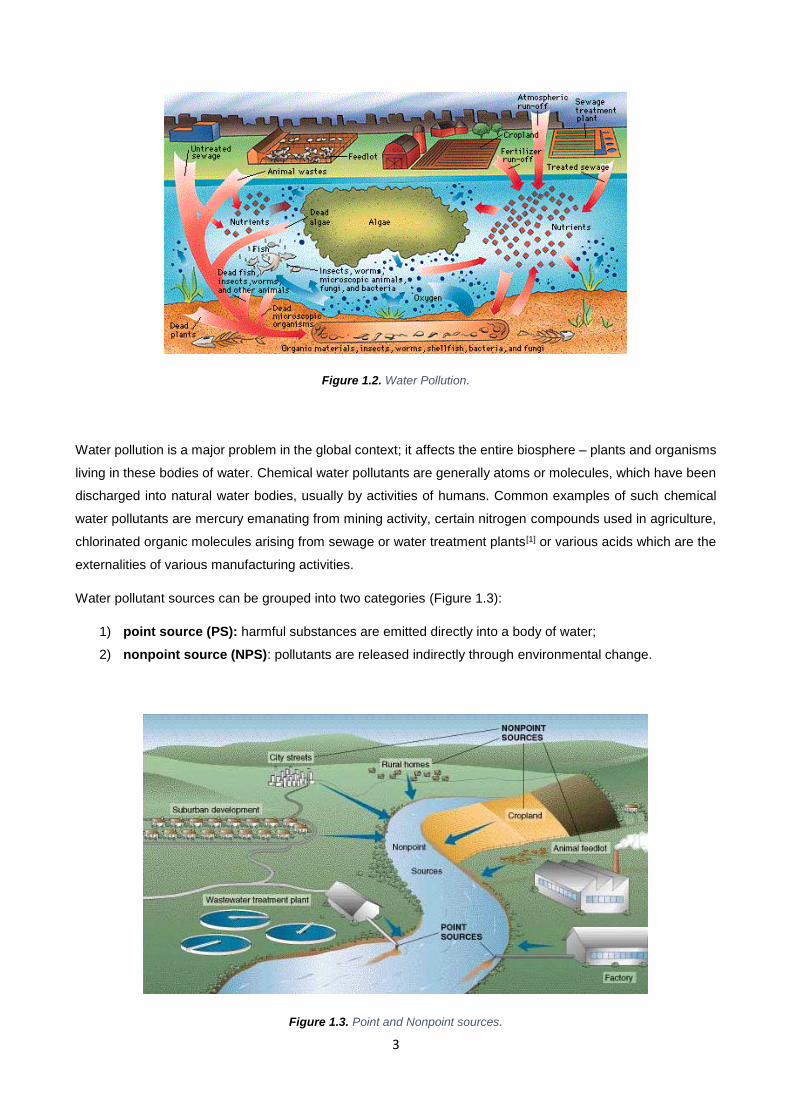
Water pollutant sources can be grouped into two categories (Figure 1.3):
1) point source (PS): harmful substances are emitted directly into a body of water;
2) nonpoint source (NPS): pollutants are released indirectly through environmental change.
Figure 1.3. Point and Nonpoint sources.
4
NPS contamination has emerged as an important environmental problem in the last decade. Although
significant advances have been made in controlling PS pollution, little progress has been accomplished in the
area of NPS pollution of surface waters and ground waters. This is because of the seasonality, inherent
variability, and multiplicity of NPS pollution[2].
Many of the common organic and inorganic chemical water pollutants are produced by nonpoint sources,
chiefly relating to intensive agriculture and high-density urban areas. Some organic compounds are very toxic,
stable, persistent to natural degradation and each pollutant is different from another. For these reasons,
different methods for the wastewater treatment have been developed to remove contaminants such as dyes,
drugs and pesticides or to degrade them into non-toxic ones but, some of them, have high costs, poor
degradation efficiency and complicated technology.
1.3. Dye Pollution
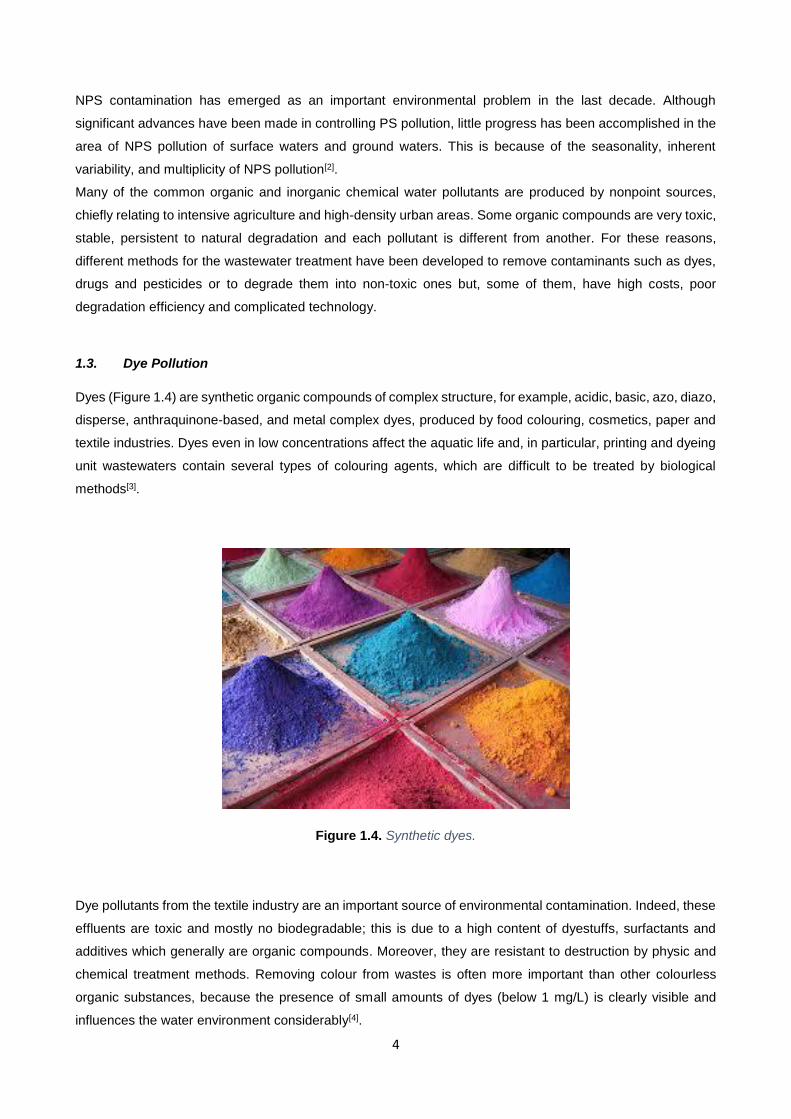
Dyes (Figure 1.4) are synthetic organic compounds of complex structure, for example, acidic, basic, azo, diazo,
disperse, anthraquinone-based, and metal complex dyes, produced by food colouring, cosmetics, paper and
textile industries. Dyes even in low concentrations affect the aquatic life and, in particular, printing and dyeing
unit wastewaters contain several types of colouring agents, which are difficult to be treated by biological
methods[3].
Figure 1.4. Synthetic dyes.
Dye pollutants from the textile industry are an important source of environmental contamination. Indeed, these
effluents are toxic and mostly no biodegradable; this is due to a high content of dyestuffs, surfactants and
additives which generally are organic compounds. Moreover, they are resistant to destruction by physic and
chemical treatment methods. Removing colour from wastes is often more important than other colourless
organic substances, because the presence of small amounts of dyes (below 1 mg/L) is clearly visible and
influences the water environment considerably[4].

5
Therefore, it is necessary to find an effective method of wastewater treatment in order to remove colour and
the relative toxicity of dyes from effluents. Various chemical and physical processes, such as chemical
precipitation and separation of pollutants, electrocoagulation, elimination by adsorption on activated carbon
etc., are currently used. These methods are not destructive but only transfer the contamination from one phase
to another, therefore, a new and different kind of pollution occurs and further treatments are deemed
necessary[5].
However, photocatalytic degradation is one of the most effectively clean technologies for the degradation of
wastewater and organic pollutants into biodegradable or less toxic organic compounds. Moreover, it appears
to be promising due to its simplicity, low cost, nontoxic, high degradation efficiency, and excellent stability.
6
2. STATE OF THE ART
2.1. Advanced Oxidation Process
Advanced oxidation processes (AOPs), which involve the in situ generation of highly potent chemical oxidants
such as the hydroxyl radical (OH∙), have recently emerged as an important class of technologies for
accelerating the oxidation and destruction of a wide range of organic contaminants in polluted water or air [6].
In particular, these processes are very useful for treating different chemicals that are discharged into the
aquatic environment, since some of them are not only toxic but also partly biodegradable. Therefore, they are
not easily removed in biological wastewater treatment plants.
In particular, these processes are very useful for treating different chemicals that are discharged into the
aquatic environment, since some of them cannot be easily removed in biological wastewater treatment plants,
due to their toxicity and partial biodegradability.
AOP involve two stages:
1. The formation of strong oxidants (e.g. hydroxyl radicals);
2. The reaction of these oxidants with organic contaminants in water.
End products of complete oxidation (i.e. mineralization) of organic compounds are carbon dioxide (CO2) and
water (H2O). Many systems are qualified under this broad definition of AOP. Most of these systems use a
combination of strong oxidants (e.g. O3 and H2O2), catalysts, e.g. transition metal ions or photocatalyst, and
irradiation, e.g. ultraviolet (UV), ultrasound (US), or electron beam.
The main advantages of these methods are:
high rates of pollutant oxidation,
flexibility concerning water quality variations,
small dimension of the equipment.
The main disadvantages are:
relatively high treatment costs,
special safety requirements because of the use of very reactive chemicals (ozone, hydrogen peroxide),
high-energy sources (UV lamps, electron beams, radioactive sources)[7].
2.1.1. Semiconductor Photocatalysis
Photocatalysis has become an intensively researched field due to practical interest in air and water
remediation, self-cleaning surfaces, self-sterilizing surfaces, and hydrogen generation using the green energy
of sunlight. Many oxide semiconductors show practical performance as photocatalysts in water disinfection
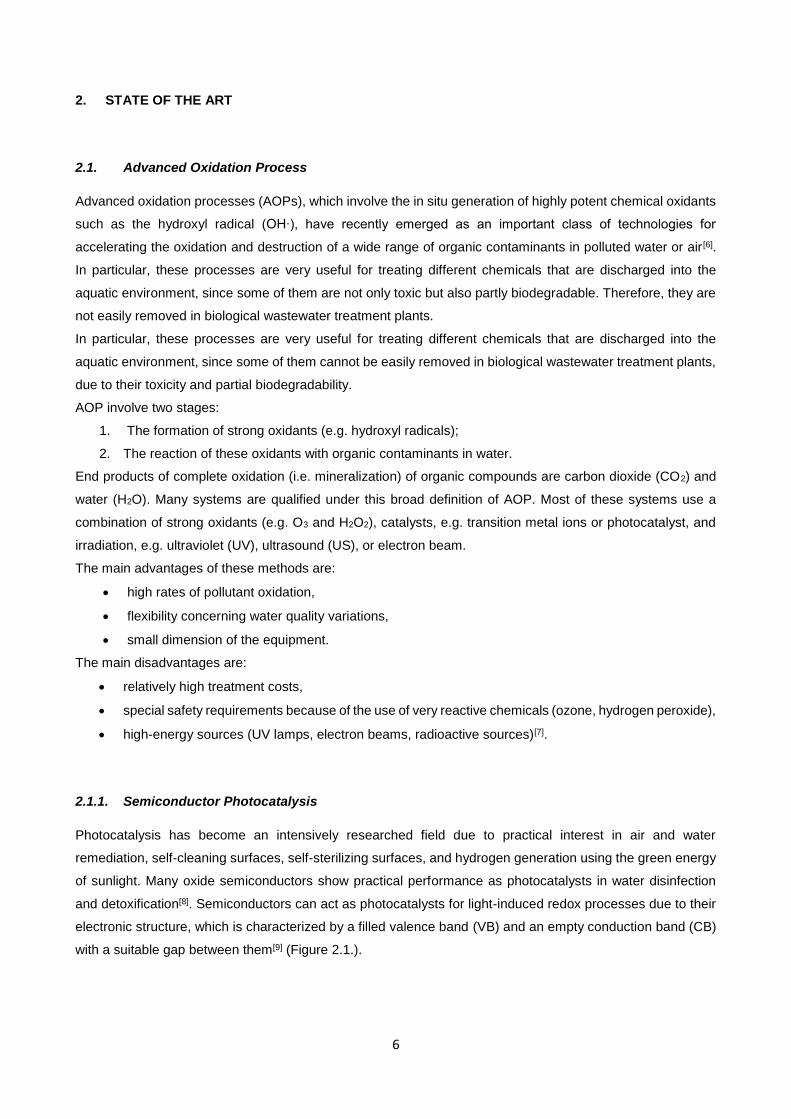
and detoxification[8]. Semiconductors can act as photocatalysts for light-induced redox processes due to their
electronic structure, which is characterized by a filled valence band (VB) and an empty conduction band (CB)
with a suitable gap between them[9] (Figure 2.1.).
7
Figure 2.1. Redox process on an illuminated semiconductor.
Metal oxides exhibit much better stability in water. TiO2 is used mainly due to its non toxicity, water insolubility,
hydrophilicity, cheap availability, stability and anti-photocorrosion. Furthermore, TiO2 can be supported on
various substrates such as glass, fibers and inorganic materials. However, the large band gap of TiO2 (≈ 3.2
eV) requires an excitation wavelength that falls in the UV region[10].
2.1.2. Photocatalytic Reaction
The word “photocatalysis” is of Greek origin and composes of two parts: the prefix “photo” (phos: light) and the
word “catalysis” (katalyo: brake apart, decompose). This term is used to define a change in the rate of a
chemical reaction or its initiation under the action of ultraviolet, visible or infrared radiation in the presence of
a substance, the photocatalyst, that absorbs light and is involved in the chemical transformation of the reaction
partners[11].
The field of heterogeneous photocatalysis has expanded rapidly within the last four decades, having
undergone various developments especially in relation to energy and environment. The two most significant
applications of photocatalysis have been in solar water splitting and purification of air and water containing low
concentrations of pollutants.
Heterogeneous catalysts are distinguished from homogeneous catalysts by the different phases present during
reaction. Homogeneous catalysts are present in the same phase as reactants and products, usually liquid,
while heterogeneous catalysts are present in a different phase, usually solid. The main advantage of using a
heterogeneous catalyst is the relative ease of catalyst separation from the product stream that aids in the
creation of continuous chemical processes. Additionally, heterogeneous catalysts are typically more tolerant
of extreme operating conditions than their homogeneous analogues[12].
A heterogeneous photocatalytic reaction involves five steps:
1) Mass transfer of the organic contaminant(s) from the liquid phase to the solid catalyst surface;
2) Adsorption of the organic contaminant(s) onto the photon activated surface (i.e. surface activation by
photon energy occurs simultaneously in this step);
3) Photocatalysis reaction for the adsorbed phase on the catalyst surface;
8
4) Desorption of the intermediate(s);
5) Mass transfer of the intermediate(s) from the interface region to the bulk fluid[13].
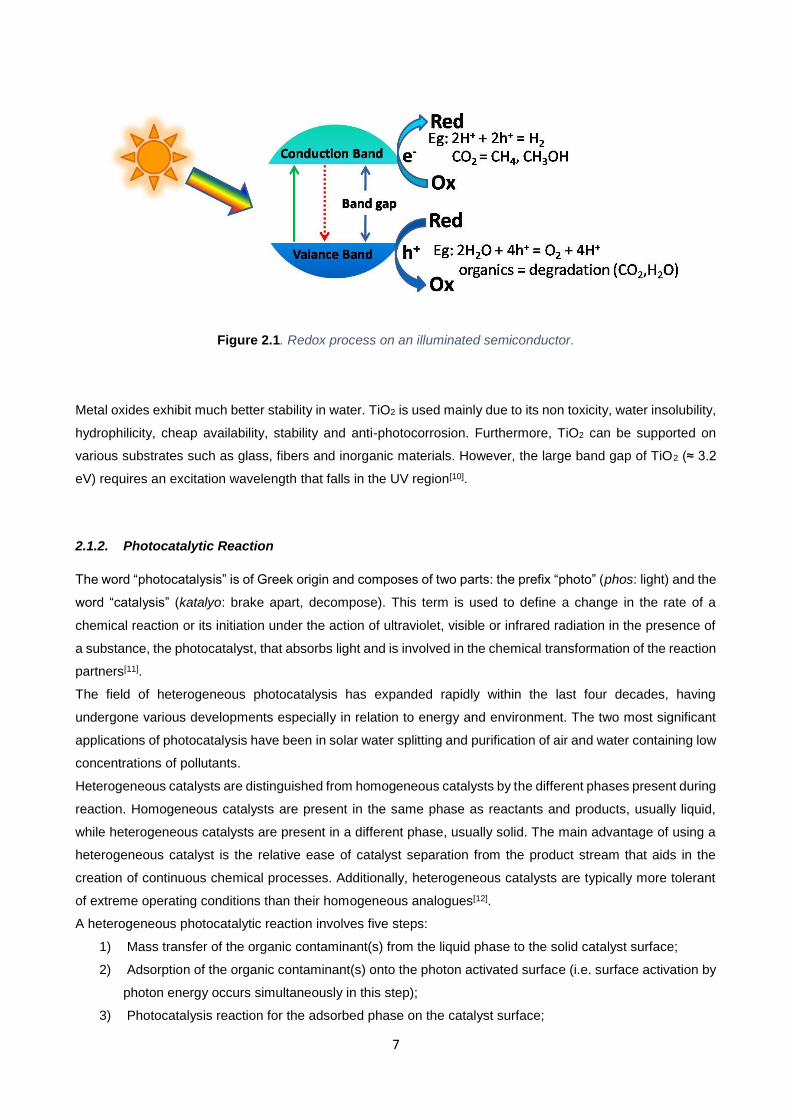
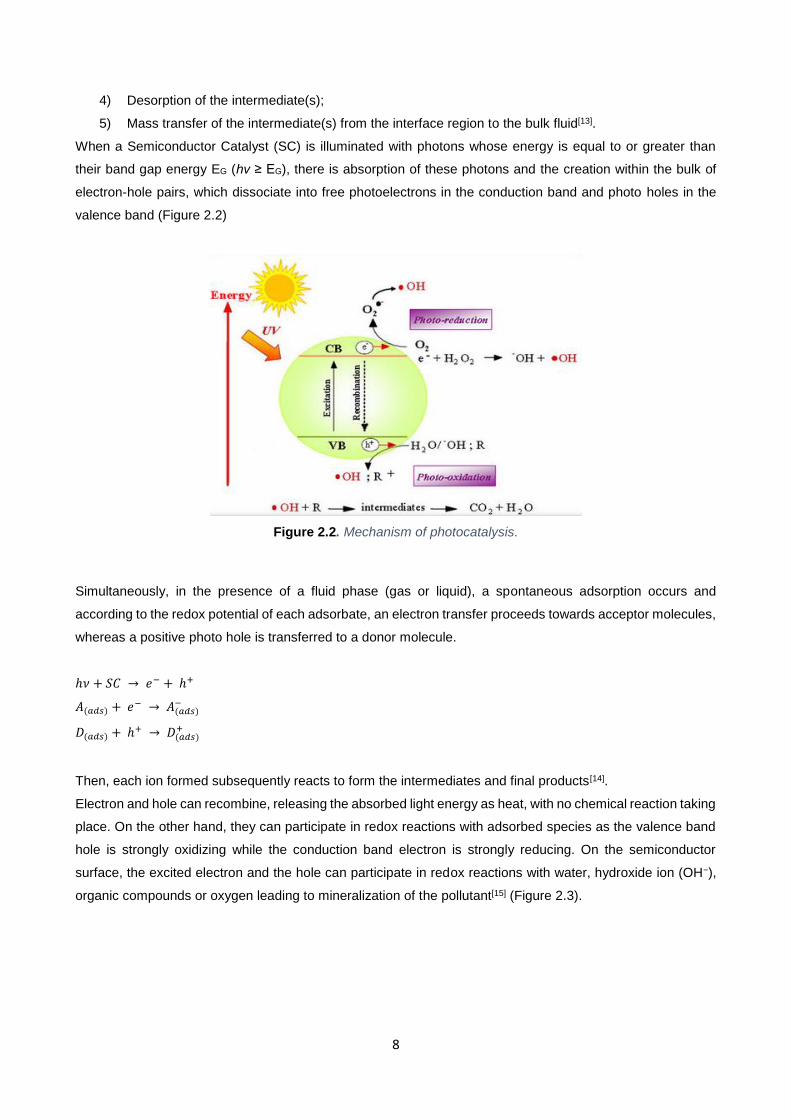
When a Semiconductor Catalyst (SC) is illuminated with photons whose energy is equal to or greater than
their band gap energy EG (hν ≥ EG), there is absorption of these photons and the creation within the bulk of
electron-hole pairs, which dissociate into free photoelectrons in the conduction band and photo holes in the
valence band (Figure 2.2)
Figure 2.2. Mechanism of photocatalysis.
Simultaneously, in the presence of a fluid phase (gas or liquid), a spontaneous adsorption occurs and
according to the redox potential of each adsorbate, an electron transfer proceeds towards acceptor molecules,
whereas a positive photo hole is transferred to a donor molecule.
ℎ𝜈 + 𝑆𝐶 → 𝑒− + ℎ+
𝐴(𝑎𝑑𝑠) + 𝑒− → 𝐴(𝑎𝑑𝑠)−
𝐷(𝑎𝑑𝑠) + ℎ+ → 𝐷(𝑎𝑑𝑠)+
Then, each ion formed subsequently reacts to form the intermediates and final products[14].
Electron and hole can recombine, releasing the absorbed light energy as heat, with no chemical reaction taking
place. On the other hand, they can participate in redox reactions with adsorbed species as the valence band
hole is strongly oxidizing while the conduction band electron is strongly reducing. On the semiconductor
surface, the excited electron and the hole can participate in redox reactions with water, hydroxide ion (OH−),
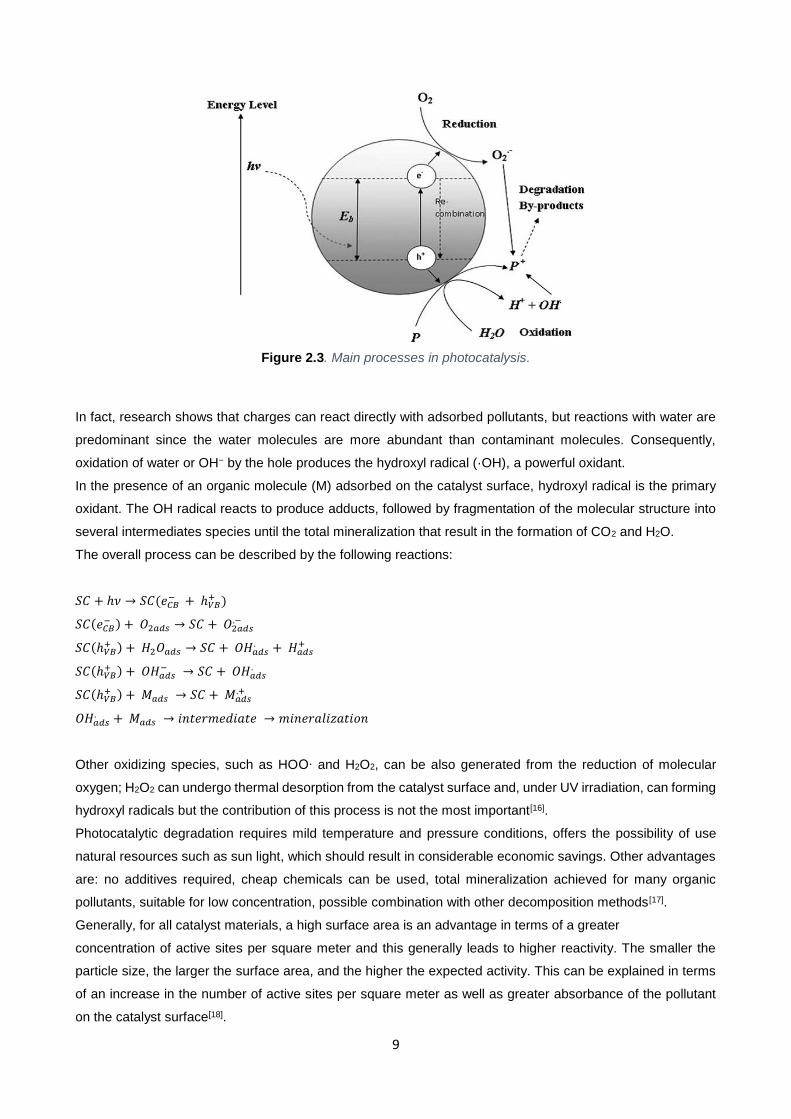
organic compounds or oxygen leading to mineralization of the pollutant[15] (Figure 2.3).
9
Figure 2.3. Main processes in photocatalysis.
In fact, research shows that charges can react directly with adsorbed pollutants, but reactions with water are
predominant since the water molecules are more abundant than contaminant molecules. Consequently,
oxidation of water or OH− by the hole produces the hydroxyl radical (·OH), a powerful oxidant.
In the presence of an organic molecule (M) adsorbed on the catalyst surface, hydroxyl radical is the primary
oxidant. The OH radical reacts to produce adducts, followed by fragmentation of the molecular structure into
several intermediates species until the total mineralization that result in the formation of CO2 and H2O.
The overall process can be described by the following reactions:
𝑆𝐶 + ℎ𝜈 → 𝑆𝐶(𝑒𝐶𝐵 − + ℎ𝑉𝐵
+ )
𝑆𝐶(𝑒𝐶𝐵− ) + 𝑂2𝑎𝑑𝑠 → 𝑆𝐶 + 𝑂2𝑎𝑑𝑠
.−
𝑆𝐶(ℎ𝑉𝐵+ ) + 𝐻2𝑂𝑎𝑑𝑠 → 𝑆𝐶 + 𝑂𝐻𝑎𝑑𝑠
. + 𝐻𝑎𝑑𝑠+
𝑆𝐶(ℎ𝑉𝐵+ ) + 𝑂𝐻𝑎𝑑𝑠
− → 𝑆𝐶 + 𝑂𝐻𝑎𝑑𝑠.
𝑆𝐶(ℎ𝑉𝐵+ ) + 𝑀𝑎𝑑𝑠 → 𝑆𝐶 + 𝑀𝑎𝑑𝑠
.+
𝑂𝐻𝑎𝑑𝑠. + 𝑀𝑎𝑑𝑠 → 𝑖𝑛𝑡𝑒𝑟𝑚𝑒𝑑𝑖𝑎𝑡𝑒 → 𝑚𝑖𝑛𝑒𝑟𝑎𝑙𝑖𝑧𝑎𝑡𝑖𝑜𝑛
Other oxidizing species, such as HOO∙ and H2O2, can be also generated from the reduction of molecular
oxygen; H2O2 can undergo thermal desorption from the catalyst surface and, under UV irradiation, can forming
hydroxyl radicals but the contribution of this process is not the most important[16].
Photocatalytic degradation requires mild temperature and pressure conditions, offers the possibility of use
natural resources such as sun light, which should result in considerable economic savings. Other advantages
are: no additives required, cheap chemicals can be used, total mineralization achieved for many organic
pollutants, suitable for low concentration, possible combination with other decomposition methods [17].
Generally, for all catalyst materials, a high surface area is an advantage in terms of a greater
concentration of active sites per square meter and this generally leads to higher reactivity. The smaller the
particle size, the larger the surface area, and the higher the expected activity. This can be explained in terms
of an increase in the number of active sites per square meter as well as greater absorbance of the pollutant
on the catalyst surface[18].
10
In recent years, the development of nanoscale metal oxides has greatly increased the catalytic activity by virtue
of the high specific surface area available for reaction of the smaller particles. In addition, the strategy to alter
the band gap of the catalyst is an important approach as this determines the portion of the solar spectrum the
catalyst absorbs and, consequently, the amount of energy that is converted to reactive species. Photocatalysts
that have high activity using wavelengths of light in the visible spectrum (380 nm < λ < 500 nm) have been
demonstrated where potentially greater amounts of energy is available (solar peak energy is around 460 nm).
This has been achieved by altering the band gap of, for example, TiO2. Doping of TiO2 with transition metal
ions (for example, V, Cr, Mn, Fe and Ni) as well as with Ag, Au and Ru, have been demonstrated to red-shift
the TiO2 absorption band from the UV into the visible region, resulting in a great increase in the efficiency of
solar-light photocatalysis[16].
2.2. Titanium Dioxide (TiO2)
Titanium Dioxide (TiO2) is an important material in many practical applications, and, in commercial products
ranging from drugs to foods, cosmetics to catalysts, paints to pharmaceuticals, and sunscreens to solar cells
in which TiO2 is used as a desiccant, brightener, or reactive mediator. In particular, TiO2, shows good ability
to oxidize organic and inorganic substrates in air and water through redox processes. In this context, TiO2 has
not only emerged as one of the most fascinating materials in both homogeneous and heterogeneous catalysis,
but has also succeeded in engaging the attention of physical chemists, physicists, material scientists and
engineers in exploring distinctive semiconducting and catalytic properties[19].
The most important features of this semiconductor are:
Non-toxicity;
Photochemical stability;
Strong oxidizing power at ambient temperature and pressure;
Photo-generated electrons are reducing enough to produce superoxide from oxygen;
Anti-bacterial;
Self-cleaning;
Chemical inertness;
Physical stability;
Super-hydrophilicity;
Stable in presence of aqueous electrolyte solutions;
Relatively inexpensive and readily available.
In particular, photocatalytic and hydrophilic properties of TiO2 makes it close to an ideal catalyst due to its high
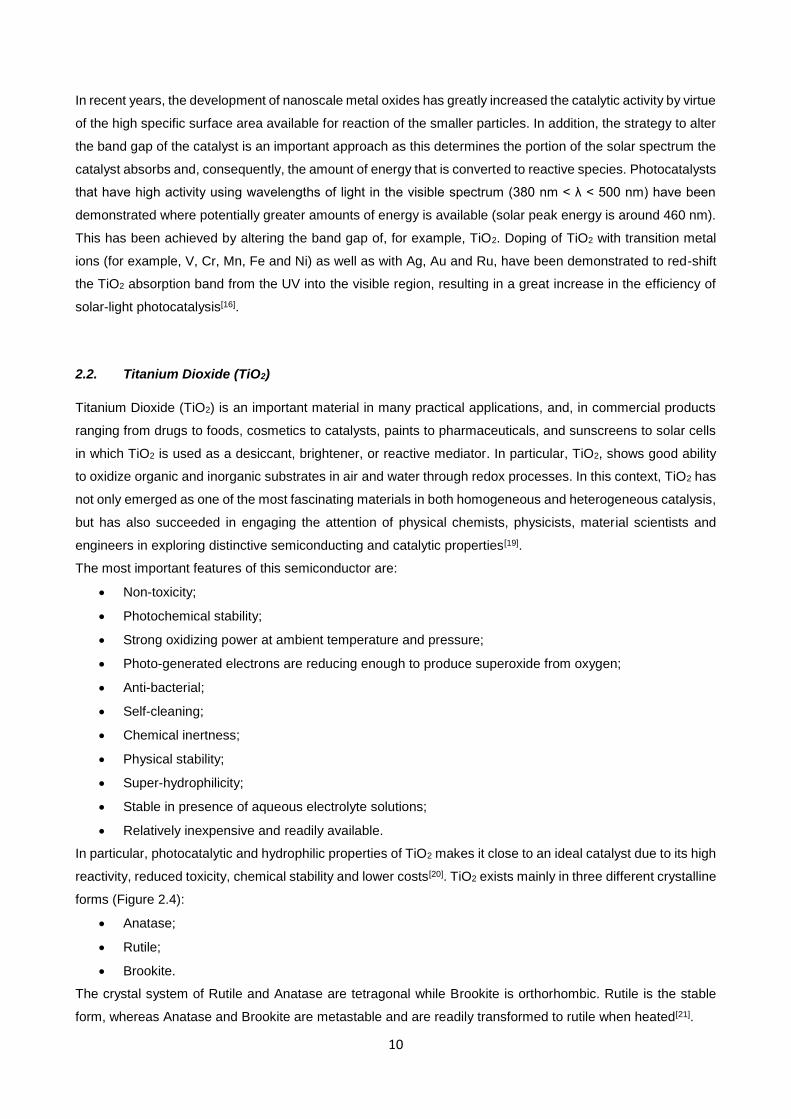
reactivity, reduced toxicity, chemical stability and lower costs[20]. TiO2 exists mainly in three different crystalline
forms (Figure 2.4):
Anatase;
Rutile;
Brookite.
The crystal system of Rutile and Anatase are tetragonal while Brookite is orthorhombic. Rutile is the stable
form, whereas Anatase and Brookite are metastable and are readily transformed to rutile when heated[21].
11
Figure 2.4. Crystalline form of a) Anatase; b) Rutile and c) Brookite.
Each structure exhibits different physical and chemical properties such as thermal stability, density and band
gap as well as surface structures. It is well know that most catalytic reactions over heterogeneous catalysts
take place on the surface of the catalyst or at the interface of active species and support. Thus, different
crystalline forms of TiO2 catalysts might exhibit different physical, chemical and catalytic properties[22].
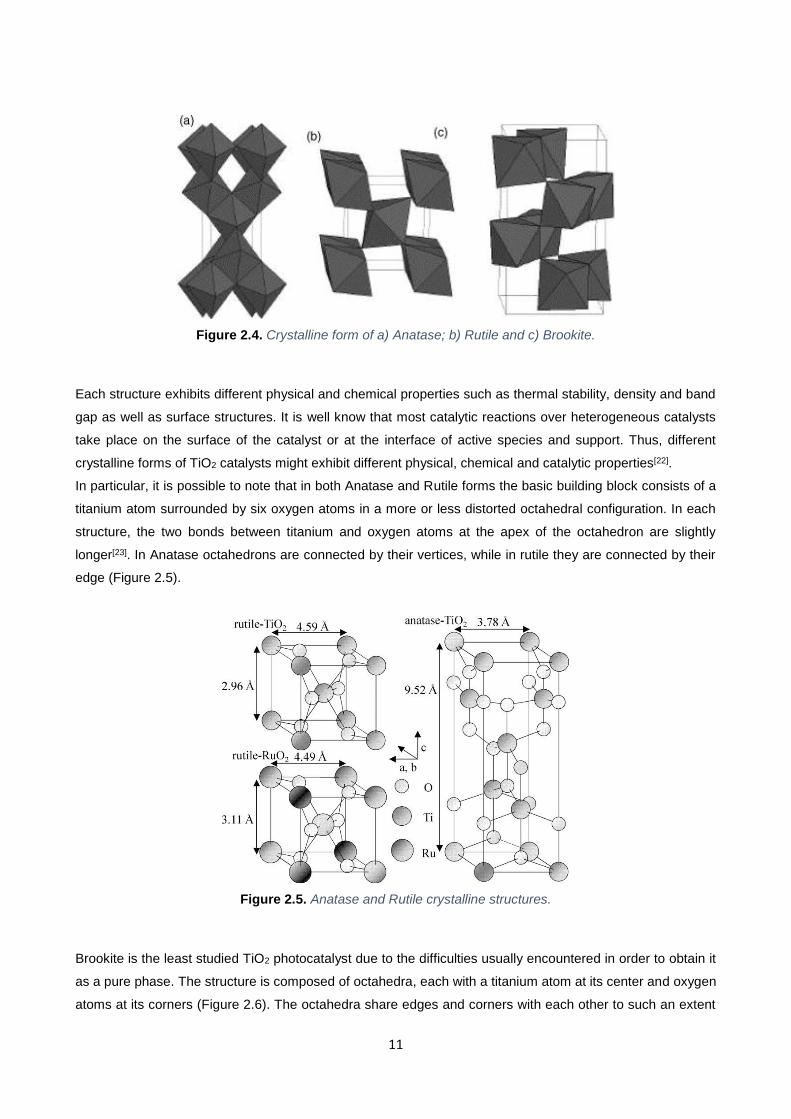
In particular, it is possible to note that in both Anatase and Rutile forms the basic building block consists of a
titanium atom surrounded by six oxygen atoms in a more or less distorted octahedral configuration. In each
structure, the two bonds between titanium and oxygen atoms at the apex of the octahedron are slightly
longer[23]. In Anatase octahedrons are connected by their vertices, while in rutile they are connected by their
edge (Figure 2.5).
Figure 2.5. Anatase and Rutile crystalline structures.
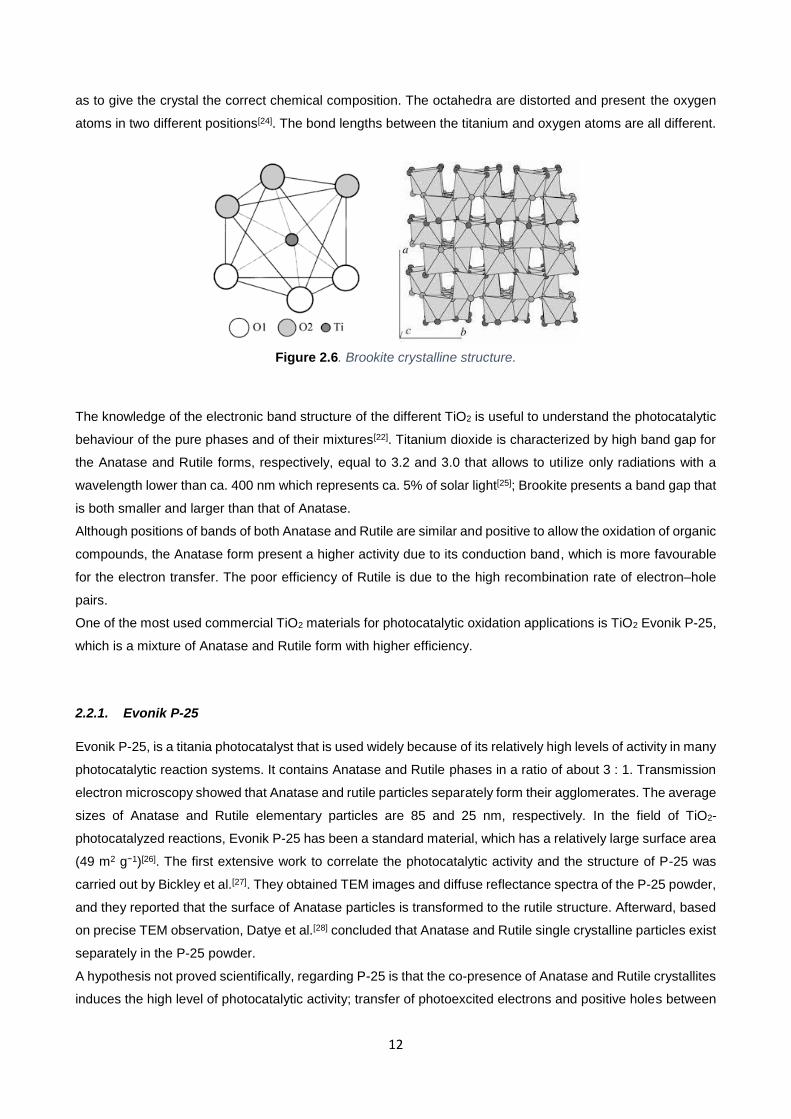
Brookite is the least studied TiO2 photocatalyst due to the difficulties usually encountered in order to obtain it
as a pure phase. The structure is composed of octahedra, each with a titanium atom at its center and oxygen
atoms at its corners (Figure 2.6). The octahedra share edges and corners with each other to such an extent
12
as to give the crystal the correct chemical composition. The octahedra are distorted and present the oxygen
atoms in two different positions[24]. The bond lengths between the titanium and oxygen atoms are all different.
Figure 2.6. Brookite crystalline structure.
The knowledge of the electronic band structure of the different TiO2 is useful to understand the photocatalytic
behaviour of the pure phases and of their mixtures[22]. Titanium dioxide is characterized by high band gap for
the Anatase and Rutile forms, respectively, equal to 3.2 and 3.0 that allows to utilize only radiations with a
wavelength lower than ca. 400 nm which represents ca. 5% of solar light[25]; Brookite presents a band gap that
is both smaller and larger than that of Anatase.
Although positions of bands of both Anatase and Rutile are similar and positive to allow the oxidation of organic
compounds, the Anatase form present a higher activity due to its conduction band, which is more favourable
for the electron transfer. The poor efficiency of Rutile is due to the high recombination rate of electron–hole
pairs.
One of the most used commercial TiO2 materials for photocatalytic oxidation applications is TiO2 Evonik P-25,
which is a mixture of Anatase and Rutile form with higher efficiency.
2.2.1. Evonik P-25
Evonik P-25, is a titania photocatalyst that is used widely because of its relatively high levels of activity in many
photocatalytic reaction systems. It contains Anatase and Rutile phases in a ratio of about 3 : 1. Transmission
electron microscopy showed that Anatase and rutile particles separately form their agglomerates. The average
sizes of Anatase and Rutile elementary particles are 85 and 25 nm, respectively. In the field of TiO2-
photocatalyzed reactions, Evonik P-25 has been a standard material, which has a relatively large surface area
(49 m2 g−1)[26]. The first extensive work to correlate the photocatalytic activity and the structure of P-25 was
carried out by Bickley et al.[27]. They obtained TEM images and diffuse reflectance spectra of the P-25 powder,
and they reported that the surface of Anatase particles is transformed to the rutile structure. Afterward, based
on precise TEM observation, Datye et al.[28] concluded that Anatase and Rutile single crystalline particles exist
separately in the P-25 powder.
A hypothesis not proved scientifically, regarding P-25 is that the co-presence of Anatase and Rutile crystallites
induces the high level of photocatalytic activity; transfer of photoexcited electrons and positive holes between
13
interconnecting Anatase and Rutile particles may enhance charge separation and hence improve the efficiency
of utilization of electron–hole pairs[29].
2.2.2. TiO2 Photocatalytic Process
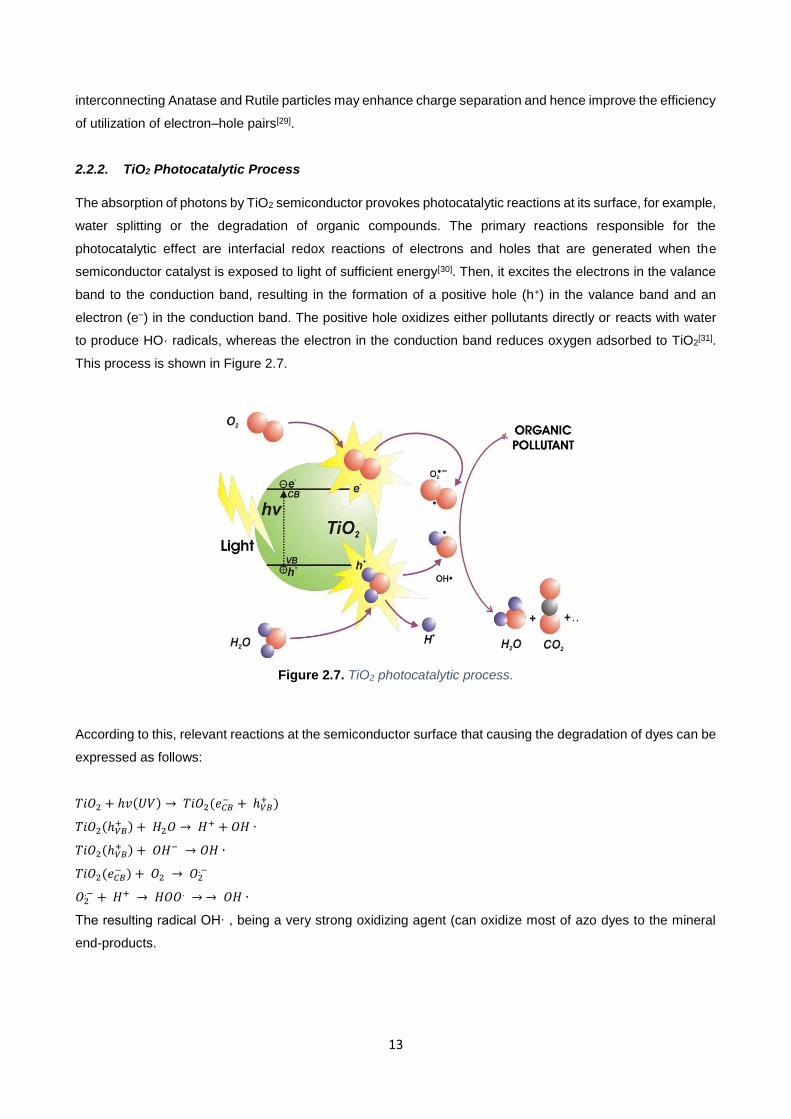
The absorption of photons by TiO2 semiconductor provokes photocatalytic reactions at its surface, for example,
water splitting or the degradation of organic compounds. The primary reactions responsible for the
photocatalytic effect are interfacial redox reactions of electrons and holes that are generated when the
semiconductor catalyst is exposed to light of sufficient energy[30]. Then, it excites the electrons in the valance
band to the conduction band, resulting in the formation of a positive hole (h+) in the valance band and an
electron (e−) in the conduction band. The positive hole oxidizes either pollutants directly or reacts with water
to produce HO· radicals, whereas the electron in the conduction band reduces oxygen adsorbed to TiO2[31].
This process is shown in Figure 2.7.
Figure 2.7. TiO2 photocatalytic process.
According to this, relevant reactions at the semiconductor surface that causing the degradation of dyes can be
expressed as follows:
𝑇𝑖𝑂2 + ℎ𝑣(𝑈𝑉) → 𝑇𝑖𝑂2(𝑒𝐶𝐵− + ℎ𝑉𝐵
+ )
𝑇𝑖𝑂2(ℎ𝑉𝐵+ ) + 𝐻2𝑂 → 𝐻+ + 𝑂𝐻 ∙
𝑇𝑖𝑂2(ℎ𝑉𝐵+ ) + 𝑂𝐻− → 𝑂𝐻 ∙
𝑇𝑖𝑂2(𝑒𝐶𝐵− ) + 𝑂2 → 𝑂2
.−
𝑂2.− + 𝐻+ → 𝐻𝑂𝑂. → → 𝑂𝐻 ∙
The resulting radical OH∙ , being a very strong oxidizing agent (can oxidize most of azo dyes to the mineral
end-products.
14
𝐷𝑦𝑒 + 𝑂𝐻 ∙ → 𝑑𝑒𝑔𝑟𝑎𝑑𝑎𝑡𝑖𝑜𝑛 𝑝𝑟𝑜𝑑𝑢𝑐𝑡s
𝐷𝑦𝑒 + ℎ𝑉𝐵+ → 𝑜𝑥𝑖𝑑𝑎𝑡𝑖𝑜𝑛 𝑝𝑟𝑜𝑑𝑢𝑐𝑡𝑠
𝐷𝑦𝑒 + 𝑒𝐶𝐵− → 𝑟𝑒𝑑𝑢𝑐𝑡𝑖𝑜𝑛 𝑝𝑟𝑜𝑑𝑢𝑐𝑡𝑠
The mechanism of photosensitized oxidation by visible radiation (λ>420 nm) is different from the pathway
implicated under UV light radiation. Several modification methods are available to shift the wavelength of
absorption of TiO2 from UV to visible region (dyes, nanoparticles or metal ions).
In the former case the mechanism suggests that excitation of the adsorbed dye takes place by visible light to
appropriate singlet or triplet states, subsequently followed by electron injection from the excited dye molecule
onto the conduction band of TiO2 particles, whereas the dye is converted to cationic dye radicals that
undergoes degradation to yield products as follows[32]:
𝐷𝑦𝑒 + ℎ𝑣(𝑉𝑖𝑠) → 𝐷𝑦𝑒∗
𝐷𝑦𝑒∗ + 𝑇𝑖𝑂2 → 𝐷𝑦𝑒 .+ + 𝑇𝑖𝑂2(𝑒𝐶𝐵− )
𝑇𝑖𝑂2(𝑒𝐶𝐵− ) + 𝑂2 → 𝑂2
.−
𝑂2.− + 𝑒− + 2𝐻+ → 𝐻2𝑂2
𝐻2𝑂2 + 𝑒− → 𝑂𝐻 ∙ + 𝑂𝐻−
𝐷𝑦𝑒 .+ + 𝑂2.− (𝑜𝑟 𝐻𝑂𝑂 ∙ 𝑜𝑟 𝑂𝐻 .−) → 𝑖𝑛𝑡𝑒𝑟𝑚𝑒𝑑𝑖𝑎𝑡𝑒𝑠 → 𝑑𝑒𝑔𝑟𝑎𝑑𝑎𝑡𝑖𝑜𝑛 𝑝𝑟𝑜𝑑𝑢𝑐𝑡𝑠
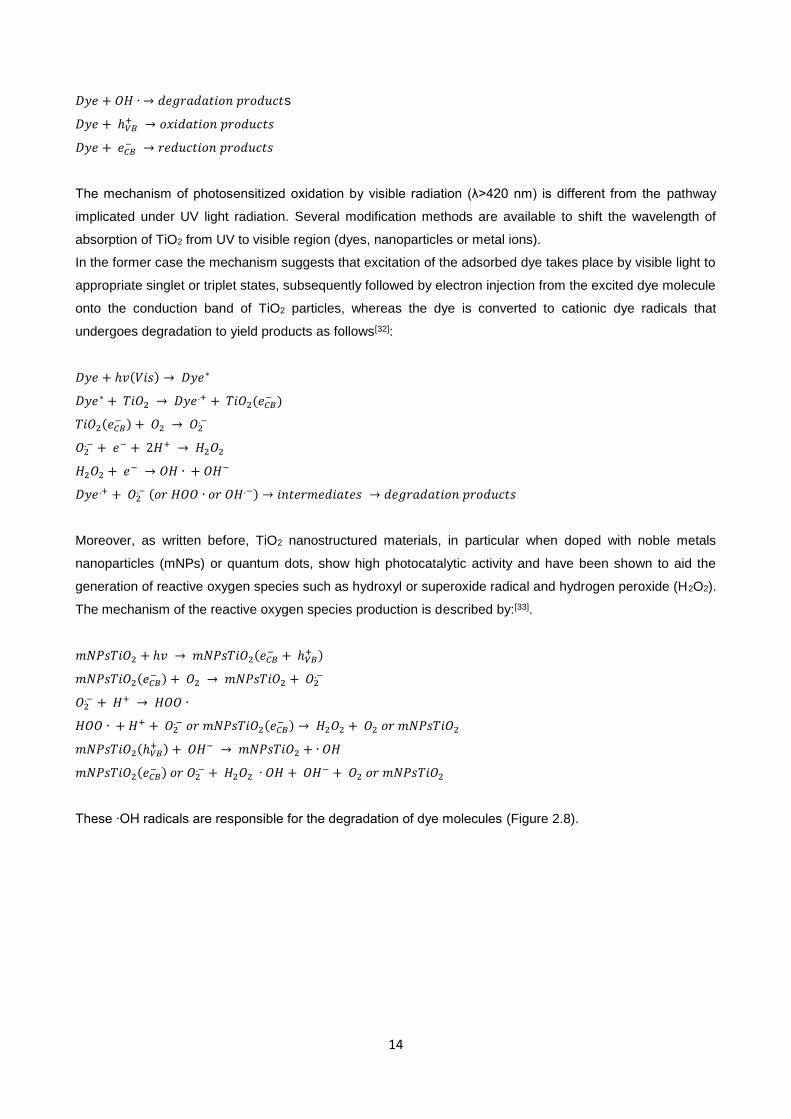
Moreover, as written before, TiO2 nanostructured materials, in particular when doped with noble metals
nanoparticles (mNPs) or quantum dots, show high photocatalytic activity and have been shown to aid the
generation of reactive oxygen species such as hydroxyl or superoxide radical and hydrogen peroxide (H2O2).
The mechanism of the reactive oxygen species production is described by:[33].
𝑚𝑁𝑃𝑠𝑇𝑖𝑂2 + ℎ𝑣 → 𝑚𝑁𝑃𝑠𝑇𝑖𝑂2(𝑒𝐶𝐵− + ℎ𝑉𝐵
+ )
𝑚𝑁𝑃𝑠𝑇𝑖𝑂2(𝑒𝐶𝐵− ) + 𝑂2 → 𝑚𝑁𝑃𝑠𝑇𝑖𝑂2 + 𝑂2
.−
𝑂2.− + 𝐻+ → 𝐻𝑂𝑂 ∙
𝐻𝑂𝑂 ∙ + 𝐻+ + 𝑂2.− 𝑜𝑟 𝑚𝑁𝑃𝑠𝑇𝑖𝑂2(𝑒𝐶𝐵
− ) → 𝐻2𝑂2 + 𝑂2 𝑜𝑟 𝑚𝑁𝑃𝑠𝑇𝑖𝑂2
𝑚𝑁𝑃𝑠𝑇𝑖𝑂2(ℎ𝑉𝐵+ ) + 𝑂𝐻− → 𝑚𝑁𝑃𝑠𝑇𝑖𝑂2 + ∙ 𝑂𝐻
𝑚𝑁𝑃𝑠𝑇𝑖𝑂2(𝑒𝐶𝐵− ) 𝑜𝑟 𝑂2
.− + 𝐻2𝑂2 ∙ 𝑂𝐻 + 𝑂𝐻− + 𝑂2 𝑜𝑟 𝑚𝑁𝑃𝑠𝑇𝑖𝑂2
These ∙OH radicals are responsible for the degradation of dye molecules (Figure 2.8).
15
Figure 2.8. Photodegradation of dyes over mNPs doped TiO2.
So, effective destruction of dyes is possible by photocatalysis in the presence of TiO2 suspensions and UV,
Vis or solar light.
2.2.3. Superhydrophilic Effect
The superhydrophilicity of TiO2 was actually discovered by chance in the work that was being carried out at
the laboratories of TOTO Inc., in 1995. It is well known that superhydrophilicity is an intrinsic property of TiO2.
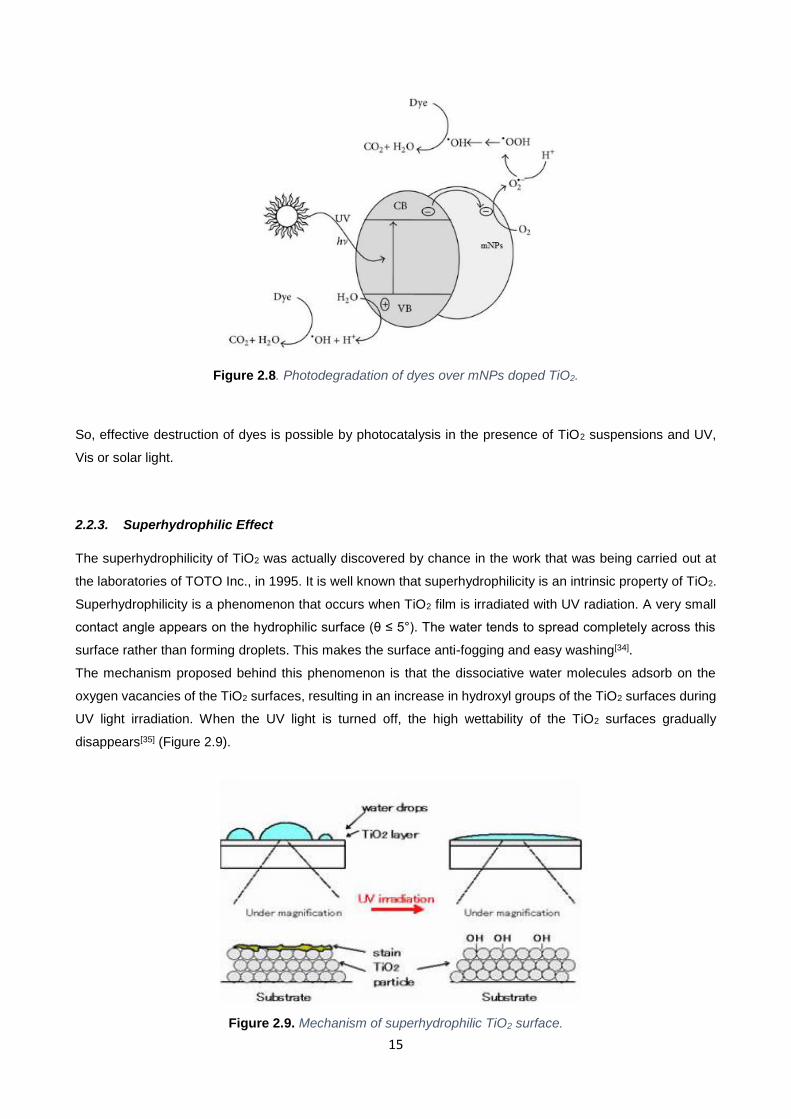
Superhydrophilicity is a phenomenon that occurs when TiO2 film is irradiated with UV radiation. A very small
contact angle appears on the hydrophilic surface (θ ≤ 5°). The water tends to spread completely across this
surface rather than forming droplets. This makes the surface anti-fogging and easy washing[34].
The mechanism proposed behind this phenomenon is that the dissociative water molecules adsorb on the
oxygen vacancies of the TiO2 surfaces, resulting in an increase in hydroxyl groups of the TiO2 surfaces during
UV light irradiation. When the UV light is turned off, the high wettability of the TiO2 surfaces gradually
disappears[35] (Figure 2.9).
Figure 2.9. Mechanism of superhydrophilic TiO2 surface.
16
In terms of the chemical mechanism, electrons tend to reduce Ti(IV) cations to the Ti(III) state, and the holes
oxidize the O2- anions. In the process, oxygen atoms are ejected, creating oxygen vacancies. In general, the
formation processes of defective sites on the TiO2 surface can be expressed as follows:
𝑇𝑖𝑂2 + ℎ𝑣(𝑈𝑉) → 𝑇𝑖𝑂2(𝑒𝐶𝐵− + ℎ𝑉𝐵
+ )
ℎ𝐶𝐵+ + 𝑂2
2− → 𝑂2− (𝑠𝑢𝑟𝑓𝑎𝑐𝑒 𝑡𝑟𝑎𝑝𝑝𝑒𝑑 ℎ𝑜𝑙𝑒)
ℎ𝐶𝐵+ + 𝑂− → 1/2𝑂2 + 𝑊 (𝑜𝑥𝑦𝑔𝑒𝑛 𝑣𝑎𝑐𝑎𝑛𝑐𝑦)
𝑇𝑖4+ + 𝑒− → 𝑇𝑖3+ (𝑠𝑢𝑟𝑓𝑎𝑐𝑒 𝑡𝑟𝑎𝑝𝑝𝑒𝑑 𝑒𝑙𝑒𝑐𝑡𝑟𝑜𝑛)
This process can coexist with the photocatalytic effect, generated by electrons, giving rise to redox reactions
involving the target pollutants rather than Ti cations. Depending on the film morphology, one phenomenon can
prevail over the other. Clearly, the hydrophilic behaviour depends on the vacancies finally occupied by H2O
molecules.
Interestingly, the hydrophilicity of a TiO2 makes the surface anti-fogging and easy- washing[36].
2.2.4. TiO2 Supports
Photocatalytic properties of TiO2 have been the subject of numerous studies due to its excellent photocatalytic
activity under UV radiation, photo stability and easy availability. Different types of modification of TiO2 have
been attempted in order to enhance its photocatalytic activity and expand its activity from UV to visible light
region, which include doping at cationic and anionic sites of TiO2, coupling with other semiconductors,
dispersing it on other porous materials or sensitizing with dyes. Another method for enhancing the
photocatalytic activity of a photocatalyst is to use a support material, which can increase its effective surface
area or by shaping the photocatalyst into nanofiber structures[37].
Various materials have been explored as a TiO2 support for the photodegradation of contaminants in polluted
water. Immobilisation can be carried out on a transparent substrate (glass, fused silica and others) or on an
opaque substrate (activated charcoal, metals and others). From the practical point of view, the ideal support
for photocatalysis must satisfy several criteria as follows:
Strong adherence between catalyst and support;
Non-degradation of the catalyst reactivity by the attachment process;
Offer a high specific surface area;
Have a strong adsorption affinity towards the pollutants[38].
2.2.5. Preparation of TiO2 Films
Research on the preparation, characterization, and testing of films constituted by many kinds of semiconductor
materials has attracted great attention among the scientific community because these devices are widely used
in micro- and opto-electronic industries. The main techniques used to prepare photocatalytic films are:
Dip-coating;
Spin-coating;
17
Flow coating;
Spray drying methods;
Spray-pyrolysis methods;
Physical vapour deposition (PVD);
Chemical vapour deposition (CVD);
Chemical bath deposition;
Thermal or anodic oxidation;
Electrophoretic deposition.
Among the available deposition techniques, dip coating is the most widely used for industrial and especially
laboratory applications which is essential founded on the simple processing, the low cost and the high coating
quality. Nevertheless, other techniques like spin coating, spraying or meniscus coating are practical as well for
some applications.
The main technique used to prepare photocatalytic films is dip-coating.
Dip-coating is carried out by first immersing the support in a liquid, in which the precursor is present, and then
withdrawing it at controlled speed and temperature under atmospheric conditions[26].
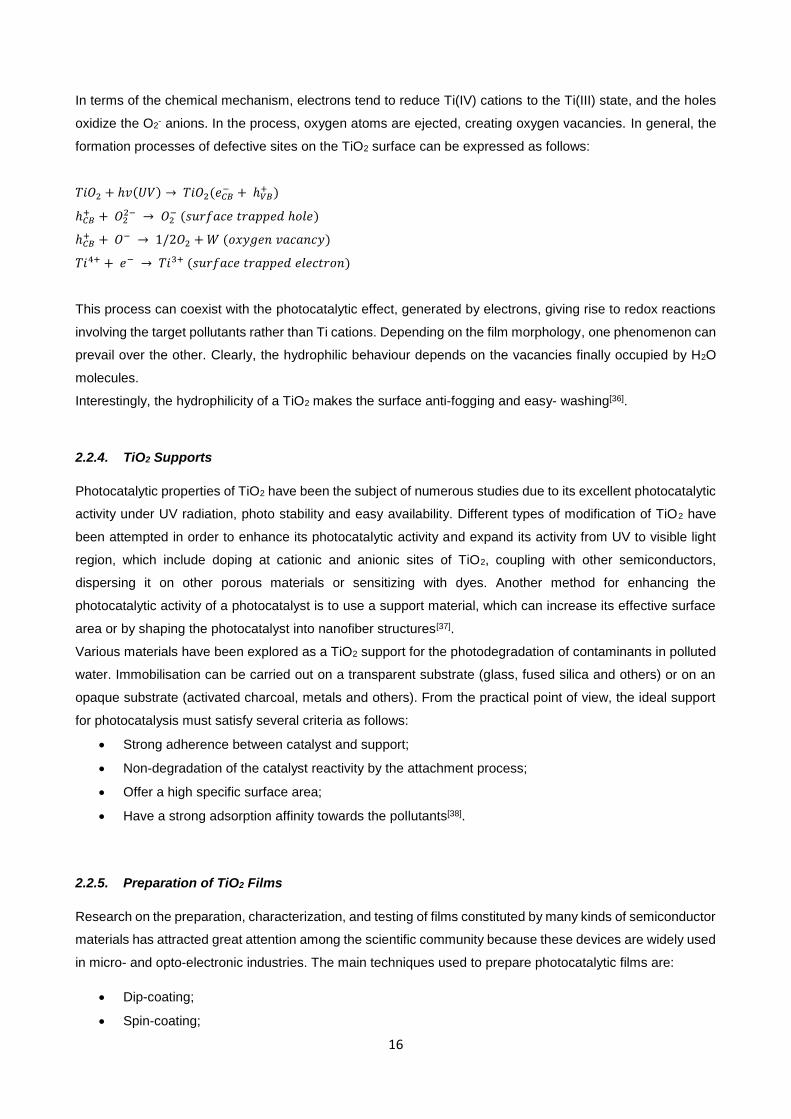
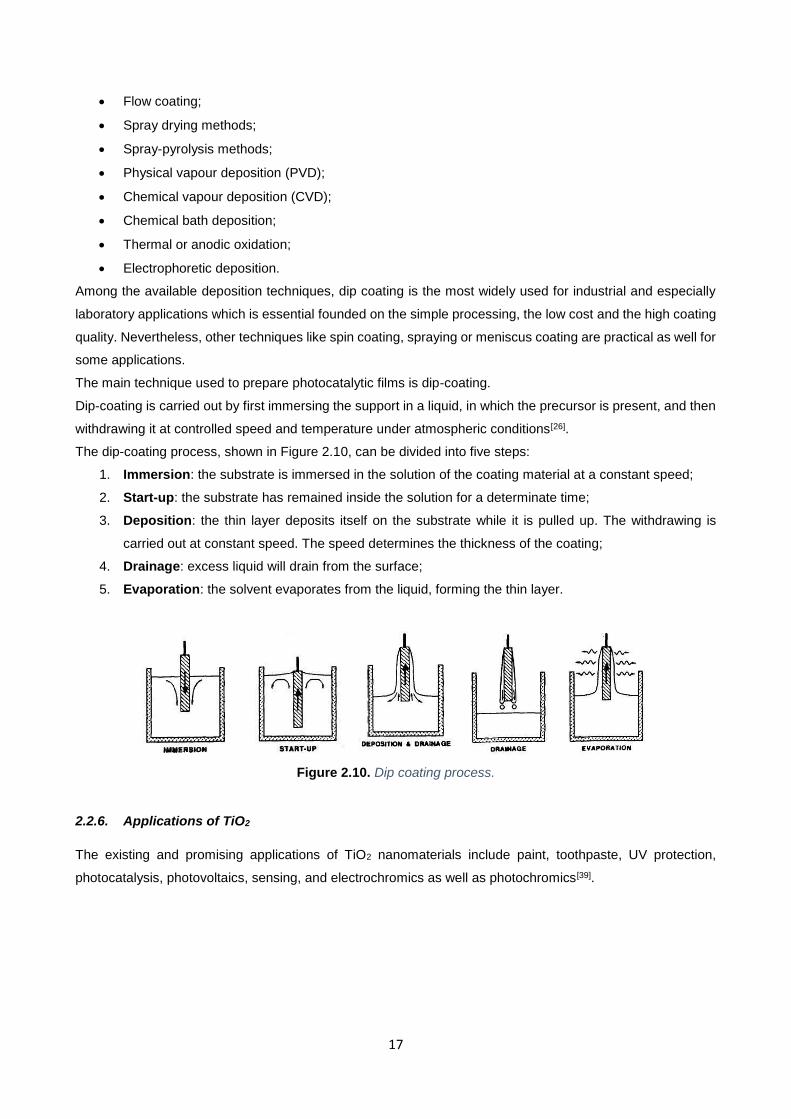
The dip-coating process, shown in Figure 2.10, can be divided into five steps:
1. Immersion: the substrate is immersed in the solution of the coating material at a constant speed;
2. Start-up: the substrate has remained inside the solution for a determinate time;
3. Deposition: the thin layer deposits itself on the substrate while it is pulled up. The withdrawing is
carried out at constant speed. The speed determines the thickness of the coating;
4. Drainage: excess liquid will drain from the surface;
5. Evaporation: the solvent evaporates from the liquid, forming the thin layer.
Figure 2.10. Dip coating process.
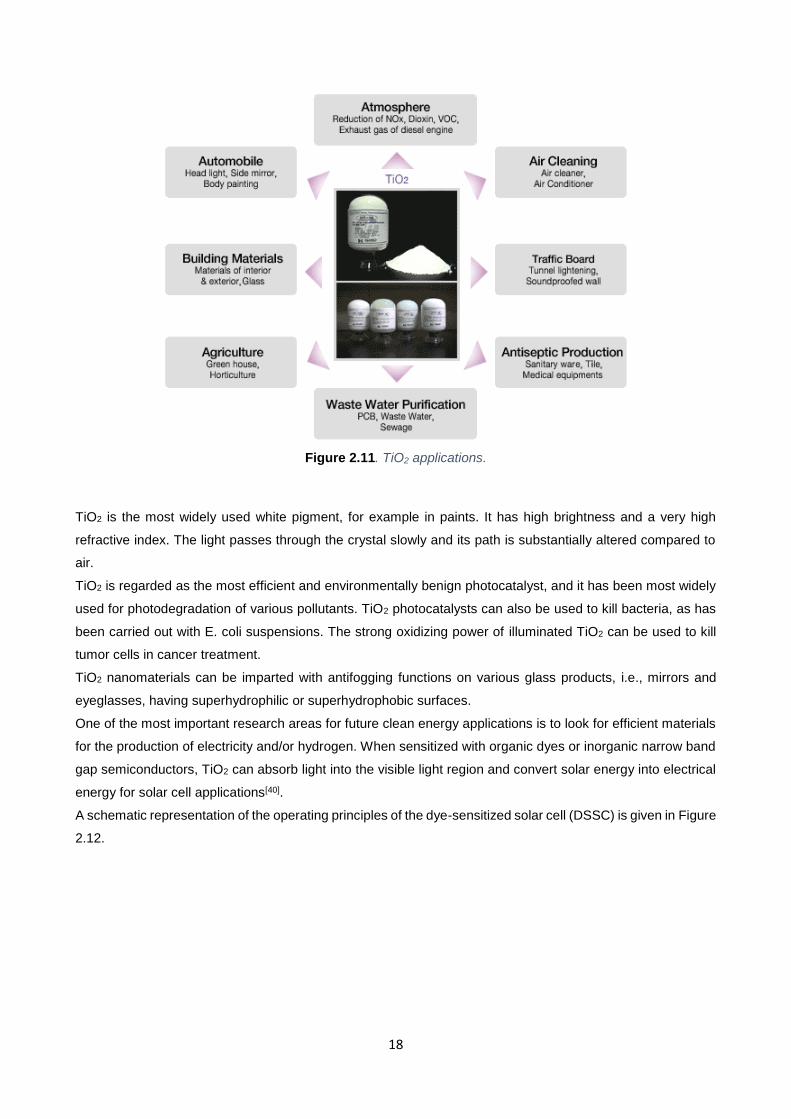
2.2.6. Applications of TiO2
The existing and promising applications of TiO2 nanomaterials include paint, toothpaste, UV protection,
photocatalysis, photovoltaics, sensing, and electrochromics as well as photochromics[39].
18
Figure 2.11. TiO2 applications.
TiO2 is the most widely used white pigment, for example in paints. It has high brightness and a very high
refractive index. The light passes through the crystal slowly and its path is substantially altered compared to
air.
TiO2 is regarded as the most efficient and environmentally benign photocatalyst, and it has been most widely
used for photodegradation of various pollutants. TiO2 photocatalysts can also be used to kill bacteria, as has
been carried out with E. coli suspensions. The strong oxidizing power of illuminated TiO2 can be used to kill
tumor cells in cancer treatment.
TiO2 nanomaterials can be imparted with antifogging functions on various glass products, i.e., mirrors and
eyeglasses, having superhydrophilic or superhydrophobic surfaces.
One of the most important research areas for future clean energy applications is to look for efficient materials
for the production of electricity and/or hydrogen. When sensitized with organic dyes or inorganic narrow band
gap semiconductors, TiO2 can absorb light into the visible light region and convert solar energy into electrical
energy for solar cell applications[40].
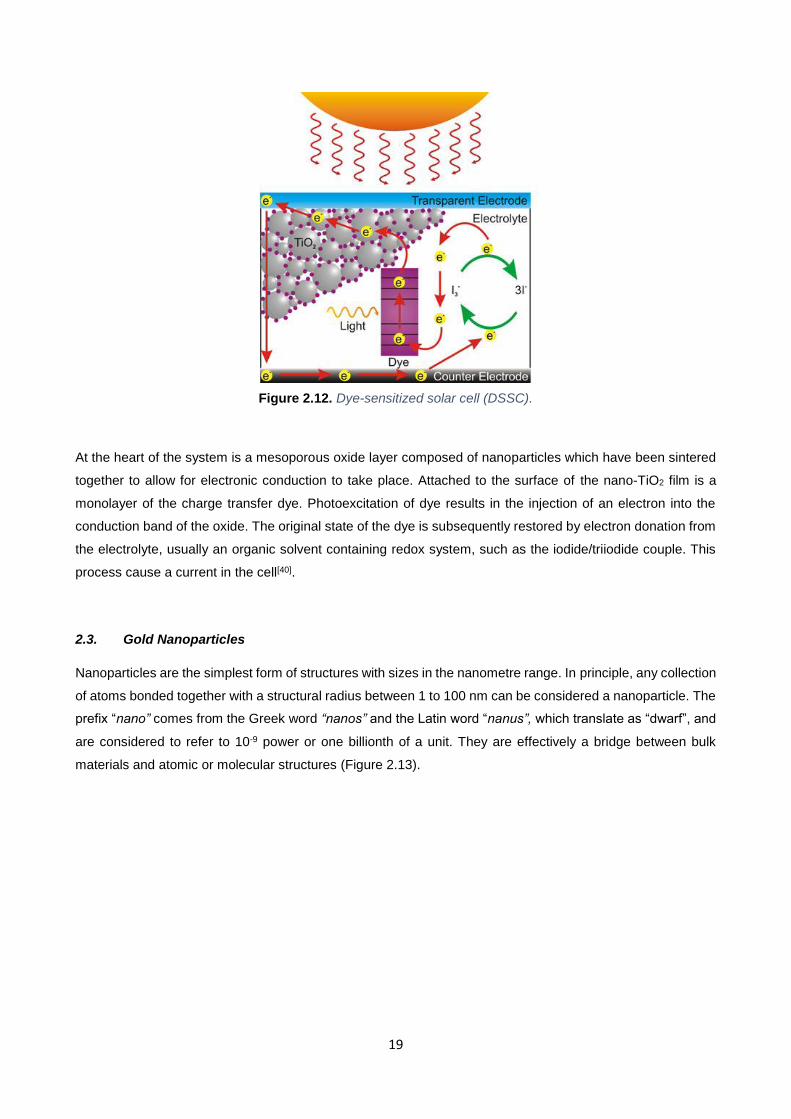
A schematic representation of the operating principles of the dye-sensitized solar cell (DSSC) is given in Figure
2.12.
19
Figure 2.12. Dye-sensitized solar cell (DSSC).
At the heart of the system is a mesoporous oxide layer composed of nanoparticles which have been sintered
together to allow for electronic conduction to take place. Attached to the surface of the nano-TiO2 film is a
monolayer of the charge transfer dye. Photoexcitation of dye results in the injection of an electron into the
conduction band of the oxide. The original state of the dye is subsequently restored by electron donation from
the electrolyte, usually an organic solvent containing redox system, such as the iodide/triiodide couple. This
process cause a current in the cell[40].
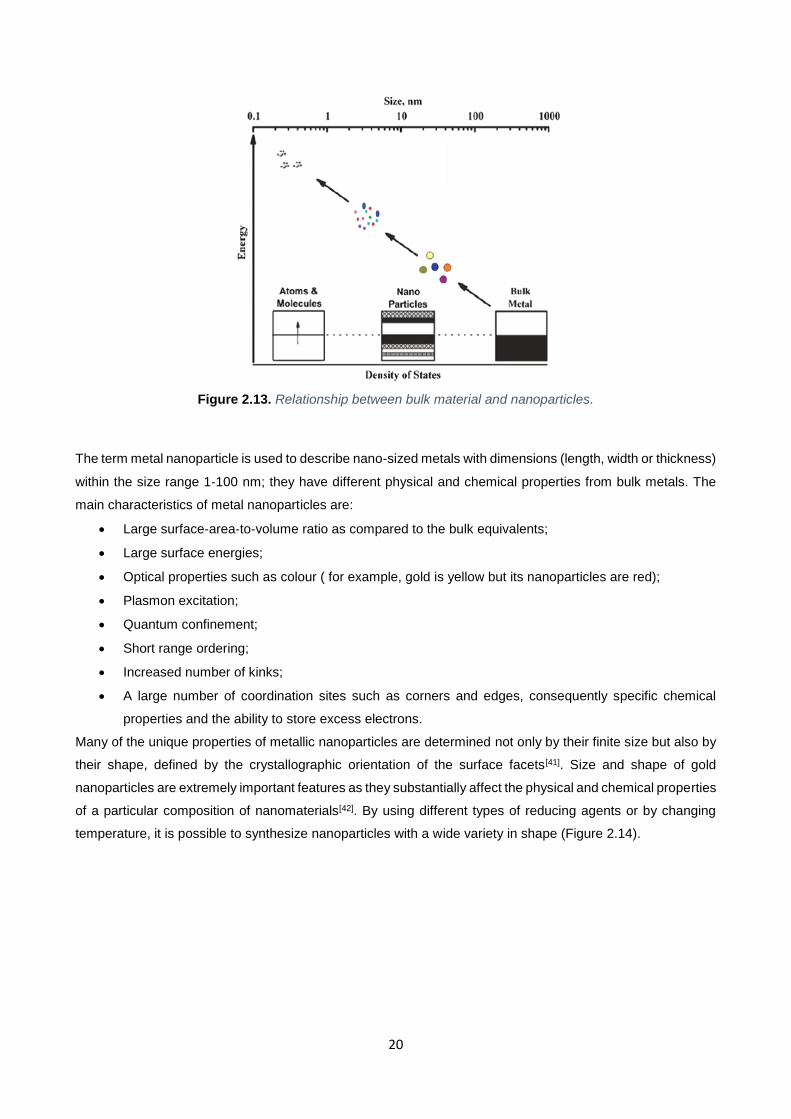
2.3. Gold Nanoparticles
Nanoparticles are the simplest form of structures with sizes in the nanometre range. In principle, any collection
of atoms bonded together with a structural radius between 1 to 100 nm can be considered a nanoparticle. The
prefix “nano” comes from the Greek word “nanos” and the Latin word “nanus”, which translate as “dwarf”, and
are considered to refer to 10-9 power or one billionth of a unit. They are effectively a bridge between bulk
materials and atomic or molecular structures (Figure 2.13).
20
Figure 2.13. Relationship between bulk material and nanoparticles.
The term metal nanoparticle is used to describe nano-sized metals with dimensions (length, width or thickness)
within the size range 1‐100 nm; they have different physical and chemical properties from bulk metals. The
main characteristics of metal nanoparticles are:
Large surface‐area‐to‐volume ratio as compared to the bulk equivalents;
Large surface energies;
Optical properties such as colour ( for example, gold is yellow but its nanoparticles are red);
Plasmon excitation;
Quantum confinement;
Short range ordering;
Increased number of kinks;
A large number of coordination sites such as corners and edges, consequently specific chemical
properties and the ability to store excess electrons.
Many of the unique properties of metallic nanoparticles are determined not only by their finite size but also by
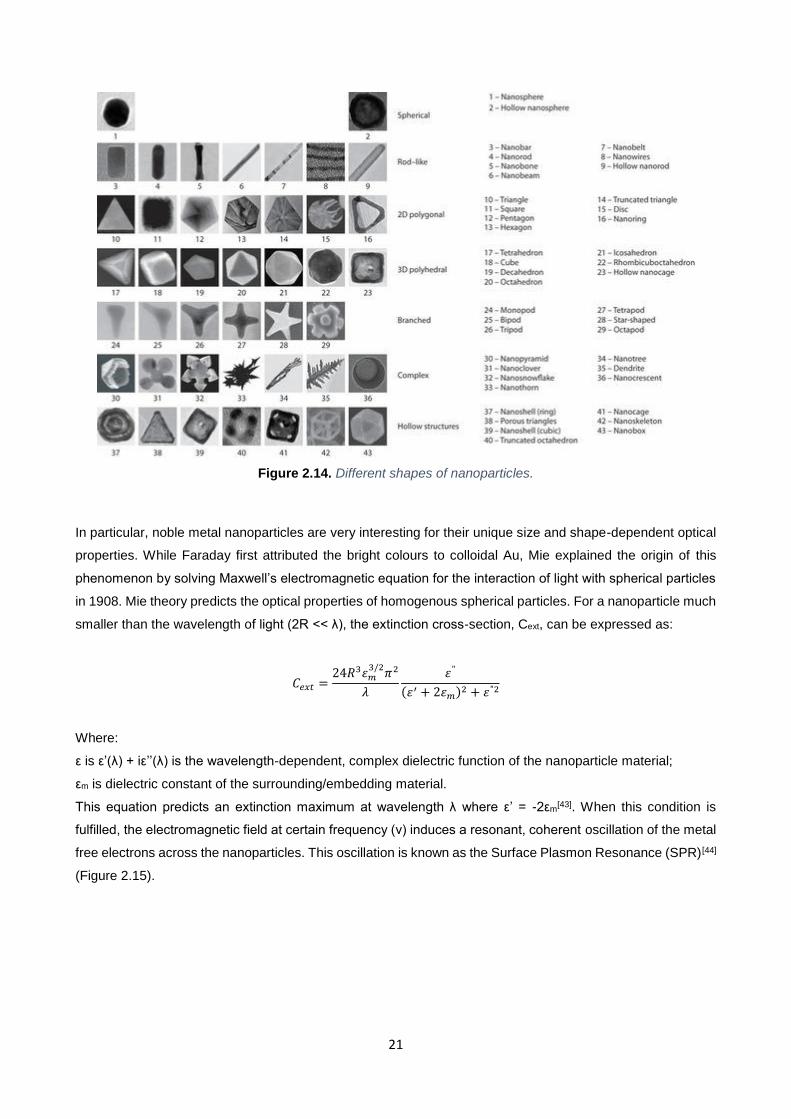
their shape, defined by the crystallographic orientation of the surface facets[41]. Size and shape of gold
nanoparticles are extremely important features as they substantially affect the physical and chemical properties
of a particular composition of nanomaterials[42]. By using different types of reducing agents or by changing
temperature, it is possible to synthesize nanoparticles with a wide variety in shape (Figure 2.14).
21
Figure 2.14. Different shapes of nanoparticles.
In particular, noble metal nanoparticles are very interesting for their unique size and shape-dependent optical
properties. While Faraday first attributed the bright colours to colloidal Au, Mie explained the origin of this
phenomenon by solving Maxwell’s electromagnetic equation for the interaction of light with spherical particles
in 1908. Mie theory predicts the optical properties of homogenous spherical particles. For a nanoparticle much
smaller than the wavelength of light (2R << λ), the extinction cross-section, Cext, can be expressed as:
𝐶𝑒𝑥𝑡 =24𝑅3𝜀𝑚
3/2𝜋2
𝜆
𝜀"
(𝜀′ + 2𝜀𝑚)2 + 𝜀"2
Where:
ε is ε’(λ) + iε’’(λ) is the wavelength-dependent, complex dielectric function of the nanoparticle material;
εm is dielectric constant of the surrounding/embedding material.
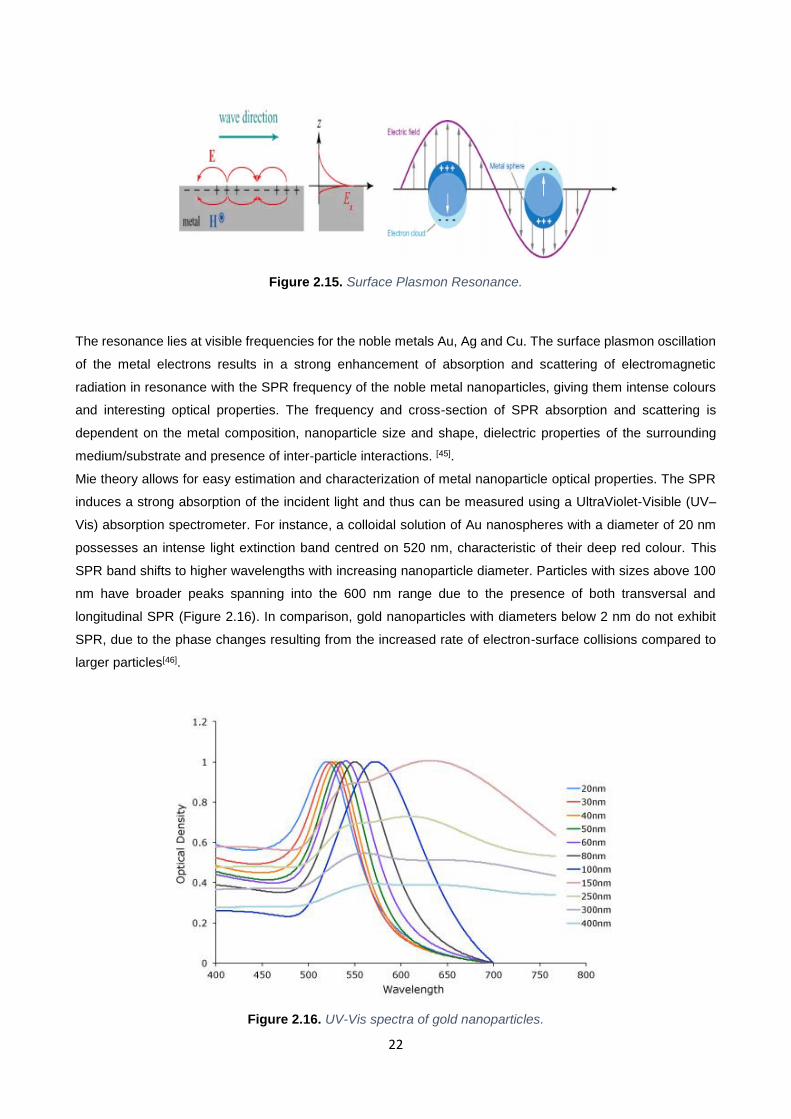
This equation predicts an extinction maximum at wavelength λ where ε’ = -2εm[43]. When this condition is
fulfilled, the electromagnetic field at certain frequency (ν) induces a resonant, coherent oscillation of the metal
free electrons across the nanoparticles. This oscillation is known as the Surface Plasmon Resonance (SPR)[44]
(Figure 2.15).
22
Figure 2.15. Surface Plasmon Resonance.
The resonance lies at visible frequencies for the noble metals Au, Ag and Cu. The surface plasmon oscillation
of the metal electrons results in a strong enhancement of absorption and scattering of electromagnetic
radiation in resonance with the SPR frequency of the noble metal nanoparticles, giving them intense colours
and interesting optical properties. The frequency and cross-section of SPR absorption and scattering is
dependent on the metal composition, nanoparticle size and shape, dielectric properties of the surrounding
medium/substrate and presence of inter-particle interactions. [45].
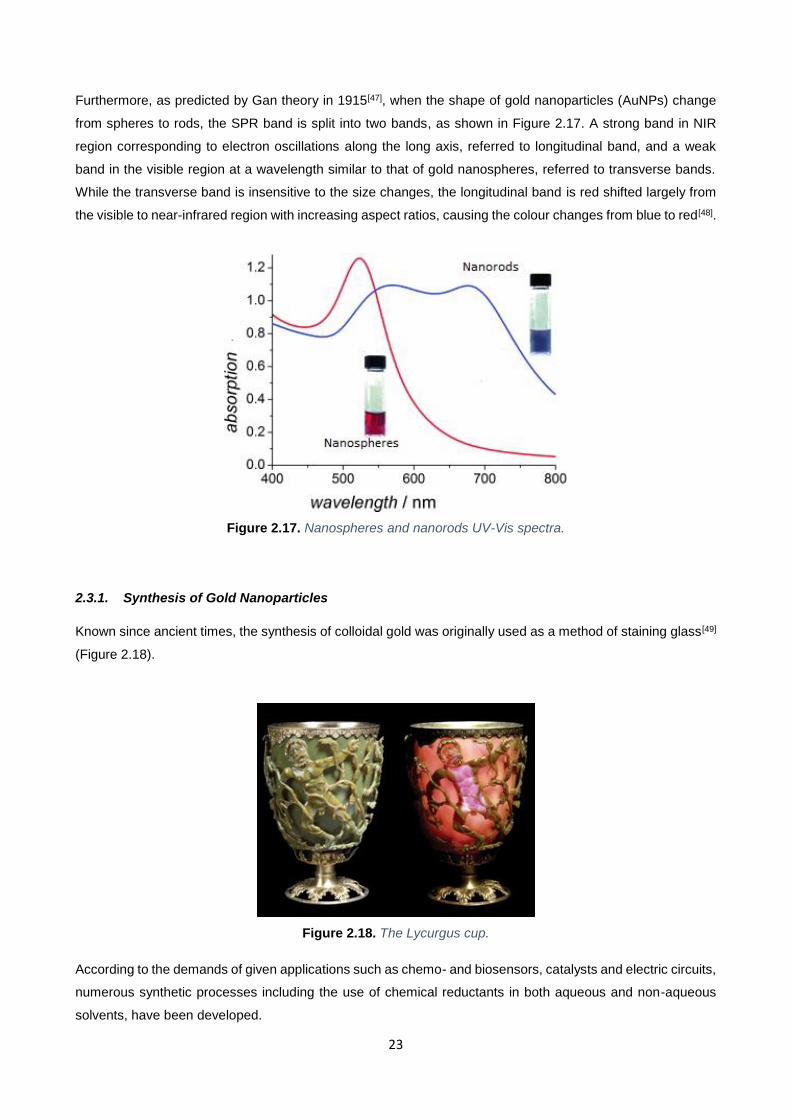
Mie theory allows for easy estimation and characterization of metal nanoparticle optical properties. The SPR
induces a strong absorption of the incident light and thus can be measured using a UltraViolet-Visible (UV–
Vis) absorption spectrometer. For instance, a colloidal solution of Au nanospheres with a diameter of 20 nm
possesses an intense light extinction band centred on 520 nm, characteristic of their deep red colour. This
SPR band shifts to higher wavelengths with increasing nanoparticle diameter. Particles with sizes above 100
nm have broader peaks spanning into the 600 nm range due to the presence of both transversal and
longitudinal SPR (Figure 2.16). In comparison, gold nanoparticles with diameters below 2 nm do not exhibit
SPR, due to the phase changes resulting from the increased rate of electron-surface collisions compared to
larger particles[46].
Figure 2.16. UV-Vis spectra of gold nanoparticles.
23
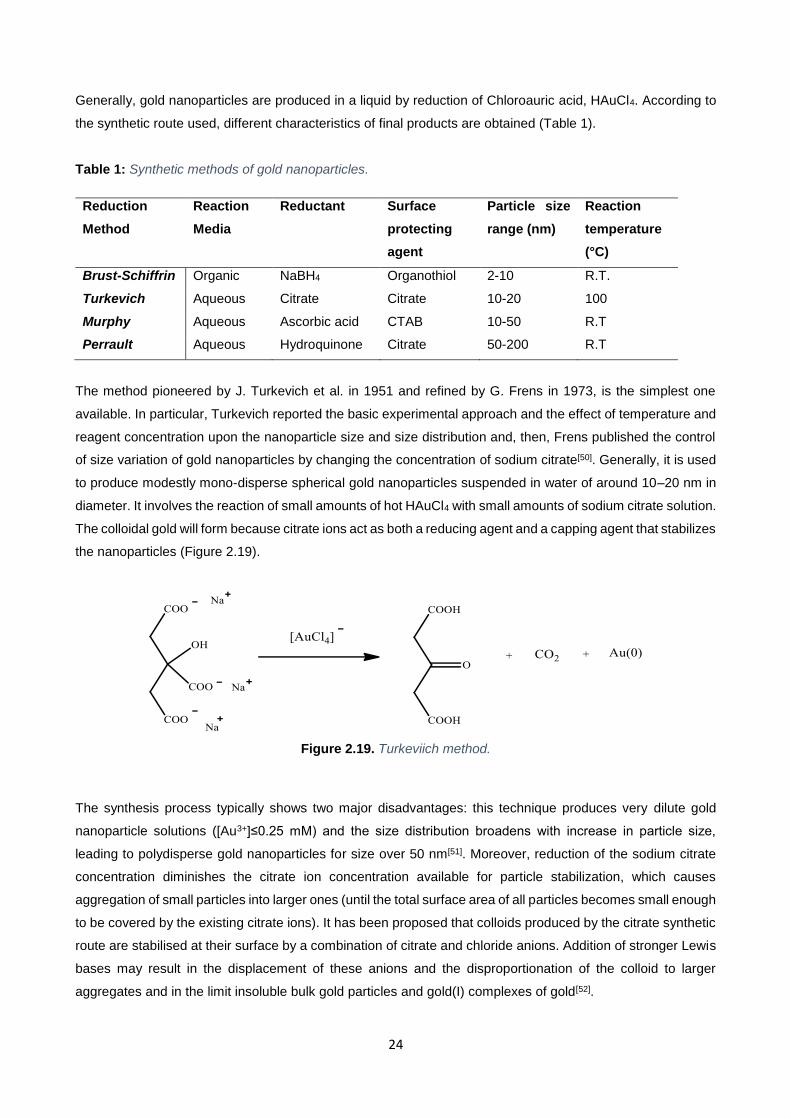
Furthermore, as predicted by Gan theory in 1915[47], when the shape of gold nanoparticles (AuNPs) change
from spheres to rods, the SPR band is split into two bands, as shown in Figure 2.17. A strong band in NIR
region corresponding to electron oscillations along the long axis, referred to longitudinal band, and a weak
band in the visible region at a wavelength similar to that of gold nanospheres, referred to transverse bands.
While the transverse band is insensitive to the size changes, the longitudinal band is red shifted largely from
the visible to near-infrared region with increasing aspect ratios, causing the colour changes from blue to red[48].
Figure 2.17. Nanospheres and nanorods UV-Vis spectra.
2.3.1. Synthesis of Gold Nanoparticles
Known since ancient times, the synthesis of colloidal gold was originally used as a method of staining glass[49]
(Figure 2.18).
Figure 2.18. The Lycurgus cup.
According to the demands of given applications such as chemo- and biosensors, catalysts and electric circuits,
numerous synthetic processes including the use of chemical reductants in both aqueous and non-aqueous
solvents, have been developed.
24
Generally, gold nanoparticles are produced in a liquid by reduction of Chloroauric acid, HAuCl4. According to
the synthetic route used, different characteristics of final products are obtained (Table 1).
Table 1: Synthetic methods of gold nanoparticles.
Reduction
Method
Reaction
Media
Reductant Surface
protecting
agent
Particle size
range (nm)
Reaction
temperature
(°C)
Brust-Schiffrin Organic NaBH4 Organothiol 2-10 R.T.
Turkevich Aqueous Citrate Citrate 10-20 100
Murphy Aqueous Ascorbic acid CTAB 10-50 R.T
Perrault Aqueous Hydroquinone Citrate 50-200 R.T
The method pioneered by J. Turkevich et al. in 1951 and refined by G. Frens in 1973, is the simplest one
available. In particular, Turkevich reported the basic experimental approach and the effect of temperature and
reagent concentration upon the nanoparticle size and size distribution and, then, Frens published the control
of size variation of gold nanoparticles by changing the concentration of sodium citrate[50]. Generally, it is used
to produce modestly mono-disperse spherical gold nanoparticles suspended in water of around 10–20 nm in
diameter. It involves the reaction of small amounts of hot HAuCl4 with small amounts of sodium citrate solution.
The colloidal gold will form because citrate ions act as both a reducing agent and a capping agent that stabilizes
the nanoparticles (Figure 2.19).
Figure 2.19. Turkeviich method.
The synthesis process typically shows two major disadvantages: this technique produces very dilute gold
nanoparticle solutions ([Au3+]≤0.25 mM) and the size distribution broadens with increase in particle size,
leading to polydisperse gold nanoparticles for size over 50 nm[51]. Moreover, reduction of the sodium citrate
concentration diminishes the citrate ion concentration available for particle stabilization, which causes
aggregation of small particles into larger ones (until the total surface area of all particles becomes small enough
to be covered by the existing citrate ions). It has been proposed that colloids produced by the citrate synthetic
route are stabilised at their surface by a combination of citrate and chloride anions. Addition of stronger Lewis
bases may result in the displacement of these anions and the disproportionation of the colloid to larger
aggregates and in the limit insoluble bulk gold particles and gold(I) complexes of gold[52].
25
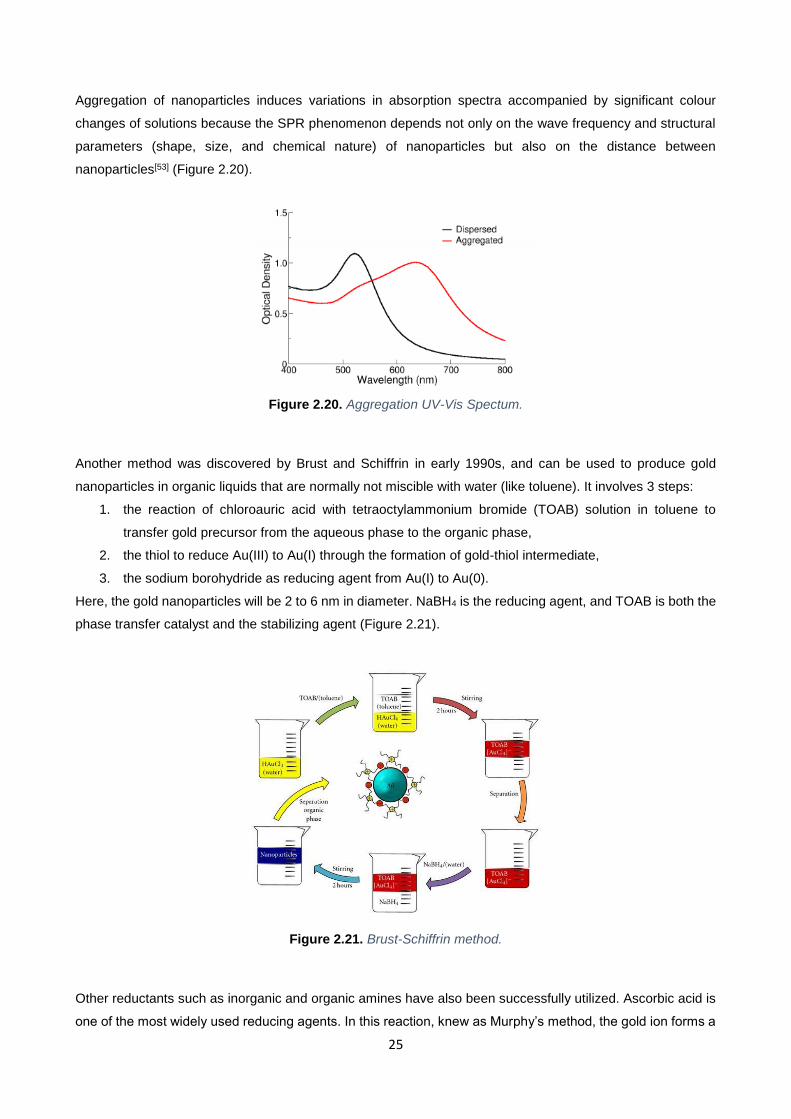
Aggregation of nanoparticles induces variations in absorption spectra accompanied by significant colour
changes of solutions because the SPR phenomenon depends not only on the wave frequency and structural
parameters (shape, size, and chemical nature) of nanoparticles but also on the distance between
nanoparticles[53] (Figure 2.20).
Figure 2.20. Aggregation UV-Vis Spectum.
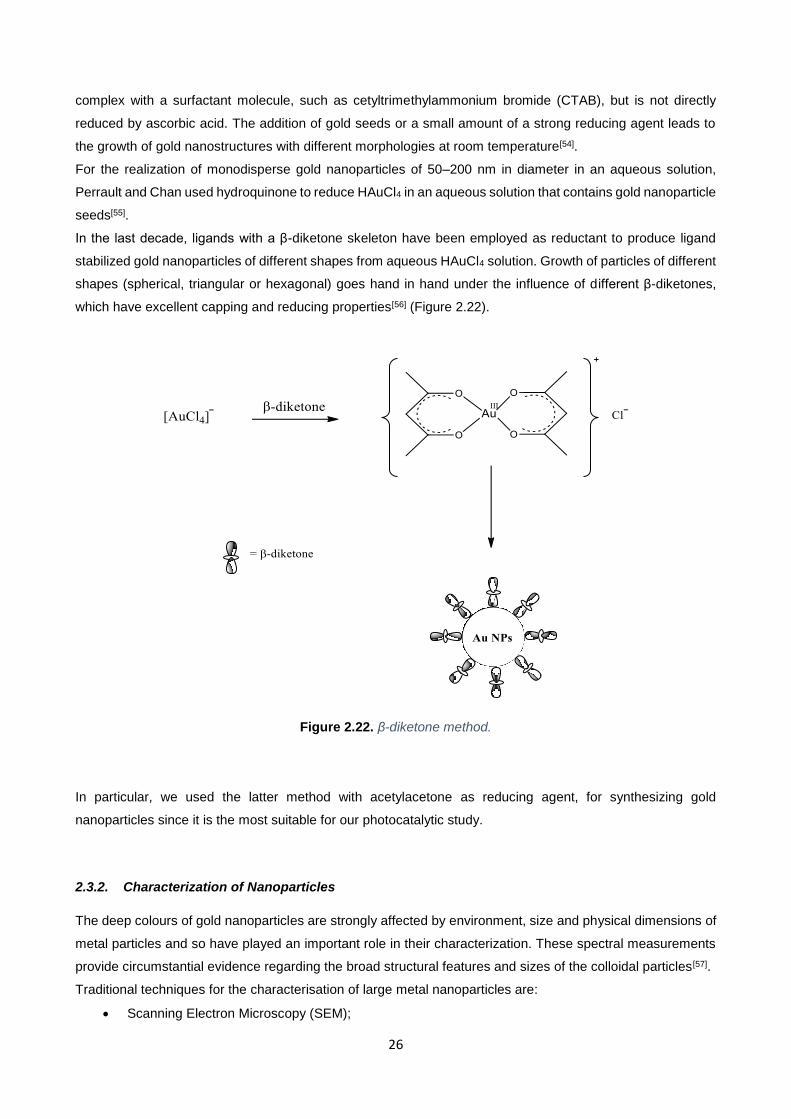
Another method was discovered by Brust and Schiffrin in early 1990s, and can be used to produce gold
nanoparticles in organic liquids that are normally not miscible with water (like toluene). It involves 3 steps:
1. the reaction of chloroauric acid with tetraoctylammonium bromide (TOAB) solution in toluene to
transfer gold precursor from the aqueous phase to the organic phase,
2. the thiol to reduce Au(III) to Au(I) through the formation of gold-thiol intermediate,
3. the sodium borohydride as reducing agent from Au(I) to Au(0).
Here, the gold nanoparticles will be 2 to 6 nm in diameter. NaBH4 is the reducing agent, and TOAB is both the
phase transfer catalyst and the stabilizing agent (Figure 2.21).
Figure 2.21. Brust-Schiffrin method.
Other reductants such as inorganic and organic amines have also been successfully utilized. Ascorbic acid is
one of the most widely used reducing agents. In this reaction, knew as Murphy’s method, the gold ion forms a
26
complex with a surfactant molecule, such as cetyltrimethylammonium bromide (CTAB), but is not directly
reduced by ascorbic acid. The addition of gold seeds or a small amount of a strong reducing agent leads to
the growth of gold nanostructures with different morphologies at room temperature[54].
For the realization of monodisperse gold nanoparticles of 50–200 nm in diameter in an aqueous solution,
Perrault and Chan used hydroquinone to reduce HAuCl4 in an aqueous solution that contains gold nanoparticle
seeds[55].
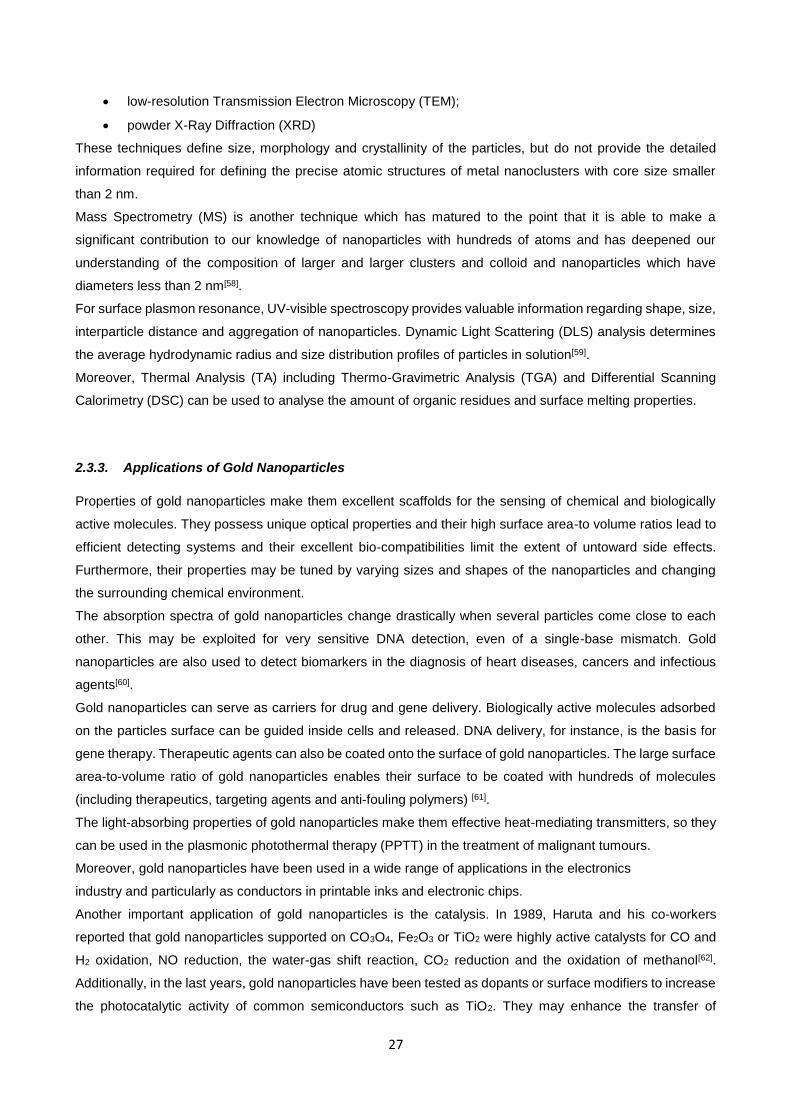
In the last decade, ligands with a β-diketone skeleton have been employed as reductant to produce ligand
stabilized gold nanoparticles of different shapes from aqueous HAuCl4 solution. Growth of particles of different
shapes (spherical, triangular or hexagonal) goes hand in hand under the influence of different β-diketones,
which have excellent capping and reducing properties[56] (Figure 2.22).
Figure 2.22. β-diketone method.
In particular, we used the latter method with acetylacetone as reducing agent, for synthesizing gold
nanoparticles since it is the most suitable for our photocatalytic study.
2.3.2. Characterization of Nanoparticles
The deep colours of gold nanoparticles are strongly affected by environment, size and physical dimensions of
metal particles and so have played an important role in their characterization. These spectral measurements
provide circumstantial evidence regarding the broad structural features and sizes of the colloidal particles[57].
Traditional techniques for the characterisation of large metal nanoparticles are:
Scanning Electron Microscopy (SEM);
27
low-resolution Transmission Electron Microscopy (TEM);
powder X-Ray Diffraction (XRD)
These techniques define size, morphology and crystallinity of the particles, but do not provide the detailed
information required for defining the precise atomic structures of metal nanoclusters with core size smaller
than 2 nm.
Mass Spectrometry (MS) is another technique which has matured to the point that it is able to make a
significant contribution to our knowledge of nanoparticles with hundreds of atoms and has deepened our
understanding of the composition of larger and larger clusters and colloid and nanoparticles which have
diameters less than 2 nm[58].
For surface plasmon resonance, UV-visible spectroscopy provides valuable information regarding shape, size,
interparticle distance and aggregation of nanoparticles. Dynamic Light Scattering (DLS) analysis determines
the average hydrodynamic radius and size distribution profiles of particles in solution[59].
Moreover, Thermal Analysis (TA) including Thermo-Gravimetric Analysis (TGA) and Differential Scanning
Calorimetry (DSC) can be used to analyse the amount of organic residues and surface melting properties.
2.3.3. Applications of Gold Nanoparticles
Properties of gold nanoparticles make them excellent scaffolds for the sensing of chemical and biologically
active molecules. They possess unique optical properties and their high surface area-to volume ratios lead to
efficient detecting systems and their excellent bio-compatibilities limit the extent of untoward side effects.
Furthermore, their properties may be tuned by varying sizes and shapes of the nanoparticles and changing
the surrounding chemical environment.
The absorption spectra of gold nanoparticles change drastically when several particles come close to each
other. This may be exploited for very sensitive DNA detection, even of a single-base mismatch. Gold
nanoparticles are also used to detect biomarkers in the diagnosis of heart diseases, cancers and infectious
agents[60].
Gold nanoparticles can serve as carriers for drug and gene delivery. Biologically active molecules adsorbed
on the particles surface can be guided inside cells and released. DNA delivery, for instance, is the basis for
gene therapy. Therapeutic agents can also be coated onto the surface of gold nanoparticles. The large surface
area-to-volume ratio of gold nanoparticles enables their surface to be coated with hundreds of molecules
(including therapeutics, targeting agents and anti-fouling polymers) [61].
The light-absorbing properties of gold nanoparticles make them effective heat-mediating transmitters, so they
can be used in the plasmonic photothermal therapy (PPTT) in the treatment of malignant tumours.
Moreover, gold nanoparticles have been used in a wide range of applications in the electronics
industry and particularly as conductors in printable inks and electronic chips.
Another important application of gold nanoparticles is the catalysis. In 1989, Haruta and his co-workers
reported that gold nanoparticles supported on CO3O4, Fe2O3 or TiO2 were highly active catalysts for CO and
H2 oxidation, NO reduction, the water-gas shift reaction, CO2 reduction and the oxidation of methanol[62].
Additionally, in the last years, gold nanoparticles have been tested as dopants or surface modifiers to increase
the photocatalytic activity of common semiconductors such as TiO2. They may enhance the transfer of
28
photogenerated electrons prolonging charge carriers lifetime and, thanks to plasmonic properties, may also
activate wide band gap semiconductors towards visible light[63].
2.4. Doping of TiO2 with Gold Nanoparticles
TiO2 has been extensively studied as a most promising photocatalyst for environmental protection due to its
intriguing optical and electric properties but studies in wastewater treatment by TiO2 are still mainly in the stage
of laboratory experiments because of some technical barriers.
Firstly, the widespread technological use of TiO2 is to some extent constrained by its wide band gap (Anatase,
~3.2 eV), which requires ultraviolet irradiation for photocatalytic activation, giving rise to a very low energy
efficiency in utilizing solar light[64]. Because UV light accounts for only a small fraction (5%) of the sun's energy
compared to visible light (45%), the shift in the optical response of TiO2 from the UV to the visible spectral
range will have a profound positive effect on the practical applications of the material. Besides the inefficient
exploitation of visible light, the practical applications were also prohibited due to the following limitations [65]:
1. low adsorption capacity to hydrophobic contaminants;
2. high aggregation tendency;
3. difficulty of separation and recovery.
How to improve the photocatalytic activity of TiO2 in the visible region and reduce high recombination rate of
photogenerated electron-hole pairs are the main focus of the recent TiO2 photocatalysis research. Several
approaches for TiO2 modification have been proposed[66]:
metal-ion implanted TiO2 (e.g., Au);
non-metal doped-TiO2 (e.g., N);
composites of TiO2 with semiconductor having lower band gap energy (e.g. sensitizing of TiO2
with dyes);
TiO2 doped with upconversion luminescence agent.
In particular, noble metal like Au and Ag have been attracting more attention because they have a wide range
of absorption in the visible region and can act as electron traps. [67]
Metal particle of Au or Ag having an intense surface plasmon resonance (SPR) peak can act as a receptor for
light trapping, resulting in photoexcitation of the SPR peak to form a locally enhanced electric field in the
proximity of metal nanoparticles.
SPR improves the solar-energy-conversion efficiency by:
1. extending light absorption to longer wavelengths,
2. increasing light scattering.
The former process enables enhanced absorption of solar light in the semiconductor throughout the visible to
near-infrared light range. This process concentrates the incident photon energy in plasmon oscillations. The
latter process originates from the large scattering cross-section associated with SPR. Metallic nanoparticles
will scatter incident light and locally amplify the electromagnetic field when placed on the surface or inside a
solar material/device. This results in an enhancement of the effective absorption cross section and an increase
in the effective optical path length inside the semiconductor[68] (Figure 2.23).
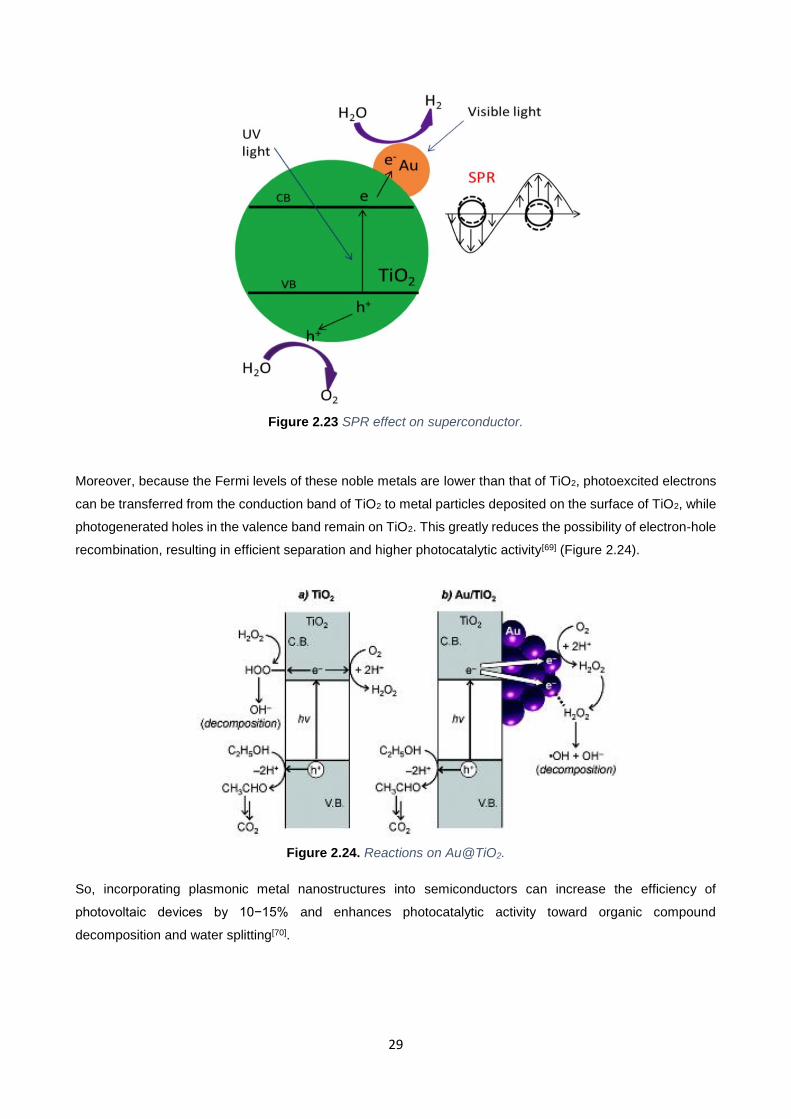
29
Figure 2.23 SPR effect on superconductor.
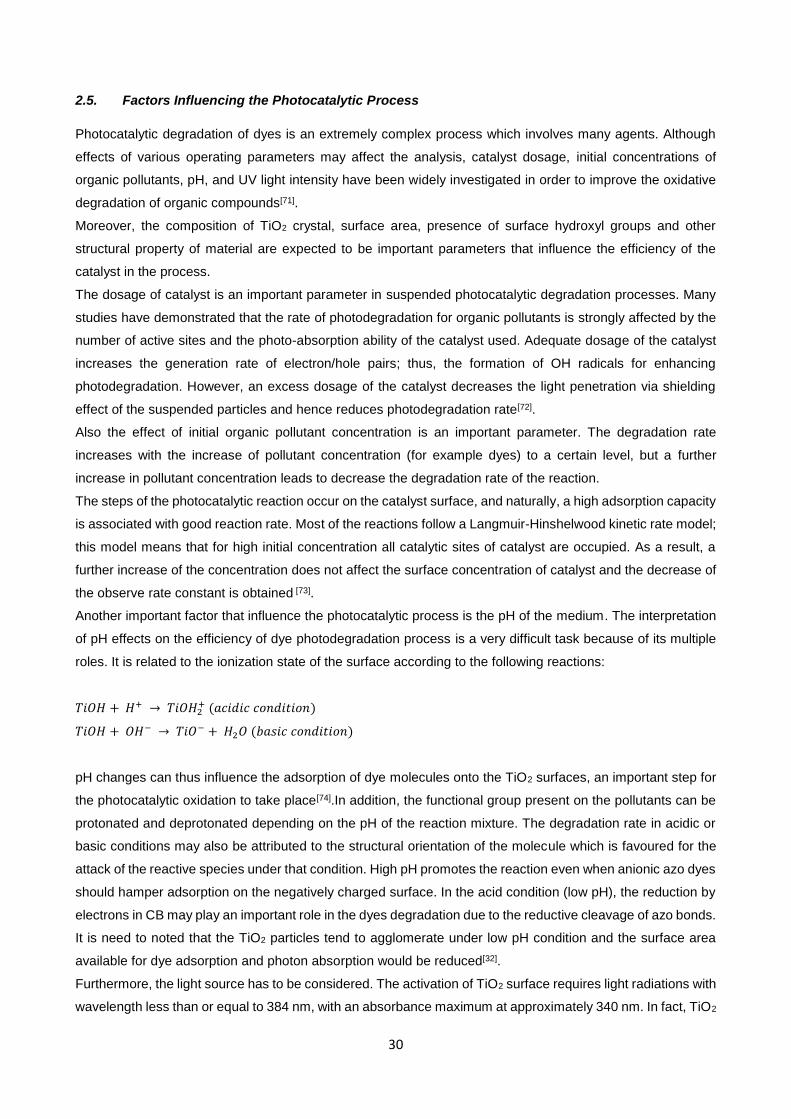
Moreover, because the Fermi levels of these noble metals are lower than that of TiO2, photoexcited electrons
can be transferred from the conduction band of TiO2 to metal particles deposited on the surface of TiO2, while
photogenerated holes in the valence band remain on TiO2. This greatly reduces the possibility of electron-hole
recombination, resulting in efficient separation and higher photocatalytic activity[69] (Figure 2.24).
Figure 2.24. Reactions on Au@TiO2.
So, incorporating plasmonic metal nanostructures into semiconductors can increase the efficiency of
photovoltaic devices by 10−15% and enhances photocatalytic activity toward organic compound
decomposition and water splitting[70].
30
2.5. Factors Influencing the Photocatalytic Process
Photocatalytic degradation of dyes is an extremely complex process which involves many agents. Although
effects of various operating parameters may affect the analysis, catalyst dosage, initial concentrations of
organic pollutants, pH, and UV light intensity have been widely investigated in order to improve the oxidative
degradation of organic compounds[71].
Moreover, the composition of TiO2 crystal, surface area, presence of surface hydroxyl groups and other
structural property of material are expected to be important parameters that influence the efficiency of the
catalyst in the process.
The dosage of catalyst is an important parameter in suspended photocatalytic degradation processes. Many
studies have demonstrated that the rate of photodegradation for organic pollutants is strongly affected by the
number of active sites and the photo-absorption ability of the catalyst used. Adequate dosage of the catalyst
increases the generation rate of electron/hole pairs; thus, the formation of OH radicals for enhancing
photodegradation. However, an excess dosage of the catalyst decreases the light penetration via shielding
effect of the suspended particles and hence reduces photodegradation rate[72].
Also the effect of initial organic pollutant concentration is an important parameter. The degradation rate
increases with the increase of pollutant concentration (for example dyes) to a certain level, but a further
increase in pollutant concentration leads to decrease the degradation rate of the reaction.
The steps of the photocatalytic reaction occur on the catalyst surface, and naturally, a high adsorption capacity
is associated with good reaction rate. Most of the reactions follow a Langmuir-Hinshelwood kinetic rate model;
this model means that for high initial concentration all catalytic sites of catalyst are occupied. As a result, a
further increase of the concentration does not affect the surface concentration of catalyst and the decrease of
the observe rate constant is obtained [73].
Another important factor that influence the photocatalytic process is the pH of the medium. The interpretation
of pH effects on the efficiency of dye photodegradation process is a very difficult task because of its multiple
roles. It is related to the ionization state of the surface according to the following reactions:
𝑇𝑖𝑂𝐻 + 𝐻+ → 𝑇𝑖𝑂𝐻2+ (𝑎𝑐𝑖𝑑𝑖𝑐 𝑐𝑜𝑛𝑑𝑖𝑡𝑖𝑜𝑛)
𝑇𝑖𝑂𝐻 + 𝑂𝐻− → 𝑇𝑖𝑂− + 𝐻2𝑂 (𝑏𝑎𝑠𝑖𝑐 𝑐𝑜𝑛𝑑𝑖𝑡𝑖𝑜𝑛)
pH changes can thus influence the adsorption of dye molecules onto the TiO2 surfaces, an important step for
the photocatalytic oxidation to take place[74].In addition, the functional group present on the pollutants can be
protonated and deprotonated depending on the pH of the reaction mixture. The degradation rate in acidic or
basic conditions may also be attributed to the structural orientation of the molecule which is favoured for the
attack of the reactive species under that condition. High pH promotes the reaction even when anionic azo dyes
should hamper adsorption on the negatively charged surface. In the acid condition (low pH), the reduction by
electrons in CB may play an important role in the dyes degradation due to the reductive cleavage of azo bonds.
It is need to noted that the TiO2 particles tend to agglomerate under low pH condition and the surface area
available for dye adsorption and photon absorption would be reduced[32].
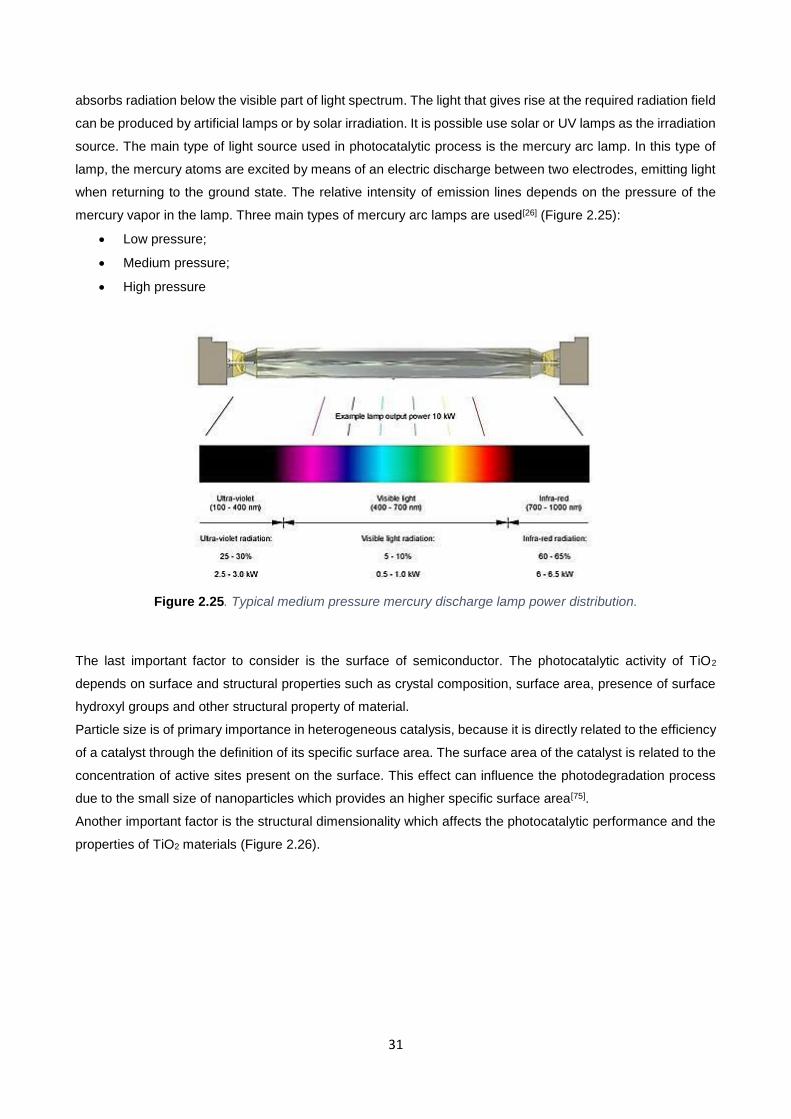
Furthermore, the light source has to be considered. The activation of TiO2 surface requires light radiations with
wavelength less than or equal to 384 nm, with an absorbance maximum at approximately 340 nm. In fact, TiO2
31
absorbs radiation below the visible part of light spectrum. The light that gives rise at the required radiation field
can be produced by artificial lamps or by solar irradiation. It is possible use solar or UV lamps as the irradiation
source. The main type of light source used in photocatalytic process is the mercury arc lamp. In this type of
lamp, the mercury atoms are excited by means of an electric discharge between two electrodes, emitting light
when returning to the ground state. The relative intensity of emission lines depends on the pressure of the
mercury vapor in the lamp. Three main types of mercury arc lamps are used[26] (Figure 2.25):
Low pressure;
Medium pressure;
High pressure
Figure 2.25. Typical medium pressure mercury discharge lamp power distribution.
The last important factor to consider is the surface of semiconductor. The photocatalytic activity of TiO2
depends on surface and structural properties such as crystal composition, surface area, presence of surface
hydroxyl groups and other structural property of material.
Particle size is of primary importance in heterogeneous catalysis, because it is directly related to the efficiency
of a catalyst through the definition of its specific surface area. The surface area of the catalyst is related to the
concentration of active sites present on the surface. This effect can influence the photodegradation process
due to the small size of nanoparticles which provides an higher specific surface area[75].
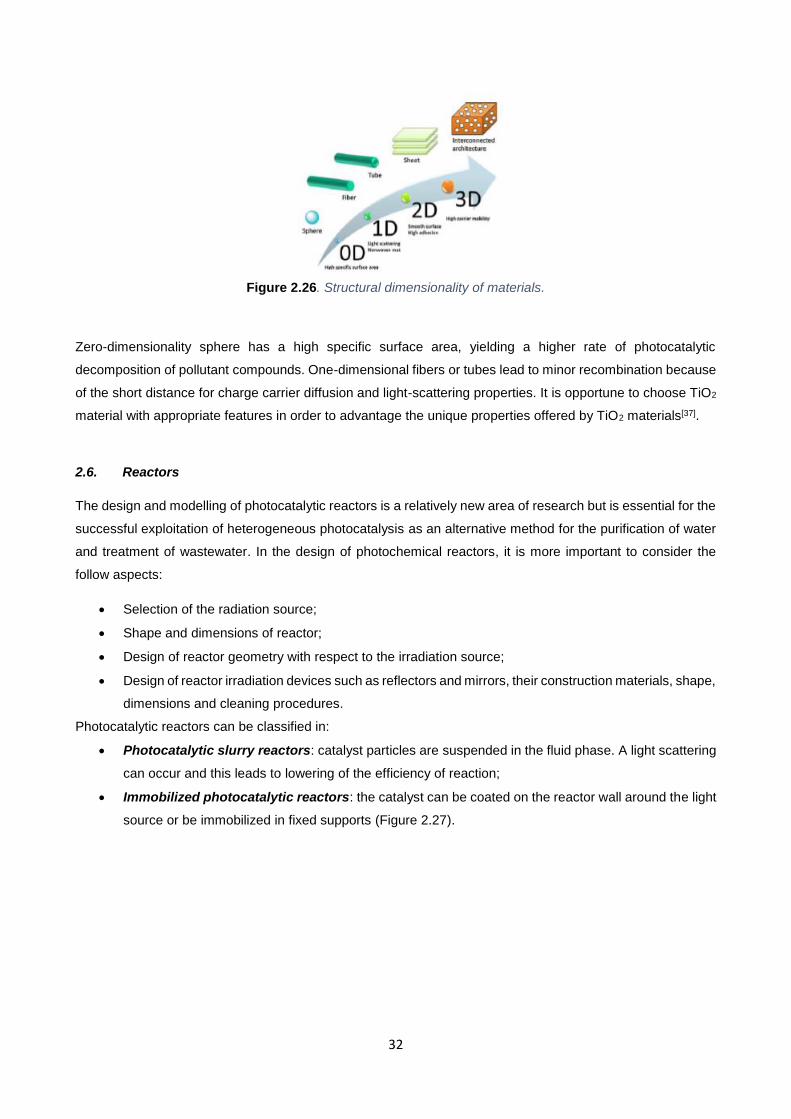
Another important factor is the structural dimensionality which affects the photocatalytic performance and the
properties of TiO2 materials (Figure 2.26).
32
Figure 2.26. Structural dimensionality of materials.
Zero-dimensionality sphere has a high specific surface area, yielding a higher rate of photocatalytic
decomposition of pollutant compounds. One-dimensional fibers or tubes lead to minor recombination because
of the short distance for charge carrier diffusion and light-scattering properties. It is opportune to choose TiO2
material with appropriate features in order to advantage the unique properties offered by TiO2 materials[37].
2.6. Reactors
The design and modelling of photocatalytic reactors is a relatively new area of research but is essential for the
successful exploitation of heterogeneous photocatalysis as an alternative method for the purification of water
and treatment of wastewater. In the design of photochemical reactors, it is more important to consider the
follow aspects:
Selection of the radiation source;
Shape and dimensions of reactor;
Design of reactor geometry with respect to the irradiation source;
Design of reactor irradiation devices such as reflectors and mirrors, their construction materials, shape,
dimensions and cleaning procedures.
Photocatalytic reactors can be classified in:
Photocatalytic slurry reactors: catalyst particles are suspended in the fluid phase. A light scattering
can occur and this leads to lowering of the efficiency of reaction;
Immobilized photocatalytic reactors: the catalyst can be coated on the reactor wall around the light
source or be immobilized in fixed supports (Figure 2.27).
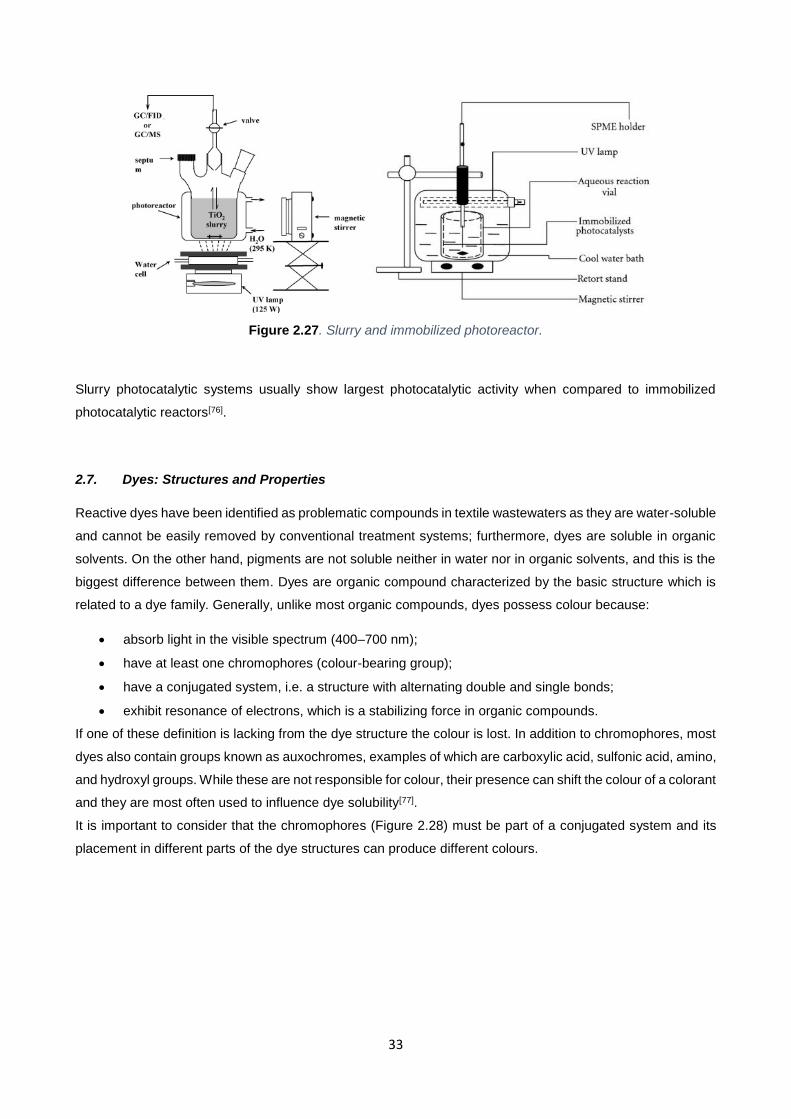
33
Figure 2.27. Slurry and immobilized photoreactor.
Slurry photocatalytic systems usually show largest photocatalytic activity when compared to immobilized
photocatalytic reactors[76].
2.7. Dyes: Structures and Properties
Reactive dyes have been identified as problematic compounds in textile wastewaters as they are water-soluble
and cannot be easily removed by conventional treatment systems; furthermore, dyes are soluble in organic
solvents. On the other hand, pigments are not soluble neither in water nor in organic solvents, and this is the
biggest difference between them. Dyes are organic compound characterized by the basic structure which is
related to a dye family. Generally, unlike most organic compounds, dyes possess colour because:
absorb light in the visible spectrum (400–700 nm);
have at least one chromophores (colour-bearing group);
have a conjugated system, i.e. a structure with alternating double and single bonds;
exhibit resonance of electrons, which is a stabilizing force in organic compounds.
If one of these definition is lacking from the dye structure the colour is lost. In addition to chromophores, most
dyes also contain groups known as auxochromes, examples of which are carboxylic acid, sulfonic acid, amino,
and hydroxyl groups. While these are not responsible for colour, their presence can shift the colour of a colorant
and they are most often used to influence dye solubility[77].
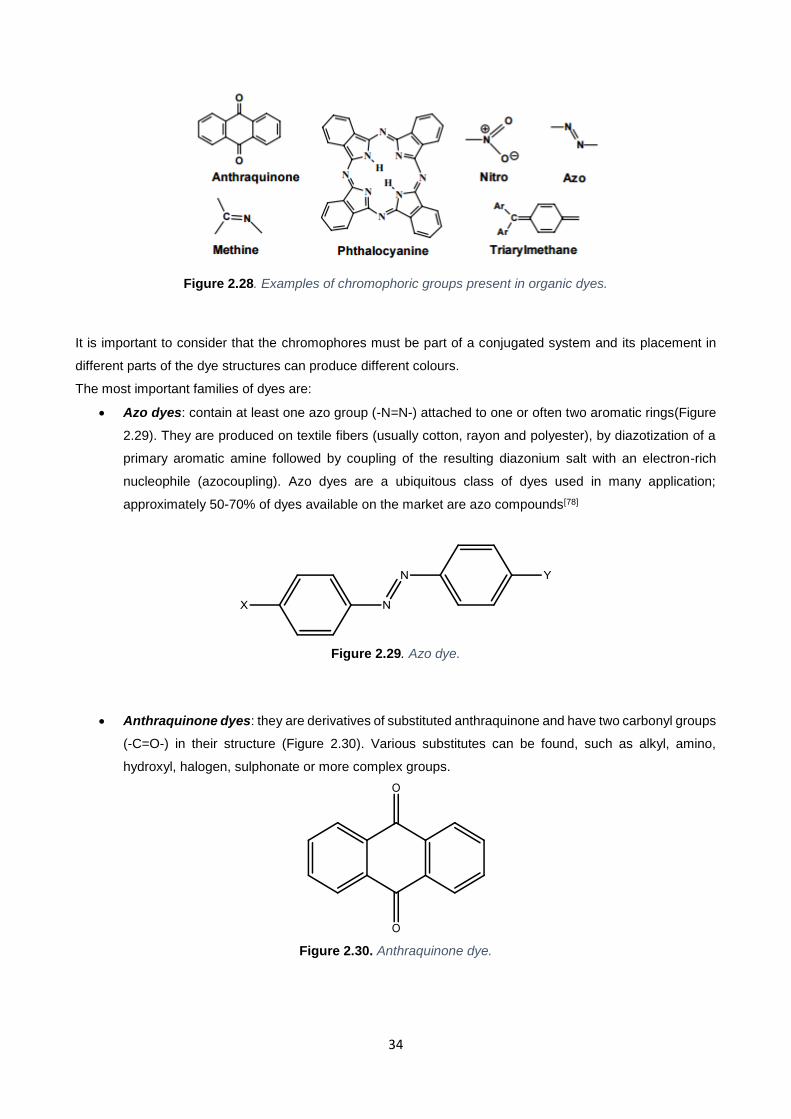
It is important to consider that the chromophores (Figure 2.28) must be part of a conjugated system and its
placement in different parts of the dye structures can produce different colours.
34
Figure 2.28. Examples of chromophoric groups present in organic dyes.
It is important to consider that the chromophores must be part of a conjugated system and its placement in
different parts of the dye structures can produce different colours.
The most important families of dyes are:
Azo dyes: contain at least one azo group (-N=N-) attached to one or often two aromatic rings(Figure
2.29). They are produced on textile fibers (usually cotton, rayon and polyester), by diazotization of a
primary aromatic amine followed by coupling of the resulting diazonium salt with an electron-rich
nucleophile (azocoupling). Azo dyes are a ubiquitous class of dyes used in many application;
approximately 50-70% of dyes available on the market are azo compounds[78]
Figure 2.29. Azo dye.
Anthraquinone dyes: they are derivatives of substituted anthraquinone and have two carbonyl groups
(-C=O-) in their structure (Figure 2.30). Various substitutes can be found, such as alkyl, amino,
hydroxyl, halogen, sulphonate or more complex groups.
Figure 2.30. Anthraquinone dye.
35
The leading example of anthraquinone derivative used as a dye is Alizarin (Figure 2.31), known as Turkish red
or Mordant Red 11. The discovery of a synthetic method of alizarin fabrication in the second half of the 19th
century revolutionized the textile industry. The British Army red coats serve as a good example of large scale
production of coloured fabrics[79]
Figure 2.31. Alizarin structure.
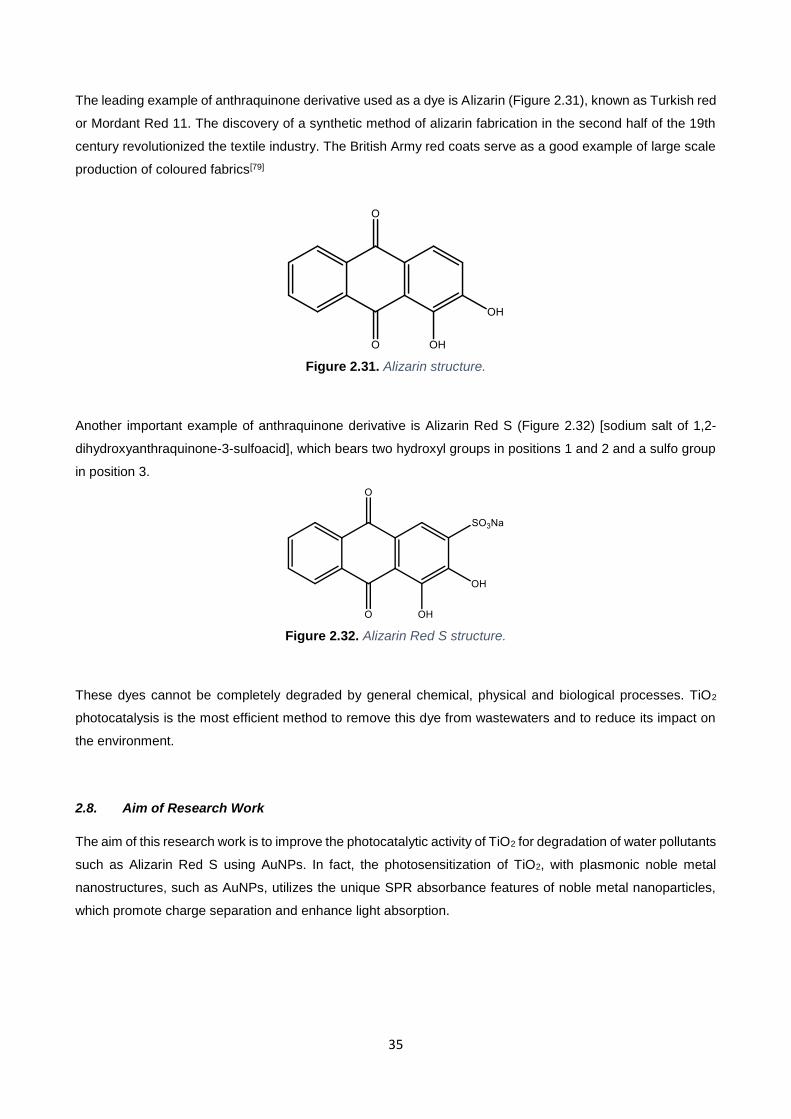
Another important example of anthraquinone derivative is Alizarin Red S (Figure 2.32) [sodium salt of 1,2-
dihydroxyanthraquinone-3-sulfoacid], which bears two hydroxyl groups in positions 1 and 2 and a sulfo group
in position 3.
Figure 2.32. Alizarin Red S structure.
These dyes cannot be completely degraded by general chemical, physical and biological processes. TiO2
photocatalysis is the most efficient method to remove this dye from wastewaters and to reduce its impact on
the environment.
2.8. Aim of Research Work
The aim of this research work is to improve the photocatalytic activity of TiO2 for degradation of water pollutants
such as Alizarin Red S using AuNPs. In fact, the photosensitization of TiO2, with plasmonic noble metal
nanostructures, such as AuNPs, utilizes the unique SPR absorbance features of noble metal nanoparticles,
which promote charge separation and enhance light absorption.
36
3. EXPERIMENTAL SECTION
3.1. Instrumentation
3.1.1. UV-Vis Spectroscopy
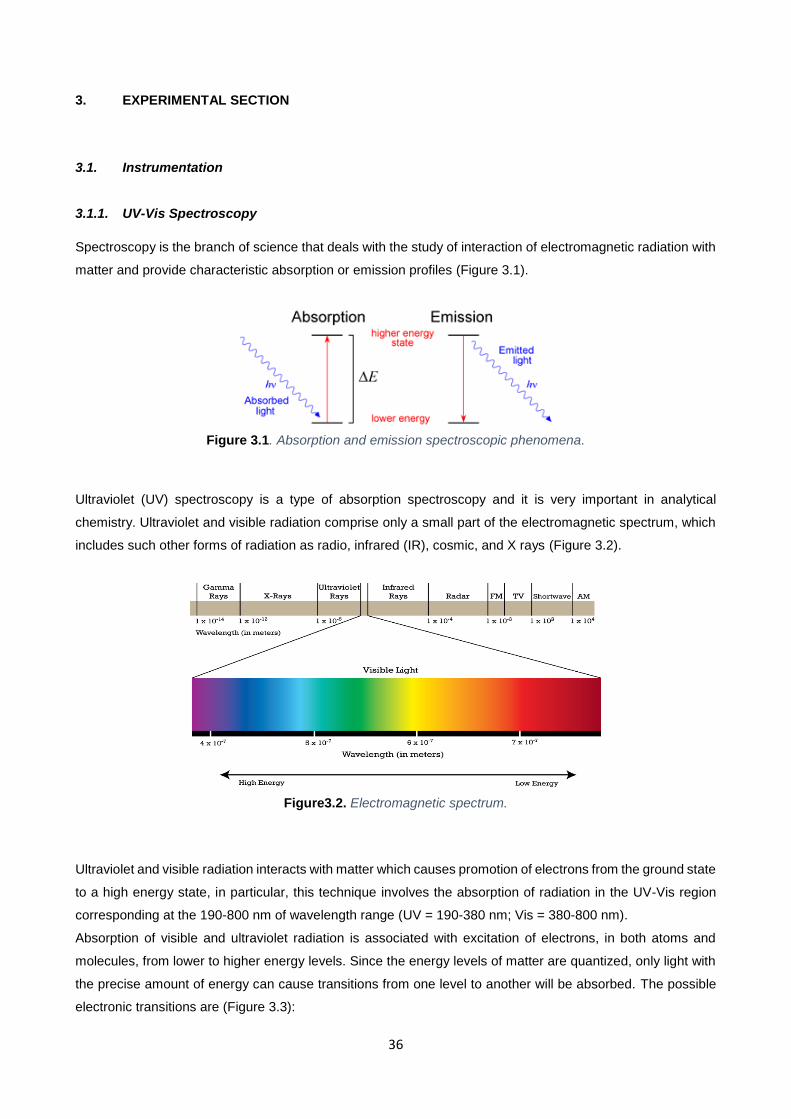
Spectroscopy is the branch of science that deals with the study of interaction of electromagnetic radiation with
matter and provide characteristic absorption or emission profiles (Figure 3.1).
Figure 3.1. Absorption and emission spectroscopic phenomena.
Ultraviolet (UV) spectroscopy is a type of absorption spectroscopy and it is very important in analytical
chemistry. Ultraviolet and visible radiation comprise only a small part of the electromagnetic spectrum, which
includes such other forms of radiation as radio, infrared (IR), cosmic, and X rays (Figure 3.2).
Figure3.2. Electromagnetic spectrum.
Ultraviolet and visible radiation interacts with matter which causes promotion of electrons from the ground state
to a high energy state, in particular, this technique involves the absorption of radiation in the UV-Vis region
corresponding at the 190-800 nm of wavelength range (UV = 190-380 nm; Vis = 380-800 nm).
Absorption of visible and ultraviolet radiation is associated with excitation of electrons, in both atoms and
molecules, from lower to higher energy levels. Since the energy levels of matter are quantized, only light with
the precise amount of energy can cause transitions from one level to another will be absorbed. The possible
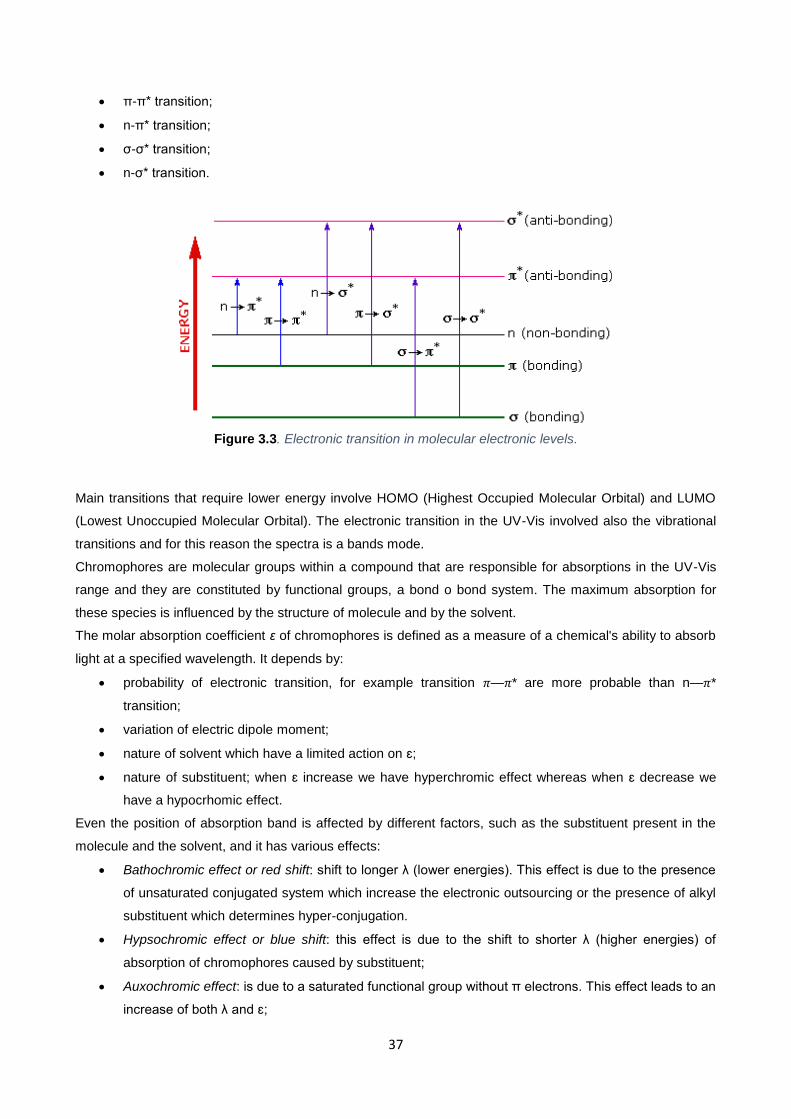
electronic transitions are (Figure 3.3):
37
π-π* transition;
n-π* transition;
σ-σ* transition;
n-σ* transition.
Figure 3.3. Electronic transition in molecular electronic levels.
Main transitions that require lower energy involve HOMO (Highest Occupied Molecular Orbital) and LUMO
(Lowest Unoccupied Molecular Orbital). The electronic transition in the UV-Vis involved also the vibrational
transitions and for this reason the spectra is a bands mode.
Chromophores are molecular groups within a compound that are responsible for absorptions in the UV-Vis
range and they are constituted by functional groups, a bond o bond system. The maximum absorption for
these species is influenced by the structure of molecule and by the solvent.
The molar absorption coefficient ε of chromophores is defined as a measure of a chemical's ability to absorb
light at a specified wavelength. It depends by:
probability of electronic transition, for example transition 𝜋—𝜋* are more probable than n—𝜋*
transition;
variation of electric dipole moment;
nature of solvent which have a limited action on ɛ;
nature of substituent; when ɛ increase we have hyperchromic effect whereas when ɛ decrease we
have a hypocrhomic effect.
Even the position of absorption band is affected by different factors, such as the substituent present in the
molecule and the solvent, and it has various effects:
Bathochromic effect or red shift: shift to longer λ (lower energies). This effect is due to the presence
of unsaturated conjugated system which increase the electronic outsourcing or the presence of alkyl
substituent which determines hyper-conjugation.
Hypsochromic effect or blue shift: this effect is due to the shift to shorter λ (higher energies) of
absorption of chromophores caused by substituent;
Auxochromic effect: is due to a saturated functional group without π electrons. This effect leads to an
increase of both λ and ɛ;
38
Solvent effect: the solvent can change the energetic levels of molecule. For this reason main properties
are the polarity and the ability to form hydrogen bond; in fact solvent stabilizes and destabilizes the
ground state or the excited state of molecule.
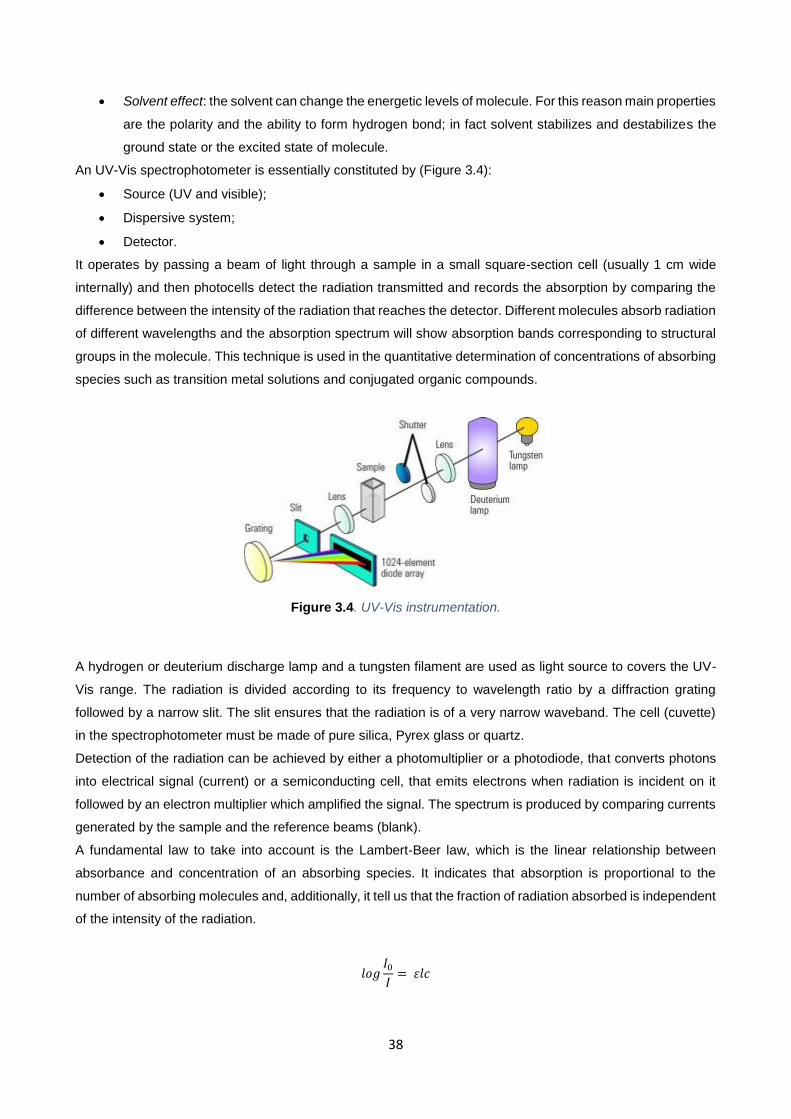
An UV-Vis spectrophotometer is essentially constituted by (Figure 3.4):
Source (UV and visible);
Dispersive system;
Detector.
It operates by passing a beam of light through a sample in a small square-section cell (usually 1 cm wide
internally) and then photocells detect the radiation transmitted and records the absorption by comparing the
difference between the intensity of the radiation that reaches the detector. Different molecules absorb radiation
of different wavelengths and the absorption spectrum will show absorption bands corresponding to structural
groups in the molecule. This technique is used in the quantitative determination of concentrations of absorbing
species such as transition metal solutions and conjugated organic compounds.
Figure 3.4. UV-Vis instrumentation.
A hydrogen or deuterium discharge lamp and a tungsten filament are used as light source to covers the UV-
Vis range. The radiation is divided according to its frequency to wavelength ratio by a diffraction grating
followed by a narrow slit. The slit ensures that the radiation is of a very narrow waveband. The cell (cuvette)
in the spectrophotometer must be made of pure silica, Pyrex glass or quartz.
Detection of the radiation can be achieved by either a photomultiplier or a photodiode, that converts photons
into electrical signal (current) or a semiconducting cell, that emits electrons when radiation is incident on it
followed by an electron multiplier which amplified the signal. The spectrum is produced by comparing currents
generated by the sample and the reference beams (blank).
A fundamental law to take into account is the Lambert-Beer law, which is the linear relationship between
absorbance and concentration of an absorbing species. It indicates that absorption is proportional to the
number of absorbing molecules and, additionally, it tell us that the fraction of radiation absorbed is independent
of the intensity of the radiation.
𝑙𝑜𝑔𝐼0
𝐼= 𝜀𝑙𝑐
39
Where:
𝐼0 is the intensity of incident radiation;
𝐼 is the intensity of transmitted radiation;
ɛ is the molar absorption coefficient which is constant for each absorbing material;
𝑙 is the path length of absorbing solution;
C is the concentration of solution expressed in mol/dm3.
This law can be written as:
𝐴 = 𝜀𝑙𝐶
Where A is the absorbance.
ɛ is independent of concentration and path length compared to the absorption value.
The value log (I0/I) is the absorbance of solution and other useful information can be found in the wavelength
at which maximum absorption occurs (λmax).
If the values of ɛ and λmax are known, the concentration of its solution can be calculated but it is need to
consider the interference eventually present in the sample such as solvent[80].
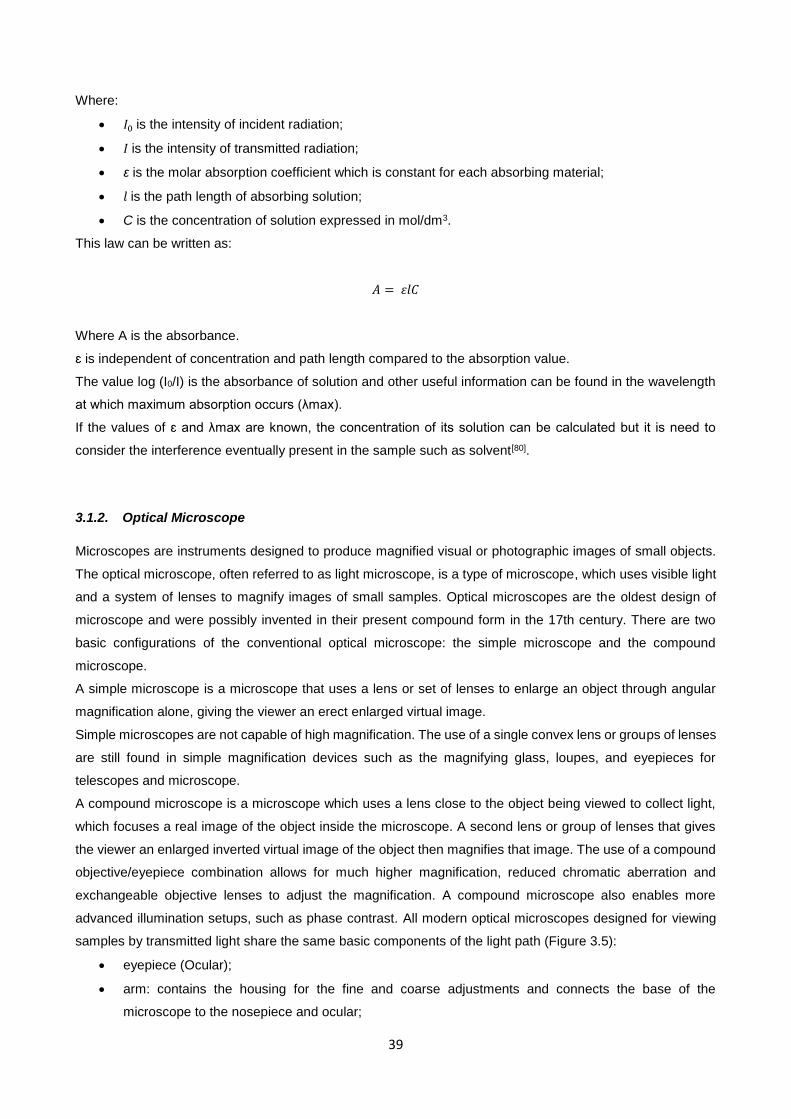
3.1.2. Optical Microscope
Microscopes are instruments designed to produce magnified visual or photographic images of small objects.
The optical microscope, often referred to as light microscope, is a type of microscope, which uses visible light
and a system of lenses to magnify images of small samples. Optical microscopes are the oldest design of
microscope and were possibly invented in their present compound form in the 17th century. There are two
basic configurations of the conventional optical microscope: the simple microscope and the compound
microscope.
A simple microscope is a microscope that uses a lens or set of lenses to enlarge an object through angular
magnification alone, giving the viewer an erect enlarged virtual image.
Simple microscopes are not capable of high magnification. The use of a single convex lens or groups of lenses
are still found in simple magnification devices such as the magnifying glass, loupes, and eyepieces for
telescopes and microscope.
A compound microscope is a microscope which uses a lens close to the object being viewed to collect light,
which focuses a real image of the object inside the microscope. A second lens or group of lenses that gives
the viewer an enlarged inverted virtual image of the object then magnifies that image. The use of a compound
objective/eyepiece combination allows for much higher magnification, reduced chromatic aberration and
exchangeable objective lenses to adjust the magnification. A compound microscope also enables more
advanced illumination setups, such as phase contrast. All modern optical microscopes designed for viewing
samples by transmitted light share the same basic components of the light path (Figure 3.5):
eyepiece (Ocular);
arm: contains the housing for the fine and coarse adjustments and connects the base of the
microscope to the nosepiece and ocular;
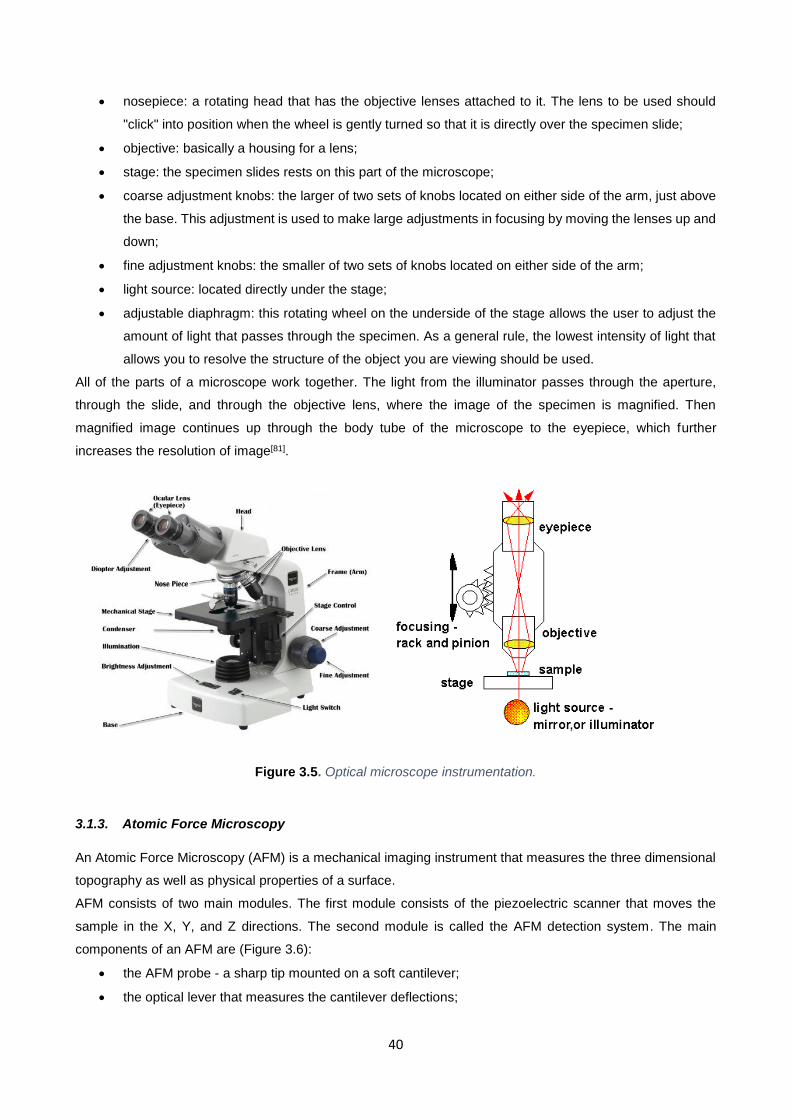
40
nosepiece: a rotating head that has the objective lenses attached to it. The lens to be used should
"click" into position when the wheel is gently turned so that it is directly over the specimen slide;
objective: basically a housing for a lens;
stage: the specimen slides rests on this part of the microscope;
coarse adjustment knobs: the larger of two sets of knobs located on either side of the arm, just above
the base. This adjustment is used to make large adjustments in focusing by moving the lenses up and
down;
fine adjustment knobs: the smaller of two sets of knobs located on either side of the arm;
light source: located directly under the stage;
adjustable diaphragm: this rotating wheel on the underside of the stage allows the user to adjust the
amount of light that passes through the specimen. As a general rule, the lowest intensity of light that
allows you to resolve the structure of the object you are viewing should be used.
All of the parts of a microscope work together. The light from the illuminator passes through the aperture,
through the slide, and through the objective lens, where the image of the specimen is magnified. Then
magnified image continues up through the body tube of the microscope to the eyepiece, which further
increases the resolution of image[81].
3.1.3. Atomic Force Microscopy
An Atomic Force Microscopy (AFM) is a mechanical imaging instrument that measures the three dimensional
topography as well as physical properties of a surface.
AFM consists of two main modules. The first module consists of the piezoelectric scanner that moves the
sample in the X, Y, and Z directions. The second module is called the AFM detection system. The main
components of an AFM are (Figure 3.6):
the AFM probe - a sharp tip mounted on a soft cantilever;
the optical lever that measures the cantilever deflections;
Figure 3.5. Optical microscope instrumentation.
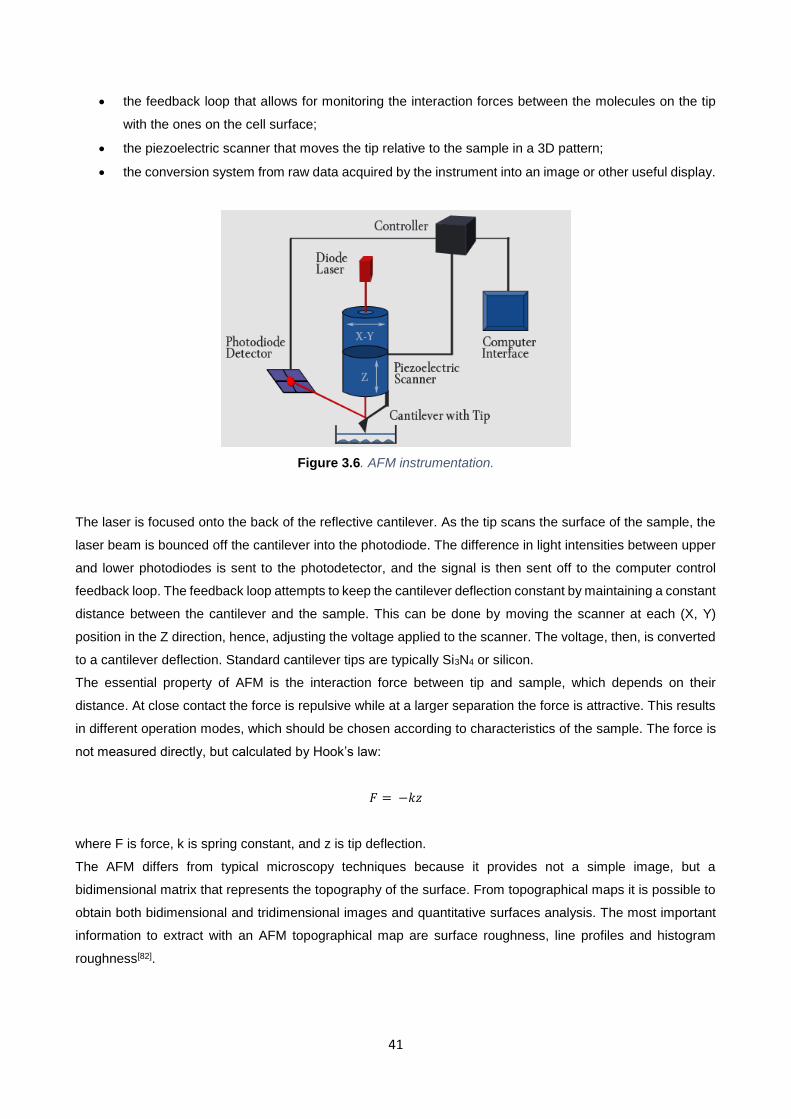
41
the feedback loop that allows for monitoring the interaction forces between the molecules on the tip
with the ones on the cell surface;
the piezoelectric scanner that moves the tip relative to the sample in a 3D pattern;
the conversion system from raw data acquired by the instrument into an image or other useful display.
Figure 3.6. AFM instrumentation.
The laser is focused onto the back of the reflective cantilever. As the tip scans the surface of the sample, the
laser beam is bounced off the cantilever into the photodiode. The difference in light intensities between upper
and lower photodiodes is sent to the photodetector, and the signal is then sent off to the computer control
feedback loop. The feedback loop attempts to keep the cantilever deflection constant by maintaining a constant
distance between the cantilever and the sample. This can be done by moving the scanner at each (X, Y)
position in the Z direction, hence, adjusting the voltage applied to the scanner. The voltage, then, is converted
to a cantilever deflection. Standard cantilever tips are typically Si3N4 or silicon.
The essential property of AFM is the interaction force between tip and sample, which depends on their
distance. At close contact the force is repulsive while at a larger separation the force is attractive. This results
in different operation modes, which should be chosen according to characteristics of the sample. The force is
not measured directly, but calculated by Hook’s law:
𝐹 = −𝑘𝑧
where F is force, k is spring constant, and z is tip deflection.
The AFM differs from typical microscopy techniques because it provides not a simple image, but a
bidimensional matrix that represents the topography of the surface. From topographical maps it is possible to
obtain both bidimensional and tridimensional images and quantitative surfaces analysis. The most important
information to extract with an AFM topographical map are surface roughness, line profiles and histogram
roughness[82].
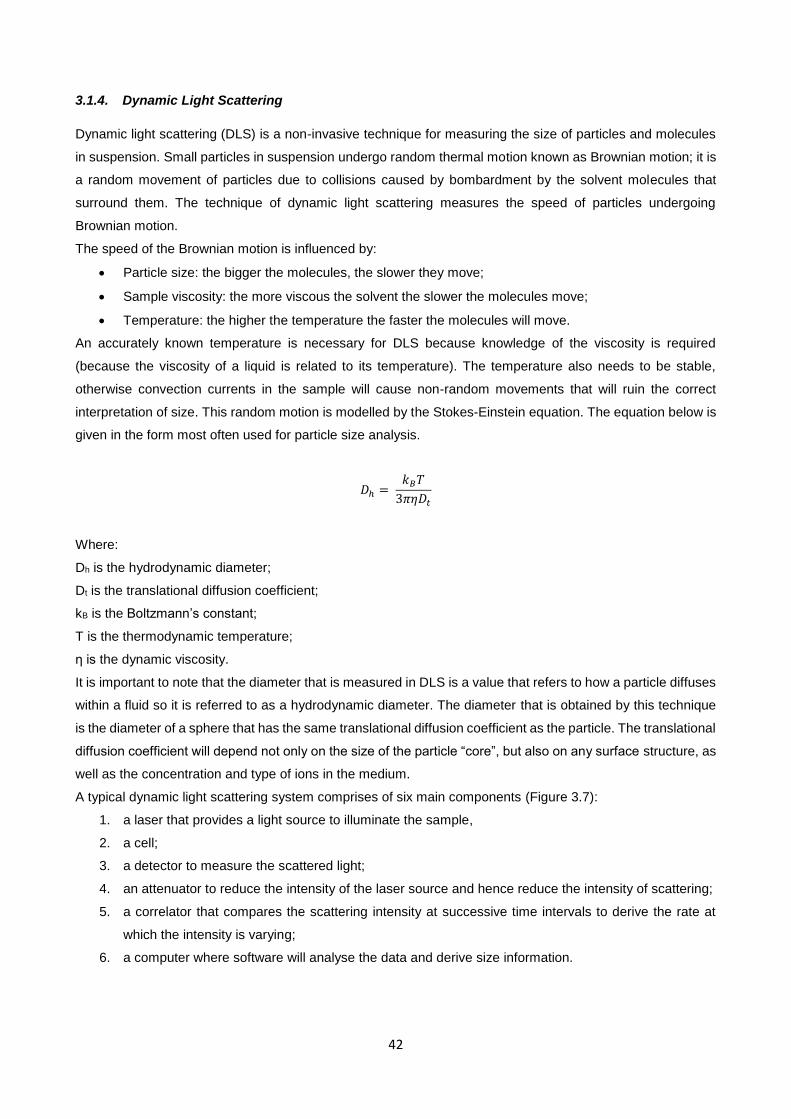
42
3.1.4. Dynamic Light Scattering
Dynamic light scattering (DLS) is a non-invasive technique for measuring the size of particles and molecules
in suspension. Small particles in suspension undergo random thermal motion known as Brownian motion; it is
a random movement of particles due to collisions caused by bombardment by the solvent molecules that
surround them. The technique of dynamic light scattering measures the speed of particles undergoing
Brownian motion.
The speed of the Brownian motion is influenced by:
Particle size: the bigger the molecules, the slower they move;
Sample viscosity: the more viscous the solvent the slower the molecules move;
Temperature: the higher the temperature the faster the molecules will move.
An accurately known temperature is necessary for DLS because knowledge of the viscosity is required
(because the viscosity of a liquid is related to its temperature). The temperature also needs to be stable,
otherwise convection currents in the sample will cause non-random movements that will ruin the correct
interpretation of size. This random motion is modelled by the Stokes-Einstein equation. The equation below is
given in the form most often used for particle size analysis.
𝐷ℎ = 𝑘𝐵𝑇
3𝜋𝜂𝐷𝑡
Where:
Dh is the hydrodynamic diameter;
Dt is the translational diffusion coefficient;
kB is the Boltzmann’s constant;
T is the thermodynamic temperature;
η is the dynamic viscosity.
It is important to note that the diameter that is measured in DLS is a value that refers to how a particle diffuses
within a fluid so it is referred to as a hydrodynamic diameter. The diameter that is obtained by this technique
is the diameter of a sphere that has the same translational diffusion coefficient as the particle. The translational
diffusion coefficient will depend not only on the size of the particle “core”, but also on any surface structure, as
well as the concentration and type of ions in the medium.
A typical dynamic light scattering system comprises of six main components (Figure 3.7):
1. a laser that provides a light source to illuminate the sample,
2. a cell;
3. a detector to measure the scattered light;
4. an attenuator to reduce the intensity of the laser source and hence reduce the intensity of scattering;
5. a correlator that compares the scattering intensity at successive time intervals to derive the rate at
which the intensity is varying;
6. a computer where software will analyse the data and derive size information.
43
Figure 3.7. DLS instrumentation.
The sample is illuminated by a laser beam and the fluctuations of the scattered light are detected at a known
scattering angle θ by a fast photon detector.
DLS is able to quantify intensity, volume or number distributions of particles in the sample. The intensity
distribution is naturally weighted according to the scattering intensity of each particle fraction or family. As
such, the intensity distribution can be somewhat misleading, in that a small amount of aggregation/
agglomeration or presence of a larger particle species can dominate the distribution. However, this distribution
can be used as a sensitive detector for the presence of large material in the sample. Although the fundamental
size distribution generated by DLS is an intensity distribution, this can be converted, using Mie theory, to a
volume distribution or a distribution describing the relative proportion of multiple components in the sample
based on their mass or volume rather than based on their scattering. When transforming an intensity
distribution to a volume/mass distribution, there are 4 assumptions that must be accepted.
All particles are spherical;
All particles are homogeneous;
The optical properties of the particles are known;
There is no error in the intensity distribution.
As such, volume and number distributions derived from these intensity distribution are best used for
comparative purposes, or for estimating the relative proportions where there are multiple modes, or peaks,
and should never be considered absolute.
DLS is most commonly used to analyse nanoparticles. Examples include determining nanogold size, protein
size, latex size, and colloid size. In general, the technique is best used for submicron particles and can be
used to measure particle with sizes less than a nanometer. In this size regime (microns to nanometers) and
for the purposes of size measurement the distinction between a molecule and a particle and even a second
liquid phase becomes blurred. Dynamic light scattering can also be used as a probe of complex fluids such as
concentrated solutions. However, this application is much less common than particle sizing[83].
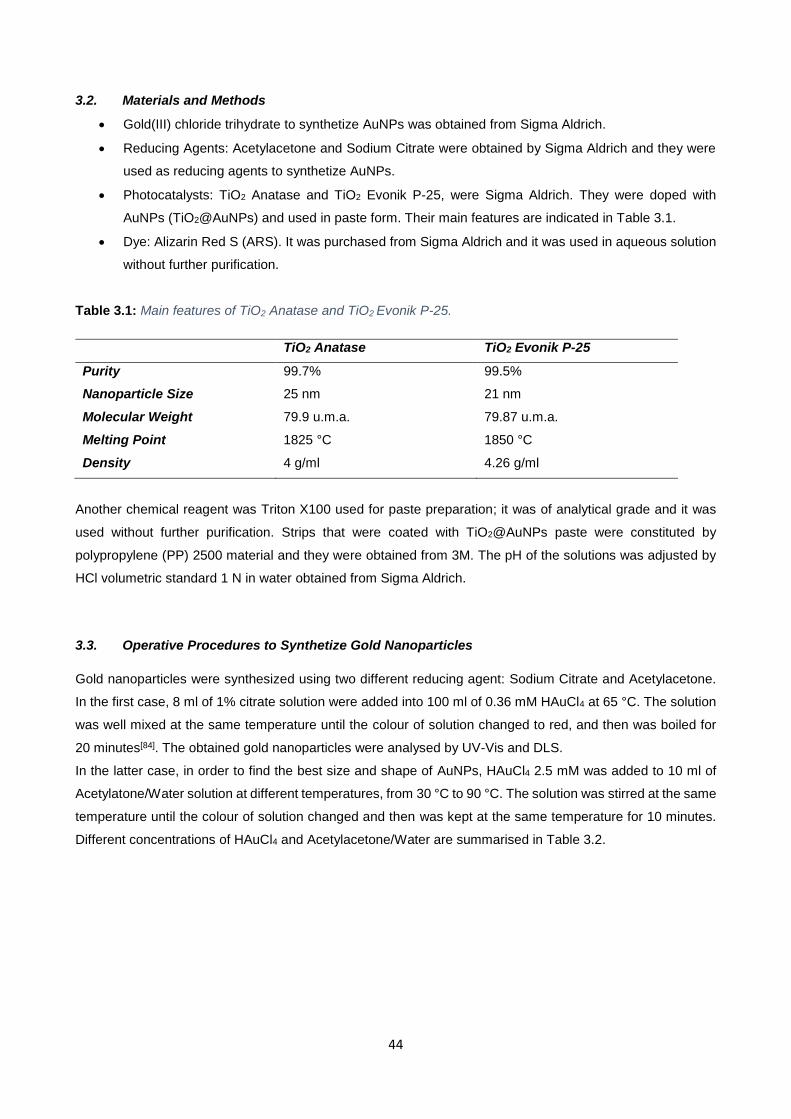
44
3.2. Materials and Methods
Gold(III) chloride trihydrate to synthetize AuNPs was obtained from Sigma Aldrich.
Reducing Agents: Acetylacetone and Sodium Citrate were obtained by Sigma Aldrich and they were
used as reducing agents to synthetize AuNPs.
Photocatalysts: TiO2 Anatase and TiO2 Evonik P-25, were Sigma Aldrich. They were doped with
AuNPs (TiO2@AuNPs) and used in paste form. Their main features are indicated in Table 3.1.
Dye: Alizarin Red S (ARS). It was purchased from Sigma Aldrich and it was used in aqueous solution
without further purification.
Table 3.1: Main features of TiO2 Anatase and TiO2 Evonik P-25.
TiO2 Anatase TiO2 Evonik P-25
Purity 99.7% 99.5%
Nanoparticle Size 25 nm 21 nm
Molecular Weight 79.9 u.m.a. 79.87 u.m.a.
Melting Point 1825 °C 1850 °C
Density 4 g/ml 4.26 g/ml
Another chemical reagent was Triton X100 used for paste preparation; it was of analytical grade and it was
used without further purification. Strips that were coated with TiO2@AuNPs paste were constituted by
polypropylene (PP) 2500 material and they were obtained from 3M. The pH of the solutions was adjusted by
HCl volumetric standard 1 N in water obtained from Sigma Aldrich.
3.3. Operative Procedures to Synthetize Gold Nanoparticles
Gold nanoparticles were synthesized using two different reducing agent: Sodium Citrate and Acetylacetone.
In the first case, 8 ml of 1% citrate solution were added into 100 ml of 0.36 mM HAuCl4 at 65 °C. The solution
was well mixed at the same temperature until the colour of solution changed to red, and then was boiled for
20 minutes[84]. The obtained gold nanoparticles were analysed by UV-Vis and DLS.
In the latter case, in order to find the best size and shape of AuNPs, HAuCl4 2.5 mM was added to 10 ml of
Acetylatone/Water solution at different temperatures, from 30 °C to 90 °C. The solution was stirred at the same
temperature until the colour of solution changed and then was kept at the same temperature for 10 minutes.
Different concentrations of HAuCl4 and Acetylacetone/Water are summarised in Table 3.2.
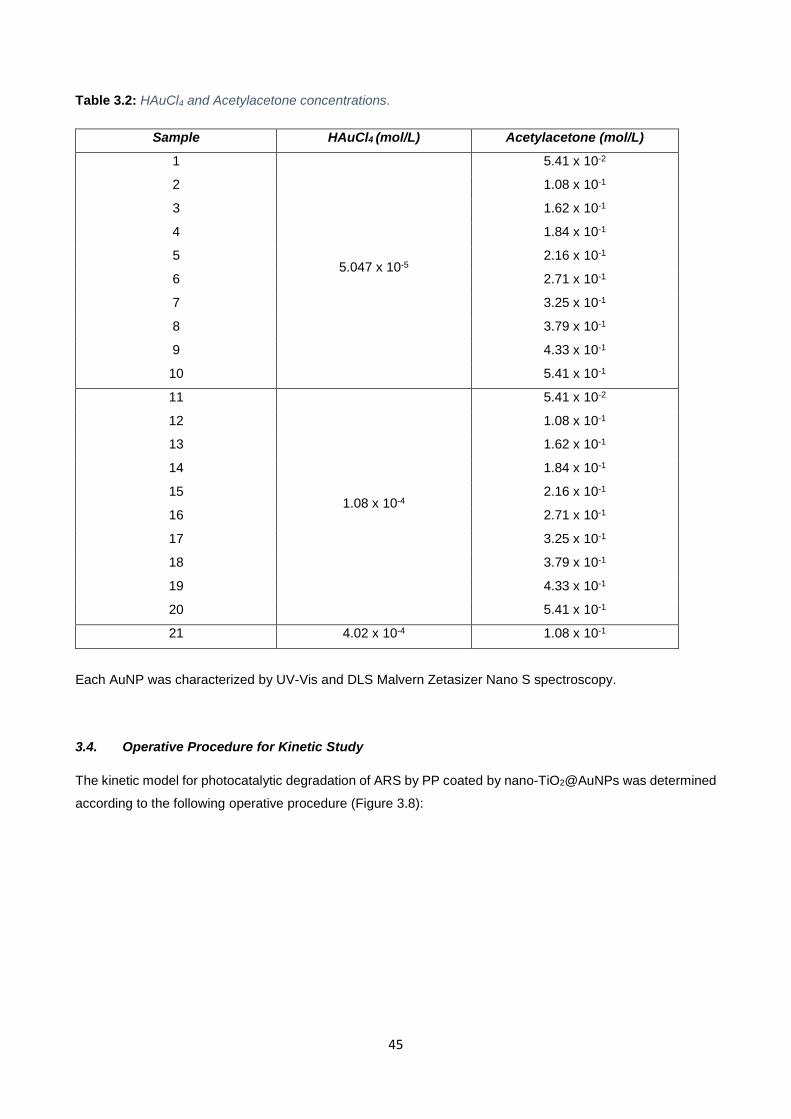
45
Table 3.2: HAuCl4 and Acetylacetone concentrations.
Sample HAuCl4 (mol/L) Acetylacetone (mol/L)
1
5.047 x 10⁻⁵
5.41 x 10⁻²
2 1.08 x 10⁻¹
3 1.62 x 10⁻¹
4 1.84 x 10⁻¹
5 2.16 x 10⁻¹
6 2.71 x 10⁻¹
7 3.25 x 10⁻¹
8 3.79 x 10⁻¹
9 4.33 x 10⁻¹
10 5.41 x 10⁻¹
11
1.08 x 10⁻⁴
5.41 x 10⁻²
12 1.08 x 10⁻¹
13 1.62 x 10⁻¹
14 1.84 x 10⁻¹
15 2.16 x 10⁻¹
16 2.71 x 10⁻¹
17 3.25 x 10⁻¹
18 3.79 x 10⁻¹
19 4.33 x 10⁻¹
20 5.41 x 10⁻¹
21 4.02 x 10⁻⁴ 1.08 x 10⁻¹
Each AuNP was characterized by UV-Vis and DLS Malvern Zetasizer Nano S spectroscopy.
3.4. Operative Procedure for Kinetic Study
The kinetic model for photocatalytic degradation of ARS by PP coated by nano-TiO2@AuNPs was determined
according to the following operative procedure (Figure 3.8):
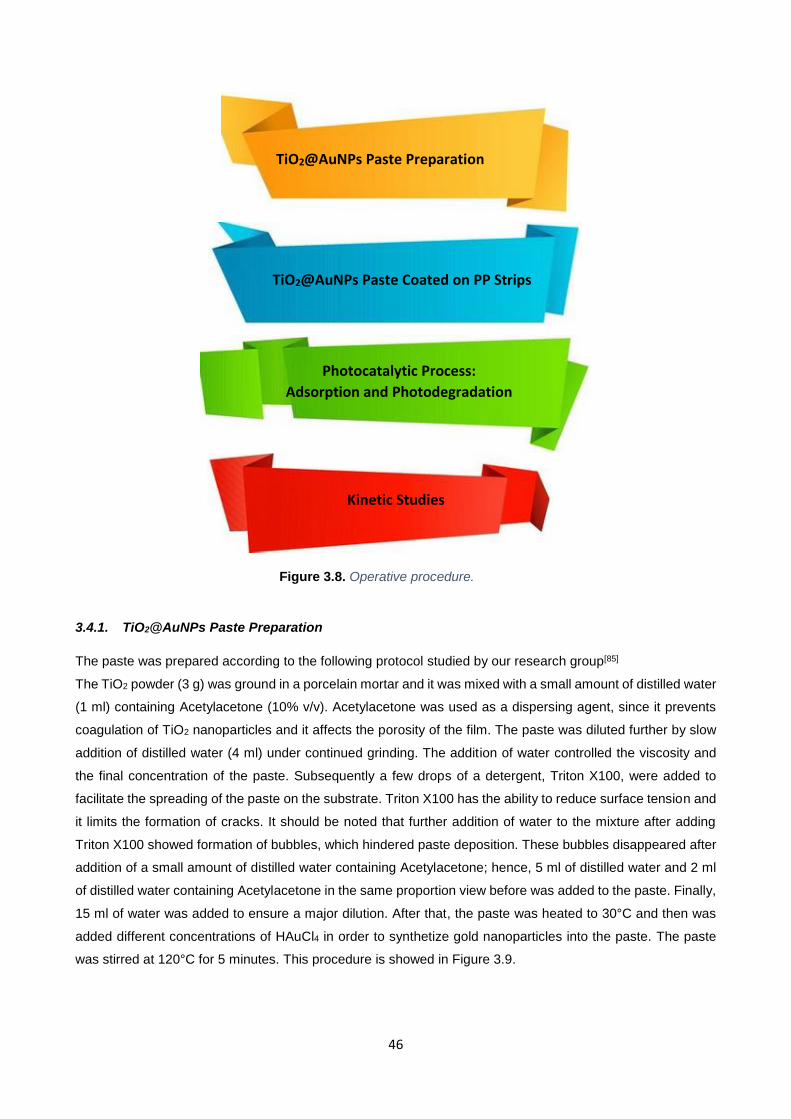
46
3.4.1. TiO2@AuNPs Paste Preparation
The paste was prepared according to the following protocol studied by our research group[85]
The TiO2 powder (3 g) was ground in a porcelain mortar and it was mixed with a small amount of distilled water
(1 ml) containing Acetylacetone (10% v/v). Acetylacetone was used as a dispersing agent, since it prevents
coagulation of TiO2 nanoparticles and it affects the porosity of the film. The paste was diluted further by slow
addition of distilled water (4 ml) under continued grinding. The addition of water controlled the viscosity and
the final concentration of the paste. Subsequently a few drops of a detergent, Triton X100, were added to
facilitate the spreading of the paste on the substrate. Triton X100 has the ability to reduce surface tension and
it limits the formation of cracks. It should be noted that further addition of water to the mixture after adding
Triton X100 showed formation of bubbles, which hindered paste deposition. These bubbles disappeared after
addition of a small amount of distilled water containing Acetylacetone; hence, 5 ml of distilled water and 2 ml
of distilled water containing Acetylacetone in the same proportion view before was added to the paste. Finally,
15 ml of water was added to ensure a major dilution. After that, the paste was heated to 30°C and then was
added different concentrations of HAuCl4 in order to synthetize gold nanoparticles into the paste. The paste
was stirred at 120°C for 5 minutes. This procedure is showed in Figure 3.9.
TiO2@AuNPs Paste Preparation
TiO2@AuNPs Paste Coated on PP Strips
Photocatalytic Process:
Adsorption and Photodegradation
Kinetic Studies
Figure 3.8. Operative procedure.
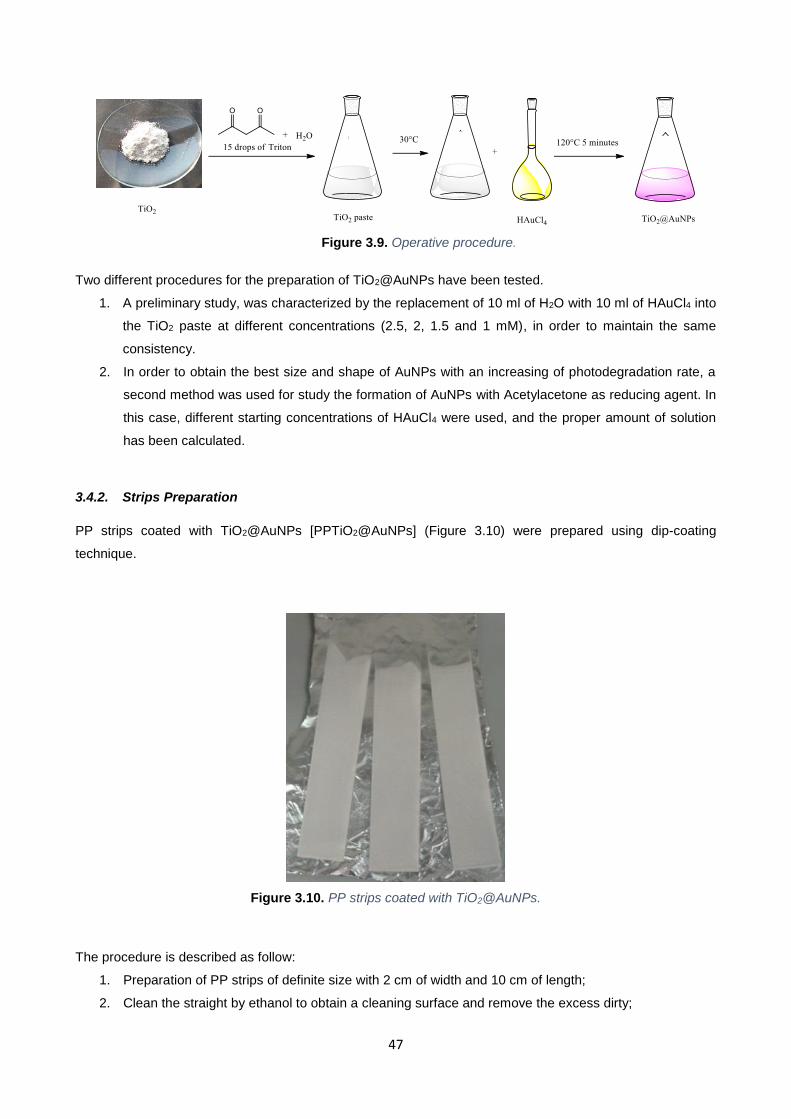
47
Two different procedures for the preparation of TiO2@AuNPs have been tested.
1. A preliminary study, was characterized by the replacement of 10 ml of H2O with 10 ml of HAuCl4 into
the TiO2 paste at different concentrations (2.5, 2, 1.5 and 1 mM), in order to maintain the same
consistency.
2. In order to obtain the best size and shape of AuNPs with an increasing of photodegradation rate, a
second method was used for study the formation of AuNPs with Acetylacetone as reducing agent. In
this case, different starting concentrations of HAuCl4 were used, and the proper amount of solution
has been calculated.
3.4.2. Strips Preparation
PP strips coated with TiO2@AuNPs [PPTiO2@AuNPs] (Figure 3.10) were prepared using dip-coating
technique.
Figure 3.10. PP strips coated with TiO2@AuNPs.
The procedure is described as follow:
1. Preparation of PP strips of definite size with 2 cm of width and 10 cm of length;
2. Clean the straight by ethanol to obtain a cleaning surface and remove the excess dirty;
Figure 3.9. Operative procedure.
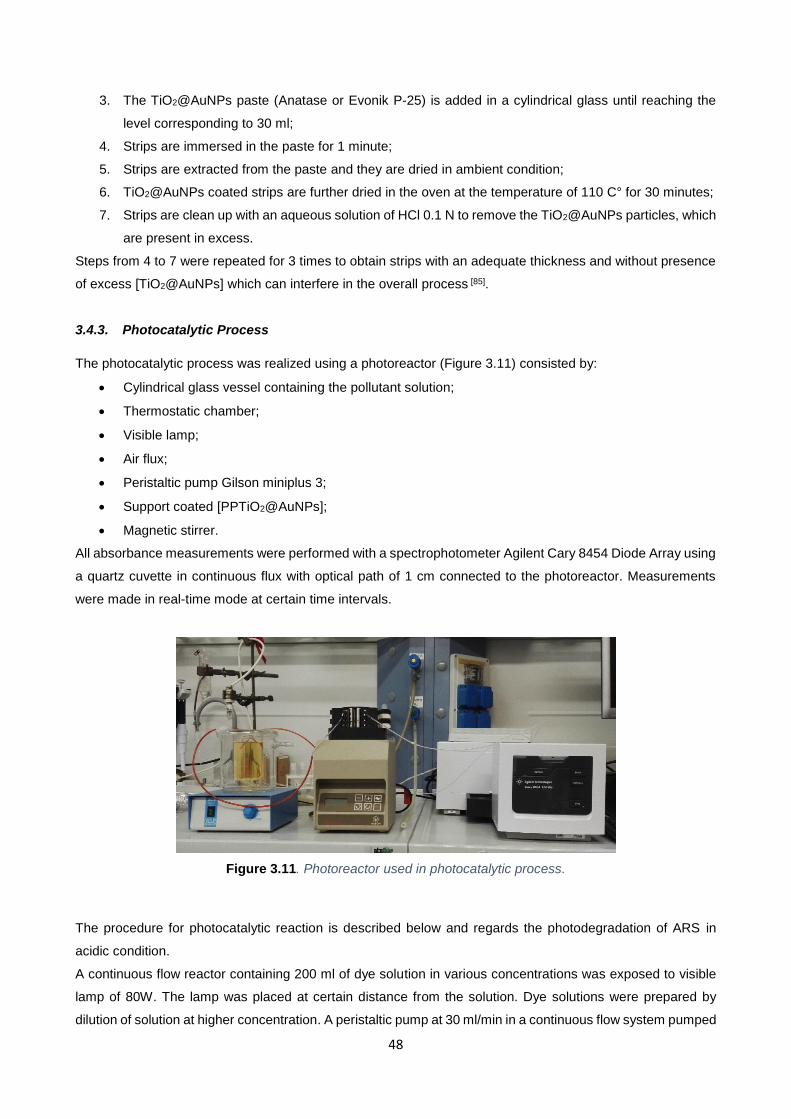
48
3. The TiO2@AuNPs paste (Anatase or Evonik P-25) is added in a cylindrical glass until reaching the
level corresponding to 30 ml;
4. Strips are immersed in the paste for 1 minute;
5. Strips are extracted from the paste and they are dried in ambient condition;
6. TiO2@AuNPs coated strips are further dried in the oven at the temperature of 110 C° for 30 minutes;
7. Strips are clean up with an aqueous solution of HCl 0.1 N to remove the TiO2@AuNPs particles, which
are present in excess.
Steps from 4 to 7 were repeated for 3 times to obtain strips with an adequate thickness and without presence
of excess [TiO2@AuNPs] which can interfere in the overall process [85].
3.4.3. Photocatalytic Process
The photocatalytic process was realized using a photoreactor (Figure 3.11) consisted by:
Cylindrical glass vessel containing the pollutant solution;
Thermostatic chamber;
Visible lamp;
Air flux;
Peristaltic pump Gilson miniplus 3;
Support coated [PPTiO2@AuNPs];
Magnetic stirrer.
All absorbance measurements were performed with a spectrophotometer Agilent Cary 8454 Diode Array using
a quartz cuvette in continuous flux with optical path of 1 cm connected to the photoreactor. Measurements
were made in real-time mode at certain time intervals.
Figure 3.11. Photoreactor used in photocatalytic process.
The procedure for photocatalytic reaction is described below and regards the photodegradation of ARS in
acidic condition.
A continuous flow reactor containing 200 ml of dye solution in various concentrations was exposed to visible
lamp of 80W. The lamp was placed at certain distance from the solution. Dye solutions were prepared by
dilution of solution at higher concentration. A peristaltic pump at 30 ml/min in a continuous flow system pumped
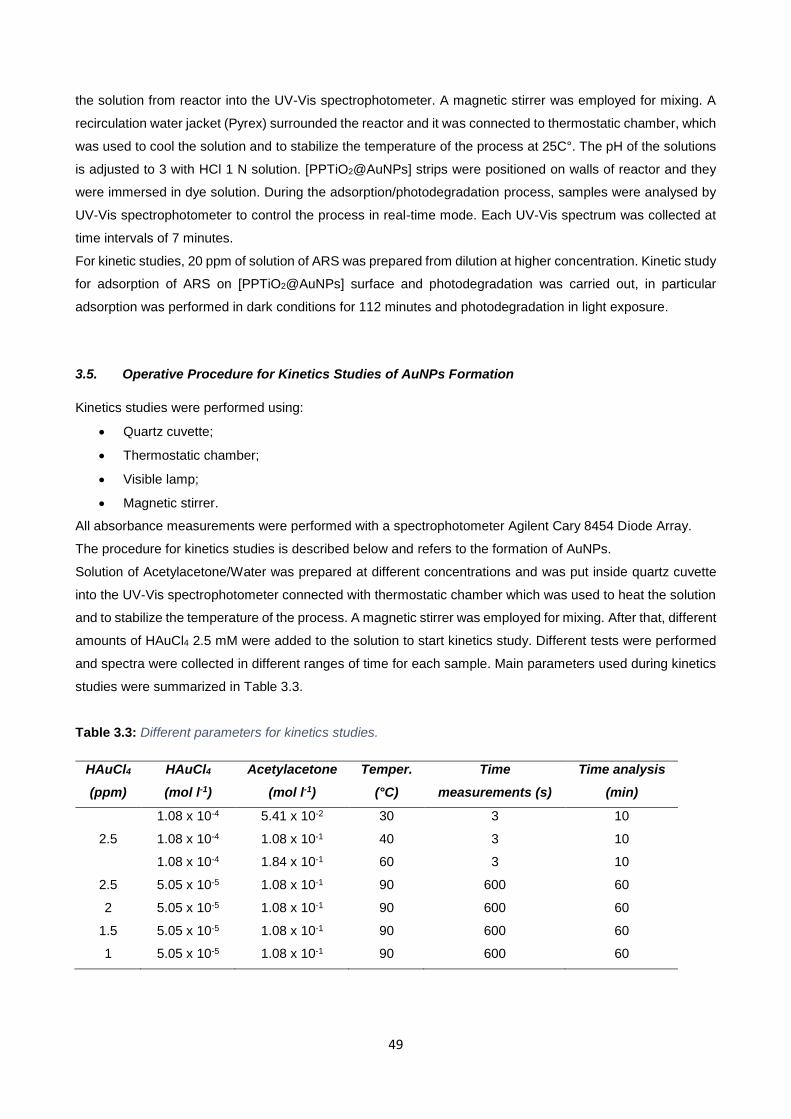
49
the solution from reactor into the UV-Vis spectrophotometer. A magnetic stirrer was employed for mixing. A
recirculation water jacket (Pyrex) surrounded the reactor and it was connected to thermostatic chamber, which
was used to cool the solution and to stabilize the temperature of the process at 25C°. The pH of the solutions
is adjusted to 3 with HCl 1 N solution. [PPTiO2@AuNPs] strips were positioned on walls of reactor and they
were immersed in dye solution. During the adsorption/photodegradation process, samples were analysed by
UV-Vis spectrophotometer to control the process in real-time mode. Each UV-Vis spectrum was collected at
time intervals of 7 minutes.
For kinetic studies, 20 ppm of solution of ARS was prepared from dilution at higher concentration. Kinetic study
for adsorption of ARS on [PPTiO2@AuNPs] surface and photodegradation was carried out, in particular
adsorption was performed in dark conditions for 112 minutes and photodegradation in light exposure.
3.5. Operative Procedure for Kinetics Studies of AuNPs Formation
Kinetics studies were performed using:
Quartz cuvette;
Thermostatic chamber;
Visible lamp;
Magnetic stirrer.
All absorbance measurements were performed with a spectrophotometer Agilent Cary 8454 Diode Array.
The procedure for kinetics studies is described below and refers to the formation of AuNPs.
Solution of Acetylacetone/Water was prepared at different concentrations and was put inside quartz cuvette
into the UV-Vis spectrophotometer connected with thermostatic chamber which was used to heat the solution
and to stabilize the temperature of the process. A magnetic stirrer was employed for mixing. After that, different
amounts of HAuCl4 2.5 mM were added to the solution to start kinetics study. Different tests were performed
and spectra were collected in different ranges of time for each sample. Main parameters used during kinetics
studies were summarized in Table 3.3.
Table 3.3: Different parameters for kinetics studies.
HAuCl4
(ppm)
HAuCl4
(mol l-1)
Acetylacetone
(mol l-1)
Temper.
(°C)
Time
measurements (s)
Time analysis
(min)
2.5
1.08 x 10⁻⁴ 5.41 x 10⁻² 30 3 10
1.08 x 10⁻⁴ 1.08 x 10⁻¹ 40 3 10
1.08 x 10⁻⁴ 1.84 x 10⁻¹ 60 3 10
2.5 5.05 x 10⁻⁵ 1.08 x 10⁻¹ 90 600 60
2 5.05 x 10⁻⁵ 1.08 x 10⁻¹ 90 600 60
1.5 5.05 x 10⁻⁵ 1.08 x 10⁻¹ 90 600 60
1 5.05 x 10⁻⁵ 1.08 x 10⁻¹ 90 600 60
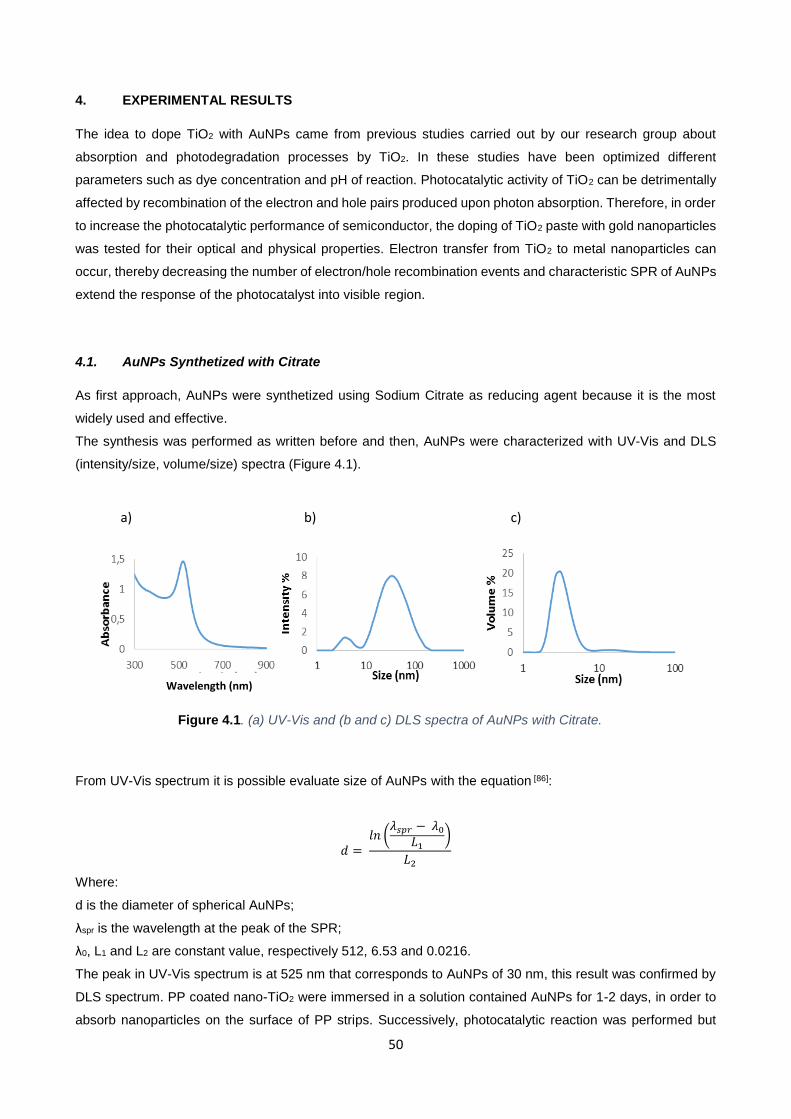
50
4. EXPERIMENTAL RESULTS
The idea to dope TiO2 with AuNPs came from previous studies carried out by our research group about
absorption and photodegradation processes by TiO2. In these studies have been optimized different
parameters such as dye concentration and pH of reaction. Photocatalytic activity of TiO2 can be detrimentally
affected by recombination of the electron and hole pairs produced upon photon absorption. Therefore, in order
to increase the photocatalytic performance of semiconductor, the doping of TiO2 paste with gold nanoparticles
was tested for their optical and physical properties. Electron transfer from TiO2 to metal nanoparticles can
occur, thereby decreasing the number of electron/hole recombination events and characteristic SPR of AuNPs
extend the response of the photocatalyst into visible region.
4.1. AuNPs Synthetized with Citrate
As first approach, AuNPs were synthetized using Sodium Citrate as reducing agent because it is the most
widely used and effective.
The synthesis was performed as written before and then, AuNPs were characterized with UV-Vis and DLS
(intensity/size, volume/size) spectra (Figure 4.1).
From UV-Vis spectrum it is possible evaluate size of AuNPs with the equation [86]:
𝑑 = 𝑙𝑛 (
𝜆𝑠𝑝𝑟 − 𝜆0
𝐿1)
𝐿2
Where:
d is the diameter of spherical AuNPs;
λspr is the wavelength at the peak of the SPR;
λ0, L1 and L2 are constant value, respectively 512, 6.53 and 0.0216.
The peak in UV-Vis spectrum is at 525 nm that corresponds to AuNPs of 30 nm, this result was confirmed by
DLS spectrum. PP coated nano-TiO2 were immersed in a solution contained AuNPs for 1-2 days, in order to
absorb nanoparticles on the surface of PP strips. Successively, photocatalytic reaction was performed but
Figure 4.1. (a) UV-Vis and (b and c) DLS spectra of AuNPs with Citrate.
c) a) b)
Wavelength (nm)
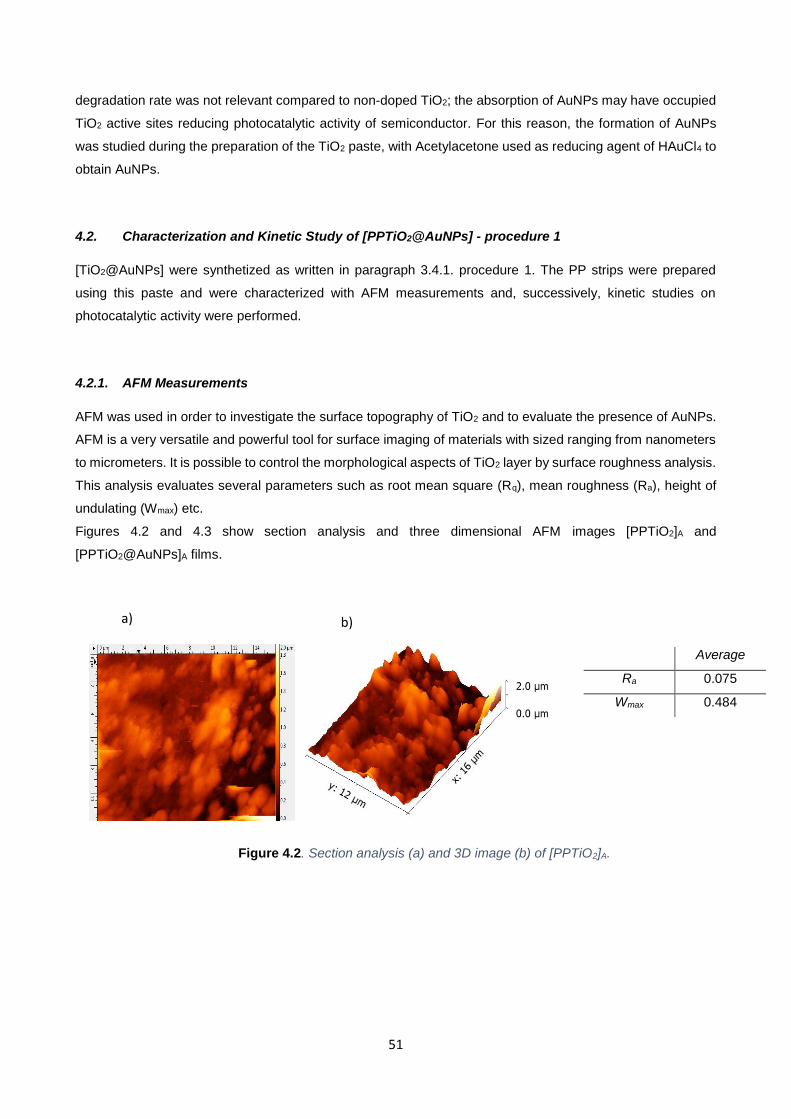
51
degradation rate was not relevant compared to non-doped TiO2; the absorption of AuNPs may have occupied
TiO2 active sites reducing photocatalytic activity of semiconductor. For this reason, the formation of AuNPs
was studied during the preparation of the TiO2 paste, with Acetylacetone used as reducing agent of HAuCl4 to
obtain AuNPs.
4.2. Characterization and Kinetic Study of [PPTiO2@AuNPs] - procedure 1
[TiO2@AuNPs] were synthetized as written in paragraph 3.4.1. procedure 1. The PP strips were prepared
using this paste and were characterized with AFM measurements and, successively, kinetic studies on
photocatalytic activity were performed.
4.2.1. AFM Measurements
AFM was used in order to investigate the surface topography of TiO2 and to evaluate the presence of AuNPs.
AFM is a very versatile and powerful tool for surface imaging of materials with sized ranging from nanometers
to micrometers. It is possible to control the morphological aspects of TiO2 layer by surface roughness analysis.
This analysis evaluates several parameters such as root mean square (Rq), mean roughness (Ra), height of
undulating (Wmax) etc.
Figures 4.2 and 4.3 show section analysis and three dimensional AFM images [PPTiO2]A and
[PPTiO2@AuNPs]A films.
Average
Ra 0.075
Wmax 0.484
Figure 4.2. Section analysis (a) and 3D image (b) of [PPTiO2]A.
a) b)
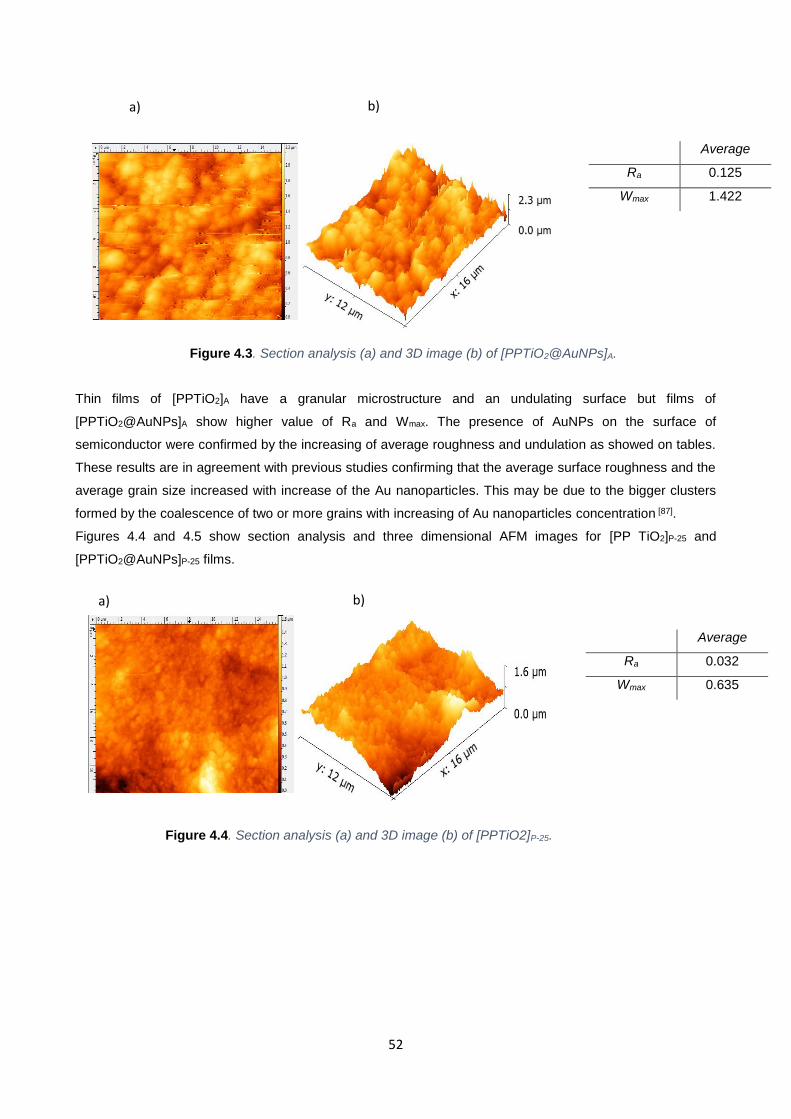
52
Thin films of [PPTiO2]A have a granular microstructure and an undulating surface but films of
[PPTiO2@AuNPs]A show higher value of Ra and Wmax. The presence of AuNPs on the surface of
semiconductor were confirmed by the increasing of average roughness and undulation as showed on tables.
These results are in agreement with previous studies confirming that the average surface roughness and the
average grain size increased with increase of the Au nanoparticles. This may be due to the bigger clusters
formed by the coalescence of two or more grains with increasing of Au nanoparticles concentration [87].
Figures 4.4 and 4.5 show section analysis and three dimensional AFM images for [PP TiO2]P-25 and
[PPTiO2@AuNPs]P-25 films.
Average
Ra 0.125
Wmax 1.422
Average
Ra 0.032
Wmax 0.635
Figure 4.3. Section analysis (a) and 3D image (b) of [PPTiO2@AuNPs]A.
Figure 4.4. Section analysis (a) and 3D image (b) of [PPTiO2]P-25.
a) b)
b) a)
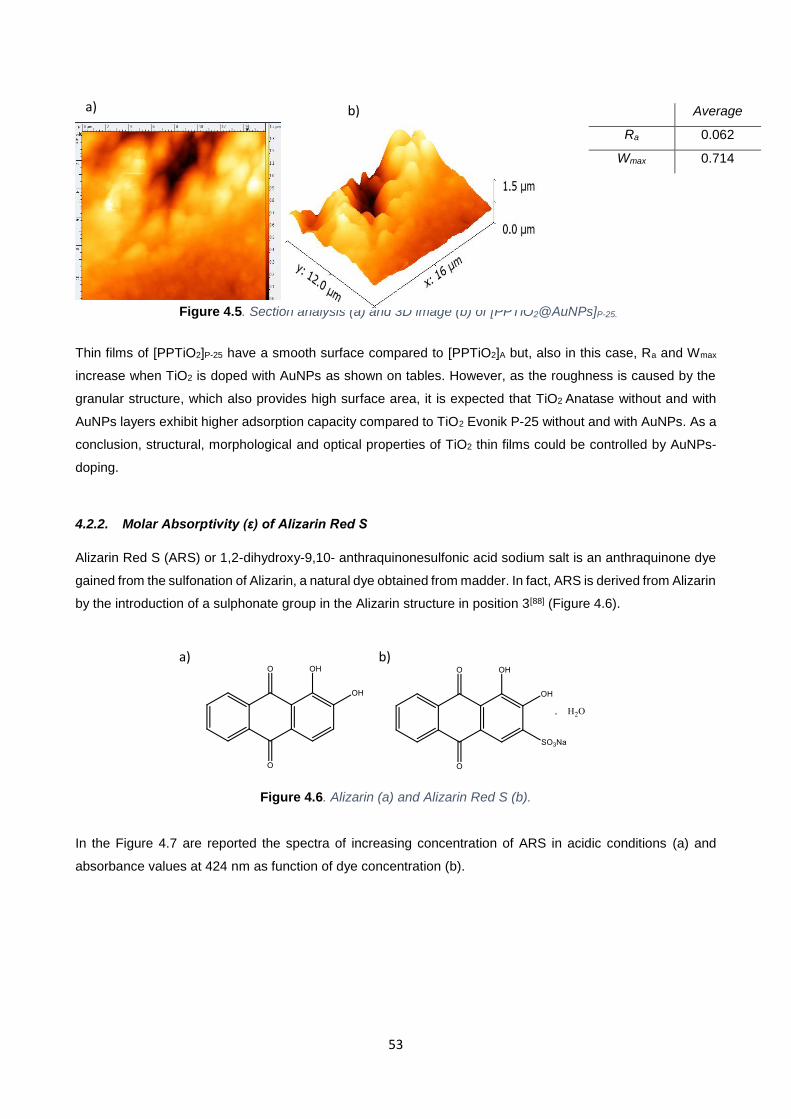
53
Thin films of [PPTiO2]P-25 have a smooth surface compared to [PPTiO2]A but, also in this case, Ra and Wmax
increase when TiO2 is doped with AuNPs as shown on tables. However, as the roughness is caused by the
granular structure, which also provides high surface area, it is expected that TiO2 Anatase without and with
AuNPs layers exhibit higher adsorption capacity compared to TiO2 Evonik P-25 without and with AuNPs. As a
conclusion, structural, morphological and optical properties of TiO2 thin films could be controlled by AuNPs-
doping.
4.2.2. Molar Absorptivity (ε) of Alizarin Red S
Alizarin Red S (ARS) or 1,2-dihydroxy-9,10- anthraquinonesulfonic acid sodium salt is an anthraquinone dye
gained from the sulfonation of Alizarin, a natural dye obtained from madder. In fact, ARS is derived from Alizarin
by the introduction of a sulphonate group in the Alizarin structure in position 3[88] (Figure 4.6).
Figure 4.6. Alizarin (a) and Alizarin Red S (b).
In the Figure 4.7 are reported the spectra of increasing concentration of ARS in acidic conditions (a) and
absorbance values at 424 nm as function of dye concentration (b).
Average
Ra 0.062
Wmax 0.714
Figure 4.5. Section analysis (a) and 3D image (b) of [PPTiO2@AuNPs]P-25.
a) b)
a) b)
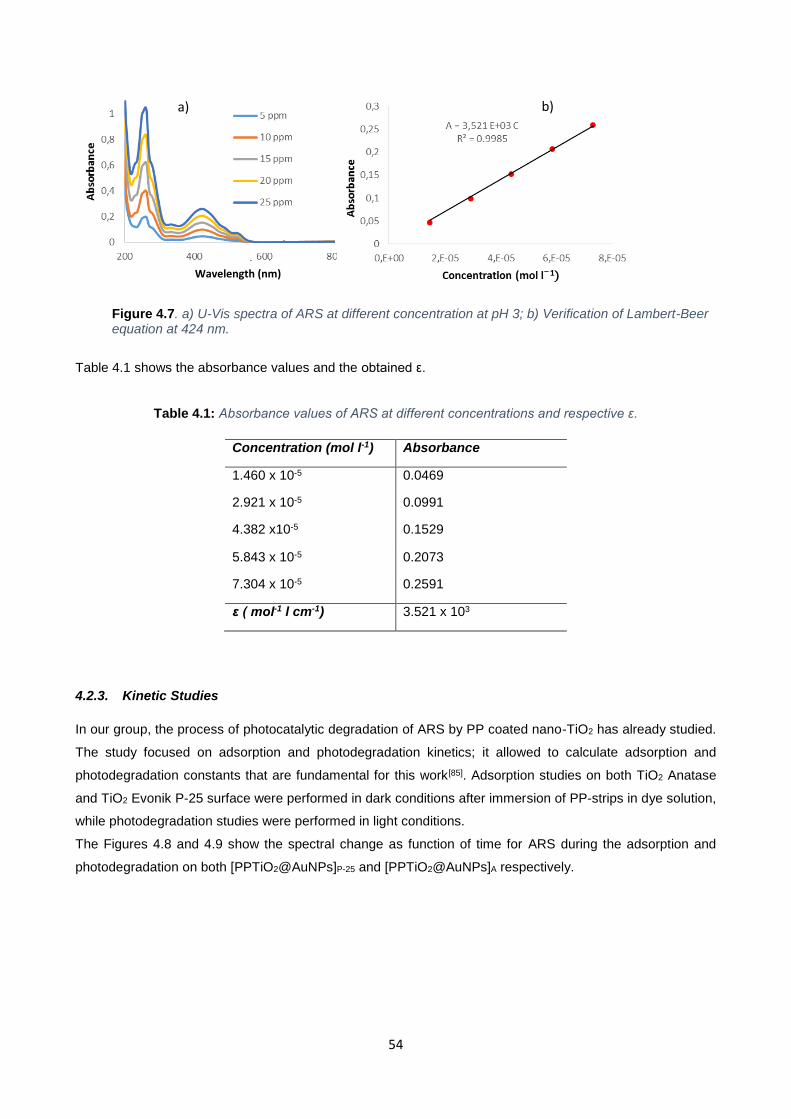
54
Table 4.1 shows the absorbance values and the obtained ε.
Table 4.1: Absorbance values of ARS at different concentrations and respective ε.
Concentration (mol l-1) Absorbance
1.460 x 10⁻⁵ 0.0469
2.921 x 10⁻⁵ 0.0991
4.382 x10⁻⁵ 0.1529
5.843 x 10⁻⁵ 0.2073
7.304 x 10⁻⁵ 0.2591
ε ( mol-1 l cm-1) 3.521 x 10³
4.2.3. Kinetic Studies
In our group, the process of photocatalytic degradation of ARS by PP coated nano-TiO2 has already studied.
The study focused on adsorption and photodegradation kinetics; it allowed to calculate adsorption and
photodegradation constants that are fundamental for this work[85]. Adsorption studies on both TiO2 Anatase
and TiO2 Evonik P-25 surface were performed in dark conditions after immersion of PP-strips in dye solution,
while photodegradation studies were performed in light conditions.
The Figures 4.8 and 4.9 show the spectral change as function of time for ARS during the adsorption and
photodegradation on both [PPTiO2@AuNPs]P-25 and [PPTiO2@AuNPs]A respectively.
Figure 4.7. a) U-Vis spectra of ARS at different concentration at pH 3; b) Verification of Lambert-Beer equation at 424 nm.
a) b)
Wavelength (nm)
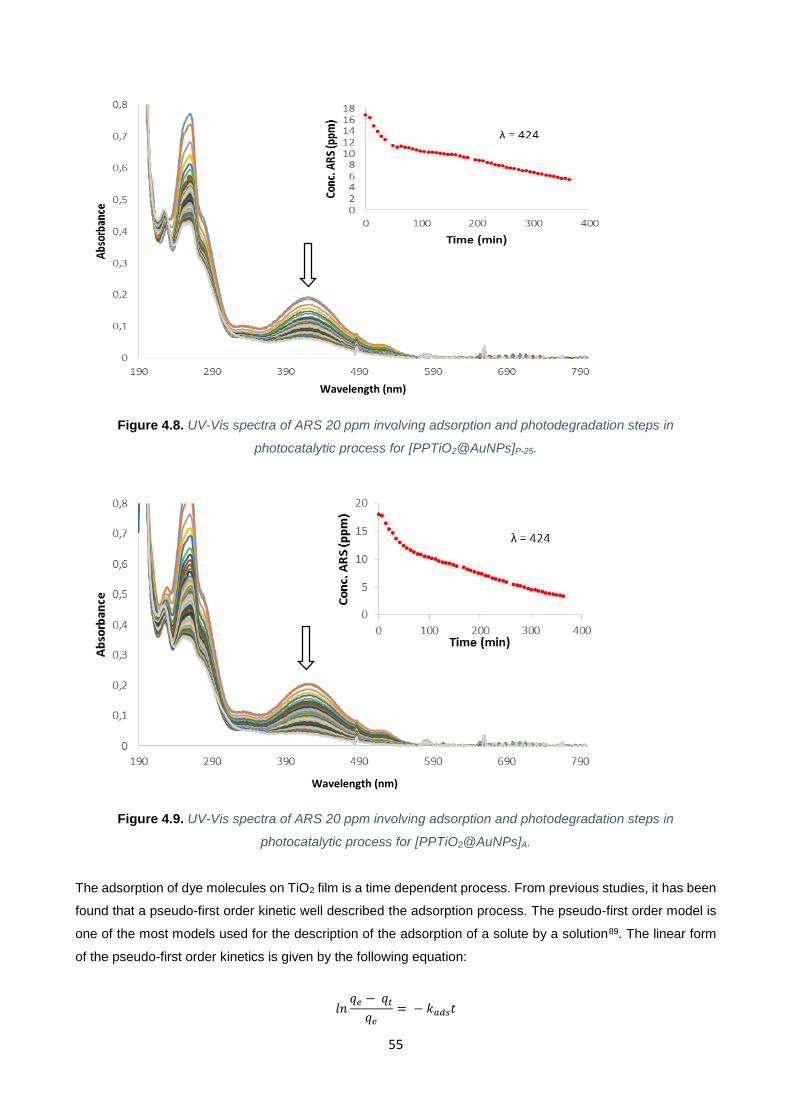
55
Figure 4.8. UV-Vis spectra of ARS 20 ppm involving adsorption and photodegradation steps in
photocatalytic process for [PPTiO2@AuNPs]P-25.
Figure 4.9. UV-Vis spectra of ARS 20 ppm involving adsorption and photodegradation steps in
photocatalytic process for [PPTiO2@AuNPs]A.
The adsorption of dye molecules on TiO2 film is a time dependent process. From previous studies, it has been
found that a pseudo-first order kinetic well described the adsorption process. The pseudo-first order model is
one of the most models used for the description of the adsorption of a solute by a solution89. The linear form
of the pseudo-first order kinetics is given by the following equation:
𝑙𝑛𝑞𝑒 − 𝑞𝑡
𝑞𝑒
= − 𝑘𝑎𝑑𝑠𝑡
Wavelength (nm)
Wavelength (nm)
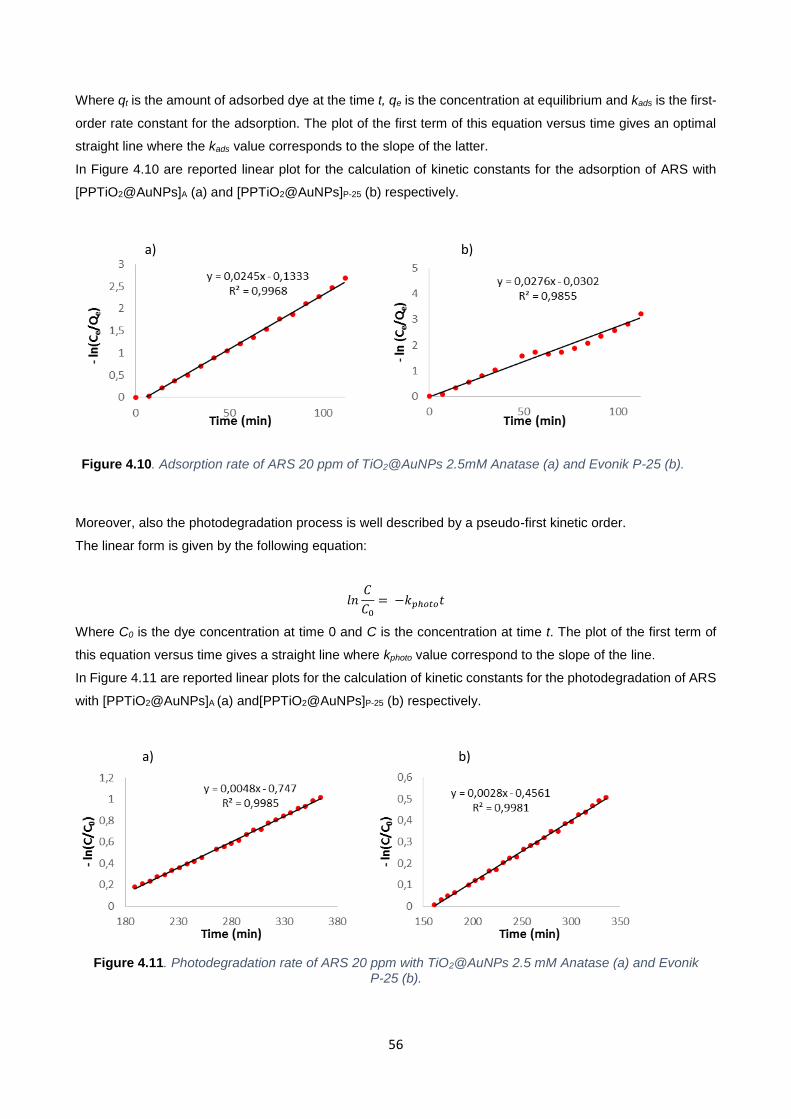
56
Where qt is the amount of adsorbed dye at the time t, qe is the concentration at equilibrium and kads is the first-
order rate constant for the adsorption. The plot of the first term of this equation versus time gives an optimal
straight line where the kads value corresponds to the slope of the latter.
In Figure 4.10 are reported linear plot for the calculation of kinetic constants for the adsorption of ARS with
[PPTiO2@AuNPs]A (a) and [PPTiO2@AuNPs]P-25 (b) respectively.
Moreover, also the photodegradation process is well described by a pseudo-first kinetic order.
The linear form is given by the following equation:
𝑙𝑛𝐶
𝐶0
= −𝑘𝑝ℎ𝑜𝑡𝑜𝑡
Where C0 is the dye concentration at time 0 and C is the concentration at time t. The plot of the first term of
this equation versus time gives a straight line where kphoto value correspond to the slope of the line.
In Figure 4.11 are reported linear plots for the calculation of kinetic constants for the photodegradation of ARS
with [PPTiO2@AuNPs]A (a) and[PPTiO2@AuNPs]P-25 (b) respectively.
a) b)
Figure 4.10. Adsorption rate of ARS 20 ppm of TiO2@AuNPs 2.5mM Anatase (a) and Evonik P-25 (b).
a) b)
Figure 4.11. Photodegradation rate of ARS 20 ppm with TiO2@AuNPs 2.5 mM Anatase (a) and Evonik P-25 (b).
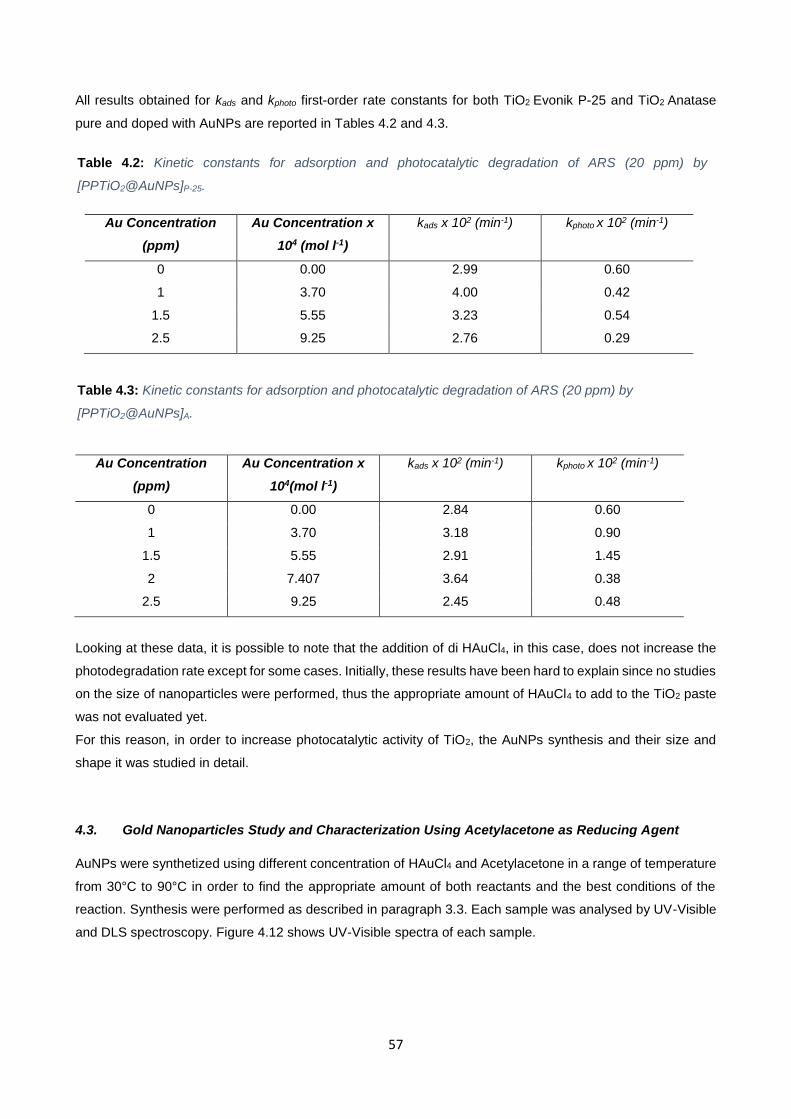
57
All results obtained for kads and kphoto first-order rate constants for both TiO2 Evonik P-25 and TiO2 Anatase
pure and doped with AuNPs are reported in Tables 4.2 and 4.3.
Looking at these data, it is possible to note that the addition of di HAuCl4, in this case, does not increase the
photodegradation rate except for some cases. Initially, these results have been hard to explain since no studies
on the size of nanoparticles were performed, thus the appropriate amount of HAuCl4 to add to the TiO2 paste
was not evaluated yet.
For this reason, in order to increase photocatalytic activity of TiO2, the AuNPs synthesis and their size and
shape it was studied in detail.
4.3. Gold Nanoparticles Study and Characterization Using Acetylacetone as Reducing Agent
AuNPs were synthetized using different concentration of HAuCl4 and Acetylacetone in a range of temperature
from 30°C to 90°C in order to find the appropriate amount of both reactants and the best conditions of the
reaction. Synthesis were performed as described in paragraph 3.3. Each sample was analysed by UV-Visible
and DLS spectroscopy. Figure 4.12 shows UV-Visible spectra of each sample.
Table 4.2: Kinetic constants for adsorption and photocatalytic degradation of ARS (20 ppm) by
[PPTiO2@AuNPs]P-25.
Au Concentration
(ppm)
Au Concentration x
104 (mol l-1)
kads x 102 (min-1) kphoto x 102 (min-1)
0 0.00 2.99 0.60
1 3.70 4.00 0.42
1.5 5.55 3.23 0.54
2.5 9.25 2.76 0.29
Table 4.3: Kinetic constants for adsorption and photocatalytic degradation of ARS (20 ppm) by
[PPTiO2@AuNPs]A.
Au Concentration
(ppm)
Au Concentration x
104(mol l-1)
kads x 102 (min-1) kphoto x 102 (min-1)
0 0.00 2.84 0.60
1 3.70 3.18 0.90
1.5 5.55 2.91 1.45
2 7.407 3.64 0.38
2.5 9.25 2.45 0.48
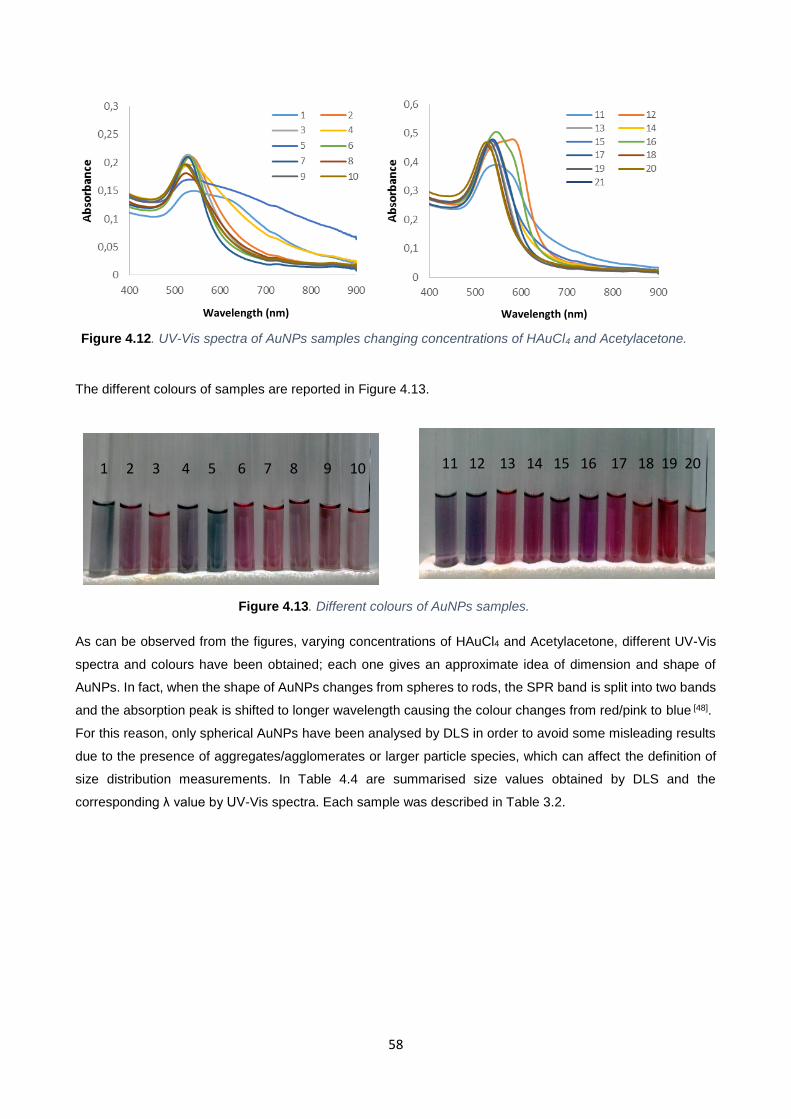
58
The different colours of samples are reported in Figure 4.13.
As can be observed from the figures, varying concentrations of HAuCl4 and Acetylacetone, different UV-Vis
spectra and colours have been obtained; each one gives an approximate idea of dimension and shape of
AuNPs. In fact, when the shape of AuNPs changes from spheres to rods, the SPR band is split into two bands
and the absorption peak is shifted to longer wavelength causing the colour changes from red/pink to blue [48].
For this reason, only spherical AuNPs have been analysed by DLS in order to avoid some misleading results
due to the presence of aggregates/agglomerates or larger particle species, which can affect the definition of
size distribution measurements. In Table 4.4 are summarised size values obtained by DLS and the
corresponding λ value by UV-Vis spectra. Each sample was described in Table 3.2.
Figure 4.12. UV-Vis spectra of AuNPs samples changing concentrations of HAuCl4 and Acetylacetone.
1 2 3 4 5 6 7 8 9 10 11 12 13 14 15 16 17 18 19 20
Figure 4.13. Different colours of AuNPs samples.
Wavelength (nm) Wavelength (nm)
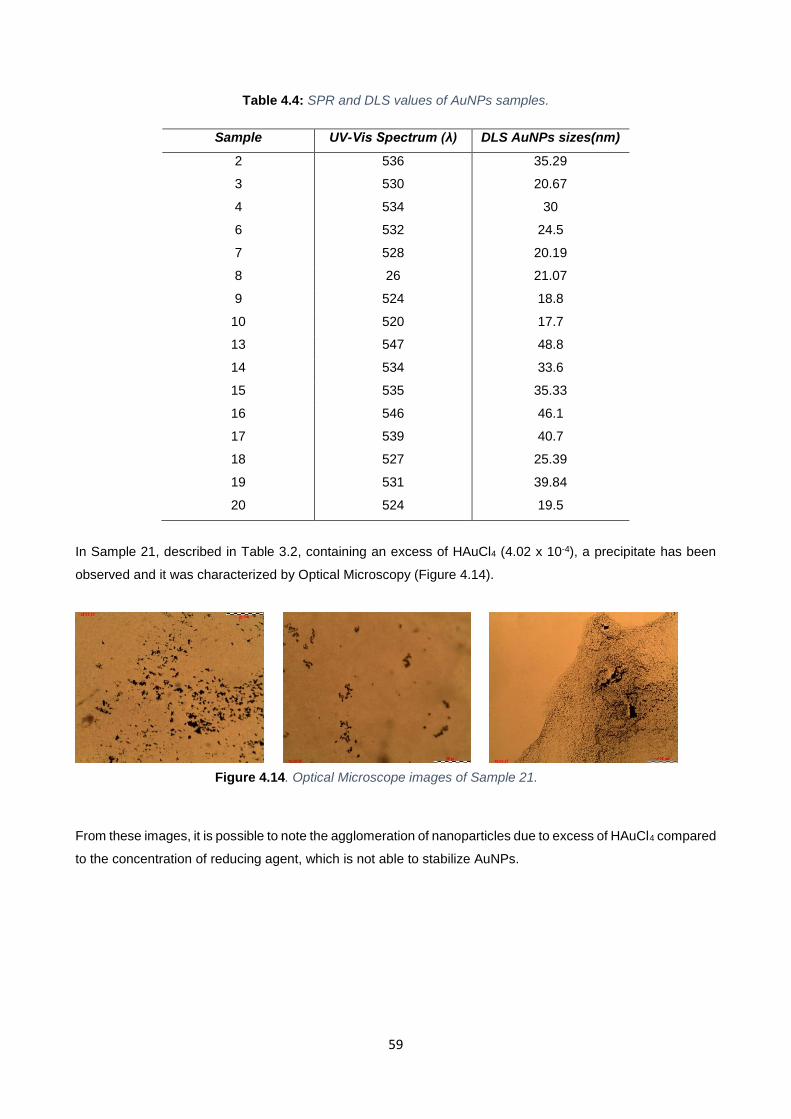
59
Table 4.4: SPR and DLS values of AuNPs samples.
Sample UV-Vis Spectrum (λ) DLS AuNPs sizes(nm)
2 536 35.29
3 530 20.67
4 534 30
6 532 24.5
7 528 20.19
8 26 21.07
9 524 18.8
10 520 17.7
13 547 48.8
14 534 33.6
15 535 35.33
16 546 46.1
17 539 40.7
18 527 25.39
19 531 39.84
20 524 19.5
In Sample 21, described in Table 3.2, containing an excess of HAuCl4 (4.02 x 10⁻⁴), a precipitate has been
observed and it was characterized by Optical Microscopy (Figure 4.14).
From these images, it is possible to note the agglomeration of nanoparticles due to excess of HAuCl4 compared
to the concentration of reducing agent, which is not able to stabilize AuNPs.
Figure 4.14. Optical Microscope images of Sample 21.
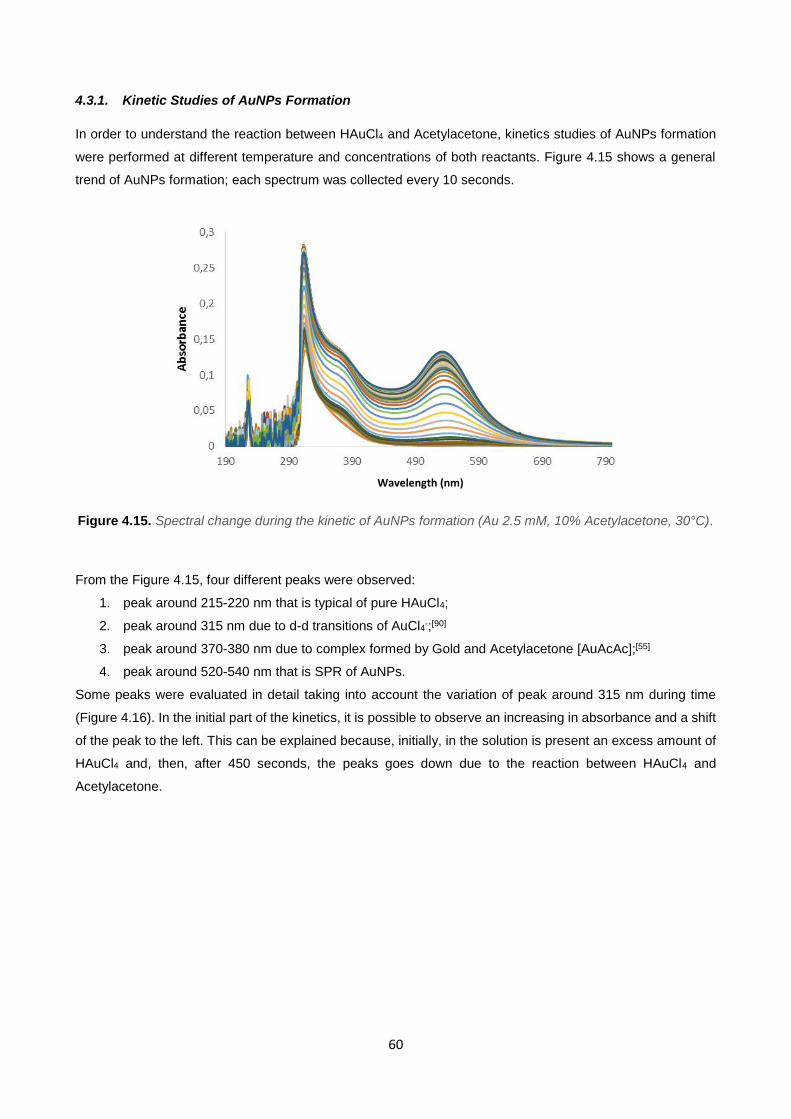
60
4.3.1. Kinetic Studies of AuNPs Formation
In order to understand the reaction between HAuCl4 and Acetylacetone, kinetics studies of AuNPs formation
were performed at different temperature and concentrations of both reactants. Figure 4.15 shows a general
trend of AuNPs formation; each spectrum was collected every 10 seconds.
Figure 4.15. Spectral change during the kinetic of AuNPs formation (Au 2.5 mM, 10% Acetylacetone, 30°C).
From the Figure 4.15, four different peaks were observed:
1. peak around 215-220 nm that is typical of pure HAuCl4;
2. peak around 315 nm due to d-d transitions of AuCl4-;[90]
3. peak around 370-380 nm due to complex formed by Gold and Acetylacetone [AuAcAc];[55]
4. peak around 520-540 nm that is SPR of AuNPs.
Some peaks were evaluated in detail taking into account the variation of peak around 315 nm during time
(Figure 4.16). In the initial part of the kinetics, it is possible to observe an increasing in absorbance and a shift
of the peak to the left. This can be explained because, initially, in the solution is present an excess amount of
HAuCl4 and, then, after 450 seconds, the peaks goes down due to the reaction between HAuCl4 and
Acetylacetone.
Wavelength (nm)
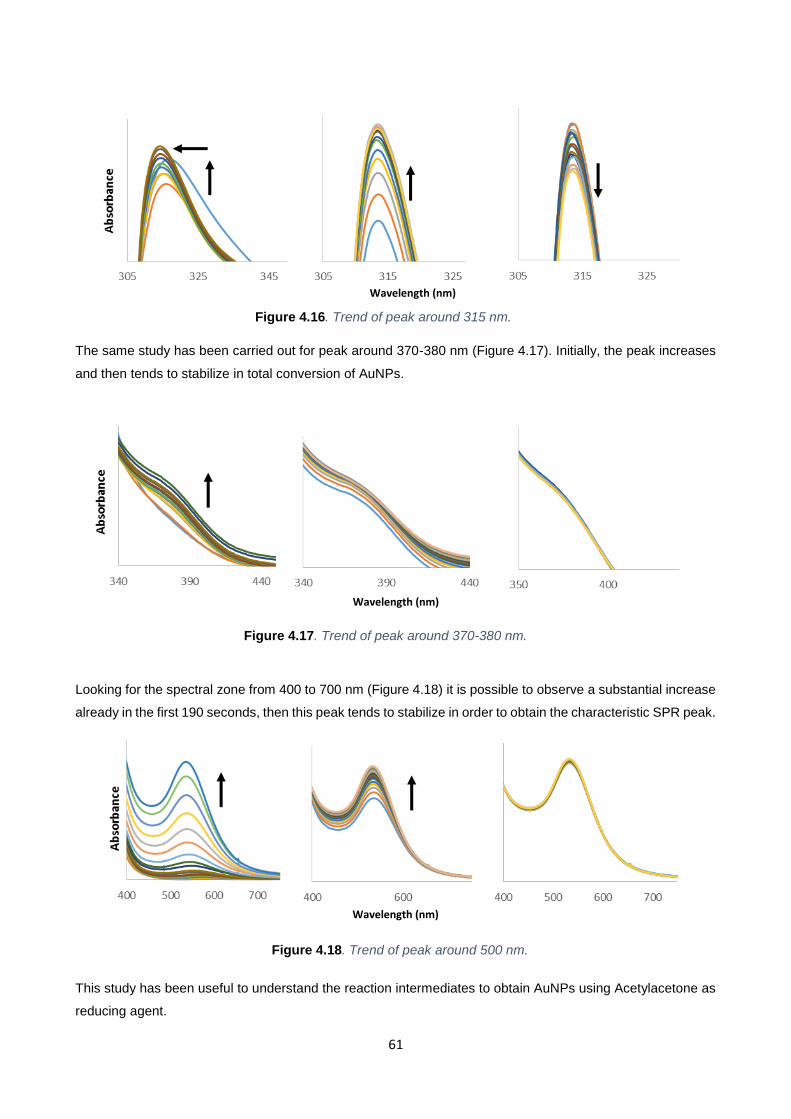
61
The same study has been carried out for peak around 370-380 nm (Figure 4.17). Initially, the peak increases
and then tends to stabilize in total conversion of AuNPs.
Looking for the spectral zone from 400 to 700 nm (Figure 4.18) it is possible to observe a substantial increase
already in the first 190 seconds, then this peak tends to stabilize in order to obtain the characteristic SPR peak.
This study has been useful to understand the reaction intermediates to obtain AuNPs using Acetylacetone as
reducing agent.
Figure 4.16. Trend of peak around 315 nm.
Figure 4.17. Trend of peak around 370-380 nm.
Figure 4.18. Trend of peak around 500 nm.
Wavelength (nm)
Wavelength (nm)
Wavelength (nm)
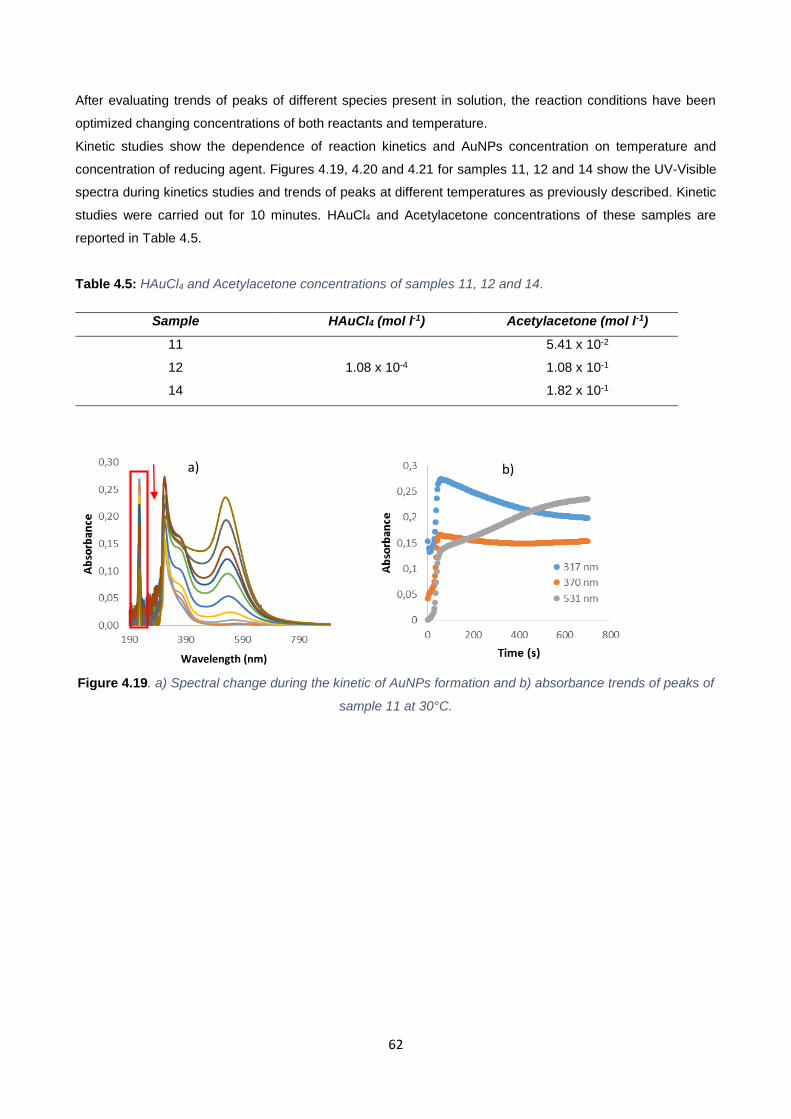
62
After evaluating trends of peaks of different species present in solution, the reaction conditions have been
optimized changing concentrations of both reactants and temperature.
Kinetic studies show the dependence of reaction kinetics and AuNPs concentration on temperature and
concentration of reducing agent. Figures 4.19, 4.20 and 4.21 for samples 11, 12 and 14 show the UV-Visible
spectra during kinetics studies and trends of peaks at different temperatures as previously described. Kinetic
studies were carried out for 10 minutes. HAuCl4 and Acetylacetone concentrations of these samples are
reported in Table 4.5.
Table 4.5: HAuCl4 and Acetylacetone concentrations of samples 11, 12 and 14.
Sample HAuCl4 (mol l-1) Acetylacetone (mol l-1)
11
1.08 x 10⁻⁴
5.41 x 10⁻²
12 1.08 x 10⁻¹
14 1.82 x 10⁻¹
Figure 4.19. a) Spectral change during the kinetic of AuNPs formation and b) absorbance trends of peaks of
sample 11 at 30°C.
a) b)
Wavelength (nm)
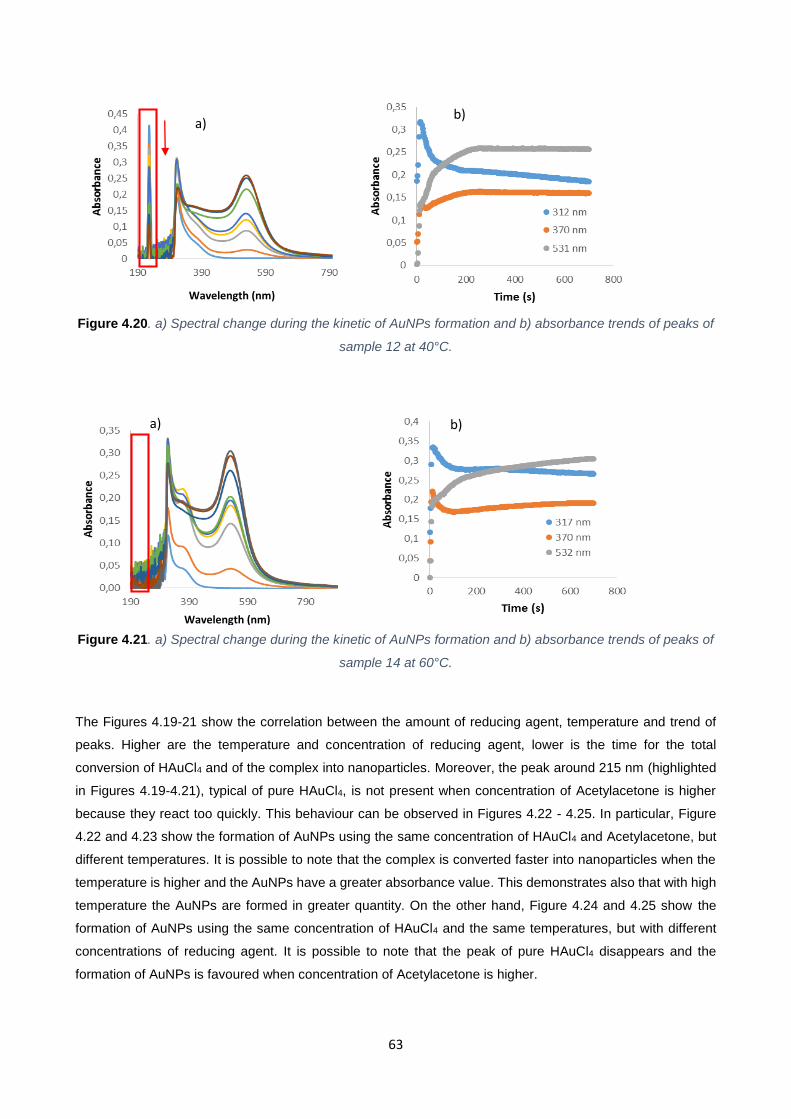
63
Figure 4.20. a) Spectral change during the kinetic of AuNPs formation and b) absorbance trends of peaks of
sample 12 at 40°C.
Figure 4.21. a) Spectral change during the kinetic of AuNPs formation and b) absorbance trends of peaks of
sample 14 at 60°C.
The Figures 4.19-21 show the correlation between the amount of reducing agent, temperature and trend of
peaks. Higher are the temperature and concentration of reducing agent, lower is the time for the total
conversion of HAuCl4 and of the complex into nanoparticles. Moreover, the peak around 215 nm (highlighted
in Figures 4.19-4.21), typical of pure HAuCl4, is not present when concentration of Acetylacetone is higher
because they react too quickly. This behaviour can be observed in Figures 4.22 - 4.25. In particular, Figure
4.22 and 4.23 show the formation of AuNPs using the same concentration of HAuCl4 and Acetylacetone, but
different temperatures. It is possible to note that the complex is converted faster into nanoparticles when the
temperature is higher and the AuNPs have a greater absorbance value. This demonstrates also that with high
temperature the AuNPs are formed in greater quantity. On the other hand, Figure 4.24 and 4.25 show the
formation of AuNPs using the same concentration of HAuCl4 and the same temperatures, but with different
concentrations of reducing agent. It is possible to note that the peak of pure HAuCl4 disappears and the
formation of AuNPs is favoured when concentration of Acetylacetone is higher.
a)
a) b)
b)
Wavelength (nm)
Wavelength (nm)
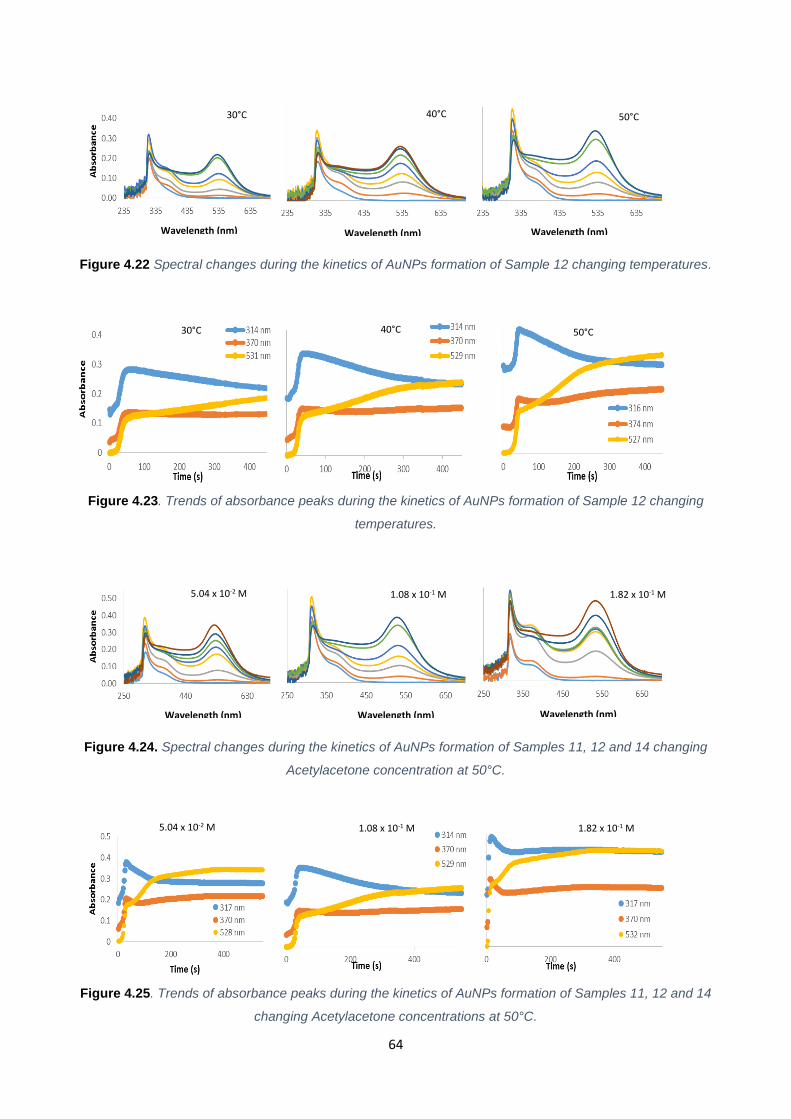
64
Figure 4.22 Spectral changes during the kinetics of AuNPs formation of Sample 12 changing temperatures.
Figure 4.23. Trends of absorbance peaks during the kinetics of AuNPs formation of Sample 12 changing
temperatures.
Figure 4.24. Spectral changes during the kinetics of AuNPs formation of Samples 11, 12 and 14 changing
Acetylacetone concentration at 50°C.
Figure 4.25. Trends of absorbance peaks during the kinetics of AuNPs formation of Samples 11, 12 and 14
changing Acetylacetone concentrations at 50°C.
30°C 40°C 50°C
1.82 x 10⁻¹ M 5.04 x 10⁻² M 1.08 x 10⁻¹ M
30°C 40°C 50°C
1.82 x 10⁻¹ M 5.04 x 10⁻² M 1.08 x 10⁻¹ M
Wavelength (nm) Wavelength (nm) Wavelength (nm)
Wavelength (nm) Wavelength (nm) Wavelength (nm)
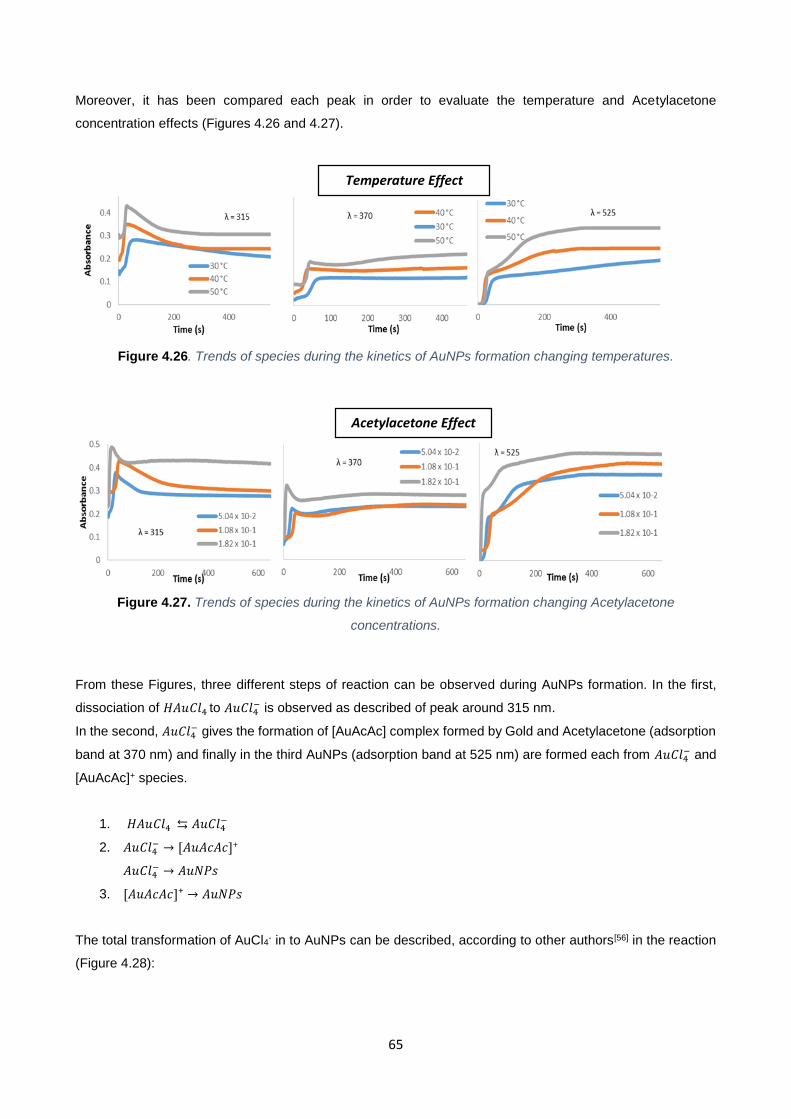
65
Moreover, it has been compared each peak in order to evaluate the temperature and Acetylacetone
concentration effects (Figures 4.26 and 4.27).
Figure 4.26. Trends of species during the kinetics of AuNPs formation changing temperatures.
Figure 4.27. Trends of species during the kinetics of AuNPs formation changing Acetylacetone
concentrations.
From these Figures, three different steps of reaction can be observed during AuNPs formation. In the first,
dissociation of 𝐻𝐴𝑢𝐶𝑙4 to 𝐴𝑢𝐶𝑙4− is observed as described of peak around 315 nm.
In the second, 𝐴𝑢𝐶𝑙4− gives the formation of [AuAcAc] complex formed by Gold and Acetylacetone (adsorption
band at 370 nm) and finally in the third AuNPs (adsorption band at 525 nm) are formed each from 𝐴𝑢𝐶𝑙4− and
[AuAcAc]+ species.
1. 𝐻𝐴𝑢𝐶𝑙4 ⇆ 𝐴𝑢𝐶𝑙4−
2. 𝐴𝑢𝐶𝑙4− → [𝐴𝑢𝐴𝑐𝐴𝑐]+
𝐴𝑢𝐶𝑙4− → 𝐴𝑢𝑁𝑃𝑠
3. [𝐴𝑢𝐴𝑐𝐴𝑐]⁺ → 𝐴𝑢𝑁𝑃𝑠
The total transformation of AuCl4- in to AuNPs can be described, according to other authors[56] in the reaction
(Figure 4.28):
Temperature Effect
Acetylacetone Effect
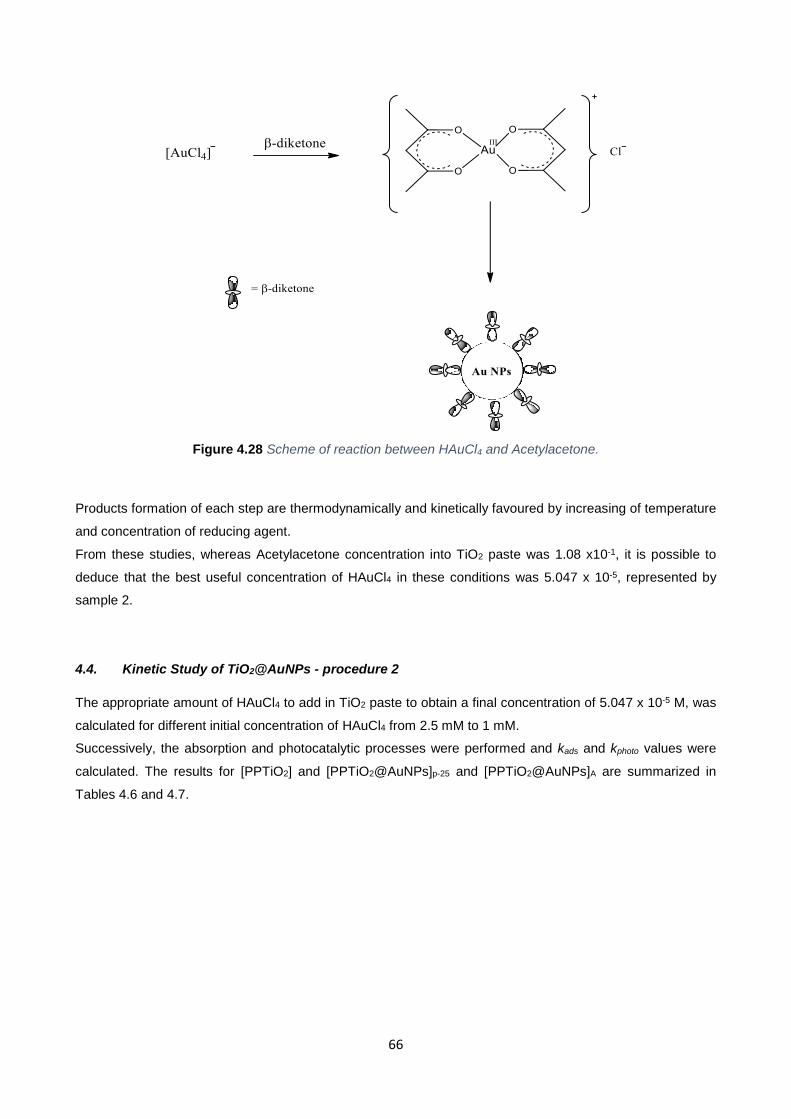
66
Figure 4.28 Scheme of reaction between HAuCl4 and Acetylacetone.
Products formation of each step are thermodynamically and kinetically favoured by increasing of temperature
and concentration of reducing agent.
From these studies, whereas Acetylacetone concentration into TiO2 paste was 1.08 x10⁻¹, it is possible to
deduce that the best useful concentration of HAuCl4 in these conditions was 5.047 x 10⁻⁵, represented by
sample 2.
4.4. Kinetic Study of TiO2@AuNPs - procedure 2
The appropriate amount of HAuCl4 to add in TiO2 paste to obtain a final concentration of 5.047 x 10⁻⁵ M, was
calculated for different initial concentration of HAuCl4 from 2.5 mM to 1 mM.
Successively, the absorption and photocatalytic processes were performed and kads and kphoto values were
calculated. The results for [PPTiO2] and [PPTiO2@AuNPs]p-25 and [PPTiO2@AuNPs]A are summarized in
Tables 4.6 and 4.7.
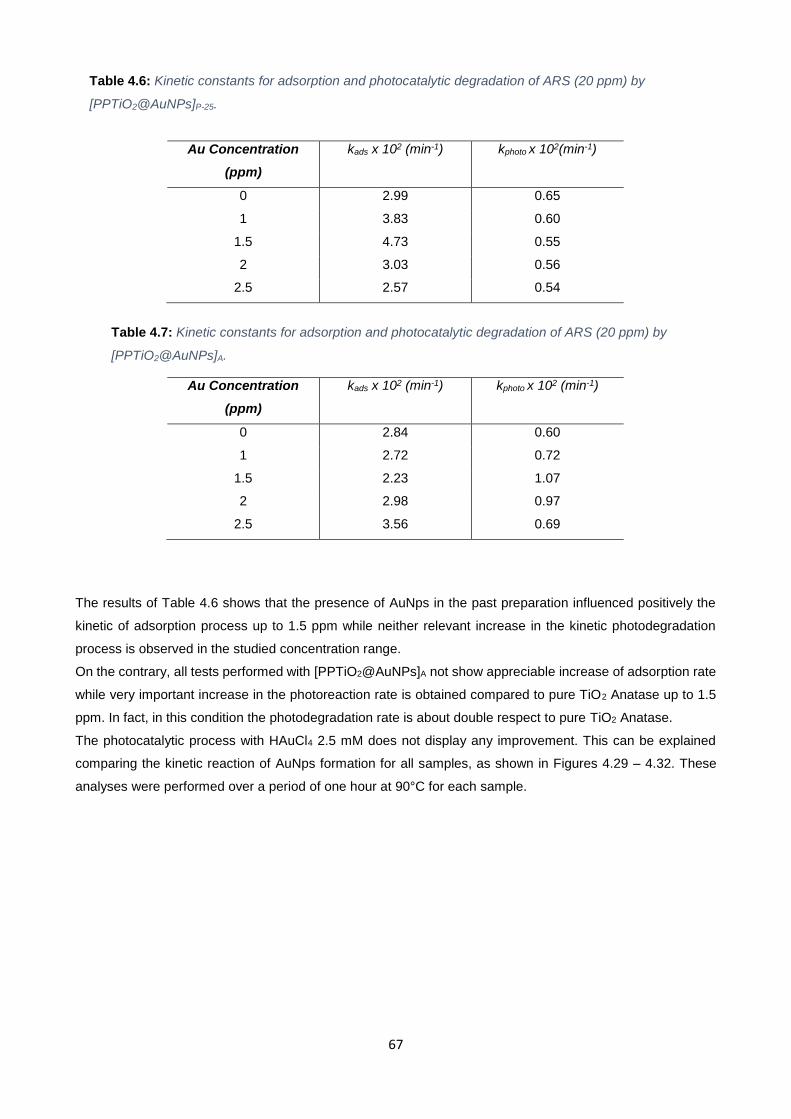
67
The results of Table 4.6 shows that the presence of AuNps in the past preparation influenced positively the
kinetic of adsorption process up to 1.5 ppm while neither relevant increase in the kinetic photodegradation
process is observed in the studied concentration range.
On the contrary, all tests performed with [PPTiO2@AuNPs]A not show appreciable increase of adsorption rate
while very important increase in the photoreaction rate is obtained compared to pure TiO2 Anatase up to 1.5
ppm. In fact, in this condition the photodegradation rate is about double respect to pure TiO2 Anatase.
The photocatalytic process with HAuCl4 2.5 mM does not display any improvement. This can be explained
comparing the kinetic reaction of AuNps formation for all samples, as shown in Figures 4.29 – 4.32. These
analyses were performed over a period of one hour at 90°C for each sample.
Table 4.6: Kinetic constants for adsorption and photocatalytic degradation of ARS (20 ppm) by
[PPTiO2@AuNPs]P-25.
Au Concentration
(ppm)
kads x 102 (min-1) kphoto x 102(min-1)
0 2.99 0.65
1 3.83 0.60
1.5 4.73 0.55
2 3.03 0.56
2.5 2.57 0.54
Au Concentration
(ppm)
kads x 102 (min-1) kphoto x 102 (min-1)
0 2.84 0.60
1 2.72 0.72
1.5 2.23 1.07
2 2.98 0.97
2.5 3.56 0.69
Table 4.7: Kinetic constants for adsorption and photocatalytic degradation of ARS (20 ppm) by
[PPTiO2@AuNPs]A.
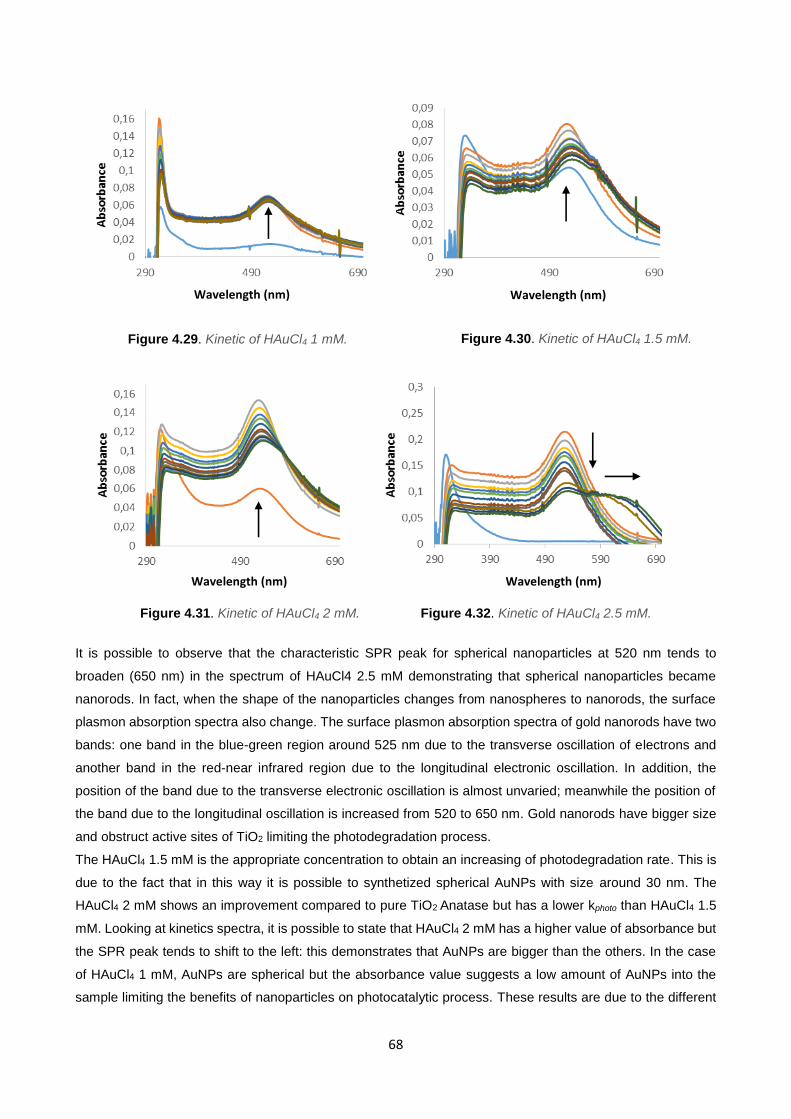
68
It is possible to observe that the characteristic SPR peak for spherical nanoparticles at 520 nm tends to
broaden (650 nm) in the spectrum of HAuCl4 2.5 mM demonstrating that spherical nanoparticles became
nanorods. In fact, when the shape of the nanoparticles changes from nanospheres to nanorods, the surface
plasmon absorption spectra also change. The surface plasmon absorption spectra of gold nanorods have two
bands: one band in the blue-green region around 525 nm due to the transverse oscillation of electrons and
another band in the red-near infrared region due to the longitudinal electronic oscillation. In addition, the
position of the band due to the transverse electronic oscillation is almost unvaried; meanwhile the position of
the band due to the longitudinal oscillation is increased from 520 to 650 nm. Gold nanorods have bigger size
and obstruct active sites of TiO2 limiting the photodegradation process.
The HAuCl4 1.5 mM is the appropriate concentration to obtain an increasing of photodegradation rate. This is
due to the fact that in this way it is possible to synthetized spherical AuNPs with size around 30 nm. The
HAuCl4 2 mM shows an improvement compared to pure TiO2 Anatase but has a lower kphoto than HAuCl4 1.5
mM. Looking at kinetics spectra, it is possible to state that HAuCl4 2 mM has a higher value of absorbance but
the SPR peak tends to shift to the left: this demonstrates that AuNPs are bigger than the others. In the case
of HAuCl4 1 mM, AuNPs are spherical but the absorbance value suggests a low amount of AuNPs into the
sample limiting the benefits of nanoparticles on photocatalytic process. These results are due to the different
Figure 4.29. Kinetic of HAuCl4 1 mM. Figure 4.30. Kinetic of HAuCl4 1.5 mM.
Figure 4.31. Kinetic of HAuCl4 2 mM. Figure 4.32. Kinetic of HAuCl4 2.5 mM.
Wavelength (nm) Wavelength (nm)
Wavelength (nm) Wavelength (nm)
69
reaction conditions during the formation of AuNPs, the kinetic and rate of reaction are very important to obtain
AuNPs with appropriate dimension.
On the other hand, considering [PPTiO2@AuNPs]P-25, no result has shown improvements compared to pure
TiO2 Evonik P-25. The observed differences between TiO2 Anatase and TiO2 Evonik P-25 can probably due
their different composition characteristics. Previous studies[91] demonstrate in fact that the XRD analysis of the
[PPTiO2]A pattern reveals that the structure of TiO2 Anatase remains unchanged after pastes preparation,
indicating that the process did not modify the characteristic nanocrystal structure of TiO2. On the contrary, the
same studies showed that the comparison of [PPTiO2]P-25 (mixture of Anatase and Rutile phases) patterns
shows any change of the Anatase diffraction lines, while the peaks assigned to the Rutile phase are slightly
more pronounced. Growth and sharpening peaks indicated a weak structural reorganization effects of the
structure of the nanocrystalline Rutile phase. Probably, are these crystallographic characteristics of
[PP@TiO2]P-25 that influences the effects of AuNPs.
70
5. CONCLUSIONS
In the last decades, treatment of water pollutants, especially that of dyes from textile industries, has been
widely studied. Different technologies have been developed, in particular those involving the photocatalytic
process promoted by TiO2. However, the photocatalytic efficiency of TiO2 has limited use because of its poor
utilization of solar energy, which is due to its wide band gap and the rapid recombination rate of photoexcited
electron-hole pair. In order to promote the charge separation and enhance light absorption, TiO2 was doped
with AuNPs that, thanks to SPR effect, shift the absorption band of TiO2 to the visible region.
AuNPs with different sizes and shapes have been synthetized from HAuCl4, using Acetylacetone as reducing
agent. Those nanoparticles have been characterized by UV-Vis and DLS spectrometry and Optical
Microscopy. Moreover, in order to understand the reaction between HAuCl4 and Acetylacetone, kinetic studies
on AuNPs formation at different temperatures and concentration of both reactants have been performed.
Three different steps of reaction can be observed during reaction:
the dissociation of HAuCl4 to AuCl4- described by peak around 315 nm;
the formation of [AuAcAc]+ complex (adsorption band at 370 nm);
conversion in AuNPs (adsorption band at 525 nm) from AuCl4- and [AuAcAc]+ species.
From these studies, it is possible to note that higher are the temperature and concentration of reducing agent,
lower is the time for the total conversion of HAuCl4 and of the complex into nanoparticles.
Furthermore, it has been found that the most suitable AuNPs for photocatalytic processes have been obtained
using solutions of Acetylacetone 1.08 x 10⁻¹ M and HAuCl4 5.047 x 10⁻⁵ M, since they provide spherical
nanoparticles with dimension around 30 nm.
Successively, degradation process of ARS at 20 ppm has been performed using [PPTiO2@AuNPs]A and
[PPTiO2@AuNPs]P-25 on PP support. Photocatalytic degradation by [PPTiO2@AuNPs]P-25 does not show any
improvement compared to [PPTiO2]P-25. This is due to composition of [PPTiO2]P-25 formed by mixture of Anatase
and Rutile phases.
On the other hand, [PPTiO2@AuNPs]A shows photodegradation rate values about twice respect to [PPTiO2]A
when AuNPs are synthetized starting from HAuCl4 1.5 mM, confirming the enhancement in visible region and
limitation of electron-hole pairs recombination.
71
REFERENCES
[1] D. Richardson, J. Plewa, D. Wagner, R. Schoeny and M. Demarini.”Occurrence, genotoxicity, and
carcinogenicity of regulated and emerging disinfection by-products in drinking water: a review and roadmap
for research”. Mutation research. 2007, 636, 178-242.
[2] E. Wilfred, P. Hostettler and F. D. Hostettler. “Nonpoint source contamination of the Mississippi River and
its Tributarles by Herbicides”. Env. Sci. Technol. 1993, 27, 1542-1552.
[3] G. McKay. “Waste colour removal from textile effluents”. Am. Dyestuff Rep. 1979, 68, 29-34.
[4] S. Ledakowicz, M. Solecka and R. Zylla. “Biodegradation, decolourization and detoxification of textile
wastewater anhanced by advanced oxidation processes”. Journal of Biotechnology. 2001, 68, 175–184.
[5] Y.M. Slokar and A. Majcen Le Marechal. “Methods of decoloration of textile wastewaters”. Dyes and
Pigments. 1998. 37, 335–356.
[6] W.H. Glaze, J.W. Kang and D.H. Chapin. “The chemistry of water treatment involving ozone, hydrogen
peroxide and ultraviolet radiation”. Ozone Science & Engineering. 1987, 9, 335-342.
[7] J. Kochany and J.R. Bolton. “Mechanism of photodegradation of aqueous organic pollutants. Measurement
of the primary rate constants for reaction of OH∙ radicals with benzene and some halobenzenes using an EPR
spin-trapping method following the photolysis of H2O2”. Envir. Sc. And Tech. 1992, 26, 262-265.
[8] M. Ahmad, E. Ahmed, Y. W. Zhang, N. R. Khalid, J. F. Xu, M. Ullah, and Z. L. Hong. “Preparation of highly
efficient Al-doped ZnO photocatalyst by combustion synthesis”, Curr. Appl Phys. 2013, 13, 697.
[9] A. Sobczynski and A. Dodosz. “Water purification by photocatalysis on semiconductors”. J. of Envir. Stud.
2001, 4, 195-205.
[10] W. X. Li. “Photocatalysis of Oxide Semiconductors”. Journal of the Australian Ceramic Society. 2013, 49,
41-46.
[11] S. E. Braslavsky. ”Glossary of terms used in photochemistry 3rd edition”. Pure and Applied Chemistry.
2007, 79, 293-465.
[12] M.E. Davis and R. J. Davis. “Fundamentals of Chemical Reaction Engineering”. McGraw Hill. 2003, 5,
133.
[13] M. N. Chong, B. Jin, C. W. K. Chow and C. Saint. “Recent developments in photocatalytic water treatment
technology: A review.” Water Reserch. 2010, 44, 2997-3027.
72
[14] J. M. Herrmann. “Heterogeneous photocatalysis: state of the art and present applications”. Topics in
Catalysis. 2005, 34, 1-4.
[15] A. O. Ibhadon and P. Fitzpatrick. “Heterogeneous photocatalysis: recent advances and applications”.
Catalysts. 2013, 3, 189-218.
[16] M. M. Halmann. “Photodegradation of Water Pollutants”. CRC Press, Boca Raton, Florida. 1996, 301.
[17] J. M. Herrmann. “Heterogeneous photocatalysis: fundamentals and applications to the removal of various
types of aqueous pollutants”. Catalyst Today. 1999, 53, 115-129.
[18] S. C. Yan, S. X. Ouyang, J. Gao, M. Yang, J. Y. Feng, X. X. Fan, L. J. Wan, Z. S. Li, J. H. Ye and Y. Zhou.
“A room-temperature reactive-template route to mesoporous ZnGa2O4 with improved photocatalytic activity in
reduction of CO2”. Angew. Chem. Int. Ed. 2010, 122, 6544–6548.
[19] P. Kamat. “TiO2 nanostructures: Recent physical chemistry advances”. J. Phys. Chem. Lett. 2012. 116,
11849–11851.
[20] A Fujishima, T. N. Rao and D. A. Tryk. “Titanium Dioxide Photocatalysis”. Journal of Photochemistry and
Photobiology C Photochemistry Reviews. 2000, 1, 1-21.
[21] A. Di Paola, M. Bellardita and L. Palmisano, “Brookite, the Least Known TiO2 Photocatalyst”. Catalysts.
2013, 3, 36-73.
[22] Z. Rui, S. Wu, C. Peng and H. Ji. “Comparison of TiO2 Degussa P25 with anatase and rutile crystalline
phases for methane combustion”. Chemical Engineering Journal. 2014, 243, 254-264.
[23] U. Diebold. “The surface science of titanium dioxide”. Surface Science Report. 2003, 48, 53-229.
[24] X. Bokhimi, A. Morales, M. Aguilar, J. A. Toledo-Antonio and F. Pedraza. “Local order in titania
polymorphs”. Int. J. Hydrogen Energy. 2001, 26, 1279–1287.
[25] V. Augugliaro, V. Loddo, G. Palmisano and L. Palmisano, “Clean by Light Irradiation Practical Applications
of Supported TiO2”, RSC Publisher 2010.
[26] T. Ohno, K. Sarukawa, K. Tokieda and M. Matsumura. “Morphology of a TiO2 photocatalyst (Degussa, P-
25) consisting of anatase and rutile crystalline phases”. Journal of Catalysis. 2001, 203, 82-86.
[27] R. I. Bickley, T. Gonzalez-Carreno, J. S. Lees, L. Palmisano and R. J. D. Tilley. “A structural investigation
of titanium-dioxide photocatalysts”. Journal of Solid State Chemistry. 1991, 92, 178-190.
73
[28] A. K. Datye, G. Riegel, J. R. Bolton, M. Huang and M. R. Prairie. “Microstructural characterization of a
fumed titanium dioxide photocatalyst”. Journal of Solid State Chemistry, 1995, 115, 236-239.
[29] D.C. Hurum, A.G. Agrios, K.A. Gray, T. Rajh and C. Thurnauer. “Explaining the enhanced photocatalytic
activity of Degussa P25 mixed-phase TiO2 using EPR”. J. Phys. Chem. 2003, 107, 4545.
[30] K. Maeda and K. Domen. “Photocatalytic water splitting: recent progress and future challenges”. J. Phys.
Chem. 2010, 1, 2655-2661.
[31] R. Thiruvenkatachari, S.Vigneswaran and I. S. Moon. “A review on UV/TiO2 photocatalytic oxidation
process”. Korean J. Chem. Eng. 2008, 25, 64-72.
[32] I. K. Konstantinou and T. A. Albanis, “TiO2-assisted photocatalytic degradation of azo dyes in aqueous
solution: kinetic and mechanistic investigations: a review”. Applied Catalysis B. 2004, 49, 1-14.
[33] M. Milievic, B. Geiseler, T. Bergfeldt, P. Bockstaller and L. Fruk. “Enhanced photocatalytic activity of
Au/TiO2 nanocomposite prepared using bifunctional bridging linker”. Adv. Funct. Mater. 2014, 24, 907-915.
[34] A. Kafizas, S. Kellici, J. A. Darr and I. P. Parkin. “Titanium dioxide and composite metal/metal oxide titania
thin films on glass: a comparative study of potocatalytic activity”. J. Photochem. Photobiol. A Chem. 2009, 204,
183-190.
[35] M. Takeuchi, K. Sakamoto, G. Martra, S. Coluccia and M. Anpo. “Mechanism of photoinduced
superhydrophilicity on the TiO2 photocatalyst surface”. J. Phys. Chem. B. 2005, 109, 15422-15428.
[36] K. Nakata and A. Fujishima. “TiO2 photocatalysis: Design and applications”. J Photochem Photobiol C.
2012, 13, 169–189.
[37] R. Sasikalaa,, A.R. Shirolea, V. Sudarsana, V.S. Kamblea, C. Sudakarb, R. Naikb, R. Raoc and S.R.
Bharadwaja. “Role of support on the photocatalytic activity of titanium oxide”. Applied Catalysis. 2010, 20,
245-252.
[38] R. L. Pozzo, M. A. Baltanàs and A. E. Cassano. “Supported titatanium oxide as photocatalyst in water
decontamination: state of the art”. Catalysis Today. 1997, 39, 219-231.
[39] X. Chen and S. S. Mao. “Titanium dioxde nanomaterials: synthesis, properties, modifications and
applications”. Chem. Rev. 2007, 107, 2891-2959.
[40] M. Grätzel. “Dye-sensitized solar cells”. Journal of Photochemistry and Photobiology C, 2003. 4, 145-
153.
74
[41] ZL. Wang. “Transmission electron microscopy of shapecontrolled nanocrystals and their assemblies”. J
Phys. Chem. B. 2000, 104, 1153–1175.
[42] P. Goutam, R. Sudipta and B. Arandam. “Synthesis of multiple shaped gold nanoparticles using wet
chemical method by different dendritic peptides at room temperature”. J. Mater. Chem. 2009, 19, 3457–3468.
[43] P. K. Jain, I. H. El-Sayed and M. A. El-Sayed. 2007. “Au nanoparticles target cancer”. Nanotoday. 2, 18–
29.
[44] U. Kreibing and M. Vollmer. “Optical properties of metal clusters”. Springer. 1995, 24.
[45] K. H. Su, Q. H. Wei and X. Zhang. “Interparticle coupling effects on plasmon resonance of nanogold
particles”. Nano Letters. 2003, 3, 1087–1090.
[46] P. K. Jain, K.S. Lee, I. H. El-Sayed and M. A. El-Sayed. “Calculated absorption and scattering properties
of gold nanoparticles of different size, shape, and composition: applications in biological imaging and
biomedicine”. J. Phys. Chem. B. 2006, 110, 7238-7248.
[47] R. Gans. “Form of ultramicroscopic particles of silver”. Ann. Phys. 1915, 47, 270-284.
[48] X. Huang and M. A. El-Sayed. “Gold nanoparticles: optical properties and implementations in cancer
diagnosis and photothermal therapy”. J. Adv. Res. 2010, 1, 13-28.
[49] G. Landgraf. “Gold: progress in chemistry, biochemistry and technology. Gold in decoration of glass and
ceramics” Wiley, Chichester. 1999.
[50] H. N. Verma, P. Singh and R. M. Chavan. “Gold nanoparticle: synthesis and characterization”. Veterinary
World. 2014, 7, 72-77.
[51] K. Zabetakis, W. E. Ghann, S. Kumar and M. C. Daniel. “Effect of high gold salt concentrations on the size
and polydisperse of gold nanoparticles prepared by an extended Turkevich-Frens method”. Gold Bull. 2012,
45, 203-211.
[52] B.-K. Pong, H.I. Elim, J.-H. Chong, W. Ji, B.L. Trout and J.-Y. Lee. “New Insights on the Nanoparticle
Growth Mechanism in the Citrate Reduction of Gold(III) Salt: Formation of the Au Nanowire Intermediate and
Its Nonlinear Optical Properties”. J. Phys. Chem. 2007, 111, 6281-6287.
[53] M. Faraday. “Experimental Relations of Gold (and Other Metals) to Light”. M. Philos. Trans. R. Soc. 1857,
147, 145.
75
[54] N.R. Jana, L. Gearheart and C.J. Murphy. “Seeding Growth for Size Control of 5−40 nm Diameter Gold
Nanoparticles”. Langmuir. 2001, 17, 6782–6786.
[55] S.D. Perrault and W.C.W. Chan. “Synthesis and Surface Modification of Highly Monodispersed, Spherical
Gold Nanoparticles of 50−200 nm”. J. Am. Chem. Soc. 2009, 131, 17042–17043.
[56] S. Kundu, A. Pal, S. K. Ghosh, S. Nath, S. Panigrahi, S. Praharaj and T. Pal. “A new route to obtain shape-
controlled gold nanoparticles from Au(III)-β-diketonates”. Inorg. Chem. 2004, 43, 5489–5491.
[57] D. Michael and P. Mingos. “Gold clusters, colloids and nanoparticles I”. Springer. 2014, 3, 25-26.
[58] K. M. Harkness, D. E. Cliffel and J. A. McLean. “Characterization of thiolate-protected gold nanoparticles
by mass spectrometry”. Analyst. 2010, 135, 868–874.
[59] C. Louis and O. Pluchery. “Gold nanoparticles for physics, chemistry and biology”. Imperial College Press.
2012, 5, 108.
[60] G. Peng, U. Tisch, O. Adams, M. Hakim, N. Shehada, YY. Broza, S. Bilan, R. Abdah-Bortnyak, A. Kuten
and H. Haick. “Diagnosing lung cancer in exhaled breath using gold nanoparticles”. Nat Nanotechnol. 2009,
4, 669–673.
[61] S. D. Brown, P. Nativo, J-A Smith, D. Stirling, P. R. Edwards, B. Venugopal, D. J. Flint, J. A. Plumb, D.
Graham and N. J. Wheate. “Gold nanoparticles for the improved anticancer drug delivery of the active
component of oxaliplatinum”. J. Am. Chem. Soc. 2010, 132, 4678–4684.
[62] M. Haruta. “Size- and support-dependency in the catalysis of gold”. Catal. Today. 1997, 36, 153–166.
[63] A. Zielinska, E. Kowalska and J. W. Sobczak. “Silver-doped TiO2 prepared by microemulsion method:
surface properties, bio- and photoactivity”. Separation and Purification Technology. 2010, 72, 309–318.
[64] M. N. Chong, B. Jin, C. W. K. Chow and C. Saint. “Recent developments in photocatalytic water
treatment technology: a review”. Water Res. 2010, 44, 2997-3027.
[65] J. Cui, J., T. He, T., X. Zhang, X., 2013. “Synthesis of Fe3O4@SiO2@PtionTiO2 hybrid composites with
high efficient UV-visible light photoactivity”. Catal. Commun. 2013, 40, 66-70.
[66] H. Dong, G. Zeng, L. Tang, C. Fan, C. Zhang, X. He and Y. He. “An overview on limitations of TiO2-based
particles for photocatalytic degradation of organic pollutants and the corresponding countermeasures”. Water
Research. 2015, 79, 128-146.
[67] A. Wold. “Photocatalytic properties of TiO2”. Chemistry of Materials. 1993, 5, 280-283.
76
[68] S. K. Cushing, J. Li, F. Meng, T. R. Senty, S. Suri, M. Zhi, M. Li,‡ A. D. Bristow, and N.Wu. “Photocatalytic
Activity Enhanced by Plasmonic Resonant Energy Transfer from Metal to Semiconductor”. J. Am. Chem. Soc.
2012, 134, 15033−15041.
[69] S. M. Gupta and M. Tripathi. “A review of TiO2 nanoparticles”. Chinese Sci. Bull. 2011, 16, 1639–1657.
[70] Z. Liu, W. Hou, P. Pavaskar, M. Aykol and SB. Cronin. “Plasmon resonant enhancement of
photocatalytic water splitting under visible illumination”. Nano let. 2011, 11, 1111-1116.
[71] U.G. Akpan and B.H. Hameed “Parameters affecting the photocatalytic degradation of dyes using TiO2-
based photocatalysts: A review”. Journal of Hazardous Materials. 2009, 170, 520–529.
[72] S. Lathasree, A.N. Rao, B. SivaSankar, V. Sadasivam and K. Rengaraj. “Heterogeneous photocatalytic
mineralization of phenols in aqueous solutions”. J. Mol. Catal. A: Chem.2004, 223,101–105.
[73] S. Sakthivela, B. Neppolianb, M.V. Shankarb, B. Arabindoob, M. Palanichamyb and V. Murugesan, “Solar
photocatalytic degradation of azo dye: comparison of photocatalytic efficiency of ZnO and TiO2”. Solar Energy
Materials & Solar Cells. 2003, 77, 65–82.
[74] M.A. Fox and M.T. Dulay. “Heterogeneous photocatalysis”. Chem. Rev. 1993 93,341.
[75] J. A. Ayllón, A. Figueras, S. Garelik, L. Spirkova, J. Durand, L. Cot, “Preparation of TiO2 powder using
titanium tetraisopropoxide decomposition in a plasma enhanced chemical vapor deposition (PECVD) reactor”.
Journal Of Materials Science Letters. 1999, 18, 1319-1321.
[76] M. Bouchy and O. Zahraa. “Photocatalytic reactors”. Int. J. Of Photoen. 2003, 3, 191-197.
[77] E. N. Abrahart. “Dyes and their Intermediates”. Chemical Publishing. 1977. 1-12.
[78] T. Kodom, E. Amouzou, G. Djaneye-Boundjoua and L. M. Bawa “Photocatalytic Discoloration of Methyl
Orange and Indigo Carmine on TiO2 (P25) Deposited on Conducting Substrates: Effect of H2O2 and S2O82-”.
Intern. J. Chem. Tech. 2012, 4, 45-56.
[79] J. Mech, M. A. Grela, K. Szacilowski. “Ground and excited state properties of alizarin and its isomers”.
Dyes and Pigments. 2014, 103, 202-213.
[80] C. Burgess, O. Thomas. “UV-Visible Spectrophotometry Of Water And Wastewater”. Techniques And
Instrumentation In Analytical Chemistry. Elsevier, 2007.
[81] B. Herman and J. J. Lemasters. “Optical Microscopy: Emerging Methods and Applications”. Academic
Press, Inc. 2012.
77
[82] E. Meyer. “Atomic Force Microscopy”. Surface Science. 1992, 41, 3-49.
[83] B. J. Berne and R. Pecora. “Dynamic Light Scattering: with applications in Cheistry, Biology and Physics”.
Dover. 2013.
[84] D. T. Nguyen, D-J. Kim, M. G. So and K-S. Kim. “Experimental measurements of gold nanoparticles
nucleation and growth by citrate reduction of HAuCl4”. Advanced Powder Technology. 2010. 21, 111-118.
[85] C. A. D’Amato. “Optimization of photocatalytic reactor for dyes degradation using PP coated Nano-TiO2”.
Experimental Thesis in Environmental Chemistry and Laboratory, 2013.
[86] W. Haiss, N. T. K. Thanh, J. Aveyard and D. G. Fernig. “Determination of Size and Concentration of Gold
Nanoparticles from UV-Vis Spectra”. Anal. Chem. 2007. 79, 4215-4221.
[87] A. Gultekin. “Effect of Au Nanoparticles Doping on the properties of TiO2 thin films”. Material Science.
2014. 20, 10-14.
[88] R. K. Gautam, A. Mudhoo and M. C. Chattopadhyaya. “Kinetic, equilibrium, thermodynamic studies and
spectroscopic analysis of Alizarin Red S removal by mustard husk”. Journal of Environmental Chemical
Engineering. 2013, 1, 1283-1291.
[89] E. Rommozzi. “Kinetic Model for Photocatalytic Degradation of Alizarin Red-S by PP coated nano-TiO2”.
Experimental Thesis in Environmental Chemistry and Laboratory, 2013.
[90] J.-L. Gu, J.-L. Shi, G.-J. You, L.-M. Xiong, S.-X. Qian, Z.-L. Hua and H.-R. Chen. “Incorporation of highly
dispersed gold nanoparticles into the pore channels of mesoporous silica thin films and their ultrafast nonlinear
optical response”. Adv. Mater. 2005. 5, 557-560.
[91] R. Giovannetti, C.A. D’Amato, E. Rommozzi, M. Zannotti, M. Minicucci and R. Gunnella. “Characterization
and environmental of polypropylene coated nano-TiO2 in wastewaters depuration”. FNMA Camerino. 2014.