Embed Size (px)
Citation preview
*For correspondence:
[email protected] (SV);
[email protected] (RD);
[email protected] (FH)
†These authors contributed
equally to this work
Competing interests: The
authors declare that no
competing interests exist.
Funding: See page 15
Received: 17 June 2020
Accepted: 20 November 2020
Published: 23 November 2020
Reviewing editor: Jonathan Erik
Peelle, Washington University in
St. Louis, United States
Copyright Vickery et al. This
article is distributed under the
terms of the Creative Commons
Attribution License, which
permits unrestricted use and
redistribution provided that the
original author and source are
credited.
Chimpanzee brain morphometry utilizingstandardized MRI preprocessing andmacroanatomical annotationsSam Vickery1,2*, William D Hopkins3, Chet C Sherwood4, Steven J Schapiro3,5,Robert D Latzman6, Svenja Caspers7,8,9, Christian Gaser10,11, Simon B Eickhoff1,2,Robert Dahnke10,11,12†*, Felix Hoffstaedter1,2†*
1Institute of Systems Neuroscience, Medical Faculty, Heinrich-Heine-University,Dusseldorf, Germany; 2Institute of Neuroscience and Medicine (INM-7) ResearchCentre Julich, Julich, Germany; 3Keeling Center for Comparative Medicine andResearch, The University of Texas MD Anderson Cancer Center, Bastrop, UnitedStates; 4Department of Anthropology and Center for the Advanced Study ofHuman Paleobiology, The George Washington University, Washington, UnitedStates; 5Department of Experimental Medicine, University of Copenhagen,Copenhagen, Denmark; 6Department of Psychology, Georgia State University,Atlanta, United States; 7Institute of Neuroscience and Medicine (INM-1), ResearchCentre Julich, Julich, Germany; 8Institute for Anatomy I, Medical Faculty, Heinrich-Heine-University, Dusseldorf, Germany; 9JARA-BRAIN, Julich-Aachen ResearchAlliance, Julich, Germany; 10Structural Brain Mapping Group, Department ofNeurology, Jena University Hospital, Jena, Germany; 11Structural Brain MappingGroup, Department of Psychiatry and Psychotherapy, Jena University Hospital,Jena, Germany; 12Center of Functionally Integrative Neuroscience, Department ofClinical Medicine, Aarhus University, Aarhus, Denmark
Abstract Chimpanzees are among the closest living relatives to humans and, as such, provide a
crucial comparative model for investigating primate brain evolution. In recent years, human brain
mapping has strongly benefited from enhanced computational models and image processing
pipelines that could also improve data analyses in animals by using species-specific templates. In
this study, we use structural MRI data from the National Chimpanzee Brain Resource (NCBR) to
develop the chimpanzee brain reference template Juna.Chimp for spatial registration and the
macro-anatomical brain parcellation Davi130 for standardized whole-brain analysis. Additionally, we
introduce a ready-to-use image processing pipeline built upon the CAT12 toolbox in SPM12,
implementing a standard human image preprocessing framework in chimpanzees. Applying this
approach to data from 194 subjects, we find strong evidence for human-like age-related gray
matter atrophy in multiple regions of the chimpanzee brain, as well as, a general rightward
asymmetry in brain regions.
IntroductionChimpanzees (Pan troglodytes) along with bonobos (Pan paniscus) represent the closest extant rela-
tives of humans sharing a common ancestor approximately 7–8 million years ago
(Langergraber et al., 2012). Experimental and observational studies, in both the field and in captiv-
ity, have documented a range of cognitive abilities that are shared with humans such as tool use and
manufacturing (Shumaker et al., 2011), symbolic thought (de and Frans, 1996), mirror self-
Vickery et al. eLife 2020;9:e60136. DOI: https://doi.org/10.7554/eLife.60136 1 of 20
RESEARCH ARTICLE
recognition (Anderson and Gallup, 2015; Hecht et al., 2017) and some basic elements of language
(Savage-Rumbaugh, 1986; Savage-Rumbaugh and Lewin, 1994; Tomasello and Call, 1997) like
conceptual metaphorical mapping (Dahl and Adachi, 2013). This cognitive complexity together with
similar neuroanatomical features (Zilles et al., 1989; Rilling and Insel, 1999; Gomez-Robles et al.,
2013; Hopkins et al., 2014; Hopkins et al., 2017) and genetic proximity (Waterson et al., 2005)
renders these species unique among non-human primates to study the evolutional origins of the
human condition. In view of evolutionary neurobiology, the relatively recent divergence between
humans and chimpanzees explains the striking similarities in major gyri and sulci, despite profound
differences in overall brain size. Numerous studies using magnetic resonance imaging (MRI) have
compared relative brain size, shape, and gyrification in humans and chimpanzees (Zilles et al., 1989;
Rilling and Insel, 1999; Gomez-Robles et al., 2013; Hopkins et al., 2014; Hopkins et al., 2017).
Previous studies of brain aging in chimpanzees have reported minimal indications of atrophy
(Herndon et al., 1999; Sherwood et al., 2011; Chen et al., 2013; Autrey et al., 2014). Neverthe-
less, Edler et al., 2017 recently found that brains of older chimpanzees’ exhibit both neurofibrillary
tangles and amyloid plaques, the classical features of Alzheimer’s disease (AD). Neurodegeneration
in the aging human brain includes marked atrophy in frontal and temporal lobes and decline in glu-
cose metabolism even in the absence of detectable amyloid beta deposition, which increases the
likelihood of cognitive decline and development of AD (Jagust, 2018). Given the strong association
of brain atrophy and amyloid beta in humans, this phenomenon requires further investigation in
chimpanzees.
Cortical asymmetry is a prominent feature of brain organization in many primate species
(Hopkins et al., 2015) and was recently shown in humans in a large-scale ENIGMA (Enhancing Neu-
roimaging Genetics through Meta-Analysis) study (Kong et al., 2018). For chimpanzees, various
studies have reported population-level asymmetries in different parts of the brain associated with
higher order cognitive functions like tool-use (Freeman et al., 2004; Hopkins et al., 2008;
Hopkins et al., 2017; Hopkins and Nir, 2010; Lyn et al., 2011; Bogart et al., 2012; Gilissen and
Hopkins, 2013) but these results are difficult to compare within and across species, due to the lack
of standardized registration and parcellation techniques as found for humans.
To date, there is no common reference space for the chimpanzee brain available to reliably asso-
ciate and quantitatively compare neuro-anatomical evidence, nor is there a standardized image
processing protocol for T1-weighted (T1w) brain images from chimpanzees that matches human
imaging standards. With the introduction of voxel-based morphometry (Ashburner and Friston,
2000) and the ICBM (international consortium of brain mapping) standard human reference brain
templates almost two decades ago (Mazziotta et al., 2001), MRI analyses became directly compara-
ble and generally reproducible. In this study, we adapt state-of-the-art MRI (magnetic resonance
imaging) processing methods to assess brain aging and cortical asymmetry in the chimpanzee brain.
To make this possible, we rely on the largest openly available resource of chimpanzee MRI data: the
National Chimpanzee Brain Resource (NCBR, http://www.chimpanzeebrain.org/), including in vivo
MRI images of 223 subjects from 9 to 54 years of age (Mean age = 26.9 ± 10.2 years). The aim of
this study is the creation of a chimpanzee template permitting automated and reproducible image
registration, normalization, statistical analysis, and visualization to systematically investigate brain
aging and hemispheric asymmetry in chimpanzees.
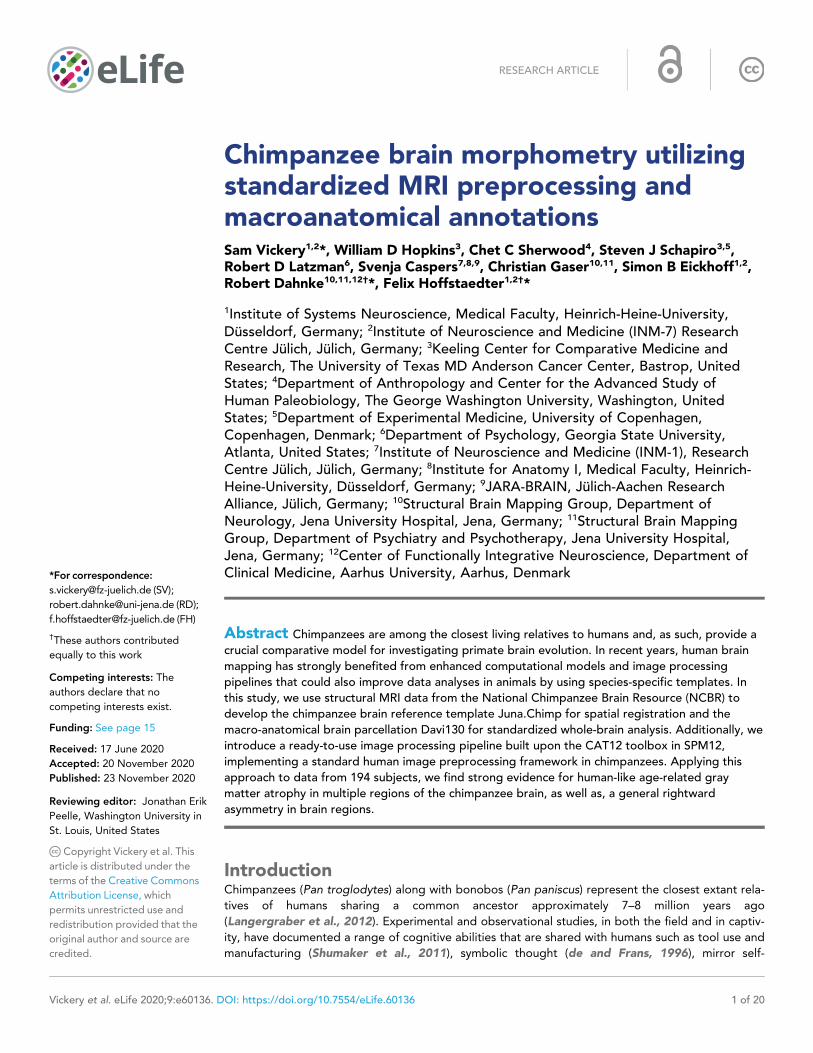
ResultsInitially, we created the population-based Juna.Chimp (Forschungszentrum Juelich - University Jena)
T1-template, tissue probability maps (TPM) for tissue classification and a non-linear spatial registra-
tion ‘Shooting’ templates (Figure 1) in an iterative fashion at 1 mm spatial resolution. The prepro-
cessing pipeline and templates creation were established using the freely available Statistical
Parametric Mapping (SPM12 v7487, http://www.fil.ion.ucl.ac.uk/spm/) software and Computational
Anatomy Toolbox (CAT12 r1704 http://www.neuro.uni-jena.de/cat/). Juna.Chimp templates, the
Davi130 parcellation, gray matter (GM) masks utilized, as well as statistical maps from our analysis
are interactively accessible and downloadable via the Juna.Chimp web viewer (http://junachimp.
inm7.de/).
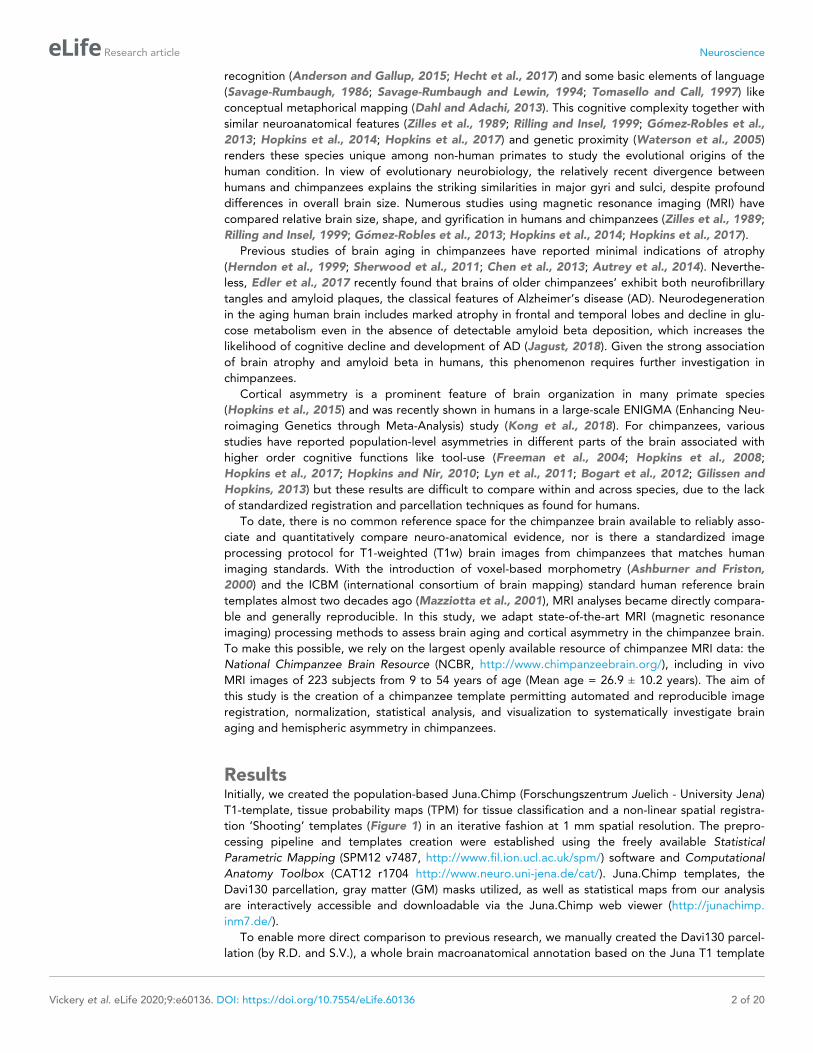
To enable more direct comparison to previous research, we manually created the Davi130 parcel-
lation (by R.D. and S.V.), a whole brain macroanatomical annotation based on the Juna T1 template
Vickery et al. eLife 2020;9:e60136. DOI: https://doi.org/10.7554/eLife.60136 2 of 20
Research article Neuroscience
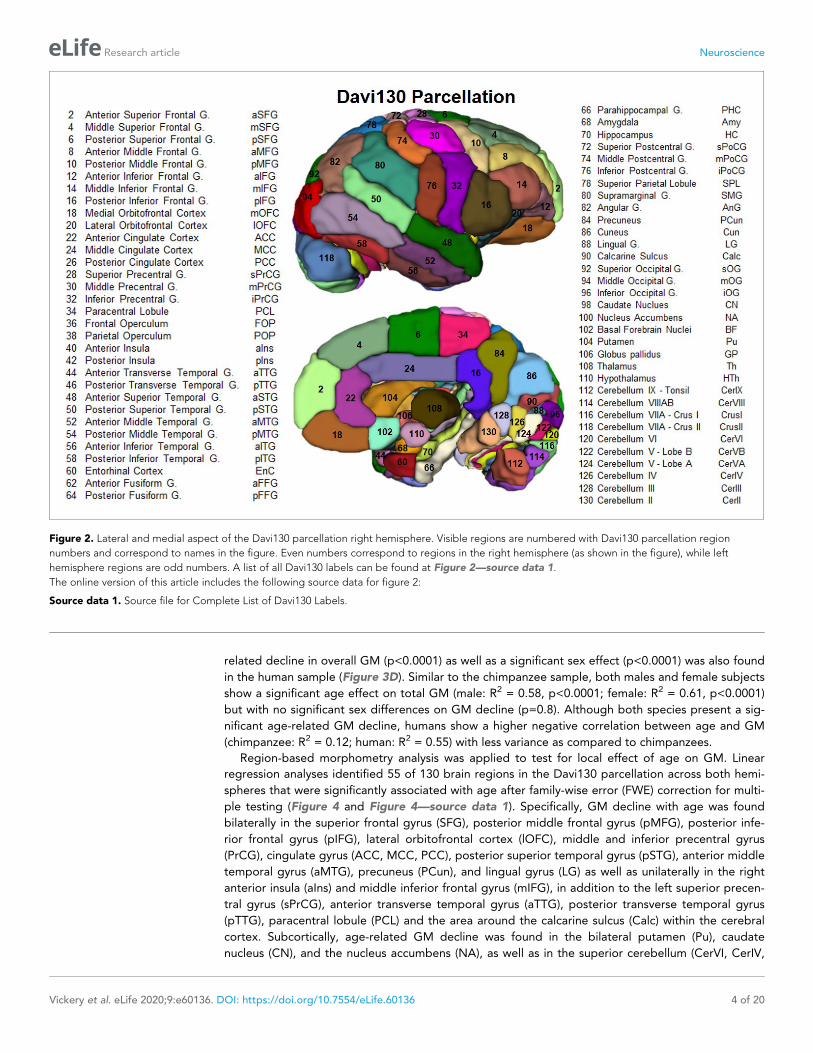
(Figure 2). The delineation of regions within the cortex was determined by following major gyri and
sulci, whereby, large regions were arbitrarily split into two to three sub-regions of approximate equal
size even though histological studies show that micro-anatomical borders between brain regions are
rarely situated at the fundus (Sherwood et al., 2003; Schenker et al., 2010; Spocter et al., 2010;
Amunts and Zilles, 2015). This process yielded 65 regions per hemisphere for a total of 130 regions
for the Davi130 macro-anatomical manual parcellation (Figure 2 and Figure 2—source data 1).
Following successful CAT12 preprocessing, rigorous quality control (QC) was employed to iden-
tify individual MRI scans suitable for statistical analysis of brain aging and hemispheric asymmetry in
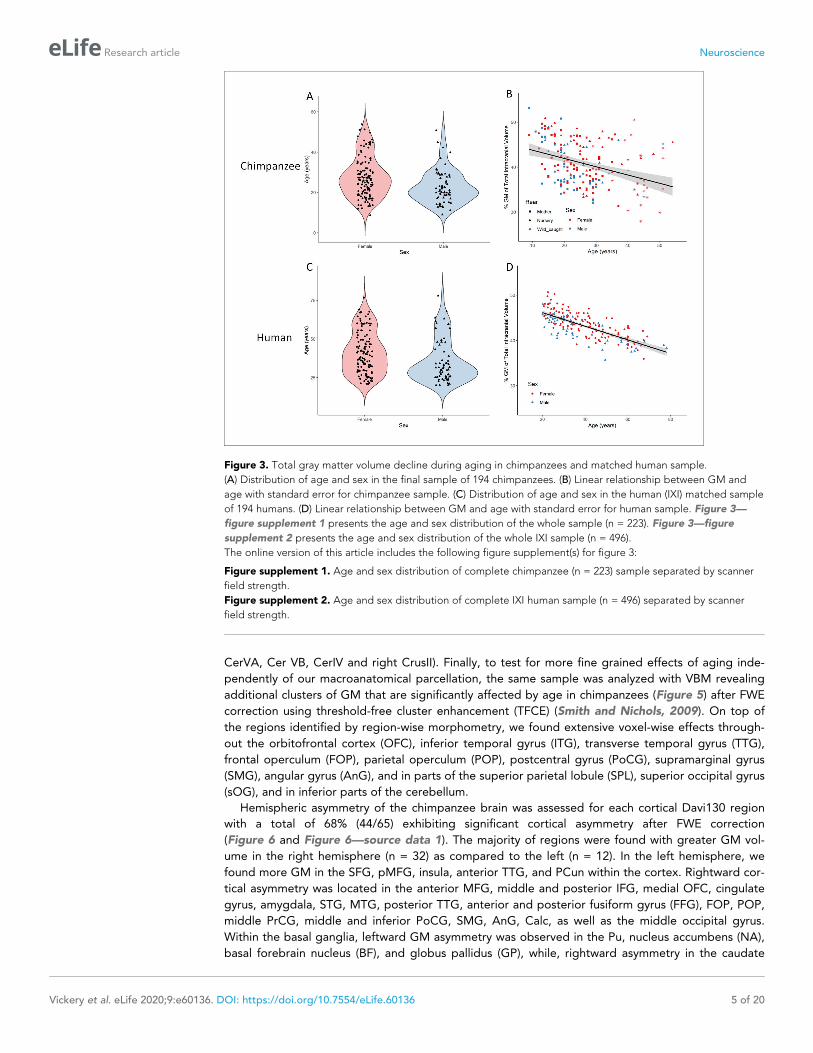
chimpanzees. Our final sample consists of 194 chimpanzees including 130 females with an age range
of 9–54 years and a mean age of 26.3 ± 9.9 years (Figure 3A). The linear regression model with GM
fraction of total intracranial volume as the dependent variable and age, scanner field strength, sex,
and rearing environment revealed a significant negative association between age and GM
(p<0.0001) demonstrating age-related decline in overall GM density (Figure 3B). Both sex (p=0.004)
and scanner field strength (p<0.0001) showed a significant effect on total GM volume. Therefore,
the sample was split into male and female subjects and into 1.5T and 3T scanner, whereby, all sub-
samples showed a significant age effect on GM (male: R2 = 0.17, p=0.0004; female R2 = 0.13,
p<0.0001, 1.5T: R2 = 0.19, p<0.0001; 3T: R2 = 0.09, p=0.004). There were no significant sex differen-
ces of GM decline (p=0.3). The same analysis was conducted on a matched human sample from the
IXI dataset (Figure 3C; https://brain-development.org/ixi-dataset/). The human sample was matched
based on age, sex, and scanner field strength (n = 194, 128 females, 20–78 y/o,
mean = 39.4 ± 14.0). As life span and aging processes are different between species, the human
sample was matched to chimpanzees roughly by using a factor of 1.5* for age. A significant age-
Figure 1. Juna.Chimp templates including the average. T1- template, tissue probability maps (TPM), and Geodesic Shooting template. For Shooting
templates and TPM axial slices are shown of gray matter (GM), white matter (WM), and cerebrospinal fluid (CSF). All templates are presented at 0.5 mm
resolution.
Vickery et al. eLife 2020;9:e60136. DOI: https://doi.org/10.7554/eLife.60136 3 of 20
Research article Neuroscience
related decline in overall GM (p<0.0001) as well as a significant sex effect (p<0.0001) was also found
in the human sample (Figure 3D). Similar to the chimpanzee sample, both males and female subjects
show a significant age effect on total GM (male: R2 = 0.58, p<0.0001; female: R2 = 0.61, p<0.0001)
but with no significant sex differences on GM decline (p=0.8). Although both species present a sig-
nificant age-related GM decline, humans show a higher negative correlation between age and GM
(chimpanzee: R2 = 0.12; human: R2 = 0.55) with less variance as compared to chimpanzees.
Region-based morphometry analysis was applied to test for local effect of age on GM. Linear
regression analyses identified 55 of 130 brain regions in the Davi130 parcellation across both hemi-
spheres that were significantly associated with age after family-wise error (FWE) correction for multi-
ple testing (Figure 4 and Figure 4—source data 1). Specifically, GM decline with age was found
bilaterally in the superior frontal gyrus (SFG), posterior middle frontal gyrus (pMFG), posterior infe-
rior frontal gyrus (pIFG), lateral orbitofrontal cortex (lOFC), middle and inferior precentral gyrus
(PrCG), cingulate gyrus (ACC, MCC, PCC), posterior superior temporal gyrus (pSTG), anterior middle
temporal gyrus (aMTG), precuneus (PCun), and lingual gyrus (LG) as well as unilaterally in the right
anterior insula (aIns) and middle inferior frontal gyrus (mIFG), in addition to the left superior precen-
tral gyrus (sPrCG), anterior transverse temporal gyrus (aTTG), posterior transverse temporal gyrus
(pTTG), paracentral lobule (PCL) and the area around the calcarine sulcus (Calc) within the cerebral
cortex. Subcortically, age-related GM decline was found in the bilateral putamen (Pu), caudate
nucleus (CN), and the nucleus accumbens (NA), as well as in the superior cerebellum (CerVI, CerIV,
Figure 2. Lateral and medial aspect of the Davi130 parcellation right hemisphere. Visible regions are numbered with Davi130 parcellation region
numbers and correspond to names in the figure. Even numbers correspond to regions in the right hemisphere (as shown in the figure), while left
hemisphere regions are odd numbers. A list of all Davi130 labels can be found at Figure 2—source data 1.
The online version of this article includes the following source data for figure 2:
Source data 1. Source file for Complete List of Davi130 Labels.
Vickery et al. eLife 2020;9:e60136. DOI: https://doi.org/10.7554/eLife.60136 4 of 20
Research article Neuroscience
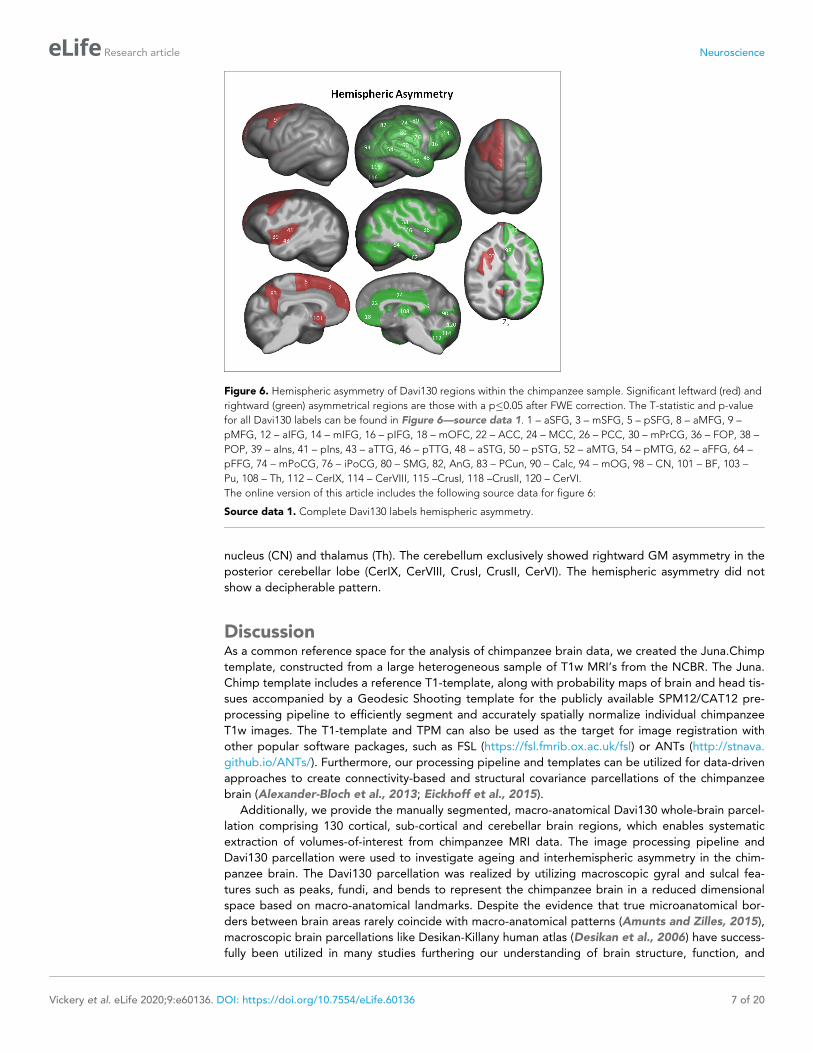
CerVA, Cer VB, CerIV and right CrusII). Finally, to test for more fine grained effects of aging inde-
pendently of our macroanatomical parcellation, the same sample was analyzed with VBM revealing
additional clusters of GM that are significantly affected by age in chimpanzees (Figure 5) after FWE
correction using threshold-free cluster enhancement (TFCE) (Smith and Nichols, 2009). On top of
the regions identified by region-wise morphometry, we found extensive voxel-wise effects through-
out the orbitofrontal cortex (OFC), inferior temporal gyrus (ITG), transverse temporal gyrus (TTG),
frontal operculum (FOP), parietal operculum (POP), postcentral gyrus (PoCG), supramarginal gyrus
(SMG), angular gyrus (AnG), and in parts of the superior parietal lobule (SPL), superior occipital gyrus
(sOG), and in inferior parts of the cerebellum.
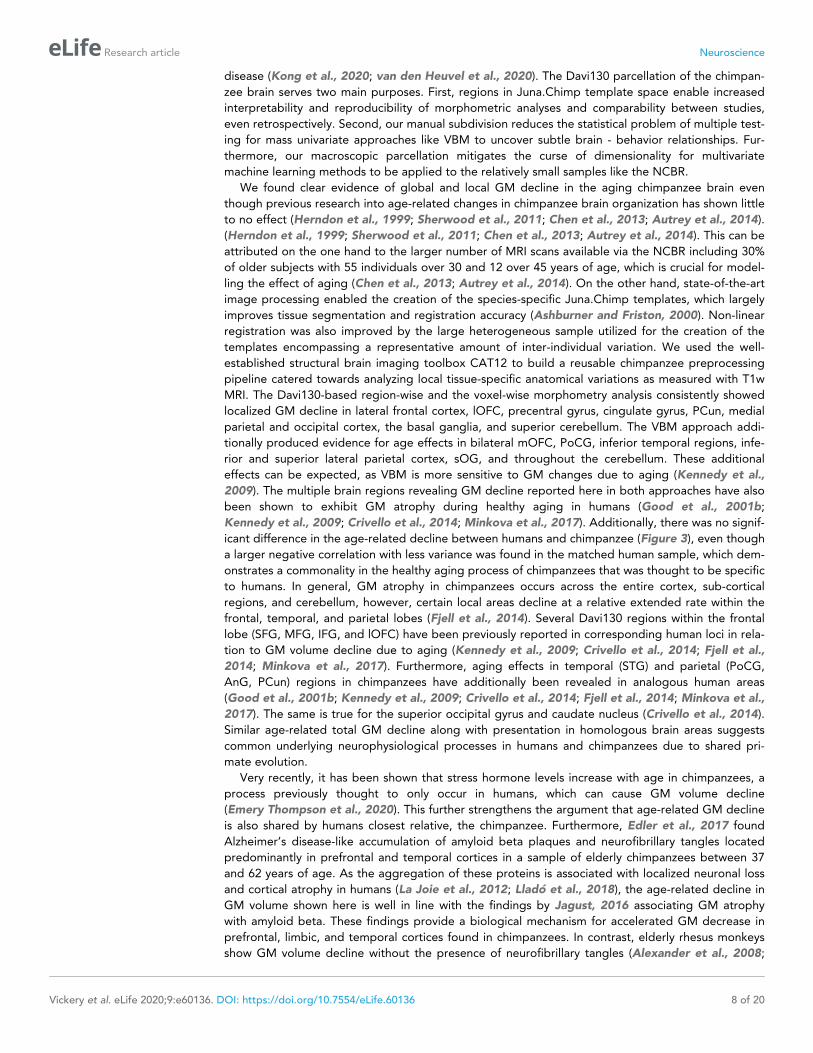
Hemispheric asymmetry of the chimpanzee brain was assessed for each cortical Davi130 region
with a total of 68% (44/65) exhibiting significant cortical asymmetry after FWE correction
(Figure 6 and Figure 6—source data 1). The majority of regions were found with greater GM vol-
ume in the right hemisphere (n = 32) as compared to the left (n = 12). In the left hemisphere, we
found more GM in the SFG, pMFG, insula, anterior TTG, and PCun within the cortex. Rightward cor-
tical asymmetry was located in the anterior MFG, middle and posterior IFG, medial OFC, cingulate
gyrus, amygdala, STG, MTG, posterior TTG, anterior and posterior fusiform gyrus (FFG), FOP, POP,
middle PrCG, middle and inferior PoCG, SMG, AnG, Calc, as well as the middle occipital gyrus.
Within the basal ganglia, leftward GM asymmetry was observed in the Pu, nucleus accumbens (NA),
basal forebrain nucleus (BF), and globus pallidus (GP), while, rightward asymmetry in the caudate
Figure 3. Total gray matter volume decline during aging in chimpanzees and matched human sample.
(A) Distribution of age and sex in the final sample of 194 chimpanzees. (B) Linear relationship between GM and
age with standard error for chimpanzee sample. (C) Distribution of age and sex in the human (IXI) matched sample
of 194 humans. (D) Linear relationship between GM and age with standard error for human sample. Figure 3—
figure supplement 1 presents the age and sex distribution of the whole sample (n = 223). Figure 3—figure
supplement 2 presents the age and sex distribution of the whole IXI sample (n = 496).
The online version of this article includes the following figure supplement(s) for figure 3:
Figure supplement 1. Age and sex distribution of complete chimpanzee (n = 223) sample separated by scanner
field strength.
Figure supplement 2. Age and sex distribution of complete IXI human sample (n = 496) separated by scanner
field strength.
Vickery et al. eLife 2020;9:e60136. DOI: https://doi.org/10.7554/eLife.60136 5 of 20
Research article Neuroscience
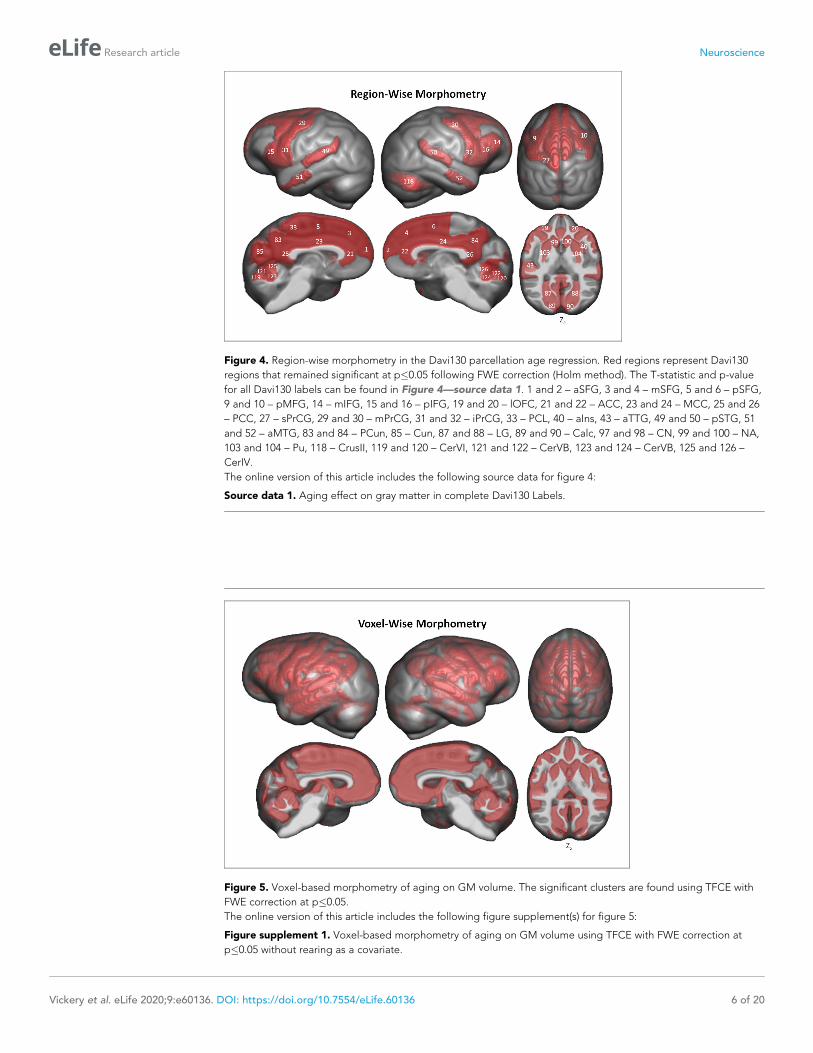
Figure 4. Region-wise morphometry in the Davi130 parcellation age regression. Red regions represent Davi130
regions that remained significant at p�0.05 following FWE correction (Holm method). The T-statistic and p-value
for all Davi130 labels can be found in Figure 4—source data 1. 1 and 2 – aSFG, 3 and 4 – mSFG, 5 and 6 – pSFG,
9 and 10 – pMFG, 14 – mIFG, 15 and 16 – pIFG, 19 and 20 – lOFC, 21 and 22 – ACC, 23 and 24 – MCC, 25 and 26
– PCC, 27 – sPrCG, 29 and 30 – mPrCG, 31 and 32 – iPrCG, 33 – PCL, 40 – aIns, 43 – aTTG, 49 and 50 – pSTG, 51
and 52 – aMTG, 83 and 84 – PCun, 85 – Cun, 87 and 88 – LG, 89 and 90 – Calc, 97 and 98 – CN, 99 and 100 – NA,
103 and 104 – Pu, 118 – CrusII, 119 and 120 – CerVI, 121 and 122 – CerVB, 123 and 124 – CerVB, 125 and 126 –
CerIV.
The online version of this article includes the following source data for figure 4:
Source data 1. Aging effect on gray matter in complete Davi130 Labels.
Figure 5. Voxel-based morphometry of aging on GM volume. The significant clusters are found using TFCE with
FWE correction at p�0.05.
The online version of this article includes the following figure supplement(s) for figure 5:
Figure supplement 1. Voxel-based morphometry of aging on GM volume using TFCE with FWE correction at
p�0.05 without rearing as a covariate.
Vickery et al. eLife 2020;9:e60136. DOI: https://doi.org/10.7554/eLife.60136 6 of 20
Research article Neuroscience
nucleus (CN) and thalamus (Th). The cerebellum exclusively showed rightward GM asymmetry in the
posterior cerebellar lobe (CerIX, CerVIII, CrusI, CrusII, CerVI). The hemispheric asymmetry did not
show a decipherable pattern.
DiscussionAs a common reference space for the analysis of chimpanzee brain data, we created the Juna.Chimp
template, constructed from a large heterogeneous sample of T1w MRI’s from the NCBR. The Juna.
Chimp template includes a reference T1-template, along with probability maps of brain and head tis-
sues accompanied by a Geodesic Shooting template for the publicly available SPM12/CAT12 pre-
processing pipeline to efficiently segment and accurately spatially normalize individual chimpanzee
T1w images. The T1-template and TPM can also be used as the target for image registration with
other popular software packages, such as FSL (https://fsl.fmrib.ox.ac.uk/fsl) or ANTs (http://stnava.
github.io/ANTs/). Furthermore, our processing pipeline and templates can be utilized for data-driven
approaches to create connectivity-based and structural covariance parcellations of the chimpanzee
brain (Alexander-Bloch et al., 2013; Eickhoff et al., 2015).
Additionally, we provide the manually segmented, macro-anatomical Davi130 whole-brain parcel-
lation comprising 130 cortical, sub-cortical and cerebellar brain regions, which enables systematic
extraction of volumes-of-interest from chimpanzee MRI data. The image processing pipeline and
Davi130 parcellation were used to investigate ageing and interhemispheric asymmetry in the chim-
panzee brain. The Davi130 parcellation was realized by utilizing macroscopic gyral and sulcal fea-
tures such as peaks, fundi, and bends to represent the chimpanzee brain in a reduced dimensional
space based on macro-anatomical landmarks. Despite the evidence that true microanatomical bor-
ders between brain areas rarely coincide with macro-anatomical patterns (Amunts and Zilles, 2015),
macroscopic brain parcellations like Desikan-Killany human atlas (Desikan et al., 2006) have success-
fully been utilized in many studies furthering our understanding of brain structure, function, and
Figure 6. Hemispheric asymmetry of Davi130 regions within the chimpanzee sample. Significant leftward (red) and
rightward (green) asymmetrical regions are those with a p�0.05 after FWE correction. The T-statistic and p-value
for all Davi130 labels can be found in Figure 6—source data 1. 1 – aSFG, 3 – mSFG, 5 – pSFG, 8 – aMFG, 9 –
pMFG, 12 – aIFG, 14 – mIFG, 16 – pIFG, 18 – mOFC, 22 – ACC, 24 – MCC, 26 – PCC, 30 – mPrCG, 36 – FOP, 38 –
POP, 39 – aIns, 41 – pIns, 43 – aTTG, 46 – pTTG, 48 – aSTG, 50 – pSTG, 52 – aMTG, 54 – pMTG, 62 – aFFG, 64 –
pFFG, 74 – mPoCG, 76 – iPoCG, 80 – SMG, 82, AnG, 83 – PCun, 90 – Calc, 94 – mOG, 98 – CN, 101 – BF, 103 –
Pu, 108 – Th, 112 – CerIX, 114 – CerVIII, 115 –CrusI, 118 –CrusII, 120 – CerVI.
The online version of this article includes the following source data for figure 6:
Source data 1. Complete Davi130 labels hemispheric asymmetry.
Vickery et al. eLife 2020;9:e60136. DOI: https://doi.org/10.7554/eLife.60136 7 of 20
Research article Neuroscience
disease (Kong et al., 2020; van den Heuvel et al., 2020). The Davi130 parcellation of the chimpan-
zee brain serves two main purposes. First, regions in Juna.Chimp template space enable increased
interpretability and reproducibility of morphometric analyses and comparability between studies,
even retrospectively. Second, our manual subdivision reduces the statistical problem of multiple test-
ing for mass univariate approaches like VBM to uncover subtle brain - behavior relationships. Fur-
thermore, our macroscopic parcellation mitigates the curse of dimensionality for multivariate
machine learning methods to be applied to the relatively small samples like the NCBR.
We found clear evidence of global and local GM decline in the aging chimpanzee brain even
though previous research into age-related changes in chimpanzee brain organization has shown little
to no effect (Herndon et al., 1999; Sherwood et al., 2011; Chen et al., 2013; Autrey et al., 2014).
(Herndon et al., 1999; Sherwood et al., 2011; Chen et al., 2013; Autrey et al., 2014). This can be
attributed on the one hand to the larger number of MRI scans available via the NCBR including 30%
of older subjects with 55 individuals over 30 and 12 over 45 years of age, which is crucial for model-
ling the effect of aging (Chen et al., 2013; Autrey et al., 2014). On the other hand, state-of-the-art
image processing enabled the creation of the species-specific Juna.Chimp templates, which largely
improves tissue segmentation and registration accuracy (Ashburner and Friston, 2000). Non-linear
registration was also improved by the large heterogeneous sample utilized for the creation of the
templates encompassing a representative amount of inter-individual variation. We used the well-
established structural brain imaging toolbox CAT12 to build a reusable chimpanzee preprocessing
pipeline catered towards analyzing local tissue-specific anatomical variations as measured with T1w
MRI. The Davi130-based region-wise and the voxel-wise morphometry analysis consistently showed
localized GM decline in lateral frontal cortex, lOFC, precentral gyrus, cingulate gyrus, PCun, medial
parietal and occipital cortex, the basal ganglia, and superior cerebellum. The VBM approach addi-
tionally produced evidence for age effects in bilateral mOFC, PoCG, inferior temporal regions, infe-
rior and superior lateral parietal cortex, sOG, and throughout the cerebellum. These additional
effects can be expected, as VBM is more sensitive to GM changes due to aging (Kennedy et al.,
2009). The multiple brain regions revealing GM decline reported here in both approaches have also
been shown to exhibit GM atrophy during healthy aging in humans (Good et al., 2001b;
Kennedy et al., 2009; Crivello et al., 2014; Minkova et al., 2017). Additionally, there was no signif-
icant difference in the age-related decline between humans and chimpanzee (Figure 3), even though
a larger negative correlation with less variance was found in the matched human sample, which dem-
onstrates a commonality in the healthy aging process of chimpanzees that was thought to be specific
to humans. In general, GM atrophy in chimpanzees occurs across the entire cortex, sub-cortical
regions, and cerebellum, however, certain local areas decline at a relative extended rate within the
frontal, temporal, and parietal lobes (Fjell et al., 2014). Several Davi130 regions within the frontal
lobe (SFG, MFG, IFG, and lOFC) have been previously reported in corresponding human loci in rela-
tion to GM volume decline due to aging (Kennedy et al., 2009; Crivello et al., 2014; Fjell et al.,
2014; Minkova et al., 2017). Furthermore, aging effects in temporal (STG) and parietal (PoCG,
AnG, PCun) regions in chimpanzees have additionally been revealed in analogous human areas
(Good et al., 2001b; Kennedy et al., 2009; Crivello et al., 2014; Fjell et al., 2014; Minkova et al.,
2017). The same is true for the superior occipital gyrus and caudate nucleus (Crivello et al., 2014).
Similar age-related total GM decline along with presentation in homologous brain areas suggests
common underlying neurophysiological processes in humans and chimpanzees due to shared pri-
mate evolution.
Very recently, it has been shown that stress hormone levels increase with age in chimpanzees, a
process previously thought to only occur in humans, which can cause GM volume decline
(Emery Thompson et al., 2020). This further strengthens the argument that age-related GM decline
is also shared by humans closest relative, the chimpanzee. Furthermore, Edler et al., 2017 found
Alzheimer’s disease-like accumulation of amyloid beta plaques and neurofibrillary tangles located
predominantly in prefrontal and temporal cortices in a sample of elderly chimpanzees between 37
and 62 years of age. As the aggregation of these proteins is associated with localized neuronal loss
and cortical atrophy in humans (La Joie et al., 2012; Llado et al., 2018), the age-related decline in
GM volume shown here is well in line with the findings by Jagust, 2016 associating GM atrophy
with amyloid beta. These findings provide a biological mechanism for accelerated GM decrease in
prefrontal, limbic, and temporal cortices found in chimpanzees. In contrast, elderly rhesus monkeys
show GM volume decline without the presence of neurofibrillary tangles (Alexander et al., 2008;
Vickery et al. eLife 2020;9:e60136. DOI: https://doi.org/10.7554/eLife.60136 8 of 20
Research article Neuroscience
Shamy et al., 2011). Taken together, regionally specific GM atrophy seems to be a common aspect
of the primate brain aging pattern observed in macaque monkeys, chimpanzees, and humans. To
make a case for the existence of Alzheimer’s disease in chimpanzees, validated cognitive tests for
Alzheimer’s-like cognitive decline in non-human primates are needed, to test for direct associations
between cognitive decline with tau pathology and brain atrophy.
To further analyze the possible moderator effects on aging, we considered the historical composi-
tion of the NCBR sample, with respect to the rearing environment. The majority of elderly chimpan-
zees over 40 years old (23/26) were born in the wild and captured at a young age, whereas only very
few chimpanzees under 40 were wild born (5/168). The capture, separation from their mothers, and
subsequent transport to the research centers can be considered a traumatic event with possible last-
ing effects on brain development and morphology (Bremner, 2006). In captivity, different chimpan-
zee-rearing experiences, either by their mother or in a nursery, has been shown to affect brain
morphology (Bogart et al., 2014; Bard and Hopkins, 2018). The same should be expected in com-
parison of captive and wild-born chimpanzees. The disproportionate distribution of rearing and early
life experiences likely influences our cross-sectional analyses of the effect of aging on GM volume.
However, we have some reason to be confident that the aging effect shown here is not solely driven
by these factors as rearing environment was added as a covariate to all age regression models and
the VBM age regression model with and without rearing as a covariate are almost identical (Figure 5
and Figure 5—figure supplement 1 respectively). Moreover, the GM decline we found is extensive,
widespread, and also present in chimpanzees under 30 years of age (p<0.0001), where 99% are cap-
tive born (143/144).
Hemispheric asymmetry was found in 68% (44/65) of all regions of the Davi130 parcellation,
reproducing several regional findings reported in previous studies using diverse image processing
methods as well as uncovering numerous novel population-level asymmetries. Previous studies utiliz-
ing a region-wise approach based on hand-drawn or atlas derived regions to analyze asymmetry in
cortical thickness also reported leftward asymmetry of the insula (Hopkins et al., 2017) and right-
ward lateralization of cortical thickness of the PCC (Hopkins et al., 2017) as well as STG, MTG, and
SMG (Hopkins and Avants, 2013). Previous VBM findings also revealed leftward asymmetry in the
anterior SFG (Hopkins et al., 2008) along with rightward lateralization of the MFG, PrCG, PoCG,
mOG, and CrusII (Hopkins et al., 2008; Hopkins and Avants, 2013). In the current study, new
regions of larger GM volume in the left hemisphere were found in frontal (pMFG, mSFG, pSFG),
temporal (aTTG), and parietal (PCun) cortices as well as in the basal ganglia (BF,GP, Pu). Novel right-
ward asymmetries could also be seen in the frontal (IFG, mOFC, FrOP), limbic (CC, Amy), temporal
(pTTG, FFG), parietal (POP, AnG), and occipital (Calc) cortices besides the basal ganglia (Th, CN)
and the cerebellum (CrusI, CerIX, CerVI, CerVIII).
The Davi130s’ region pTTG which contains the planum temporale (PT), presented significant
rightward lateralization, while previous studies of the PT have shown leftward asymmetry in chimpan-
zee GM volume, surface area (Hopkins and Nir, 2010), and cytoarchitecture (Zilles et al., 1996;
Gannon et al., 1998; Spocter et al., 2010). A possible reason for the divergence in this finding is
that the anterior border of PT (Hopkins and Nir, 2010) lies several millimeters posterior from the
anterior posterior split of the Davi130 TTG. Additionally, the left lateral sulcus in the Juna.Chimp
template appears to proceed further posteriorly and superiorly compared to the right, which is con-
sistent with previous findings in asymmetrical length of the POP in chimpanzees (Gilissen and Hop-
kins, 2013) and Sylvian fissure length in old world monkeys (Lyn et al., 2011; Marie et al., 2018).
Population-level asymmetries in the pIFG in chimpanzees were documented almost two decades
ago by Cantalupo and Hopkins, 2001, who reported a leftward asymmetry in pIFG volume in a
small sample of great apes. In subsequent studies, this result could not be replicated when consider-
ing GM volume (Hopkins et al., 2008; Keller et al., 2009) or cytoarchitecture (Schenker et al.,
2010). We also failed to find a leftward asymmetry in GM volume for the pIFG, in contrary to asym-
metries found in humans (Amunts et al., 1999; Uylings et al., 2006; Keller et al., 2009).
A substantial amount of regions presenting significant inter-hemispheric differences of local mor-
phology in chimpanzees has also been shown in humans (Good et al., 2001a; Plessen et al., 2014;
Kong et al., 2018). Specifically, leftward lateralization has been found in human analogous regions
of the SFG and insula utilizing GM thickness and volume in voxel-wise and atlas derived region-wise
approaches (Good et al., 2001a; Takao et al., 2011; Plessen et al., 2014; Kong et al., 2018).
Rightward asymmetry in the Davi130 regions IFG, STG, MTG, AnG, mOG, Calc, in addition to the
Vickery et al. eLife 2020;9:e60136. DOI: https://doi.org/10.7554/eLife.60136 9 of 20
Research article Neuroscience
thalamus and lateral cerebellum is documented in the human brain also using both VBM and surface
measures (Good et al., 2001a; Takao et al., 2011; Plessen et al., 2014; Kong et al., 2018). Gross
hemispheric asymmetry in humans follows a general structure of frontal rightward and occipital left-
ward asymmetry known as the ‘Yakovlevian torque’ (Toga and Thompson, 2003). This general orga-
nizational pattern of asymmetry was not apparent in the chimpanzee (Li et al., 2018).
The NCBR offers the largest and richest openly available dataset of chimpanzee brain MRI scans
acquired over a decade with 1.5T and 3T MRI at two locations, capturing valuable inter-individual
variation in one large heterogeneous sample. To account for the scanner effect on GM estimation,
field strength was modeled as a covariate of no interest for analyzing the age effect on GM volume.
The focus of this study was the analysis of GM volume, even though the CAT12 image processing
pipeline enables surface projection and analysis. Consequently, the next step will be the application
of CAT12 to analyze cortical surface area, curvature, gyrification, and thickness of the chimpanzee
brain, to include behavioral data and the quantitative comparison to humans and other species, as
cortical surface projection permits a direct inter-species comparison due to cross-species
registration.
ConclusionIn conclusion, we present the new chimpanzee reference template Juna.Chimp, TPM’s, the Davi130
whole-brain parcellation, and the CAT12 preprocessing pipeline which is ready-to-use by the wider
neuroimaging community. Investigations of age-related GM changes in chimpanzees using both
region-wise and voxel-based morphometry showed substantial atrophy with age, which was also
apparent in a matched human sample providing further evidence for human-like physiological aging
processes in the chimpanzee brain. Examining population-based hemispheric asymmetry in chimpan-
zees showed a general rightward lateralization of higher GM volume without the presence of a dis-
tinct pattern like the ‘Yakovlevian torgue’ seen in humans.
Materials and methods
Key resources table
Reagent type(species)or resource Designation
Source orreference Identifiers
Additionalinformation
Software,algorithm
CAT12 http://www.neuro.uni-jena.de/cat/
RRID:SCR_019184
Software,algorithm
NCBR http://www.chimpanzeebrain.org/
RRID:SCR_019183
Software,algorithm
MATLAB http://www.mathworks.com/products/matlab/
RRID:SCR_001622
Software,algorithm
SPM http://www.fil.ion.ucl.ac.uk/spm/
RRID:SCR_007037
Software,algorithm
RStudio http://www.rstudio.com/
RRID:SCR_000432
Software,algorithm
3D Slicer http://slicer.org/ RRID:SCR_005619
Subject information and image collection procedureThis study analyzed structural T1w MRI scans of 223 chimpanzees (137 females; 9–54 y/o, mean age
26.9 ± 10.2 years, Figure 3—figure supplement 1) from the NCBR (http://www.chimpanzeebrain.
org/). The chimpanzees were housed at two locations including, the National Center for Chimpanzee
Care of The University of Texas MD Anderson Cancer Center (UTMDACC) and the Yerkes National
Primate Research Center (YNPRC) of Emory University. The standard MR imaging procedures for
chimpanzees at the YNPRC and UTMDACC are designed to minimize stress for the subjects. For an
Vickery et al. eLife 2020;9:e60136. DOI: https://doi.org/10.7554/eLife.60136 10 of 20
Research article Neuroscience
in-depth explanation of the imaging procedure please refer to Autrey et al., 2014. Seventy-six
chimpanzees were scanned with a Siemens Trio 3 Tesla scanner (Siemens Medical Solutions USA,
Inc, Malvern, Pennsylvania, USA). Most T1w images were collected using a three-dimensional gradi-
ent echo sequence with 0.6 � 0.6 � 0.6 resolution (pulse repetition = 2300 ms, echo time = 4.4 ms,
number of signals averaged = 3). The remaining 147 chimpanzees were scanned using a 1.5T GE
echo-speed Horizon LX MR scanner (GE Medical Systems, Milwaukee, WI), predominantly applying
gradient echo sequence with 0.7 � 0.7 � 1.2 resolution (pulse repetition = 19.0 ms, echo time = 8.5
ms, number of signals averaged = 8).
DICOM conversion and de-noisingThe structural T1w images were provided by the NCBR in their original DICOM format and con-
verted into Nifti using MRIcron (Rorden and Brett, 2000). If multiple scans were available, the aver-
age was computed. Following DICOM conversion, each image was cleaned of noise (Manjon et al.,
2010) and signal inhomogeneity and resliced to 0.6 mm isotropic resolution. Finally, the anterior
commissure was manually set as the center (0,0,0) of all Nifti’s to aid in affine preprocessing.
CAT12 preprocessing segmentationStructural image segmentation in CAT12 builds on the TPM-based approach employed by SPM12,
whereby, the gray/white image intensity is aided with a priori tissue probabilities in initial segmenta-
tion and affine registration as it is in common template space. Another advantage of a TPM is that
one has a template for initial affine registration, which then enables the segment maps to be non-lin-
early registered and spatially normalized to corresponding segment maps of the chimpanzee shoot-
ing templates. Lowering the possibility for registration errors improves the quality of the final
normalized image. Improving upon SPM’s segmentation (Ashburner and Friston, 2005), CAT12
employs Local Adaptive Segmentation (LAS) (Dahnke et al., 2012), Adaptive Maximum A Posterior
segmentation(AMAP) (Dahnke and Gaser, 2017; Gaser et al., 2020), and Partial Volume Estimation
(PVE) (Tohka et al., 2004). LAS creates local intensity transformations for all tissue types to limit GM
misclassification due to varying GM intensity in regions such as the occipital, basal ganglia, and
motor cortex because of anatomical properties (e.g. high myelination and iron content). AMAP seg-
mentation takes the initially segmented, aligned, and skull stripped image created utilizing the TPM
and disregards the a priori information of the TPM, to conduct an adaptive AMAP estimation where
local variations are modeled by slowly varying spatial functions (Rajapakse et al., 1997). Along with
the classical three tissue types for segmentation (GM, WM, and CSF) based on the AMAP estima-
tion, an additional two PVE classes (GM-WM and GM-CSF) are created resulting in an estimate of
the fraction of each tissue type contained in each voxel. These features outlined above of our pipe-
line allow for more accurate tissue segmentation and therefore a better representation of macroana-
tomical GM levels for analysis.
Creation of chimpanzee templatesAn iterative process as by Franke et al., 2017 was employed to create the Juna.Chimp template,
with T1 average, Shooting registration template (Ashburner and Friston, 2011), as well as the TPM
(Figure 7). Initially, a first-generation template was produced using the ‘greater_ape’ template deliv-
ered by CAT (Franke et al., 2017; Gaser et al., 2020) that utilizes data provided in Rilling and Insel,
1999. The final segmentation takes the bias-corrected, intensity-normalized, and skull-stripped
image together with the initial SPM-segmentation to conduct an AMAP estimation
(Rajapakse et al., 1997) with a partial volume model for sub-voxel accuracy (Tohka et al., 2004).
The affine normalized tissue segments of GM, white matter (WM), and cerebrospinal fluid (CSF)
were used to create a new Shooting template that consists of four major non-linear normalization
steps allowing to normalize new scans. To create a chimpanzee-specific TPM, we average the differ-
ent Shooting template steps to benefit from the high spatial resolution of the final Shooting steps
but also include the general affine aspects to avoid over-optimization. Besides the brain tissues the
TPM also included two head tissues (bones and muscles) and a background class for standard
SPM12 (Ashburner and Friston, 2005) and CAT12 preprocessing. An internal CAT atlas was written
for each subject and mapped to the new chimpanzee template using the information from the
Shooting registration. The CAT atlas maps were averaged by a median filter and finally manually
Vickery et al. eLife 2020;9:e60136. DOI: https://doi.org/10.7554/eLife.60136 11 of 20
Research article Neuroscience
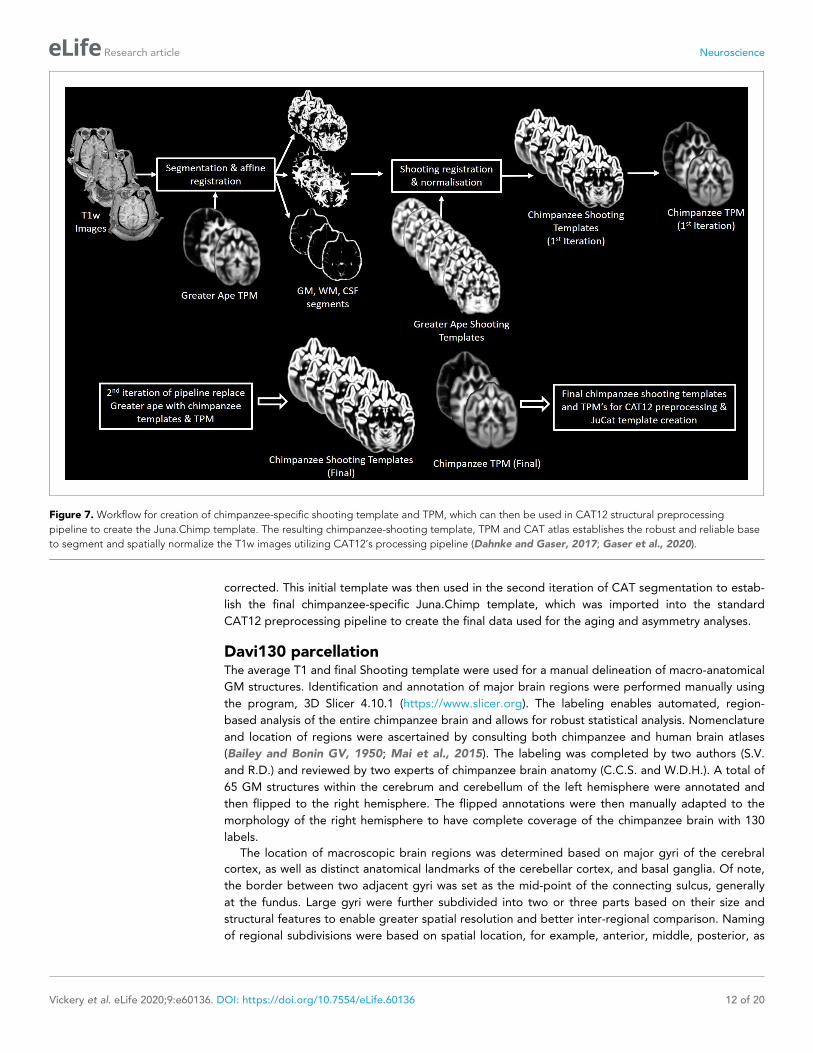
corrected. This initial template was then used in the second iteration of CAT segmentation to estab-
lish the final chimpanzee-specific Juna.Chimp template, which was imported into the standard
CAT12 preprocessing pipeline to create the final data used for the aging and asymmetry analyses.
Davi130 parcellationThe average T1 and final Shooting template were used for a manual delineation of macro-anatomical
GM structures. Identification and annotation of major brain regions were performed manually using
the program, 3D Slicer 4.10.1 (https://www.slicer.org). The labeling enables automated, region-
based analysis of the entire chimpanzee brain and allows for robust statistical analysis. Nomenclature
and location of regions were ascertained by consulting both chimpanzee and human brain atlases
(Bailey and Bonin GV, 1950; Mai et al., 2015). The labeling was completed by two authors (S.V.
and R.D.) and reviewed by two experts of chimpanzee brain anatomy (C.C.S. and W.D.H.). A total of
65 GM structures within the cerebrum and cerebellum of the left hemisphere were annotated and
then flipped to the right hemisphere. The flipped annotations were then manually adapted to the
morphology of the right hemisphere to have complete coverage of the chimpanzee brain with 130
labels.
The location of macroscopic brain regions was determined based on major gyri of the cerebral
cortex, as well as distinct anatomical landmarks of the cerebellar cortex, and basal ganglia. Of note,
the border between two adjacent gyri was set as the mid-point of the connecting sulcus, generally
at the fundus. Large gyri were further subdivided into two or three parts based on their size and
structural features to enable greater spatial resolution and better inter-regional comparison. Naming
of regional subdivisions were based on spatial location, for example, anterior, middle, posterior, as
Figure 7. Workflow for creation of chimpanzee-specific shooting template and TPM, which can then be used in CAT12 structural preprocessing
pipeline to create the Juna.Chimp template. The resulting chimpanzee-shooting template, TPM and CAT atlas establishes the robust and reliable base
to segment and spatially normalize the T1w images utilizing CAT12’s processing pipeline (Dahnke and Gaser, 2017; Gaser et al., 2020).
Vickery et al. eLife 2020;9:e60136. DOI: https://doi.org/10.7554/eLife.60136 12 of 20
Research article Neuroscience
these splits are based on macroanatomical features and do not necessarily correspond to functional
parcellations.
Considering the limitations of macroscopic features present in T1w, we utilized distinct morpho-
logical representations to split large gyri, such as gyral/sulcal folds and continuation of sulci. If a dis-
tinguishable feature could not be determined, rough distance and regional size was employed as
border defining criteria. The splits of the lateral temporal lobe, including the TTG, followed a contin-
uation of the inferior portion of the postcentral sulcus that angles slightly posteriorly to better
account for the increase in length of the gyri as it proceeds inferiorly. The central sulcus as well as
the adjacent pre- and postcentral gyri contain a knob or U-shaped bend proceeding posteriorly. The
superior beginning and inferior end of this bend were employed for the two splits of these gyri.
Additionally, the central sulcus is the border between the frontal and parietal lobes, therefore, the
FOP – POP split occurs at the termination of the central sulcus at the lateral fissure. Within the fron-
tal cortex, the anterior posterior split of the MFG is at the meeting point of the middle frontal sulcus
and the superior precentral sulcus, which translates to the inferior bend of the MFG. The tip of the
fronto-orbito sulcus was used as an anchor point for the split of the pIFG and mIFG. The middle
anterior split of the IFG was then determined by distance, whereby the remaining gyrus was sepa-
rated into equally sized parts. The cingulate cortex anterior, middle, and posterior subdivisions were
delineated by splits following the anterior and posterior bends of the gyrus around the corpus cal-
losum. The cerebellum was divided into its major lobes which are quite similar across primates
(Apps and Hawkes, 2009). Finally, splits within the OFC, SFG, and insula were based on equal size
and/or distance.
Quality controlCAT12 provides quality measures pertaining to noise, bias inhomogeneities, resolution and an over-
all compounded score of the original input image. Using these ratings, poor images were flagged
for visual inspection when they were two standard deviations (std) away from the sample mean of
each rating. The preprocessed modulated GM maps were then tested for sample inhomogeneity
separately for each scanner (3T and 1.5T) and those that have a mean correlation below two std
were flagged for visual inspection. Once the original image was flagged, affine GM, and modulated
GM maps were inspected for poor quality, tissue misclassification, artefacts, irregular deformations,
and very high intensities. For the second and third iteration, the passed modulated GM maps were
tested again for mean correlation as a complete sample, flagging the images below two std for
visual inspection, looking for the same features as in the initial QC iteration. Following the three iter-
ations of QC a total of 194 of 223 chimpanzee MRI’s (130 females, 9–54 y/o, mean = 26.2 ± 9.9)
qualified for statistical analysis.
Age-related changes in total gray matterA linear regression model was used to determine the effect of aging on total GM volume. Firstly,
total GM volume for each subject was converted into a percentage of total intracranial volume (TIV)
to account for the variation in head size. This was then entered into a linear regression model as the
dependent variable with age, sex, scanner field strength, and rearing as the independents. Sex-spe-
cific models were conducted with males and females separately using age as the only dependent
variable. The slope of each regression line was determined using R2 and a p-value of p�0.05 was
used to determine the significant effect of age and sex on total GM volume. The IXI brain develop-
ment dataset (http://brain-development.org/ixi-dataset/) was utilized to compare the age effect on
total GM volume between chimpanzees and humans, as it includes subjects with a wide age range
and T1w images from MRI scanners of both 1.5T and 3T field strength. Prior to matching the IXI
sample to the QC passed chimpanzee sample, all images collected from the Institute of Psychiatry
(IOP) were removed to keep similarity to the chimpanzee sample of a single 1.5T scanner. After
removing subjects without meta data, a total of 496 subjects (Figure 3—figure supplement 2) were
used for matching to the chimpanzee sample regarding age, sex, and scanner field strength. To
enable age matching between species, a factor of 1.5 of chimpanzee age was used to roughly calcu-
late the comparable human age. This factor was chosen based on the comparable life span of the
two species, because a chimpanzee 40+ years is considered elderly and so is a 60+ year old human,
also a 60+ year old chimpanzee is very old and uncommon similarly to a human 90+ years old.
Vickery et al. eLife 2020;9:e60136. DOI: https://doi.org/10.7554/eLife.60136 13 of 20
Research article Neuroscience
Furthermore, the age of sexual maturity in humans is 19.5 years, while in chimps it is 13.5 years
which is also approximately a difference of 1.5 (Robson and Wood, 2008). The sample matching
was conducted using the ‘MatchIt’ (Ho et al., 2007) R package (https://cran.r-project.org/package=
MatchIt) and utilizing the ‘optimal’ (Hansen and Klopfer, 2006) algorithm. The matched human
sample contained 194 subjects (128 females, 20–78 y/o, mean = 39.4 ± 14.0) for statistical analysis.
Age-related changes in gray matter using Davi130 parcellationThe Davi130 parcellation was applied to the modulated GM maps to conduct region-wise morphom-
etry analysis. First, the Davi130 regions were masked with a 0.1 GM mask to remove all non-GM por-
tions of the regions. Subsequently, the average GM intensity of each region for all QC-passed
chimpanzees was calculated. A multiple regression model was conducted for the labels from both
hemispheres, whereby, the dependent variable was GM volume and the predictor variables were
age, sex, TIV, scanner strength, and rearing. Significant age-related GM decline was established for
a Davi130 label with a p�0.05, after correcting for multiple comparisons using FWE (Holm, 1979).
Voxel-based morphometryVBM analysis was conducted using CAT12 to determine the effect of aging on local GM volume. The
modulated and spatially normalized GM segments from each subject were spatially smoothed with a
4 mm FWHM (full width half maximum) kernel prior to analyses. To restrict the overall volume of
interest, an implicit 0.4 GM mask was employed. As MRI field strength is known to influence image
quality, and consequently, tissue classification, we included scanner strength in our VBM model as a
covariate. The dependent variable in the model was age, with covariates of TIV, sex, scanner
strength, and rearing. The VBM model was corrected for multiple comparisons using TFCE with
5000 permutations (Smith and Nichols, 2009). Significant clusters were determined at p�0.05, after
correcting for multiple comparisons using FWE.
Hemispheric asymmetryAs for the age regression analysis, all Davi130 parcels were masked with a 0.1 GM mask to remove
non-GM portions within regions. Cortical hemispheric asymmetry of Davi130 labels was determined
using the formula Asym = (L - R) / (L + R) * 0.5 (Kurth et al., 2015; Hopkins et al., 2017), whereby L
and R represent the average GM volume for each region in the left and right hemisphere, respec-
tively. Therefore, the bi-hemispheric Davi130 regions were converted into single Asym labels
(n = 65) with positive Asym values indicating a leftward asymmetry, and negative values, a rightward
bias. One-sample t-tests were conducted for each region under the null hypothesis of Asym = 0, and
significant leftward or rightward asymmetry was determined with a p�0.05, after correcting for mul-
tiple comparisons using FWE (Holm, 1979).
Exemplar pipeline workflowTo illustrate the structural processing pipeline, we have created exemplar MATLAB SPM batch
scripts that utilizes the Juna.Chimp templates in CAT12’s preprocessing workflow to conduct seg-
mentation, spatial registration, and finally some basic age analysis on an openly available direct-to-
download chimpanzee sample (http://www.chimpanzeebrain.org/). These scripts require the appro-
priate templates which can be downloaded from the Juna.Chimp web viewer (SPM/CAT_templates.
zip) and then place the templates_animals/folder into the latest version CAT12 Toolbox directory
(CAT12.7 r1609). The processing parameters are similar to those conducted in this study, although
different DICOM conversions and denoising were conducted. Further information regarding each
parameter can be viewed when opening the script in the SPM batch as well as the provided com-
ments and README file. The code for the workflow in addition to the code used to conduct the
aging effect and asymmetry analyses can be found here (https://github.com/viko18/
JunaChimp; Vickery, 2020; copy archived at swh:1:rev:
411f0610269416d4ee04eaf9670a9dc84e829ea0).
Vickery et al. eLife 2020;9:e60136. DOI: https://doi.org/10.7554/eLife.60136 14 of 20
Research article Neuroscience
AcknowledgementsWe thank Jona Fischer for the creation of the interactive Juna.Chimp web viewer adapted from
nehuba (github).
Additional information
Funding
Funder Grant reference number Author
Helmholtz Association Helmholtz Portfolio Theme’Supercomputing andModelling for the HumanBrain
Sam VickerySimon B EickhoffFelix Hoffstaedter
Horizon 2020 945539 (HBP SGA 3) Sam VickerySimon B EickhoffFelix Hoffstaedter
Helmholtz Association Initiative and NetworkingFund
Svenja Caspers
Horizon 2020 785907 (HBP SGA 2) Svenja Caspers
National Institutes of Health NS-42867 William D Hopkins
National Institutes of Health NS092988 Chet C Sherwood
James S. McDonnell Founda-tion
220020293 Chet C Sherwood
Inspire Foundation SMA-1542848 Chet C Sherwood
National Institutes of Health U42-OD011197 Steven J Schapiro
Deutsche Forschungsge-meinschaft
417649423 Robert Dahnke
National Institutes of Health NS-73134 William D Hopkins
National Institutes of Health NS-92988 William D Hopkins
The funders had no role in study design, data collection and interpretation, or the
decision to submit the work for publication.
Author contributions
Sam Vickery, Conceptualization, Data curation, Software, Formal analysis, Investigation, Visualization,
Methodology, Writing - original draft, Project administration, Writing - review and editing; William D
Hopkins, Conceptualization, Resources, Data curation, Funding acquisition, Validation, Methodol-
ogy, Writing - original draft, Writing - review and editing; Chet C Sherwood, Resources, Data cura-
tion, Funding acquisition, Validation, Methodology, Writing - original draft, Writing - review and
editing; Steven J Schapiro, Resources, Data curation, Funding acquisition, Writing - original draft,
Writing - review and editing; Robert D Latzman, Conceptualization, Data curation, Writing - original
draft, Writing - review and editing; Svenja Caspers, Conceptualization, Supervision, Writing - original
draft, Writing - review and editing; Christian Gaser, Resources, Software, Methodology, Writing -
original draft, Writing - review and editing; Simon B Eickhoff, Conceptualization, Resources, Supervi-
sion, Funding acquisition, Writing - original draft, Project administration, Writing - review and edit-
ing; Robert Dahnke, Conceptualization, Resources, Data curation, Software, Supervision, Validation,
Investigation, Methodology, Writing - original draft, Project administration, Writing - review and
editing; Felix Hoffstaedter, Conceptualization, Software, Supervision, Validation, Methodology, Writ-
ing - original draft, Project administration, Writing - review and editing
Author ORCIDs
Sam Vickery https://orcid.org/0000-0001-6732-7014
Chet C Sherwood http://orcid.org/0000-0001-6711-449X
Robert D Latzman http://orcid.org/0000-0002-1175-8090
Vickery et al. eLife 2020;9:e60136. DOI: https://doi.org/10.7554/eLife.60136 15 of 20
Research article Neuroscience
Simon B Eickhoff http://orcid.org/0000-0001-6363-2759
Felix Hoffstaedter https://orcid.org/0000-0001-7163-3110
Ethics
Animal experimentation: the chimpanzee imaging data were acquired under protocols approved by
the Yerkes National Primate Research Center (YNPRC) at Emory University Institutional Animal Care
and Use Committee (Approval number YER2001206).
Decision letter and Author response
Decision letter https://doi.org/10.7554/eLife.60136.sa1
Author response https://doi.org/10.7554/eLife.60136.sa2
Additional filesSupplementary files. Transparent reporting form
Data availability
The T1-weighted MRI’s are available at the National Chimpanzee Brain Resource website as well as
the direct-to-download dataset we used for our example workflow. The code used in the manuscript
can be found at this GitHub repo https://github.com/viko18/JunaChimp (copy archived at https://
archive.softwareheritage.org/swh:1:rev:411f0610269416d4ee04eaf9670a9dc84e829ea0/).
ReferencesAlexander GE, Chen K, Aschenbrenner M, Merkley TL, Santerre-Lemmon LE, Shamy JL, Skaggs WE, BuonocoreMH, Rapp PR, Barnes CA. 2008. Age-related regional network of magnetic resonance imaging gray matter inthe rhesus macaque. Journal of Neuroscience 28:2710–2718. DOI: https://doi.org/10.1523/JNEUROSCI.1852-07.2008, PMID: 18337400
Alexander-Bloch A, Giedd JN, Bullmore E. 2013. Imaging structural co-variance between human brain regions.Nature Reviews Neuroscience 14:322–336. DOI: https://doi.org/10.1038/nrn3465, PMID: 23531697
Amunts K, Schleicher A, Burgel U, Mohlberg H, Uylings HB, Zilles K. 1999. Broca’s region revisited:cytoarchitecture and intersubject variability. The Journal of Comparative Neurology 412:319–341. DOI: https://doi.org/10.1002/(SICI)1096-9861(19990920)412:2<319::AID-CNE10>3.0.CO;2-7, PMID: 10441759
Amunts K, Zilles K. 2015. Architectonic mapping of the human brain beyond brodmann. Neuron 88:1086–1107.DOI: https://doi.org/10.1016/j.neuron.2015.12.001, PMID: 26687219
Anderson JR, Gallup GG. 2015. Mirror self-recognition: a review and critique of attempts to promote andengineer self-recognition in primates. Primates 56:317–326. DOI: https://doi.org/10.1007/s10329-015-0488-9,PMID: 26341947
Apps R, Hawkes R. 2009. Cerebellar cortical organization: a one-map hypothesis. Nature Reviews Neuroscience10:670–681. DOI: https://doi.org/10.1038/nrn2698, PMID: 19693030
Ashburner J, Friston KJ. 2000. Voxel-based morphometry–the methods. NeuroImage 11:805–821. DOI: https://doi.org/10.1006/nimg.2000.0582, PMID: 10860804
Ashburner J, Friston KJ. 2005. Unified segmentation. NeuroImage 26:839–851. DOI: https://doi.org/10.1016/j.neuroimage.2005.02.018, PMID: 15955494
Ashburner J, Friston KJ. 2011. Diffeomorphic registration using geodesic shooting and Gauss-Newtonoptimisation. NeuroImage 55:954–967. DOI: https://doi.org/10.1016/j.neuroimage.2010.12.049, PMID: 21216294
Autrey MM, Reamer LA, Mareno MC, Sherwood CC, Herndon JG, Preuss T, Schapiro SJ, Hopkins WD. 2014.Age-related effects in the neocortical organization of chimpanzees: gray and white matter volume, corticalthickness, and gyrification. NeuroImage 101:59–67. DOI: https://doi.org/10.1016/j.neuroimage.2014.06.053,PMID: 24983715
Bailey P, Bonin GV MW. 1950. The Isocortex of the Chimpanzee. Urbana: Univ of Illinois Press.Bard KA, Hopkins WD. 2018. Early socioemotional intervention mediates Long-Term effects of atypical rearingon structural covariation in gray matter in adult chimpanzees. Psychological Science 29:594–603. DOI: https://doi.org/10.1177/0956797617740685, PMID: 29381427
Bogart SL, Mangin J-F, Schapiro SJ, Reamer L, Bennett AJ, Pierre PJ, Hopkins WD. 2012. Cortical sulciasymmetries in chimpanzees and macaques: a new look at an old Idea. NeuroImage 61:533–541. DOI: https://doi.org/10.1016/j.neuroimage.2012.03.082
Vickery et al. eLife 2020;9:e60136. DOI: https://doi.org/10.7554/eLife.60136 16 of 20
Research article Neuroscience
Bogart SL, Bennett AJ, Schapiro SJ, Reamer LA, Hopkins WD. 2014. Different early rearing experiences havelong-term effects on cortical organization in captive chimpanzees (Pan Troglodytes). Developmental Science17:161–174. DOI: https://doi.org/10.1111/desc.12106, PMID: 24206013
Bremner JD. 2006. Traumatic stress: effects on the brain. Dialogues in Clinical Neuroscience 8:445–461.DOI: https://doi.org/10.31887/DCNS.2006.8.4/jbremner, PMID: 17290802
Cantalupo C, Hopkins WD. 2001. Asymmetric broca’s area in great apes: A region of the ape brain is uncannilysimilar to one linked with speech in humans. Nature 414:505. DOI: https://doi.org/10.1038/35107134
Chen X, Errangi B, Li L, Glasser MF, Westlye LT, Fjell AM, Walhovd KB, Hu X, Herndon JG, Preuss TM, Rilling JK.2013. Brain aging in humans, chimpanzees (Pan Troglodytes), and rhesus macaques (Macaca mulatta): magneticresonance imaging studies of macro- and microstructural changes. Neurobiology of Aging 34:2248–2260.DOI: https://doi.org/10.1016/j.neurobiolaging.2013.03.028, PMID: 23623601
Crivello F, Tzourio-Mazoyer N, Tzourio C, Mazoyer B. 2014. Longitudinal assessment of global and regional rateof grey matter atrophy in 1,172 healthy older adults: modulation by sex and age. PLOS ONE 9:e114478.DOI: https://doi.org/10.1371/journal.pone.0114478, PMID: 25469789
Dahl CD, Adachi I. 2013. Conceptual metaphorical mapping in chimpanzees (Pan Troglodytes). eLife 2:e00932.DOI: https://doi.org/10.7554/eLife.00932
Dahnke R, Ziegler G, Gaser C. 2012. Local adaptive segmentation. Hum Brain Mapp Conference.Dahnke R, Gaser C. 2017. Voxel-based preprocessing in CAT. Organ Hum Brain Mapp 2:70887. DOI: https://doi.org/10.13140/RG.2.2.11653.70887
de WFBM, Frans BM. 1996. Good natured: the origins of right and wrong in humans and other animals. HarvardUniversity Press.
Desikan RS, Segonne F, Fischl B, Quinn BT, Dickerson BC, Blacker D, Buckner RL, Dale AM, Maguire RP, HymanBT, Albert MS, Killiany RJ. 2006. An automated labeling system for subdividing the human cerebral cortex onMRI scans into gyral based regions of interest. NeuroImage 31:968–980. DOI: https://doi.org/10.1016/j.neuroimage.2006.01.021, PMID: 16530430
Edler MK, Sherwood CC, Meindl RS, Hopkins WD, Ely JJ, Erwin JM, Mufson EJ, Hof PR, Raghanti MA. 2017.Aged chimpanzees exhibit pathologic hallmarks of Alzheimer’s disease. Neurobiology of Aging 59:107–120.DOI: https://doi.org/10.1016/j.neurobiolaging.2017.07.006
Eickhoff SB, Thirion B, Varoquaux G, Bzdok D. 2015. Connectivity-based parcellation: critique and implications.Human Brain Mapping 36:4771–4792. DOI: https://doi.org/10.1002/hbm.22933, PMID: 26409749
Emery Thompson M, Fox SA, Berghanel A, Sabbi KH, Phillips-Garcia S, Enigk DK, Otali E, Machanda ZP,Wrangham RW, Muller MN. 2020. Wild chimpanzees exhibit humanlike aging of glucocorticoid regulation.PNAS 117:8424–8430. DOI: https://doi.org/10.1073/pnas.1920593117, PMID: 32229565
Fjell AM, McEvoy L, Holland D, Dale AM, Walhovd KB, Alzheimer’s Disease Neuroimaging Initiative. 2014. Whatis normal in normal aging? effects of aging, amyloid and Alzheimer’s disease on the cerebral cortex and thehippocampus. Progress in Neurobiology 117:20–40. DOI: https://doi.org/10.1016/j.pneurobio.2014.02.004,PMID: 24548606
Franke K, Clarke GD, Dahnke R, Gaser C, Kuo AH, Li C, Schwab M, Nathanielsz PW. 2017. Premature brainaging in baboons resulting from moderate fetal undernutrition. Frontiers in Aging Neuroscience 9:92.DOI: https://doi.org/10.3389/fnagi.2017.00092, PMID: 28443017
Freeman HD, Cantalupo C, Hopkins WD. 2004. Asymmetries in the Hippocampus and amygdala of chimpanzees(Pan Troglodytes). Behavioral Neuroscience 118:1460–1465. DOI: https://doi.org/10.1037/0735-7044.118.6.1460, PMID: 15598157
Gannon PJ, Holloway RL, Broadfield DC, Braun AR. 1998. Asymmetry of chimpanzee planum temporale:humanlike pattern of Wernicke’s brain language area homolog. Science 279:220–222. DOI: https://doi.org/10.1126/science.279.5348.220, PMID: 9422693
Gaser C, Dahnke R, Kurth K, Luders E, Alzheimer’s Disease Neuroimaging Initiative. 2020. A computationalanatomy toolbox for the analysis of structural MRI data. NeuroImage 2:9282. DOI: https://doi.org/10.13140/RG.2.2.19452.49282
Gilissen EP, Hopkins WD. 2013. Asymmetries of the parietal operculum in chimpanzees (Pan Troglodytes) inrelation to handedness for tool use. Cerebral Cortex 23:411–422. DOI: https://doi.org/10.1093/cercor/bhs029,PMID: 22368087
Gomez-Robles A, Hopkins WD, Sherwood CC. 2013. Increased morphological asymmetry, evolvability andplasticity in human brain evolution. Proceedings of the Royal Society B: Biological Sciences 280:20130575.DOI: https://doi.org/10.1098/rspb.2013.0575
Good CD, Johnsrude I, Ashburner J, Henson RN, Friston KJ, Frackowiak RS. 2001a. Cerebral asymmetry and theeffects of sex and handedness on brain structure: a voxel-based morphometric analysis of 465 normal adulthuman brains. NeuroImage 14:685–700. DOI: https://doi.org/10.1006/nimg.2001.0857, PMID: 11506541
Good CD, Johnsrude IS, Ashburner J, Henson RN, Friston KJ, Frackowiak RS. 2001b. A voxel-basedmorphometric study of ageing in 465 normal adult human brains. NeuroImage 14:21–36. DOI: https://doi.org/10.1006/nimg.2001.0786, PMID: 11525331
Hansen BB, Klopfer SO. 2006. Optimal full matching and related designs via network flows. Journal ofComputational and Graphical Statistics 15:609–627. DOI: https://doi.org/10.1198/106186006X137047
Hecht EE, Mahovetz LM, Preuss TM, Hopkins WD. 2017. A neuroanatomical predictor of mirror self-recognitionin chimpanzees. Social Cognitive and Affective Neuroscience 12:37–48. DOI: https://doi.org/10.1093/scan/nsw159, PMID: 27803287
Vickery et al. eLife 2020;9:e60136. DOI: https://doi.org/10.7554/eLife.60136 17 of 20
Research article Neuroscience
Herndon JG, Tigges J, Anderson DC, Klumpp SA, McClure HM. 1999. Brain weight throughout the life span ofthe chimpanzee. The Journal of Comparative Neurology 409:567–572. DOI: https://doi.org/10.1002/(SICI)1096-9861(19990712)409:4<567::AID-CNE4>3.0.CO;2-J, PMID: 10376740
Ho DE, Imai K, King G, Stuart EA. 2007. Matching as nonparametric preprocessing for reducing modeldependence in parametric causal inference. Political Analysis 15:199–236. DOI: https://doi.org/10.1093/pan/mpl013
Holm S. 1979. A simple sequentially rejective multiple test procedure. Scand J Stat 6:65–70. DOI: https://doi.org/10.2307/4615733
Hopkins WD, Taglialatela JP, Meguerditchian A, Nir T, Schenker NM, Sherwood CC. 2008. Gray matterasymmetries in chimpanzees as revealed by voxel-based morphometry. NeuroImage 42:491–497. DOI: https://doi.org/10.1016/j.neuroimage.2008.05.014, PMID: 18586523
Hopkins WD, Meguerditchian A, Coulon O, Bogart S, Mangin JF, Sherwood CC, Grabowski MW, Bennett AJ,Pierre PJ, Fears S, Woods R, Hof PR, Vauclair J. 2014. Evolution of the central sulcus morphology in primates.Brain, Behavior and Evolution 84:19–30. DOI: https://doi.org/10.1159/000362431, PMID: 25139259
Hopkins WD, Misiura M, Pope SM, Latash EM. 2015. Behavioral and brain asymmetries in primates: a preliminaryevaluation of two evolutionary hypotheses. Annals of the New York Academy of Sciences 1359:65–83.DOI: https://doi.org/10.1111/nyas.12936, PMID: 26426409
Hopkins WD, Li X, Crow T, Roberts N. 2017. Vertex- and atlas-based comparisons in measures of corticalthickness, gyrification and white matter volume between humans and chimpanzees. Brain Structure andFunction 222:229–245. DOI: https://doi.org/10.1007/s00429-016-1213-1, PMID: 27100220
Hopkins WD, Avants BB. 2013. Regional and hemispheric variation in cortical thickness in chimpanzees (PanTroglodytes). Journal of Neuroscience 33:5241–5248. DOI: https://doi.org/10.1523/JNEUROSCI.2996-12.2013,PMID: 23516289
Hopkins WD, Nir TM. 2010. Planum temporale surface area and grey matter asymmetries in chimpanzees (PanTroglodytes): the effect of handedness and comparison with findings in humans. Behavioural Brain Research208:436–443. DOI: https://doi.org/10.1016/j.bbr.2009.12.012, PMID: 20035802
Jagust W. 2016. Is amyloid-b harmful to the brain? insights from human imaging studies. Brain 139:23–30.DOI: https://doi.org/10.1093/brain/awv326, PMID: 26614753
Jagust W. 2018. Imaging the evolution and pathophysiology of alzheimer disease. Nature Reviews Neuroscience19:687–700. DOI: https://doi.org/10.1038/s41583-018-0067-3, PMID: 30266970
Keller SS, Roberts N, Hopkins W. 2009. A comparative magnetic resonance imaging study of the anatomy,variability, and asymmetry of broca’s area in the human and chimpanzee brain. Journal of Neuroscience 29:14607–14616. DOI: https://doi.org/10.1523/JNEUROSCI.2892-09.2009, PMID: 19923293
Kennedy KM, Erickson KI, Rodrigue KM, Voss MW, Colcombe SJ, Kramer AF, Acker JD, Raz N. 2009. Age-related differences in regional brain volumes: A comparison of optimized voxel-based morphometry to manualvolumetry. Neurobiology of Aging 30:1657–1676. DOI: https://doi.org/10.1016/j.neurobiolaging.2007.12.020
Kong XZ, Mathias SR, Guadalupe T, Glahn DC, Franke B, Crivello F, Tzourio-Mazoyer N, Fisher SE, ThompsonPM, Francks C, ENIGMA Laterality Working Group. 2018. Mapping cortical brain asymmetry in 17,141 healthyindividuals worldwide via the ENIGMA consortium. PNAS 115:E5154–E5163. DOI: https://doi.org/10.1073/pnas.1718418115, PMID: 29764998
Kong X-Z, Postema MC, Guadalupe T, Kovel C, Boedhoe PSW, Hoogman M, Mathias SR, Rooij D, Schijven D,Glahn DC, Medland SE, Jahanshad N, Thomopoulos SI, Turner JA, Buitelaar J, Erp TGM, Franke B, Fisher SE,Heuvel OA, Schmaal L, et al. 2020. Mapping brain asymmetry in health and disease through the ENIGMAconsortium. Human Brain Mapping 8:25033. DOI: https://doi.org/10.1002/hbm.25033
Kurth F, Gaser C, Luders E. 2015. A 12-step user guide for analyzing voxel-wise gray matter asymmetries instatistical parametric mapping (SPM). Nature Protocols 10:293–304. DOI: https://doi.org/10.1038/nprot.2015.014
La Joie R, Perrotin A, Barre L, Hommet C, Mezenge F, Ibazizene M, Camus V, Abbas A, Landeau B, Guilloteau D,de La Sayette V, Eustache F, Desgranges B, Chetelat G. 2012. Region-specific hierarchy between atrophy,hypometabolism, and b-amyloid (Ab) load in Alzheimer’s disease dementia. Journal of Neuroscience 32:16265–16273. DOI: https://doi.org/10.1523/JNEUROSCI.2170-12.2012, PMID: 23152610
Langergraber KE, Prufer K, Rowney C, Boesch C, Crockford C, Fawcett K, Inoue E, Inoue-Muruyama M, MitaniJC, Muller MN, Robbins MM, Schubert G, Stoinski TS, Viola B, Watts D, Wittig RM, Wrangham RW,Zuberbuhler K, Paabo S, Vigilant L. 2012. Generation times in wild chimpanzees and gorillas suggest earlierdivergence times in great ape and human evolution. PNAS 109:15716–15721. DOI: https://doi.org/10.1073/pnas.1211740109, PMID: 22891323
Li X, Crow TJ, Hopkins WD, Gong Q, Roberts N. 2018. Human torque is not present in chimpanzee brain.NeuroImage 165:285–293. DOI: https://doi.org/10.1016/j.neuroimage.2017.10.017
Llado A, Tort-Merino A, Sanchez-Valle R, Falgas N, Balasa M, Bosch B, Castellvı M, Olives J, Antonell A,Hornberger M. 2018. The hippocampal longitudinal axis-relevance for underlying tau and TDP-43 pathology.Neurobiology of Aging 70:1–9. DOI: https://doi.org/10.1016/j.neurobiolaging.2018.05.035, PMID: 29935415
Lyn H, Pierre P, Bennett AJ, Fears S, Woods R, Hopkins WD. 2011. Planum temporale grey matter asymmetriesin chimpanzees (Pan Troglodytes), vervet (Chlorocebus aethiops Sabaeus), rhesus (Macaca mulatta) and bonnet(Macaca radiata) monkeys. Neuropsychologia 49:2004–2012. DOI: https://doi.org/10.1016/j.neuropsychologia.2011.03.030, PMID: 21447349
Mai JK, Majtanik M, Paxinos G. 2015. Atlas of the Human Brain. Elsevier.
Vickery et al. eLife 2020;9:e60136. DOI: https://doi.org/10.7554/eLife.60136 18 of 20
Research article Neuroscience
Manjon JV, Coupe P, Martı-Bonmatı L, Collins DL, Robles M. 2010. Adaptive non-local means denoising of MRimages with spatially varying noise levels. Journal of Magnetic Resonance Imaging 31:192–203. DOI: https://doi.org/10.1002/jmri.22003, PMID: 20027588
Marie D, Roth M, Lacoste R, Nazarian B, Bertello A, Anton JL, Hopkins WD, Margiotoudi K, Love SA,Meguerditchian A. 2018. Left brain asymmetry of the planum temporale in a nonhominid primate: redefiningthe origin of brain specialization for language. Cerebral Cortex 28:1808–1815. DOI: https://doi.org/10.1093/cercor/bhx096, PMID: 28431000
Mazziotta J, Toga A, Evans A, Fox P, Lancaster J, Zilles K, Woods R, Paus T, Simpson G, Pike B, Holmes C,Collins L, Thompson P, MacDonald D, Iacoboni M, Schormann T, Amunts K, Palomero-Gallagher N, Geyer S,Parsons L, et al. 2001. A probabilistic atlas and reference system for the human brain: international consortiumfor brain mapping (ICBM). Philosophical Transactions of the Royal Society of London. Series B: BiologicalSciences 356:1293–1322. DOI: https://doi.org/10.1098/rstb.2001.0915
Minkova L, Habich A, Peter J, Kaller CP, Eickhoff SB, Kloppel S. 2017. Gray matter asymmetries in aging andneurodegeneration: a review and meta-analysis. Human Brain Mapping 38:5890–5904. DOI: https://doi.org/10.1002/hbm.23772, PMID: 28856766
Plessen KJ, Hugdahl K, Bansal R, Hao X, Peterson BS. 2014. Sex, age, and cognitive correlates of asymmetries inthickness of the cortical mantle across the life span. Journal of Neuroscience 34:6294–6302. DOI: https://doi.org/10.1523/JNEUROSCI.3692-13.2014, PMID: 24790200
Rajapakse JC, Giedd JN, Rapoport JL. 1997. Statistical approach to segmentation of single-channel cerebral MRimages. IEEE Transactions on Medical Imaging 16:176–186. DOI: https://doi.org/10.1109/42.563663, PMID:9101327
Rilling JK, Insel TR. 1999. The primate neocortex in comparative perspective using magnetic resonance imaging.Journal of Human Evolution 37:191–223. DOI: https://doi.org/10.1006/jhev.1999.0313
Robson SL, Wood B. 2008. Hominin life history: reconstruction and evolution. Journal of Anatomy 212:394–425.DOI: https://doi.org/10.1111/j.1469-7580.2008.00867.x
Rorden C, Brett M. 2000. Stereotaxic display of brain lesions. Behavioural Neurology 12:191–200. DOI: https://doi.org/10.1155/2000/421719, PMID: 11568431
Savage-Rumbaugh ES. 1986. Ape Language: From Conditioned Response to Symbol. Oxford University Press.Savage-Rumbaugh ES, Lewin R. 1994. Kanzi: The Ape at the Brink of the Human Mind. Wiley.Schenker NM, Hopkins WD, Spocter MA, Garrison AR, Stimpson CD, Erwin JM, Hof PR, Sherwood CC. 2010.Broca’s area homologue in chimpanzees (Pan troglodytes): probabilistic mapping, asymmetry, and comparisonto humans. Cerebral Cortex 20:730–742. DOI: https://doi.org/10.1093/cercor/bhp138, PMID: 19620620
Shamy JL, Habeck C, Hof PR, Amaral DG, Fong SG, Buonocore MH, Stern Y, Barnes CA, Rapp PR. 2011.Volumetric correlates of spatiotemporal working and recognition memory impairment in aged rhesus monkeys.Cerebral Cortex 21:1559–1573. DOI: https://doi.org/10.1093/cercor/bhq210, PMID: 21127015
Sherwood CC, Broadfield DC, Holloway RL, Gannon PJ, Hof PR. 2003. Variability of broca’s area homologue inAfrican great apes: Implications for language evolution. Anat Rec - Part a Discov Mol Cell Evol Biol 271:276–285. DOI: https://doi.org/10.1002/ar.a.10046
Sherwood CC, Gordon AD, Allen JS, Phillips KA, Erwin JM, Hof PR, Hopkins WD. 2011. Aging of the cerebralcortex differs between humans and chimpanzees. PNAS 108:13029–13034. DOI: https://doi.org/10.1073/pnas.1016709108, PMID: 21788499
Shumaker RW, Walkup KR, Beck BB. 2011. Animal Tool Behavior: The Use and Manufacture of Tools by Animals.Johns Hopkins University Press.
Smith SM, Nichols TE. 2009. Threshold-free cluster enhancement: addressing problems of smoothing, thresholddependence and localisation in cluster inference. NeuroImage 44:83–98. DOI: https://doi.org/10.1016/j.neuroimage.2008.03.061, PMID: 18501637
Spocter MA, Hopkins WD, Garrison AR, Bauernfeind AL, Stimpson CD, Hof PR, Sherwood CC. 2010. Wernicke’sarea homologue in chimpanzees (Pan troglodytes) and its relation to the appearance of modern humanlanguage . Proceedings of the Royal Society B: Biological Sciences 277:2165–2174. DOI: https://doi.org/10.1098/rspb.2010.0011
Takao H, Abe O, Yamasue H, Aoki S, Sasaki H, Kasai K, Yoshioka N, Ohtomo K. 2011. Gray and white matterasymmetries in healthy individuals aged 21-29 years: a voxel-based morphometry and diffusion tensor imagingstudy. Human Brain Mapping 32:1762–1773. DOI: https://doi.org/10.1002/hbm.21145, PMID: 20886579
Toga AW, Thompson PM. 2003. Mapping brain asymmetry. Nature Reviews Neuroscience 4:37–48. DOI: https://doi.org/10.1038/nrn1009, PMID: 12511860
Tohka J, Zijdenbos A, Evans A. 2004. Fast and robust parameter estimation for statistical partial volume modelsin brain MRI. NeuroImage 23:84–97. DOI: https://doi.org/10.1016/j.neuroimage.2004.05.007, PMID: 15325355
Tomasello M, Call J. 1997. Primate Cognition. Oxford University Press.Uylings HB, Jacobsen AM, Zilles K, Amunts K. 2006. Left-right asymmetry in volume and number of neurons inadult broca’s area. Cortex 42:652–658. DOI: https://doi.org/10.1016/S0010-9452(08)70401-5, PMID: 16881273
van den Heuvel OA, Boedhoe PSW, Bertolin S, Bruin WB, Francks C, Ivanov I, Jahanshad N, Kong XZ, Kwon JS,O’Neill J, Paus T, Patel Y, Piras F, Schmaal L, Soriano-Mas C, Spalletta G, van Wingen GA, Yun JY, Vriend C,Simpson HB, et al. 2020. An overview of the first 5 years of the ENIGMA obsessive–compulsive disorderworking group: The power of worldwide collaboration. Human Brain Mapping 10:24972. DOI: https://doi.org/10.1002/hbm.24972
Vickery S. 2020. JunaChimp. Software Heritage. swh:1:rev:411f0610269416d4ee04eaf9670a9dc84e829ea0. https://archive.softwareheritage.org/swh:1:rev:411f0610269416d4ee04eaf9670a9dc84e829ea0/
Vickery et al. eLife 2020;9:e60136. DOI: https://doi.org/10.7554/eLife.60136 19 of 20
Research article Neuroscience

Waterson RH, Lander ES, Wilson RK, Chimpanzee Sequencing and Analysis Consortium. 2005. Initial sequence ofthe chimpanzee genome and comparison with the human genome. Nature 437:69–87. DOI: https://doi.org/10.1038/nature04072, PMID: 16136131
Zilles K, Armstrong E, Moser KH, Schleicher A, Stephan H. 1989. Gyrification in the cerebral cortex of primates.Brain, Behavior and Evolution 34:143–150. DOI: https://doi.org/10.1159/000116500, PMID: 2512000
Zilles K, Dabringhaus A, Geyer S, Amunts K, Qu M, Schleicher A, Gilissen E, Schlaug G, Steinmetz H. 1996.Structural asymmetries in the human forebrain and the forebrain of Non-human primates and rats.Neuroscience & Biobehavioral Reviews 20p. :593–605. DOI: https://doi.org/10.1016/0149-7634(95)00072-0
Vickery et al. eLife 2020;9:e60136. DOI: https://doi.org/10.7554/eLife.60136 20 of 20
Research article Neuroscience