Embed Size (px)
Citation preview

Developed by ACARA’s Digital Technologies in focus project Australian Government Department of Education and Training CC BY 4.0
INVESTIGATING ENVIRONMENTAL DATA WITH MICRO:BITS
According to the research of Professor Stephen Heppell: ‘A poor physical environment hurts learning.’ Source: www.learnometer.net
To be more specific, poor light levels, the wrong temperatures, inappropriate sound volumes and rhythms, humidity, air pollution, carbon dioxide (CO2) and air pressure can all impair learning. On their own, each of these factors can affect a student’s ability to learn. In combination, current research is expected to show that learning outcomes are even worse.
So, what can you do about it? This knowledge provides a great opportunity for students to participate in some authentic transdisciplinary activities focused on Technologies, Science and Mathematics to measure environmental factors and improve the spaces in which they learn. ‘If we can optimise that environment students learn more effectively and it also encourages them to become reflective learners, which improves their learning further.’ Source: www.learnometer.net
Some of these activities could be done using mobile phone apps and devices such as the Learnometer (Figures 1 and 2). Alternatively, your students could measure some of these things for themselves by creating their own digital solutions (such as micro:bit with MonkMakes sensor board as shown in Figure 3) – a powerful, authentic learning project.
The Learnometer Partners of Stephen Heppell have produced the ‘Learnometer’ – a device which sits happily in your classroom and measures all the physical factors listed earlier. Both versions of the device (Figures 1 and 2) display readouts of the physical environment and can store data in the cloud for later use. For more information about these devices see https://gratnellslearnometer.com
Figure 1: Early model Learnometer
Figure 2: Learnometer
Figure 3: A micro:bit with MonkMakes sensor board
CLASSROOM IDEAS: YEARS 5–6
Developed by ACARA’s Digital Technologies in focus project Australian Government Department of Education and Training CC BY 4.0
TUTORIAL YEARS 5–6 This tutorial shows the coding needed for digital solutions to some of the many environmental issues mentioned in the introduction can be created using pseudocode and visual programming. It can also be created using general-purpose programming.
Before engaging in these activities, students should have a good knowledge of visual programming and understand the function of variables in programming.
The tutorial is organised into parts as follows:
Part A: Measuring light level Part B: Measuring temperature Part C: Measuring sound level Part D: Extension activities (optional).
Context: environmental factors
Challenge: Create a digital device that can measure and display one or more of the following environmental factors in the classroom:
• light levels • temperature • sound levels.
Optional (requires extra sensors) • CO2 levels • air pressure
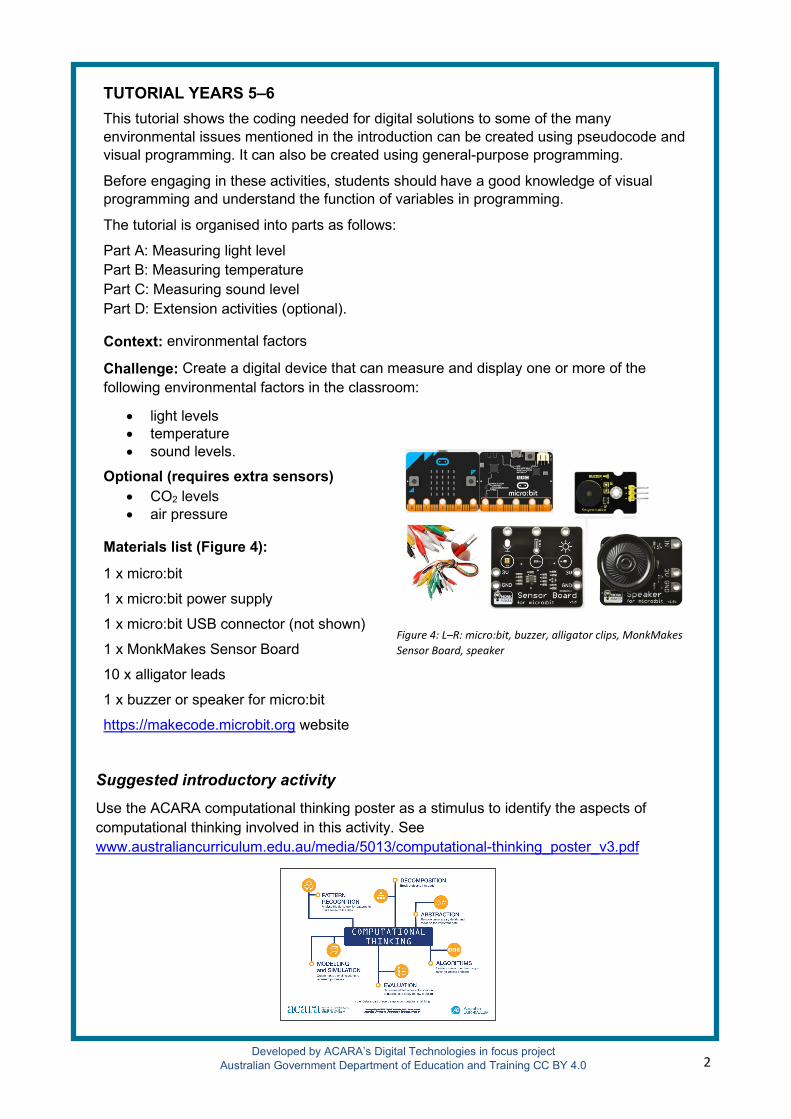
Materials list (Figure 4):
1 x micro:bit
1 x micro:bit power supply
1 x micro:bit USB connector (not shown)
1 x MonkMakes Sensor Board
10 x alligator leads
Figure 4: L–R: micro:bit, buzzer, alligator clips, MonkMakes Sensor Board, speaker
1 x buzzer or speaker for micro:bit
https://makecode.microbit.org website
Suggested introductory activity Use the ACARA computational thinking poster as a stimulus to identify the aspects of computational thinking involved in this activity. See www.australiancurriculum.edu.au/media/5013/computational-thinking_poster_v3.pdf
2

Developed by ACARA’s Digital Technologies in focus project Australian Government Department of Education and Training CC BY 4.0
Part A: Measuring light level
Context: Poor lighting is a significant barrier to learning. Recent research (Barrett et al. 2015) shows that good lighting significantly influences reading, vocabulary and science test scores. Above 500 lux is acceptable but above 1,000 lux is better.
Challenge: Create a light meter with your students. To do this we will first need a micro:bit and a clear idea of what we want it to do.
Algorithm: Expressed as a simple sequence of steps What is the sequence of steps needed to achieve this digital solution?
• Have the micro:bit report on the light level. • Compare that light level to the lux light level indicated by an
app on a smart phone. • Program the micro:bit to convert its reported light level to
something similar to the lux readout of the app; that is, we need to code the micro:bit to reflect the true temperature of the room.
• When the user presses button A the calibrated lux level is shown.
We will use the Microsoft MakeCode website www.makecode.microbit.org to create this in visual programming. The code to get a light level can be as simple as that shown in Figure 5.
However, we want to do a few things with the light level value, so we will:
1. store it in a variable (see glossary on page 17) 2. apply a formula to convert the level to something simple that says if it is too dark or at an
‘OK’ lux level (‘lux’ may need to be explained before you proceed, depending on students’ age/knowledge/ability – see glossary)
3. create a table (such as the one shown in Table 1) with micro:bit reported light levels and lux readings from a phone app placed next to each other. This way these values can be compared easily. For this activity we don’t need to go into too much depth or accuracy.
Table 1: micro:bit and phone app lux values on a scale of healthy light* Micro:bit value Phone app lux value Healthy light?
12 41 Too dark
17 57 Too dark
35 190 Too dark
44 230 Too dark
53 307 Still too dark
56 345 Still too dark
84 429 Still too dark
88 471 Still too dark
102 592 Light level OK (boundary level)
224 2017 Light level OK
255 5000 Light level OK
* Above 500 lux is acceptable but above 1,000 lux is better.
3
Figure 5

Developed by ACARA’s Digital Technologies in focus project Australian Government Department of Education and Training CC BY 4.0
The data in Table 1 have been grouped in this way:
• Dark blue – the lux values are around 3–5 times the micro:bit value (too dark) • Mid blue – the lux values are around 6 times the micro:bit value (still too dark) • Light blue – the boundary level – at around 100 indicates a lux value of about 500 (light
level is OK) • White – the lux values are around10 times or more the micro:bit value (light level is OK).
So, using micro:bit values, 88 is becoming a reasonable light level, 102 is a reasonable light level and 224 is desirable.
Algorithms: Expressed in pseudocode/English How could these steps be expressed in pseudocode?
Get the light level
If the light level is below 100
Then it’s too dark
Else
The light level is acceptable
Coding the micro:bit using visual programming
Students can use the www.makecode.microbit.org website to create the visual program as shown in Figure 6. This can then be tested on screen with the emulator (virtual micro:bit) and finally downloaded to a physical micro:bit for testing.
Adding an external sensor
For this tutorial we are using a MonkMakes Sensor Board. This board has three built-in sensors which we will be using: a thermometer, a light sensor and a sound sensor. We will be combining code using these sensors, and explain why along the way, so that students (and you) get a good understanding of what is going on.
Remember our aim is to create environmental monitors for the classroom to help ensure an optimal learning space. Introducing students to external sensors is a necessary part of this whole exercise.
Figure 6
4

Developed by ACARA’s Digital Technologies in focus project Australian Government Department of Education and Training CC BY 4.0
Connecting the micro:bit and the sensor board
The sensor board must connect to the micro:bit. The diagram at Figure 7 shows how this is done using alligator clips that connect to the gold teeth at the bottom of the micro:bit. When students do this, remind them to ensure that they have not put the alligator clips over any adjacent teeth (the fine vertical lines between the labelled larger pins).
Once connected, the sensor board is powered via the micro:bit (3V and GND) and for this example the light sensor is connected to pin 2. The next step is to code the micro:bit to display what the sensor is reporting.
The initial values can be read using a visual programming as simple as the example in Figure 8, which has been created in MakeCode. This code doesn’t mean much though if the equivalent lux value of the environment isn’t known. We created the following example of how students could do this.
First, we used a lux meter (mobile phone app) to find an area in a room that was about 500 lux. We then put the sensor board in the same spot with the same angle – we found the angle of the sensor can affect readings – so we placed it flat on the desk and made sure our shadow was in the way. We did the same for 1,000 lux. The readings provided boundary values to inform our visual programming.
We used the code shown in Figure 8 (visual programming) and collected the data shown in Table 2. You could also do this in a general-purpose programming language for more advanced students.
Students should collect the same data if they have access to a smart phone and a relevant lux meter/ measurement app.
Note: The red ‘analog read pin …’ block shown in Figure 8 is located in Pins.
Sensor board value Phone app lux value Healthy light? < 17 < 500 Too dark
17 503 Light level OK
23 1067 Light level ideal
Table 2: Indoor sensor board and lux values
Figure 7: A micro:bit (top) and MonkMakes sensor board (bottom)
Figure 8
5

Developed by ACARA’s Digital Technologies in focus project Australian Government Department of Education and Training CC BY 4.0
Algorithms: Expressed in English/pseudocode How could these steps be expressed in pseudocode?
Our algorithmic thinking will be very similar to what we have already used:
Get the value from pin 2
Create a variable called level to store the value from pin 2
If level is below 17
Then show sad face and show level
Else if the level is below 23
Then show happy face and show level
Else
Show heart and show level
Coding the micro:bit using visual programming
The code using www.makecode.microbit.org website to carry out our algorithmic thinking is shown in Figure 9.
Students may ask: “Why does it work when 7 is less than 17 but it is also less than 23?” The answer is that the micro:bit goes through the code line by line. As soon as it finds a comparison that is true (7 is less than 17) it doesn’t bother looking at any other parts of the IF ELSE IF ELSE block.
When students can successfully measure suitable light levels in their classroom and a visual alert warns them if the light is too low, we can move on to measuring another factor that can affect learning: temperature.
For students in Years 5–6 we will just use the in-built micro:bit temperature sensor.
Part B: Measuring temperature
Context: Research by Graff Zivin et al. (2018) suggests that warmer classrooms (above 21 ºC) have a negative effect on learning and this becomes statistically significant above 26 ºC. Another study www.tinyurl.com/y8pzrdod confirms that students who experience more hot days during the year perform worse on subsequent standardised exams.
Challenge: Create a digital thermometer with your students. In this tutorial we will use the in-built micro:bit temperature sensor.
Figure 9
6

Developed by ACARA’s Digital Technologies in focus project Australian Government Department of Education and Training CC BY 4.0
Algorithms: Expressed in English/pseudocode How could these steps be expressed in pseudocode?
Get the temperature level
If the temperature level is below 26 degrees Celsius
Then that’s good
Else
The temperature is too high
Coding the micro:bit using visual programming
Students can use the www.makecode.microbit.org website to create the visual program shown in Figure 10.
We could add another readout to make the device more informative. Underneath the tick and the cross you could add two lines saying to pause for a second and then show the temperature.
This addition to the code is shown in Figure 11.
Possible extension It is easy enough to get the micro:bit to display the temperature, but wouldn’t it be great to have it sound an alarm if the temperature gets too warm or too cold?
The way to do this is outlined in the extended tutorial for Years 5–8 students. See the separate document www.australiancurriculum.edu.au/media/6746/classroom-ideas-5-8-microbit-environmental-measurement.pdf available in the resources section of the DTiF website www.australiancurriculum.edu.au/resources/digital-technologies-in-focus/resources/ if you wish to do this with your students.
7
Figure 11
Figure 10

Developed by ACARA’s Digital Technologies in focus project Australian Government Department of Education and Training CC BY 4.0
Part C: Measuring sound level
Context: Classroom sound signatures can affect how well students achieve (Picard and Bradley 2001). Studies by James et al. (2012) and Anderson (2001) show that ‘children from classrooms with poor acoustics have lower literacy and numeracy skills, are less productive in the workforce, and tend to be in lower paid jobs than those from classrooms with good acoustics’ (in Mealings 2016). Anything above approximately 72 decibels starts to get disruptive. Above 50 makes concentrating difficult.
Challenge: Create a sound monitor with your students.
Preparation: On the MonkMakes sensor board there is a third sensor (in addition to temperature and light), which can detect sound. Unlike temperature and light, the micro:bit does not have an in-built sound sensor. If students want to monitor their classroom for
suitable noise levels, some sort of microphone sensor which works with a micro:bit is needed.
For this tutorial we will use the MonkMakes board because we have it on hand. Your students may find themselves in the situation where 0, 1, 2, 3V and GND pins have all been used on the micro:bit to get the temperature, light and alarm operating, as in the example shown in Figure 12.
There are breakout boards or edge connectors www.tinyurl.com/y9h4vjyf available for the micro:bit which allow you to utilise all 21 pins, including all the little pins in between the larger labelled pins just mentioned.
We won’t use one of those here. Instead, we will just code another micro:bit and connect it up to the sensor board as a stand-alone environmental sensor.
If you have read the research findings at the start of this part, you will be aware that sounds above 72 decibels are regarded as disruptive, although noise over 50 might be annoying if you are trying to concentrate. We are going to use the Sensor Board to provide sound levels for the micro:bit and tell it when the noise level is too high and to sound an alarm to alert the students that the environment is no longer conducive to optimal learning. Here is how we will do that.
Figure 12
Figure 13
8

Developed by ACARA’s Digital Technologies in focus project Australian Government Department of Education and Training CC BY 4.0
Connecting the sound (microphone) sensor
Connect pin 0 to the S pin on the buzzer. Next, connect the sound sensor to pin 1 or pin 2. In Figure 13 we have used pin 1. Finally, we need to connect the power connectors as we had them before.
Experimenting with the sound sensor
The sound sensor is connected to pin 1. It supplies an analog signal between 0 and 3 V. The signal swings above and below a midpoint of about 1.5 V. Let’s code the micro:bit to show this.
We are going to graph the results that the micro:bit receives from the sensor board.
The visual programming code to start on our noise level journey is shown in Figure 14.
You will notice that even when a space is really quiet, about half of the LEDs light up. (On our simulator it looks like the image shown at Figure 15.)
That is because a very quiet environment registers at about 500 (which is about 1.5 volts). It appears as though there is much greater noise when it is actually really quiet.
NB: Noises that are greater than this register at above or below the 1.5 volts. This is due to the way the sensor works. To find out more about sinusoidal waves created by sound pressure (not necessary to know this to do the activity) see www.tinyurl.com/y8e9poa6.
To resolve this issue we can do some mathematics. Since silence starts at around 500, if we take about 500 away then silence will then be represented by about 0 or 1. We are actually going to subtract 511.
You may remember that the analog signals being reported by the sensor board fall between 0 and 1023. If we take 511 from the highest value then that is about half. Have the students try the code shown in Figure 16 to see if they can get the top two lines of the LEDs to light up at all. Of course, they won’t be able to because if we are taking 511 from any reading, then the top reading can only be 512 (511 + 512 = 1023). We have told the graph to plot to 1023, which it won’t get to.
To get the graph to be more accurate, we need to tell it to make 512 the highest value to expect. The finished graph code is shown in Figure 17. Using this code, students should be able to get all the rows of LEDs to light up, even momentarily. This video shows this whole process https://youtu.be/EidbZE5NK8Y (4 min).
Figure 16
Figure 14
Figure 17
9
Figure 15

Developed by ACARA’s Digital Technologies in focus project Australian Government Department of Education and Training CC BY 4.0
The graph shown in Figure 18 shows what happens when sounds are detected. Notice that the readings oscillate above and below the 1.5 V level.
Figure 18. Source: www.monkmakes.com/downloads/instructions_mb_sensor.pdf
Capturing the sound level data
We are going to stray for a few minutes to explore a really powerful feature of MakeCode for micro:bits. When we are watching the LEDs light up, they are being controlled by incoming data from the Sensor Board sound level sensor. There is a lot of data coming in. Wouldn’t it be great if we could capture that data for later use or analysis? Well, we can.
To do this, the micro:bit needs to be paired to the computer that is being used to program it. If you haven’t discovered this yet, it is the easiest way to download code to the micro:bit.
There are two things you will need for PC, both of which are worth the effort:
• the latest Chrome browser (at least version 65) or the latest Microsoft Edge browser (at least version 83 or the beta version)
• firmware version 0249 or above installed on your micro:bits.
When you open the Microsoft micro:bit MakeCode editor and open or start a new program you will see a gear symbol near the top right (Figure 19). When you click the gear icon an option should come up saying ‘Pair device’ (Figure 20).
Figure 19
10

Developed by ACARA’s Digital Technologies in focus project Australian Government Department of Education and Training CC BY 4.0
If you cannot see that option, you will need to upgrade your browser.
If you have a class set of micro:bits it is best to upgrade them all at once. Just download the firmware file and follow the instructions for each micro:bit. After the initial download it takes only 30 seconds per micro:bit to get them all ready.
Of course, getting at least version 65 of Chrome may need negotiation with whomever looks after your computer network.
This video explains the process of upgrading your micro:bits if they cannot seem to pair, and then going through the process of pairing https://youtu.be/r1VgzQV8to0 (5 min).
This is worth doing with your personal or home computer just to see the possibilities, even if your school computers’ software may need to be upgraded for it to work for the students.
Make sure the micro:bit and your computer are connected by a USB cable. When you click on pair device (big green button in pop-up), a window comes up and it should have the name of the micro:bit in it. Click on the name and then click connect.
Now when you want to download some code, just click the purple download button and it automatically goes straight to the micro:bit. Better still, when using the plot bar graph block of code, a new button will appear called Show console Device (Figure 21).
Using Show console Device
Make sure that your micro:bit is paired with your computer. Download the latest code we have written (Figure 17). You will see more LEDs lighting up on the micro:bit as the sound level increases.
If you click on the Show console Device button under the emulator a graph will appear which is showing in real time what the Sensor Board is picking up.
Figure 22 shows an example using the initial code.
Figure 21
Figure 20
11

Developed by ACARA’s Digital Technologies in focus project Australian Government Department of Education and Training CC BY 4.0
Figure 22
Figure 23 shows what it picked up with the latest code.
Figure 23
Notice the almost flatline quiet signal on the top graph (Figure 22) is at around 500 (look where 827 and 17 are) and it is around 0 on the bottom graph (Figure 23).
If we pause the real-time graphing we can then download (Figure 24) the data as a CSV file. We can then analyse that data in a spreadsheet.
Take a look at this video to see an example of what you can do with these data https://youtu.be/avL9GUGZpzg (7 min).
Students could also add a plot bar graph function to the temperature and the light codes as well, and there would be a wealth of data to analyse.
We suggest sampling only once every minute to reduce the amount of data that students have to deal with. Of course, it would depend on what you were collecting the data for.
There is a lot that can be done with this graphing and data capture ability. One idea is micro:bits sending data via their radio functions to a central micro:bit connected to a computer which collects all that data from various parts of the classroom as well as outside, perhaps.
Figure 24
12

Developed by ACARA’s Digital Technologies in focus project Australian Government Department of Education and Training CC BY 4.0
Getting the sound sensor to alert when it is too loud
The last thing we will do with this sensor is to get it to play an alarm and give a visual cue when the sound level gets too loud.
First, we have to load the MonkMakes extension. The process for doing this is described below.
Adding MonkMakes extension blocks in MakeCode
1. Open www.makecode.microbit.org, click on ‘New Project’, then complete the Create a Project box. Next click on Extensions (Figure 25) under Advanced (Figure 26).
2. Search for ‘Monk’ in the search bar (Figure 27) and choose the sensor extension that comes up (Figure 28).
You will then have a new set of blocks called Sensor (Figure 29). The video at the following link explains the process https://youtu.be/sx6OIfdg3sE (1 min).
It is worth advising your students that they will need to get the extension blocks every time they start a new program with the MonkMakes Sensor Board.
Once we add the sensor board blocks to MakeCode we can use the new sound level block to help us collect the sound. It will report a sound level between 0 and 100. We tested this using the code shown in Figure 30.
Approximate levels captured just through observation are shown in Table 3.
Figure 25 Figure 26 Figure 27
Figure 28 Figure 29
13
Figure 30

Developed by ACARA’s Digital Technologies in focus project Australian Government Department of Education and Training CC BY 4.0
Table 3: Sample sound level data Sample Our perception Sensor average level App decibels
A Soft 14 40
B Medium 23 63
C Starting to get loud 34 73
D Quite loud 48 around 78
For classroom ownership, you could lead your class through a discussion of what are conducive sound levels and measure them with a mobile app and the sensor board attached to the micro:bit.
Perhaps get the students to raise their hand when they think the classroom level is great for learning, getting annoying and really annoying. Students could capture readings at these times and use that data to inform their coding.
That is what we will do with the data we captured in Table 3. We will use a sensor average level value of about halfway between soft and medium (so about 17) to be the boundary for conducive levels, and a value between medium and starting to get loud (about 28) to indicate somewhat annoying noise. Anything between 29 and 36 becomes quite annoying noise and above 36 will trigger the alarm for sound that is disruptive to learning levels. These are approximations and your class may come up with a different scale.
Algorithms: Expressed in English/pseudocode How could these steps be expressed in pseudocode?
Get the sound level
If the sound level is below or equal to 17
Then sound level is OK, show the centre LED
Else If
the sound level is below or equal to 28
Then sound level is starting to get annoying, flash a small square
Else If
The sound is below or equal to 36
Sound level is quite annoying, flash the large square unfilled square
Else
Level is too high show all LEDs lit, sound alarm for a second
Just note that now that we have our data we don’t need the ‘plot bar graph’ block to allow the console device to run so it won’t form part of our code.
You could change your code if you want the students to continue to be able to track the sound levels in real time. You may find you also need to change the code to better represent noise levels in your classroom. The examples shown in this tutorial were not taken in a classroom environment.
14

Developed by ACARA’s Digital Technologies in focus project Australian Government Department of Education and Training CC BY 4.0
Coding the micro:bit using visual programming As code, the program appears as shown in Figure 31.
So now we have devices that can measure the temperature, sound and light levels in a classroom and alert the students and teacher when they get to a level that is no longer conducive to effective learning.
Students can take ownership of their environment, based on science, and create a positive atmosphere in which to learn. This is really powerful as it gives the students agency for their own learning.
Part D: Extension activities (optional)
As extension, you may like your students to attempt to measure carbon dioxide or air pressure levels or to create a master monitoring device.
Carbon dioxide levels
Context: Carbon dioxide (CO2) levels play a major part in students’ abilities to learn. With as little as 1,000 parts per million and likely lower still, CO2 induces sleepiness, poor concentration, abnormal heart rates and even nausea, as expressed in an article about a study from the Harvard School of Public Health www.tinyurl.com/yclw6kzu. Similarly, it appears that air pollution has an enormous effect on learning. A study reported on in The Guardian www.tinyurl.com/y92t7yz9 suggests that high levels of urban pollution have a major impact on attainment, with some students dropping a whole year of progress over their school lives.
Challenge: measure CO2 and create an alarm when readings reach a certain level.
Air pressure
Context: Air pressure may play a role in affecting cognitive abilities. This is under research; however, the common complaint of sinus headaches when air pressure changes will obviously affect one’s ability to learn. Think about how your students behave on a windy day.
Challenge: measure air pressure and create an alarm when readings reach a certain level.
Create a master monitoring device
You may want students to make a central computer which is monitoring all the sensors covered in this tutorial.
General-purpose programming languages These activities can also be done in general-purpose programming languages should you wish to extend your students’ learning further. See glossary and useful links.
Figure 31
15

Developed by ACARA’s Digital Technologies in focus project Australian Government Department of Education and Training CC BY 4.0
Links to the Australian Curriculum Table 4 gives teachers an opportunity to see related aspects of the Australian Curriculum.
Table 4: Links from the task to the Australian Curriculum: Digital Technologies Years 5–6
Digital Technologies Achievement standard
By the end of Year 6, students explain the fundamentals of digital system components (hardware, software and networks) and how digital systems are connected to form networks. They explain how digital systems use whole numbers as a basis for representing a variety of data types. Students define problems in terms of data and functional requirements and design solutions by developing algorithms to address the problems. They incorporate decision-making, repetition and user interface design into their designs and implement their digital solutions, including a visual program. They explain how information systems and their solutions meet needs and consider sustainability. Students manage the creation and communication of ideas and information in collaborative digital projects using validated data and agreed protocols.
Strands Digital Technologies knowledge and understanding • Digital systems Digital Technologies processes and production skills • Collecting, managing and analysing data • Creating designed solutions by:
– investigating and defining – generating and designing – producing and implementing – evaluating
Content descriptions
• Examine the main components of common digital systems and how they may connect together to form networks to transmit data (ACTDIK014)
• Acquire, store and validate different types of data, and use a range of software to interpret and visualise data to create information (ACTDIP016)
• Design a user interface for a digital system (ACTDIP018) • Design, modify and follow simple algorithms involving sequences of steps,
branching, and iteration (repetition) (ACTDIP019) • Implement digital solutions as simple visual programs involving branching,
iteration (repetition), and user input (ACTDIP020)
Key concepts • abstraction • data collection • data interpretation • specification • algorithms • implementation • digital systems • interactions • impact
Key ideas Thinking in Technologies • computational thinking • systems thinking
Cross-curriculum priorities
General capabilities
• Information and Communication Technology (ICT) Capability
• Literacy • Numeracy
16

Developed by ACARA’s Digital Technologies in focus project Australian Government Department of Education and Training CC BY 4.0
Useful links
Investigating environmental data with micro:bits extended tutorial for Years 5–8 students www.australiancurriculum.edu.au/media/6746/classroom-ideas-5-8-microbit-environmental-measurement.pdf
Find out more about the micro:bit www.microbit.org
• Code the micro:bit at www.makecode.org – Block code within MakeCode: https://makecode.microbit.org/
Find out more about variables:
• https://makecode.microbit.org/blocks/variables/var • https://makecode.microbit.org/courses/csintro/variables
For teachers or students wishing to explore these activities in a general-purpose programming language including Python and MicroPython, see:
• Code in Python inside MakeCode: https://python.microbit.org/v/1.1 • Python for beginners https://www.python.org/about/gettingstarted/ • Code in MicroPython with Mu editor. Download site: https://codewith.mu/en/download • The extended version of this tutorial for Years 5–8 students
www.australiancurriculum.edu.au/resources/digital-technologies-in-focus/resources/
Glossary
General-purpose programming languages Programming languages in common use designed to solve a wide range of problems. They include procedural, functional and object-oriented programming languages, including scripting and/or dynamically typed languages. Examples of general-purpose programming languages include C#, C++, Java, JavaScript, Python, Ruby and Visual Basic.
Lux A measure of the illumination or amount of light produced by something. For example, we can use a light meter/lux meter to measure the light produced by a light bulb.
Pseudocode A way of showing algorithms without use of any specific programming language. This makes the algorithm easy to understand for everyone whatever programming language they might use. Pseudocode may be written in English text with some common operation words used. For example: if and else.
Variables Created by programmers to hold the value of data that may change. For example, a variable may be created to hold the player’s score in a game.
Visual programming A programming language or environment where a program is represented and manipulated graphically rather than as text. A common visual metaphor represents statements and control structures as graphic blocks that can be composed to form programs, allowing programming without having to deal with textual syntax. Examples of visual programming languages include: Alice, GameMaker, Kodu, Lego Mindstorms, MIT App Inventor, Scratch (Build Your Own Blocks and Snap). See also www.australiancurriculum.edu.au/f-10-curriculum/technologies/glossary/
17

Developed by ACARA’s Digital Technologies in focus project Australian Government Department of Education and Training CC BY 4.0
Bibliography
Allen, J. G., MacNaughton, P., Satish, U., Santanam, S., Vallarino, J. & Spengler, J. D. (2016). Associations of cognitive function scores with carbon dioxide, ventilation, and volatile organic compound exposures in office workers: a controlled exposure study of green and conventional office environments. Environmental health perspectives, 124(6), 805–812. Barrett, P., Davies, F., Zhang, Y. & Barrett, L. (2015). The impact of classroom design on pupils' learning: Final results of a holistic, multi-level analysis. Building and Environment, 89, 118–133. Carrington, D. & Kuo, L. (2018). Air pollution causes ‘huge’ reduction in intelligence, study reveals. The Guardian, Aug 27. Retrieved from https://www.theguardian.com/environment/2018/aug/27/air-pollution-causes-huge-reduction-in-intelligence-study-reveals Graff Zivin, J., Hsiang, S. M. & Neidell, M. (2018). Temperature and human capital in the short and long run. Journal of the Association of Environmental and Resource Economists, 5(1), 77–105. Heppell, S. (n.d.). Learnometer. Retrieved from http://www.learnometer.net/ Mealings, K. (2016). Classroom acoustic conditions: Understanding what is suitable through a review of national and international standards, recommendations, and live classroom measurements. Conference paper, Acoustics 2016 Brisbane. Available at https://www.researchgate.net/publication/310651345_Classroom_acoustic_conditions_Understanding_what_is_suitable_through_a_review_of_national_and_international_standards_recommendations_and_live_classroom_measurements Mooney, C. (2015). Paper finds a surprising link between warmer temperatures and math test scores. The Washington Post. Retrieved from https://www.washingtonpost.com/news/energy-environment/wp/2015/05/12/paper-finds-a-surprising-link-between-warm-temperatures-and-math-test-scores/?postshare=7651431446442153 Park, R. J. (2019). Heat wave: Air conditioned schools would narrow the racial achievement gap. USA Today. Retrieved from https://www.usatoday.com/story/opinion/2019/08/15/heat-wave-students-need-air-conditioning-close-achievement-gap-column/1996394001/ Picard, M. & Bradley, J. S. (2001). Revisiting speech interference in classrooms. Audiology, 40(5), 221–244. Retrieved from https://pubmed.ncbi.nlm.nih.gov/11688542/ Romm, J. (2015). Elevated CO2 Levels Directly Affect Human Cognition. Climate Progress, Oct, 26. Retrieved from https://thinkprogress.org/exclusive-elevated-co2-levels-directly-affect-human-cognition-new-harvard-study-shows-2748e7378941/ Zhang, X., Chen, X. & Zhang, X. (2018). The impact of exposure to air pollution on cognitive performance. Proceedings of the National Academy of Sciences, 115(37), 9193–9197. DOI:10.1073/pnas.1809474115 Disclaimer: ACARA does not endorse any product or make any representations as to the quality of such products. This resource is indicative only. Any product that uses material published on the ACARA website should not be taken to be affiliated with ACARA or have the sponsorship or approval of ACARA. It is up to each person to make their own assessment of the product, taking into account matters including the degree to which the materials align with the content descriptions and achievement standards of the Australian Curriculum. The Creative Commons licence BY 4.0 does not apply to any trademark-protected material.
All images in this resource used with permission
18