Embed Size (px)
Citation preview

CLIL VE VÝUCE MATEMATIKY
Orlová 2012

2
OBSAH OBSAH .............................................................................................................................................................. 2
ÚVOD ................................................................................................................................................................ 4
DEFINITION OF FUNCTION, INTRODUCTION TO FUNCTIONS............................................................ 5
DEFINICE FUNKCE, ÚVOD K FUNKCÍM ................................................................................................... 7
REPRESENTATIONS OF FUNCTION ........................................................................................................... 9
ZPŮSOBY ZADÁNÍ FUNKCE ...................................................................................................................... 11
DOMAIN OF FUNCTION .............................................................................................................................. 13
DEFINIČNÍ OBOR FUNKCE ........................................................................................................................ 15
RANGE OF FUNCTION ................................................................................................................................ 17
OBOR HODNOT FUNKCE............................................................................................................................ 19
WORKSHEET –definition of function, the domain and function range ......................................................... 21
PRACOVNÍ LIST – definice funkce, definiční obor, obor hodnot ................................................................. 23
PROPERTIES OF FUNCTION – monotonicity, one-to-one function ............................................................ 25
VLASTNOSTI FUNKCE – monotónnost, prostá funkce ............................................................................... 27
PROPERTIES OF FUNCTION – boundary, extremes, periodic .................................................................... 29
VLASTNOSTI FUNKCE – omezenost, extrémy, periodičnost ...................................................................... 31
EVEN AND ODD FUNCTIONS .................................................................................................................... 33
PARITA FUNKCE .......................................................................................................................................... 35
WORKSHEET – PROPERTIES OF FUNCTIONS ........................................................................................ 37
PRACOVNÍ LIST – VLASTNOSTI FUNKCÍ ............................................................................................... 39
WORKSHEET – properties of functions from graphs and tables ................................................................... 41
PRACOVNÍ LIST – vlastnosti funkce z grafu a tabulky ................................................................................ 43
LINEAR FUNCTION – word problem ........................................................................................................... 45
LINEÁRNÍ FUNKCE – úvodní slovní úloha .................................................................................................. 47
LINEAR FUNCTION – definition and graph ................................................................................................. 49
LINEÁRNÍ FUNKCE – definice a graf ........................................................................................................... 51
LINEAR FUNCTION – importance of the parameters a, b ............................................................................ 53
LINEÁRNÍ FUNKCE– význam parametrů a, b .............................................................................................. 55
LINEAR FUNCTION– creating formula, properties ...................................................................................... 57
LINEÁRNÍ FUNKCE – sestavení předpisu, vlastnosti ................................................................................... 59
LINEAR FUNCTION – use in solving equations, inequalities and their systems .......................................... 61
LINEÁRNÍ FUNKCE – využití při řešení rovnic, nerovnic a jejich soustav .................................................. 63
QUADRATIC FUNCTION without the linear term - graph ........................................................................... 65
KVADRATICKÁ FUNKCE bez lineárního členu - graf ................................................................................ 67
QUADRATIC FUNCTION – graph of a general quadratic function .............................................................. 69
KVADRATICKÁ FUNKCE – graf obecné kvadratické funkce ..................................................................... 71
COMPLETING THE SQUARE ...................................................................................................................... 73
DOPLNĚNÍ NA ČTVEREC............................................................................................................................ 75

3
QUADRATIC FUNCTION – properties ......................................................................................................... 77
KVADRATICKÁ FUNKCE – vlastnosti, využití ........................................................................................... 79
POWER FUNCTION ...................................................................................................................................... 81
MOCNINNÁ FUNKCE................................................................................................................................... 83
LINEAR FRACTIONAL FUNCTION - worksheet........................................................................................ 85
LINEÁRNÍ LOMENÁ FUNKCE – pracovní list ............................................................................................ 87
EXPONENCIAL FUNCTION – worksheet .................................................................................................... 89
LOGARITHMIC FUNCTION – worksheet .................................................................................................... 91
LOGARITMICKÁ FUNKCE – pracovní list .................................................................................................. 93
TRIGONOMETRIC FUNCTION – SINE, COSINE ...................................................................................... 95
TRIGONOMETRICKÉ FUNKCE – SINUS A KOSINUS ............................................................................ 97
WORKSHEET – graph of SINE AND COSINE ............................................................................................ 99
PRACOVNÍ LIST – GRAF SINU A KOSINU ............................................................................................. 102
ABSOLUTE VALUE .................................................................................................................................... 105
ABSOLUTNÍ HODNOTA ............................................................................................................................ 107
AXIAL SYMMETRY ................................................................................................................................... 109
CENTRAL SYMMETRY ............................................................................................................................. 110
OSOVÁ SOUMĚRNOST .............................................................................................................................. 111
STŘEDOVÁ SOUMĚRNOST ...................................................................................................................... 112
TRANSLATION............................................................................................................................................ 113
POSUNUTÍ .................................................................................................................................................... 115
ORIENTED ANGLE ..................................................................................................................................... 117
ORIENTOVANÝ ÚHEL ............................................................................................................................... 119
POUŽITÁ LITERATURA: ........................................................................................................................... 127

4
ÚVOD
Publikace, která se Vám dostává do rukou, je jedním ze stěžejních výstupů projektu CLIL
DATABASE – tvorba metodických a učebních materiálů pro zavádění výuky vybraných předmětů
metodou CLIL, který probíhal od června 2011 do června 2012 a jehož hlavním posláním byla propagace
metody CLIL v Moravskoslezském kraji.
Tato publikace je souborem pracovních listů z matematiky určených pro žáky středních škol.
Barbora Paulíková

5
DEFINITION OF FUNCTION, INTRODUCTION TO FUNCTIONS
What is function?
In every day life many quantities depend on one or more changing variables. For example the temperature of
boiling water depends on atmospheric pressure, plants growth depends on sunlight and rainfall and also
marks from tests depend on preparation, doing homeworks and etc.
We say that two variables are tied by a functional dependence. Exactly we say this if we can receive each
value of one of the variables by the certain rule with using values of another.
The function is a rule that says how one quantity depends on another quantity/other quantities.
Definition of the function
Function of a single variable on set is a relation in which for each element of set A is given one
element of another set .
The first quantity (variable) is a function of the second quantity (variable) if there is a relationship between
them; every value of the first variable matches with only one value of the second variable .
Examples:
1. The equation for the area of a square is
a (cm) 1 2 3 4 12 50 51 100 0,1
S (cm2) 1 4 9 16 144 2500 2 601 10 000 0,01
This is a function. Each value of the independent variable a gives us one value of the dependent
variable S.
2. “Multiply by 3“ is also a very simple function
x 1 2 3 4 12 50 51 100 0,1
y 3 6 9 12 36 150 153 300 0,3
3. Dependence of the temperature of boiling water on atmospheric pressure:
For each value of atmospheric pressure
we can compute (read from graph) only
one value of the temperature of boiling
water.

6
Dependent and independent variable
A variable, values which are given, is called an argument or an independent variable.
The other variable, values which are found by the certain rule, is called a dependent variable.
Usually an argument is marked as x and a dependent variable is marked as y .
Important characteristic of the function:
A function relates each element of a set with exactly one element of another set.
1. … each element …
This means that every element in set A is related to some element in set B.
2. …exactly one …
This means that the function will not give 2 or more results for the same input.
This relation is a function. This relation is NOT a function.
If relation does not follow one or both of those rules then it is not a function.

7
DEFINICE FUNKCE, ÚVOD K FUNKCÍM
Co je funkce?
V každodenním životě se můžeme setkat s mnoha veličinami, které závisí na jedné nebo více jiných
proměnných veličinách. Například teplota varu vody závisí na atmosférickém tlaku, vzrůst rostliny je
závislý na slunečním světle a srážkách nebo také známky z testu závisí na přípravě, plnění domácích úkolů
atd.
Říkáme, že dvě veličiny jsou funkčně závislé. Toto vyjádření použijeme přesněji v situaci, kdy každou
hodnotu určité proměnné získáme dosazením hodnot jiné proměnné do určitého pravidla/ předpisu.
Funkce je pravidlo, které určuje, jak jedna veličina závisí na jiné/jiných veličinách.
Definice funkce
Funkce jedné proměnné na množině je předpis, který každému číslu z množiny A přiřazuje právě
jedno číslo z množiny .
První veličina (proměnná) je funkcí druhé veličiny (proměnné), jestliže mezi nimi existuje zobrazení, které
každé hodnotě první veličiny přiřadí právě jednu hodnotu druhé veličiny.
Příklady:
1. Vztah pro výpočet obsahu čtverce je:
a (cm) 1 2 3 4 12 50 51 100 0,1
S (cm2) 1 4 9 16 144 2500 2 601 10 000 0,01
Jedná se o funkci. Každé hodnotě nezávislé proměnné a je přiřazena právě jedna hodnota závislé
proměnné S.
2. Dělení číslem 3 je také velmi jednoduchá funkce:
x 1 2 3 4 12 50 51 100 0,1
y 3 6 9 12 36 150 153 300 0,3
3. |Závislost teploty varu vody na atmosférickém tlaku:
Pro každou hodnotu atmosférického tlaku
můžeme vypočítat (vyčíst z grafu) právě
jednu hodnotu teploty varu vody.
8
Závislá a nezávislá proměnná
Proměnná, jejíž hodnoty jsou dány, se nazývá argument nebo nezávisle proměnná.
Druhá proměnná, jejíž hodnoty nalezneme pomocí konkrétního předpisu, se nazývá závislá proměnná.
Argument obvykle značíme x a závislou proměnnou y .
Důležité vlastnosti funkce:
Funkce přiřazuje každému prvku z množiny A právě jeden prvek jiné množiny.
1. … každému …
To znamená, že každému prvku z množiny A je přiřazen nějaký prvek v B.
2. …právě jeden…
To znamená, že funkce nepřiřadí jedné vstupní hodnotě dva nebo více výsledků.
Tato závislost je funkce. Tato závislost NENÍ funkce.
Pokud závislost nesplňuje jednu nebo obě tyto podmínky, pak se nejedná o funkci.
9
REPRESENTATIONS OF FUNCTION As you might have noticed in the previous worksheet, there are 4 ways how we can represent some function:
a) Table
b) Graph
c) Formula
d) Verbal prescription
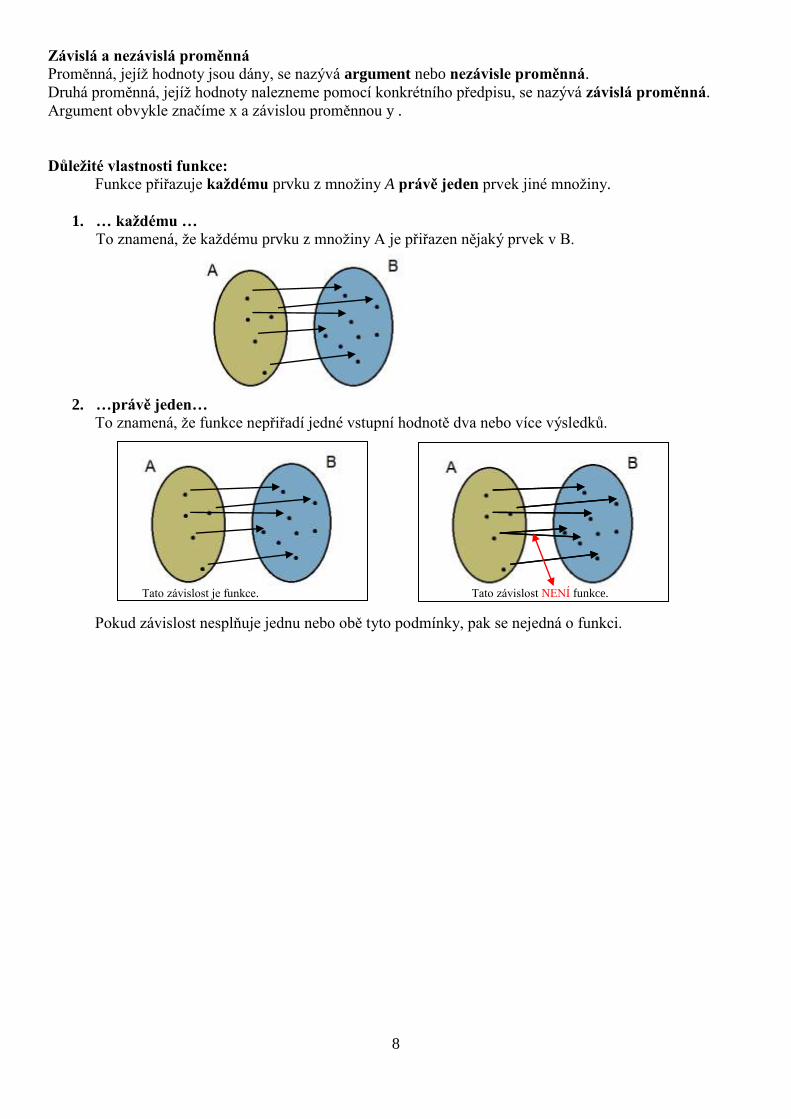
Representation of the function by table
We use representation by table (or graph) if it is impossible to represent a functional dependence by a
formula, or this formula is an uncomfortable for calculations.
This table represents the functional dependence between the athmospheric pressure p and the temperature of
boiling water t.
p (105Pa) 0,4 0,5 0,6 0,7 0,8 0,9 1,0
t (°C) 76,1 81,6 86,1 90,3 93,8 97 100
It is obvious that any table cannot contain all values of argument.
But useful table must contain so many values that they are enough to work or to receive additional values by
interpolating the existing ones.
Representation of the function by formula
Many of the functions can be represented by simple formulas.
Example: We know the equation for the arrea S of a circle from a primary school:
, where r is the radius of the circle. This is an example of the function where each value of the
independent variable r gives us one value of the dependent variable S.
We use x for the independent variable and y for the dependent variable for general cases.
The function formula is the “equation“ using which we calculate just one value of y (dependent value) for
every specific value of x.
Function notation:
We normaly write function as and read this as “function f of x“
We can also use other letters for functions, most often .
Examples:
1.
2. 3. A tree grows 20 cm every year, so the height of the tree is the function of its age (the number of
years is x). Name this function : or another way of writing .
How to work with the function formula?
For example, we want to know the height of the tree for 13 years and 80 years.
We compute that the tree will be for 13 years 2,6 meters high and for 80 years it will be ………..
high.
Number is called the function value or value of the function.
Graphical representation of the functions
The graph of the function is the collection of all ordered pairs in the coordinate system.
To represent the function as a graph it is necessary:

10
1. Write a set of values of the function and its
argument in the table.
2. Transfer the coordinates of the function
points from the table to the coordinate
system.
3. Join marked points by a smooth curve. We
receive a graph of the given functional
dependence.
We meet this way with the empirical functions whose values are obtained by measuring, for example, the
temperature values measured during the day.
Representation of function by the verbal precription
We use the precription for the function for which the formula cannot be found.
Example: The function in which we assign a number of divisors to each natural number.
TO PRACTISE:
1. Evaulate following functions:
a) Given , find:
I.
II.
b) Given
, , find
I.
II.
2. Write the function that expresses the dependence:
a) Area S of a square on its side lenght
b) Lenght of the circle on its diameter.
c) Perimeter of isosceles triangle on the lenght of the ordinate.
d) Car fuel cunsumption (number of litres per 100 kilometres).
75 78 81 84 87 90 93 96 99
102
0,35 0,45 0,55 0,65 0,75 0,85 0,95 1,05
WATER BOILING POINT
p (105Pa)
t (°C)

11
ZPŮSOBY ZADÁNÍ FUNKCE Jak jste si mohli všimnout v předchozím pracovním listu, existují 4 způsoby, kterými můžeme vyjádřit
funkci:
a) Tabulka
b) Graf
c) Funkční předpis
d) Slovní zadání
Určení funkce tabulkou
Zadání funkce pomocí tabulky (grafu) se využívá, pokud není možné zadat funkční závislost předpisem
nebo tento předpis není vhodný pro výpočty.
Tato tabulka představuje závislost mezi atmosférickým tlakem p a teplotou varu vody t.
p (105Pa) 0,4 0,5 0,6 0,7 0,8 0,9 1,0
t (°C) 76,1 81,6 86,1 90,3 93,8 97 100
Je zřejmé, že do tabulky nelze zahrnout všechny hodnoty argumentu funkce.
Užitečná tabulka ale musí obsahovat dostatečné množství takových hodnot, které postačují k práci nebo
které lze doplnit metodou interpolace.
Vyjádření funkce předpisem
Velké množství funkcí lze vyjádřit jednoduchým předpisem.
Příklad: Ze základní školy znáte vzorec pro výpočet obsahu kruhu:
, kde r je poloměr kruhu. Toto je příklad funkce, která každé hodnotě nezávisle proměnné r přiřadí
jednu hodnotu závisle proměnné S.
V obecných případech značíme nezávisle proměnnou x a závisle proměnnou y.
Funkční předpis je„rovnice“, pomocí které pro každou určitou hodnotu x vypočítáme y (závislá proměnná).
Zápis funkce:
Obvykle zapisujeme funkci jako a čteme „funkce f proměnné x“
Pro označení funkce můžeme použít i jiná písmena, nejčastěji .
Příklady:
1.
2. 3. Strom vyroste každý rok o 20 cm. Výška stromu je tedy funkcí jeho stáří (počet let označme x).
Označme tuto funkce : , jiný způsob zápisu .
Jak se pracuje s předpisem funkce?
Například bychom chtěli určit výšku stromu starého 13 a 80 let.
Spočítali jsme, že ve 13 letech bude strom vysoký 2,6 metrů a v 80 bude ……….. vysoký.
Číslo nazýváme funkční hodnota nebo hodnota funkce.
Zadání funkce pomocí grafu
Graf funkce je množina všech uspořádaných dvojic v soustavě souřadnic.
Při zadávání funkce pomocí grafu je potřeba:

12
1. Zapsat hodnoty funkce a argumentu do
tabulky.
2. „Přenést“ souřadnice bodů z tabulky do
soustavy souřadnic.
3. Proložit těmito body hladkou křivku.
Obdržíme graf zadané funkční závislosti.
S funkcí zadanou tímto způsobem se setkáváme u empirických funkcí, jejichž hodnoty byly získány
měřením. Příkladem můře být měření teploty v průběhu dne.
Určení funkce slovním předpisem
Slovní zadání funkce používáme u funkcí, u kterých nelze sestavit předpis.
Př: Funkce, která každému přirozenému číslu přiřazuje počet jeho dělitelů.
K PROCVIČENÍ:
1. Určete hodnoty následujících funkcí:
a) Je dáno: , určete:
I.
II.
b) Je dáno
, , určete
I.
II.
2. Zapište funkce, které vyjadřují závislost:
a) Obsahu čtverce na délce jeho strany.
b) Délky kružnice na poloměru.
c) Obvodu rovnostranného trojúhelníku na délce strany.
d) Spotřeby auta na počtu ujetých kilometrů.
75 78 81 84 87 90 93 96 99
102
0,35 0,45 0,55 0,65 0,75 0,85 0,95 1,05
TEPLOTA VARU VODY
p (105Pa)
t (°C)

13
DOMAIN OF FUNCTION
Repetition: Fill in the gaps
The function of a single variable on set is a relation in which for ……………………….. is given
………………… of another set .
The first variable is a function of the second variable if there is a relationship between them:
…………………………………………………… …………….…………………………………… .
A variable, values which are given, is called an argument or an ………………………………………...
The other variable, values which are found by the certain rule, is called a …………………………….
Usually an argument is marked as …… and a …………………………. is marked as y .
DOMAIN OF A FUNCTION f
The domain is the set of values for which a function is defined.
The domain is the set of all , for which there is such that .
Simply: The domain of a function is the set of all possible x-values which will make the function
“work“ and will output real y-values.
DETERMINING THE DOMAIN
1. Representation of the function by table
f:
The domain is the set of all for which exists The domain is the set of all in the first row of the table.
Be sure to check that the table is a representation of a function!
2. Graphical representation of the function
The domain is the set of all for which exists The domain is usually an interval.
Be sure to check that the graph is a representation of a function!
3. Representation of the function by formula
The domain is the set of all for which the expression on the right side is defined.
Do not forget: The denominator of a fraction cannot be zero.
The values under a square root sign cannot be negative.
Df

14
Practice: Determine domains of functions:
1.
f1: -2 1 5 6 14 16
0 2 6 8 9 10
2.
f1: -2 1 5 6 14 16
0 2 6 8 9 10
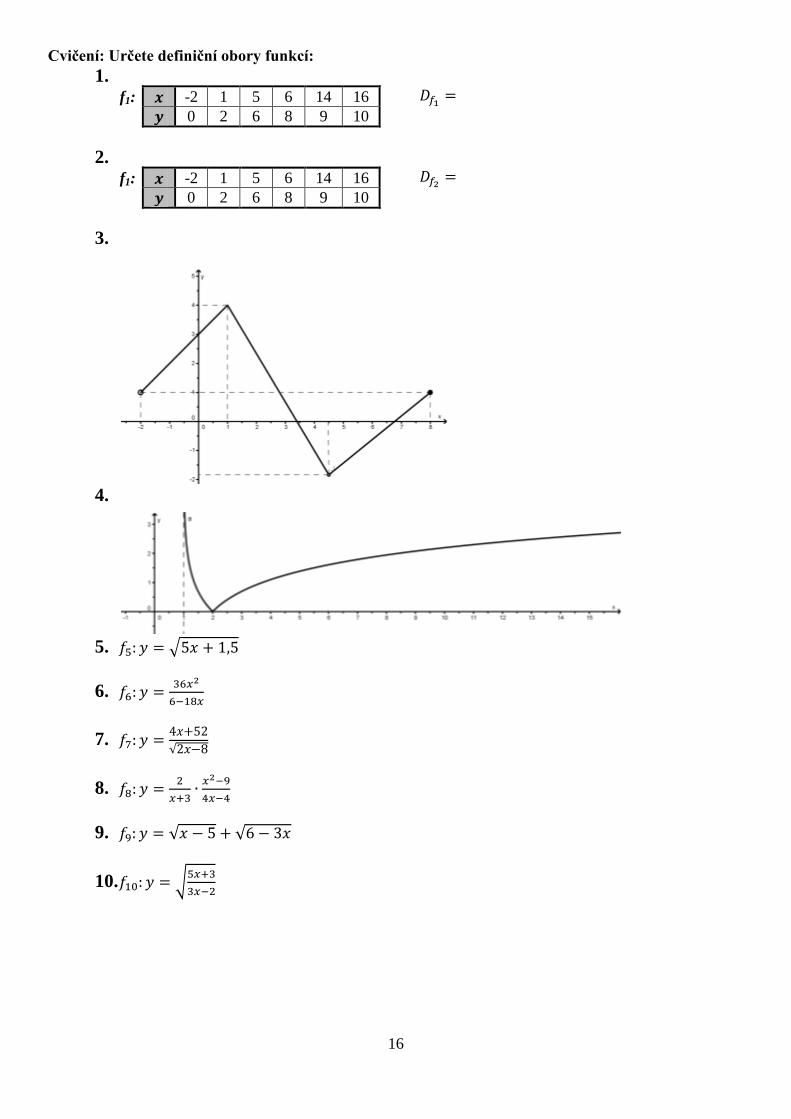
3.
4.
5.
6.
7.
8.
9.
10.

15
DEFINIČNÍ OBOR FUNKCE Opakování: Doplňte
Funkce jedné proměnné na množině je předpis, který ……………………………………přiřazuje
………………………………………….. .
První veličina (proměnná) je funkcí druhé veličiny (proměnné), jestliže mezi nimi existuje zobrazení, které
………………………………………………………………………………………………………..
Proměnná, jejích hodnoty jsou dány, se nazývá argument nebo …………………………………...
Druhá proměnná, jejích hodnoty nalezneme pomocí konkrétního předpisu, se nazývá …………………..
Argument obvykle značíme … a závislou proměnnou …… .
DEFINIČNÍ OBOR FUNKCE f
Definiční obor je množina všech čísel, pro která je funkce definována.
Definiční obor je množina všech , pro které existuje tak, že .
Zjednodušeně: Definiční obor funkce je množina všech možných hodnot, pro které bude funkce
„pracovat“ a bude produkovat reálná čísla y.
URČENÍ PŘEDPISU FUNKCE
1. zadání funkce tabulkou:
f:
Definiční obor je množina všech , pro které existuje Definiční obor je množina všech v prvním řádku tabulky.
Nezapomeňte ověřit, že tabulka je zadáním funkce!
2. Zadání funkce grafem
Definiční obor je množina všech , pro které existuje Definiční obor je obvykle interval.
Nezapomeňte ověřit, že graf je zadáním funkce!
3. Funkce určená předpisem
Definiční obor je množina for pro která je definován výraz na pravé straně rovnice.
Nezapomeňte: Dělitel zlomku nesmí být 0.
Výraz pod druhou odmocninou nesmí být záporný.
Df
16
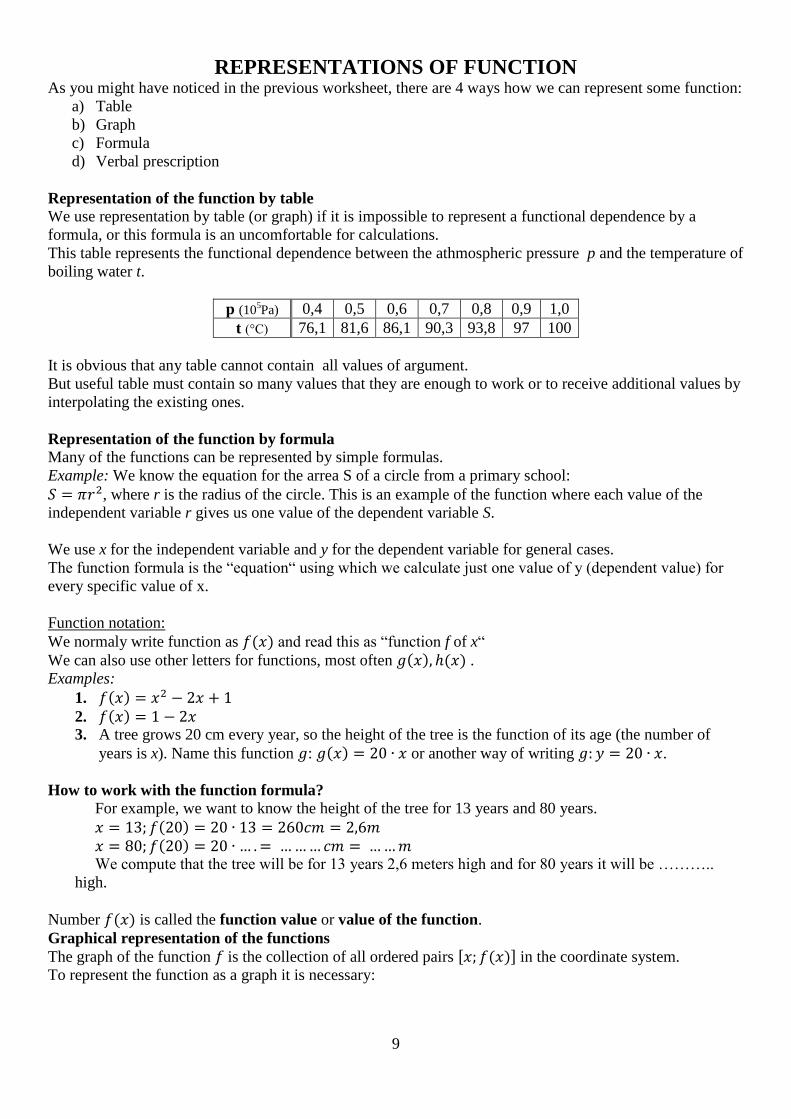
Cvičení: Určete definiční obory funkcí:
1.
f1: -2 1 5 6 14 16
0 2 6 8 9 10
2.
f1: -2 1 5 6 14 16
0 2 6 8 9 10
3.
4.
5.
6.
7.
8.
9.
10.

17
RANGE OF FUNCTION
Repetition: Fill in the gaps
The function of a single variable on set is a relation in which for ……………………….. is given
………………… of another set .
The first variable is a function of the second variable if there is a relationship between them:
…………………………………………………… …………….…………………………………… .
The domain is ……………………………………………………………………………………………….
RANGE OF A FUNCTION f
The range is the set of y-values of a function, it is the set of dependent variables.
The range is the set of all , for which there is such that .
Simply: The range is the set of all possible output values which result from using the function
formula.
DETERMINING THE RANGE
1. Representation of the function by table
f:
The range is the set of all for which exists .
The range is the set of all in the second row of the table.
Be sure to check that the table is a representation of a function!
2. Graphical representation of the function
The range is the set of all for which exists The range is usually an interval.
Be sure to check that the graph is a representation of a function!
Hf

18
3. Representation of the function by formula
In order to determine a function’s range, we need to determine the domain.
Analyze the function to determine any values of y for which there isn´t a real value of x.
Example:
; 0 can’t be a part of the range because
can’t be true.
Determine the range is based on the domain.
Example: . If we assign a real number for x. then . In the
formula there is a substraction of number 4. The range is all real numbers greater than or
equal to -4, .
Practice: Determine ranges of functions:
1.
f1: -2 1 5 6 14 16
0 2 6 8 9 10
2.
f1: -2 1 5 6 14 16
0 2 6 8 9 10
3.
4.
5.
6.
7.
8.
9.
19
OBOR HODNOT FUNKCE
Opakování: Doplňte
Funkce jedné proměnné na množině je předpis, který ……………………………………přiřazuje
………………………………………….. .
První veličina (proměnná) je funkcí druhé veličiny (proměnné), jestliže mezi nimi existuje zobrazení, které
………………………………………………………………………………………………………..
Definiční obor funkce je ……………………………………………………………………………………….
OBOR HODNOT FUNKCE f
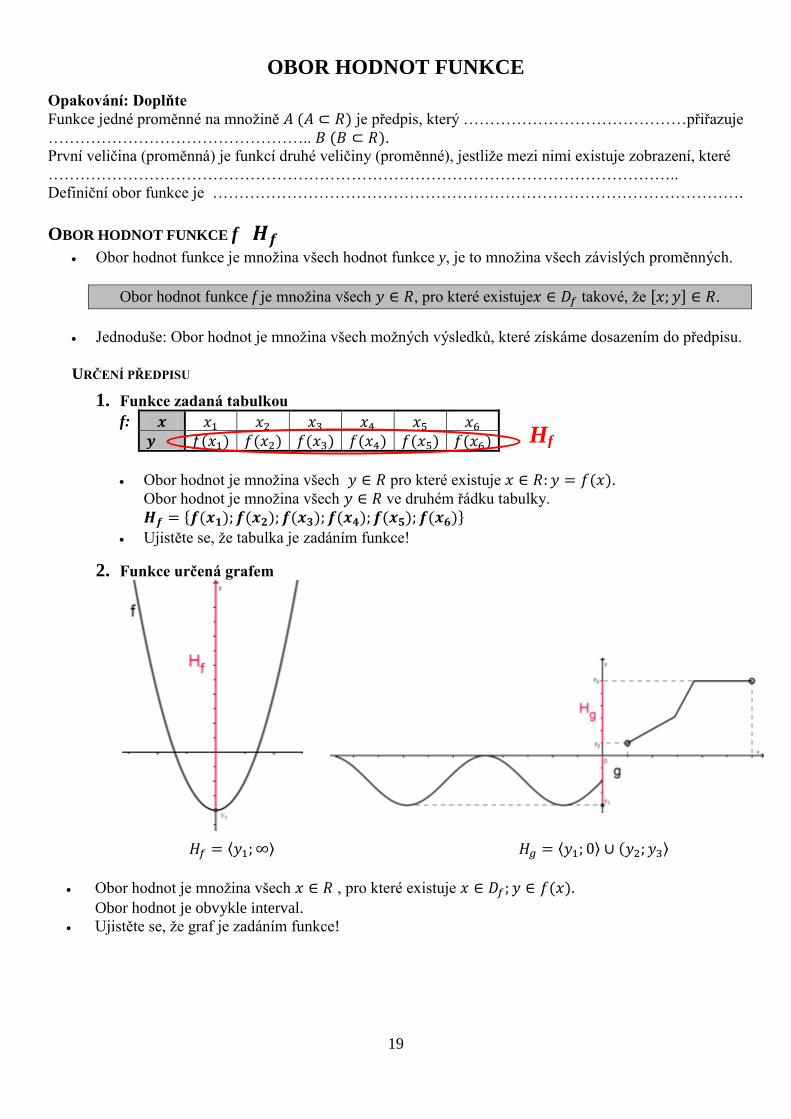
Obor hodnot funkce je množina všech hodnot funkce y, je to množina všech závislých proměnných.
Obor hodnot funkce f je množina všech , pro které existuje takové, že .
Jednoduše: Obor hodnot je množina všech možných výsledků, které získáme dosazením do předpisu.
URČENÍ PŘEDPISU
1. Funkce zadaná tabulkou
f:
Obor hodnot je množina všech pro které existuje .
Obor hodnot je množina všech ve druhém řádku tabulky.
Ujistěte se, že tabulka je zadáním funkce!
2. Funkce určená grafem
Obor hodnot je množina všech , pro které existuje Obor hodnot je obvykle interval.
Ujistěte se, že graf je zadáním funkce!
Hf

20
3. Funkce zadaná předpisem
Při určení oboru hodnot potřebujeme nejprve určit definiční obor..
Analyzujeme funkci, abychom určili všechny hodnoty y, pro které neexistuje reálné x.
Příklad:
; 0 nemůže patřit do oboru hodnot, protože rovnost
nikdy neplatí.
Určeni oboru hodnot je založeno na definičním oboru funkce..
Příklad: . Pokud za x dosadíme libovolné reálné číslo, pak. .
V předpisu je odečtena 4. Obor hodnot tedy budou všechna čísla vetší nebo rovna -4,
.
Cvičení: Určete obor hodnot:
1.
f1: -2 1 5 6 14 16
0 2 6 8 9 10
2.
f1: -2 1 5 6 14 16
0 2 6 8 9 10
3.
4.
5.
6.
7.
8.
9.

21
WORKSHEET –definition of function, the domain and function range
I. Decide which of following graphs/tables are the representation of a function. If it is a function,
specify the domain and the range:
1. x -3 0 2 8 -1 3
y 1 -1 0 1 2 3
2. x -3 5 2 8 -3 3
y 6 -2 5 1 2 3
3.
4.
5.
6.
7.
II. Decide if the following functions are equal. Mark your answer in the box.
(yes – Y, no - N)
1.
Y N
2.
Y N
3.
Y N

22
III. Determine the domains of the following functions:
IV. Given functions f, g, h. Match the correct number with the value of the function.
A 1 0 A
B 2 13 B
C 3 4 C
D 4 1 D
E 5 E 4
F 6 F
V. Given
. Find which of following numbers belong to the range of the function f.
(Fill in the gap with one of following symbols: ).
VI. Draw a graph of a function which domain is the interval and the range of the
function is:
a) b) c)

23
PRACOVNÍ LIST – definice funkce, definiční obor, obor hodnot
I. Rozhodněte, které z následujících grafů/tabulek jsou zadáním funkce. U funkcí určete
definiční obor a obor hodnot:
1. x -3 0 2 8 -1 3
y 1 -1 0 1 2 3
2. x -3 5 2 8 -3 3
y 6 -2 5 1 2 3
3.
4.
5.
6.
7.
II. Rozhodněte, zda se dané funkce rovnají. Svou odpověď vyznačte do příslušného pole.
(Ano – A, ne - N)
1.
A N
2.
A N
3.
A N
24
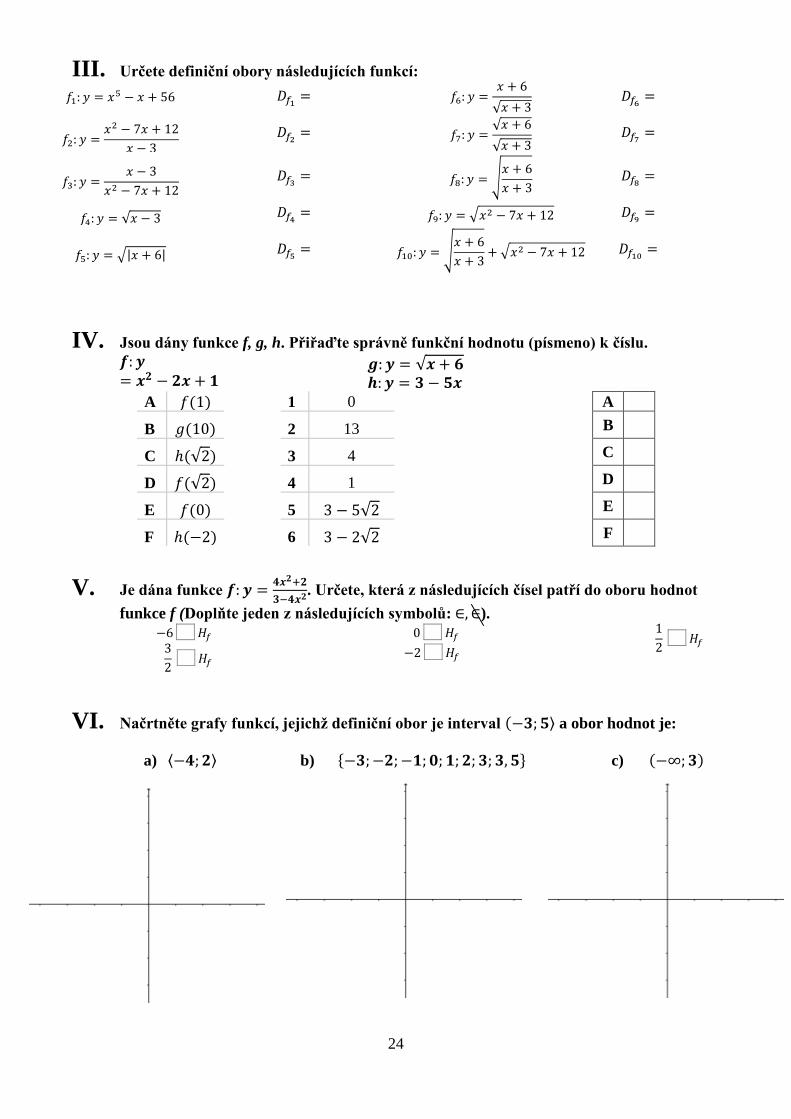
III. Určete definiční obory následujících funkcí:
IV. Jsou dány funkce f, g, h. Přiřaďte správně funkční hodnotu (písmeno) k číslu.
A 1 0 A
B 2 13 B
C 3 4 C
D 4 1 D
E 5 E
F 6 F
V. Je dána funkce
. Určete, která z následujících čísel patří do oboru hodnot
funkce f (Doplňte jeden z následujících symbolů: ).
VI. Načrtněte grafy funkcí, jejichž definiční obor je interval a obor hodnot je:
a) b) c)

25
PROPERTIES OF FUNCTION – monotonicity, one-to-one function
In this worksheet the concept of a monotonic function is discussed and the method to determine a
monotonicity is introduced.
INCREASING FUNCTION
A function f is called increasing on an interval if the function value increases
as the independent value increases.
: if then
DECREASING FUNCTION
A function f is called decreasing on an interval if the function value decreases
as the independent value increases.
: if then
NONINCREASING FUNCTION
: if then
NONDECREASING FUNCTION
: if then
MONOTONICITY
A function which is nonincreasing or nondecreasing is called monotonicity on its domain.
The function is also called monotonic.
A function which is increasing or nondecreasing is called strictly monotonic on its domain.
This function is decreasing in the interval of This function in increasing in the interval of
The function is not monotonic on its domain .

26
ONE-TO-ONE FUNCTIONS
A function for which every element of the range of the function corresponds to exactly one element
of the domain.
One-to-one function relates each value of the independent variable x to the single value of the
dependent variable y.
A function is called an one-to-one function if for each y from the range of f there
exists exactly one x in the domain of f which is related to y.
Otherwise
Example:
1. 2. 3.
f: -4 -2 -1 0 1 2 4
0 1 2 8 9 3 -6
g: -4 -2 -1 0 1 2 4
9 6 3 1 5 6 8
h: -3 -2 -1 1 2 3 -1
-5 -4 -3 -3 -4 -5 -6
Function f is one-to-one. Function g is not one-to-one because
h is not a function!
For graph of function we can do a horizontal line test.
The graph of a function is the grapf of an one-to-one function if only and only if no horizontal line intersects
the graph at more than one point.
4. 5. 6.
The function is not one-to-one. The function is one-to-one. The function is not one-to-one
7.
This function is not one-to.one.
but
8. This function is one-to-one.
IF THE FUNCTION IS INCREASING OR DECREASING, THEN IT IS AN ONE-TO-ONE
FUNCTION.

27
VLASTNOSTI FUNKCE – monotónnost, prostá funkce
V tomto pracovním listu je vysvětlen pojem monotónnost a způsob rozpoznání monotónnosti.
ROSTOUCÍ FUNKCE
Řekneme, že funkce je rostoucí na intervalu, jestliže s rostoucími hodnotami
argumentu roste i funkční hodnota.
: jestliže pak
KLESAJÍCÍ FUNKCE
Řekneme, že funkce je klesající na intervalu, jestliže s rostoucími hodnotami
argumentu klesá funkční hodnota.
: jestliže pak
NEROSTOUCÍ FUNKCE
: jestliže pak
NEKLESAJÍCÍ FUNKCE
: jestliže pak
MONOTÓNNOST
Monotónní nazveme funkci, která je na celém definičním oboru nerostoucí nebo je na celém
definičním oboru neklesající.
Funkce, která je na celém svém definičním oboru rostoucí nebo je na celém definičním oboru
klesající, se nazývá ryze monotónní.
Tato funkce je klesající pro Tato funkce je rostoucí pro
Tato funkce není monotónní na svém definičním oboru .
neklesající nerostoucí

28
PROSTÁ FUNKCE
Prostá funkce je funkce, ve které dvěma různým funkčním hodnotám odpovídají různé hodnoty
argumentu.
Prostá funkce přiřazuje dvěma různým funkčním hodnotám různé hodnoty argumentů.
Funkce je prostá, jestliže pro každé y z oboru hodnot existuje právě jedno x z
definičního oboru funkce, pro které .
jinak
Příklad:
1. 2. 3.
f: -4 -2 -1 0 1 2 4
0 1 2 8 9 3 -6
g: -4 -2 -1 0 1 2 4
9 6 3 1 5 6 8
h: -3 -2 -1 1 2 3 -1
-5 -4 -3 -3 -4 -5 -6
Funkce f je prostá. Funkce není prostá, protože
h není funkce!
Pro funkci zadanou grafem můžeme provést test pomocí vodorovné přímky.
Graf funkce je grafem prosté funkce právě tehdy, když libovolná vodorovná přímka protne graf nejvýše
v jednom bodě (jeden nebo žádný průsečík).
4. 5. 6.
Funkce není prostá. Funkce je prostá. Funkce není prostá.
7.
Tato funkce není prostá.
ale
8. Tato funkce je prostá.
JESTLIŽE JE FUNKCE ROSTOUCÍ NEBO KLESAJÍCÍ, PAK JE PROSTÁ.

29
PROPERTIES OF FUNCTION – boundary, extremes, periodic
BOUNDED FUNCTION
We say that a real function f is bounded from below if there is a
number d such that for all x from the domain one has .
We say that a real function f is bounded from above if there
is a number H such that for all x from the domain one has
.
We say that a real function f is bounded if it is bounded both
from above and below.
Practice:
Draw a graph of a function which is even and
bounded from below:
Example:
Determine if
is bounded.
; 0
The function is bounded.

30
EXTREME VALUES OF FUNCTIONS When an output value of a function is a maximum or minimum over the entire domain of the
function, the value is called the maximum or the minimum, as defined below.
Function f has maximum in point a if and only if for all is .
Function f has minimum in point b if and only if for all is .
This function has a minimum for : This function has a maximum for :
PERIODIC FUNCTION
A function f is said to be periodic with period p ( ) if for each also
and one has for
The function is periodic.
The function is not periodic.
Practice:
Determine extreme points, intervals of monocity and boundedness
The function is decreasing for
The function is incerasing for
The function has maximum for
The function has minimum for
The function ……. bounded.
For all :

31
VLASTNOSTI FUNKCE – omezenost, extrémy, periodičnost
OMEZENÁ FUNKCE
Řekneme, že reálná funkce f je omezená zdola, jestliže existuje
reálné číslo d tak, že pro každé x z definičního oboru platí:
.
Řekneme, že reálná funkce f je omezená shora, jestliže
existuje reálné číslo H tak, že pro každé x z definičního oboru
platí: .
Řekneme, že funkce je omezená, jestliže je omezená shora i zdola.
Cvičení:
Načrtněte graf funkce, která je sudá a omezená
zdola.
Příklad:
Zjistěte, zda je funkce
omezená.
; 0
Funkce je omezená.

32
EXTRÉMY FUNKCE V případě, že hodnota funkce je největší nebo nejmenší na celém jejím definičním oboru, pak se tato
hodnota nazývá maximum respektive minimum funkce, jak je uvedeno níže.
Funkce f má maximum v bodě a, právě tehdy když pro všechna je .
Funkce f má minimum v bodě b právě tehdy když pro všechna je .
Funkce má minimum pro : Funkce má maximum pro :
PERIODICKÁ FUNKCE
Řekneme, že funkce f je periodická s periodou p ( ), jestliže pro všechna také
A platí: pro
Funkce je periodická.
Funkce není periodická.
Cvičení:
Určete extrémy, intervaly monotónnosti a omezenost funkce.
Funkce je rostoucí pro pro
Funkce je klesající pro pro
Funkce má maximum pro
Funkce má minimum pro
Funkce ……. omezená.
Pro všechna :

33
EVEN AND ODD FUNCTIONS
EVEN FUNCTION A function f is said to be even if:
1. For each also and
2. For each : .
The graph of an even function is always symmetrical about the vertical axis
(that is, we have a mirror image through the y-axis)
Example 1:
1. 2. 3.
f: -4 -2 -1 0 1 2 4
9 6 3 1 3 6 9
g: -4 -2 -1 0 1 2 4
9 6 3 1 3 5 9
h: -3 -2 -1 1 2 3 4
-5 -4 -3 -3 -4 -5 -6
Function f is even. Function g is not even because
Function h is not even because
and
2. 3. 4.
Function a is even. Function b is even. Function c is not even because
and
Example 2: this implies .
Function f is even.
Practice 1: Complete tables of even functions:
1. 2. 3.
f: -5 -4 -3 0
0 1 2 0
g: -9 -2 5
1 2 6
h: 1 2 3
3 2 1
Practice 2: Decide which of these functions is even:

34
ODD FUNCTION A function f is said to be odd if:
1. For each also and
2. For each : ……………………….
The graph of an even function is always symmetrical about the origin.
(a graph has origin symmetry if we can fold it along the vertical axis, then along the horizontal axis,
and it lays the graph onto itself.)
Example 1:
1. 2. 3.
f: -4 -2 -1 0 1 2 4
9 6 3 1 -3 -6 -9
g: -4 -2 -1 0 1 2 4
-9 6 3 0 -3 -5 9
h: -3 -2 -1 1 2 3 4
5 -4 -3 -3 4 -5 -6
Function f is odd. Function g is not even because
Function h is not even because
and
2. 3. 4.
Function a is odd. Function b is even. Function c is not even because
and
Example 2:
this implies .
Function f is odd.
Practice 1: Complete the graph so that it is will be an odd function:

35
PARITA FUNKCE
SUDÁ FUNKCE Řekneme, že funkce je sudá, jestliže::
3. Pro všechna i a
4. Pro všechna : .
Graf sudé funkce je souměrný podle osy y.
(To znamená, že osa y vytváří zrcadlový obraz)
Příklad 1:
1. 2. 3.
f: -4 -2 -1 0 1 2 4
9 6 3 1 3 6 9
g: -4 -2 -1 0 1 2 4
9 6 3 1 3 5 9
h: -3 -2 -1 1 2 3 4
-5 -4 -3 -3 -4 -5 -6
Funkce f je sudá. Funkce g není sudá, protože
Funkce h není sudá, protože
and
2. 3. 4.
Funkce a je sudá.. Funkce b je sudá.. Funkce c není sudá, protože
and
Příklad 2: z toho vyplývá, že .
Funkce je sudá.
Cvičení 1: Doplňte tabulky sudých funkcí:
1. 2. 3.
f: -5 -4 -3 0
0 1 2 0
g: -9 -2 5
1 2 6
h: 1 2 3
3 2 1
Cvičení 2: Rozhodněte, které funkce jsou sudé:

36
LICHÁ FUNKCE Řekneme, že funkce je lichá,jestliže::
1. Pro všechna i and
2. Pro všechna : ……………………….
Graf každé liché funkce je souměrný podle počátku soustav souřadnic.
(Graf je středově souměrný. Pokud překlopíme graf podle osy y a tento obraz následně podle osy x,
získáme totožný graf.)
Příklad 1:
1. 2. 3.
f: -4 -2 -1 0 1 2 4
9 6 3 1 -3 -6 -9
g: -4 -2 -1 0 1 2 4
-9 6 3 0 -3 -5 9
h: -3 -2 -1 1 2 3 4
5 -4 -3 -3 4 -5 -6
Funkce f je lichá. Funkce g není lichá, protože
Funkce h není lichá, protože
and
2. 3. 4.
Funkce a je lichá.. Funkce b je sudá.. Funkce c není lichá, protože
and
Příklad 2:
y toho vyplývá .
Funkce f je lichá..
Cvičení 1: Doplňte grafy tak, aby se jednalo o liché funkce.:

37
WORKSHEET – PROPERTIES OF FUNCTIONS
Fill in the gaps:
A.
The function of a single variable on set is a relation in which for ……………………….. is
given ………………… of another set .
The first variable is a function of the second variable if there is a relationship between them:
…………………………………………………… …………….…………………………………… .
A variable, values which are given, is called an argument or an ………………………………………...
The other variable, values which are found by the certain rule, is called a …………………………….
Usually an argument is marked as …… and a …………………………. is marked as y .
The domain is the set …………………………………………………………………………………
The range is the set …………………………………………………………………………………....
Graph of a function.
This graph is not a function.
B.
A function f is called increasing on an interval if ………………………………………………………..
A function f is called decreasing on an interval if ……………………………………………………….
A function f is called nonincreasing on an interval if …………………………………………………....
A function f is called nondecreasing on an interval if…………………………………………………….
A function is called monotonic if ……………………………………………………………………….....
Graph of monotonic function.
Graph of nonincreasing function.
38
C.
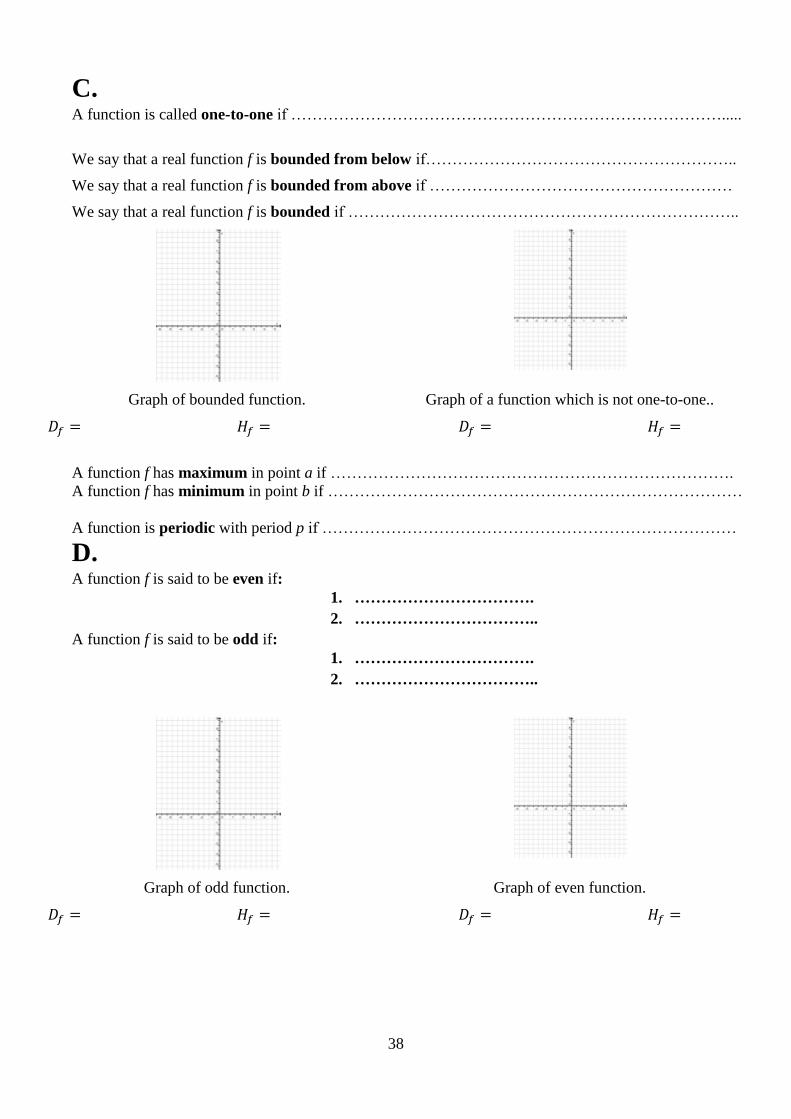
A function is called one-to-one if ……………………………………………………………………….....
We say that a real function f is bounded from below if…………………………………………………..
We say that a real function f is bounded from above if …………………………………………………
We say that a real function f is bounded if ………………………………………………………………..
Graph of bounded function.
Graph of a function which is not one-to-one..
A function f has maximum in point a if ………………………………………………………………….
A function f has minimum in point b if ……………………………………………………………………
A function is periodic with period p if ……………………………………………………………………
D.
A function f is said to be even if:
1. …………………………….
2. ……………………………..
A function f is said to be odd if:
1. …………………………….
2. ……………………………..
Graph of odd function.
Graph of even function.
39
PRACOVNÍ LIST – VLASTNOSTI FUNKCÍ
Doplňte vynechaná místa:
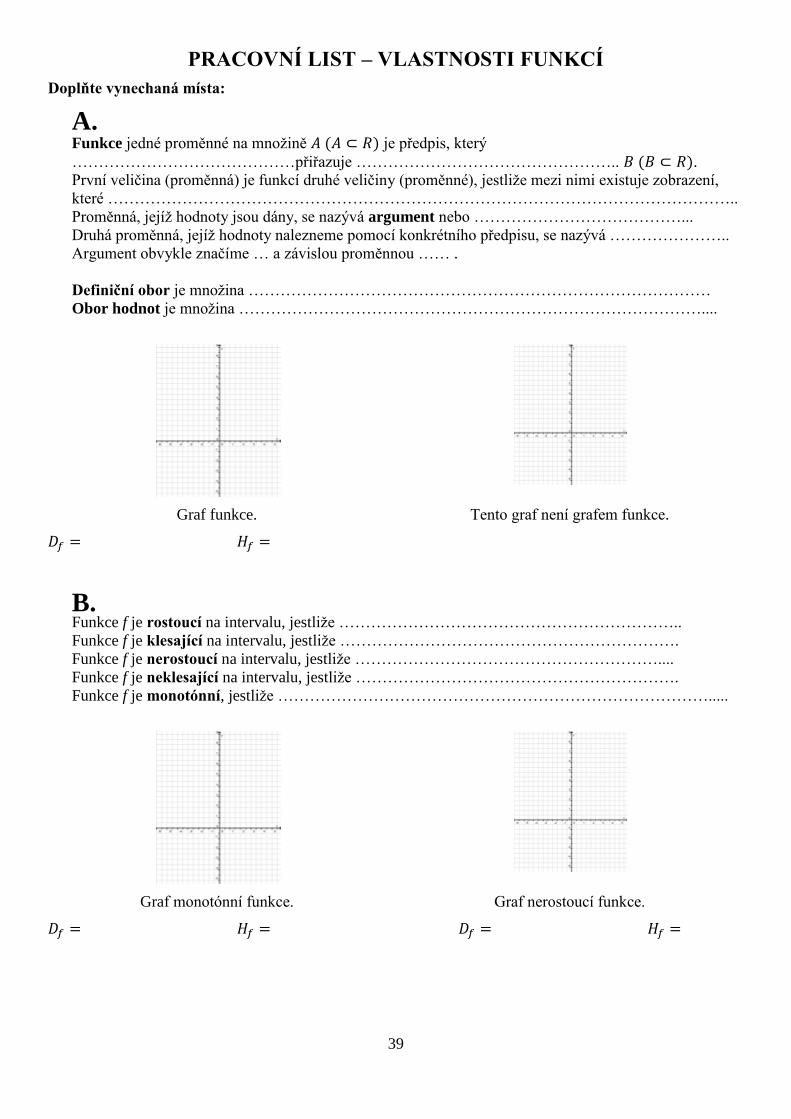
A.
Funkce jedné proměnné na množině je předpis, který
……………………………………přiřazuje ………………………………………….. .
První veličina (proměnná) je funkcí druhé veličiny (proměnné), jestliže mezi nimi existuje zobrazení,
které ………………………………………………………………………………………………………..
Proměnná, jejíž hodnoty jsou dány, se nazývá argument nebo …………………………………...
Druhá proměnná, jejíž hodnoty nalezneme pomocí konkrétního předpisu, se nazývá …………………..
Argument obvykle značíme … a závislou proměnnou …… .
Definiční obor je množina ……………………………………………………………………………
Obor hodnot je množina ……………………………………………………………………………....
Graf funkce.
Tento graf není grafem funkce.
B.
Funkce f je rostoucí na intervalu, jestliže ………………………………………………………..
Funkce f je klesající na intervalu, jestliže ……………………………………………………….
Funkce f je nerostoucí na intervalu, jestliže …………………………………………………....
Funkce f je neklesající na intervalu, jestliže …………………………………………………….
Funkce f je monotónní, jestliže ……………………………………………………………………….....
Graf monotónní funkce.
Graf nerostoucí funkce.

40
C.
Funkce je prostá, jestliže ……………………………………………………………………….....
Řekneme, že funkce f je omezená zdola, jestliže …….…………………………………………………..
Řekneme, že funkce f je omezená shora, jestliže ……………………………………………………..…
Řekneme, že funkce f je omezená, jestliže …… …………………………………………….…………..
Graf omezené funkce.
Graf prosté funkce.
Funkce f má v bodě a maximum ………………………………………………………………….
Funkce f má v bodě b minimum ……………………………………………………………………
Funkce je periodická s periodou p, jestliže………………………………………………………………
D.
Řekneme, že funkce f je sudá, jestliže:
1. …………………………….
2. …………………………….. Řekneme, že funkce f je lichá, jestliže:
1. …………………………….
2. ……………………………..
Graf sudé funkce.
Graf liché funkce.

41
WORKSHEET – properties of functions from graphs and tables
Determine properties of following functions:
1.
2.
3. Monotonicity:
4. One-to-one:
5. Extremes:
6. Boundaries:
7. Odd, even:
1.
2.
3. Monotonicity:
4. One-to-one:
5. Extremes:
6. Boundaries:
7. Odd, even:
1.
2.
3. Monotonicity:
4. One-to-one:
5. Extremes:
6. Boundaries:
7. Odd, even:

42
1.
2.
3. Monotonicity:
4. One-to-one:
5. Extremes:
6. Boundaries:
7. Odd, even:
1.
2.
3. Monotonicity:
4. One-to-one:
5. Extremes
6. Boundaries:
7. Odd, even:
1.
2.
3. Monotonicity:
4. One-to-one:
5. Extremes:
6. Boundaries:
7. Odd, even:
f: -5 -2 -3 3 2 5
0 1 2 -2 -1 0
1.
2.
3. Monotonicity:
4. One-to-one:
5. Extremes:
6. Boundaries:
7. Odd, even:

43
PRACOVNÍ LIST – vlastnosti funkce z grafu a tabulky
Určete vlastnosti následujících funkcí:
1.
2.
3. Monotónnost:
4. Prostá:
5. Extrémy:
6. Omezenost:
7. Parita:
1.
2.
3. Monotónnost:
4. Prostá:
5. Extrémy:
6. Omezenost:
7. Parita:
1.
2.
3. Monotónnost:
4. Prostá:
5. Extrémy:
6. Omezenost:
7. Parita:

44
1.
2.
3. Monotónnost:
4. Prostá:
5. Extrémy:
6. Omezenost:
7. Parita:
1.
2.
3. Monotónnost:
4. Prostá:
5. Extrémy
6. Omezenost:
7. Parita:
1.
2.
3. Monotónnost:
4. Prostá:
5. Extrémy:
6. Omezenost:
7. Parita:
f: -5 -2 -3 3 2 5
0 1 2 -2 -1 0
1.
2.
3. Monotónnost:
4. Prostá:
5. Extrémy:
6. Omezenost:
7. Parita:

45
LINEAR FUNCTION – word problem Example:
Mr. Nováček gives his son a weekly pocket money in amount of 300 Kč. His son Peter spends on average
230 Kč per a week. From his grandmother he get an extra 500 Kč for a nice school report with straight ones.
1. Calculate how much money Peter gets from his dad per :
a) one week
b) 4 weeks
c) a year
d) 2 years
e) 100 years
f) t weeks
time t (weeks) 1 4 52 t
money x (Kč)
2. Calculate how much money Peter can save for :
a) one week
b) 4 weeks
c) a year
d) 2 years
e) 100 years
f) t weeks
time t (weeks) 1 4 52 t
money x (Kč)
Write a function that expresses the dependence of the saved money on the number of weeks.
a) 1 week:
b) 2 weeks:
c) 4 weeks:
d) 52 weeks:
e) 104weeks:
f) t weeks:
3. Construct a graph of this function to the coordinate system. Determine its domain and range.
4. How long will it take to Petr to save 7000 Kč for a new bike?

46
Example 2:
Write a function that expresses the dependence of the saved money on the number of weeks if
1. Petr got from his grandmother 500 Kč for a nice school report in addition to pocket money.
2. Petr gets a weekly pocket money in amount of 250 Kč.
3. Petr 's spending increased to 260 Kč.
Example 3:
Assign functions f, g, h, k to the line, that is the graph of the function:
The …………………….. line (colour) is the graph of the function f with a formula f:y=
The …………………….. line (colour) is the graph of the function g with a formula g:y=
The …………………….. line (colour) is the graph of the function h with a formula h:y=
The …………………….. line (colour) is the graph of the function k with a formula k:y=
All functions that you have entered in this worksheet is an example of the linear function.

47
LINEÁRNÍ FUNKCE – úvodní slovní úloha Příklad:
Pan Nováček dává svému synovi týdenní kapesné ve výši 300 Kč. Jeho syn Petr týdně utratí v průměru
230 Kč. Za krásné vysvědčení se samými jedničkami dostal letos od babičky výjimečně ještě 500 Kč navíc.
1. Vypočítejte, kolik peněz dostal Petr od tatínka za:
a) týden
b) 4 týdny
c) rok
d) 2 roky
e) 100 let
f) t týdnů
čas t (týdny) 1 4 52 t
peníze x (Kč)
2. Určete, kolik peněz Petr ušetřil za:
a) týden
b) 4 týdny
c) rok
d) 2 roky
e) 100 let
f) t týdnů
čas t (týdny) 1 4 52 t
peníze x (Kč)
Zapište předpis funkce f, která udává množství ušetřených peněz na čase uvedeném v týdnech.
1 týden:
2 týdny:
4 týdny:
52 týdnů:
104týdnů:
t týdnů:
3. Do připravené soustavy souřadnic sestrojte graf této funkce a určete její definiční obor a obor hodnot.
4. Za jak dlouho by Petr při nezměněném kapesném ušetřil 7000 Kč na nové kolo?

48
Příklad 2:
Zapište předpis funkce, která udává množství ušetřených peněz na čase uvedeném v týdnech, jestliže:
1. Petr dostal kromě kapesného od babičky odměnu za vysvědčení ve výši 650 Kč.
2. Petr dostává kapesné ve výši 250 Kč.
3. Petrova útrata vzrostla na 260 Kč.
Příklad 3:
Přiřaďte funkcím f, g, h, k přímku, která je grafem příslušné funkce:
Grafem funkce f o předpisu f:y= je …………………….. přímka (přiřaďte barvu)
Grafem funkce g o předpisu g:y= je …………………….. přímka (přiřaďte barvu)
Grafem funkce h o předpisu h:y= je …………………….. přímka (přiřaďte barvu)
Grafem funkce k o předpisu k:y= je …………………….. přímka (přiřaďte barvu)
Všechny funkce, které jste sestavili v tomto pracovním listu, jsou příkladem lineární funkce.

49
LINEAR FUNCTION – definition and graph The name of a linear function comes from the latin word linea, which means ………………..
A graph of the linear function is thus ………..
Linear function f on set R is any function that has a formula:
f: ,with
Domain of the linear function:
A special case of the linear functions is:
1. Constant function
- Linear function, in which , the constant function has a formula:
2. Direct proportion
- Linear function, in which , the direct proportionality has a formula:
Example: Linear functions include for example these:
GRAPH OF THE LINEAR FUNCTION A line is the graph of the linear function.
As the line is determined by exactly two points, it is sufficient to construct the graph of an linear
function using the coordinates of two points.
Example 1: Construct a graph of a linear function with the formula:
We need to know coordinates of two points to construct the graph of any linear function.
The first coordinate we choose arbitrarily and the one remaining we have to calculate
from the formula of our function.
, ; , ; A simple and clear notation can be also created in the table:
0 1
5 8
Example 2: Construct a graph of a linear function with the formula:
This formula is a formula of the constant function.
0 1
3 3

50
Practice 1:Construct graphs of functions:
1.
2.
3.
4.
5.
6.
…………………………… is the graph of any linear function.
A line which passes through…………………………… is the graph of any direct proportion
A line which …………………………………………… is the graph of any constant function

51
LINEÁRNÍ FUNKCE – definice a graf Název lineární funkce pochází z latinského slova linea, což znamená ………………..
Grafem lineární funkce je tedy ………..
Lineární funkce f na množině R je každá funkce, která má předpis ve tvaru:
f: ,kde
Definičním obor lineární funkce:
Speciálním případem lineárních funkcí je:
3. Konstantní funkce
- lineární funkce, kde je , konstantní funkce má předpis:
4. Přímá úměrnost
- lineární funkce, kde je , přímá úměrnost má předpis:
Př.: Mezi lineární funkce patří například funkce:
GRAF LINEÁRNÍ FUNKCE Grafem lineární funkce je přímka.
Protože je přímka určena právě dvěma body, stačí k sestrojení grafu lineární funkce znát souřadnice
dvou bodů.
Příklad 1: Sestrojte graf lineární funkce o předpisu:
K sestrojení grafu lineární funkce stačí znát souřadnice dvou bodů.
První souřadnici zvolíme libovolně a zbylou musíme dopočítat z předpisu funkce.
, ; , ; Jednoduchý a přehledný zápis můžeme vytvořit i pomocí tabulky:
0 1
5 8
Příklad 2: Sestrojte graf lineární funkce o předpisu:
Jedná se o předpis konstantní funkce.
0 1
3 3

52
Cvičení 1:Sestrojte grafy následujících funkcí:
1.
2.
3.
4.
5.
6.
Grafem každé lineární funkce je ……………………………
Grafem každé přímé úměrnosti je přímka, která prochází ………………………………………
Grafem konstantní funkce je přímka, která ……………………………………………………….

53
LINEAR FUNCTION – importance of the parameters a, b
In this worksheet we will show the influence of the values of parameters a, b in the formula of a linear
function ( ) on its course and properties.
Example 1.: Construct graphs of functions into prepared coordinate system:
The value of parameter b in the formula of a linear function
determines ………………………………………………….
……………………………………………………................
Příklad 1: Construct graphs of functions into prepared
coordinate system:

54
The value of parameter a in the formula of a linear function determines ……………………………………..
…………………………………………………………………………………………………………………..
This parameter is called a slope of the line and for all pairs is given
.
For a….. is the graph of linear function increasing.
For a….. is the graph of linear function decreasing.
Fora …. is the linear function constant.
Example:
From the formula is
determined:
From the graph:
From the formula is
determined:
From the graph:
Practice: Determine values of parametres a, b from the graph. Write the formula of this function.
55
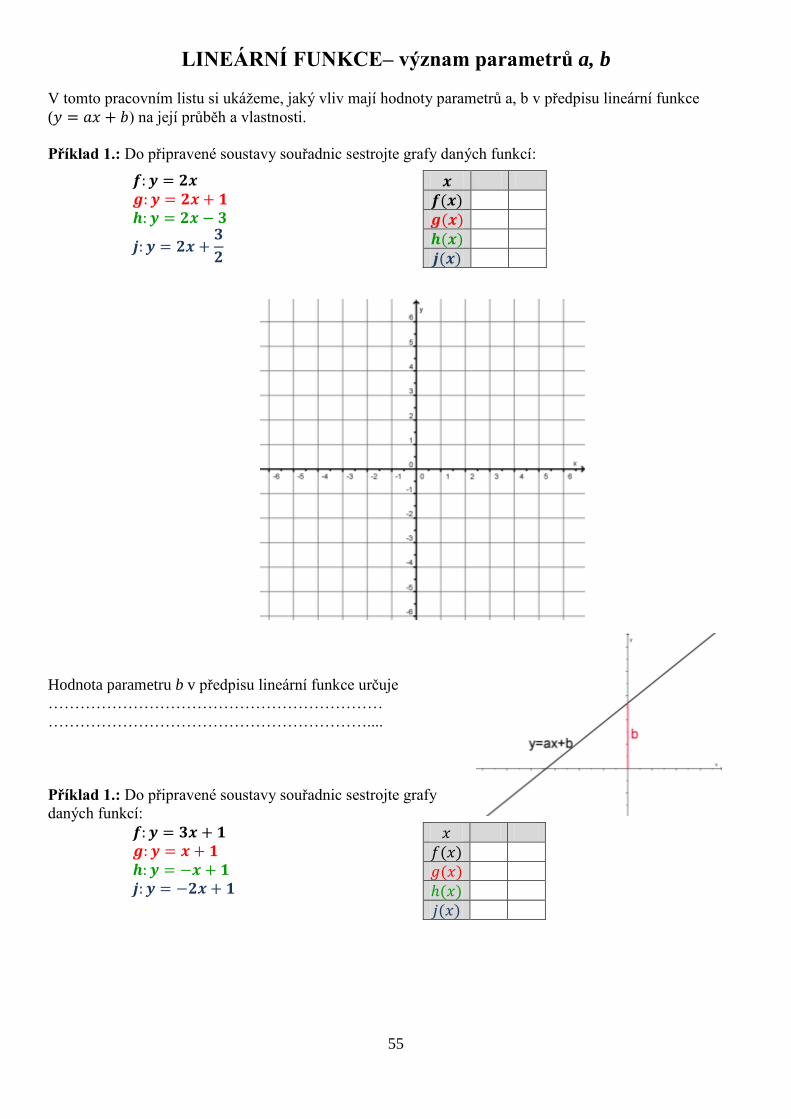
LINEÁRNÍ FUNKCE– význam parametrů a, b
V tomto pracovním listu si ukážeme, jaký vliv mají hodnoty parametrů a, b v předpisu lineární funkce
( ) na její průběh a vlastnosti.
Příklad 1.: Do připravené soustavy souřadnic sestrojte grafy daných funkcí:
Hodnota parametru b v předpisu lineární funkce určuje
………………………………………………………
……………………………………………………....
Příklad 1.: Do připravené soustavy souřadnic sestrojte grafy
daných funkcí:

56
Hodnota parametru a v předpisu lineární funkce určuje ………………………………………………………
Číslo a se nazývá směrnice přímky a pro každou dvojici platí
.
Pro a….. je lineární funkce rostoucí.
Pro a….. je lineární funkce klesající.
Pro a …. se jedná o funkci konstantní.
Příklad.:
Z předpisu lze určit, že
Z grafu:
Z předpisu lze určit, že
Z grafu:
Cvičení.: Určete z grafu lineární funkce hodnoty parametrů a a b. Sestavte předpis funkce.

57
LINEAR FUNCTION– creating formula, properties
Example 1: For linear function g is given: . Create a formula of this function.
The general formula of any linear function is: .
Each linear function has therefore different values of parameters a and b.
Contructing the formula of one specific function is based on determining the values of a, b.
We substitute values of the function from the input to the formula of the linear function.
Now we solve the system of two linear equations with two unknowns.
Zk.:
Practice: Determine the formulas of linear functions f, g, h, if you know:
1. 2.
3. ;
Example 2: Determine the formula of linear function f, whose graph you can see on the picture.
1.possible solution
To construct the formula it is necessary to
determine the coordinates of two points that
lie on the graph (line) of the function.
Now, the procedure is the same as in the
previous case. We substitute coordinates of
these points to the general rule of a linear
function:
2.possible solution
It is possible to directly
determine the values of the
parametres a, b.

58
Practice: Determine formulas of function f,g,h from the graph.
PROPERTIES OF LINEAR FUNCTION Fill in the gaps general properties of linear functions.
Linear function f on set R is any function that has a formula:
f: ,with
One-to-one Simple Simple
Function ………one-to-one (is/ isn't)
Function ………one-to-one (is/ isn't)
Function ………one-to-one (is/ isn't)
Monotonicity Monotonicity Monotonicity
Function …… ……for (increasing, decreasing, monotonicity)
Function …… ……for (increasing, decreasing, monotonicity)
Function …… ……for (increasing, decreasing, monotonicity)
Bounded Bounded Bounded
Function …… bounded (is/ isn't) Function …… bounded (is/ isn't) Function …… bounded (is/ isn't)
Extremum Extremum Extremum
Even and odd Even and odd Even and odd

59
LINEÁRNÍ FUNKCE – sestavení předpisu, vlastnosti
Příklad 1.: Pro lineární funkci g platí: . Určete předpis této funkce.
Obecný předpis každé lineární funkce je ve tvaru: .
Jednotlivé lineární funkce se tedy liší hodnotou parametrů a a b.
Sestavení předpisu konkrétní funkce tedy spočívá v určení hodnot a,b.
Do obecného předpisu lineární funkce dosadíme funkční hodnoty ze zadání.
Nyní vyřešíme soustavu dvou lineárních rovnic o dvou neznámých.
Zk.:
Cvičení: Určete předpisy lineárních funkcí f, g, h, víte-li:
1. 2.
3. ;
Příklad 2.: Určete předpis lineární funkce f, jejíž graf je na obrázku:
1.způsob
K sestavení předpisu je třeba určit
souřadnice dvou bodů, které leží na grafu
(přímce) hledané funkce.
Nyní je postup stejný jako v předchozím
případě. Souřadnice bodů dosadíme do
becného předpisu lineární funkce:
2.způsob
Z grafu je možné přímo
určit hodnoty parametrů a,
b.

60
Cvičení.:Z grafů určete předpisy lineárních funkcí f,g,h:
VLASTNOSTI LINEÁRNÍ FUNKCE Doplňte na vynechaná místa obecné vlastnosti lineární funkce:
Lineární funkce f na množině R je každá funkce, která má předpis ve tvaru:
f: ,kde
Prostá Prostá Prostá
Funkce …………prostá (je/není) Funkce …………prostá (je/není) Funkce …………prostá (je/není)
Monotónnost Monotónnost Monotónnost
Funkce …… ……pro (rostoucí, klesající, monotónní)
Funkce …… ……pro (rostoucí, klesající, monotónní)
Funkce …… ……pro (rostoucí, klesající, monotónní)
Omezenost Omezenost Omezenost
Funkce …… omezená (je/není) Funkce …… omezená (je/není) Funkce …… omezená (je/není)
Extrémy Extrémy Extrémy
Parita Parita Parita

61
LINEAR FUNCTION – use in solving equations, inequalities and their systems
In this worksheet we will explain how to use the graphs of
linear functions to solve linear equations, inequalities and
their systems.
In the coordinate system on the left you can see a sample
graph of a linear function.
The part of the graph, for which all the functional values
are greater than zero, is green.
The part of the graph, for which all the functional values
are less than zero, has blue colour.
The point, in which the value of the function is zero, is red.
Example:
Construct the graph of a linear function and determine for which is valid:
1.
2.
3.
4.
5.
1. 2. 3.
4. 5.
Practice: Construct the graph of a linear function and determine from it for which is
valid:
1.
2.
3.
4.

62
SOLVING SYSTEMS OF LINEAR EQUATIONS AND INEQUALITIES BY GRAPHING In the coordinate system there are graphs of functions f and g.
Function f is ……………(increasing/decreasing)
Function g is……………(increasing/decreasing)
Functions f and g intersect exactly in …………(number) point/points.
This point is marked by……………..colour and in it is valid the equality:
.
From the graph we can also determine for which real numbers x, the value
of the first function is greater than in the other (see the picture).
Simply we can say that the values of one function are greater than the
functional value of the second function if its graph is above (above the
graph of the second function).
Příklad: Solve this system of linear equations graphically:
The solution of this system is the ordered pair that is a solution
to both equations.
To solve a system of linear equations graphically we graph both
equations in the same coordinate system.
The solution to the system is the point where the two line intersect.
The solution of the example which is constructed in the coordinate
system is a point:
.
Practice: Solve this equations graphically: (use the graph above)
Practice: Solve numerically an equation with unknowns
Solution:
Graphical solution of linear equations is often used to solve
. problems of movement or other types of word problems.
SOLVING LINEAR INEQUALITIES BY GRAPHING Example: Solve inequalities graphically (use the graph above):
1.
Inequality can be rewritten:
2.
Inequality can be rewritten:
-

63
LINEÁRNÍ FUNKCE – využití při řešení rovnic, nerovnic a jejich soustav
V tomto pracovním listu se dozvíte o tom, jak lze využít
grafu lineární funkce při řešení lineárních rovnic a
nerovnic nebo jejich soustav.
V kartézské soustavě vlevo je sestrojen ukázkový graf
lineární funkce.
Část grafu funkce, pro níž jsou všechny funkční hodnoty
větší než nula, je vyznačena zelenou barvou.
Část grafu funkce, pro níž jsou všechny funkční hodnoty
menší než nula, je vyznačena zelenou barvou.
Bod, ve kterém je funkce rovna nule, je červený.
Příklad:
Sestrojte graf lineární funkce a zjistěte z něj, pro která platí:
1.
2.
3.
4.
5.
1. 2. 4.
5. 6.
Cvičení: Sestrojte graf lineární funkce a zjistěte z něj, pro která platí:
1.
2.
3.
4.

64
GRAFICKÉ ŘEŠENÍ SOUSTAV LINEÁRNÍCH ROVNIC A NEROVNIC V soustavě souřadnic jsou sestrojeny grafy funkcí f a g.
Funkce f je ……………(rostoucí/klesající)
Funkce g je……………(rostoucí/klesající)
Funkce f a g mají společný/ch právě …………(počet) bod/bodů.
Tento bod je označen ……………..barvou a platí v něm: .
Z grafu můžeme také určit, pro která reálná čísla x jsou funkční hodnoty
jedné funkce větší než druhé (viz obrázek).
Zjednodušeně lze říci, že funkční hodnoty jedné funkce jsou větší než
funkční hodnoty druhé funkce, jestliže je její graf výše (nad grafem
druhé funkce).
Příklad: Řešte graficky soustavu lineárních rovnic s neznámými
Vyřešit soustavu rovnic znamená najít takovou uspořádanou dvojici
čísel x, y, která splňuje obě dvě rovnice.
Na každou rovnici můžeme pohlížet také jako na rovnici přímky,
předpis lineární funkce. Řešením soustavy jsou souřadnice průsečíku
těchto přímek.
V příkladu sestrojeném v soustavě souřadnic je řešením bod
.
Cvičení: Řešte graficky rovnici: (využijte grafu sestrojeného výše)
Cvičení: Řešte početně soustavu lineárních rovnic s neznámými
Řešení:
Grafické řešení soustav lineárních rovnice se uplatňuje např.
. při řešení úloh o pohybu nebo jiných typech slovních úloh.
GRAFICKÉ ŘEŠENÍ SOUSTAV LINEÁRNÍCH NEROVNIC Příklad: Řešte graficky nerovnici (využijte grafu sestrojeného výše):
1.
Nerovnici lze přepsat
2.
Nerovnici lze přepsat
-

65
QUADRATIC FUNCTION without the linear term - graph
Example: Construct graphs of following functions to the prepared coordinate system. To each formula of
a function construct a graph of the same colour.
1.
-3 -2 -1,5 -1 -0,5 0
3 2 1,5 1 0,5
2.
-3 -2 -1,5 -1 -0,5 0
3 2 1,5 1 0,5

66
The vertex of a parabola, which is the graph of a quadratic function with a formula has
coordinates:
3.
-3 -2 -1,5 -1 -0,5 0
3 2 1,5 1 0,5
PROPERTIES OF A QUADRATIC FUNCTION
Graph of the quadratic function is convex for .
Graph of the quadratic function is concave for .
As increases, the graph …………………………. (becomes wider/ becomes narrower)
As desreases, the graph …………………………. (becomes wider/ becomes narrower)
The vertex of a parabola, which is the graph of a function has coordinates:
For is For is
function is increasing for
function is increasing for
function is decreasing for
function is decreasing for
A GRAPH AND PROPERTIES OF THE FUNCTION The graph is a parabola
For is the parabola convex
For is the parabola concave
The vertex of the parabola has coordinates
The value of a parameter a affects the
width of the parabola, the value of a
parameter c determines a translation of
parabola in y-direc
convex concave

67
KVADRATICKÁ FUNKCE bez lineárního členu - graf
Příklad: Do připravené soustavy souřadnic sestrojte grafy následujících funkcí. Graf sestrojte stejnou
barvou, jakou je napsaný předpis funkce:
1.
-3 -2 -1,5 -1 -0,5 0
3 2 1,5 1 0,5
2.
-3 -2 -1,5 -1 -0,5 0
3 2 1,5 1 0,5

68
Vrchol paraboly, která je grafem kvadratické funkce o předpisu , má souřadnice:
3.
-3 -2 -1,5 -1 -0,5 0
3 2 1,5 1 0,5
VLASTNOSTI KVADRATICKÉ FUNKCE
Graf kvadratické funkce je konvexní pro .
Graf kvadratické funkce je konkávní pro .
S rostoucí hodnotou se graf …………………………. (rozšiřuje/zužuje)
S klesající hodnotou se graf …………………………..(rozšiřuje/zužuje)
Vrchol paraboly, která je grafem funkce o předpisu má souřadnice:
Pro je Pro je
funkce je rostoucí pro
funkce je rostoucí pro
funkce je klesající pro
funkce je klesající pro
GRAF A VLASTNOSTI FUNKCE Grafem je parabola
Pro je parabola konvexní
Pro je parabola konkávní
Vrchol paraboly má souřadnice
Hodnota koeficientu a ovlivňuje šířku
paraboly, hodnota koeficientu c určuje
velikost posunutí paraboly ve směru osy y
konvexní konkávn
í

69
QUADRATIC FUNCTION – graph of a general quadratic function
Example: Construct graphs of following functions to the prepared coordinate system. To each formula of
a function construct a graph of the same colour:
1.
-3 -2 -1,5 -1 -0,5 0
3 2 1,5 1 0,5
Graph and properties of a quadratic function The graph is a parabola.
A vertex of the parabola, which is the graph of the function , has coordinates:
A parabola that is the graph of has the same shape as a parabola with the equation
The value of the coefficient b determines the translation of a parabola in x-direction.
For is the vertex translated in the direction of the positive half-axis x
For the vertex translated in the direction of the negative half-axis x
GRAPH OF A GENERAL QUADRATIC FUNCTION
Quadratic function f on set R is any function that has a formula:
f: ,with
Domain of the quadratic function:
From previous worksheets we know how to construct graphs of quadratic functions of the following
types: ; a .

70
The coefficient a infuences …………. of the parabola.
The coefficient b determines the translation of the graph in ………………………………
The coefficient c determines the translation of the graph in ………………………………
We combine our knowledges and apply them simultaneously to constructing of the graph of a general
quadratic function:
CONSTRUCTING THE GRAPH OF
Graph of the function has the same shape as the graph of a function and
a vertex 1. Sketch the graph of the function
2. Translate the graph of the function of C units in the direction of the y axis and of (-B) units in
the direction of the x axis.
Example: Construct a graph of a function:
The graph of this function is the same shape as:
.
The vertex has coordinates:
Practice: Construct a graph of a function
The graph of this function is the same shape as:
.
The vertex has coordinates:
Example: Construct a graph of a function
At first we modify the formula to a form, from we can easily determine the
coordinates of the peak and the shape of the graph..
(The used procedure is called „completing the square“ and the next worksheet
deals with it.)
Practice: Determine coordinates of the vertex:
1.
;
2. ,
3.
,
4. , 5. ,

71
KVADRATICKÁ FUNKCE – graf obecné kvadratické funkce
Příklad: Do připravené soustavy souřadnic sestrojte grafy následujících funkcí. Graf sestrojte stejnou
barvou, jakou je napsaný předpis funkce:
3.
-3 -2 -1,5 -1 -0,5 0
3 2 1,5 1 0,5
Graf a vlastnosti kvadratické funkce Grafem je parabola
Vrchol paraboly, která je grafem funkce o předpisu má souřadnice:
Parabola, která je grafem funkce má stejný tvar jako parabola s rovnicí
Hodnota koeficientu b určuje velikost posunutí paraboly ve směru osy x.
Pro je vrchol paraboly posunut ve směru kladné poloosy x
Pro je vrchol paraboly posunut ve směru záporné poloosy x
GRAF OBECNÉ KVADRATICKÉ FUNKCE
Kvadratická funkce f na množině R je každá funkce, která má předpis ve tvaru:
f: ,kde ,
Definiční obor kvadratické funkce:
Z předchozích pracovních listů umíme sestrojit grafy následujících typů kvadratických funkcí:
; a .

72
Koeficient a ovlivňuje …………. paraboly.
Koeficient b souvisí s posunem grafu ve směru osy …..
Koeficient c určuje posunutí ve směru osy ……..
Nyní naše poznatky spojíme a aplikujeme je současně při sestrojení grafu obecné kvadratické funkce:
KONSTRUKCE GRAFU
Graf funkce má stejný tvar jako graf funkce a vrchol 3. Načrtneme graf funkce
4. Graf funkce posuneme o C jednotek ve směru osy y a B jednotek po ose x.
Příklad: Načrtněte graf funkce
Graf této funkce má stejný tvar jako graf funkce
.
Vrchol má souřadnice
Cvičení: Načrtněte graf funkce
Graf této funkce má stejný tvar jako graf funkce
.
Vrchol má souřadnice
Příklad: Načrtněte graf funkce
Nejprve upravíme předpis na vhodný tvar, ze kterého lze snadno určit
souřadnice vrcholu a tvar grafu.
(Použitá úprava se jmenuje doplnění na čtverec a věnuje se jí příští
pracovní list.)
Cvičení: Určete souřadnice vrcholu paraboly, která je grafem funkce:
6.
;
7. ,
8.
,
9. , 10. ,

73
COMPLETING THE SQUARE Completing the square is more precisely called completing to the square of the linear binomial.
This operation can be used:
1. In simplifying the formula of a quadratic function while constructing a graph.
2. In modifying the equations of conics to the vertex form/ center-radius form.
3. In solving the quadratic equations.
Completing the square is based on relationships:
These relationships can be simply verify by modification of expression on the left side:
We show also the graphical proof:
Practice: Fill in the gaps:
1.
2.
3.
4.
5.
6.
7.
8.
9.
10.
11.
12.
13.
14.
15.
16.
17.
18.
19.

74
ALGORITHM OF COMPLETING THE SQUARE Completing the square is a technique for converting a quadratic polynomial of the form
to the form , where .
From this form is for exapmle easy to determine coordinates of the vertex of a parabola.
First we will deal with a simpler case – completing the normalized polynomial
(To see applying of general procedure follow the examples on the right side.)
Normalized quadratic polynomial;
1. Put the quadratic and the linear monomial to one bracket.
2. I. Add a number to the bracket to get a perfect square.
What number do we add to the bracket? (look at exercise 8 to 19).
The number is solution of the equation:
II. We have to substract recetly added value (to keep the same value
of the expression).
3. Rewrite the bracket as a perfect square.
4. Done.
Check:
1. Factor the coefficient a out of the first two terms.
2. We get the normalized polynomial. Next procedure is the same as in
the previous case.
Check:
Practice: Complete the square:
1.
2.
3.
4.
5.
6.
7.
75
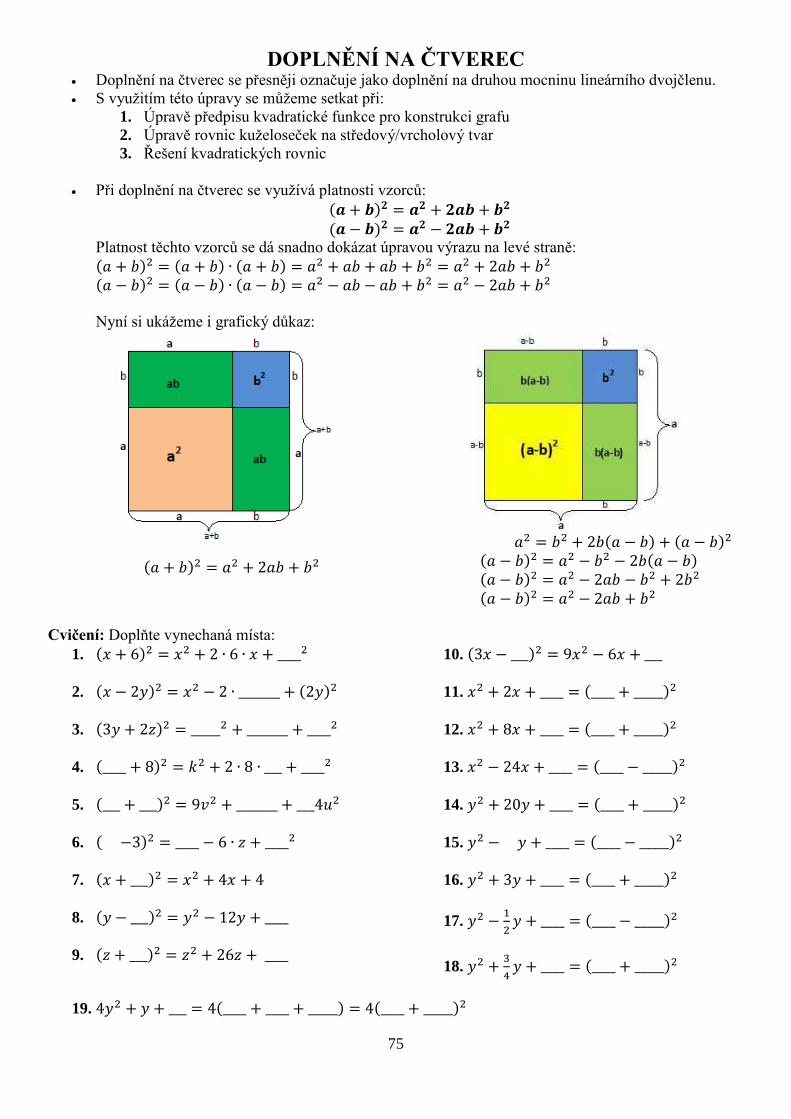
DOPLNĚNÍ NA ČTVEREC Doplnění na čtverec se přesněji označuje jako doplnění na druhou mocninu lineárního dvojčlenu.
S využitím této úpravy se můžeme setkat při:
1. Úpravě předpisu kvadratické funkce pro konstrukci grafu
2. Úpravě rovnic kuželoseček na středový/vrcholový tvar
3. Řešení kvadratických rovnic
Při doplnění na čtverec se využívá platnosti vzorců:
Platnost těchto vzorců se dá snadno dokázat úpravou výrazu na levé straně:
Nyní si ukážeme i grafický důkaz:
Cvičení: Doplňte vynechaná místa:
1.
2.
3.
4.
5.
6.
7.
8.
9.
10.
11.
12.
13.
14.
15.
16.
17.
18.
19.

76
ALGORITMUS DOPLNĚNÍ NA ČTVEREC Doplnění na čtverec je úprava, kdy výraz ve tvaru převedeme na tvar ,
kde .
Z tohoto tvaru lze například snadno určit souřadnice vrcholu paraboly, která je grafem funkce o
tomto předpisu
Nejprve se budeme zabývat jednodušším případem – doplněním normovaného tvaru
(Uplatnění obecného postupu můžete sledovat na příkladech uvedených v pravé části stránky)
Normovaný trojčlen;
1. Do závorky seskupíme kvadratický a lineární člen zadaného
trojčlenu
2. I. K těmto členům přičteme vhodné číslo tak, abychom trojčlen mohli
zapsat ve tvaru druhé mocniny dvojčlenu:
Jaké číslo je třeba doplnit? (podívejte se pozorně na cvičení 8 až 19).
Pro hledané číslo platí:
II. Aby se nezměnila hodnota výrazu, přičtenou hodnotu musíme za
závorkou opět odečíst.
3. Výraz v první závorce zapíšeme jako druhou mocninu dvojčlenu.
4. Hotovo
Zkouška:
3. Vytkneme z prvních dvou členů koeficient a kvadratického členu
4. Získali jsme normovaný tvar. Další postup je stejný jako
v předchozím případě.
Zkouška:
Cvičení: Doplňte na čtverec (druhou mocninu kvadratického dvojčlenu)
1.
2.
3.
4.
5.
6.
7.

77
QUADRATIC FUNCTION – properties
PROPERTIES OF QUADRATIC FUNCTION Fill in the gaps general properties of quadratic functions.
Quadratic function f on set R is any function that has a formula:
f: , kde
One-to-one One-to-one
Function ………one-to-one (is/ isn't)
Function ………one-to-one (is/ isn't)
Monotonicity Monotonicity
Function …… ……for
Function …… ……for (increasing, decreasing, monotonicity)
Function …… ……for
Function …… ……for (increasing, decreasing, monotonicity)
Bounded Bounded
Function …… bounded (is/ isn't) Function …… bounded (is/ isn't)
Extremum Extremum
Even and odd Even and odd
GRAPHICAL SOLUTION OF QUADRATIC EQUATIONS AND INEQUALITIES First, we will deal with important points on the graph of quadratic function.
There are three important points on the graph of quadratic
function.
We mark them as I,II and III.
III Is the intersection of the parabola and y-axis.
We can determine coordinates of this point for every quadratic
function with . They are:
I, II Are intersections of the parabola and x-axis.
First coordinates of these point are solutions of an equation:

78
1.
The equation has no solution.
Points I and II don’t exist.
2.
The equation has one sollution .
3.
The equation has two sollutions .
How to solve quadratic inequations ?
1. First we the root of quadratic equation:
2. Sketch graph of the quadratic function .
3. Determine the solution from the graph:
Example:
1.
Quadratic equation:

79
KVADRATICKÁ FUNKCE – vlastnosti, využití
VLASTNOSTI KVADRATICKÉ FUNKCE Doplňte na vynechaná místa obecné vlastnosti lineární funkce:
Lineární funkce f na množině R je každá funkce, která má předpis ve tvaru:
f: , kde
Prostá Prostá
Funkce …………prostá (je/není) Funkce …………prostá (je/není)
Monotónnost Monotónnost
Funkce …… ……pro
Funkce …… ……pro (rostoucí, klesající, monotónní)
Funkce …… ……pro
Funkce …… ……pro (rostoucí, klesající, monotónní)
Omezenost Omezenost
Funkce …… (je/není)omezená …………… Funkce …… (je/není)omezená ……………
Extrémy Extrémy
Parita Parita
GRAF KVADRATICKÉ FUNKCE PŘI ŘEŠENÍ ROVNIC A NEROVNIC Nejprve se budeme podrobněji zabývat významnými body na grafu kvadratické funkce.
There are three important points on the graph of quadratic
function.
We mark them as I,II and III.
III Is the intersection of the parabola and y-axis.
We can determine coordinates of this point for every quadratic
function with .
I, II Are intersections of the parabola and x-axis.
First coordinates of these point are solutions of an equation:

80
1.
The equation has no sollution.
Points I and II don’t exist.
2.
The equation has one sollution .
3.
The equation has two sollutions .
How to solve quadratic inequations?
1. First we the root of quadratic equation:
2. Sketch graph of the quadratic function .
3. Determine the solution from the graph:
Example: Solve:
1.
Quadratic equation:

81
POWER FUNCTION
Power function f on set R is any function that has a formula:
f: ,with
I.
n is odd
n is even
One-to-one One-to-one
Function ………one-to-one (is/ isn't) Function ………one-to-one (is/ isn't)
Monotonicity Monotonicity
Function …… ……………………for
Function …… ……………………
(increasing, decreasing, monotonicity)
Function …… ……………….…for
Function …… ……………….…for
(increasing, decreasing, monotonicity)
Bounded Bounded
Function …… bounded (is/ isn't).
Function …… bounded (is/ isn't)
Extremum Extremum
Even and odd Even and odd

82
II.
n is odd
n is even
One-to-one One-to-one
Function ………one-to-one (is/ isn't) Function ………one-to-one (is/ isn't)
Monotonicity Monotonicity
Function …… ……………………for
Function …… ……………………
(increasing, decreasing, monotonicity)
Function …… ……………….…for
Function …… ……………….…for
(increasing, decreasing, monotonicity)
Bounded Bounded
Function …… bounded (is/ isn't).
Function …… bounded (is/ isn't)
Extremum Extremum
Even and odd Even and odd

83
MOCNINNÁ FUNKCE
Mocninná funkce f na množině R je každá funkce o předpisu:
f: ,kde
III.
n je sudé
n je liché
Prostá Prostá
Funkce ………prostá (je/ není) Funkce ………prostá (je/ není)
Monotónnost Monotónnost
Funkce …… ……………………pro
Funkce …… ……………………
(rostoucí, klesající, monotónní)
Funkce …… ……………………pro
Funkce …… ……………………
(rostoucí, klesající, monotónní)
Omezenost Omezenost
Function …… bounded (je/ není)
Function …… bounded (je/ není)
Extrémy Extrémy
Parita Parita

84
I.
n je sudé
n je liché
Prostá Prostá
Funkce ………prostá (je/ není) Funkce ………prostá (je/ není)
Monotónnost Monotónnost
Funkce …… ……………………pro
Funkce …… ……………………
(rostoucí, klesající, monotónní)
Funkce …… ……………………pro
Funkce …… ……………………
(rostoucí, klesající, monotónní)
Omezenost Omezenost
Function …… bounded (je/ není)
Function …… bounded (je/ není)
Extrémy Extrémy
Parita Parita

85
LINEAR FRACTIONAL FUNCTION - worksheet
Practice 1: Construct graph of function
and determine all its properties.
Asymptotes:
f:
Properties:
Practice 2: Decide which of these statements are true and which are false:
1. Every inverse proportion is even. false/true
2. Every inverse proportion is decreasing. false/true
3. Every inverse proportion is increasing or decreasing function. false/true
4. There is no inverse proportion which is bounded from above. false/true
Practice 3: Construct graphs of these sets of function to the same coordinate system:
1.
;
;
2.
;
;
Practice 4: Determine the range and the domain of functions:
1.
2.
3.

86
Practice 5: Construct graph of function:
and determine properties.
Practice 6: Sketch graphs of functions:
1.
2.
3.
Practice 7: Assign the graph with correct formula.
1 2 3
A.
B.
C.

87
LINEÁRNÍ LOMENÁ FUNKCE – pracovní list
Cvičení 1: Sestrojte graf funkce
a určete její vlastnosti.
Asymptoty:
f:
Vlastnosti:
Cvičení 2: Rozhodněte, která tvzerní jsou pravdivá a která nejsou:
5. Každá přímá úměrnost je sudá funkce. pravda/nepravda
6. Každá přímá úměrnost je klesající funkce. pravda/nepravda
7. Každá přímá úměrnost je klesající nebo rostoucí funkce . pravda/nepravda
8. Existuje shora ohraničená přímá úměrnost. pravda/nepravda
Cvičení 3: Do připravených souřadnicových systémů sestrojte grafy následujících skupin funkcí:
3.
;
;
4.
;
;
Cvičení 4: Učete definiční obor a obor hodnot funkcí:
1.
2.
3.

88
Cvičení 5: Sestrojte graf funkce:
a určete vlastnosti.
Cvičení 6: Načrtněte grafy funkcí:
1.
2.
3.
Cvičení 7: Přiřaďte grafům správný funkční předpis.
1 2 3
A.
B.
C.

89
EXPONENCIAL FUNCTION – worksheet
Practice 1: Add correct sign of inequality:
1.
2.
3.
4.
5.
6.
7.
8.
Practice 2: Sketch graphs of functions and compare a and b; .
1.
2. 3.
Practice 3: Determine values od parametres a, b, c, d so that the function is increasing.
1.
2.
3.
4.

90
Practice 4: Construct graphs of following functions:
Practice 5: Construct graph of function . Determine the domain, the range and all properties
of this function.
One-to-one
Function ………one-to-one (is/ isn't)
Monotonicity
Function …… ……………………for (increasing, decreasing, monotonicity)
Bounded
Function …… bounded (is/ isn't).
Extremum
Even and odd

91
LOGARITHMIC FUNCTION – worksheet
Practice 1: Determine domains of functions:
1.
2.
3.
4.
5.
6.
7.
8.
9.
10.
Practice 2: Add correct sign of inequality:
1.
2.
3.
4.
5.
6.
Practice 3: Compute:
1.
2.
3.
4.
5.
6.
7.
8.
9.
10.
11.
12.
13.
14.

92
Practise 4: Construct graphs of following functions:
Practice 5: Construct graphs of following functions:
f1 f2 f3
One-to-one
Function ………one-to-one (is/ isn't)
Monotonicity
Function ……
……………………for (increasing, decreasing, monotonicity)
Bounded
Function …… bounded (is/ isn't).
Extremum
Even and odd
One-to-one
Function ………one-to-one (is/ isn't)
Monotonicity
Function ……
……………………for (increasing, decreasing, monotonicity)
Bounded
Function …… bounded (is/ isn't).
Extremum
Even and odd
One-to-one
Function ………one-to-one (is/ isn't)
Monotonicity
Function ……
……………………for (increasing, decreasing, monotonicity)
Bounded
Function …… bounded (is/ isn't).
Extremum
Even and odd

93
LOGARITMICKÁ FUNKCE – pracovní list
Cvičení 1: Určete definiční obor funkcí:
1.
2.
3.
4.
5.
6.
7.
8.
9.
10.
Cvičení 2: Doplňte správný znak nerovnosti:
1.
2.
3.
4.
5.
6.
Cvičení 3: Vypočítejte:
1.
2.
3.
4.
5.
6.
7.
8.
9.
10.
11.
12.
13.
14.

94
Cvičení 4: Sestrojte grafy následujících funkcí:
Cvičení 5: Sestrojte grafy následujících funkcí:
f1 f2 f3
Prostá
Funkce ………prostá (je/není)
Monotónnost
Funkce ……
……………..………pro (rostoucí, klecající, monotónní)
Omezenost
Funkce …… omezená (je/není).
Extrém
Parita
Prostá
Funkce ………prostá (je/není)
Monotónnost
Funkce ……
……………..………pro (rostoucí, klecající, monotónní)
Omezenost
Funkce …… omezená (je/není).
Extrém
Parita
Prostá
Funkce ………prostá (je/není)
Monotónnost
Funkce ……
……………..………pro (rostoucí, klecající, monotónní)
Omezenost
Funkce …… omezená (je/není).
Extrém
Parita

95
TRIGONOMETRIC FUNCTION – SINE, COSINE
To establish and define functions sine and cosine of any angle we must first begin with the unit circle.
The unit circle is a circle with a radius of one unit.
To determine the value of sine and cosine of a specific angle α we must start the unit circle.
So now contruct an arbtraryoriented angle of the size α,
Place this angle in the unit circle and the coordinate system so that the initial arm AV is
similar to the positive part of x axes. There is only one such location (Picture 2).
Trailing arm VB of the
angle intersects the
circle at a single point.
This intersection‘s name
is M.
This can be seen in the
Picture 3.
We can unambiguously assign the coordinates of the point M:
Determining the values of sine and cosine of our
angle α is nothing more than determining these
M point coordinates.
The second coordinate of the point M is called
sine α and its first coordinate is called the cosine
α, they are denoted sin , cos .
sin
cos
M
M
y
x
, for every R .
SINE
The sine function on the set R is called the function in which each number R is assigned number Mx .
COSINE
The cosine function on the set R is called the function in which each number R is assigned number My .
Picture 2 Picture 3
Picture 1
Picture 4

96
Similary (as described above for general angle α) we can use the unit circle to determine the value of the
sine and cosine functions for any given oriented angle.
We always calculate the basic angle and then place this angle into the unit circle.
We will show some particular examples below.
Picture 5
Using the unit circle, we have determined
following values:
Exactly:
Picture 6
Using the unit circle, we have determined
following values:
Exactly:
Of course, we can determine the values of sine and cosine for angles whose size is given in arc degree.
Exactly:

97
TRIGONOMETRICKÉ FUNKCE – SINUS A KOSINUS
K zavedení a definování funkcí sinus a kosinus pro libovolný úhel si nejprve zvolíme jednotkovou kružnici.
Tedy kružnici o poloměru 1 jednotka.
Pomocí této jednotkové kružnice určíme hodnoty funkce sinus a kosinus konkrétního úhlu.
Sestrojme si tedy libovolný orientovaný úhel o velikosti α,
Tento úhel umístěme do jednotkové kružnice a soustavy souřadnic tak, že počáteční rameno
AV bude kladná poloosa x v soustavě souřadnic. Existuje jen jedno takové umístění (Picture
2).
Koncové rameno VB úhlu
protne kružnici
v jediném bodě.
Tento průsečík označme M.
Toto můžete vidět na
Picture 3.
Bodu M můžeme jednoznačně přiřadit jeho souřadnice
Určení hodnoty funkce sinus a kosinus našeho
úhlu α není nic jiného než určení těchto
souřadnic bodu M.
Druhou souřadnici bodu M jednotkové kružnice
na koncovém rameni orientovaného úhlu
nazýváme sinus α a jeho první souřadnici
nazýváme kosinus α, značíme je sin , cos .
sin
cos
M
M
y
x
, pro každé R .
SINUS
Funkcí sinus se nazývá funkce na množině R, kterou je každému číslu R přiřazeno číslo Mx .
KOSINUS
Funkcí kosinus se nazývá funkce na množině R, kterou je každému číslu R přiřazeno číslo My .
Obrázek 8 Obrázek 9
Obrázek 7
Obrázek 10

98
Stejným způsobem, který jsme popsali výše pro nějaký obecný úhel α, můžeme pomocí jednotkové kružnice
určit hodnotu funkce sinus a kosinus pro libovolný konkrétní orientovaný úhel.
Vždy určíme základní velikost úhlu a tento úhel umístíme do jednotkové kružnice.
Níže uvedeme několik konkrétních příkladů.
Obrázek 11
Pomocí jednotkové kružnice jsme určili
následující hodnoty.
Přesně:
Obrázek 12
Pomocí jednotkové kružnice jsme určili
následující hodnoty:
Přesně:
Samozřejmě můžeme určit hodnoty funkce sinus a kosinus i pro úhly, které mají velikost dánu v obloukové
míře.
Přesně:
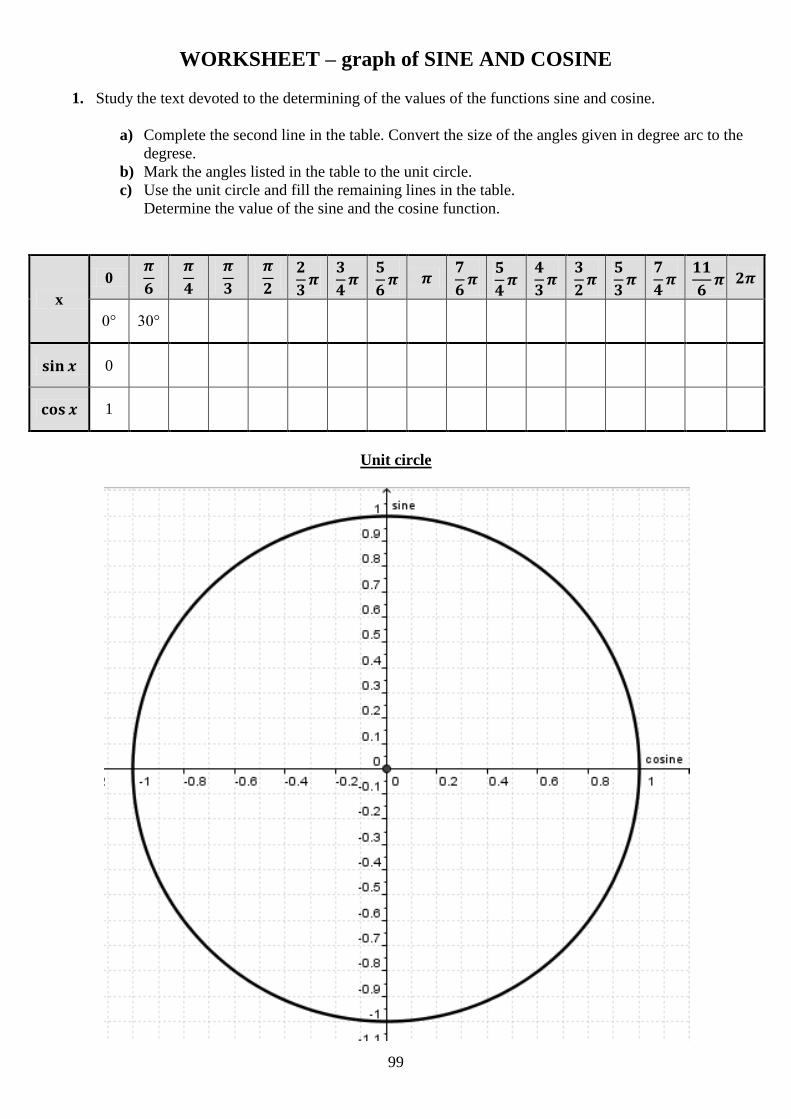
99
WORKSHEET – graph of SINE AND COSINE
1. Study the text devoted to the determining of the values of the functions sine and cosine.
a) Complete the second line in the table. Convert the size of the angles given in degree arc to the
degrese.
b) Mark the angles listed in the table to the unit circle.
c) Use the unit circle and fill the remaining lines in the table.
Determine the value of the sine and the cosine function.
x
0
0° 30°
0
1
Unit circle

100
2. Use data in the table and construct a graph of sine (cosine) in the Cartesian coordinate system.
Apply the values of the angle (in radians) to the x-axis.
Appropriate value of the sine function is always applied to the axis y.
Example: On the graph of the sine function there is a point X with coordinates.
3. Add values in the table below. Use these values in your cunstruction of the graph of sine.
You need always specify the basic angle while determining these values.
x
-90° -180° 360°
basic
angle
0
-1 0
0 1
4. Construct the graph of the sine (cosine) function.
You can use the Cartesian coordinate system in the attached file.

101
Graph:

102
PRACOVNÍ LIST – GRAF SINU A KOSINU
1. Prostudujte text věnovaný určování hodnot funkcí sinus a kosinus.
a) Doplňte druhý řádek tabulky. Převěďte obloukovou míru úhlu na míru stupňovou.
b) Vyznačte úhly zapsané v tabulce na jednotkové kružnici.
c) S využitím jednotkové kružnice doplňte zbylé řádky tabulky.
Určete hodnoty funkcí sinus a cosinus.
x
0
0° 30°
0
1
Jednotková kružnice

103
2. Využijte hodnoty z tabulky a sestrojte graf sinu (kosinu) v Kartézské soustavě souřadnic.
Hodnoty úhlu v obloukové míře vyznačte na osu x.
Zaokrouhlené hodnoty funkcí sinus a kosinus vždy znázorněte na osu y.
Příklad: Na grafu funkce sinus je vyznačen bod X o souřadnicích
3. Doplňte hodnoty do tabulky níže. Tyto hodnoty využijte při konstrukci grafu funkce sinu.
Při určování těchto hodnot vždy určete základní velikost úhlu.
x
-90° -180° 360°
zákl.
velikost
0
-1 0
0 1
4. Sestrojte graf funkce sinus (kosinus).
Využijte soustavu souřadnic z přiloženého souboru.

104
Graf:

105
ABSOLUTE VALUE
In this worksheet you will learn a new term. It is an absolute value. You will also try to give a definition of
this term. In the next worksheet you will learn how to work with an absolute value function.
Geometrical interpretation of absolute value
Before making a definition of the absolute value we will first try to explain the meaning of absolute value on
the numerical axis.
1. Mark following numbers on the numerical axis.
1; -1; 4; -4; 7; -7; 5,5;-5,5
2. Comlete these statements.
a) The distance of number 1 from the coordinate origin is/are …… unit/units.
b) The distance of number -1 from the coordinate origin is/are …… unit/units.
c) The distance of number 4 from the coordinate origin is/are …… unit/units.
d) The distance of number -4 from the coordinate origin is/are …… unit/units.
e) The distance of number 7 from the coordinate origin is/are …… unit/units.
f) The distance of number -7 from the coordinate origin is/are …… unit/units.
g) The distance of number 5,5 from the coordinate origin is/are …… unit/units.
h) The distance of number-5,5 from the coordinate origin is/are …… unit/units.
The bsolute value of a real number is connected with the distance of this real number from zero.
THE ABSOLUTE VALUE OF EVERY REAL NUMBER IS EQUAL TO THE DISTANCE BETWEEN THIS
NUMBER AND THE COORDINATE ORIGIN ON THE NUMERICAL AXIS.
A symbol a is used for annotation of the absolute value.
We can write findings from example 2 with using following equations (complete all empty spaces):
a) 1 1
b) 1 1
c) 4 4
d) 4
e) 7
f) 7
g) 5,5
h) 5,5
Now try to complete a definition of the absolute value:
THE DEFINITION OF THE ABSOLUTE VALUE a OF A REAL NUMBER a IS:
IF 0a , THEN a ……,
IF 0a , THEN a …… .
The absolute value of the non-negative number a is equal to …. , the absolute value of the negative
number a is egual to a opposite number which is written ……..
So for every real number we can notice: |a| 0
(fill in the gap with the right sign of inequality)

106
3. Calculate:
a) 105
b) 15 ( 3)
c) 2 9
d) 7 5 8
e) 2 2
f) 1 2
4. Mark on the numerical axis all numbers which are the solutions of these equations.
a) 5x __________________________________________________________________
b) 5x __________________________________________________________________
c) 3x __________________________________________________________________
d) 2x __________________________________________________________________
5. Calculate:
a) 1 3
3 1
b) 4 6
6 4
c)
Look at the previous exercise once more!
Each pair of equations have the same solutions. Is it possible that also these types of absolute value have
some geometrical interpretation?
Mark numbers 1 and 3 on the numerical axis:
Mark numbers 3 and 7 on the numerical axis:
What is the geometrical interpretation of the absolute value of the difference between numbers 1 and 3?
( 1 3 )?
…………………………………………………………………………………………(Write your idea.)
THE DISTANCE BETWEEN REAL NUMBERS a, b ON THE NUMERICAL AXIS IS EQUAL
TO …………. ,
or ……….….
6. Mark on the numerical axis all numbers which are the solutions of these equations:
a) 1 2x
b) 6 1x
c) 4 1x
d) 4 1x
e) 1 5x

107
ABSOLUTNÍ HODNOTA
V tomto pracovním listu se seznámíme s dalším novým matematickým pojmem.Tímto pojmem je absolutní
hodnota. Sami si zkusíte vyslovit i definici absolutní hodnoty.
Geometrická interpretace absolutní hodnoty:
Před vyslovením definice si nejprve zkusíme vysvětlit význam absolutní hodnoty na číselné ose.
1. Na danou číselnou osu znázorněte obrazy následujících čísel:
1; -1; 4; -4; 7; -7; 5,5;-5,5
2. Doplňte na vynechaná místa správné údaje:
a) Vzdálenost obrazu čísla 1 od počátku je/jsou …… jednotek/jednotky.
b) Vzdálenost obrazu čísla -1 od počátku je/jsou …… jednotek/jednotky.
c) Vzdálenost obrazu čísla 4 od počátku je/jsou …… jednotek/jednotky.
d) Vzdálenost obrazu čísla -4 od počátku je/jsou …… jednotek/jednotky.
e) Vzdálenost obrazu čísla 7 od počátku je/jsou …… jednotek/jednotky.
f) Vzdálenost obrazu čísla -7 od počátku je/jsou …… jednotek/jednotky.
g) Vzdálenost obrazu čísla 5,5 od počátku je/jsou …… jednotek/jednotky.
h) Vzdálenost obrazu čísla -5,5 od počátku je/jsou …… jednotek/jednotky.
Absolutní hodnota reálného čísla souvisí se vzdáleností jeho obrazu od počátku na číselné ose.
ABSOLUTNÍ HODNOTA KAŽDÉHO REÁLNÉHO ČÍSLA JE ROVNA VZDÁLENOSTI OBRAZU
TOHOTO ČÍSLA OD POČÁTKU NA ČÍSELNÉ OSE.
Absolutní hodnotu reálného čísla a značíme a .
Závěry ze cvičení 2 tedy můžeme zapsat (doplňte správné hodnoty na vynechaná místa):
a) 1 1
b) 1 1
c) 4 4
d) 4
e) 7
f) 7
g) 5,5
h) 5,5
Pokuste se nyní doplnit a vyslovit definici absolutní hodnoty.
ABSOLUTNÍ HODNOTU a REÁLNÉHO ČÍSLAO a DEFINUJEME TAKTO:
JE-LI 0a , PAK a ……,
JE-LI 0a , PAK a …… .
Absolutní hodnota nezáporného čísla a je tedy rovna číslu …. , absolutní hodnota záporného čísla a je
rovna ……………………… číslu, které zapíšeme………………..
Pro každé reálné číslo a tedy platí: |a| 0
(doplňte správně znak nerovnosti

108
3. Vypočítejte:
a) 105
b) 15 ( 3)
c) 2 9
d) 7 5 8
e) 2 2
f) 1 2
4. Na číselné ose znázorněte všechna reálná čísla, pro něž platí:.
a) 5x __________________________________________________________________
b) 5x __________________________________________________________________
c) 3x __________________________________________________________________
d) 2x __________________________________________________________________
5. Vypočítejte:
a) 1 3
3 1
b) 4 6
6 4
c)
Pořádně se na předchozí příklad ještě jednou podívejte!
Vždy ve dvojicích příkladů vychází stejné výsledky! Nebude mít i tento zápis s absolutní hodnotou
nějaký geometrický význam?
Znázorněte na číselnou osu obraz čísla 1 a obraz čísla 3. 3:
Znázorněte na číselnou osu obraz čísla 4 a obraz čísla 6:
Jaký má podle vás geometrický význam absolutní hodnota rozdílu čísel 1 a 3? ( 1 3 )?
………………………………………………………………………………(Zapište svoji myšlenku.)
VZDÁLENOST OBRAZŮ REÁLNÝCH ČÍSEL a, b NA ČÍSELNÉ OSE JE ROVNA …………. ,
resp. ……….….
6. Na číselné ose znázorněte obrazy všech reálných čísel, pro která platí:
f) 1 2x
g) 6 1x
h) 4 1x
i) 4 1x
j) 1 5x

109
AXIAL SYMMETRY
There is a line o.
AXIAL SYMMETRY is an identical mapping O(o) which assigns:
1. each point to point X‘ so that the line o is the axis of the segment XX‘.
2. each point to point .
The line o is called the axis of symmetry.
1. Find and construct images of points C,D,E in axial symmetry
2. Find and construct the image of lines a and b in axial symmetry
Image of line a, which is not parallel to the axis of symmetry, is a straight line a‘ which
…………………………………………………………………………………………………
Image of line b, which is parallel to the axis of symmetry, is a straight line b‘ which
…………………………………………………………………………………………………
Axial symmetry ……….. (has/doesn´t have) self-conjugate points.
Lines, that …………………………………………………………. are self-conjugate.

110
CENTRAL SYMMETRY
There is a point S.
CENTRAL SYMMETRY is an identical mapping S(S) which assigns:
1. each point to point X‘ so that the line S is the the center of the segment XX‘.
2. each point to point .
The point S is called the center symmetry.
1. Find and construct images of points C,D,E in central symmetry
2. Find and construct the image of lines a and b in in central symmetry
Image of line a, which is passing through the center of symmetry, is a straight line a‘ which
…………………………………………………………………………………………
Image of line b, which is not passing through the center of symmetry, is a straight line b‘ which
…………………………………………………………………………………………
Central symmetry ……….. (has/doesn´t have) self-conjugate points. …………………………
Lines, that …………………………………………………………. are self-conjugate.

111
OSOVÁ SOUMĚRNOST
Je dána přímka o.
OSOVÁ SOUMĚRNOST je shodné zobrazení O(o), které přiřazuje:
1. každému bodu bod X‘ tak, že přímka o je osou úsečky XX‘.
2. každému bodu bod .
Přímka o se nazývá osa souměrnosti.
3. V osové souměrnosti sestrojte obrazy bodů C, D, E.
4. V osové souměrnosti sestrojte obrazy přímek a, b.
Obrazem přímky a, která je různoběžná s osou souměrnosti, je přímka a‘,
která……………………………………………………………………………………………
Obrazem přímky b, která je rovnoběžná s osou symetrie, je přímka b‘, která
…………………………………………………………………………………………………
Osová souměrnost ……….. (má/nemá) samodružné body.
Přímky, které …………………………………………………………. jsou samodružné.
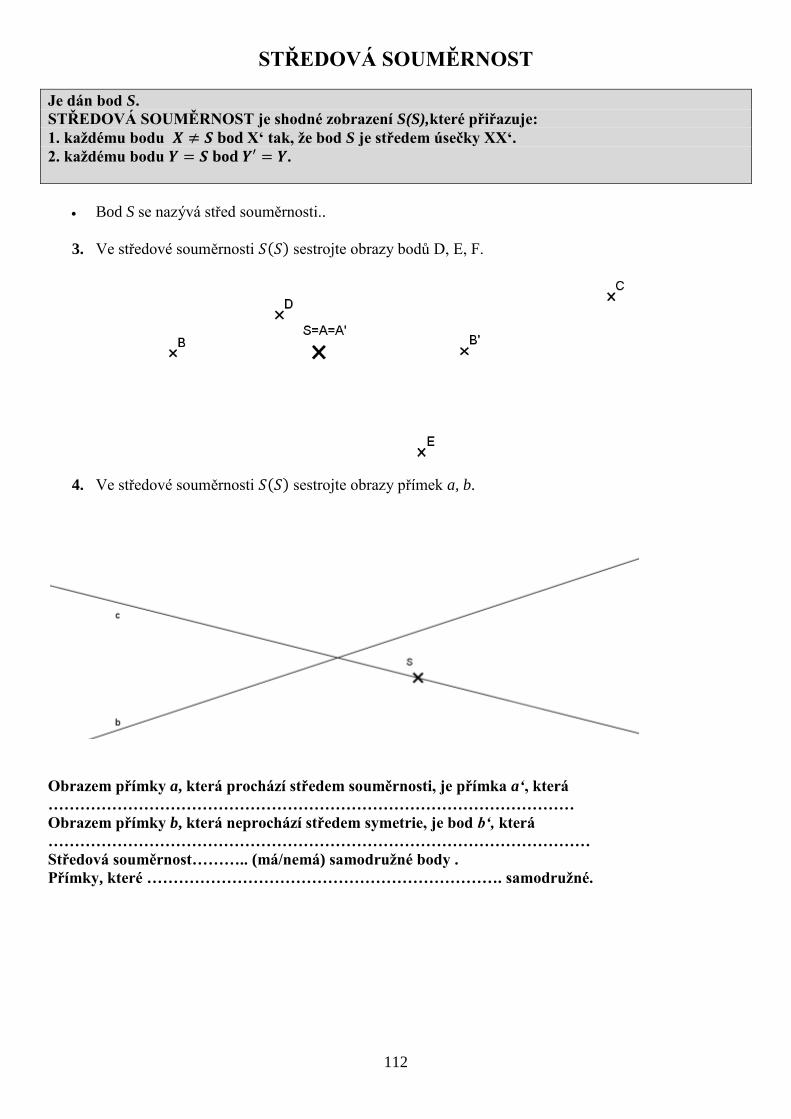
112
STŘEDOVÁ SOUMĚRNOST
Je dán bod S.
STŘEDOVÁ SOUMĚRNOST je shodné zobrazení S(S),které přiřazuje:
1. každému bodu bod X‘ tak, že bod S je středem úsečky XX‘.
2. každému bodu bod .
Bod S se nazývá střed souměrnosti..
3. Ve středové souměrnosti sestrojte obrazy bodů D, E, F.
4. Ve středové souměrnosti sestrojte obrazy přímek a, b.
Obrazem přímky a, která prochází středem souměrnosti, je přímka a‘, která
………………………………………………………………………………………
Obrazem přímky b, která neprochází středem symetrie, je bod b‘, která
…………………………………………………………………………………………
Středová souměrnost……….. (má/nemá) samodružné body .
Přímky, které …………………………………………………………. samodružné.
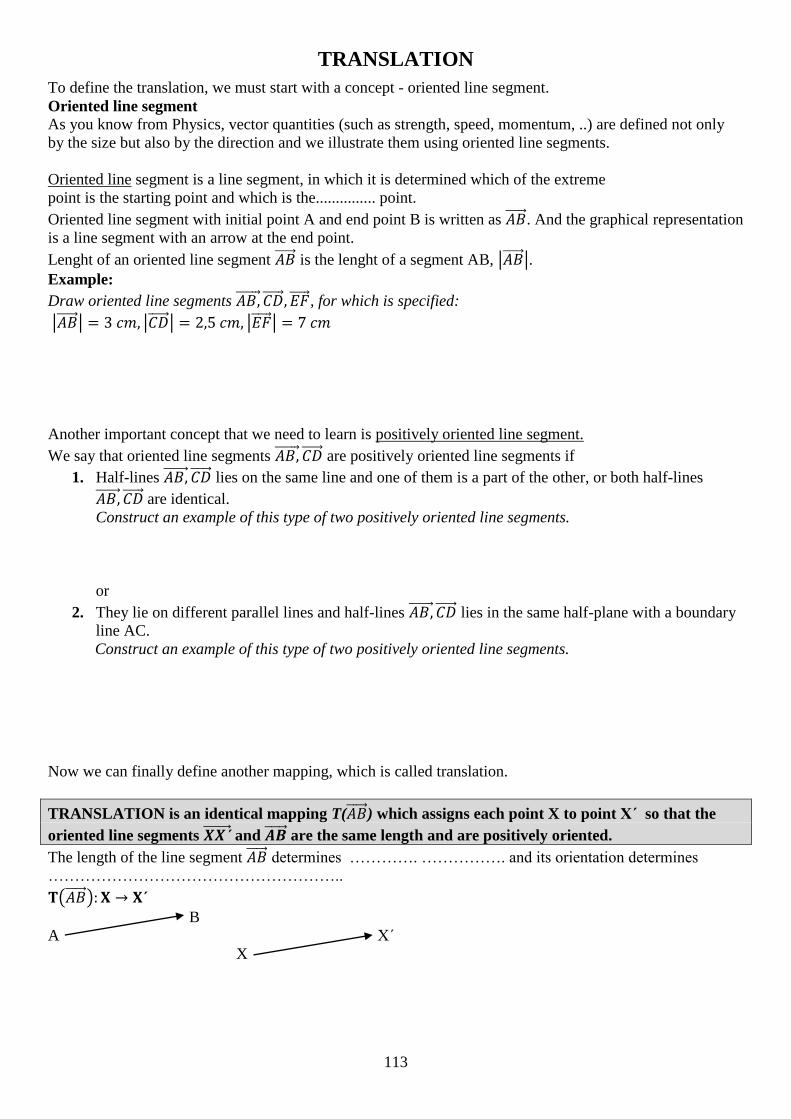
113
TRANSLATION
To define the translation, we must start with a concept - oriented line segment.
Oriented line segment
As you know from Physics, vector quantities (such as strength, speed, momentum, ..) are defined not only
by the size but also by the direction and we illustrate them using oriented line segments.
Oriented line segment is a line segment, in which it is determined which of the extreme
point is the starting point and which is the............... point.
Oriented line segment with initial point A and end point B is written as . And the graphical representation
is a line segment with an arrow at the end point.
Lenght of an oriented line segment is the lenght of a segment AB, . Example:
Draw oriented line segments , for which is specified:
Another important concept that we need to learn is positively oriented line segment.
We say that oriented line segments are positively oriented line segments if
1. Half-lines lies on the same line and one of them is a part of the other, or both half-lines
are identical.
Construct an example of this type of two positively oriented line segments.
or
2. They lie on different parallel lines and half-lines lies in the same half-plane with a boundary
line AC.
Construct an example of this type of two positively oriented line segments.
Now we can finally define another mapping, which is called translation.
TRANSLATION is an identical mapping T( ) which assigns each point X to point X´ so that the
oriented line segments and are the same length and are positively oriented.
The length of the line segment determines …………. ……………. and its orientation determines
………………………………………………..
´
B
A X´
X

114
3. Find and conctruct images of points C,D,E,F in translation T( ).
B
+F
A
+ C
+D
+ E
4. Find and conctruct the image of line p in translation T( ).
A p
B
5. Find and conctruct the images of following formations in translation T( ).
B
A
Image of line p, which is not parallel to the direction of translation, is a straight line p´, which
……………………………………………..
Translation ……… (has/doesn´t have) self-conjugate points.
Lines, that …………………………………………………………. are self-conjugate.
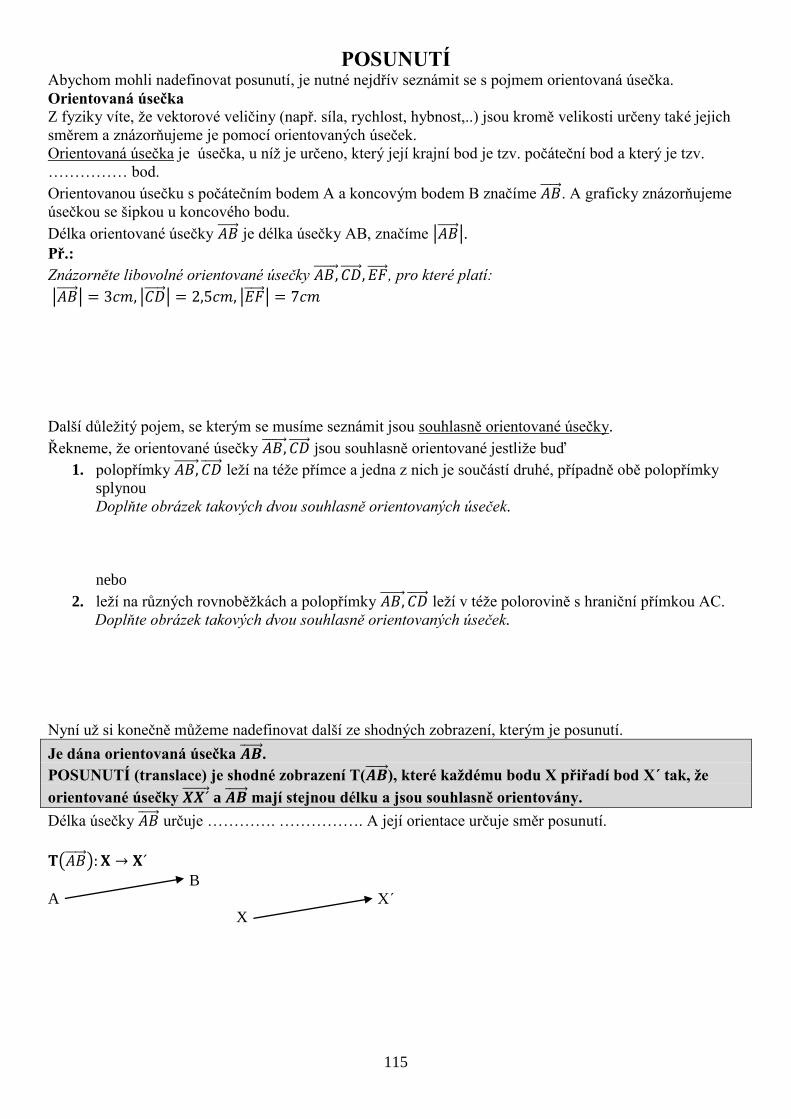
115
POSUNUTÍ Abychom mohli nadefinovat posunutí, je nutné nejdřív seznámit se s pojmem orientovaná úsečka.
Orientovaná úsečka
Z fyziky víte, že vektorové veličiny (např. síla, rychlost, hybnost,..) jsou kromě velikosti určeny také jejich
směrem a znázorňujeme je pomocí orientovaných úseček.
Orientovaná úsečka je úsečka, u níž je určeno, který její krajní bod je tzv. počáteční bod a který je tzv.
…………… bod.
Orientovanou úsečku s počátečním bodem A a koncovým bodem B značíme . A graficky znázorňujeme
úsečkou se šipkou u koncového bodu.
Délka orientované úsečky je délka úsečky AB, značíme . Př.:
Znázorněte libovolné orientované úsečky , pro které platí:
Další důležitý pojem, se kterým se musíme seznámit jsou souhlasně orientované úsečky.
Řekneme, že orientované úsečky jsou souhlasně orientované jestliže buď
1. polopřímky leží na téže přímce a jedna z nich je součástí druhé, případně obě polopřímky
splynou
Doplňte obrázek takových dvou souhlasně orientovaných úseček.
nebo
2. leží na různých rovnoběžkách a polopřímky leží v téže polorovině s hraniční přímkou AC.
Doplňte obrázek takových dvou souhlasně orientovaných úseček.
Nyní už si konečně můžeme nadefinovat další ze shodných zobrazení, kterým je posunutí.
Je dána orientovaná úsečka .
POSUNUTÍ (translace) je shodné zobrazení T( ), které každému bodu X přiřadí bod X´ tak, že
orientované úsečky a mají stejnou délku a jsou souhlasně orientovány.
Délka úsečky určuje …………. ……………. A její orientace určuje směr posunutí.
B
A X´
X

116
1. Je dáno posunutí T( ). Najděte v tomto posunutí obrazy daných bodů C,D,E,F.
B
+F
A
+ C
+D
+ E
2. Je dáno posunutí T( ). Najděte v tomto posunutí obraz přímky p.
A p
B
3. Je dáno posunutí T( ). Najděte v tomto posunutí obrazy daných útvarů:
B
A
Obrazem přímky p, která není rovnoběžná se směrem posunutí je přímka p´, která
……………………………………………..
Posunutí ……… (má/nemá) samodružné body.
Samodružné jsou přímky, které ………………………………………………………….

117
ORIENTED ANGLE
To define the rotation, we must start with the term oriented angle.
Oriented angle
Oriented angle is the angle in which it is determined which arm is the initial arm. The other arm at the end
of the angle is called terminal arm.
Oriented angle can be described as the starting and ending position of the ray that rotates around its starting
point. Oriented angle is therefore an ordered pair of rays ( ) with the same starting point V.
Oriented angle is written as . This symbol indicates that VA is the initial arm, VB is the terminal arm
and V is the vertex of an angle.
Picture 1 shows the oriented angle
with the initial arm VA and the terminal
arm VB.
Picture 2 shows the oriented angle
with the initial arm VB and the terminal
arm VA.
In these pictures we can also see how to
represent the oriented angle. To the arch,
which characterizes angle, it is
necessary to assign an arrow that points
from the starting arm to the terminal
arm.
Size of the oriented angle
The initial and terminal arm can be compared to the clock hands. The size of the
oriented angle is the angle which describes the initial arm VA
counterclockwise around the vertex V so that the starting arm VA overlays the
terminal arm VB.
Angle which describes ray in this rotation is called the basic angle.
The movement of the starting arm can be: positive negative
– a counterclockwise rotation - a clockwise rotation
-A positive angle is formed by a counterclockwise
rotation of the initial arm.
– A negative angle is formed by a clockwise
rotation of the initial arm.
THE SIZE OF THE ORIENTED ANGLE DETERMINES OF HOW MANY DEGREES MUST TURN THE INITIAL ARM IN
A POSITIVE OR NEGATIVE SENSE (POSITIVE OR NEGATIVE ANGLE) TO OVERLAY THE TERMINAL ARM.
As you can see in previous examples, the size of one oriented angle can be
expressed in several ways, these ways are endless.
When entering the final position the initial arm can make more than one
rotation.
The size of the oriented angle in the picture on the right can be determined
as 110°, also as 470° or 1190°.
Picture 1 Picture 2
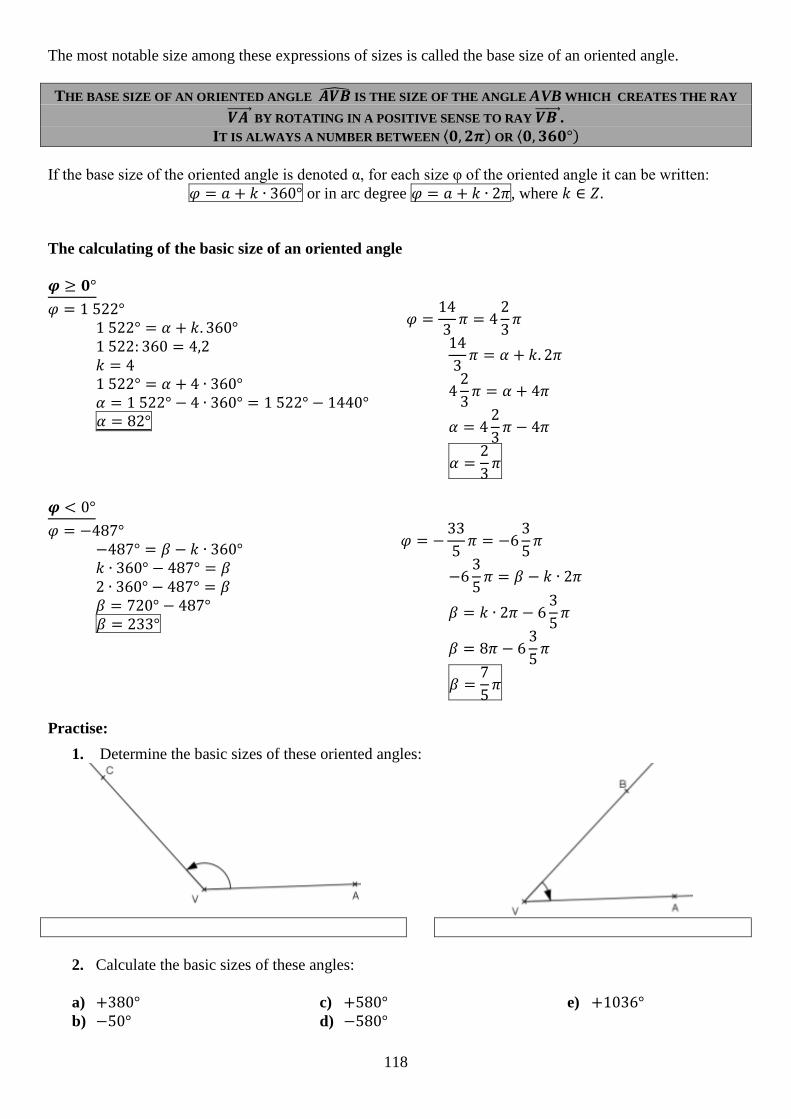
118
The most notable size among these expressions of sizes is called the base size of an oriented angle.
THE BASE SIZE OF AN ORIENTED ANGLE IS THE SIZE OF THE ANGLE AVB WHICH CREATES THE RAY
BY ROTATING IN A POSITIVE SENSE TO RAY . IT IS ALWAYS A NUMBER BETWEEN OR
If the base size of the oriented angle is denoted α, for each size φ of the oriented angle it can be written:
or in arc degree , where
The calculating of the basic size of an oriented angle
Practise:
1. Determine the basic sizes of these oriented angles:
2. Calculate the basic sizes of these angles:
a) b)
c) d)
e)

119
ORIENTOVANÝ ÚHEL
Abychom mohli nadefinovat otočení, je nutné nejdřív seznámit se s pojmem orientovaný úhel.
Orientovaný úhel
Orientovaný úhel je úhel, u něhož je určeno, které jeho rameno je tzv. počáteční rameno; druhé rameno je
jeho koncovým ramenem.
Orientovaný úhel si můžeme představit jako počáteční a koncovou polohu polopřímky, která se otáčí kolem
svého počátku. Orientovaný úhel je tedy uspořádaná dvojice polopřímek ( )se společným počátkem
V.
Orientovaný úhel značíme . Z tohoto vyplývá, že VA je počáteční rameno, VB je koncové rameno a
V je vrchol úhlu.
Na obrázku 1 vidíme orientovaný úhel
s počátečním ramenem VA a
koncovým ramenem VB.
Na obrázku 2 můžeme vidět orientovaný
úhel s počátečním ramenem VB a
koncovým ramenem VA.
Na obrázcích lze také vidět, jak
orientovaný úhel znázorňujeme.
K oblouku, který vyznačuje úhel, je
nutné přiřadit šipku, která směřuje od
počátečního ramene ke koncovému.
Velikost orientovaného úhlu
Počáteční a koncové rameno orientovaného úhlu si lze představit jako hodinové
ručičky. Velikostí orientovaného úhlu je pak úhel, který opíše počáteční rameno
VA proti směru chodu hodinových ručiček kolem vrcholu V tak, aby počáteční
rameno VA splynulo s koncovým ramenem VB.
Velikost úhlu, který opíše polopřímka při tomto otáčení se nazývá základní
velikost orientovaného úhlu.
K pohybu počáteční polopřímky může dojít: v kladném smyslu v záporném smyslu
– proti směru chodu hodinových ručiček -po směru chodu hodinových ručiček
-Pokud otáčíme počátečním ramenem v kladném
smyslu, je velikost orientovaného úhlu kladná.
–. Pokud otáčíme počátečním ramenem v záporném
smyslu, je velikost orientovaného úhlu záporná.
VELIKOST ORIENTOVANÉHO ÚHLU UDÁVÁ, O KOLIK STUPŇŮ MUSÍME OTOČIT POČÁTEČNÍM RAMENEM
V KLADNÉM ČI ZÁPORNÉM SMYSLU (PODLE ZNAMÉNKA ÚHLU), ABY POČÁTEČNÍ RAMENO SPLYNULO
S KONCOVÝM RAMENEM.
Jak je vidět z předchozích příkladů, lze velikost jednoho orientovaného úhlu
vyjádřit více způsoby, těchto způsobů je nekonečně mnoho.
Počáteční rameno může při přechodu do polohy koncového ramene vykonat
více otáček.
Velikost orientovaného úhlu na obrázku vpravo můžeme vyjádřit jako 110°,
ale také 470°nebo 1190°.
Obr. 3 Obr. 4
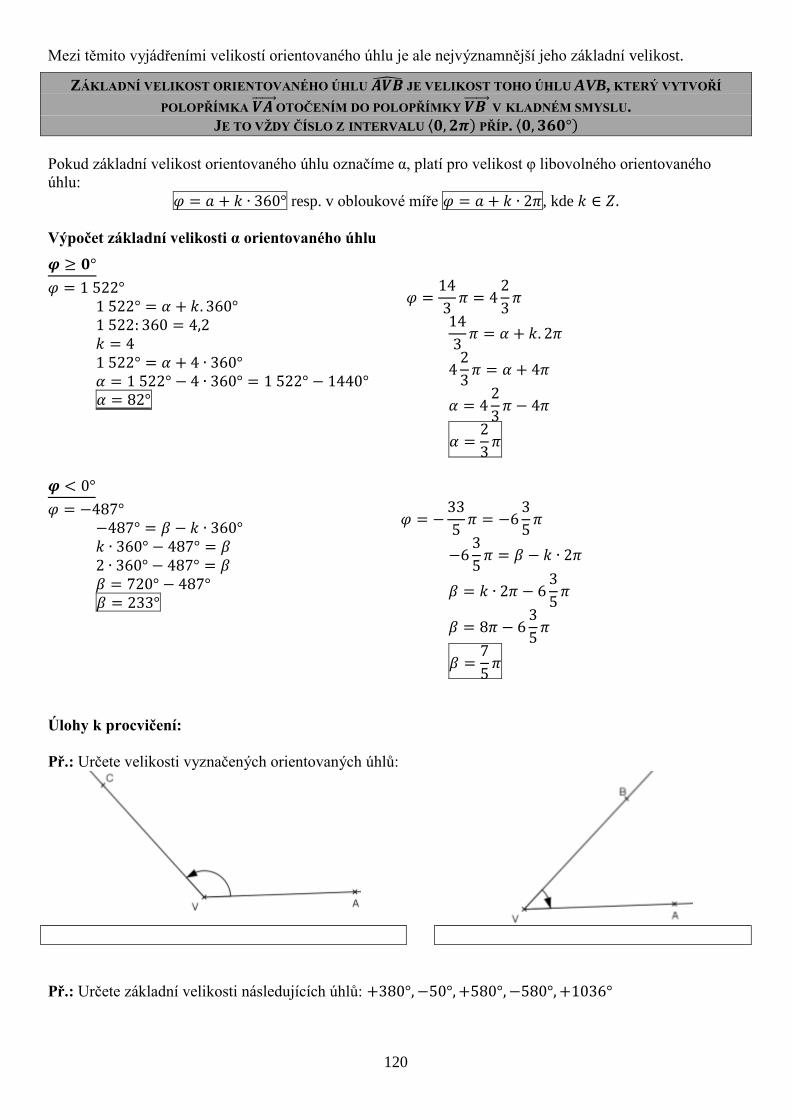
120
Mezi těmito vyjádřeními velikostí orientovaného úhlu je ale nejvýznamnější jeho základní velikost.
ZÁKLADNÍ VELIKOST ORIENTOVANÉHO ÚHLU JE VELIKOST TOHO ÚHLU AVB, KTERÝ VYTVOŘÍ
POLOPŘÍMKA OTOČENÍM DO POLOPŘÍMKY V KLADNÉM SMYSLU.
JE TO VŽDY ČÍSLO Z INTERVALU PŘÍP.
Pokud základní velikost orientovaného úhlu označíme α, platí pro velikost φ libovolného orientovaného
úhlu:
resp. v obloukové míře , kde
Výpočet základní velikosti α orientovaného úhlu
Úlohy k procvičení:
Př.: Určete velikosti vyznačených orientovaných úhlů:
Př.: Určete základní velikosti následujících úhlů:

121
ROTACE 1. ČÁST - ORIENTOVANÝ ÚHEL
Abychom mohli nadefinovat otočení, je nutné nejdřív seznámit se s pojmem orientovaný úhel.
Orientovaný úhel
Orientovaný úhel je úhel, u něhož je určeno, které jeho rameno je tzv. počáteční rameno; druhé rameno je
jeho koncovým ramenem.
Orientovaný úhel si můžeme představit jako počáteční a koncovou polohu polopřímky, která se otáčí kolem
svého počátku. Orientovaný úhel je tedy uspořádaná dvojice polopřímek ( )se společným počátkem
V.
Orientovaný úhel značíme . Z tohoto vyplývá, že VA je počáteční rameno, VB je koncové rameno a
V je vrchol úhlu.
Na obrázku 1 vidíme orientovaný úhel
s počátečním ramenem VA a
koncovým ramenem VB.
Na obrázku 2 můžeme vidět orientovaný
úhel s počátečním ramenem VB a
koncovým ramenem VA.
Na obrázcích lze také vidět, jak
orientovaný úhel znázorňujeme.
K oblouku, který vyznačuje úhel, je
nutné přiřadit šipku, která směřuje od
počátečního ramene ke koncovému.
Velikost orientovaného úhlu
Počáteční a koncové rameno orientovaného úhlu si lze představit jako hodinové
ručičky. Velikostí orientovaného úhlu je pak úhel, který opíše počáteční rameno
VA proti směru chodu hodinových ručiček kolem vrcholu V tak, aby počáteční
rameno VA splynulo s koncovým ramenem VB.
Velikost úhlu, který opíše polopřímka při tomto otáčení se nazývá základní velikost orientovaného úhlu.
K pohybu počáteční polopřímky může dojít: v kladném smyslu v záporném smyslu
– proti směru chodu hodinových ručiček -po směru chodu hodinových ručiček
-Pokud otáčíme počátečním ramenem v kladném
smyslu, je velikost orientovaného úhlu kladná.
–. Pokud otáčíme počátečním ramenem v záporném
smyslu, je velikost orientovaného úhlu záporná.
VELIKOST ORIENTOVANÉHO ÚHLU UDÁVÁ, O KOLIK STUPŇŮ MUSÍME OTOČIT POČÁTEČNÍM RAMENEM
V KLADNÉM ČI ZÁPORNÉM SMYSLU (PODLE ZNAMÉNKA ÚHLU), ABY POČÁTEČNÍ RAMENO SPLYNULO
S KONCOVÝM RAMENEM.
Jak je vidět z předchozích příkladů, lze velikost jednoho orientovaného úhlu
vyjádřit více způsoby, těchto způsobů je nekonečně mnoho.
Počáteční rameno může při přechodu do polohy koncového ramene vykonat
více otáček.
Obr. 5 Obr. 6
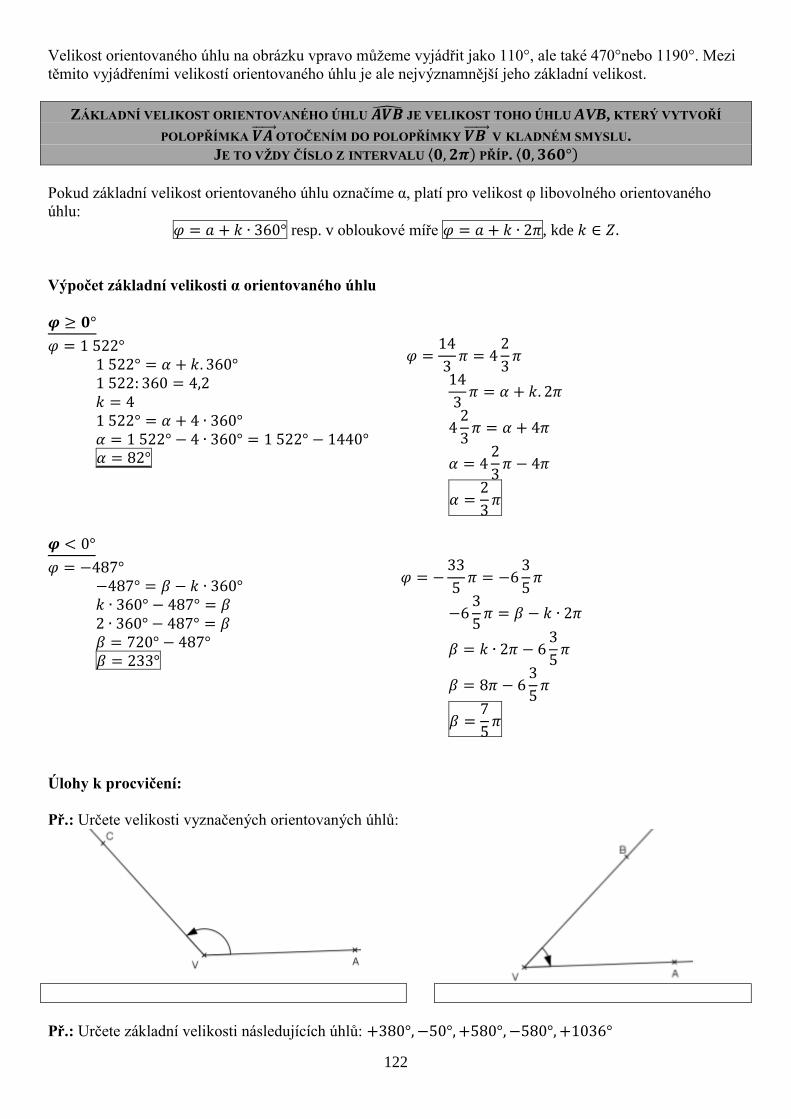
122
Velikost orientovaného úhlu na obrázku vpravo můžeme vyjádřit jako 110°, ale také 470°nebo 1190°. Mezi
těmito vyjádřeními velikostí orientovaného úhlu je ale nejvýznamnější jeho základní velikost.
ZÁKLADNÍ VELIKOST ORIENTOVANÉHO ÚHLU JE VELIKOST TOHO ÚHLU AVB, KTERÝ VYTVOŘÍ
POLOPŘÍMKA OTOČENÍM DO POLOPŘÍMKY V KLADNÉM SMYSLU.
JE TO VŽDY ČÍSLO Z INTERVALU PŘÍP.
Pokud základní velikost orientovaného úhlu označíme α, platí pro velikost φ libovolného orientovaného
úhlu:
resp. v obloukové míře , kde
Výpočet základní velikosti α orientovaného úhlu
Úlohy k procvičení:
Př.: Určete velikosti vyznačených orientovaných úhlů:
Př.: Určete základní velikosti následujících úhlů:

123
ROTATION
There is an oriented angle , which size is φ, and a point S
ROTATION is an identical mapping R(S,φ) which assigns
1. point S to point S.
2. each point to point X‘ so that and oriented angle size is φ.
Point S is called the center of rotation, oriented angle with size φ is the angle of rotation.
The procedure of constructing the image of a point in the rotation:
Find the image of point A in the rotation , if .
1.
There are points A and S.
To find the image of point A
in rotation R means to rotate
point A around point S by
75° counterclockwise.
2.
We construct ray .This
ray is the initial arm of
the oriented angle .
Then we construct also
the terminal arm of the
oriented angle , size
of this angle is 75°.
Futhermore, we know that
. In the center of rotation we
construct a circle with a
radius of .
3.
The image of point A is
the intersection of the
circle and the terminal
arm of the angle (we
rotated point A around
point S by 75° in the
positive sense).
Practice: Find images of points A, B, C, D, E, F , if .

124
1. Find images of lines p, q, r in the rotation .
2. Construct the image of an equilateral triangle ABC in the rotation a) S=T, where T is the center of gravity
b) S=C a) Solution: b) Solution:
3. In the rotation , if find images of points A,B,C,D
4. In the rotation , if find images of points A,B,C,D
Fill in gaps:
Rotation is ………………… (direct/indirect) identical mapping.
Rotation has…………………….. (how many) self-conjugated point/points.
Rotation ………….(has/doesn’t have) self-conjugated lines.
If the angle of rotation is then the rotation becomes
………………….
If the angle of rotation is then the rotation is ……………………

125
OTOČENÍ
Je dán orientovaný úhel , jehož jedna z velikostí je φ, a bod S
OTOČENÍ (rotace) je shodné zobrazení R(S,φ), které
1. bodu S přiřazuje bod S.
2. každému bodu přiřazuje bod X‘ tak, že a orientovaný úhel XSX‘ má velikost φ.
Bod S se nazývá střed otočení, orientovaný úhel o velikosti φ je úhel otočení.
Postup konstrukce obrazu bodu v rotaci:
V otočení , kde najděte obraz bodu A.
4.
Jsou dány body A a S.
Najít obraz bodu A v dané
rotaci R znamená otočit bod
A kolem bodu S o 75°proti
směru chodu hodinových
ručiček.
5.
Sestrojíme polopřímku
. Tato polopřímka je
počátečním ramenem
orientovaného úhlu ASA´.
Sestrojíme i koncové
rameno orientovaného
úhlu ASA´ o velikosti
+75°.
Dále víme, že . Ve středu rotace S tedy
opíšeme kružnici o poloměru
.
6.
Obraz bodu A je
průsečíkem kružnice a
koncového ramene úhlu.
(bod A jsem otočili kolem
bodu S o 75°v kladném
smyslu)
Příklad. V otočení , kde najděte obrazy bodů A,B,C,D,E,F.

126
4. Je dána rotace . Najděte v tomto otočení obrazy přímek p,q,r.
5. Je dána rotace . Najděte v tomto otočení obraz rovnostranného
trojúhelníka ABC, jestliže
c) S=T, kde T je těžiště
d) S=C c) Řešení: d) Řešení:
6. V otočení , kde najděte obrazy bodů A,B,C,D
7. V otočení , kde najděte obrazy bodů A,B,C,D
Doplňte vynechaná místa:
Otočení je ………………… (přímá/nepřímá) shodnost.
Otočení má…………………….. (počet) samodružný bod/samodružných bodů.
Otočení ………….(má/nemá) samodružné přímky.
Pro úhel otočení přejde otočení ve ……… souměrnost.
Pro úhel otočení je otočení …………………………….

127
POUŽITÁ LITERATURA:
Pomykalová Eva: Matematika pro gymnázia: Planimetrie. 3. vyd. Praha: Prometheus, 1997.
Odvárko Oldřich: Matematika pro gymnázia: Funkce. 2. vyd. Praha: Prometheus, 1994.
Odvárko Oldřich: Matematika pro gymnázia: Goniometrie. 2. vyd. Praha: Prometheus, 1997.
Bušek Ivan, Calda Emil: Matematika pro gymnázia: Základní poznatky z matematiky. 3. vyd. Praha:
Prometheus, 2002
Pomykalová Eva: Matematika pro gymnázia: Planimetrie. 3. vyd. Praha: Prometheus, 1997.
Polák Josef: Přehled středoškolské matematiky, 9.přepr.vyd. Praha:Prometheus, 2008
Petáková J.: Matematika, příprava k maturitě a k přijímacím zkouškám na vysoké školy. 1.vyd.
Praha: Prometheus, 2008.
Kubešová Naděžda: Matematika – přehled středoškolského učiva. 2.vyd. Praha: Vyuka.CZ:
Praha, 2007
Kubát Josef: Matematika, maturitní minimum – Sbírka úloh z matematiky pro střední školy. 1.vyd.
Praha: 1996.
Odvárko Oldřich: Základní poznatky, Matematika pro SOŠ. 1.vyd. Praha: Prometheus, 2008
Bušek Ivan: Řešené maturitní úlohy z matematiky. 3.vyd.,Praha:prometheus, 1999
Internetové zdroje:
http://www.sosmath.com/
http://www.ecourses.ou.edu/
http://www.intmath.com/
http://www.karlin.mff.cuni.cz
http://matematika-libverda.webnode.cz/
http://fyzika.jreichl.com/
http://ucebnice.krynicky.cz/