Embed Size (px)
Citation preview
Climate and Weather ReviewClimate and Weather Review
4 December 20094 December 2009
University of CaliforniaUniversity of California
Santa BarbaraSanta Barbara
Acknowledgements: most graphics from Climate Prediction Center
(CPC/NCEP/NOA)
OUTLINE
ENSO evolution last 30 days and seasonal outlooks
Madden-Julian Oscillation (MJO) evolution
Forecasts and Hazards weeks 1-2
Outlooks for next 30 days
Monsoons in Africa and South America
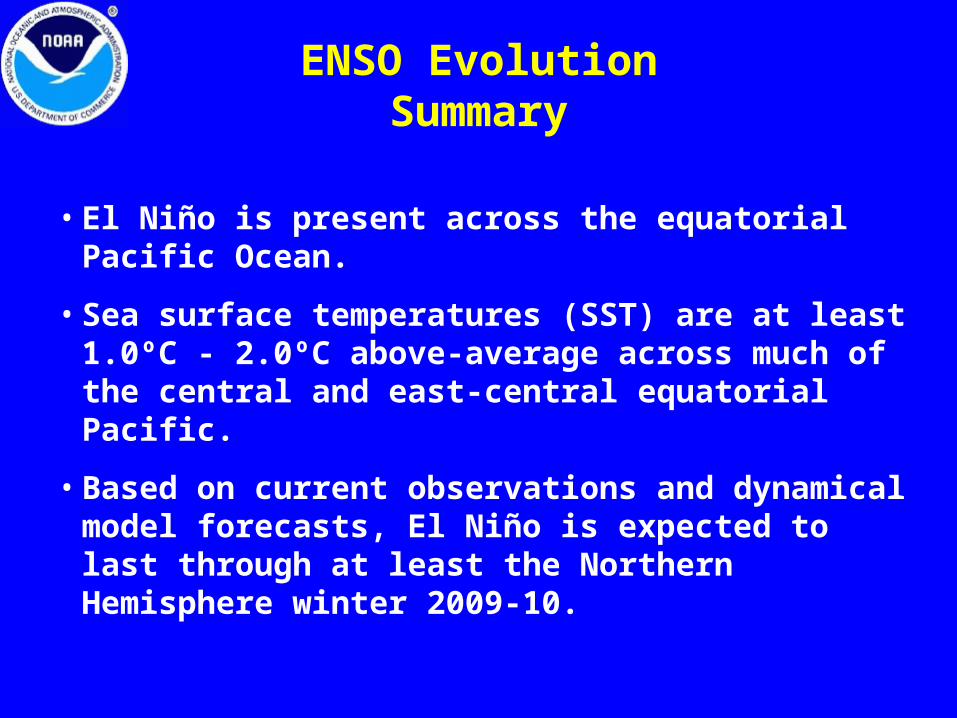
ENSO EvolutionSummary
• El Niño is present across the equatorial Pacific Ocean.
• Sea surface temperatures (SST) are at least 1.0ºC - 2.0ºC above-average across much of the central and east-central equatorial Pacific.
• Based on current observations and dynamical model forecasts, El Niño is expected to last through at least the Northern Hemisphere winter 2009-10.
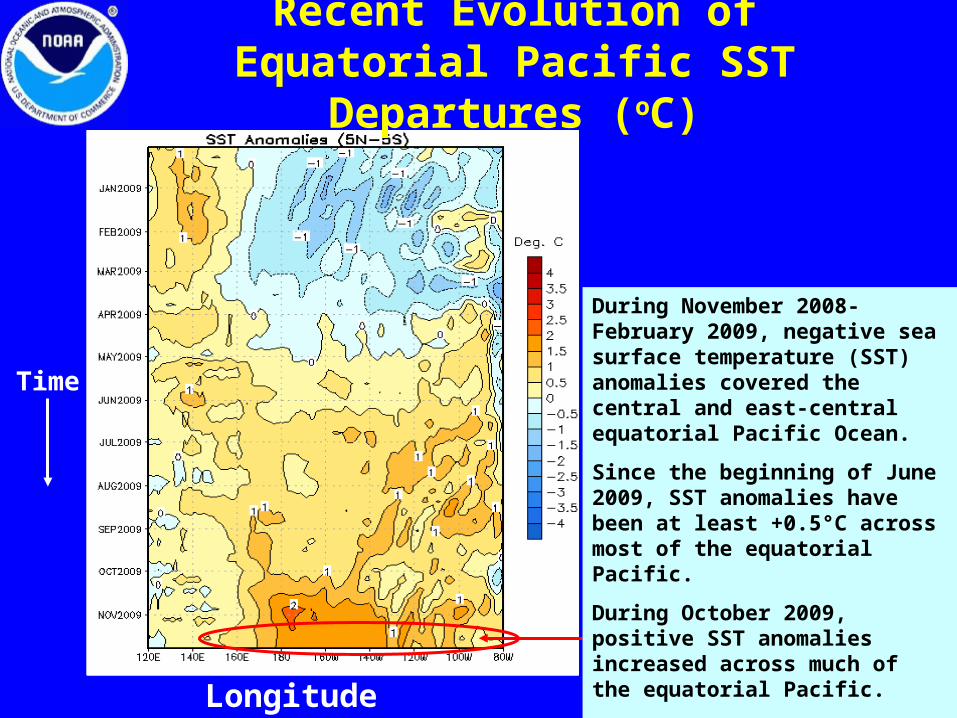
Recent Evolution of Equatorial Pacific SST Departures (oC)
Longitude
Time
During November 2008- February 2009, negative sea surface temperature (SST) anomalies covered the central and east-central equatorial Pacific Ocean.
Since the beginning of June 2009, SST anomalies have been at least +0.5°C across most of the equatorial Pacific.
During October 2009, positive SST anomalies increased across much of the equatorial Pacific.
Recently, positive SST anomalies remain nearly unchanged.

Niño Region SST Departures (oC) Recent Evolution
The latest weekly SST departures are:
Niño 4 1.6ºC
Niño 3.4 1.7ºC
Niño 3 1.3ºC
Niño 1+2 0.2ºC

SST Departures (oC) in the Tropical Pacific During the Last 4 Weeks
During the last 4-weeks, SSTs were at least 1.0°C above average across much of the equatorial Pacific and more than 2.0°C above average between 180° and 130°W.

Global SST Departures (oC)
During the last four weeks, equatorial SSTs were above-average across the Pacific and Indian Oceans. Also, above-average SSTs covered large areas of the Northern Hemisphere subtropics.

Weekly SST Departures (oC) for the Last Four Weeks
• During the last four weeks, positive SST anomalies persisted across the central and eastern equatorial Pacific Ocean.
• During the last 30 days, equatorial SST anomalies increased in some parts across the eastern Pacific.

• During October – mid November 2009, positive temperature anomalies at thermocline depth increased and expanded eastward across the eastern equatorial Pacific, in response to the downwelling phase of an oceanic Kelvin wave.
• The most recent period (below) shows a slight eastward expansion of positive anomalies in the equatorial Pacific near 50 -150m depth.
Sub-Surface Temperature Departures (oC) in the Equatorial Pacific
Most recent pentad analysisLongitude
Time

U.S. Temperature and Precipitation Departures During the Last 30 days
30-day (ending 28 Nov 2009) temperature departures (degree C)
30-day (ending 29 Nov 2009) % of average precipitation
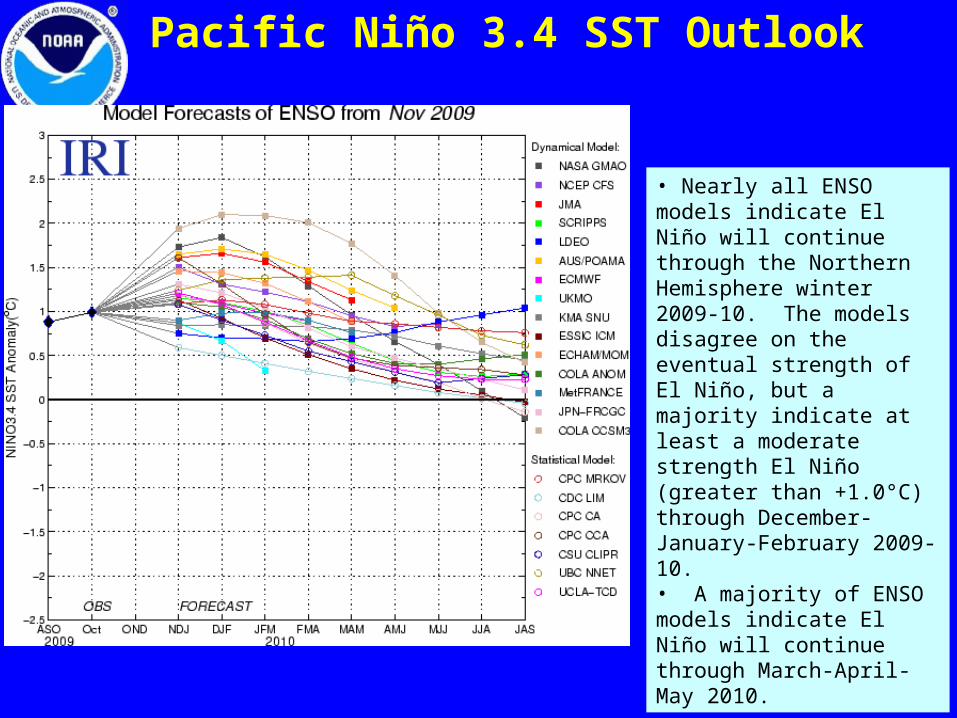
Pacific Niño 3.4 SST Outlook
• Nearly all ENSO models indicate El Niño will continue through the Northern Hemisphere winter 2009-10. The models disagree on the eventual strength of El Niño, but a majority indicate at least a moderate strength El Niño (greater than +1.0°C) through December-January-February 2009-10. • A majority of ENSO models indicate El Niño will continue through March-April-May 2010.
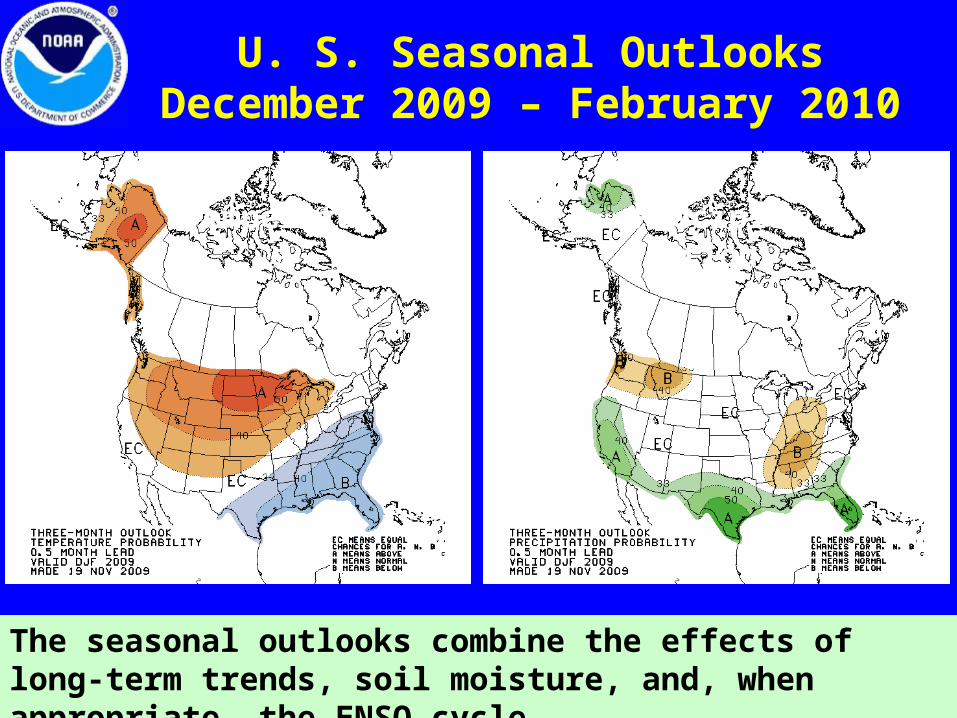
The seasonal outlooks combine the effects of long-term trends, soil moisture, and, when appropriate, the ENSO cycle.
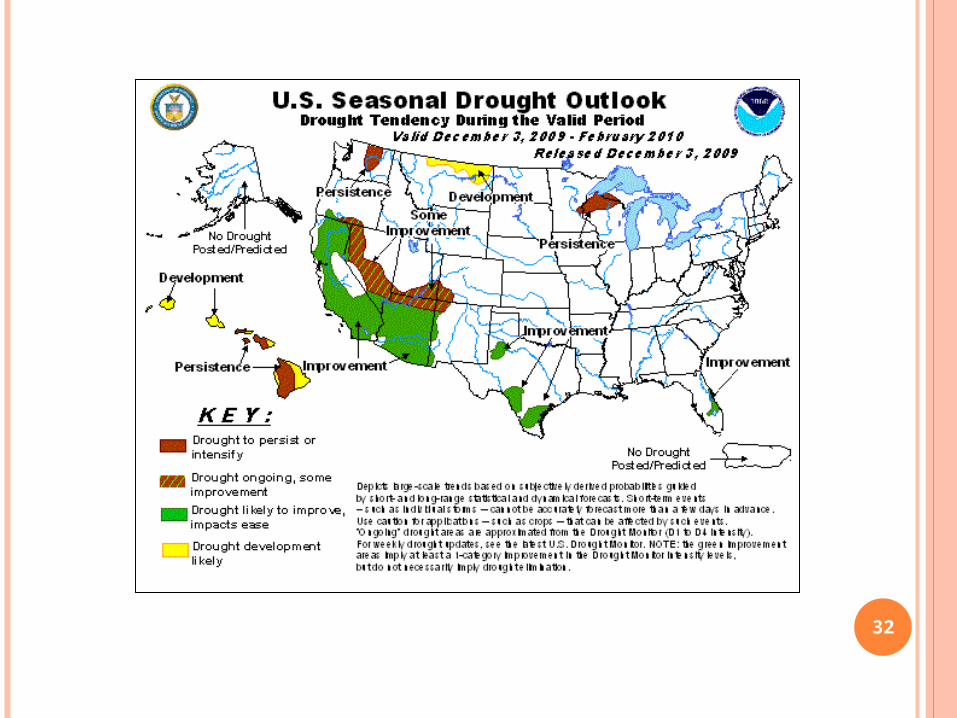
U. S. Seasonal OutlooksDecember 2009 – February 2010
Temperature Precipitation
13
13
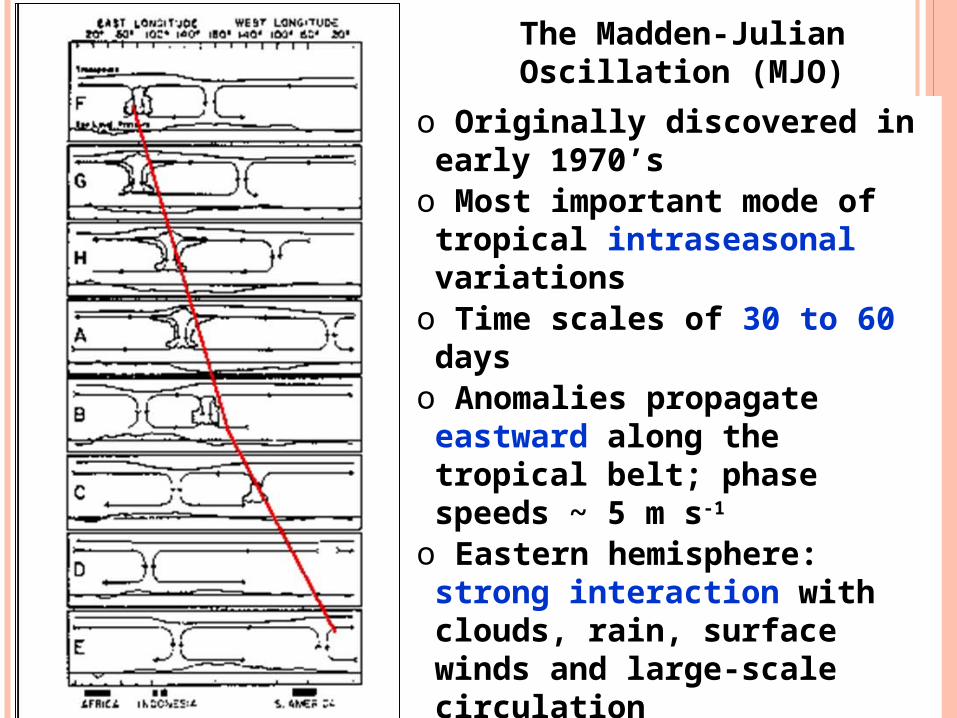
o Originally discovered in early 1970’so Most important mode of tropical
intraseasonal variations o Time scales of 30 to 60 dayso Anomalies propagate eastward
along the tropical belt; phase speeds ~ 5 m s-1
o Eastern hemisphere: strong interaction with clouds, rain, surface winds and large-scale circulationo Western hemisphere: modest
interaction with convection and large-scale circulationo Significant case-to-case and
interannual variability
The Madden-Julian Oscillation (MJO)

14
14
The Life Cycle of the MJO: Convective Activity
Jones (2000)
Enhanced Convection
Suppressed Convection
oThis sequence of OLR anomalies shows composites (or snapshots) of filtered OLR data. The OLR time series were filtered to retain only variations of 30-60 days.
oIncrease in convective anomalies start over tropical Africa and propagate eastward to the western Pacific
Tim
e
T = 0
T = 10 days
T = 20 days
T = 30 days
T = 40 days
15
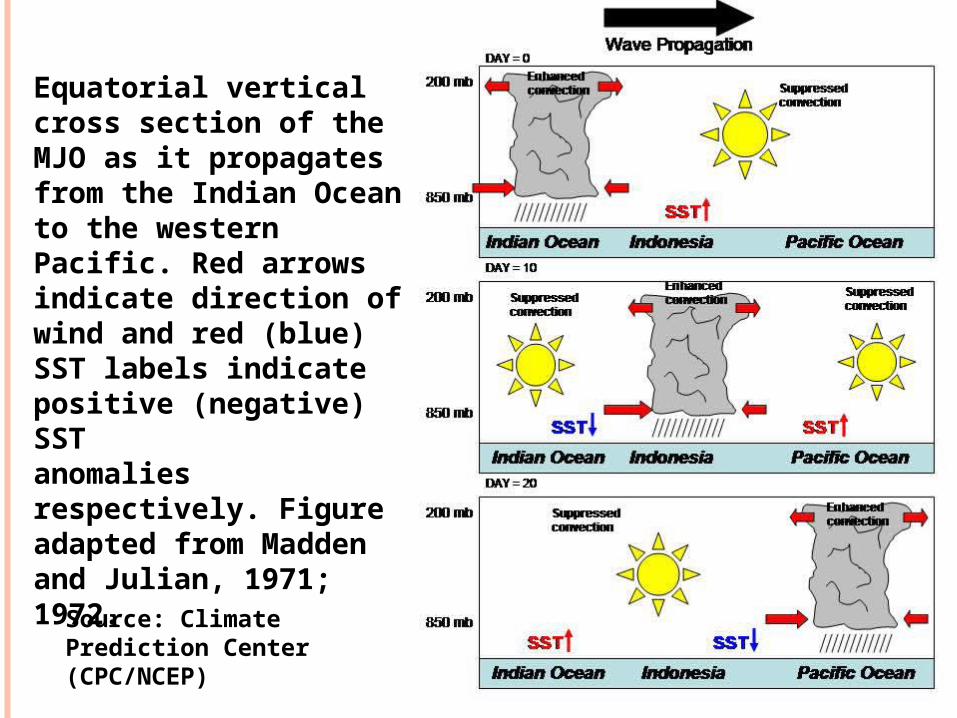
Equatorial vertical cross section of the MJO as it propagates from the Indian Ocean to the westernPacific. Red arrows indicate direction of wind and red (blue) SST labels indicate positive (negative) SSTanomalies respectively. Figure adapted from Madden and Julian, 1971; 1972.
Source: Climate Prediction Center (CPC/NCEP)
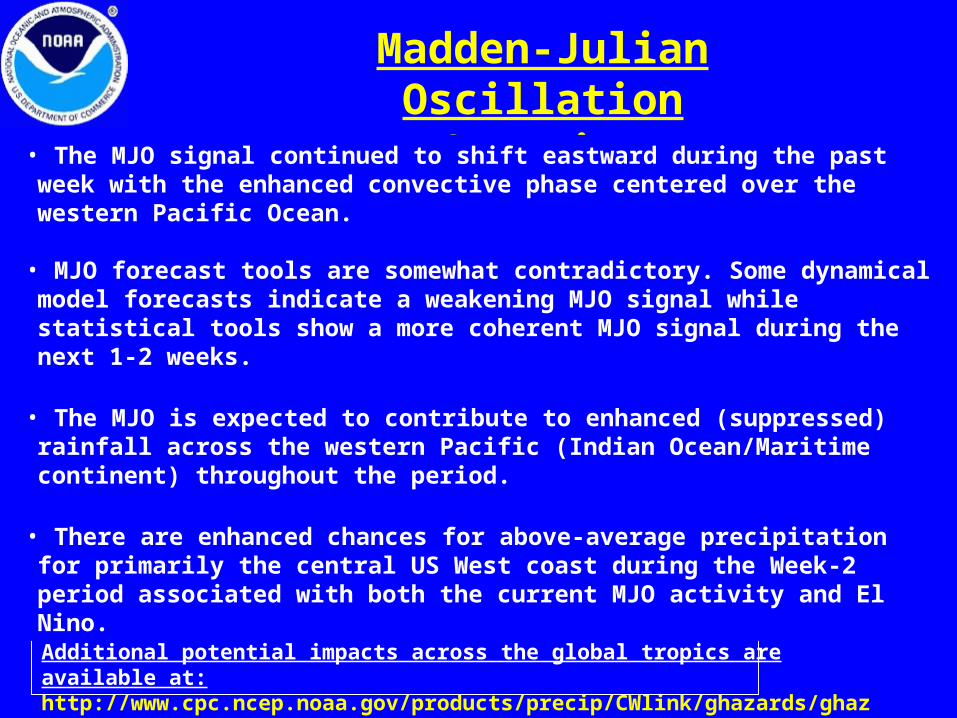
Madden-Julian OscillationOverview
Additional potential impacts across the global tropics are available at: http://www.cpc.ncep.noaa.gov/products/precip/CWlink/ghazards/ghaz.shtml
• The MJO signal continued to shift eastward during the past week with the enhanced convective phase centered over the western Pacific Ocean.
• MJO forecast tools are somewhat contradictory. Some dynamical model forecasts indicate a weakening MJO signal while statistical tools show a more coherent MJO signal during the next 1-2 weeks.
• The MJO is expected to contribute to enhanced (suppressed) rainfall across the western Pacific (Indian Ocean/Maritime continent) throughout the period.
• There are enhanced chances for above-average precipitation for primarily the central US West coast during the Week-2 period associated with both the current MJO activity and El Nino.
17
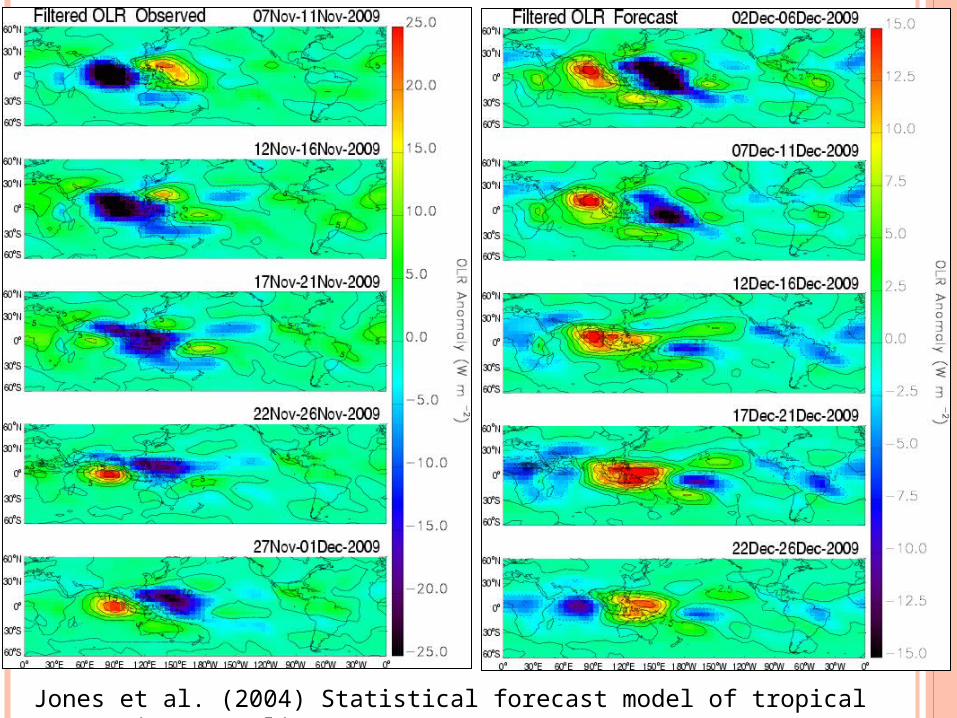
Jones et al. (2004) Statistical forecast model of tropical convective anomalies
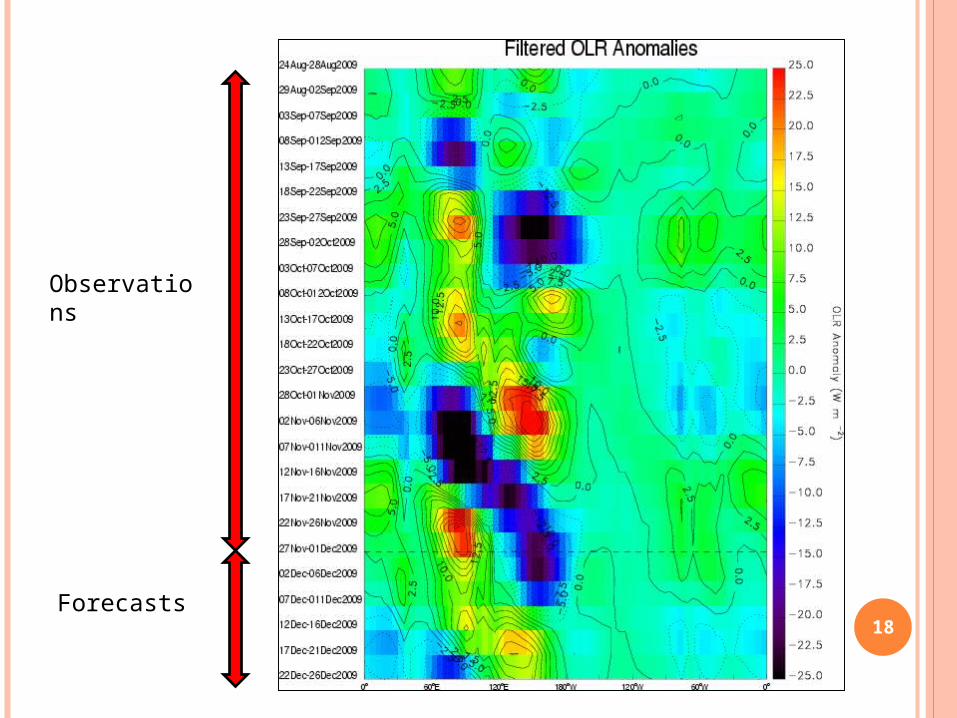
18
Observations
Forecasts
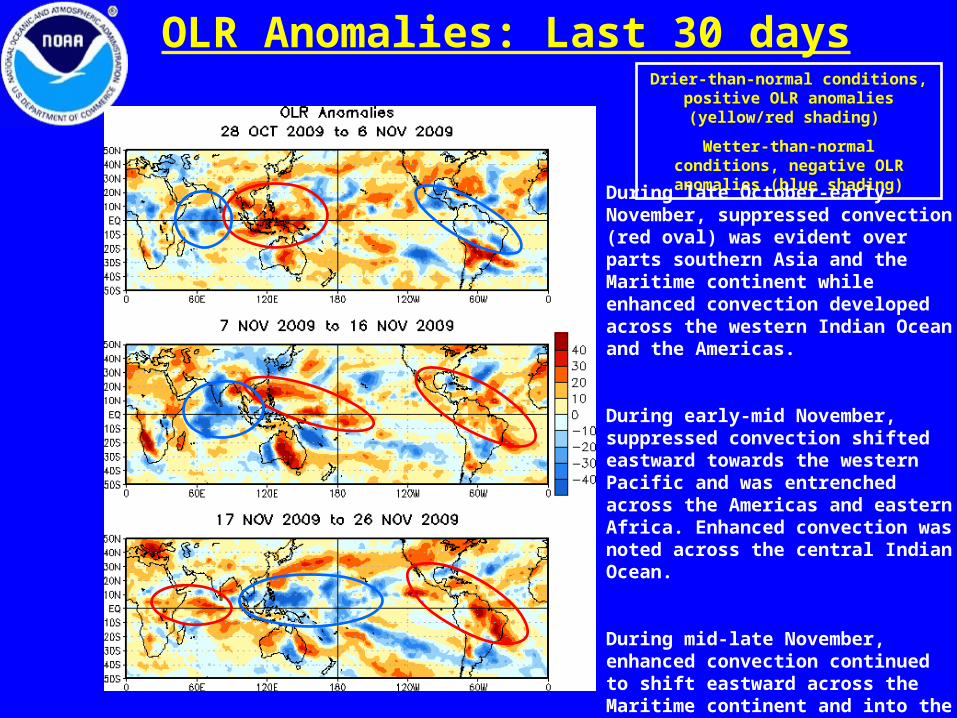
OLR Anomalies: Last 30 daysDrier-than-normal conditions, positive OLR anomalies (yellow/red shading)
Wetter-than-normal conditions, negative OLR anomalies (blue shading)
During late October-early November, suppressed convection (red oval) was evident over parts southern Asia and the Maritime continent while enhanced convection developed across the western Indian Ocean and the Americas.
During early-mid November, suppressed convection shifted eastward towards the western Pacific and was entrenched across the Americas and eastern Africa. Enhanced convection was noted across the central Indian Ocean.
During mid-late November, enhanced convection continued to shift eastward across the Maritime continent and into the west Pacific while suppressed convection prevailed across Indian Ocean and the Americas.
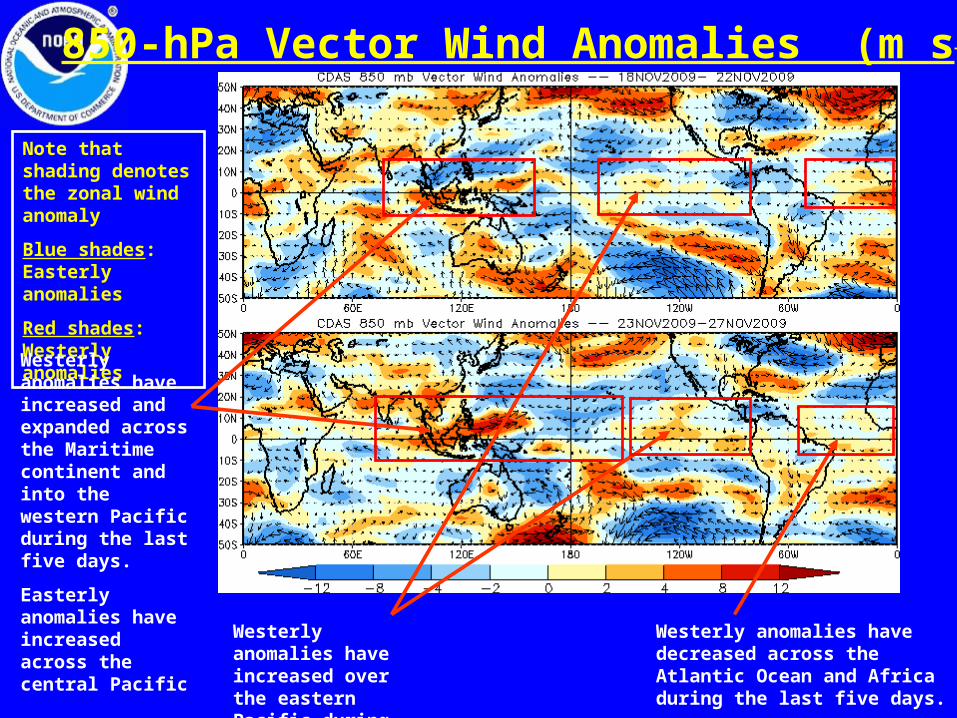
850-hPa Vector Wind Anomalies (m s-1)
Westerly anomalies have increased over the eastern Pacific during the last five days.
Westerly anomalies have decreased across the Atlantic Ocean and Africa during the last five days.
Note that shading denotes the zonal wind anomaly
Blue shades: Easterly anomalies
Red shades: Westerly anomalies
Westerly anomalies have increased and expanded across the Maritime continent and into the western Pacific during the last five days.
Easterly anomalies have increased across the central Pacific
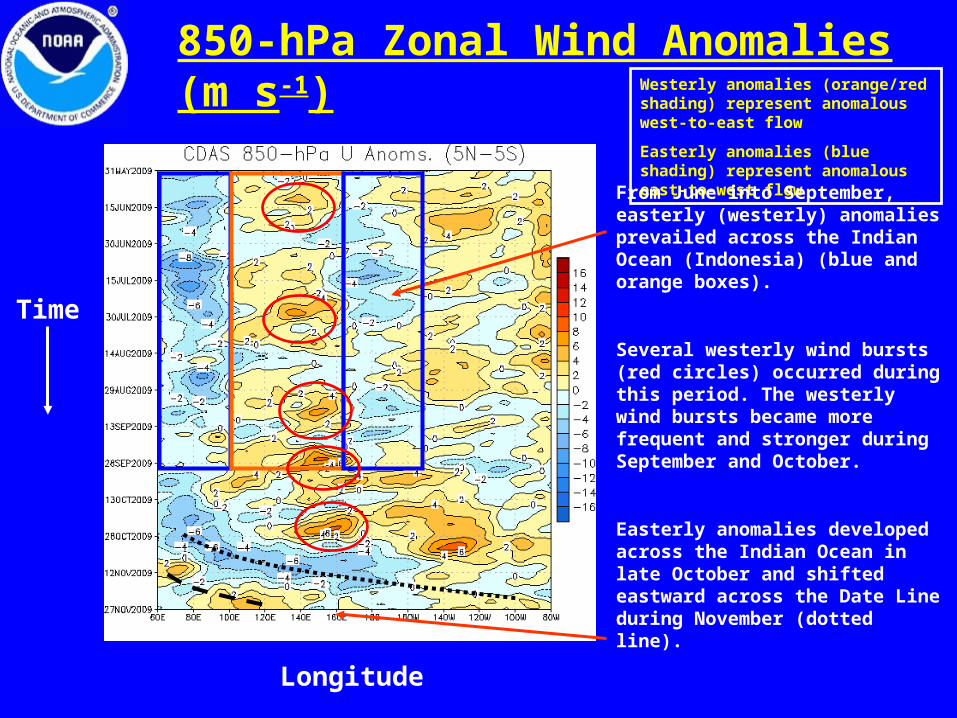
850-hPa Zonal Wind Anomalies (m s-1)Westerly anomalies (orange/red shading) represent anomalous west-to-east flow
Easterly anomalies (blue shading) represent anomalous east-to-west flow
From June into September, easterly (westerly) anomalies prevailed across the Indian Ocean (Indonesia) (blue and orange boxes).
Several westerly wind bursts (red circles) occurred during this period. The westerly wind bursts became more frequent and stronger during September and October.
Easterly anomalies developed across the Indian Ocean in late October and shifted eastward across the Date Line during November (dotted line).
Most recently, westerly anomalies have developed across the Maritime continent and west Pacific (dashed line).
Time
Longitude
•Oceanic Kelvin waves have alternating warm and cold phases. The warm phase is indicated by dashed lines. Down-welling and warming occur in the leading portion of a Kelvin wave, and up-welling and cooling occur in the trailing portion.
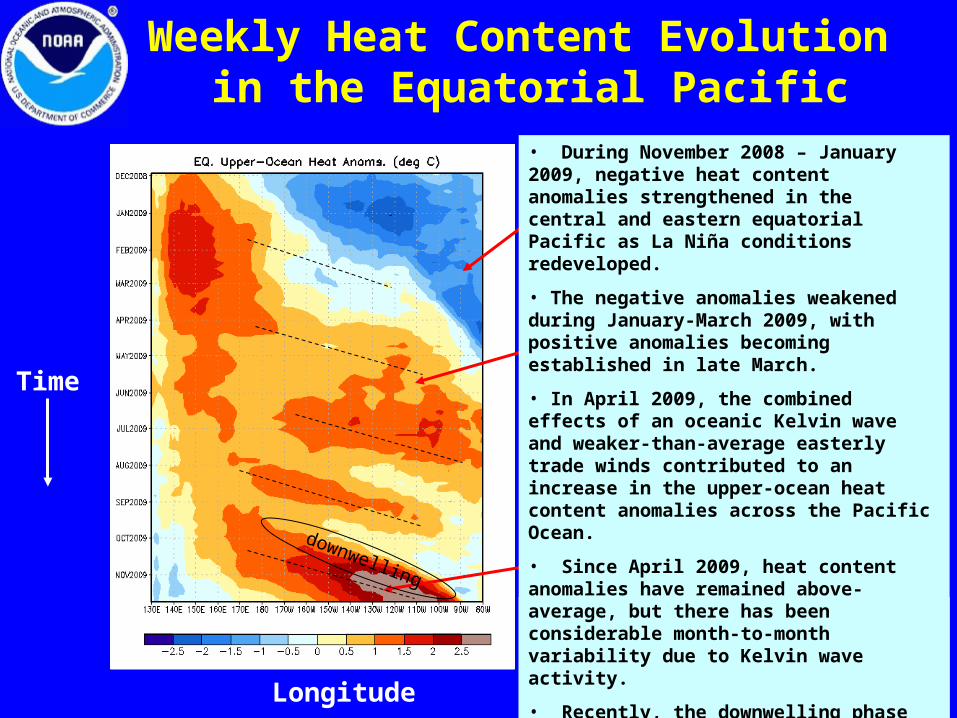
Weekly Heat Content Evolution in the Equatorial Pacific
Longitude
Time
downwelling
• During November 2008 – January 2009, negative heat content anomalies strengthened in the central and eastern equatorial Pacific as La Niña conditions redeveloped.
• The negative anomalies weakened during January-March 2009, with positive anomalies becoming established in late March.
• In April 2009, the combined effects of an oceanic Kelvin wave and weaker-than-average easterly trade winds contributed to an increase in the upper-ocean heat content anomalies across the Pacific Ocean.
• Since April 2009, heat content anomalies have remained above-average, but there has been considerable month-to-month variability due to Kelvin wave activity.
• Recently, the downwelling phase of a Kelvin wave has contributed to a sharp increase in heat content.

23
Typical scenario linking pattern of tropical rainfall associated with the MJO to extreme precipitation events along the west coast: progressive (i.e. eastward moving) circulation pattern in the tropics and a retrograding (i.e. westward moving) circulation pattern in the midlatitudes of the North Pacific. Typical wintertime weather anomalies preceding heavy precipitation events in the Pacific Northwest are as follows :
7-10 days prior to the event: Heavy tropical rainfall associated with the MJO shifts eastward from the eastern Indian Ocean to the western tropical Pacific. A moisture plume extends northeastward from the western tropical Pacific towards the general vicinity of the Hawaiian Islands. A strong blocking anticyclone is located in the Gulf of Alaska with a strong polar jet stream around its northern flank.
MJO impacts in North America

24
24
3-5 days prior to the event: Heavy tropical rainfall shifts eastward towards the date line and begins to diminish. The associated moisture plume extends further to the northeast, often traversing the Hawaiian Islands. The strong blocking high weakens and shifts westward. A split in the North Pacific jet stream develops, characterized by an increase in the amplitude and spatial extent of the upper tropospheric westerly zonal winds on the southern flank of the block and a decrease on its northern flank. Tropical and extratropical circulation patterns begin to “phase” allowing a developing midlatitude trough to tap moisture plume extending from the deep tropics
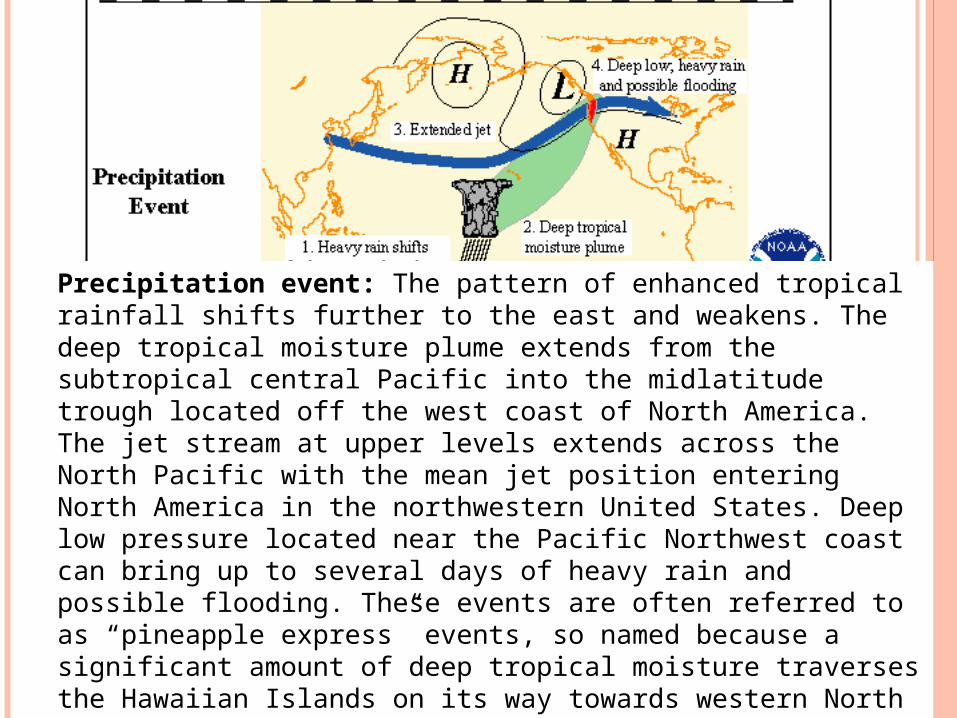
Precipitation event: The pattern of enhanced tropical rainfall shifts further to the east and weakens. The deep tropical moisture plume extends from the subtropical central Pacific into the midlatitude trough located off the west coast of North America. The jet stream at upper levels extends across the North Pacific with the mean jet position entering North America in the northwestern United States. Deep low pressure located near the Pacific Northwest coast can bring up to several days of heavy rain and possible flooding. These events are often referred to as “pineapple express” events, so named because a significant amount of deep tropical moisture traverses the Hawaiian Islands on its way towards western North America.

26
1. Alternating periods of wetter/drier conditions in the tropics
2. ”Pineapple express” heavy rainfall events3. Modulation of monsoon systems4. Influence on tropical cyclone development5. Modulation of ENSO cycle through oceanic Kelvin
wavesSource: Climate Prediction Center (CPC/NCEP)
The Madden-Julian Oscillation Impacts
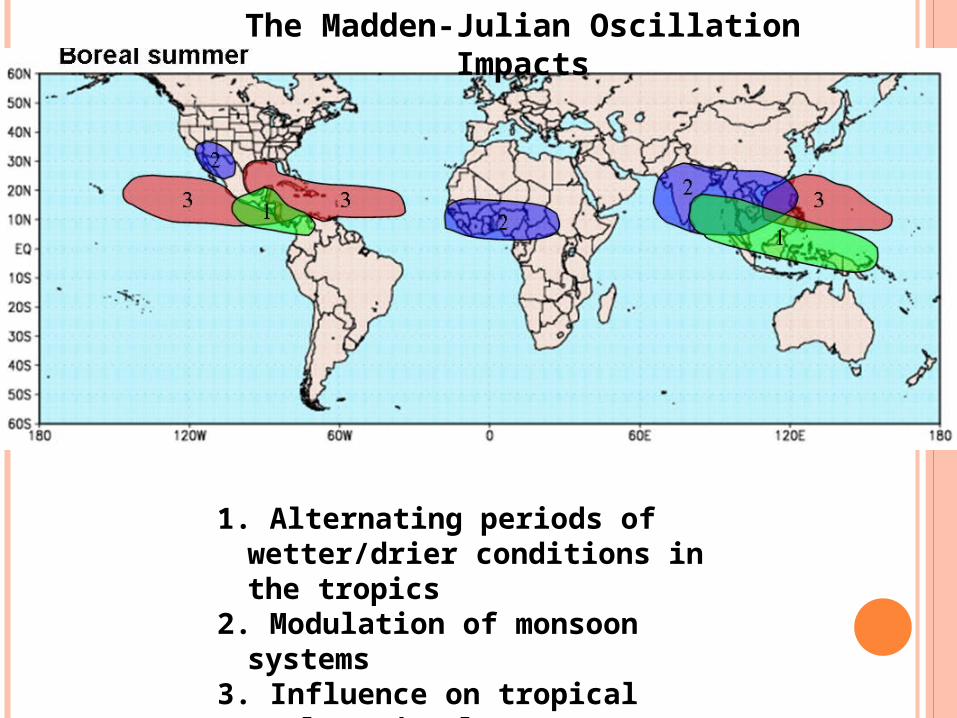
The Madden-Julian Oscillation Impacts
1. Alternating periods of wetter/drier conditions in the tropics
2. Modulation of monsoon systems3. Influence on tropical cyclone
development
28
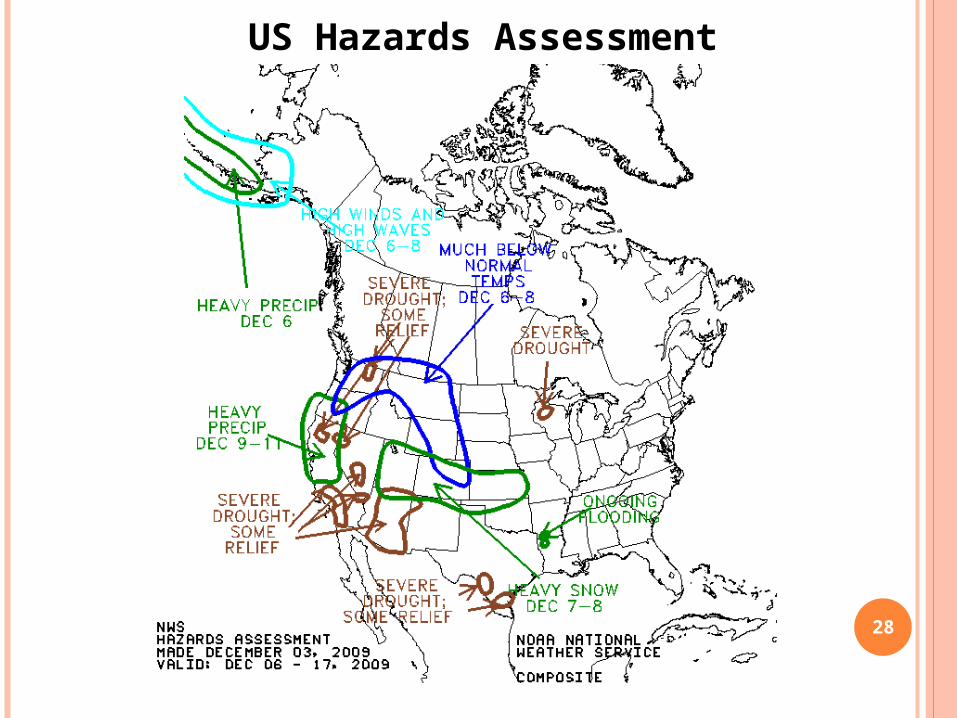
US Hazards Assessment
29
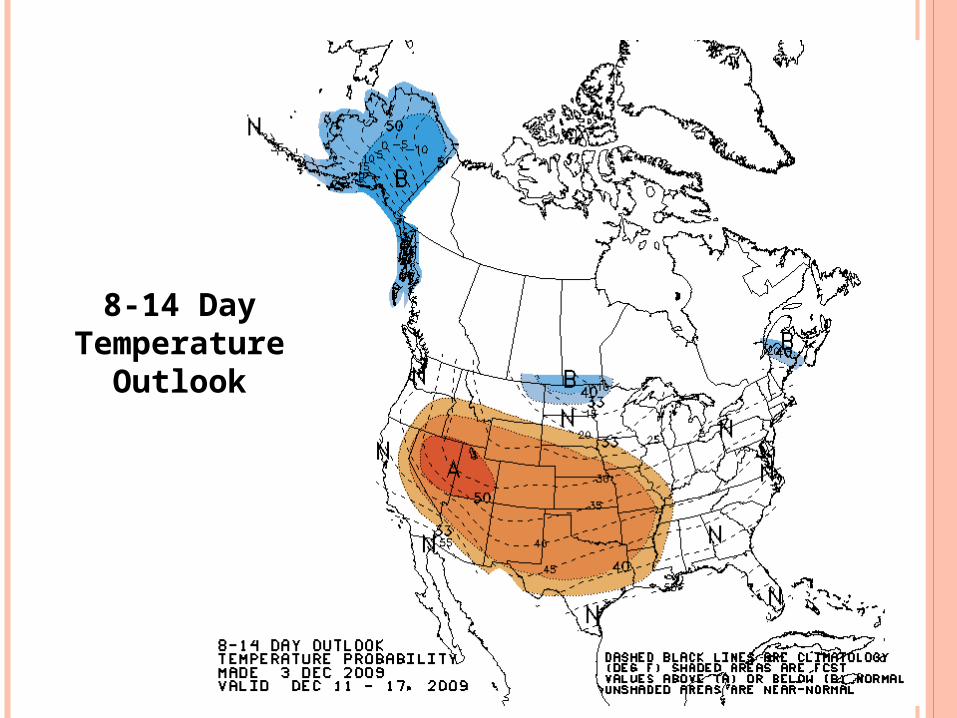
8-14 Day Temperature Outlook
30
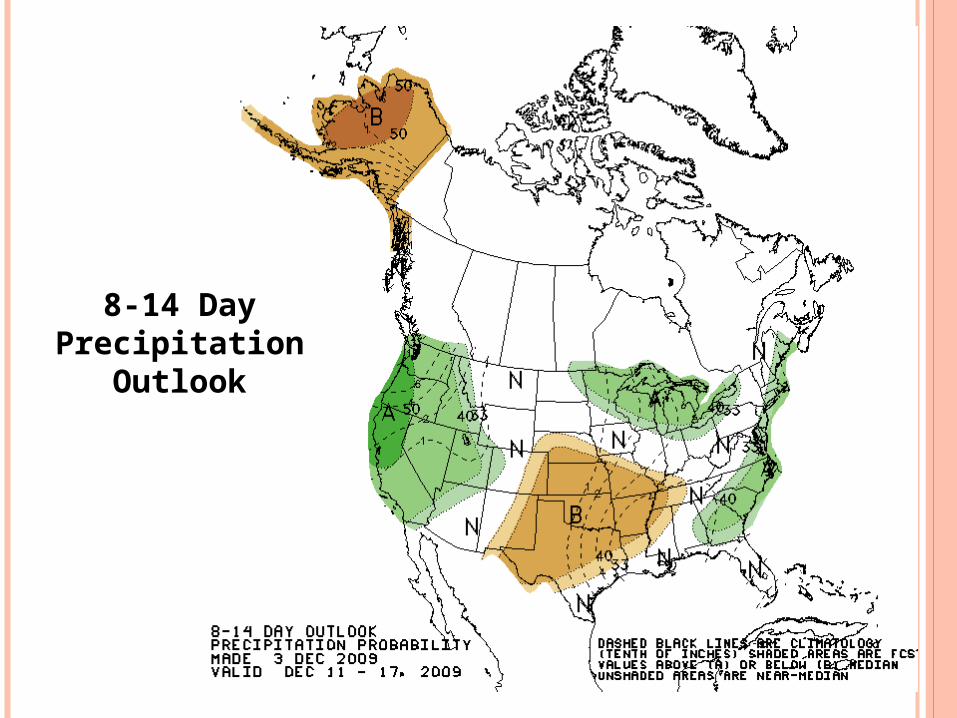
8-14 Day Precipitation Outlook
31
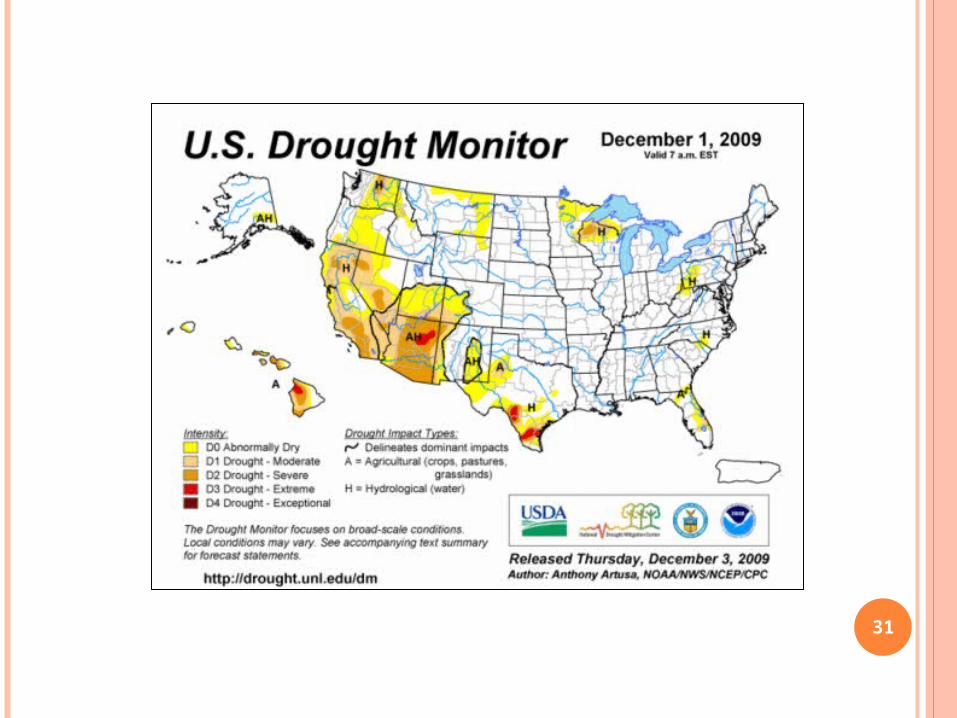
32
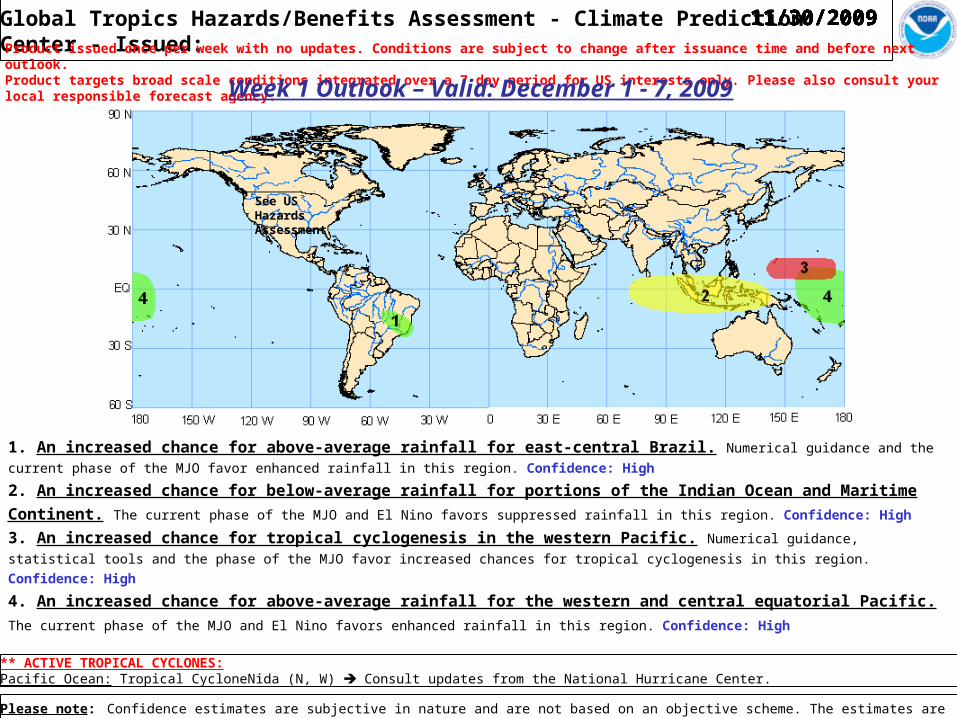
Global Tropics Hazards/Benefits Assessment - Climate Prediction Center - Issued:Product issued once per week with no updates. Conditions are subject to change after issuance time and before next outlook.Product targets broad scale conditions integrated over a 7 day period for US interests only. Please also consult your local responsible forecast agency.
Week 1 Outlook – Valid: December 1 - 7, 2009
Please note: Confidence estimates are subjective in nature and are not based on an objective scheme. The estimates are given to provide additional information to the user.
11/30/200911/30/200911/30/200911/30/200911/30/200911/30/200911/30/2009
1. An increased chance for above-average rainfall for east-central Brazil. Numerical guidance and the current phase of the MJO favor enhanced rainfall in
this region. Confidence: High
2. An increased chance for below-average rainfall for portions of the Indian Ocean and Maritime Continent. The current phase of the MJO and El
Nino favors suppressed rainfall in this region. Confidence: High
3. An increased chance for tropical cyclogenesis in the western Pacific. Numerical guidance, statistical tools and the phase of the MJO favor increased
chances for tropical cyclogenesis in this region. Confidence: High
4. An increased chance for above-average rainfall for the western and central equatorial Pacific. The current phase of the MJO and El Nino favors
enhanced rainfall in this region. Confidence: High
** ACTIVE TROPICAL CYCLONES:Pacific Ocean: Tropical CycloneNida (N, W) Consult updates from the National Hurricane Center.
See US Hazards Assessment
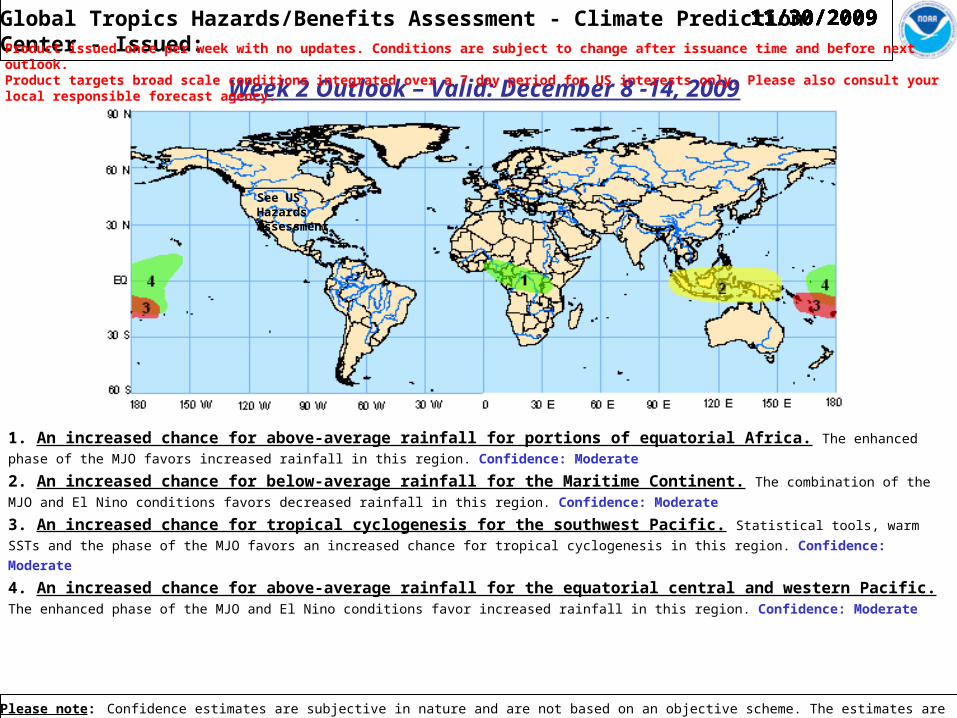
Week 2 Outlook – Valid: December 8 -14, 2009
Global Tropics Hazards/Benefits Assessment - Climate Prediction Center - Issued:
Please note: Confidence estimates are subjective in nature and are not based on an objective scheme. The estimates are given to provide additional information to the user.
Product issued once per week with no updates. Conditions are subject to change after issuance time and before next outlook.Product targets broad scale conditions integrated over a 7 day period for US interests only. Please also consult your local responsible forecast agency.
11/30/200911/30/200911/30/200911/30/200911/30/200911/30/200911/30/2009
1. An increased chance for above-average rainfall for portions of equatorial Africa. The enhanced phase of the MJO favors increased rainfall in this
region. Confidence: Moderate
2. An increased chance for below-average rainfall for the Maritime Continent. The combination of the MJO and El Nino conditions favors decreased
rainfall in this region. Confidence: Moderate
3. An increased chance for tropical cyclogenesis for the southwest Pacific. Statistical tools, warm SSTs and the phase of the MJO favors an increased chance
for tropical cyclogenesis in this region. Confidence: Moderate
4. An increased chance for above-average rainfall for the equatorial central and western Pacific. The enhanced phase of the MJO and El Nino
conditions favor increased rainfall in this region. Confidence: Moderate
See US Hazards Assessment
African Monsoon Highlights:Last 7 Days
• Tropical Cyclone Bongani soaked the Seychelles and northern Madagascar before striking the Comoros Islands.
• Local areas in eastern Kenya improved, but many localities continued to experience rainfall shortages. Portions of southern Somalia received significant rains following a long break.
• Rainfall eased significantly over western Tanzania and in many areas in central Africa.
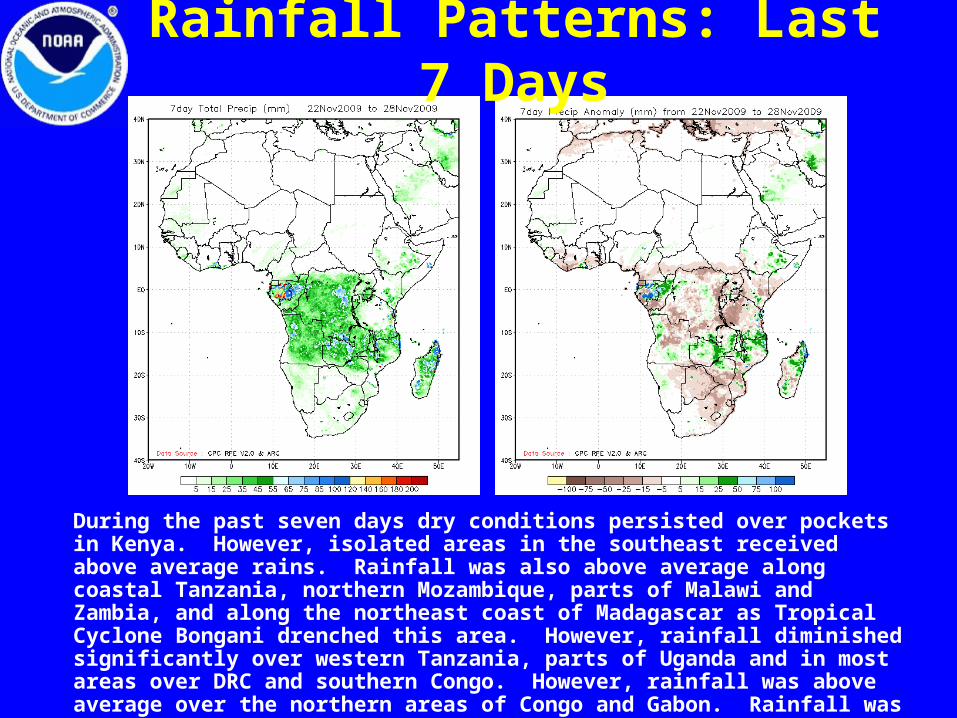
Rainfall Patterns: Last 7 Days
During the past seven days dry conditions persisted over pockets in Kenya. However, isolated areas in the southeast received above average rains. Rainfall was also above average along coastal Tanzania, northern Mozambique, parts of Malawi and Zambia, and along the northeast coast of Madagascar as Tropical Cyclone Bongani drenched this area. However, rainfall diminished significantly over western Tanzania, parts of Uganda and in most areas over DRC and southern Congo. However, rainfall was above average over the northern areas of Congo and Gabon. Rainfall was below average locally along the Guinea coast.

Rainfall Patterns: Last 30 Days
During the past 30 days rainfall was below average over parts of the Greater Horn of Africa, including Kenya, Uganda, southwestern Ethiopia, and southern Somalia. Rainfall was above average over western Tanzania, southern DRC, Zambia, northern Zimbabwe, and southern Mozambique. However, light rains sustained moisture deficits over southern Madagascar, central Mozambique, the area along the west coast of Angola, and local areas in southern Cameroon. Rainfall was above average over much of Gabon, eastern CAR, central Cameroon, and the areas along the Gulf of Guinea coastline.

• Heavy rainfall was observed over portions of southern Brazil and northeastern Argentina, while below-average rainfall dominated most of the monsoon core region during the last 7 days.
• The GFS predicts above-average rainfall to continue over southern Brazil and northeastern Argentina during the next two weeks. For week 1 (1-7 days) much above-average rainfall is predicted to move northward over the monsoon core region.
South American Monsoon System Highlights
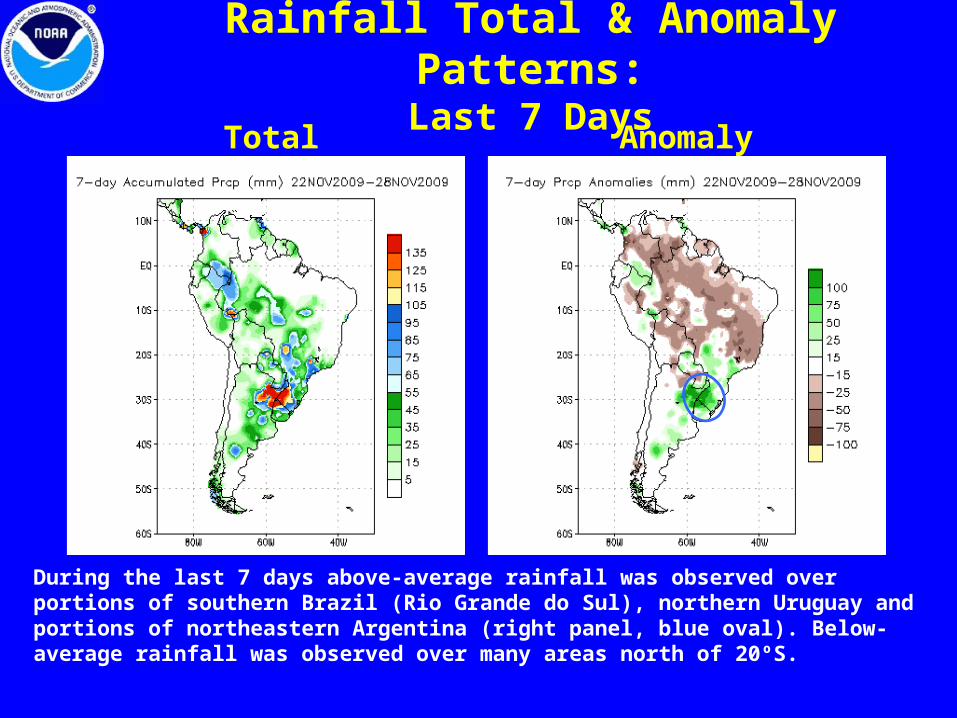
Rainfall Total & Anomaly Patterns:Last 7 Days
During the last 7 days above-average rainfall was observed over portions of southern Brazil (Rio Grande do Sul), northern Uruguay and portions of northeastern Argentina (right panel, blue oval). Below-average rainfall was observed over many areas north of 20ºS.
Total Anomaly
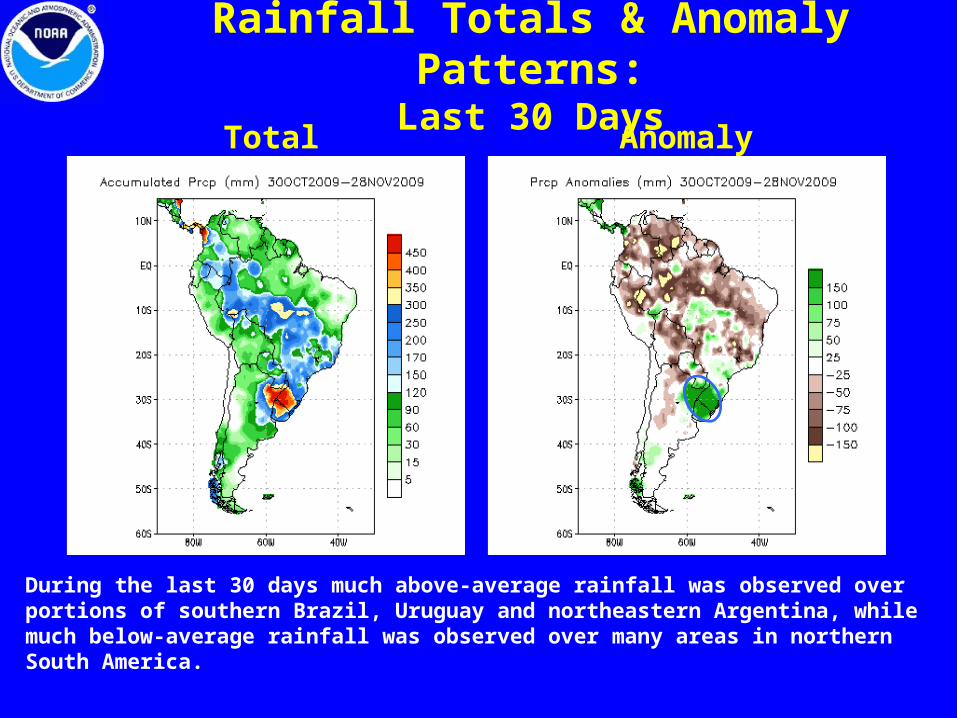
Rainfall Totals & Anomaly Patterns:Last 30 Days
During the last 30 days much above-average rainfall was observed over portions of southern Brazil, Uruguay and northeastern Argentina, while much below-average rainfall was observed over many areas in northern South America.
Total Anomaly