Embed Size (px)
Citation preview

CLUSTER ANALYSIS 1
Cluster Analysis of the Fabricated Metals
Manufacturing Sector in Salem, Oregon
Prepared by:
Phillip Andrews
Spencer Gibson
Under the supervision of
Professor Bruce Blonigen
Prepared for:
City of Salem, Urban Development
CLUSTER ANALYSIS 2
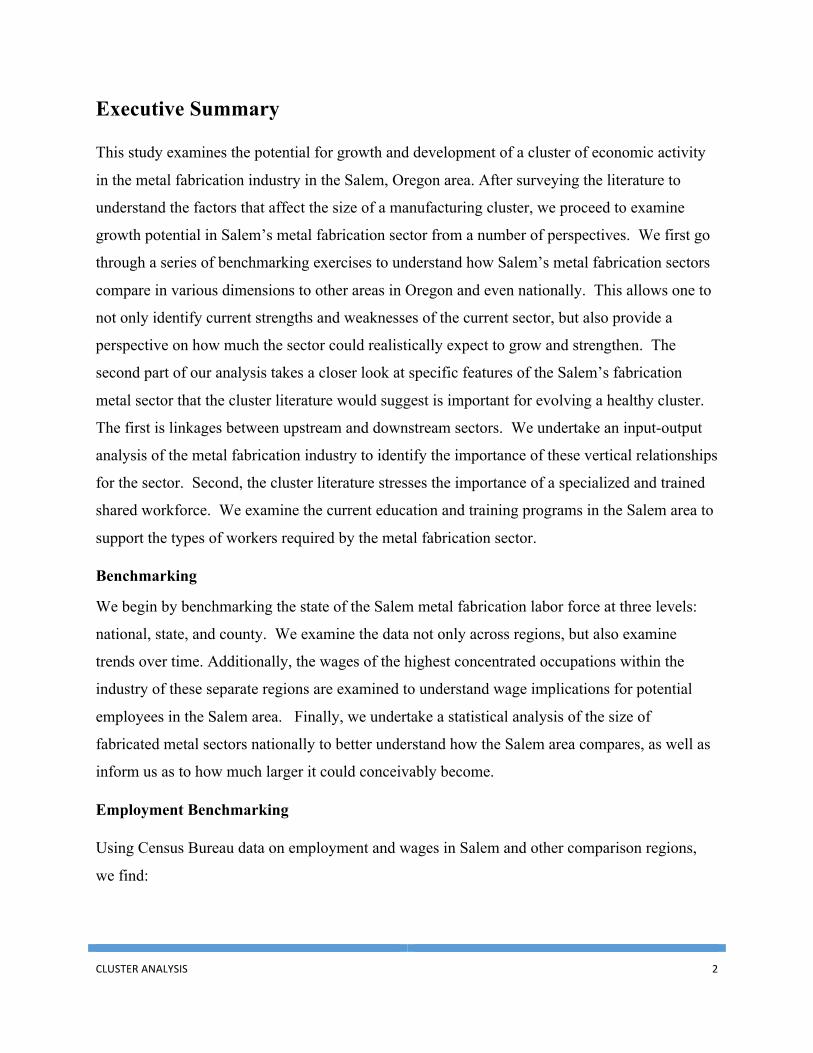
Executive Summary
This study examines the potential for growth and development of a cluster of economic activity
in the metal fabrication industry in the Salem, Oregon area. After surveying the literature to
understand the factors that affect the size of a manufacturing cluster, we proceed to examine
growth potential in Salem’s metal fabrication sector from a number of perspectives. We first go
through a series of benchmarking exercises to understand how Salem’s metal fabrication sectors
compare in various dimensions to other areas in Oregon and even nationally. This allows one to
not only identify current strengths and weaknesses of the current sector, but also provide a
perspective on how much the sector could realistically expect to grow and strengthen. The
second part of our analysis takes a closer look at specific features of the Salem’s fabrication
metal sector that the cluster literature would suggest is important for evolving a healthy cluster.
The first is linkages between upstream and downstream sectors. We undertake an input-output
analysis of the metal fabrication industry to identify the importance of these vertical relationships
for the sector. Second, the cluster literature stresses the importance of a specialized and trained
shared workforce. We examine the current education and training programs in the Salem area to
support the types of workers required by the metal fabrication sector.
Benchmarking
We begin by benchmarking the state of the Salem metal fabrication labor force at three levels:
national, state, and county. We examine the data not only across regions, but also examine
trends over time. Additionally, the wages of the highest concentrated occupations within the
industry of these separate regions are examined to understand wage implications for potential
employees in the Salem area. Finally, we undertake a statistical analysis of the size of
fabricated metal sectors nationally to better understand how the Salem area compares, as well as
inform us as to how much larger it could conceivably become.
Employment Benchmarking
Using Census Bureau data on employment and wages in Salem and other comparison regions,
we find:
CLUSTER ANALYSIS 3
• From 1998 to 2011 employment in the the fabricated metals sector in the U.S. and
Oregon decreased by 27% and 20%, respectively. Over the same time period, the
fabricated metals sector diminished by 61% in Marion Country, the largest drop of
the top metal fabricating counties in the state. The next largest declines in fabricated
metals employment in the state were Multnomah and Lane counties at 31.2% and 12.6%,
respectively.
• Metal fabrication employment as a percentage of manufacturing employment in the U.S.
shifted from 10.7% to 12.1% over the same time period. In Oregon, this shift was from
9% to 12.3%. Marion County was the only county to show a decrease in fabricated
metals share of manufacturing employment of all those analyzed in this research.
This decrease was from 15.2% of manufacturing employment to 8.3%.
• In 2012, the U.S. industry grew by 3.48% and Oregon by 3.3%. Marion County's metal
fabrication sector grew by 7.6%, the highest of all counties analyzed. This suggests
that there is some rebound now occurring in the sector in Marion county.
Wage Benchmarking
Our analysis also benchmarks wages in Salem to those throughout the nation, Oregon, and the
Portland area. The top four production positions of the industry and first-line supervisor role are
used to understand the disparity of wages in Salem.
• The top production occupation, machinist, received a salary $6,720 higher in the
Portland area compared to Salem.
• Lower wages occur in three of the top four production positions, or 25 percent of
employment, in Salem when compared to all three regions.
Statistical Analysis
Using employment and population data at the MSA level, an empirical model can be developed
that explains most of the variation within the data. Our regression analysis finds:
CLUSTER ANALYSIS 4
• In 2010, employment within the fabricated metals industry in the Salem metro area was
946. Our model predicts that Salem, based only on the size of its population and
manufacturing sector, should have 1,134 employees within this sector. This simple
model suggests that Salem has the opportunity to increase employment by at least
188 employees.
• For the size of Salem’s fabricated metal industry, relative to the size of their
manufacturing sector, to be equal with the national mean, employment would have to
increase by 299.
• Continuing with this same benchmarking process, if Salem wanted to be one standard
deviation above the national mean, employment in the fabricated metal sector would
have to increase by 1,104.
After understanding and measuring the prospects for growth in Salem, we now turn our attention
to an empirical review of the cluster traits, namely demand conditions and the existence of
related and supporting industries.
Micro Analysis: Input-Output
Porter’s (1990) diamond of competitive advantages framework explains the importance of
demand conditions and the presence of related and supporting industries as being imperative to
fostering competitive advantages within industries. The input-output analysis examines both of
these traits and we find.
• Primary metals is the largest upstream industry (or supplier) for the fabricated metals,
consisting of 35.58% of total inputs within the industry.
• The largest downstream industries (or consumers) of fabricated metals are construction;
motor vehicle bodies, trailers, and parts manufacturing; and machinery. These
industries consume 16.10%, 13.34%, and 11.87% of total fabricated metal products
output, respectively.
• Architectural and structural metal products industry is the largest fabricated metals
subsector within the Salem metropolitan region. Detailed level construction industries
consume approximately 41.7% of all output in the platework and fabricated
CLUSTER ANALYSIS 5
structural products industry, and 44.3% of total output in the architectural and
structural.
Case Study
To better understand the role of downstream consumers for the size and health of the fabricated
metals sector, we examined a couple cities of similar size to Salem that had much larger
fabricated metals sectors. From our statistical analysis we found that comparable regions with
unusually high levels of employment in the fabricated metals sector were the Reno-Sparks, NV
and Springfield, MO regions. These regions can be compared and contrasted to Salem to identify
important discrepancies that may explain these differences in employment.
• Similar to Salem, the fabricated metal products industry in the Reno-Sparks, NV region is
heavily concentrated in architectural and structural metal products. However, the Reno-
Sparks region has almost 1,000 more employees in the fabricated metal industry
relative to Salem. The construction industry is larger in the Reno-Sparks area by just
over 2,000 employees, with identical levels of machinery and motor vehicle parts
manufacturing. Furthermore, gaming machines and systems to land-based casinos
provides a niche market with possible demand spillover effects.
• Similar to Salem, the Springfield, MO area has almost an equal level of employment
within their construction industry, yet has over 1,000 more employees in the
machinery manufacturing sector, with a measureable motor vehicle parts
manufacturing of 511 employees. Springfield has nearly 1,300 more employees in
the fabricated metal industry relative to Salem, with 810 of these employees working
in the metal tank manufacturing sector. Of the 810 employees within this metal
fabrication subsector, a single firm, Paul Mueller Company, employs between 250 to
499 workers.
These results reveal three major findings. First, the presence of downstream industries appears to
have an impact on a region’s local fabricated metals sector. Second, local niche markets may
have demand spillover effects. Finally, historical endowment, such as the presence of a large
preexisting firm can also result in large levels of employment.
CLUSTER ANALYSIS 6
Micro Analysis of Training Programs
Porter (1990) and others stress that specialized labor market can be crucial for the development
and maintenance of a large and healthy cluster. Thus, a final analysis in the paper examined the
existing workforce training programs in the Salem area. The process of comparing the
curriculums of the welding and manufacturing oriented programs at three schools within the state
(Chemeketa CC, Clackamas CC, and Mt. Hood CC) yields a comprehensive viewpoint of how
the regional labor force becomes specialized. Examination of these three schools curricula for
workers important to the fabricated metals sectors produced various conclusions about the state
of Chemeketa Community College.
• At Chemeketa, the training focuses on welding and CNC machining, whereas Mt. Hood
balances the distribution of training across welding and manual and CNC machining.
• The manufacturing and machining programs at Clackamas address a much larger range of
techniques and additional concentrations when compared to Chemeketa.
• The welding degree at Clackamas builds more advanced welding skills in the second year
of studies, unlike Chemeketa which instructs individuals in the techniques of CNC
machining.
This analysis shows that there is some variation in the training programs throughout the state and
that the programs at Chemekata may be inferior to others.
Policy Conclusions:
The findings from our micro analyses have lead us to the following policy implications:
• Develop a larger local supply chain, focusing on instigating growth within downstream
industries – the consumers of fabricated metal products.
• Improve the perception of manufacturing careers by linking high school students to
opportunities that incorporate them in the local industry.
• Reevaluate local training programs at Chemeketa Community College. Reach out to
local businesses to understand how important these training programs are (or could be).
Investigate policy options to strengthen the local vocational system's ability to provide
the necessary skills for workers required in the fabricated metals sector.

CLUSTER ANALYSIS 7
• Facilitate a professional network of local industry business owners and managers to build
a local flow of industry and technological knowledge.
These recommendations have the capability to promote growth, but may not have the influence
to fully develop, by themselves, the metal fabrication sector. Global, national, and statewide
factors can hinder the effectiveness of local development policy. We believe that positive and
negative external influences, both observable and unobservable, heavily drive industries like the
metal fabrication sector towards success or failure. This analysis has identified traits of the
industry that show potential for growth within Salem, but Salem's current position creates
challenges for economic developers.
CLUSTER ANALYSIS 8
I. Introduction The subject of industry agglomeration (or “clustering”) has been of great interest in
recent years to policy makers, and for good reason. If industries do tend to cluster, and if policy
and other economic incentives can help facilitate clustering, then there is the potential for urban
developers to expand their economies. Such knowledge is also valuable to business planners
when competing in a market. We see the importance of this issue given the potential it has in
creating economic value for different regions. If industries don’t cluster, the information is still
valuable because it may reduce unnecessary expenditures resulting from a city trying to form a
cluster that cannot occur.
This study seeks to analyze and understand the process and life cycle of industry
agglomeration with respect to fabricated metal production in Salem, Oregon. The United States
Census Bureau North American Industry Classification System (NAICS) defines fabricated
metals production as a subsector of manufacturing that transforms metals into intermediate or
end products. Firms in this sector take primary metal products (such as steel sheets or rods) and
then further modify them into a wide variety of more sophisticated metal products, from bolts
and screws to cell phone towers. Our study will examine the industry features of the fabricated
metals sector and its presence in Salem in order to analyze the prospects of growing a more
vibrant fabricated metals sector in this region.
An academic literature review provides a theoretical framework for understanding when,
where and why firms in different industries might cluster together. A benchmarking process of
employment and wages will build a standard for Salem’s metal fabrication industry. From there a
statistical analysis measures different degrees of concentration of various metro regions
throughout the nation, and provide additional benchmarks of growth for Salem.
We study the more prominent subsectors that occupy the Salem area by analyzing
national input-output accounts to understand the demand conditions of the industry. This is
benchmarked to the nation as a whole, and then compared to other areas that are comparable
with respect to population and manufacturing characteristics. We want to know if there are
unexploited opportunities for Salem developers, and if Salem can foster the agglomeration of this
industry. To explore such possibilities, we examine similar metro regions with higher levels of
metal manufacturing employment and compare their related downstream industries.. Factor
CLUSTER ANALYSIS 9
conditions, such as a specialized labor pool and educational institutions, can also influence
agglomeration. To understand both of these conditions, we employ a technique to compare
training programs in Salem to other local regions. Possible policy recommendations are derived
from these analyses.
The city of Salem wants to expand their economy through diversification of their
manufacturing sector. The food and beverage industry dominates the manufacturing sector of
Salem's economy, which has one of the lowest average wages of all manufacturing sectors.1 In
order to expand their economy, economic developers want to grow and diversify the
manufacturing sector, starting with the metals industry. If they can understand how this industry
functions, then they hope to exploit opportunities through effective policy that would act as a
catalyst to facilitate growth in the fabricated metals sector.
Paper Organization and Structure
In order to more easily digest the information within this paper, the analyses will be
broken down into different sections. The sections will be categorized as follows:
II. Literature Review and Framework: We first examine the preexisting literature on
the topic of industry agglomeration in order to gain a theoretical framework in which to analyze
our research question. This is followed by a discussion of our methodology, sources of data, and
limitations regarding the data and subsequent conclusions.
III. Benchmarking: We begin by looking at employment and wage trends within Salem
and contrast these them to our benchmark regions. After examining these trends, we conduct a
statistical analysis that utilizes an empirical model to generate predicted employment levels
given population and manufacturing statistics. We generate residual values and a deviation
variable to measure how Salem’s employment levels differ from its predicted value, and then
assess the prospects for growth.
IV. Micro Analysis: After understanding where Salem is relative to other regions, we
begin to analyze why it is where it is. First, we conduct an input-output analysis at both the
summary and detailed level. The detailed level input-output accounts will be constructed by first
identifying which subsectors are located in the Salem area and which sectors are large buyers
1 Oregon Employment Department, (2013).
CLUSTER ANALYSIS 10
and sellers of fabricated metals products. Once we have developed an understanding of the
supply chain, we look at education and training programs to evaluate the strength and quality of
the local labor pool.
V. Case Study: Up to this point, we have analyzed employment and wage trends over
time; measured how employment in the local industry deviates from what our empirical model
predicts; constructed a national supply chain using the relevant subsectors within the Salem
region; and how education and training programs affect the quality of the labor pool. In this
section we return to the empirical model to create a sample of regions comparable to Salem with
respect to population and manufacturing statistics. We then conduct a case study of those
comparable regions that experience higher levels of deviation between their observed levels of
employment and their predicted levels of employment.
VI. Policy Recommendations: Using the case study and our analyses, we derive
different policy recommendations that economic developers in Salem can utilize to grow their
fabricated metals sector. The recommendations drawn stay consistent with both the theoretical
framework and the empirical evidence.
VII. Conclusion: A review of the work and its limitations, as well as possible work to be
done moving forward.
Appendix: Contains additional information regarding the sources of data for the input-
output analysis. A visual representation of the national industry supply chain is also provided.
along with a comprehensive account of the detailed level input-output linkages.
II. Framework We begin by developing a theoretical understanding of a cluster, and the factors that lead
to clusters, through a comprehensive literature review. Previous theoretical and empirical work
provides the foundation for applying a cluster analysis of the fabricated metal manufacturing
industry within Salem. A methodology section frames the analytical process and their respective
purposes. In short, the framework section provides a background understanding of the empirical
analysis and its applications in the use of policy.
Cluster Identification:
CLUSTER ANALYSIS 11
As we begin to investigate the possibilities of expanding the metal industry of Salem, a
developed understanding of business cluster formation and activity will guide our analysis. In
2006, Joseph Cortright of the Brookings Institution finds that the literature produces a range of
definitions for an agglomeration, industrial district, and various other terms that equate to the
term "cluster."2 Instead of creating a hard definition for cluster activity, Cortright finds
characteristics in the industrial structures of firms that lead to agglomeration, ranging from labor
market pooling to a firm's competitive strategy.
Alfred Marshall
Alfred Marshall, an early 20th century economist, is widely recognized as the first
pioneer in understanding agglomeration. In his Principles of Economics text, he observed the
industrial district of England and determined three reasons for why firms of similar industries
locate close together: labor market pooling, supplier specialization, and knowledge spillovers.3
These three explanations for industrial organization became known as Marshall's Trinity. The
first, labor market pooling, benefits both firms and workers, as firms have a large labor force to
choose from and workers can optimize the employment of their specialized skills. Secondly,
close proximity allows for the scale necessary in creating a goods market that harbors
specialization of firms. Finally, these industrial districts that Marshall observed create an
environment that allows for easy transfer of knowledge from firm to firm.
Localization vs. Urbanization Economies
The 1950s ushered in the organization of thoughts that formed the field of regional
science building on the ideas of Marshall and others. In his book, The Location of Economic
Activity, E.M Hoover developed the distinction between two types of agglomeration—
localization and urbanization economies4. A localization economy represents a cluster that
forms because of the gains firms obtain from locating near similar firms. An urbanization
economy produces positive externalities from locating near firms in various industries, a quality
associated with large urban areas. These distinctions allow for economists to understand how a
2Cortright, J., & Brookings Institution. (2006). 3 Marshall, A. (1920). 4 Hoover, E. M. (1948).
CLUSTER ANALYSIS 12
particular industrial structure formed. An urban area may grow because of a localization
economy, or agglomeration may occur because of the diverse labor market in a large city. The
differentiation between the two economies of scale helps identify the factors that lead to the
development of an industrial district.
The ideas of regional scientists led to a deeper understanding of urbanization economies
by historian Jane Jacobs. In her book The Economies of Cities, Jacobs concluded that the size
and diversity of cities promote the formulation of new ideas and technologies5. The
accumulation of diverse people, industries, and traded goods play a large role in the incubation
of human capital. This idea relates to the large urban setting of an industry, but also has
credence in explaining the formation of new ideas in a localization economy. Similar firms
organizing in close proximity and interacting through flows of goods and labor can develop new
ideas to advance their local industry.
Flexible Specialization
As geographers, urban economists, and sociologists continued to research the dynamics
of regional economics, Michael Piore and Charles Sabel believed the concentration of mass
markets was leading to increased consumer demand for variety and quality. In 1984 Piore and
Sabel published a book, The Second Industrial Divide, which stated that this increased demand
and the current technological improvements allowed for smaller, craft-oriented firms to beat out
larger, inflexible firms6. The two social scientists did a case study of the Italian industrial
districts and found that these regions were not dominated by big firms with large economies of
scale, but rather by smaller businesses who took on a flexible specialization. These firms were
able to take advantage of market niches and evolving demand in industries that ranged from
ceramics to industrial manufacturing. The institutions and culture of the communities these
firms organized in dissipated some of the advantages of scale through group buying, technology
development, and market research. This way of organizing business is an alternative to large-
scale production and highlights the advantages that specialized clusters can create.
5 Jacobs, J. (1969). 6 Piore, M. J., & Sabel, C. F. (1984).
CLUSTER ANALYSIS 13
"The Diamond of Competitive Advantage"
In 1990, Michael Porter developed the "diamond of competitive advantage" in The
Competitive Advantage of Nations, which highlighted four factors responsible for industry
clusters7:
• Factor Conditions: These factors of production are ones that all firms can benefit from.
For example, a specialized labor market, strong infrastructure, educational institutions,
and other externalities. If these factors are only present in one area, the probability of
agglomeration greatly increases.
• Demand Conditions: An established set of sophisticated and demanding local customers
is required for clustered firms to remain productive and keep technology up to date.
• Related and Supporting Industries: A strong base of local suppliers and related
industries will allow firms to have a connected web of upstream and downstream
relationships. This will lead to greater efficiency as firms evolve and improve their own
technological progression.
• Firm strategy, structure, and rivalry: If firms continually update their strategy and
invest in new capital, they will remain competitive. Firms with similar strategies
competing in close proximity will create a strong industrial structure. Healthy rivalry can
motivate firms to compete regionally and improve the industry dynamics.
Porter emphasized the importance firms put in understanding how location will affect
their strategy and performance. These four factors influence firms and explain why industry
clusters can be more competitive than isolated firms.
Cluster Traits
These studies propose a range of possible characteristics that lead to the formation of an
industrial cluster. Porter identifies factor conditions, demand conditions, related and supporting
industries, and regional strategy and competition as key determinants of how firms choose where
to locate. The difference between localization and urbanization economies shows that
agglomeration can occur because of labor market conditions, supplier localization, or the
potential for technological progress. Another trait of a cluster is specialization because the close 7 Porter, M. E. (1990).
CLUSTER ANALYSIS 14
proximity can create the scale necessary in developing a specific product of a regionally
integrated supply chain. Flexible specialization is an alternative form of business organization
and forms because firms look to take advantage of market niches and changing demand.
Cluster Ambiguity
Finally, Cortright stresses the controversy that pertains to cluster analysis in both the
theoretical and political realm. In Cortright's view, "Academics are looking to simplify, to
abstract, and to generalize: to find relationships that are consistent across a wide range of firms
and context."8 On the other hand, policymakers take a pragmatic approach that looks for an
explanation of challenges they see in their economic community. Feser and his colleagues, in
their paper, "Incorporating Spatial Analysis in Applied Industry Cluster Studies," explain this
ambiguity as "the complexity of the cluster concept as well as the significant range of policies
that clusters might inform dictate that no single definition is appropriate for all analytical or
policy needs."9 We keep this in mind as we explore the wide spectrum that encompasses cluster
analysis in the policy arena.
National Industry Cluster Templates
Edward Feser and Edward Bergman's study, "National Industry Cluster Templates: A
Framework for Applied Regional Cluster Analysis," attempts to create templates for the different
manufacturing clusters in the nation by using information on the 1994 input-output accounts
released by the Bureau of Economic Analysis10. They use the Standard Industrial Classification
(SIC) system, which defines the subsectors of various industries, to establish the direct and
indirect linkages between firms. Correlation analysis techniques based on patterns of sales and
purchases across 362 industries are used to develop a national set of benchmarks for industrial
clusters that have no regional context. These benchmarks "represent strategically important
alignments of detailed sectors."
Feser and Bergman found the metalworking cluster to be the largest in the nation due to
the large number of sectors that encompass primary metal, fabricated metal, and industrial
8Cortright, J., & Brookings Institution (2006). 9Feser, E. J., and others. (2001). 10 Feser, E., & Bergman, E. (February 01, 2000).
CLUSTER ANALYSIS 15
machinery industries, as well as sectors that spill into the electronic and electrical equipment
industries. The metalworking cluster shares component industries with 14 of the other 23
clusters in the nation that they identified.
In their conclusion, Feser and Bergman state, "The national templates do not constitute a
definitive 'vision' of the industry mix that could or even should develop in a region, but rather a
baseline picture of the regional industry mix across broad supply chains." The industries that
they have used in this study dip into a multitude of clusters and show an overarching view of the
possibilities of agglomeration in particular regions.
Christina Kelton, Margaret Pasquale, and Robert Rebelein update the work of Feser and
Bergman because of the change from collecting industry data using the SIC system to NAICS11.
Their study uses the 1997 input-output tables, which are based on the NAICS industrial
classifications. Using the same industrial correlation techniques as Feser and Bergman, the
NAICS industries produce substantially more concentrated results. The improved data allows
for the identification of 61 national cluster templates. In the study they used 483 different
NAICS classification, 88 of them occupying the metalworking cluster. Fabricated Metal
Products was the 41st ranked cluster, dipping into 19 various industries. Industrial Machinery
and Equipment was the 15th ranked cluster, encompassing 40 of the NAICS industries.
Kelton, Pasquale, and Rebelein concluded that these templates of the various national
clusters will create a foundation for more in depth regional analyses. This study has more
specific industry data, but creates a similar perspective of the cluster framework in the U.S that
Feser and Bergman found. The templates in both studies give analysts and policymakers
interested in cluster formation in a region a starting point to develop a more detailed
investigation.
Methodology In order to understand what types of industry characteristics and relationships would
determine a cluster we first examine the fabricated metal industry and all of its relevant
subsectors in the Salem region. From there, it becomes a matter of how to analyze the industry in
11 Kelton, C. M. L., Pasquale, M. K., & Rebelein, R. P. (April 01, 2008).
CLUSTER ANALYSIS 16
a meaningful way. We will do this by benchmarking Salem against other regions and further
analyzing its prospects for growth within this industry. Following this, we conduct a series of
micro analyses to develop an empirical review of the theoretical framework, including demand
conditions, factor conditions, and existence of related and supporting industries. Each of these
techniques will build the foundation for possible policy recommendations.
Benchmarking
This approach includes analyzing national, state, and county level trends. Specifically, we
begin by examining the past and present state of the fabricated metals industry in terms of
employment. By understanding these different regions we create a benchmark for growth within
Salem. Next, we conduct a brief analysis of the current state of wages within the industry. Using
U.S., Oregon, and Portland wage statistics, we build a thorough understanding of the wage
structure in Salem.
After having developed an understanding of where this industry has been and where it is
headed, we then begin to estimate and measure the prospect for growth in Salem. Using data
aggregated at the metropolitan (MSA) level, we construct an empirical model which uses the
level of fabricated metal employment across all MSAs relative to employment in the
manufacturing sector. We use this model to compare Salem’s actual level of employment to what
the model predicts. . Finally, we measure how much growth is required to reach both a national
level, and a cluster level of employment.
Micro Analysis
After understanding the potential for growth in Salem, we undergo a series of micro
analyses. Using the diamond of competitive advantagedeveloped by Porter, we evaluate Salem’s
capacity to foster a cluster. We begin by examining demand conditions and the existence of
related and supporting industries by means of an input-output analysis. Once a supply chain is
developed, we can apply these national linkages on a regional level to determine whether or not
the existence of downstream industries promotes growth within the industry at the MSA level.
The analysis of the Salem area concludes by assessing the local development of a quality
labor pool. Training programs throughout the state are compared and contrasted to establish a
thorough evaluation of relative fabricated metals training in Salem. Moreover, the disparities
CLUSTER ANALYSIS 17
between the different programs may suggest what the local training programs do well and how
they can improve.
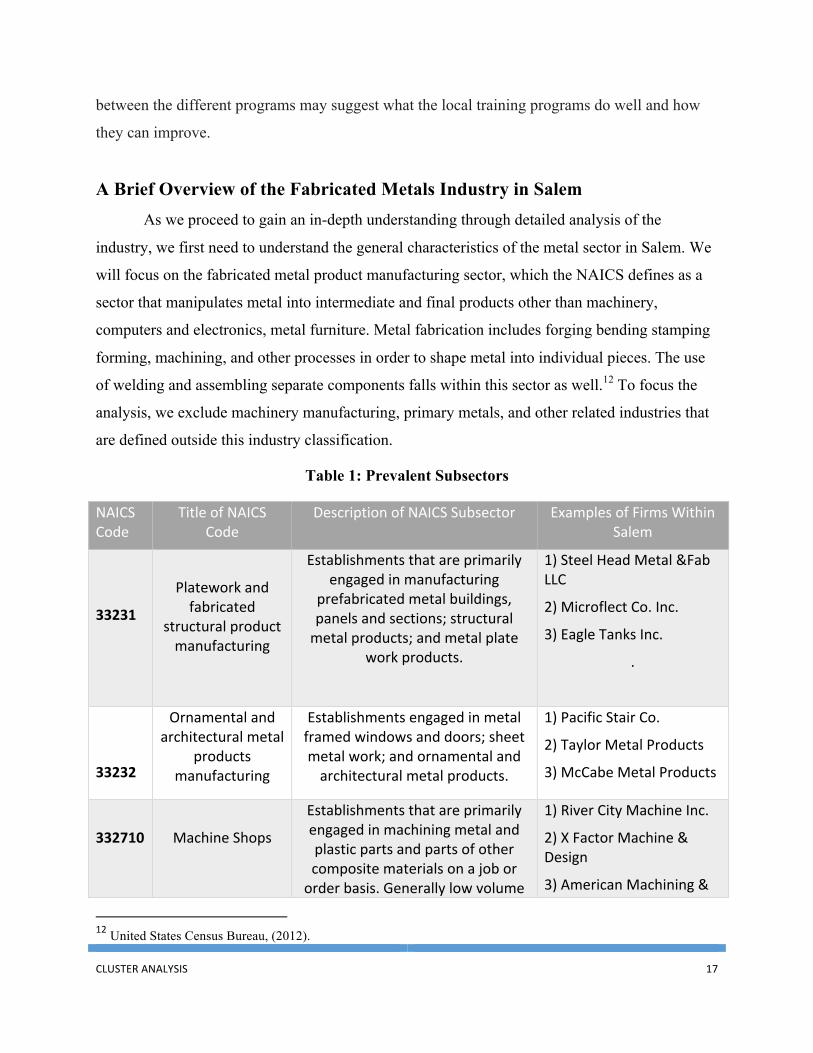
A Brief Overview of the Fabricated Metals Industry in Salem As we proceed to gain an in-depth understanding through detailed analysis of the
industry, we first need to understand the general characteristics of the metal sector in Salem. We
will focus on the fabricated metal product manufacturing sector, which the NAICS defines as a
sector that manipulates metal into intermediate and final products other than machinery,
computers and electronics, metal furniture. Metal fabrication includes forging bending stamping
forming, machining, and other processes in order to shape metal into individual pieces. The use
of welding and assembling separate components falls within this sector as well.12 To focus the
analysis, we exclude machinery manufacturing, primary metals, and other related industries that
are defined outside this industry classification.
Table 1: Prevalent Subsectors
NAICS Code
Title of NAICS Code
Description of NAICS Subsector Examples of Firms Within Salem
33231
Platework and fabricated
structural product manufacturing
Establishments that are primarily engaged in manufacturing
prefabricated metal buildings, panels and sections; structural metal products; and metal plate
work products.
1) Steel Head Metal &Fab LLC
2) Microflect Co. Inc.
3) Eagle Tanks Inc.
.
33232
Ornamental and architectural metal
products manufacturing
Establishments engaged in metal framed windows and doors; sheet metal work; and ornamental and architectural metal products.
1) Pacific Stair Co.
2) Taylor Metal Products
3) McCabe Metal Products
332710
Machine Shops
Establishments that are primarily engaged in machining metal and plastic parts and parts of other composite materials on a job or order basis. Generally low volume
1) River City Machine Inc.
2) X Factor Machine & Design
3) American Machining &
12 United States Census Bureau, (2012).
CLUSTER ANALYSIS 18
using various machine tools. Manufacturing Inc.
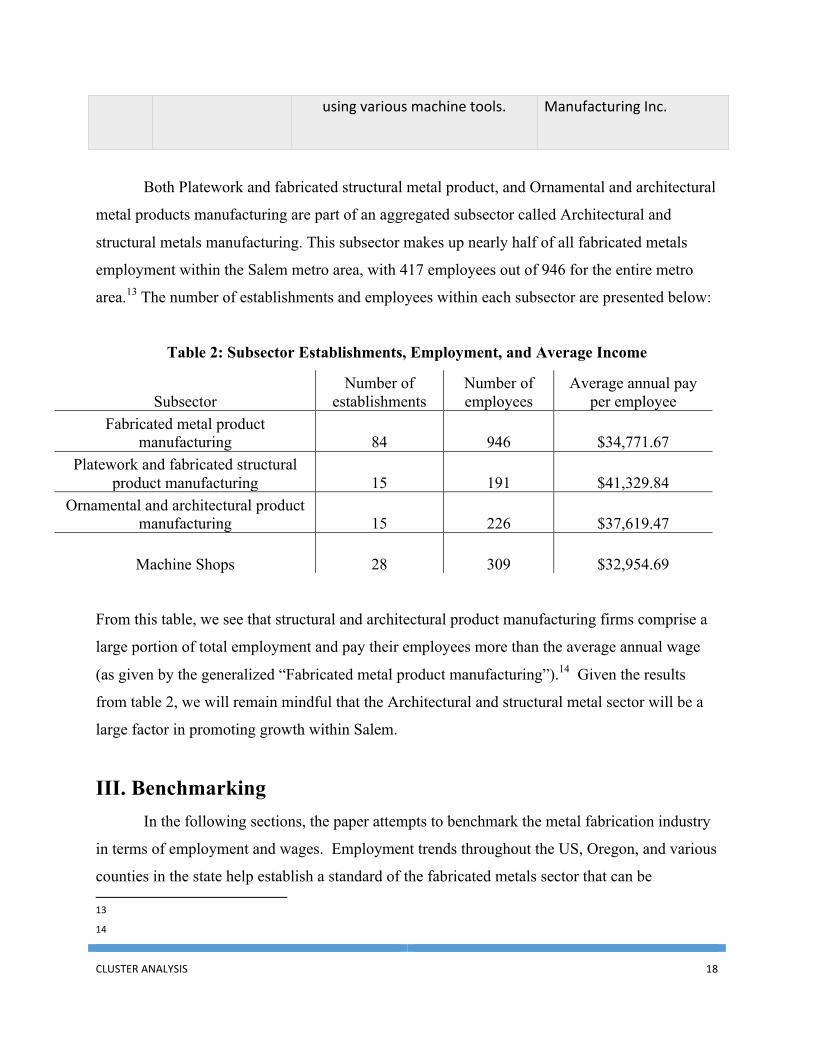
Both Platework and fabricated structural metal product, and Ornamental and architectural
metal products manufacturing are part of an aggregated subsector called Architectural and
structural metals manufacturing. This subsector makes up nearly half of all fabricated metals
employment within the Salem metro area, with 417 employees out of 946 for the entire metro
area.13 The number of establishments and employees within each subsector are presented below:
Table 2: Subsector Establishments, Employment, and Average Income
Subsector Number of
establishments Number of employees
Average annual pay per employee
Fabricated metal product manufacturing 84 946 $34,771.67
Platework and fabricated structural product manufacturing 15 191 $41,329.84
Ornamental and architectural product manufacturing 15 226 $37,619.47
Machine Shops 28 309 $32,954.69 From this table, we see that structural and architectural product manufacturing firms comprise a
large portion of total employment and pay their employees more than the average annual wage
(as given by the generalized “Fabricated metal product manufacturing”).14 Given the results
from table 2, we will remain mindful that the Architectural and structural metal sector will be a
large factor in promoting growth within Salem.
III. Benchmarking In the following sections, the paper attempts to benchmark the metal fabrication industry
in terms of employment and wages. Employment trends throughout the US, Oregon, and various
counties in the state help establish a standard of the fabricated metals sector that can be 13 14
CLUSTER ANALYSIS 19
compared to the current and present state of Salem. Though regional circumstances shape each
area differently, building a standard of the industry allows for a systematic analysis of Salem's
opportunities to grow.
Employment Trends: United States, Oregon State, and Select Oregon Counties
Employment in the US manufacturing sector has decreased significantly since the late
1990s. Both the recession of the early 2000s and the Great Recession multiplied the effect of an
already shrinking manufacturing labor force. Market trends show an industry that continues to
grow out of the trough it reached at the beginning of 2010. This modest employment growth is
observed in a range of manufacturing industries: food, chemical, plastic and rubber products,
primary metals, fabricated metal products, machinery, and transportation equipment.
One of the manufacturing industries that experienced the post-recession advances of
interest is the metal fabrication sector. Since 1998, employment in the metal fabrication industry
decreased by roughly 300,000 jobs.15 In line with this decrease in employment, the number of
establishments has decreased by roughly 8,000 firms since 1998. The fall in employment was
mild at the beginning of the new millennium, but experienced a large drop off from 1.76 million
to 1.51 million jobs from 2001 to 2003 due to a recession and mill consolidation.16 The industry
never fully recovered because of globalization and the emergence of Asian markets. Following
2008, the labor force began to plummet and hit a low of 1.27 million employees in 2010. The
U.S. experienced significant job growth in the metal fabrication industry, adding 60,000 workers
to the labor force over the course of the next year. Since then, the Federal Reserve Bank of St.
Louis reported 2.3% growth in the last quarter of the 2011 and 3.48% growth over the course of
2012.
As the fabricated metals sector changed over the course of this time period, so did the
manufacturing industry. Manufacturing throughout the U.S. experienced a 32 percent decrease
in employment whereas the metal fabrication sector experienced an 18 percent drop in the
number of employees. With this information, we see that metal fabrication improved as a
percentage of manufacturing employment throughout the U.S. from 9.9 to 11.9 percent
15 United States Census Bureau, (1998-2011). 16 Duensing, L. (2013, March 21).
CLUSTER ANALYSIS 20
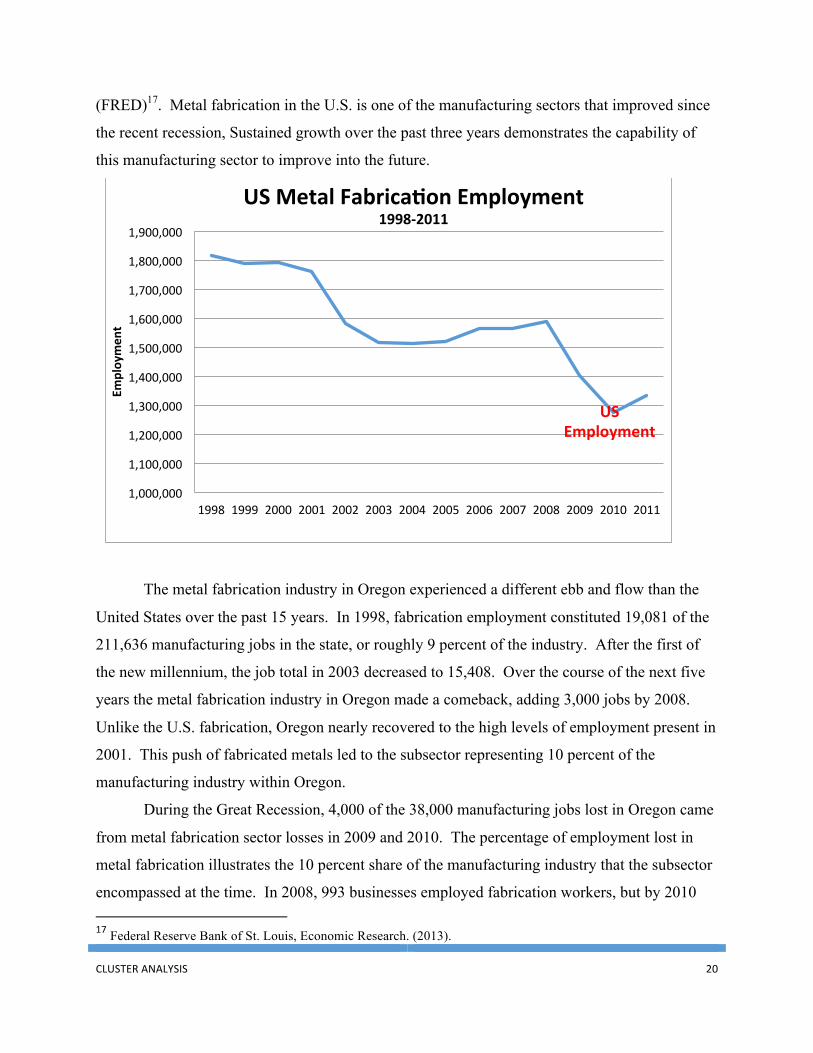
(FRED)17. Metal fabrication in the U.S. is one of the manufacturing sectors that improved since
the recent recession, Sustained growth over the past three years demonstrates the capability of
this manufacturing sector to improve into the future.
The metal fabrication industry in Oregon experienced a different ebb and flow than the
United States over the past 15 years. In 1998, fabrication employment constituted 19,081 of the
211,636 manufacturing jobs in the state, or roughly 9 percent of the industry. After the first of
the new millennium, the job total in 2003 decreased to 15,408. Over the course of the next five
years the metal fabrication industry in Oregon made a comeback, adding 3,000 jobs by 2008.
Unlike the U.S. fabrication, Oregon nearly recovered to the high levels of employment present in
2001. This push of fabricated metals led to the subsector representing 10 percent of the
manufacturing industry within Oregon.
During the Great Recession, 4,000 of the 38,000 manufacturing jobs lost in Oregon came
from metal fabrication sector losses in 2009 and 2010. The percentage of employment lost in
metal fabrication illustrates the 10 percent share of the manufacturing industry that the subsector
encompassed at the time. In 2008, 993 businesses employed fabrication workers, but by 2010 17 Federal Reserve Bank of St. Louis, Economic Research. (2013).
US Employment
1,000,000
1,100,000
1,200,000
1,300,000
1,400,000
1,500,000
1,600,000
1,700,000
1,800,000
1,900,000
1998 1999 2000 2001 2002 2003 2004 2005 2006 2007 2008 2009 2010 2011
Employmen
t
US Metal Fabrica9on Employment 1998-‐2011
CLUSTER ANALYSIS 21
the number of firms decreased to 901. The manufacturing industry slowly crept out of the hole
that the recession created, gaining 700 new jobs from 2010 to 2011. Metal fabrication in Oregon
injected nearly 800 of these jobs into the Oregon economy.
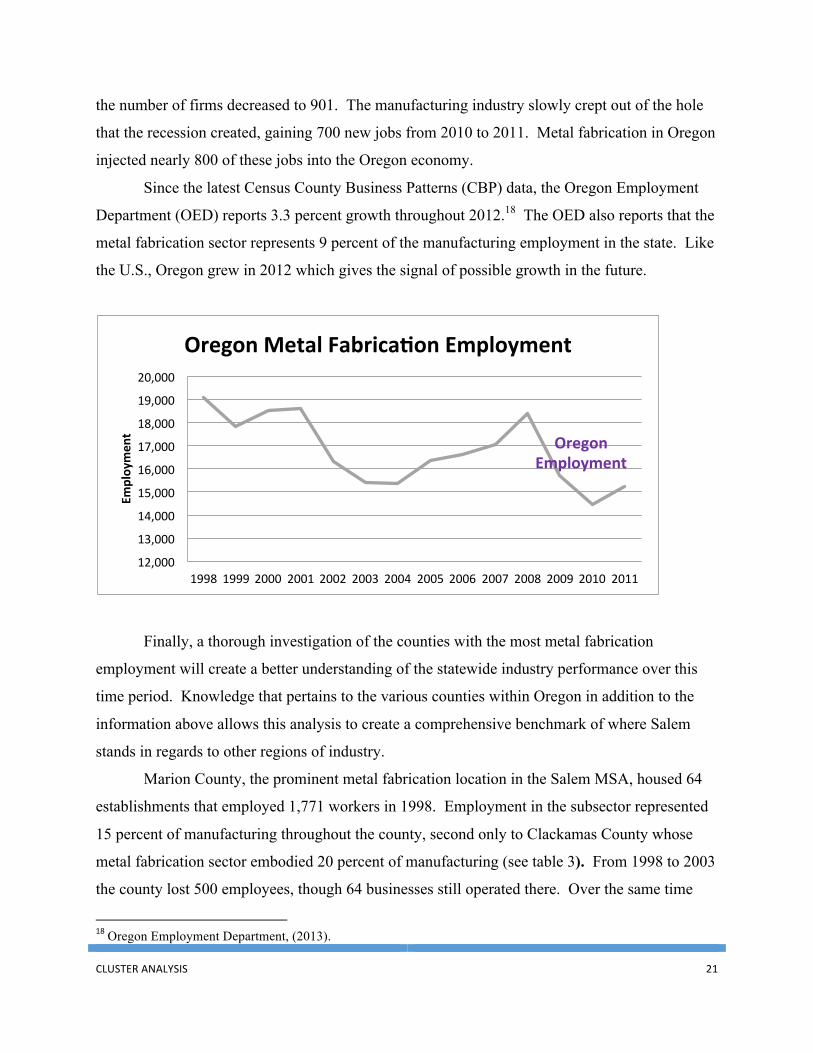
Since the latest Census County Business Patterns (CBP) data, the Oregon Employment
Department (OED) reports 3.3 percent growth throughout 2012.18 The OED also reports that the
metal fabrication sector represents 9 percent of the manufacturing employment in the state. Like
the U.S., Oregon grew in 2012 which gives the signal of possible growth in the future.
Finally, a thorough investigation of the counties with the most metal fabrication
employment will create a better understanding of the statewide industry performance over this
time period. Knowledge that pertains to the various counties within Oregon in addition to the
information above allows this analysis to create a comprehensive benchmark of where Salem
stands in regards to other regions of industry.
Marion County, the prominent metal fabrication location in the Salem MSA, housed 64
establishments that employed 1,771 workers in 1998. Employment in the subsector represented
15 percent of manufacturing throughout the county, second only to Clackamas County whose
metal fabrication sector embodied 20 percent of manufacturing (see table 3). From 1998 to 2003
the county lost 500 employees, though 64 businesses still operated there. Over the same time
18 Oregon Employment Department, (2013).
Oregon Employment
12,000
13,000
14,000
15,000
16,000
17,000
18,000
19,000
20,000
1998 1999 2000 2001 2002 2003 2004 2005 2006 2007 2008 2009 2010 2011
Employmen
t
Oregon Metal Fabrica9on Employment
CLUSTER ANALYSIS 22
period, Clackamas, Multnomah, and Washington counties lost 1,000, 1,800, and 660 employees,
respectively.
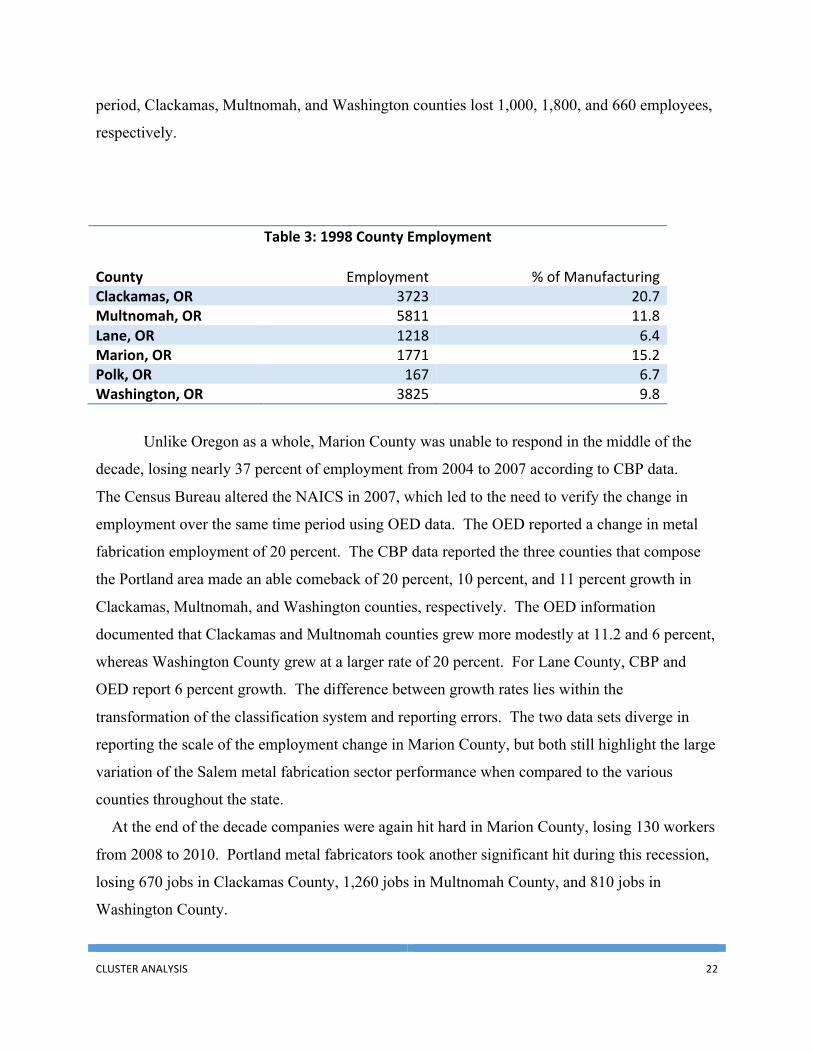
Table 3: 1998 County Employment
County Employment % of Manufacturing Clackamas, OR 3723 20.7 Multnomah, OR 5811 11.8 Lane, OR 1218 6.4 Marion, OR 1771 15.2 Polk, OR 167 6.7 Washington, OR 3825 9.8
Unlike Oregon as a whole, Marion County was unable to respond in the middle of the
decade, losing nearly 37 percent of employment from 2004 to 2007 according to CBP data.
The Census Bureau altered the NAICS in 2007, which led to the need to verify the change in
employment over the same time period using OED data. The OED reported a change in metal
fabrication employment of 20 percent. The CBP data reported the three counties that compose
the Portland area made an able comeback of 20 percent, 10 percent, and 11 percent growth in
Clackamas, Multnomah, and Washington counties, respectively. The OED information
documented that Clackamas and Multnomah counties grew more modestly at 11.2 and 6 percent,
whereas Washington County grew at a larger rate of 20 percent. For Lane County, CBP and
OED report 6 percent growth. The difference between growth rates lies within the
transformation of the classification system and reporting errors. The two data sets diverge in
reporting the scale of the employment change in Marion County, but both still highlight the large
variation of the Salem metal fabrication sector performance when compared to the various
counties throughout the state.
At the end of the decade companies were again hit hard in Marion County, losing 130 workers
from 2008 to 2010. Portland metal fabricators took another significant hit during this recession,
losing 670 jobs in Clackamas County, 1,260 jobs in Multnomah County, and 810 jobs in
Washington County.
CLUSTER ANALYSIS 23
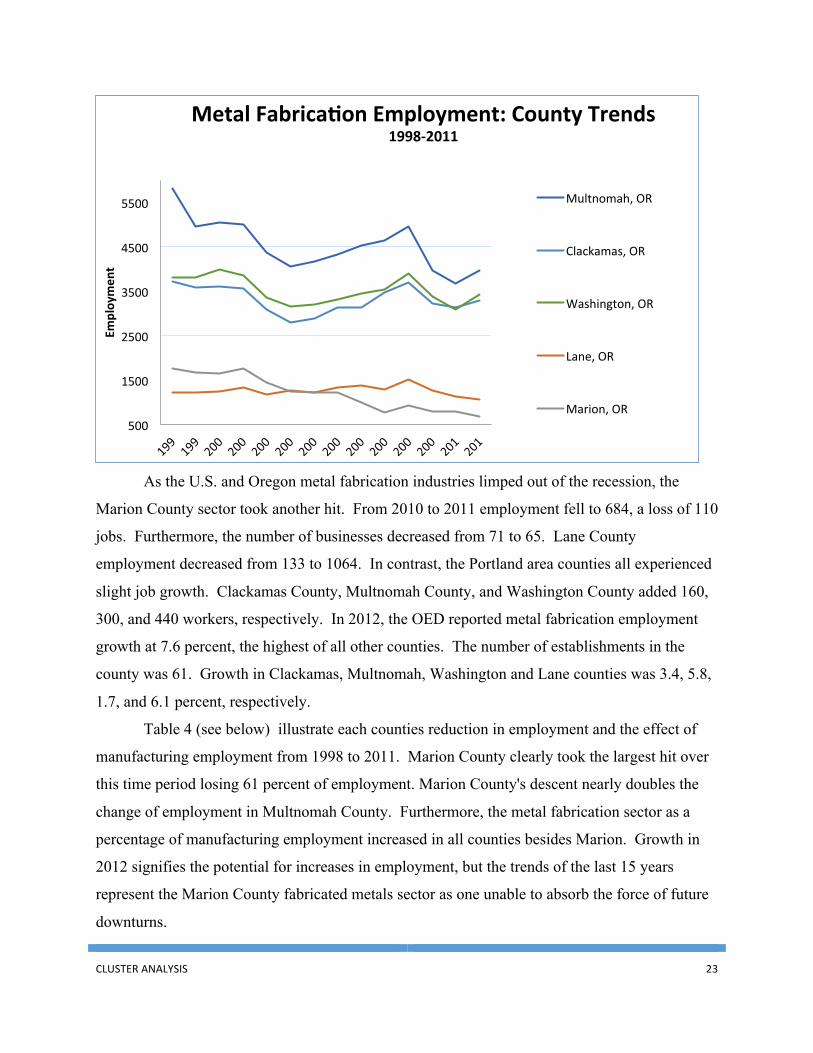
As the U.S. and Oregon metal fabrication industries limped out of the recession, the
Marion County sector took another hit. From 2010 to 2011 employment fell to 684, a loss of 110
jobs. Furthermore, the number of businesses decreased from 71 to 65. Lane County
employment decreased from 133 to 1064. In contrast, the Portland area counties all experienced
slight job growth. Clackamas County, Multnomah County, and Washington County added 160,
300, and 440 workers, respectively. In 2012, the OED reported metal fabrication employment
growth at 7.6 percent, the highest of all other counties. The number of establishments in the
county was 61. Growth in Clackamas, Multnomah, Washington and Lane counties was 3.4, 5.8,
1.7, and 6.1 percent, respectively.
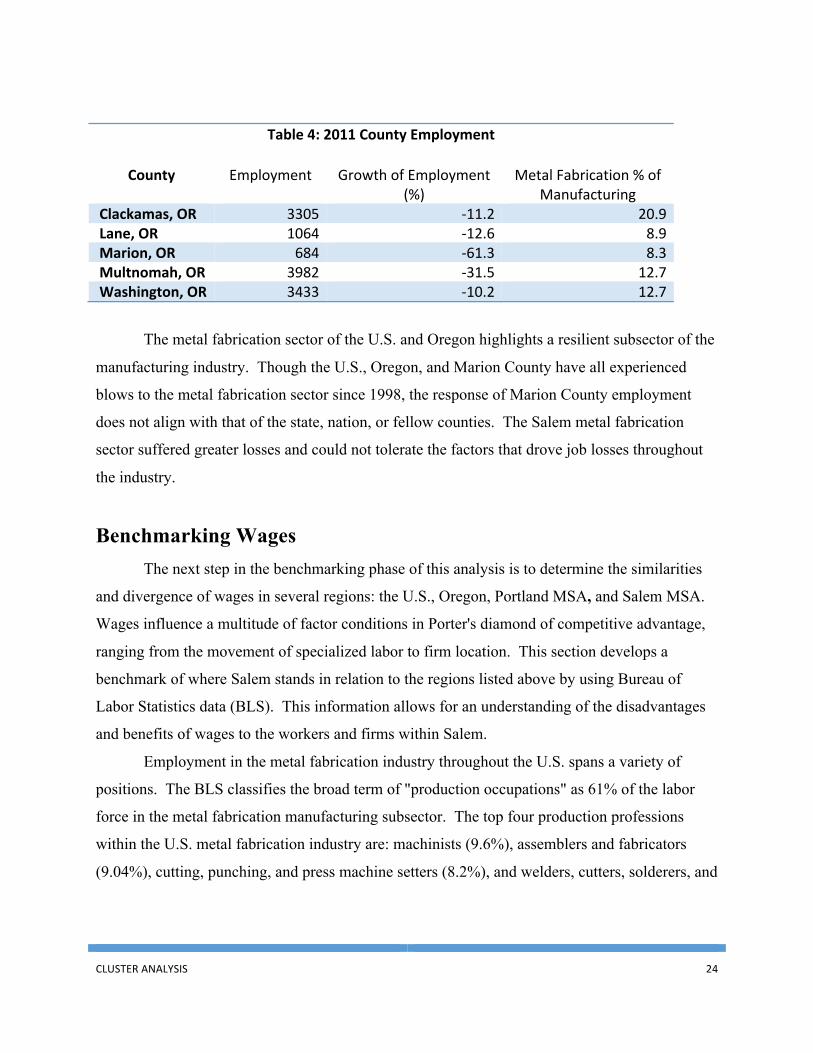
Table 4 (see below) illustrate each counties reduction in employment and the effect of
manufacturing employment from 1998 to 2011. Marion County clearly took the largest hit over
this time period losing 61 percent of employment. Marion County's descent nearly doubles the
change of employment in Multnomah County. Furthermore, the metal fabrication sector as a
percentage of manufacturing employment increased in all counties besides Marion. Growth in
2012 signifies the potential for increases in employment, but the trends of the last 15 years
represent the Marion County fabricated metals sector as one unable to absorb the force of future
downturns.
500
1500
2500
3500
4500
5500
Employmen
t Metal Fabrica9on Employment: County Trends
1998-‐2011
Multnomah, OR
Clackamas, OR
Washington, OR
Lane, OR
Marion, OR
CLUSTER ANALYSIS 24
Table 4: 2011 County Employment
County Employment Growth of Employment (%)
Metal Fabrication % of Manufacturing
Clackamas, OR 3305 -‐11.2 20.9 Lane, OR 1064 -‐12.6 8.9 Marion, OR 684 -‐61.3 8.3 Multnomah, OR 3982 -‐31.5 12.7 Washington, OR 3433 -‐10.2 12.7
The metal fabrication sector of the U.S. and Oregon highlights a resilient subsector of the
manufacturing industry. Though the U.S., Oregon, and Marion County have all experienced
blows to the metal fabrication sector since 1998, the response of Marion County employment
does not align with that of the state, nation, or fellow counties. The Salem metal fabrication
sector suffered greater losses and could not tolerate the factors that drove job losses throughout
the industry.
Benchmarking Wages The next step in the benchmarking phase of this analysis is to determine the similarities
and divergence of wages in several regions: the U.S., Oregon, Portland MSA, and Salem MSA.
Wages influence a multitude of factor conditions in Porter's diamond of competitive advantage,
ranging from the movement of specialized labor to firm location. This section develops a
benchmark of where Salem stands in relation to the regions listed above by using Bureau of
Labor Statistics data (BLS). This information allows for an understanding of the disadvantages
and benefits of wages to the workers and firms within Salem.
Employment in the metal fabrication industry throughout the U.S. spans a variety of
positions. The BLS classifies the broad term of "production occupations" as 61% of the labor
force in the metal fabrication manufacturing subsector. The top four production professions
within the U.S. metal fabrication industry are: machinists (9.6%), assemblers and fabricators
(9.04%), cutting, punching, and press machine setters (8.2%), and welders, cutters, solderers, and
CLUSTER ANALYSIS 25
brazers (6.9%).19 Of the four occupations within the U.S., machinists are paid the highest hourly
and yearly wages, whereas assemblers and fabricators are paid the lowest wages (See table 5).
Also, this benchmarking chooses to analyze the variations in wages of first-line supervisors to
determine the variations in wages of production managers. The national information will
become more relevant as we begin to benchmark the wages of the U.S., Oregon, and the Portland
MSA to each other and finally contrast each to the wages of the Salem MSA.
As the wage benchmarking begins two caveats must be put in place. Firstly, the first-line
supervisor data does not adjust for the cost of living of these individuals. Different cost of living
arrangements occur across the nation and Oregon which makes this analysis effective only if this
is taken into consideration. Secondly, the wage data for all five occupations in Oregon, Portland,
and Salem ranges across all manufacturing production. This skews the data upward for a large
metropolitan area like Portland when compared to one smaller like Salem. Certain types of
manufacturing fields will pay individuals higher wages, as this data does not generate a
difference between higher skilled labor with similar production position titles. The
benchmarking proceeds with these two cautions in mind.
Compared to the U.S., Oregon wages for the four top positions in the metal fabrication
industry experienced some disparity. Employers in Oregon compensated machinists with a
salary $6,210 greater than the national average and welders with a $1,300 higher yearly wage.
Assemblers and fabricators also received a salary $560 greater than the national average.
Median yearly wage for press machine setters were slightly lower in Oregon when compared to
the U.S. The first-line supervisors in Oregon received a salary $3,250 less than national
averages.
In Portland, all five production positions paid higher wages when compared to Oregon.
This can be expected as Portland encompasses the largest production area in Oregon, drawing
many of the high skilled workers in the state. Also, the large manufacturers within the area
harbor some of the most efficient and skilled first-line supervisors who in turn will receive
higher than average wages. One of the benefits of a large, urbanized area is the ability to pull
from a large labor pool which leads to manufacturers obtaining some of the most skilled workers
in the region.
19 Bureau of Labor Statistics, (2012).
CLUSTER ANALYSIS 26
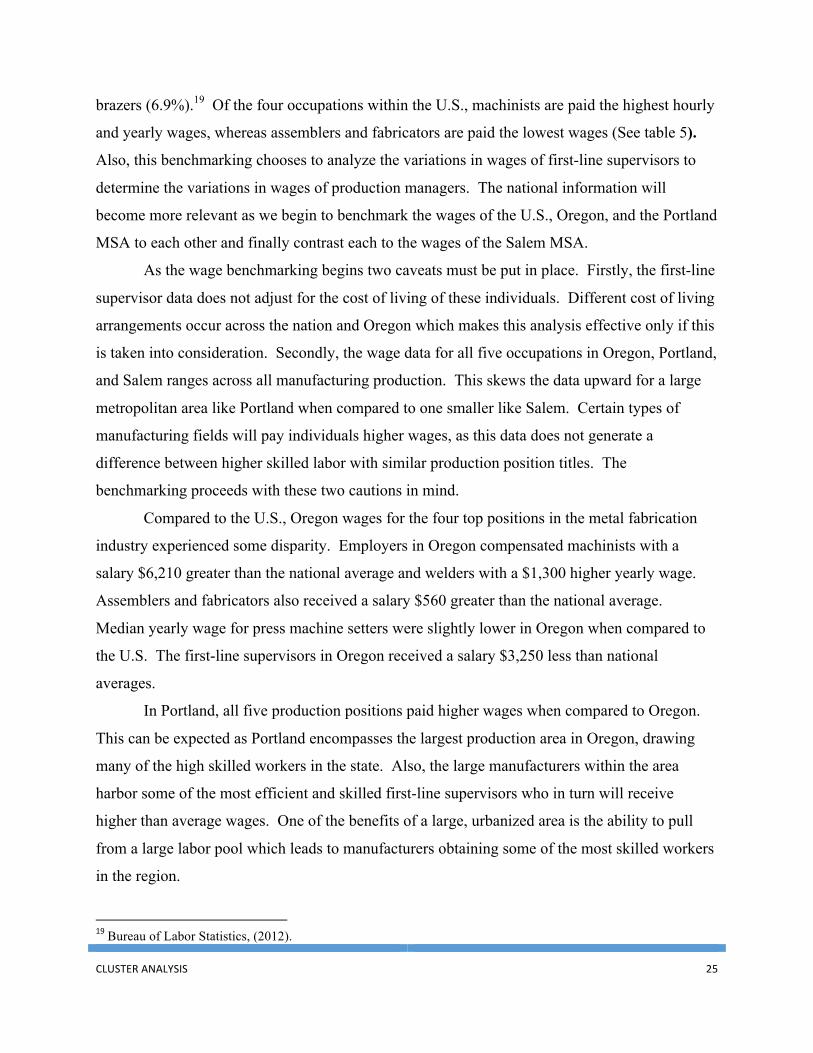
In the metropolitan area of Salem, three of the top production positions within the metal
fabrication sector paid lower yearly wages when compared to Oregon. Likewise, the average
salaries of these three positions were lower than U.S. averages. The only occupations that had
higher salaries ($1,460) were press machine setters. A similar wage divergence occurs when
Salem is compared to the Portland MSA. Again, press machine setters are the only positions that
are paid higher wages ($1,830) in the Salem area. The top production occupation, machinist,
received a salary $6,720 higher in the Portland area when compared to Salem. Lower wages in
three of the top four production positions, or 25 percent of employment, in Salem can be a real
hindrance to drawing the most highly skilled workers to the area. On the other hand, it may
suggest that Salem metal fabricators are using somewhat lower-skilled workers.
Finally, there is a large difference in the salaries of first-line supervisors. The U.S.,
Oregon, and Portland MSA have salaries for these employees of $14,210, $10,960, and $14,650,
respectively. Again, first-line managers only represent 4.34 percent of employment in the metal
fabrication sector and this data can create unreliable conclusions when comparing across regions
with varying manufacturing structures
Table 5: Regional and Occupational Wage Comparisons
Machinists Assemblers and
Fabricators
Cutting, punching, and press machine setters
Welders, cutters,
solderers, and
brazers
First-line supervisors/managers
of production and operating workers
Percentage of Metal Fabrication
Employment
9.58% 9.04% 8.24% 6.90% 4.34%
U.S. Median Hourly Wages (MHW)
$18.12 $14.60 $15.21 $17.29 $26.22
US Yearly Wages (YW)
$38,920 $31,980 $32,730 $35,960 $57,480
Oregon MHW $21.40 $13.86 $15.12 $17.75 $25.17 Oregon YW $45,130 $32,560 $32,210 $37,260 $54,230
Portland MSA MHW $21.53 $15.36 $15.15 $18.79 $27.14 Portland YW $45,430 $32,590 $32,360 $38,780 $57,920
Salem MSA MHW $18.90 $12.46 $16.50 $16.63 $19.13 Salem YW $38,710 $28,270 $34,190 $35,760 $43,270
Data derived from May 2012, Bureau of Labor Statistics
CLUSTER ANALYSIS 27
Many conditions drive these differences, which makes it difficult to draw conclusions as
to why these variations occur. The landscape of the wage situation in Salem, Portland, Oregon,
and the U.S. shows an environment where Salem lags behind in most of the top employment
categories. The wages of the top production occupations shed light on the composition of the
labor force in Salem. With this understanding of the past and current state of the industry, we can
begin measuring the potential Salem has for growth.
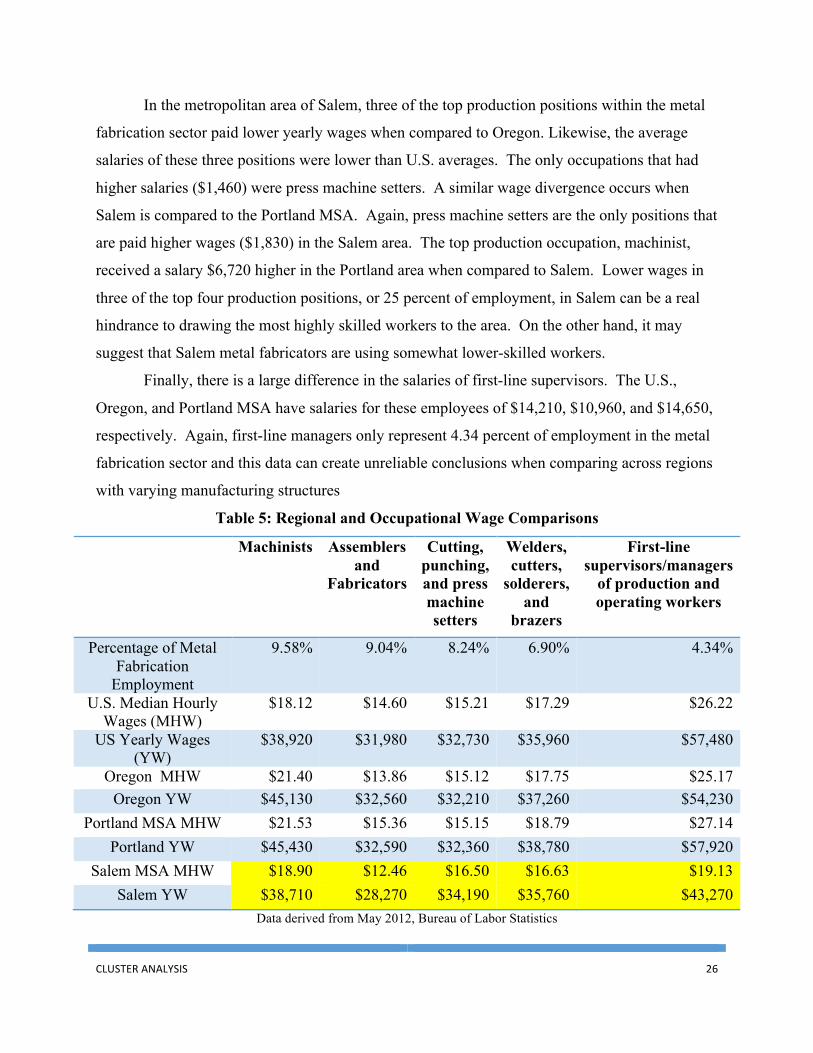
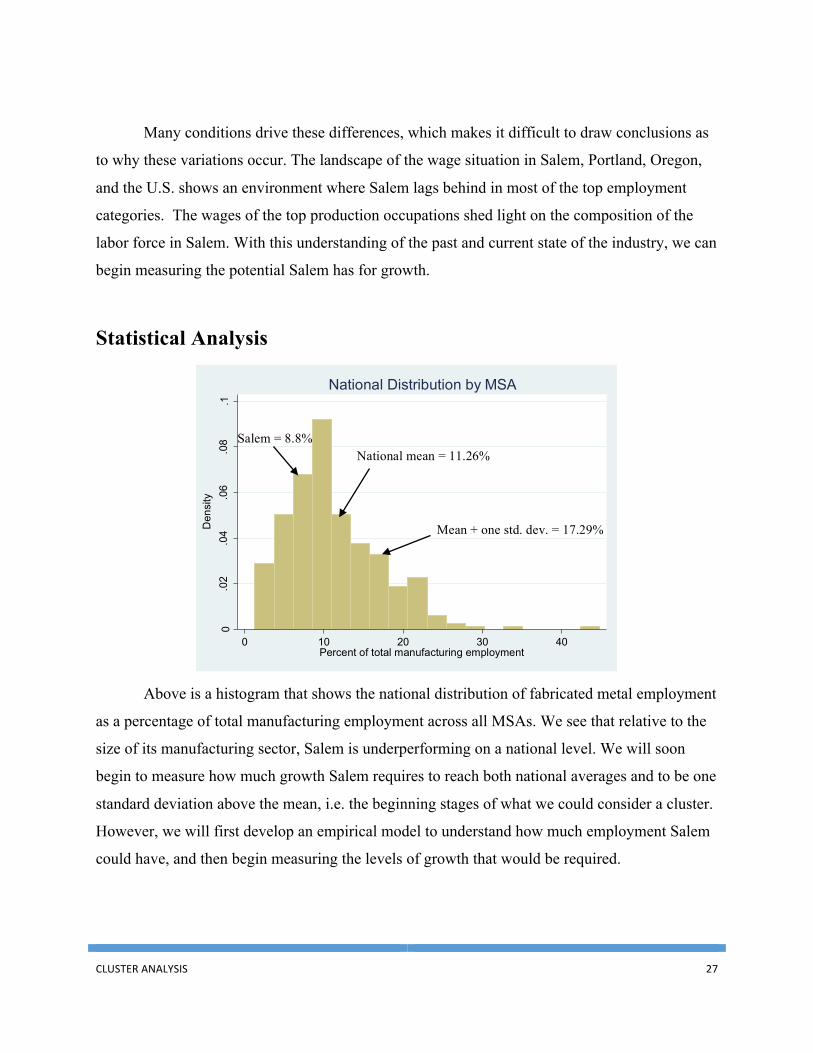
Statistical Analysis
Above is a histogram that shows the national distribution of fabricated metal employment
as a percentage of total manufacturing employment across all MSAs. We see that relative to the
size of its manufacturing sector, Salem is underperforming on a national level. We will soon
begin to measure how much growth Salem requires to reach both national averages and to be one
standard deviation above the mean, i.e. the beginning stages of what we could consider a cluster.
However, we will first develop an empirical model to understand how much employment Salem
could have, and then begin measuring the levels of growth that would be required.
0.0
2.0
4.0
6.0
8.1
Den
sity
0 10 20 30 40Percent of total manufacturing employment
National Distribution by MSA
Salem = 8.8%National mean = 11.26%
Mean + one std. dev. = 17.29%
CLUSTER ANALYSIS 28
Baseline Model
This section is intended to analyze how employment in the fabricated metals sector
deviates from expected levels within regions. To do this, we have gathered data at the MSA
level, which includes levels of employment in the fabricated metals industry; employment levels
in the manufacturing industry; and the size of the population. In order to measure how a given
region deviates from what we would expect, we will run an ordinary least squares regression
using fabricated metals employment as the dependent variable, with population and
manufacturing employment as our explanatory variables. Once we have generated a model that
explains a large portion of the data, i.e. a high R-squared, we can then generate predicted values
based on the size of the population and manufacturing sectors of each MSA. Using predicted
levels of employment and their residuals, we can see how the observed levels of employment in
each region deviates from what our model predicts. This allows us to benchmark Salem on a
national level, as well as against other similar regions. We will also be able to identify clusters
by examining regions that deviate substantially from its predicted values. Finally, regions with
very large observed deviations can be used as a point of reference in terms of what may cause a
region to have large concentrations of employment in the fabricated metals industry.
To begin the analysis, we look at the most basic variables that would influence
employment of the fabricated metals industry within an MSA, i.e. the size of the population and
manufacturing sector. From this, we have a baseline model:
𝐹𝑎𝑏𝑀𝑒𝑡𝑎𝑙! = 𝛽! + 𝛽!𝑃𝑜𝑝! + 𝛽!𝑀𝑎𝑛𝑢𝑓𝑎𝑐𝑡𝑢𝑟𝑖𝑛𝑔! + 𝑢!
Where 𝐹𝑎𝑏𝑀𝑒𝑡𝑎𝑙! is total employment in the fabricated metals industry in metropolitan area i;
𝑃𝑜𝑝! is total population in metropolitan area i; and 𝑀𝑎𝑛𝑢𝑓𝑎𝑐𝑡𝑢𝑟𝑖𝑛𝑔! is total manufacturing
employment in area i.
Theoretically, we would expect the coefficients for the population and manufacturing
variables to be positive. For the simple model, it is intuitive to assume that largely populated
metropolitan areas would have greater amounts of employment in the fabricated metals industry.
Likewise, increased manufacturing employment would increase employment in the industry.
This could be for various reasons, one of which might be that metro areas with larger
manufacturing sectors may have environments that foster competitive advantages for local
businesses. Other manufacturing sectors are also key suppliers, while others are large buyers of
fabricated metals products, meaning sizeable demand for these products requires more
CLUSTER ANALYSIS 29
employment to meet that demand. Another reason could be that geographic endowments, such as
convenient access to bodies of water, offer competitive advantages to manufacturing industry
businesses that locate in those regions.
Controlling for Region
We are interested in locating and understanding all of the relevant factors that would
contribute to a cluster forming. Doing so would requires analyzing how different regions in the
United States might affect levels of fabricated metals employment. Expanding our baseline
model to include different regions, we have the following model:
𝐹𝑎𝑏𝑀𝑒𝑡𝑎𝑙! = 𝛽! + 𝛽!𝑃𝑜𝑝! + 𝛽!𝑀𝑎𝑛𝑢𝑓𝑎𝑐𝑡𝑢𝑟𝑖𝑛𝑔! + 𝛽!𝑅𝑒𝑔𝑖𝑜𝑛!! + 𝑢!,
where 𝑅𝑒𝑔𝑖𝑜𝑛!!is a set of dummy variables that control for various region-specific effects. Each
region is defined by the Census Bureau, and consists of the following:
• New England = New Hampshire, Vermont, Massachusetts, Rhode Island, Connecticut,
and Maine.
• Mid-Atlantic = New York, Pennsylvania, and New Jersey.
• East North Central = Wisconsin, Michigan, Illinois, Indiana, and Ohio.
• West North Central = Missouri, North Dakota, South Dakota, Nebraska, Kansas,
Minnesota, and Iowa.
• South Atlantic = Delaware, Maryland, Virginia, West Virginia, North Carolina, South
Carolina, Georgia, and Florida.
• East South Central = Kentucky, Tennessee, Mississippi, and Alabama.
• West South Central = Oklahoma, Texas, Arkansas, and Louisiana.
• Mountain = Idaho, Montana, Wyoming, Nevada, Utah, Colorado, Arizona, and New
Mexico.
• Pacific = Alaska, Washington, Oregon, California, and Hawaii.
The regression will not be able to include all of the regions. In order to avoid multicollinearity
between these dummy variables and the constant, we excluded the metro regions that cross state
boarders. The constant will then be largely representative of the region that will be left out from
the regression.
CLUSTER ANALYSIS 30
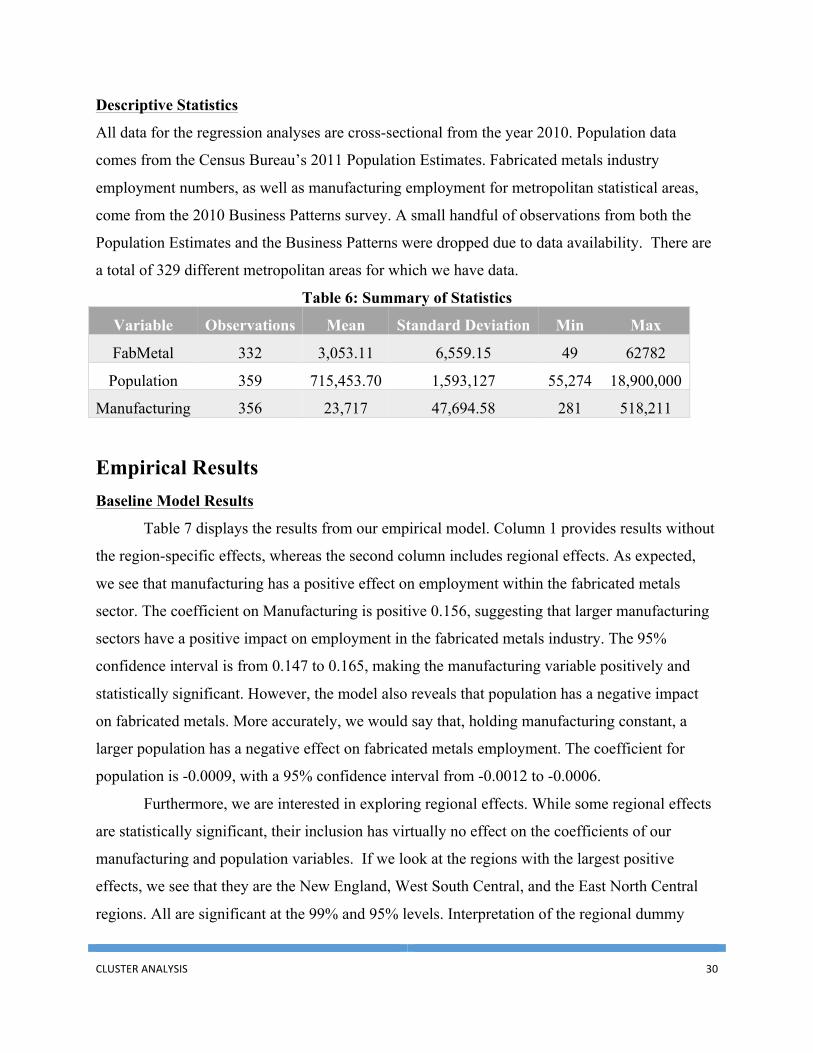
Descriptive Statistics
All data for the regression analyses are cross-sectional from the year 2010. Population data
comes from the Census Bureau’s 2011 Population Estimates. Fabricated metals industry
employment numbers, as well as manufacturing employment for metropolitan statistical areas,
come from the 2010 Business Patterns survey. A small handful of observations from both the
Population Estimates and the Business Patterns were dropped due to data availability. There are
a total of 329 different metropolitan areas for which we have data.
Table 6: Summary of Statistics
Variable Observations Mean Standard Deviation Min Max
FabMetal 332 3,053.11 6,559.15 49 62782
Population 359 715,453.70 1,593,127 55,274 18,900,000
Manufacturing 356 23,717 47,694.58 281 518,211
Empirical Results Baseline Model Results
Table 7 displays the results from our empirical model. Column 1 provides results without
the region-specific effects, whereas the second column includes regional effects. As expected,
we see that manufacturing has a positive effect on employment within the fabricated metals
sector. The coefficient on Manufacturing is positive 0.156, suggesting that larger manufacturing
sectors have a positive impact on employment in the fabricated metals industry. The 95%
confidence interval is from 0.147 to 0.165, making the manufacturing variable positively and
statistically significant. However, the model also reveals that population has a negative impact
on fabricated metals. More accurately, we would say that, holding manufacturing constant, a
larger population has a negative effect on fabricated metals employment. The coefficient for
population is -0.0009, with a 95% confidence interval from -0.0012 to -0.0006.
Furthermore, we are interested in exploring regional effects. While some regional effects
are statistically significant, their inclusion has virtually no effect on the coefficients of our
manufacturing and population variables. If we look at the regions with the largest positive
effects, we see that they are the New England, West South Central, and the East North Central
regions. All are significant at the 99% and 95% levels. Interpretation of the regional dummy
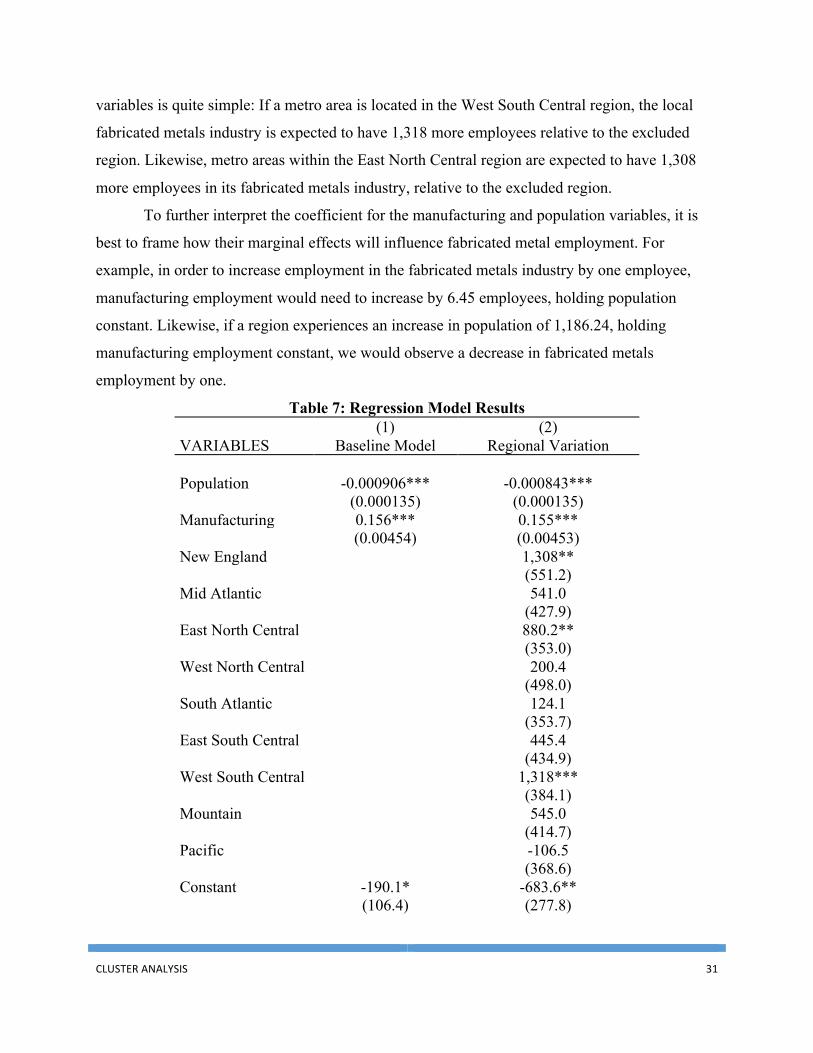
CLUSTER ANALYSIS 31
variables is quite simple: If a metro area is located in the West South Central region, the local
fabricated metals industry is expected to have 1,318 more employees relative to the excluded
region. Likewise, metro areas within the East North Central region are expected to have 1,308
more employees in its fabricated metals industry, relative to the excluded region.
To further interpret the coefficient for the manufacturing and population variables, it is
best to frame how their marginal effects will influence fabricated metal employment. For
example, in order to increase employment in the fabricated metals industry by one employee,
manufacturing employment would need to increase by 6.45 employees, holding population
constant. Likewise, if a region experiences an increase in population of 1,186.24, holding
manufacturing employment constant, we would observe a decrease in fabricated metals
employment by one.
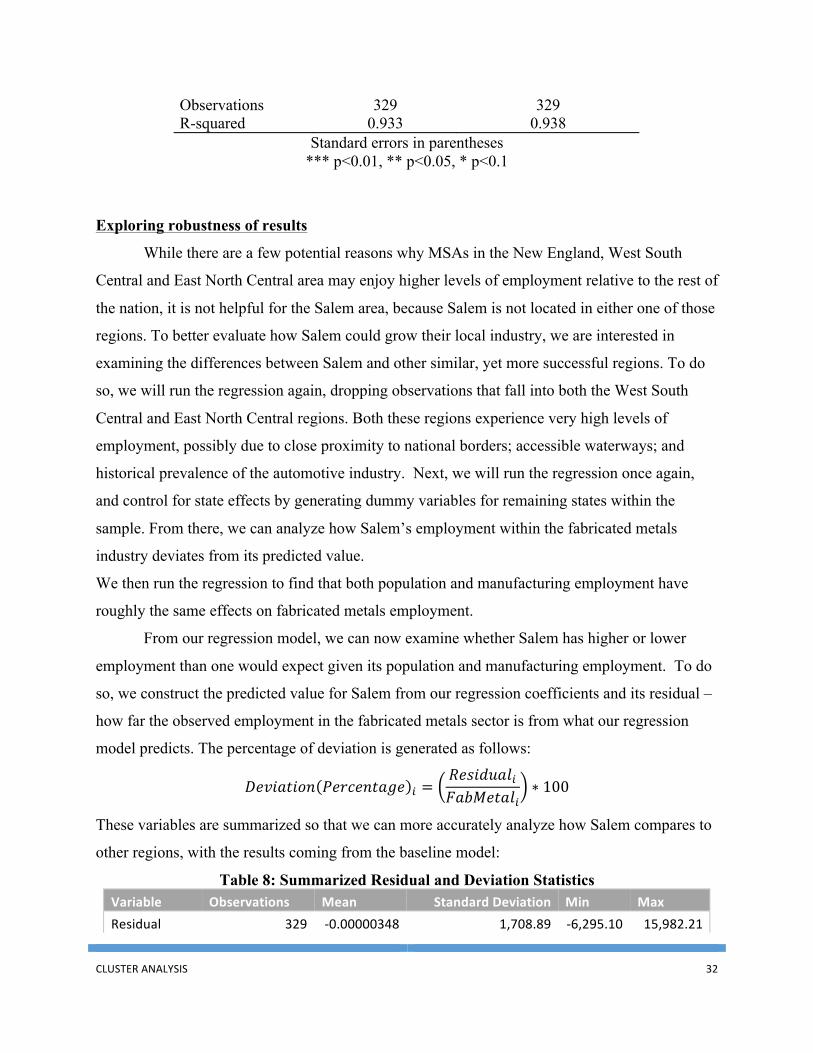
Table 7: Regression Model Results (1) (2) VARIABLES Baseline Model Regional Variation Population -0.000906*** -0.000843*** (0.000135) (0.000135) Manufacturing 0.156*** 0.155*** (0.00454) (0.00453) New England 1,308** (551.2) Mid Atlantic 541.0 (427.9) East North Central 880.2** (353.0) West North Central 200.4 (498.0) South Atlantic 124.1 (353.7) East South Central 445.4 (434.9) West South Central 1,318*** (384.1) Mountain 545.0 (414.7) Pacific -106.5 (368.6) Constant -190.1* -683.6** (106.4) (277.8)
CLUSTER ANALYSIS 32
Observations 329 329 R-squared 0.933 0.938
Standard errors in parentheses *** p<0.01, ** p<0.05, * p<0.1
Exploring robustness of results
While there are a few potential reasons why MSAs in the New England, West South
Central and East North Central area may enjoy higher levels of employment relative to the rest of
the nation, it is not helpful for the Salem area, because Salem is not located in either one of those
regions. To better evaluate how Salem could grow their local industry, we are interested in
examining the differences between Salem and other similar, yet more successful regions. To do
so, we will run the regression again, dropping observations that fall into both the West South
Central and East North Central regions. Both these regions experience very high levels of
employment, possibly due to close proximity to national borders; accessible waterways; and
historical prevalence of the automotive industry. Next, we will run the regression once again,
and control for state effects by generating dummy variables for remaining states within the
sample. From there, we can analyze how Salem’s employment within the fabricated metals
industry deviates from its predicted value.
We then run the regression to find that both population and manufacturing employment have
roughly the same effects on fabricated metals employment.
From our regression model, we can now examine whether Salem has higher or lower
employment than one would expect given its population and manufacturing employment. To do
so, we construct the predicted value for Salem from our regression coefficients and its residual –
how far the observed employment in the fabricated metals sector is from what our regression
model predicts. The percentage of deviation is generated as follows:
𝐷𝑒𝑣𝑖𝑎𝑡𝑖𝑜𝑛 𝑃𝑒𝑟𝑐𝑒𝑛𝑡𝑎𝑔𝑒 ! =𝑅𝑒𝑠𝑖𝑑𝑢𝑎𝑙!𝐹𝑎𝑏𝑀𝑒𝑡𝑎𝑙!
∗ 100
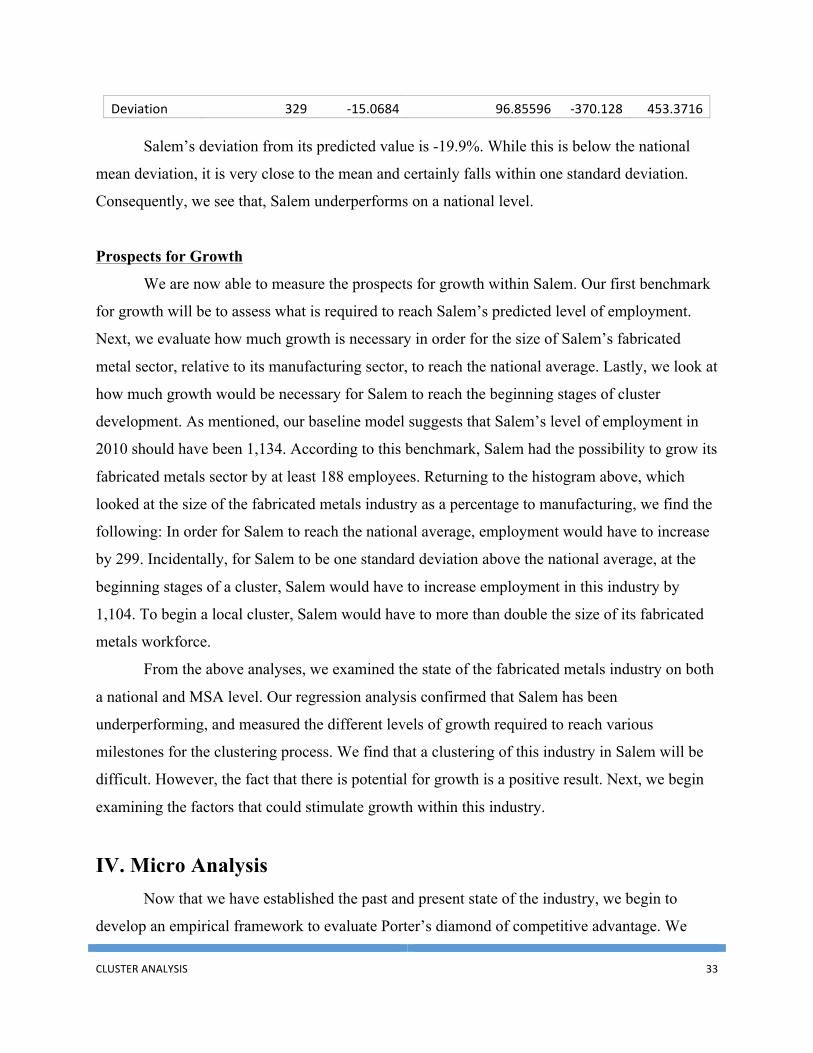
These variables are summarized so that we can more accurately analyze how Salem compares to
other regions, with the results coming from the baseline model:
Table 8: Summarized Residual and Deviation Statistics Variable Observations Mean Standard Deviation Min Max Residual 329 -‐0.00000348 1,708.89 -‐6,295.10 15,982.21
CLUSTER ANALYSIS 33
Deviation 329 -‐15.0684 96.85596 -‐370.128 453.3716
Salem’s deviation from its predicted value is -19.9%. While this is below the national
mean deviation, it is very close to the mean and certainly falls within one standard deviation.
Consequently, we see that, Salem underperforms on a national level.
Prospects for Growth
We are now able to measure the prospects for growth within Salem. Our first benchmark
for growth will be to assess what is required to reach Salem’s predicted level of employment.
Next, we evaluate how much growth is necessary in order for the size of Salem’s fabricated
metal sector, relative to its manufacturing sector, to reach the national average. Lastly, we look at
how much growth would be necessary for Salem to reach the beginning stages of cluster
development. As mentioned, our baseline model suggests that Salem’s level of employment in
2010 should have been 1,134. According to this benchmark, Salem had the possibility to grow its
fabricated metals sector by at least 188 employees. Returning to the histogram above, which
looked at the size of the fabricated metals industry as a percentage to manufacturing, we find the
following: In order for Salem to reach the national average, employment would have to increase
by 299. Incidentally, for Salem to be one standard deviation above the national average, at the
beginning stages of a cluster, Salem would have to increase employment in this industry by
1,104. To begin a local cluster, Salem would have to more than double the size of its fabricated
metals workforce.
From the above analyses, we examined the state of the fabricated metals industry on both
a national and MSA level. Our regression analysis confirmed that Salem has been
underperforming, and measured the different levels of growth required to reach various
milestones for the clustering process. We find that a clustering of this industry in Salem will be
difficult. However, the fact that there is potential for growth is a positive result. Next, we begin
examining the factors that could stimulate growth within this industry.
IV. Micro Analysis Now that we have established the past and present state of the industry, we begin to
develop an empirical framework to evaluate Porter’s diamond of competitive advantage. We
CLUSTER ANALYSIS 34
begin by examining demand conditions and related and supporting industries through an input-
output analysis. These two cluster traits are tested using a case study to see if their presence is
imperative at a local level. Following these analyses, we analyze factor conditions, namely those
that affect the quality of the local labor pool through a series of training program analyses in the
Oregon region.
Input-Output Analysis
Clusters of firms occur because those firms are related in such a way that proximate
location to each other is beneficial. An important way that firms may be related is through their
purchases of each other’s products for inputs. Being close to each other lowers the costs of
transporting inputs and outputs. It can also facilitate close communication about specialization
of inputs for each other. Understanding these supply-chain links can be quite important for
developing regional policies to encourage business clusters.
For example, platework and fabricated structure manufacturing is a relatively strong
subsector in the fabricated metals industry in Salem. To encourage more firms in the fabricated
metals industry to locate in Salem, one possible policy option would be to strengthen the
presence of this sector’s primary downstream and upstream industries in the Salem area.
Input-output analysis is a standard method to examine upstream and downstream supply-
chain links. It involves examination of data on input purchases one sector makes from other
sectors in order to produce its output. In the following, we conduct an input-output analysis of
the fabricated metals sector in the U.S., as well as a similar analysis of the sub-sectors in
fabricated metals that are most common in the Salem area.
Summary Level
We first begin with an analysis of the upstream and downstream relationships for the
fabricated metals sector in aggregate. Upstream industries are those that provide inputs into the
fabricated metals sector, whereas downstream industries are those that purchase fabricated
metals products as inputs. The data for these input and output relationships between sectors of
the economy come from the BEA’s website20. For our purposes, we use data from “The Use of
20 www.bea.gov.
CLUSTER ANALYSIS 35
Commodities before Redefinitions”, which includes data scaled to producer’s prices in millions
of dollars. By analyzing relatively large levels of purchases between industries, we can identify
the major downstream and upstream sectors for the fabricated metals sector, thereby deriving a
basic supply chain.
Figure__ diagrams the major supply chain relationships for the fabricated metals sector. The
percentages show what percent each specific industry flow makes up of the sum of all upstream
or downstream purchases. For example, we see that primary metals makes up 35.58% of total
fabricated metal inputs, and the construction industry makes up 16.1% of total fabricated metal
output.
• Upstream Industries:
o Primary metals (35.58%)
o Fabricated metals (17.51%)
o Wholesale trade (6.54%)
• Downstream Industries:
o Construction (16.1%)
o Motor vehicles, bodies and trailers, and parts (13.34%)
o Machinery (11.87%)
o Fabricated metals (11.41%)
o Food and beverage and tobacco products (4.37%)
o Other Transportation Equipment (4.42%)
The supply-chain diagram shows the basic flow of goods between different industries. The
percentages show what portion that specific industry flow makes up of all flows. Notice with the
list above that fabricated metals is both a downstream and upstream industry to itself. The reason
is pretty simple: the data is at a summary level, and so within the fabricated metals industry are
more detailed subsectors that act as upstream industries to other subsectors and so on.
Detailed Level
We can further explore a more detailed level supply-chains for subsectors of the
fabricated metals sector. To get this level of detail, we must turn to historical benchmark input-
output from the BEA, which are only available up until 2002. We discuss some of the
CLUSTER ANALYSIS 36
disadvantages of using data from different time periods in the appendix, but for now we will
continue our analysis with the assumption that the industry relationships have not changed
substantially since 2002.
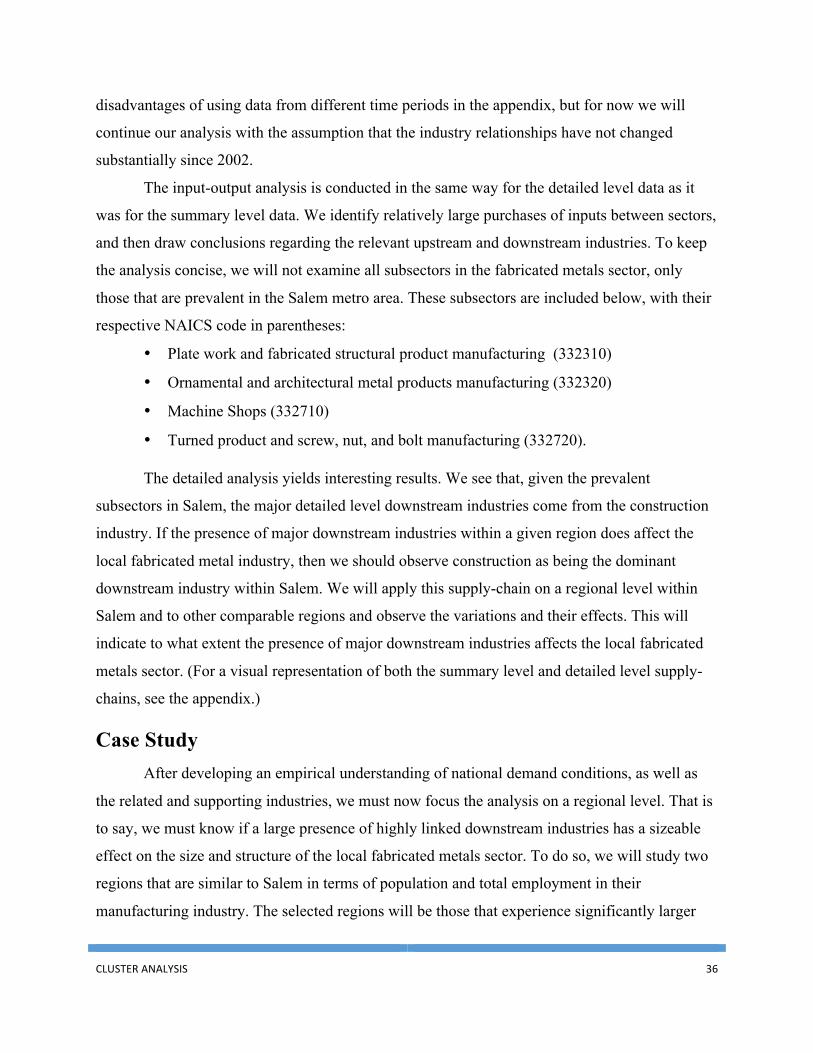
The input-output analysis is conducted in the same way for the detailed level data as it
was for the summary level data. We identify relatively large purchases of inputs between sectors,
and then draw conclusions regarding the relevant upstream and downstream industries. To keep
the analysis concise, we will not examine all subsectors in the fabricated metals sector, only
those that are prevalent in the Salem metro area. These subsectors are included below, with their
respective NAICS code in parentheses:
• Plate work and fabricated structural product manufacturing (332310)
• Ornamental and architectural metal products manufacturing (332320)
• Machine Shops (332710)
• Turned product and screw, nut, and bolt manufacturing (332720).
The detailed analysis yields interesting results. We see that, given the prevalent
subsectors in Salem, the major detailed level downstream industries come from the construction
industry. If the presence of major downstream industries within a given region does affect the
local fabricated metal industry, then we should observe construction as being the dominant
downstream industry within Salem. We will apply this supply-chain on a regional level within
Salem and to other comparable regions and observe the variations and their effects. This will
indicate to what extent the presence of major downstream industries affects the local fabricated
metals sector. (For a visual representation of both the summary level and detailed level supply-
chains, see the appendix.)
Case Study After developing an empirical understanding of national demand conditions, as well as
the related and supporting industries, we must now focus the analysis on a regional level. That is
to say, we must know if a large presence of highly linked downstream industries has a sizeable
effect on the size and structure of the local fabricated metals sector. To do so, we will study two
regions that are similar to Salem in terms of population and total employment in their
manufacturing industry. The selected regions will be those that experience significantly larger
CLUSTER ANALYSIS 37
levels of employment in the fabricated metals industry. Finally, these regions will be compared
to Salem, both through the size and structure of their fabricated metal sectors, and by the size of
the relevant downstream industries.
Salem vs. Reno and Springfield, MO:
Both the Reno-Sparks, NV and Springfield, MO regions have similarly sized population
and manufacturing employment relative to Salem. However, these two regions have significantly
higher levels of fabricated metal manufacturing employment. To understand why, we will
consider the following:
1. What is the concentration ratio within the regional fabricated metals sector? That is, are
there any subsectors that make up a highly concentrated sector relative to employment? If
so, why could this be?
2. Relative to different levels of subsector concentration within each region, how big are the
relevant downstream industries?
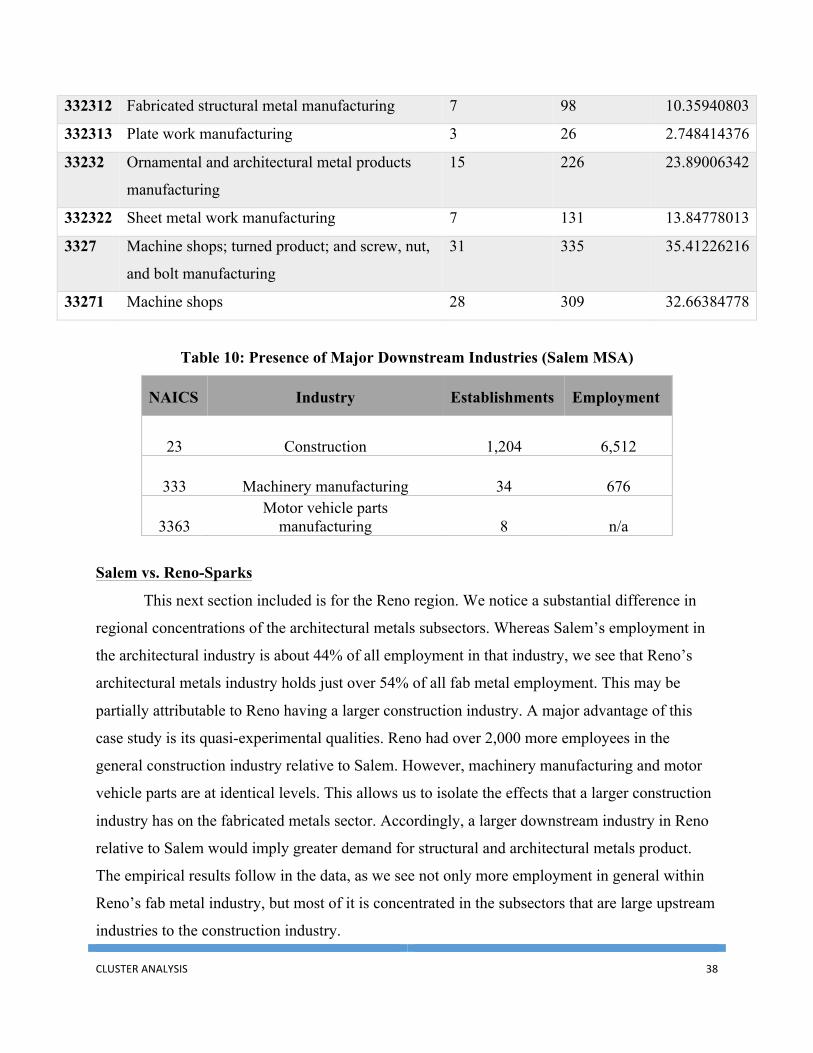
We will analyze the presence of the three largest downstream industries, i.e. construction;
machinery manufacturing; and motor vehicle parts manufacturing. From there, we compare and
contrast the prevalent downstream industries in each region and analyze the effects they have on
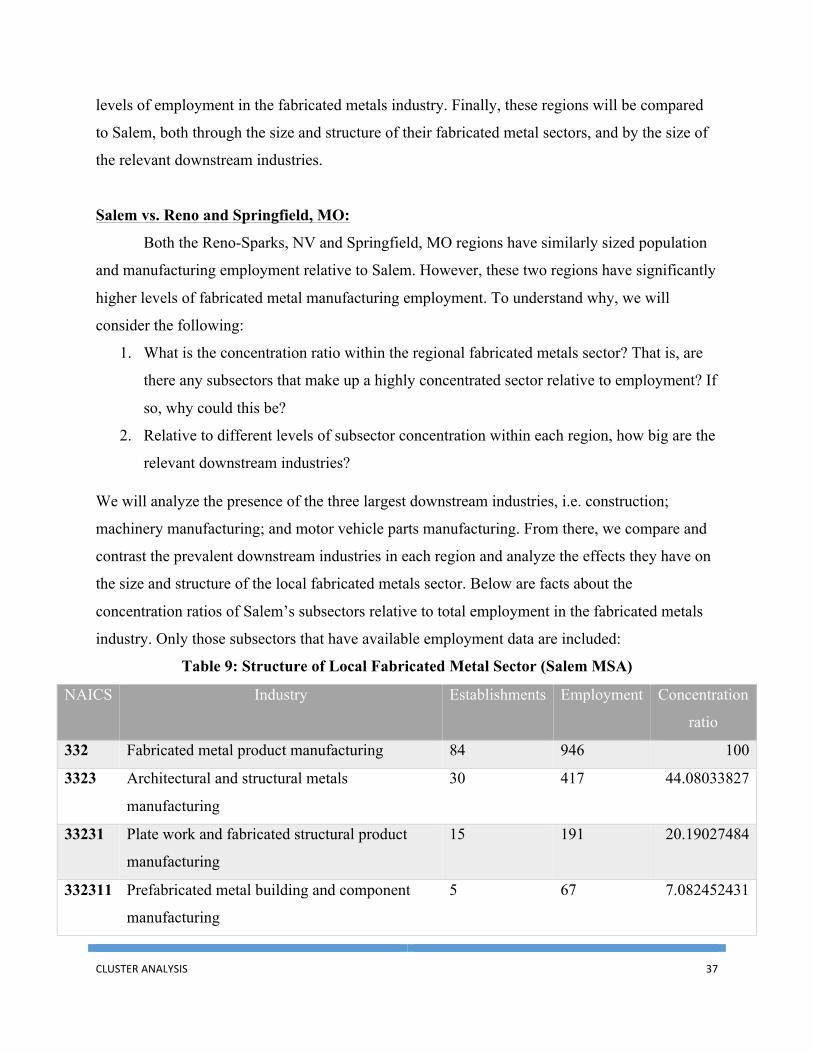
the size and structure of the local fabricated metals sector. Below are facts about the
concentration ratios of Salem’s subsectors relative to total employment in the fabricated metals
industry. Only those subsectors that have available employment data are included:
Table 9: Structure of Local Fabricated Metal Sector (Salem MSA)
NAICS Industry Establishments Employment Concentration
ratio
332 Fabricated metal product manufacturing 84 946 100
3323 Architectural and structural metals
manufacturing
30 417 44.08033827
33231 Plate work and fabricated structural product
manufacturing
15 191 20.19027484
332311 Prefabricated metal building and component
manufacturing
5 67 7.082452431
CLUSTER ANALYSIS 38
332312 Fabricated structural metal manufacturing 7 98 10.35940803
332313 Plate work manufacturing 3 26 2.748414376
33232 Ornamental and architectural metal products
manufacturing
15 226 23.89006342
332322 Sheet metal work manufacturing 7 131 13.84778013
3327 Machine shops; turned product; and screw, nut,
and bolt manufacturing
31 335 35.41226216
33271 Machine shops 28 309 32.66384778
Table 10: Presence of Major Downstream Industries (Salem MSA)
NAICS Industry Establishments Employment
23 Construction 1,204 6,512
333 Machinery manufacturing 34 676
3363 Motor vehicle parts
manufacturing 8 n/a
Salem vs. Reno-Sparks
This next section included is for the Reno region. We notice a substantial difference in
regional concentrations of the architectural metals subsectors. Whereas Salem’s employment in
the architectural industry is about 44% of all employment in that industry, we see that Reno’s
architectural metals industry holds just over 54% of all fab metal employment. This may be
partially attributable to Reno having a larger construction industry. A major advantage of this
case study is its quasi-experimental qualities. Reno had over 2,000 more employees in the
general construction industry relative to Salem. However, machinery manufacturing and motor
vehicle parts are at identical levels. This allows us to isolate the effects that a larger construction
industry has on the fabricated metals sector. Accordingly, a larger downstream industry in Reno
relative to Salem would imply greater demand for structural and architectural metals product.
The empirical results follow in the data, as we see not only more employment in general within
Reno’s fab metal industry, but most of it is concentrated in the subsectors that are large upstream
industries to the construction industry.
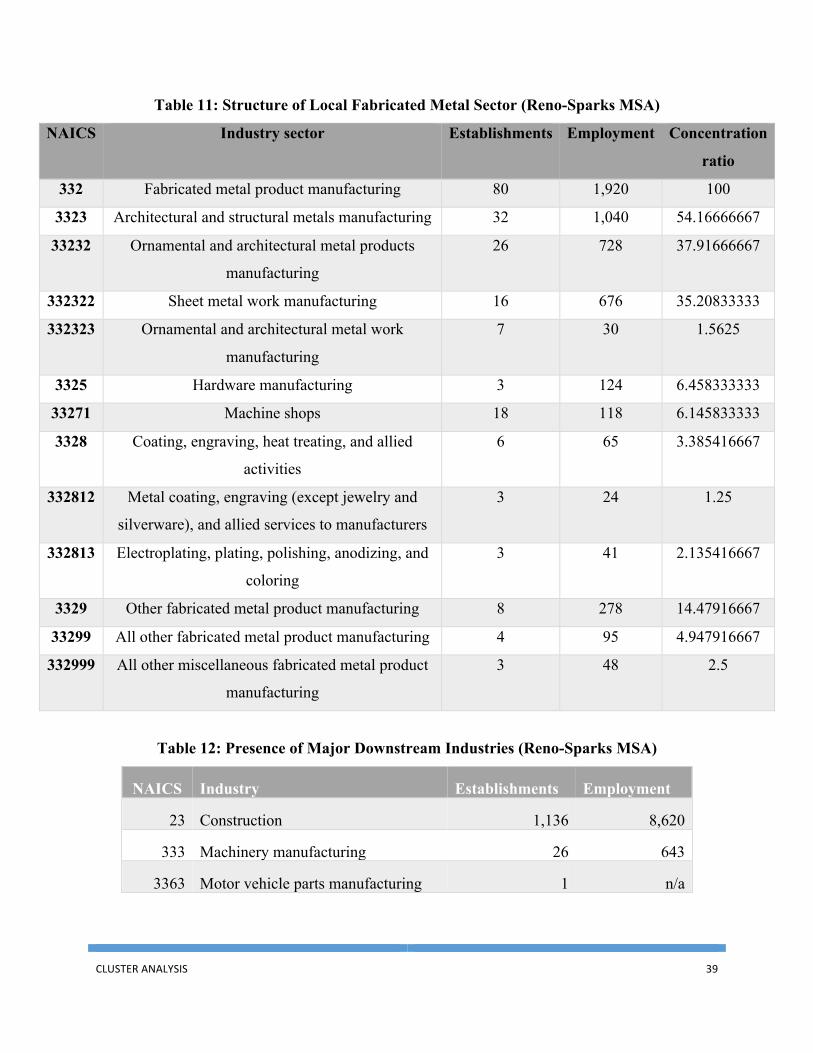
CLUSTER ANALYSIS 39
Table 11: Structure of Local Fabricated Metal Sector (Reno-Sparks MSA)
NAICS Industry sector Establishments Employment Concentration
ratio
332 Fabricated metal product manufacturing 80 1,920 100
3323 Architectural and structural metals manufacturing 32 1,040 54.16666667
33232 Ornamental and architectural metal products
manufacturing
26 728 37.91666667
332322 Sheet metal work manufacturing 16 676 35.20833333
332323 Ornamental and architectural metal work
manufacturing
7 30 1.5625
3325 Hardware manufacturing 3 124 6.458333333
33271 Machine shops 18 118 6.145833333
3328 Coating, engraving, heat treating, and allied
activities
6 65 3.385416667
332812 Metal coating, engraving (except jewelry and
silverware), and allied services to manufacturers
3 24 1.25
332813 Electroplating, plating, polishing, anodizing, and
coloring
3 41 2.135416667
3329 Other fabricated metal product manufacturing 8 278 14.47916667
33299 All other fabricated metal product manufacturing 4 95 4.947916667
332999 All other miscellaneous fabricated metal product
manufacturing
3 48 2.5
Table 12: Presence of Major Downstream Industries (Reno-Sparks MSA)
NAICS Industry Establishments Employment
23 Construction 1,136 8,620
333 Machinery manufacturing 26 643
3363 Motor vehicle parts manufacturing 1 n/a
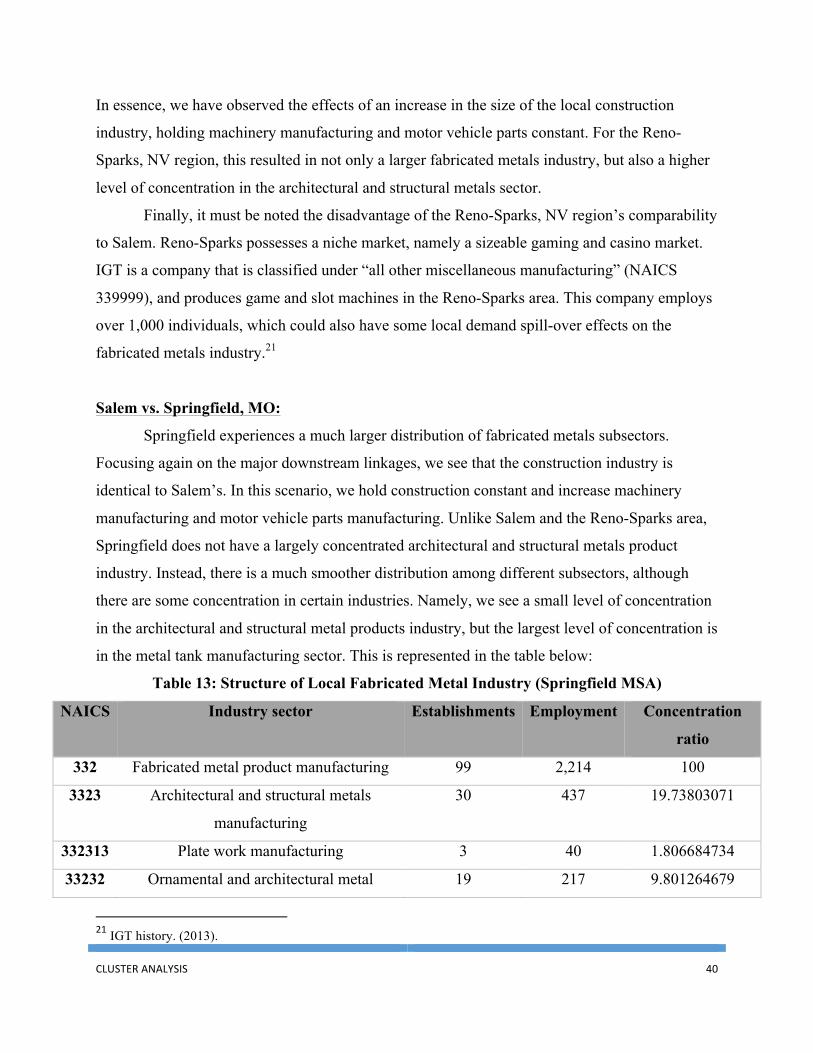
CLUSTER ANALYSIS 40
In essence, we have observed the effects of an increase in the size of the local construction
industry, holding machinery manufacturing and motor vehicle parts constant. For the Reno-
Sparks, NV region, this resulted in not only a larger fabricated metals industry, but also a higher
level of concentration in the architectural and structural metals sector.
Finally, it must be noted the disadvantage of the Reno-Sparks, NV region’s comparability
to Salem. Reno-Sparks possesses a niche market, namely a sizeable gaming and casino market.
IGT is a company that is classified under “all other miscellaneous manufacturing” (NAICS
339999), and produces game and slot machines in the Reno-Sparks area. This company employs
over 1,000 individuals, which could also have some local demand spill-over effects on the
fabricated metals industry.21
Salem vs. Springfield, MO:
Springfield experiences a much larger distribution of fabricated metals subsectors.
Focusing again on the major downstream linkages, we see that the construction industry is
identical to Salem’s. In this scenario, we hold construction constant and increase machinery
manufacturing and motor vehicle parts manufacturing. Unlike Salem and the Reno-Sparks area,
Springfield does not have a largely concentrated architectural and structural metals product
industry. Instead, there is a much smoother distribution among different subsectors, although
there are some concentration in certain industries. Namely, we see a small level of concentration
in the architectural and structural metal products industry, but the largest level of concentration is
in the metal tank manufacturing sector. This is represented in the table below:
Table 13: Structure of Local Fabricated Metal Industry (Springfield MSA)
NAICS Industry sector Establishments Employment Concentration
ratio
332 Fabricated metal product manufacturing 99 2,214 100
3323 Architectural and structural metals
manufacturing
30 437 19.73803071
332313 Plate work manufacturing 3 40 1.806684734
33232 Ornamental and architectural metal 19 217 9.801264679
21 IGT history. (2013).
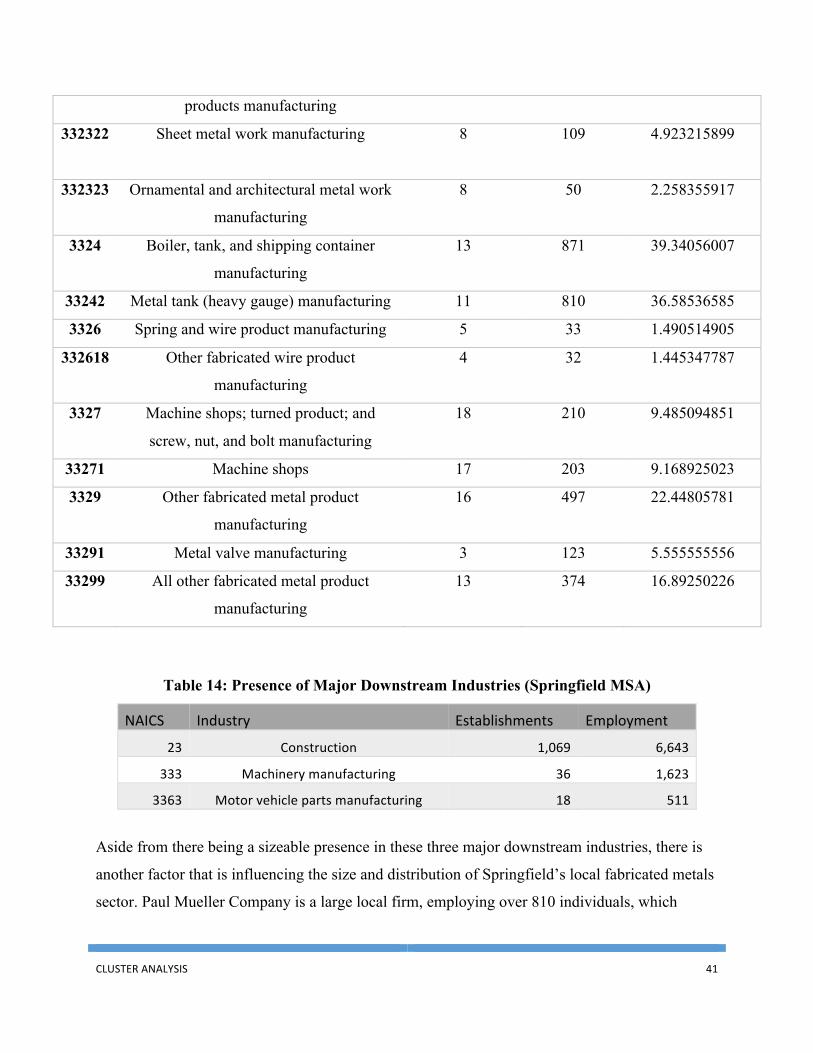
CLUSTER ANALYSIS 41
products manufacturing
332322 Sheet metal work manufacturing 8 109
4.923215899
332323 Ornamental and architectural metal work
manufacturing
8 50 2.258355917
3324 Boiler, tank, and shipping container
manufacturing
13 871 39.34056007
33242 Metal tank (heavy gauge) manufacturing 11 810 36.58536585
3326 Spring and wire product manufacturing 5 33 1.490514905
332618 Other fabricated wire product
manufacturing
4 32 1.445347787
3327 Machine shops; turned product; and
screw, nut, and bolt manufacturing
18 210 9.485094851
33271 Machine shops 17 203 9.168925023
3329 Other fabricated metal product
manufacturing
16 497 22.44805781
33291 Metal valve manufacturing 3 123 5.555555556
33299 All other fabricated metal product
manufacturing
13 374 16.89250226
Table 14: Presence of Major Downstream Industries (Springfield MSA)
NAICS Industry Establishments Employment
23 Construction 1,069 6,643
333 Machinery manufacturing 36 1,623
3363 Motor vehicle parts manufacturing 18 511
Aside from there being a sizeable presence in these three major downstream industries, there is
another factor that is influencing the size and distribution of Springfield’s local fabricated metals
sector. Paul Mueller Company is a large local firm, employing over 810 individuals, which
CLUSTER ANALYSIS 42
manufactures stainless steel tanks; processing systems and equipment; among other things for
various industries. This company located in Missouri during its inception in 1940.22
We need to be careful in asserting causality. However, after observing the discrepancies
between these comparable regions, we obtain interesting results. The quasi-experimental
characteristics of this case study suggests that a larger presence of downstream industries does
influence the size and structure of the local fabricated metal sector. Lastly, it should be noted that
there was no sizeable presence of the primary metals sector in any of these regions, suggesting
that the presence of upstream industries does not significantly affect the size or structure of the
fabricated metals industry.
Factor Conditions Now that we have laid the foundation of the demand conditions within Salem, this
analysis shifts towards characterizing the factor condition of labor within the area. We create a
point of reference by using a recent regional survey which establishes the issues fabricators face
while searching for new employees. With an orientation of the how business people view the
work force, this analysis attempts to dissect the effectiveness and efficacy of training programs
in the state. Comparing Chemeketa Community College to Clackamas and Mt. Hood
Community Colleges develops knowledge of what the specialized labor force excels in and lacks
throughout the state.
WorkSource Oregon Survey
In July 2012, WorkSource Oregon released a report that addressed the challenges that the
fabricated metal manufacturing employers in the Marion, Polk, and Yamhill counties faced
during 2011.23 WorkSource surveyed 70 of these manufacturing companies to determine the
vacancies employers struggled to fill and what skills applicants of these positions lacked.
22 Paul Mueller: Products. (2013). 23 Jackson, B. WorkSource Oregon, (2012).
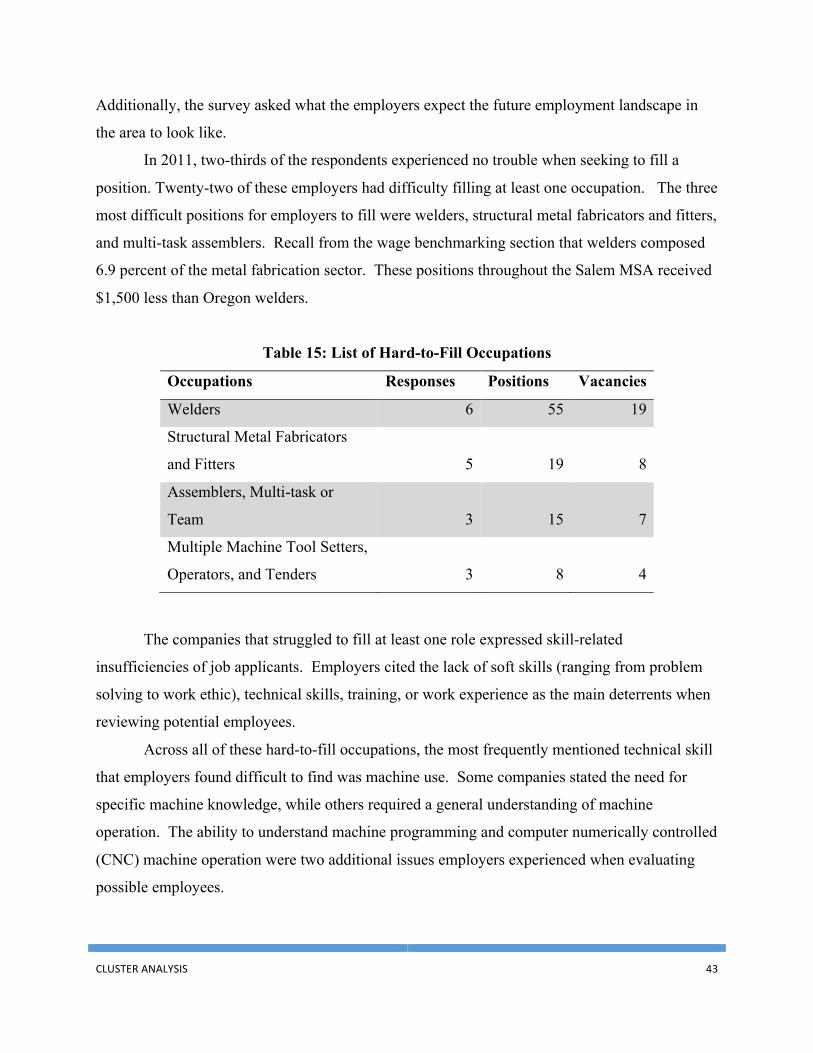
CLUSTER ANALYSIS 43
Additionally, the survey asked what the employers expect the future employment landscape in
the area to look like.
In 2011, two-thirds of the respondents experienced no trouble when seeking to fill a
position. Twenty-two of these employers had difficulty filling at least one occupation. The three
most difficult positions for employers to fill were welders, structural metal fabricators and fitters,
and multi-task assemblers. Recall from the wage benchmarking section that welders composed
6.9 percent of the metal fabrication sector. These positions throughout the Salem MSA received
$1,500 less than Oregon welders.
Table 15: List of Hard-to-Fill Occupations
Occupations Responses Positions Vacancies
Welders 6 55 19
Structural Metal Fabricators
and Fitters 5 19 8
Assemblers, Multi-task or
Team 3 15 7
Multiple Machine Tool Setters,
Operators, and Tenders 3 8 4
The companies that struggled to fill at least one role expressed skill-related
insufficiencies of job applicants. Employers cited the lack of soft skills (ranging from problem
solving to work ethic), technical skills, training, or work experience as the main deterrents when
reviewing potential employees.
Across all of these hard-to-fill occupations, the most frequently mentioned technical skill
that employers found difficult to find was machine use. Some companies stated the need for
specific machine knowledge, while others required a general understanding of machine
operation. The ability to understand machine programming and computer numerically controlled
(CNC) machine operation were two additional issues employers experienced when evaluating
possible employees.
CLUSTER ANALYSIS 44
Deficient technical skills, experience, or training among job applicants created 62% of
the inability of employers to find suitable applicants. Respondents stressed their desire for
individuals with prior work experience, but also believed that educational programs do not
suitably train students for fabricated metal manufacturing positions. A few of these employers
look to solve this problem by providing additional in-house training opportunities. This survey
of the metal fabrication employers in Marion, Polk, and Yamhill Counties shows a strong
foundational labor force. However, as businesses seek opportunities to expand the inability to
find young talent may hinder possibilities for improved performance.
Many companies did not express an inability to find qualified candidates throughout
2011. The limited hardship in filling vacancies could be a product of the high number of
experienced individuals seeking employment in the post-recession economy. Firms laid off
practiced metal fabrication employees at the onset of, and throughout the recession, which left
older workers out of the labor force. As the most skilled applicants in the market, these
individuals would have been some of the first to obtain positions throughout 2011 as the industry
began to strengthen. Soon, most of the older workforce will either be employed or retired,
leading to the need of the young generation to fill future positions created by vacancies or firm
expansion. Understanding the efficacy and strengths of the training programs in Salem and how
they compare to others across the state will shed light on the ability of individuals to develop
skills and obtain opportunities either in Salem or outside the area.
Training Program Analysis Chemeketa Community College
Chemeketa Community College (CCC) in Salem offers two programs that relate to the
metal fabrication sector: welding technology and machining technology programs. These
assorted curriculums prepare individuals for different positions within the manufacturing
industry, each providing varying levels of knowledge and preparation.
The welding technology division at CCC offers a three-term program to obtain a welding
certificate of completion and a six-term program to acquire an Associate degree in welding
fabrication (both programs require full-time enrollment). The certificate of completion allows
CLUSTER ANALYSIS 45
individuals to develop the knowledge necessary to find employment in entry-level welding
occupations.
The advanced welding fabrication associate degree aims to qualify individuals for
positions in industries such as machinery fabrication, structural fabrication, welding fitting and
layout, automatic and semiautomatic welding, and others within the metal manufacturing sector.
The program develops a "background for students in manufacturing materials, processes and
systems, including shear and press brake operation, blueprint reading, and shop and drawing
layout.”24
The machining technology programs train individuals "in using computer-controllers on
computer numerically controlled (CNC) machine tools, manual machining tools, and computers
as tools in machine control inspection (CMM), mechanical design, and engineering."25 Students
have the opportunity to pursue three certificate based programs, ranging from one to three terms
and one Associate degree program that requires six terms of fulltime academics.
The Basic Manufacturing Technician (BMT) certificate, a statewide program recognized
by many manufacturing employers, prepares students for entry level positions and possible
higher level manufacturing training. Students also take on a specialization in one of the three
areas: welding, CNC mill, or machining. With this certificate, students qualify for a variety of
entry-level manufacturing positions.
An addition to the BMT certificate is the Computer-Aided Manufacturing (CAM)
program, or CAM Fundamentals, which allows individuals to obtain additional manufacturing
skills that include understanding manufacturing materials, interpreting engineering drawings,
measuring practices, and basic operation of computer controlled mills and lathes. This second
certificate will allow graduates to take on a range of entry-level manufacturing roles.
If individuals desire to build upon the CAM Fundamentals certificate with an additional
term of studies they have the option of either obtaining a CNC Operator certificate or the Manual
Machine Operator certificate. The CNC Operator enhances knowledge for the setup and
operation of computer controlled machines. The certificate program offers courses that will
develop manual programming skills for both mills and lathes. Graduates usually seek
employment as a CNC machine tool operator or in various other manufacturing positions. The 24 (2011). Welding technology programs. 25 (2011). Machining technology programs.
CLUSTER ANALYSIS 46
Manual Machine Operator certificate develops machining skills associated with "the setup and
operation of manual machine tools such as drills, mills, lathes, saws, and grinders."26 Graduates
have the ability to work as machine tool operators, entry-level machinists, or in other
manufacturing positions.
Both of these programs have extremely similar curriculums, so much so that individuals
would only need to take two additional courses to obtain the additional certificate. This would
allow an individual to harbor knowledge in both the computer controlled and manual divisions of
manufacturing.
The final program that that the Machining Technology department gives students the
opportunity to obtain an Associate degree in Computer-Aided Design/Computer-Aided
Manufacturing (CAD/CAM) by remaining in school for an additional year. Graduates will use
these amplified skills to "use computers on the job for drafting, design and programming, and
operating CNC machine tools."27
An advantage of the Welding and Machining Technology departments at CCC is the
opportunity to partake in a "Cooperative Work Experience." These courses allow students to
gain on-the-job training from various businesses or agencies that relate to the student's
coursework. The associate degree program requires students to take at least 4 credits in these
workplace settings, though Chemeketa offers courses ranging from 1-12 credits. The assortment
of time commitments of these training involvements give students unable to pursue an associate
degree the opportunity to obtain a range of beneficial work experience. The certificate of
completion program does not implement a work experience requirement, but individuals have
the opportunity to partake in these classes by filling their elective requirement. This
advantageous opportunity could lead to connecting with potential employers and developing
work related skills.
A basic briefing of the programs at Chemeketa gives no real weight to how well-prepared
the specialized work force coming out of this school will be. This analysis proceeds by
comparing the similar programs at Clackamas and Mt. Hood Community Colleges to gauge the
effectiveness of the Welding and Manufacturing Technology programs at Chemeketa.
26 (2011). Machining technology programs. 27 (2011). Machining technology programs.
CLUSTER ANALYSIS 47
Clackamas Community College28
Clackamas Community College in Oregon City provides similar programs that offer
parallel certificates and associate degrees. The required training courses for the welding
technology certificate provide similar welding skills and techniques at Clackamas when
compared to Chemeketa Community College. The main difference between these two programs
is that Clackamas makes the job site training mandatory, whereas CCC does not. The failure to
require one of the most beneficial courses at Chemeketa diminishes the likelihood of students
creating contact with potential employers. Though most students are likely encouraged to
entertain this opportunity, the individuals who shy from participating lose out on the intangible
knowledge gained in a work environment.
The Associate degree curriculum at Clackamas begins to take an alternate route in the
training process of students. The required courses in the final three terms of the program entail
less CNC training, but provide more workshop-oriented instruction. Over the three terms,
students partake in three project oriented courses that build upon each other. Chemeketa only
offers a one-credit workshop that helps students understand the progression of techniques and
trends in the industry. CCC also holds two additional workshops, but only offers these to current
industry workers and business owners. Like Chemeketa, Clackamas provides work-based
training experiences where individuals develop knowledge and skills in a business environment.
This course at Clackamas Community College is only a two-credit requirement, unlike the four-
credit requirement at Chemeketa.
The main difference between the two welding associate degrees is the deviation in the
second year curriculums of the two schools. At Chemeketa students develop skills that pertain to
CNC machines in their second year, directly enrolling students in machining technology courses.
CCC requires no welding courses in the last three terms of study, a puzzling plan for individuals
pursuing a degree in welding technologies. According to the 2012-2013 course catalog,
Chemeketa only offers three welding courses in addition to the twelve required in the first year
of studies (excluding the work experience courses and one workshop). Conversely, Clackamas
Community College continues to teach individuals new welding techniques throughout the
second year of studies. Furthermore, individuals partake in a metal fabrication project during the
28 All analysis is derived from Ccc programs & certificates (2013).
CLUSTER ANALYSIS 48
entirety of the year. The likely cause of this deviation between programs derives from the
Clackamas Community College's welding curriculum being based on American Welding Society
(AWS) standards for entry-level welders. Chemeketa students will have less concentrated
welding training over the course of their two-year degree, but will have an overarching
knowledge of the technologies and processes that formulate the metal manufacturing industry.
The lack of training in various welding techniques at Chemeketa in the last three terms
reduces the welding skill sets of students that metal fabrication companies seek in potential
employees. The WorkSource survey classified welders as the position metal fabricators within
the area had the most trouble finding. Chemeketa's lack of teaching a wider range of welding
techniques hinders the ability of firms to find locally trained individuals and hurts graduates in
their search to find work.
The Manufacturing Technology Department at Clackamas Community College has a
wider range of training opportunities for individuals seeking roles within the manufacturing
sectors. The BMT training program resembles the training process of the same name at
Chemeketa. Like Chemeketa, the program coincides with the statewide curriculum that many
manufacturing employers recognize.
At Clackamas, the CNC Machining Technician certificate parallels the CAM
Fundamentals certificate that CCC offers. This CNC certificate fits within the Manufacturing
Technology certificate and Associate degree at Clackamas. The certificate curriculum instructs
individuals to use similar machine tools taught in the Manual Machine Operator courses at
Chemeketa. What differs at Clackamas is the ability to obtain an additional year of training in
this field. The second year of studies that students partake in allows them to increase their
knowledge of machine tools and computer-aided manufacturing. Furthermore, individuals have
the opportunity to learn basic welding and electrical skills. This Manufacturing Technology
degree is the one at Clackamas that outperforms CCC's program when preparing individuals to
succeed in the machine-oriented positions. Many factors play into students committing their
time to an additional year of studies, but Clackamas's offering of this extra year of training
highlights a program that better prepares individuals for success in the fabrication and
manufacturing fields.
Clackamas also offers a CAD/CAM technology associate degree that contains similarities
to the same program at Chemeketa. Individuals enrolled in Manufacturing Technology and

CLUSTER ANALYSIS 49
CAD/CAM Technology courses will interact with one another which can develop professional
relationships and a flow of knowledge. This additional year of training for a Manufacturing
Technology degree gives individuals an opportunity to pursue greater knowledge in a field vital
to the metal fabrication sector.
The Manufacturing Technology department at Clackamas requires work-related training
in both the Manufacturing and CAD/CAM associate degree programs. Again, this opportunity
creates contact with possible employers within the area. If strong contacts are built within the
Portland area, individuals will have the best opportunity to find work post-graduation.
Additionally, Clackamas Community College partners with the Oregon Institute of
Technology (OIT). Many courses within the Manufacturing Technology programs are
transferable to the OIT Manufacturing Engineering bachelor degree program. This partnership
creates the possibility for successful students to pursue a higher degree of education.
Connections built in this area through student interaction and work-based training relationships
may influence these individuals to return to the source of this network, the Portland area.
Though many barriers prevent individuals to obtaining these higher degrees, the partnership that
Clackamas Community College has with OIT creates greater opportunities for students.
Mt. Hood Community College29
Mt. Hood Community College (MHCC) is another school within the Portland area that
offers certificates and degrees that teach people the necessary skills to pursue a career in metal
fabrication and other related fields. Located in Gresham, Oregon, MHCC maintains three
certificate and two degree programs with selective and limited entry. The Integrated Metals
department houses these various programs that prepare students for metal fabrication and
manufacturing roles. As of May, the department filled all spots for four of the five programs of
the 2013-2014 academic year. A thorough investigation of the curriculum and program
outcomes at Mt. Hood will create an understanding of the difference between the two training
options offered at MHCC and CCC.
To begin, the Integrated Metals department at MHCC offers a welding technology
certificate that provides similar training techniques taught at Chemeketa. Both curriculums 29 All analysis is derived from Integrated metals - catalog year 2013-14. (2013).
CLUSTER ANALYSIS 50
correspond when comparing the relevant material taught in each required class. Neither of the
programs generates a significant advantage over the other as both build comparative welding
skills. The inability of this analysis to determine the differing quality of facilities and instructors
must be kept in mind throughout this examination of the two departments. Nevertheless, the
two certificate programs build a comparable range of knowledge within the field of welding.
The Integrated Metals Associate degree is for individuals who look to pursue training that
incorporates both machine tool and welding technologies. This direction within the department
corresponds with the Welding Technology degree at CCC. The program at the MHCC
assembles a slightly different curriculum, stressing an alternative path towards specialization. At
Mt. Hood students develop their skills within the machine shop for the first three terms prior to
learning the basics of welding. These courses entail understanding the various operations that a
machinist will apply in the work setting. In the second year of studies individuals begin to
partake in welding technology training as well as the basics skills needed in manual and CNC
machine tool use. The Integrated Metals degree stresses less welding knowledge, but develops a
wider spectrum of expertise pertaining to the various positions that a person can take on at a
metal fabrication company. After Chemeketa graduates have a smaller, but concentrated skill set
to advertise to employers. Mt. Hood graduates have the opportunity to find a large number of
entry level roles, but are less proficient in welding techniques when compared to Chemeketa
graduates. So, unlike the comparison between the programs at Clackamas and Chemeketa, there
is some ambiguity in determining which program offers the superior curriculum. In this situation
it depends upon which type of role a prospective graduate wishes to take on.
The machining oriented certificate programs at Mt. Hood parallel those at Chemeketa.
Mt. Hood does not offer a BMT program like Chemeketa and Clackamas, but provide similar
CNC Machine Operator and Manual Machine Operator certificates. Each provides similar
computer and manual machine tool operating techniques. Furthermore, the machining
technology degrees at each of these schools emphasize the role of computer-aided machine use
in the training of students. Both curriculums require more advanced training of the skills taught
in the certificate programs.
The process of comparing the curriculums of the welding and manufacturing oriented
programs at these three schools produced various conclusions about the state of Chemeketa
Community College. The only differences between Mt. Hood and CCC were within the welding
CLUSTER ANALYSIS 51
Associate degrees. At Chemeketa, the training focuses on welding and CNC machining, whereas
Mt. Hood evens the distribution of training across welding and manual and CNC machining.
The manufacturing and machining programs at Clackamas address a larger range of techniques
and additional concentrations when compared to Chemeketa. Also, the welding degree at
Clackamas builds more advanced welding skills in the second year of studies, unlike Chemeketa
which instructs individuals in the techniques of CNC machining. This analysis shows that there
is some variation in the training programs throughout the state. Chemeketa mainly differs in the
process of preparing students for welding occupations. The WorkSource survey illustrates that
employers struggled to find qualified welders in the Salem area during 2011. We conclude that
there may be room for the training programs at Chemeketa to reevaluate and adjust towards the
most relevant training techniques.
V. Policy Recommendations Through our analyses and case study, we believe that Salem may not be a good candidate
for a fabricated metals manufacturing cluster. While there are some regions that deviate from
what one would expect their employment levels to be within the industry, it is difficult to assert
any causal factors that are driving such a phenomenon as industry agglomeration. However, our
statistical analysis suggests that relative to the size of Salem’s population and manufacturing
sector, as well as their geographic location, there is room for growth within this industry. With a
thorough understanding of the supply chain and large downstream industry linkages, as well as
factors that contribute to a strong labor pool, there are opportunities for economic developers to
utilize policy that may instigate growth in this industry.
Input-output recommendation: To initiate growth within strongly linked downstream
industries
We have analyzed national input-output accounts and examined what portion these
downstream industries make up of total demand for fabricated metals product. The supply chain
suggests that these downstream industries are vital factors for a strong fabricated metals sector.
Our case study showed that the Reno-Sparks, NV and Springfield, MO regions experience larger
downstream industries relative to Salem; and thus we observe larger fabricated metals industries
in those regions as well. Because the fabricated metals industry is very competitive, incentivizing
CLUSTER ANALYSIS 52
these downstream industries to buy locally can lead to growth within the fabricated metals
industry. Therefore, to encourage growth in the metals industry, growth must be initiated within
the downstream industries. For example, public policy can be used to stimulate growth in the
construction industry through government spending on infrastructure. Enhancing infrastructure
increases demand for residential and other nonresidential structures, which could lead to an
increase in demand for fabricated metals product, particularly within the architectural and
structural metals product sector, which is one of the most prevalent subsectors within the Salem
region. Another way to stimulate downstream demand would be to work with a large
downstream firm and entice them to locate within Salem. There are certain elements within the
Salem economy that can allow large firms to succeed. The pro-business environment of the
community, and the low costs associated with labor and other capital, would permit growth
within these industries.
Employment recommendation #1: Diminishing the stigma surrounding manufacturing
careers and developing first-contact between the industry and high school students
Within certain pockets of the high school community there is a negative stigma regarding
manufacturing as a viable career choice. As the population continues aging and local firms
require new employees, opportunities for younger individuals will come to fruition. A lack of
exposure to these opportunities and the negative connotations attached to manufacturing
employment will diminish the quality of the labor pool. Furthermore, this prevents certain
individuals from attaining employment that would otherwise be consistent with their preferences
and talents. To reduce this stigma, creating a contact for high school students to the fabricated
metals and general manufacturing industries allows students to build their own assessments and
perceptions regarding these career possibilities. To create this contact, there are a range of
possibilities. For example, developing classes within the Salem-Keizer School District to teach
students the basic skills of welding and machinery operations. This allows students to gain
hands-on experience in order to further develop their understanding of alternative career options
in these industries. Finally, educating teachers to tolerate the manufacturing industry as a viable
career option for students to succeed in allows for the possibility for a higher quality labor pool.
Employment recommendation #2: Recalibrating training programs at Chemeketa by
working with and understanding local industry needs
CLUSTER ANALYSIS 53
Through analysis of the programs and curriculum of the various community colleges
within Oregon, there appears to be some room for improvement within relevant training
programs at Chemeketa. For instance, the welding technology appears to be relatively different
when comparing and contrasting Chemeketa’s programs to that of Clackamas and Mt. Hood. It is
possible that Chemeketa may be sub optimizing on the skill sets that are necessary for a strong
local labor pool. As WorkSource survey suggests, the skills of welders coming out of Chemeketa
do not meet entry-level standards. Also, a local manufacturer expressed that he does not send
employees to Chemeketa anymore. Graduates of Chemeketa may be unqualified or under
qualified for prospective employment within these industries. Thus, when new employees need
to be hired, local employers will be required to pick up the tab on training and development,
which may discourage businesses in this industry form locating within the Salem area.
Reevaluation of the training process at Chemeketa can improve the efficiency and
efficacy of their specialized training processes. To do so, both an internal and external
assessment of the vocational and training system should be conducted in order to optimize these
programs within the community. An external assessment will consist of a survey that identifies
both the skills that employers prefer, and those skills that applicants have lacked. From there, the
survey can be cross-referenced with the structure of the training programs at Chemeketa and
efficiently developed. As the industry progresses, reinstating the survey in a timely fashion will
promote future success in the industry.
Firm structure, strategy, and rivalry recommendation: To facilitate a network of local
industry professionals to create knowledge spill-over effects.
Porter’s diamond of competitive advantage postulates that close proximity within an
industry strengthens the competitive dynamics on not only a regional level, but also on a national
level. According to Porter, firms will place a strong emphasis on where to locate, and a strong
local network of related industries can incentivize business owners to locate near these networks
in order to stay competitive. A local flow of industry knowledge will keep industry firms
conscious of the changes in technology and will further inform them on how to continue making
the proper investments in various capital markets. The Strategic Economic Development
Cooperation (SEDCOR) attempted creating a metal fabrication network in the past, but the group
could not harbor benefits for the industry. If the economic developers facilitate a group that
CLUSTER ANALYSIS 54
includes businessmen, educators, and developers alike, the network of firms have the capability
to grow the industry.
VI. Conclusion After benchmarking the fabricated metals industry in Salem to other regions and
measuring the prospects for industry growth, we were able to conclude that this was an industry
that had potential to increase employment. Although the development of a cluster would require
more than doubling the size of the current local industry, there exists competitive traits that could
foster growth. We decided to use three of the four traits of Porter’s diamond of competitive
advantage to further analyze where Salem stands and which opportunities remained unexploited.
An input-output analysis aimed at understanding the demand conditions and the existence
of related and supporting industries in the metal fabrication sector. We identified three major
downstream industries that made up the majority of fabricated metal output, namely
construction; machinery manufacturing; and motor vehicle parts manufacturing. The largest
upstream industry was found to be primary metals, providing over a third of total inputs within
this industry. These national input-output accounts were applied to Salem on the MSA level, and
then compared to other comparable regions with larger fabricated metal sectors in order to test
the importance of a local presence of these highly linked industries. The case study suggests that
the presence of downstream industries does have an effect on not only the relative size of the
fabricated metals industry, but also how the structure of its subsectors are concentrated. We also
find that niche markets and historical endowment, such as a large preexisting firm within a
region, highly impacts the size of this industry
Once the analysis established a knowledgeable framework of the upstream and
downstream relationships, we assessed the training programs within the area. Development of a
specialized labor force can derive from a strong educational system, both of which are
imperative factor conditions. The review of the three schools brought an understanding of
disparities in the welding and manufacturing programs at Chemeketa Community College
relative to those at Clackamas and Mt. Hood Community Colleges. We found that the welding
and manufacturing programs at Chemeketa require reevaluations in order to consistently meet
the local metal fabrication employer needs.

CLUSTER ANALYSIS 55
In order to further improve this analysis, we do have a few recommendations going
forward. First, it would be beneficial to more closely study the relevant downstream industries
and see to what extent policy can affect those industries. We would suggest studying the three
most highly linked industries, i.e. construction, motor vehicle parts manufacturing, and
machinery manufacturing. We would further apply our benchmarking processes to each industry
and evaluate their detailed level supply-chain linkages. Further studies which can be conducted
to analyze the industry include:
• The effect of trade organizations and other industry networks on the health of an industry.
• Examination of a less significant downstream industry that has sizeable presence within
or near Salem. Study how this industry can be used to begin the facilitation of growth
within the metals industry.
• The effects of infrastructure and geographic endowments on the fabricated metals sector
and other related industries. To begin this analysis, begin by using our empirical
regression model to identify highly concentrated regions.
There are certainly other routes to move forward in the area of cluster analysis. This paper
focused on a single industry relative to a single region. The methodologies can be utilized to
further generalize the existence of clusters and to develop a better understanding of how, or if,
public policy can exploit the advantages of various clusters.
CLUSTER ANALYSIS 56
References (2011). Machining technology programs. 2011–2012 Chemeketa Community College Catalog,
Retrieved from http://www.chemeketa.edu/classes/catalog/documents/machining.pdf
(2011). Welding technology programs. 2011–2012 Chemeketa Community College Catalog,
Retrieved from:
http://www.chemeketa.edu/classes/catalog/documents/weldingtechnology.pdf
Bureau of Labor Statistics, (2012). Occupational employment statistics. Retrieved from:
http://www.bls.gov/oes/home.htm
Ccc programs & certificates (2013). Retrieved from:
http://www.clackamas.edu/Career_Technical_Programs.aspx
Cortright, J., & Brookings Institution. (2006). Making sense of clusters: Regional
competitiveness and economic development. Washington, D.C: Brookings Institution,
Metropolitan Policy Program.
Duensing, L. (2013, March 21). Business in the fast lane. Modern Metals, Retrieved from
http://www.modernmetals.com/item/11397-business-in-the-fast-lane.html
Federal Reserve Bank of St. Louis, Economic Research. (2013). All employees: Manufacturing .
Retrieved from website: http://research.stlouisfed.org/fred2/series/MANEMP
CLUSTER ANALYSIS 57
Federal Reserve Bank of St. Louis, Economic Research. (2013). Value of manufacturers' new
orders for durable goods industries: Fabricated metal products. Retrieved from:
http://research.stlouisfed.org/fred2/series/A32SNO
Feser, E., & Bergman, E. (February 01, 2000). National Industry Cluster Templates: A
Framework for Applied Regional Cluster Analysis. Regional Studies, 34, 1, 1-19.
Feser, E. J., and others. (2001). “Incorporating Spatial Analysis in Applied Industry Cluster
Studies.”Working paper. Chapel Hill: University of North Carolina.
Hoover, E. M. (1948). The Location of Economic Activity. New York: McGraw-Hill Book Co.
IGT history. (2013). Retrieved from http://www.igt.com/us-en/interactive/about-us.aspx
Integrated metals - catalog year 2013-14. (2013). Retrieved from
https://www.mhcc.edu/IntegratedMetals.aspx?id=1865
Jackson, B. WorkSource Oregon, (2012). What employers need workforce challenges among
fabricated metal manufacturers in marion, polk, and yamhill counties. Retrieved from:
http://www.qualityinfo.org/pubs/skills/fabmetals.pdf
Jacobs, J. (1969). The Economy of Cities. New York: Random House.
Kelton, C. M. L., Pasquale, M. K., & Rebelein, R. P. (April 01, 2008). Using the North
American Industry Classification System (NAICS) to Identify National Industry Cluster
Templates for Applied Regional Analysis. Regional Studies, 42, 3.)
Marshall, A. (1920). Principles of Economics: An introductory volume. London: Macmillan.
Oregon Employment Department, (2013). Current employment statistics. Retrieved from:
http://www.qualityinfo.org/olmisj/CES
Paul Mueller: Products. (2013). Retrieved from http://www.muel.com/productDivisions/
Piore, M. J., & Sabel, C. F. (1984). The second industrial divide: Possibilities for prosperity.
New York: Basic Books.
Porter, M. E. (1990). The Competitive Advantage of Nations. New York: Free Press.
United States Census Bureau, (2012). 2012 naics definition. Retrieved from:
http://www.census.gov/cgi-bin/sssd/naics/naicsrch?code=332&search=2012

CLUSTER ANALYSIS 58
United States Census Bureau, (1998-2011). county business patterns. Retrieved from:
http://www.census.gov/econ/cbp/
Appendix Data for the input-output analysis is as follows:
• Summary Level:
o Use of commodities before redefinitions, aggregated at the summary level.
o Year 2011
• Detailed Level:
o Historical benchmark IO, year 2002
o Use of commodities after redefinitions30, aggregated at the detailed level
The process for analyzing national input-output accounts for the fabricated metals industry can
be applied to the other downstream industries as well to better develop a comprehensive
understanding of the dynamics between these downstream industries. Additionally, we find that
between the years 2002 and 2011, the summary level relationships do not change. Therefore, we
can assume that the 2011 detailed level relationships are identical to those in 2002. The
following pages provide the following:
1. Visual summary level supply chain.
2. Visual detailed level supply chain.
3. Input table identifying the percentages of total input per detailed level industry.
30 The reason for using “after redefinitions” for detailed level and “before redefinitions” for the summary level table is due to the fact that more years of data are available for the “after redefinitions” in the detailed level.
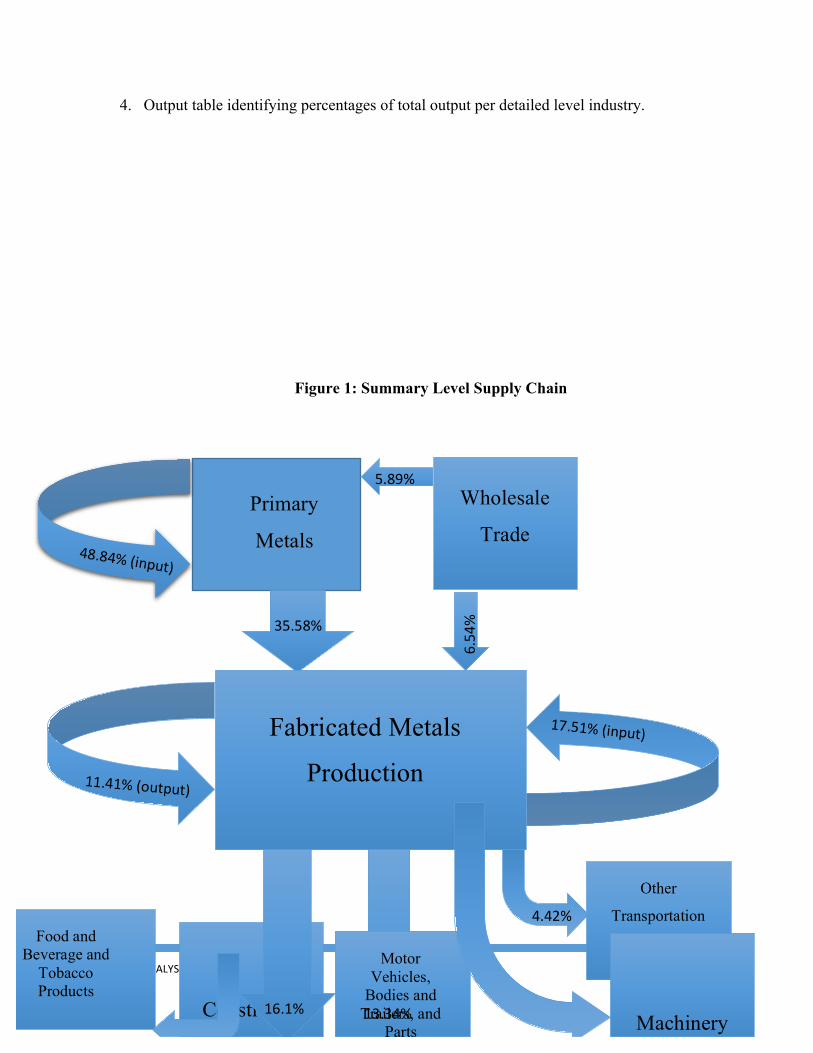
CLUSTER ANALYSIS 59
4. Output table identifying percentages of total output per detailed level industry.
Figure 1: Summary Level Supply Chain
Primary
Metals
Fabricated Metals
Production
Construction
Food and Beverage and
Tobacco Products
Wholesale
Trade
Motor Vehicles,
Bodies and Trailers, and
Parts
Other
Transportation
Equipment
Machinery
35.58%
6.54
%
17.51% (input)
5.89%
16.1%
11.87%
13.34%
4.42%
4.37%
11.41% (output)
48.84% (input)
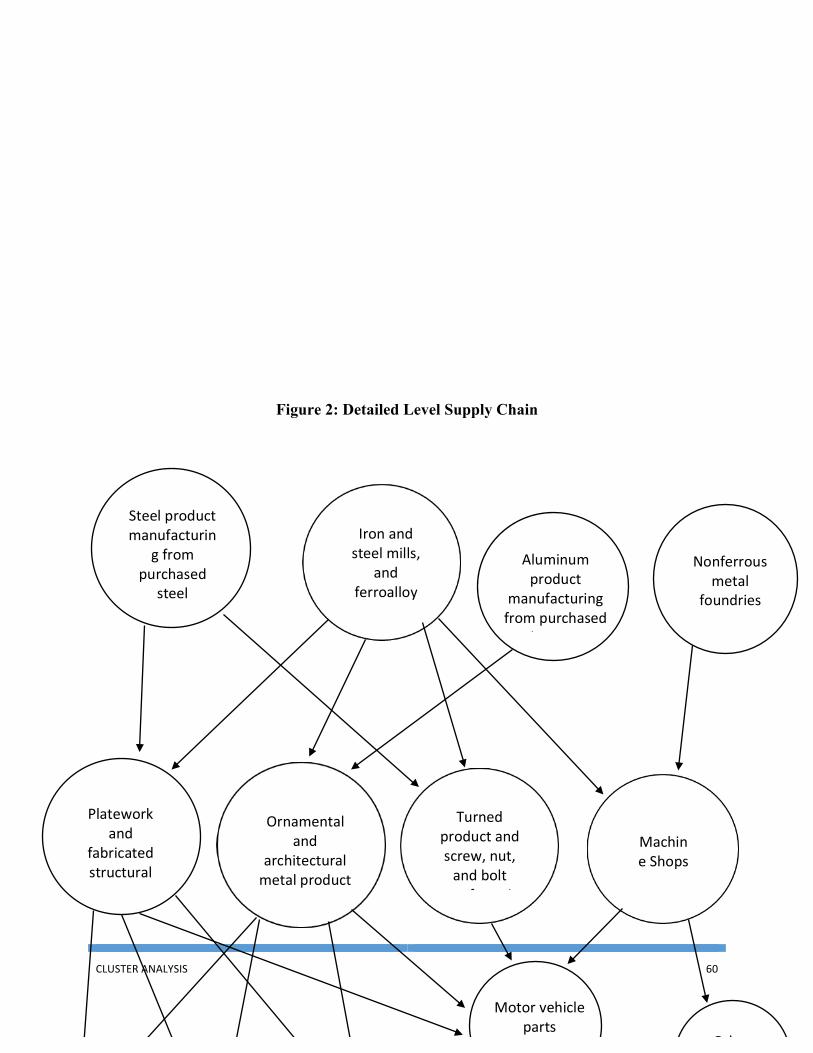
CLUSTER ANALYSIS 60
Steel product manufacturin
g from purchased
steel
Aluminum product
manufacturing from purchased
aluminum
Nonferrous metal
foundries
Other residentia
Motor vehicle parts
manufacturing
Figure 2: Detailed Level Supply Chain
Platework and
fabricated structural product
Ornamental and
architectural metal product manufacturing
Machine Shops
Turned product and screw, nut, and bolt
manufacturing
Iron and steel mills,
and ferroalloy
manufacturin
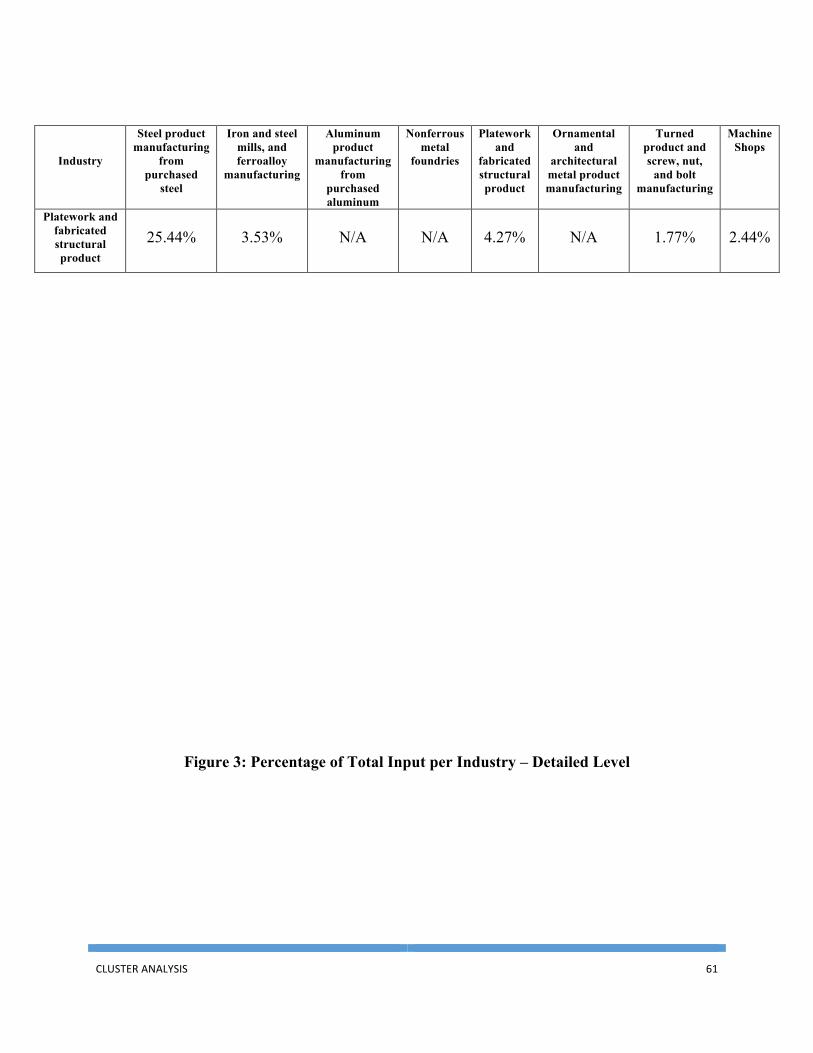
CLUSTER ANALYSIS 61
Figure 3: Percentage of Total Input per Industry – Detailed Level
Industry
Steel product manufacturing
from purchased
steel
Iron and steel mills, and ferroalloy
manufacturing
Aluminum product
manufacturing from
purchased aluminum
Nonferrous metal
foundries
Platework and
fabricated structural product
Ornamental and
architectural metal product manufacturing
Turned product and screw, nut,
and bolt manufacturing
Machine Shops
Platework and fabricated structural product
25.44%
3.53%
N/A
N/A
4.27%
N/A
1.77%
2.44%
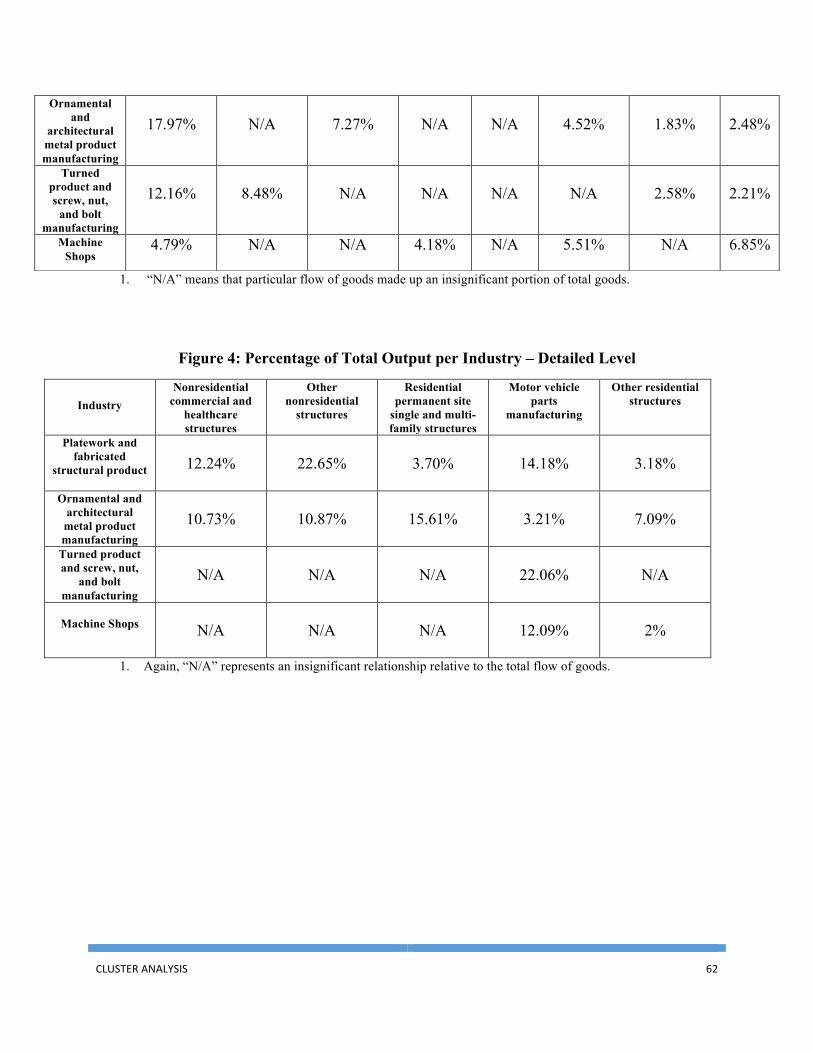
CLUSTER ANALYSIS 62
1. “N/A” means that particular flow of goods made up an insignificant portion of total goods.
Figure 4: Percentage of Total Output per Industry – Detailed Level
Industry
Nonresidential commercial and
healthcare structures
Other nonresidential
structures
Residential permanent site
single and multi-family structures
Motor vehicle parts
manufacturing
Other residential structures
Platework and fabricated
structural product
12.24%
22.65%
3.70%
14.18%
3.18%
Ornamental and architectural metal product manufacturing
10.73%
10.87%
15.61%
3.21%
7.09%
Turned product and screw, nut,
and bolt manufacturing
N/A
N/A
N/A
22.06%
N/A
Machine Shops
N/A
N/A
N/A
12.09%
2%
1. Again, “N/A” represents an insignificant relationship relative to the total flow of goods.
Ornamental and
architectural metal product manufacturing
17.97%
N/A
7.27%
N/A
N/A
4.52%
1.83%
2.48%
Turned product and screw, nut,
and bolt manufacturing
12.16%
8.48%
N/A
N/A
N/A
N/A
2.58%
2.21%
Machine Shops
4.79% N/A N/A 4.18% N/A 5.51% N/A 6.85%

CLUSTER ANALYSIS 63