Embed Size (px)
Citation preview
Coffee Market Outlook Mauricio Galindo International Coffee Council March 2015
Supply & Demand
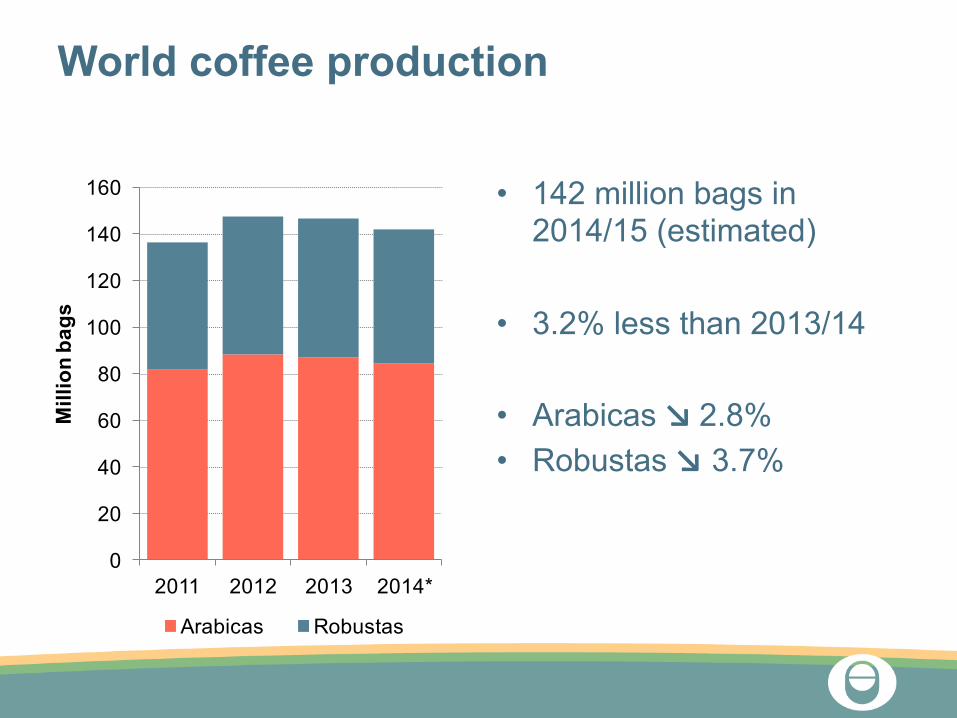
World coffee production
• 142 million bags in 2014/15 (estimated)
• 3.2% less than 2013/14
• Arabicas ↘ 2.8% • Robustas ↘ 3.7%
0
20
40
60
80
100
120
140
160
2011 2012 2013 2014*
Mill
ion
bags
Arabicas Robustas
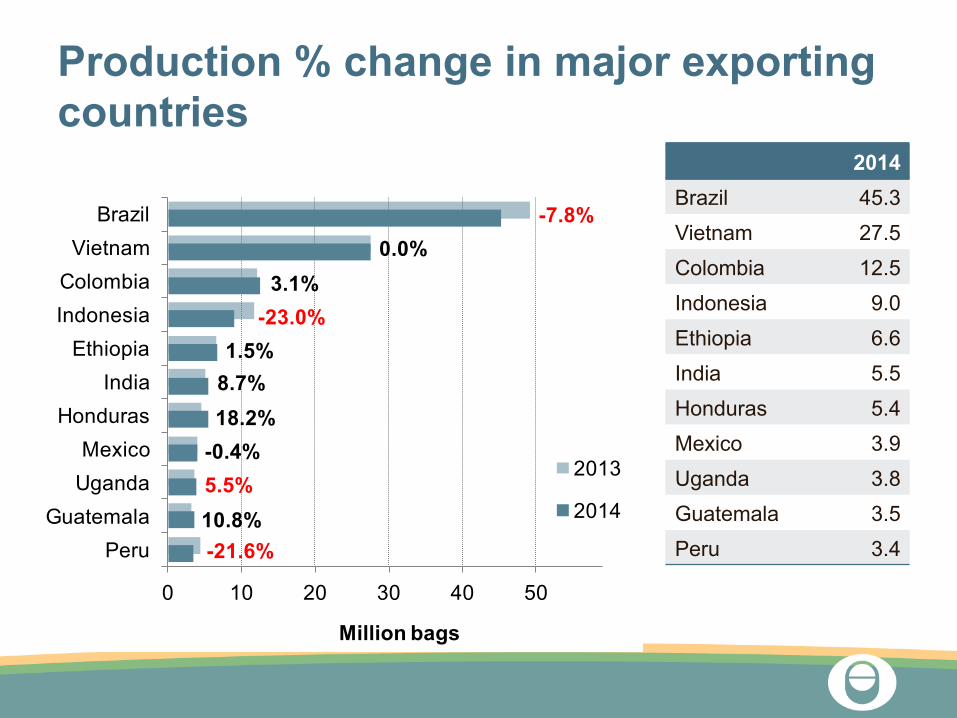
Production % change in major exporting countries
2014 Brazil 45.3 Vietnam 27.5 Colombia 12.5 Indonesia 9.0 Ethiopia 6.6 India 5.5 Honduras 5.4 Mexico 3.9 Uganda 3.8 Guatemala 3.5 Peru 3.4
-7.8%0.0%
3.1%-23.0%
1.5%8.7%18.2%
-0.4%5.5%10.8%-21.6%
0 10 20 30 40 50
BrazilVietnamColombiaIndonesiaEthiopiaIndia
HondurasMexicoUganda
GuatemalaPeru
Million bags
2013
2014
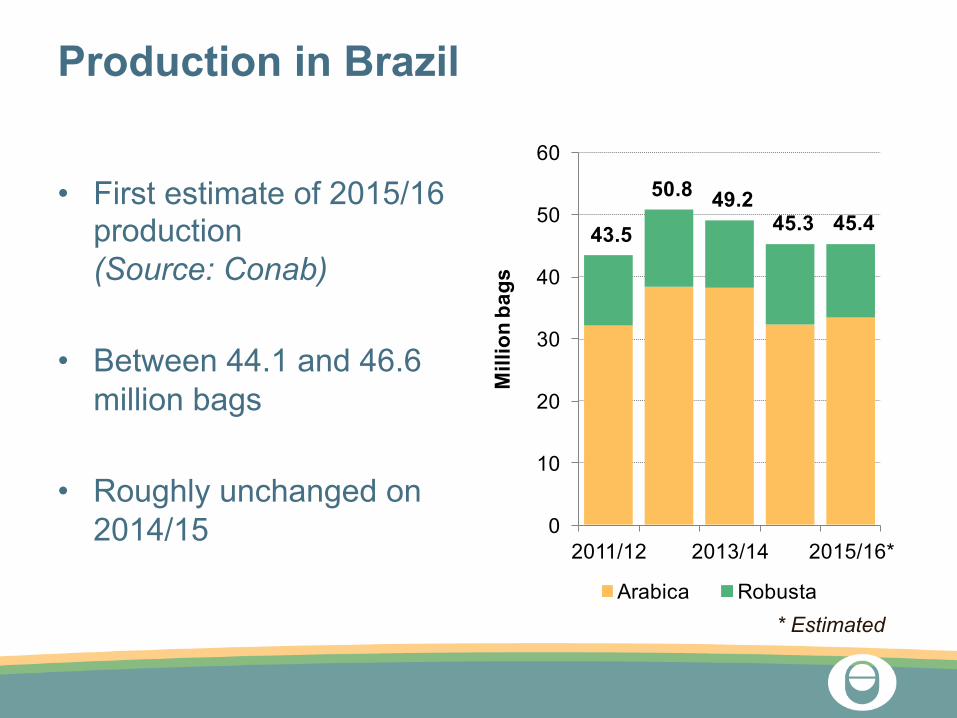
Production in Brazil
• First estimate of 2015/16 production (Source: Conab)
• Between 44.1 and 46.6 million bags
• Roughly unchanged on 2014/15
43.5
50.8 49.245.3 45.4
0
10
20
30
40
50
60
2011/12 2013/14 2015/16*
Mill
ion
bags
Arabica Robusta* Estimated
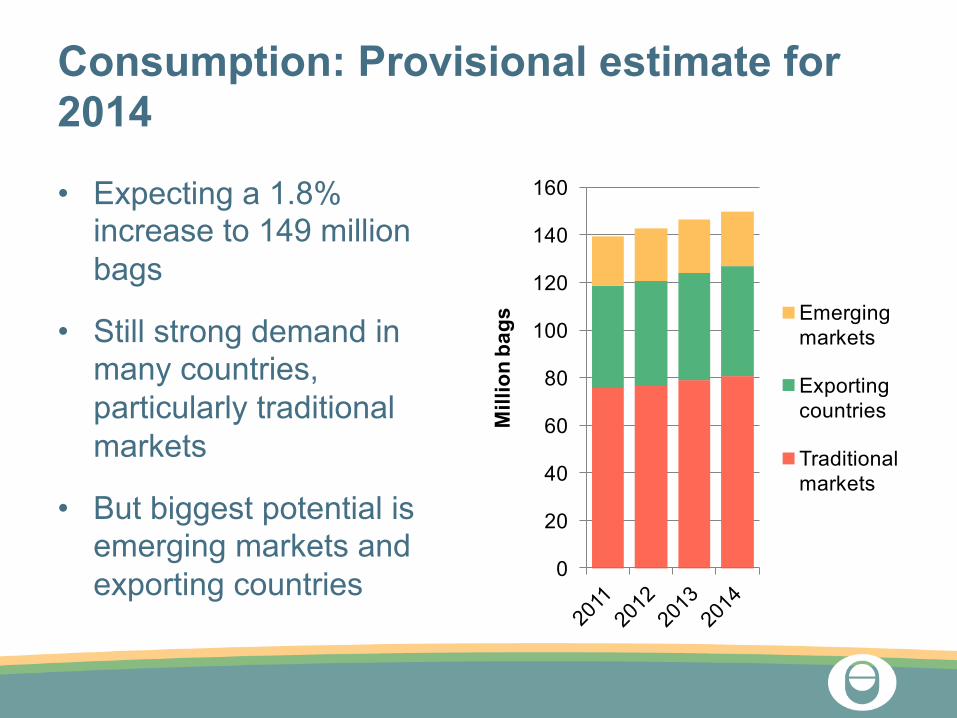
Consumption: Provisional estimate for 2014
• Expecting a 1.8% increase to 149 million bags
• Still strong demand in many countries, particularly traditional markets
• But biggest potential is emerging markets and exporting countries 0
20
40
60
80
100
120
140
160
Mill
ion
bags Emerging
markets
Exporting countries
Traditional markets
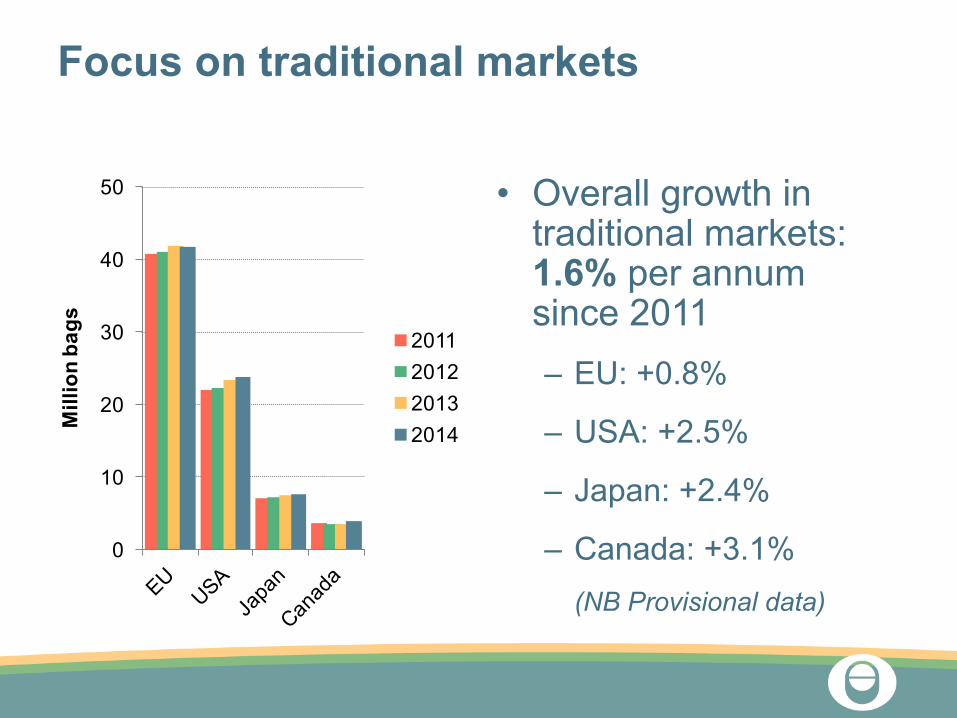
Focus on traditional markets
• Overall growth in traditional markets: 1.6% per annum since 2011 – EU: +0.8%
– USA: +2.5%
– Japan: +2.4%
– Canada: +3.1% (NB Provisional data)
0
10
20
30
40
50
Mill
ion
bags
2011201220132014

Prices
120
130
140
150
160
170
180
190
US
cent
s/lb
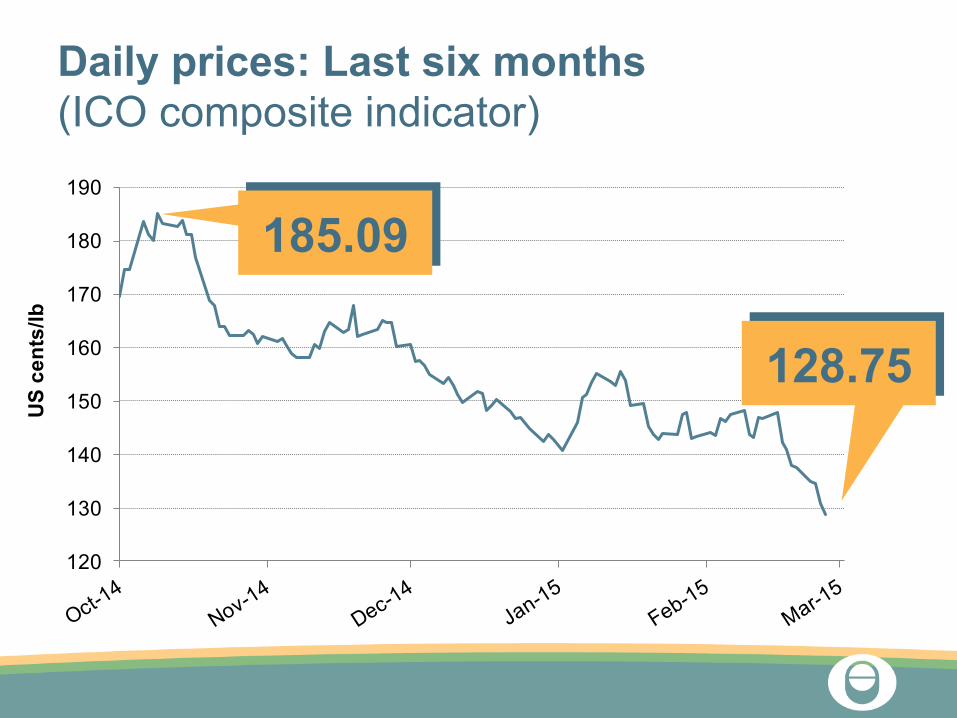
Daily prices: Last six months (ICO composite indicator)
185.09
128.75
80
100
120
140
160
180
200
US
cent
s/lb
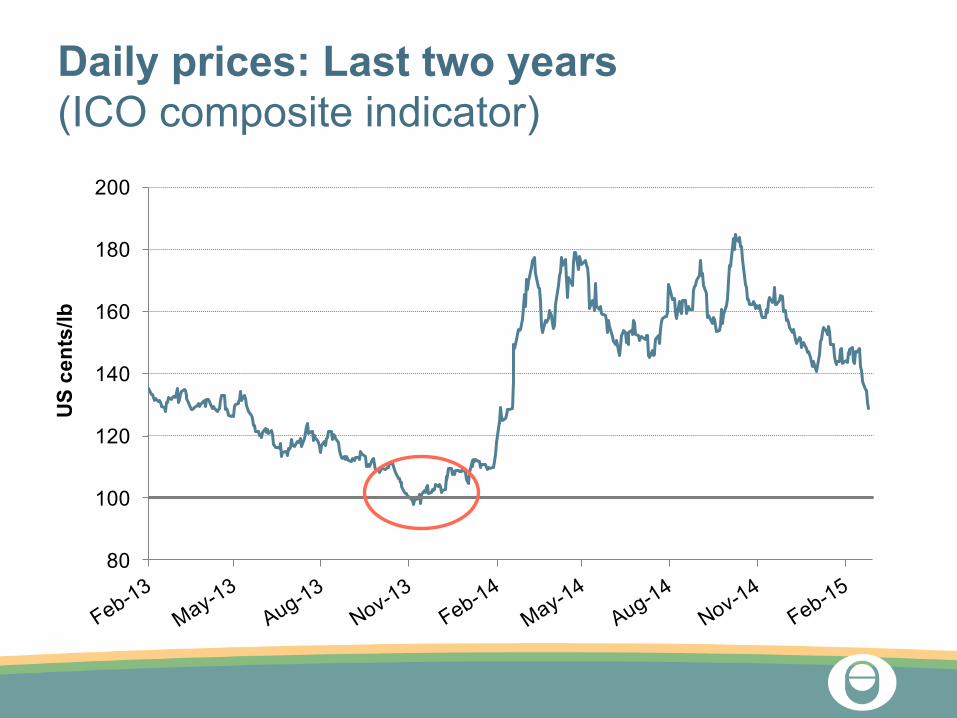
Daily prices: Last two years (ICO composite indicator)
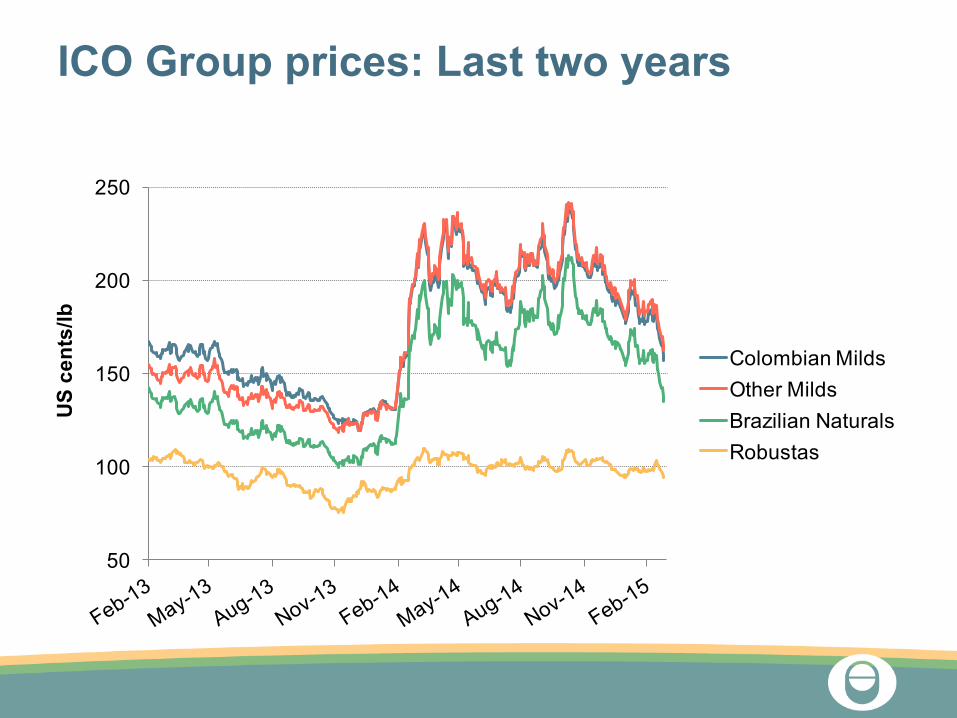
ICO Group prices: Last two years
50
100
150
200
250
US
cent
s/lb
Colombian MildsOther MildsBrazilian NaturalsRobustas
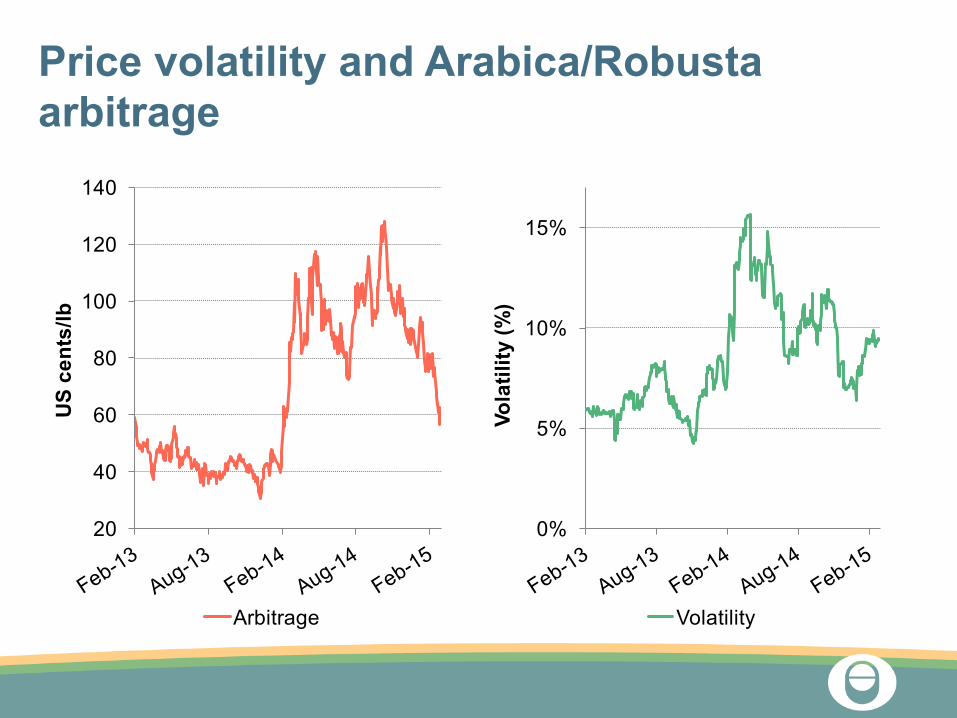
Price volatility and Arabica/Robusta arbitrage
20
40
60
80
100
120
140
US
cent
s/lb
Arbitrage
0%
5%
10%
15%
Vola
tility
(%)
Volatility

So, why have prices been falling?
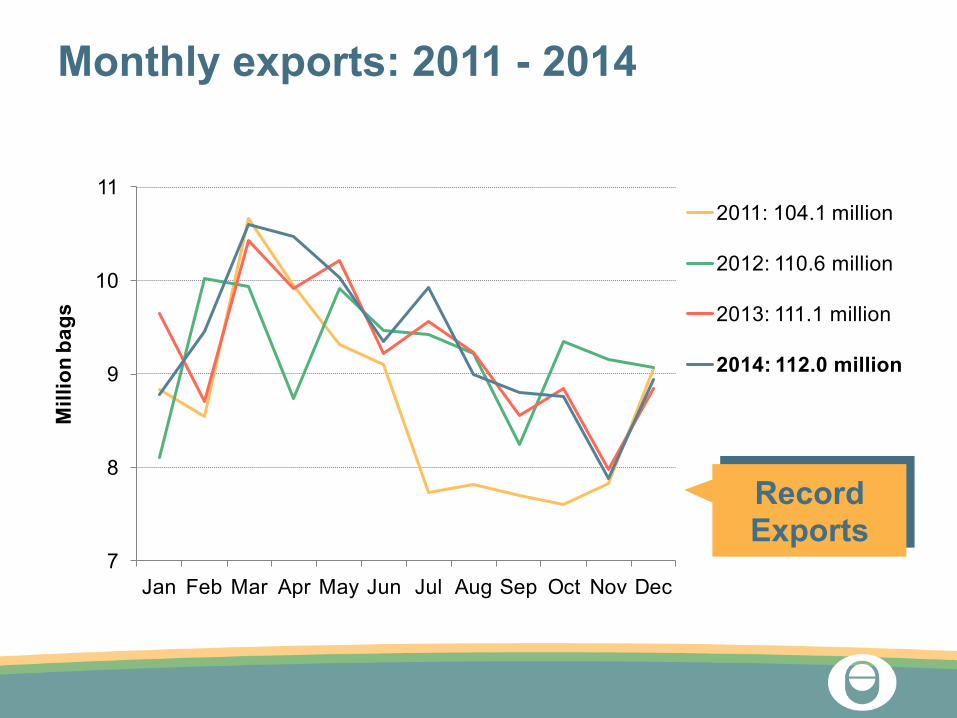
7
8
9
10
11
Jan Feb Mar Apr May Jun Jul Aug Sep Oct Nov Dec
Mill
ion
bags
2011: 104.1 million
2012: 110.6 million
2013: 111.1 million
2014: 112.0 million
Monthly exports: 2011 - 2014
Record Exports
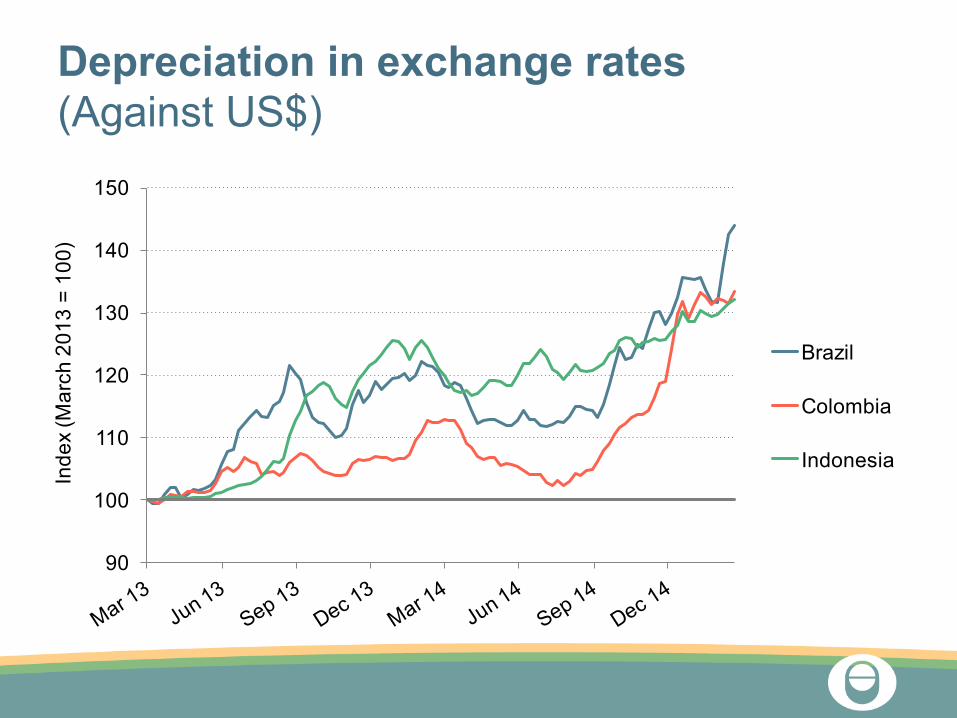
Depreciation in exchange rates (Against US$)
90
100
110
120
130
140
150
Inde
x (M
arch
201
3 =
100)
Brazil
Colombia
Indonesia
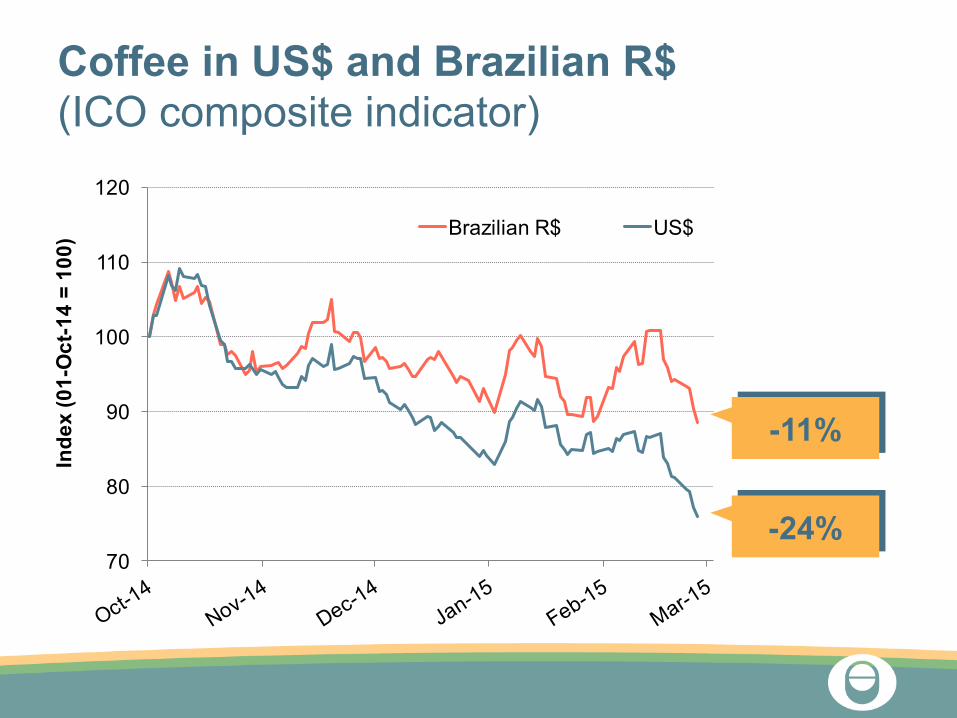
70
80
90
100
110
120
Inde
x (0
1-O
ct-1
4 =
100)
Brazilian R$ US$
Coffee in US$ and Brazilian R$ (ICO composite indicator)
-11%
-24%
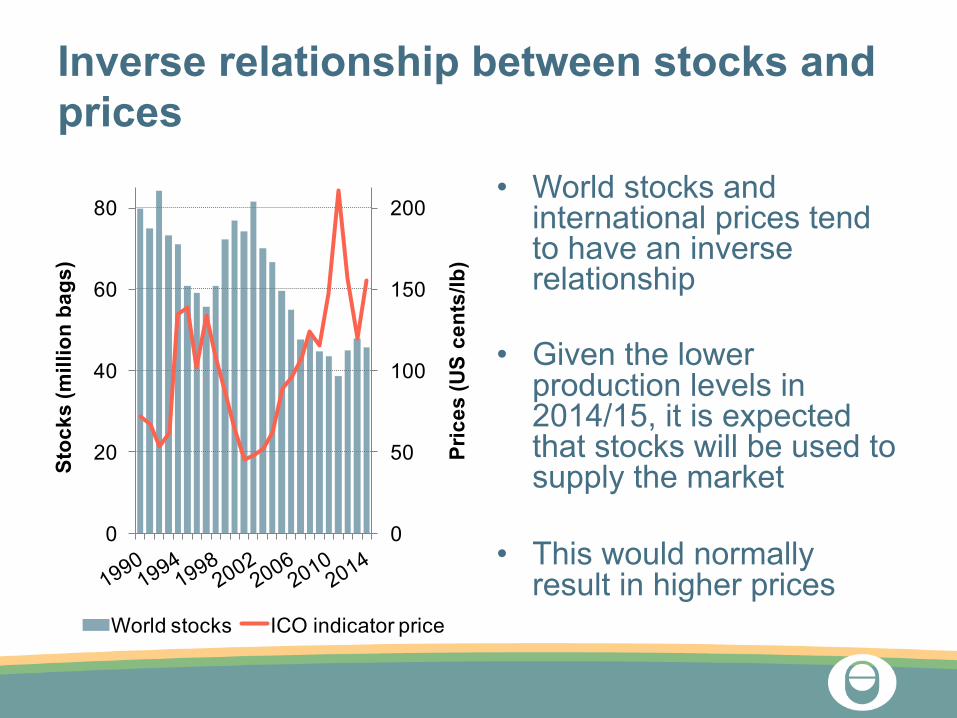
Inverse relationship between stocks and prices
• World stocks and international prices tend to have an inverse relationship
• Given the lower production levels in 2014/15, it is expected that stocks will be used to supply the market
• This would normally result in higher prices
0
50
100
150
200
0
20
40
60
80
Pric
es (U
S ce
nts/
lb)
Stoc
ks (m
illio
n ba
gs)
World stocks ICO indicator price
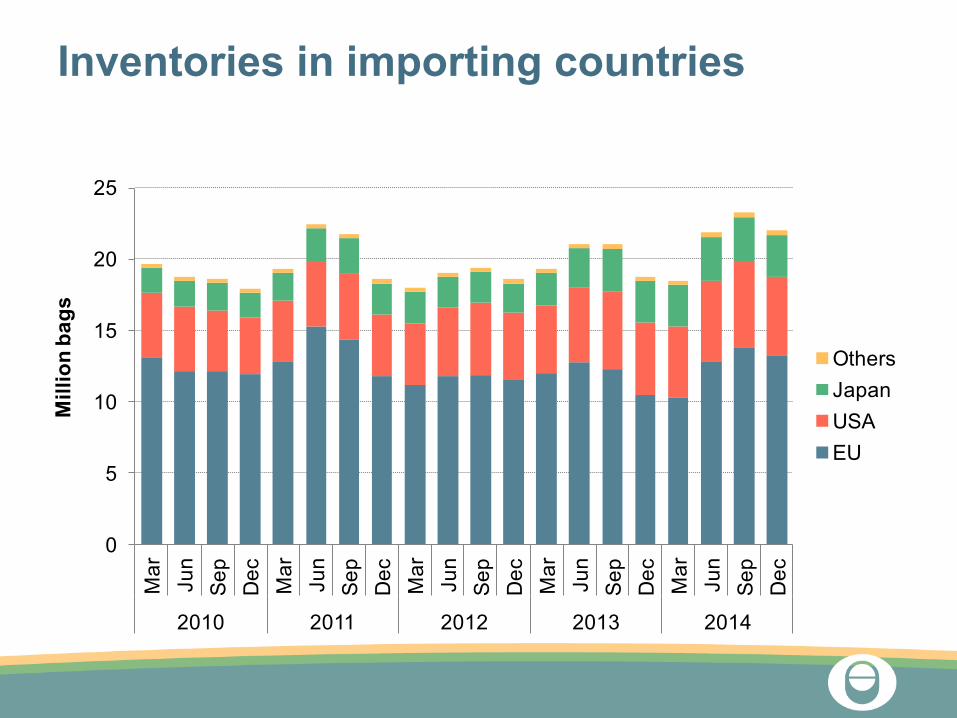
Inventories in importing countries
0
5
10
15
20
25
Mar
Jun
Sep Dec Mar
Jun
Sep Dec Mar
Jun
Sep Dec Mar
Jun
Sep Dec Mar
Jun
Sep Dec
2010 2011 2012 2013 2014
Mill
ion
bags
OthersJapanUSAEU
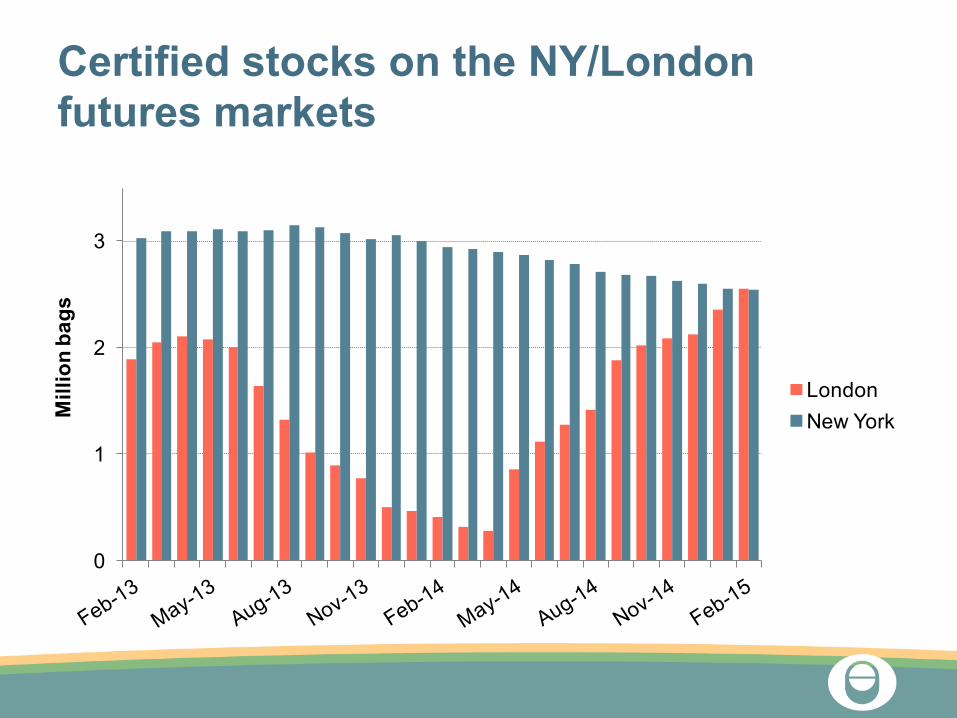
Certified stocks on the NY/London futures markets
0
1
2
3
Mill
ion
bags
LondonNew York
Conclusions
Global deficit in 2014/15, after two consecutive
surpluses
Accumulation of stocks will help supply the
market for now
But this cannot be maintained indefinitely, and will put pressure on
prices
Thank you