Embed Size (px)
Citation preview
College Affordability and Transparency
Explanation Form
Summary Guide to College Costs for the 2016 Collection Year
May 2017
The views expressed herein do not necessarily represent the positions or policies of the Department of Education. No official endorsement by the U.S. Department of Education of any product, commodity, service or enterprise mentioned in this publication is intended or should be inferred.
U.S. Department of Education Betsy DeVos Secretary
Office of Postsecondary Education Lynn Mahaffie Deputy Assistant Secretary for Policy, Planning and Innovation Delegated the Duties of Assistant Secretary for Postsecondary Education
May 2017This report is in the public domain. Authorization to reproduce it in whole or in part is granted. While permission to reprint this publication is not necessary, the citation should be:
U.S. Department of Education, Office of Postsecondary Education, College Affordability and Transparency Explanation Form: Summary Guide to College Costs for the 2016 Collection Year. Washington, D.C., 2017.
This report is available on the Department’s website at https://collegecost.ed.gov/catc/resources/2016_College_Affordability_and_Transparency_Explanation_Form_Summary.pdf.
Availability of Alternate FormatsRequests for documents in alternate formats such as Braille or large print should be submitted to the Alternate Format Center by calling 202 260 0852 or by contacting the 504 coordinator via email at [email protected].
Notice to Limited English Proficient Persons If you have difficulty understanding English, you may request language assistance services for Department information that is available to the public. These language assistance services are available free of charge. If you need more information about interpretation or translation services, please call 1–800–USA–LEARN (1-800-872-5327) (TTY: 1-800-437-0833), email us at [email protected], or write to U.S. Department of Education, Information Resource Center, 400 Maryland Ave., SW, Washington, DC 20202.
iii
Contents List of Tables ................................................................................................................................................ iv
List of Figures ............................................................................................................................................... iv
Abstract ......................................................................................................................................................... v
Executive Summary ...................................................................................................................................... vi
Introduction .................................................................................................................................................. 1
The College Affordability and Transparency Center Lists ......................................................................... 1
Institutional Sectors ............................................................................................................................. 2
IPEDS Data Used in CATC and CATEF ................................................................................................... 3
Calculating Percent Increases .............................................................................................................. 3
Tuition and Fees ................................................................................................................................... 4
Net Price ............................................................................................................................................... 4
The CATEF Survey ..................................................................................................................................... 5
Finance Data ......................................................................................................................................... 5
Summary of Results ...................................................................................................................................... 7
Analysis of Cost Areas ............................................................................................................................... 9
Excluded Schools ................................................................................................................................ 10
Explanations of Cost Increases ............................................................................................................... 11
Increased Enrollment ......................................................................................................................... 11
Staff, Wages, and Benefits ................................................................................................................. 13
New and Expanding Programs ........................................................................................................... 13
Expansion, Renovation, and Maintenance ......................................................................................... 14
Steps for Reducing Costs ........................................................................................................................ 14
Progress on Cost Reduction ............................................................................................................... 15
Conclusion ................................................................................................................................................... 16
Appendices .................................................................................................................................................. 18
Appendix I: 2016 Tuition and Fees CATEF Respondents ........................................................................ 18
Appendix II: 2016 Net Price CATEF Respondents ................................................................................... 28
Appendix III: 2016 Response Rates......................................................................................................... 37
Appendix IV: CATEF Review Guidelines .................................................................................................. 38
Appendix V: 2016 Tuition and Fees CATEF Instrument .......................................................................... 39
Appendix VI: 2016 Net Price CATEF Instrument ..................................................................................... 45
Appendix VII: Glossary of Terms ............................................................................................................. 51
iv
List of Tables
Table 1: Nine sectors used to categorize institutions (control, level) .......................................................... 2
Table 2: Example of the calculation of percent change over a three-year period ....................................... 3
Table 3: Number of institutions identified as having the greatest increases in each cost area, and the
median increase in total dollars, by cost area and survey for the 2016 CATEF .......................................... 10
Table 4: Compliant responses to the 2016 CATEF, by survey and institutional sector. .............................. 37
List of Figures
Figure 1: Comparison years for the 2016 CATEF .......................................................................................... 3
Figure 2: The number of institutions required to complete a 2016 CATEF form ......................................... 7
Figure 3: Number of institutions that responded to the 2016 CATEF, by list and institutional sector ........ 7
Figure 4: Percentage of institutions that responded to the 2016 Tuition & Fees CATEF by institutional
sector ............................................................................................................................................................ 8
Figure 5: Percentage of institutions that responded to the 2016 Net Price CATEF by institutional sector . 8
Figure 6: Total dollar amount increase for each cost area on the 2016 CATEF ............................................ 9
Figure 7: Selected cost areas for institutions with no Year-1 data on the 2016 CATEF ............................. 11
Figure 8: Number of institutions that responded to the CATEF, by list and year ....................................... 16
v
Abstract
Section 132(e) of the Higher Education Act of 1965, as amended (HEA), requires schools with the highest
increases in tuition and fees and net price (cost of attendance after grant and scholarship aid) to explain
to the secretary of education why their costs have gone up and how they will address these rising costs.
Further, the HEA requires the secretary to issue an annual report summarizing the responses provided by
these institutions and outlining the methodology employed to collect and interpret the information.
Respondents to the 2016 College Affordability Transparency Explanation Form (CATEF) with an increase
in tuition and fees and/or net price were indicated on the College Affordability and Transparency Center
List website. Accordingly, this Summary Guide to College Costs contains the U.S. Department of
Education’s (ED) methodology for the CATEF and summarizes responses to the same.
The 2016 CATEF asked institutions to provide (1) an explanation for the areas in the institution’s budget
with the highest percentage increase in costs; (2) a description of any steps they have taken (or intended
to take) toward reducing costs or the reason for not reducing costs; and (3) whether student charges are
within the exclusive control of the institution. The predominant reasons given for the cost increases
included rising enrollment, new staff or increases in wages and benefits, new programs or the addition of
supplies and equipment, and facility expansions and renovations due to the increased student population
or the need for a more modern approach to teaching.

vi
Executive Summary
The 2016 College Affordability and Transparency Explanation Form (CATEF) is a mandatory survey
for institutions in the top five percent of their sector (see Table 1) with the highest increases in tuition
and/or fees and net price, as per Section 132(e) of the Higher Education Act of 1965, as amended
(HEA). The CATEF examined six major cost areas1: (1) academic support, student services, and
institutional support; (2) auxiliary enterprises; (3) instruction; (4) net grant aid to students / scholarships
and fellowships; (5) other expenses; and (6) research and public service.
Of these cost areas, the following three are identified as having the highest cost increases over the
three-year period2 for schools on both the Highest Increase in Tuition and Fees list and the Highest
Increase in Net Price list: academic support, student services, and institutional support;
instruction; and other expenses.
Since the categorization of expenses varied by institution and multiple explanations for the
reported increases were present under each cost area, the overall CATEF narrative was more
accurate in summarizing the increases than deriving conclusions based on institutional responses to
individual cost areas.
The majority of institutions stated that rising student enrollment led to the cost increases, especially for
salaries and wages and employee fringe benefits. The additional staff directly supported the
expanded student population. The costs associated with hiring staff are just one of the ways in which
the growing student population affected the finances of these institutions. While institutions
primarily cited expenditures related to hiring additional instructors; several also reported adding
personnel to help maintain or improve student related services, such as financial aid, counseling,
tutoring, and security.
Secondary to the increase in student population was the addition or expansion of new programs or degree
levels. New programs and degree levels not only required additional or higher credentialed staff but also
facilities, supplies, and equipment. Physical changes to campuses were also provided as reasons for the
increases in cost, including new student facilities, classroom facilities, maintenance of existing facilities,
and larger unexpected repairs.
Additionally, with regard to increases in price, 102 out of 563 institutions reported that they did not have
exclusive control of student charges, citing state-level organizations, legislators, or governing boards as
partially or primarily responsible for establishing their tuition and fee rates.
1 Depending on the version of the IPEDS (Integrated Postsecondary Education Data System) Finance component forms completed, institutions either reported combined expenses for some cost area categories or reported expenses separately for each cost area. For the purpose of this report, any cost areas that some schools reported as combined have been combined across all institutions for comparability. Note: Two additional cost areas available to certain institutions were excluded. Hospital services is only available to 4-year institutions and was indicated as a cost area for one public 4-year institution. Independent operations is only available to public and private not-for-profit 4-year institutions and was indicated as a cost area for two private not-for-profit 4-year institutions, one on the Net Price CATEF and one on the Tuition and Fees CATEF. 2 The 2015 Highest Increase in Tuition and Fees College Affordability and Transparency Center (CATC) list was based on the percent change in tuition and fees for the three-year period between 2011-12 and 2013-14. The Highest Increase in Net Price CATC list was based on the percent change in net price for the three-year period between 2010-11 and 2012-13.

1
Introduction
Section 132 of the Higher Education Act of 1965, as amended (HEA), requires institutions on the annual
College Affordability and Transparency Center (CATC) lists of schools with the highest increases in tuition
and required fees and/or net price (cost of attendance after grant and scholarship aid) to explain to the
secretary of education why their costs have gone up and how they will address these rising costs. Further,
the HEA requires the secretary to issue an annual report summarizing the responses provided by these
institutions and outlining the methodology employed to collect and interpret the information.
Accordingly, this summary guide to college costs compiles the responses that institutions on the 2015
CATC list website provided to the U.S. Department of Education (ED) through the online College
Affordability Transparency Explanation Form (CATEF) in early 2016 and describes ED’s methodology.
The College Affordability and Transparency Center Lists
Since 2011, in an effort to improve transparency in college tuition prices for potential students and
families, ED is required to release a total of six lists related to student costs at America’s colleges and
universities. Using data collected by the National Center for Education Statistics (NCES) through the
Integrated Postsecondary Education Data System (IPEDS)3, each list is generated annually and released
via the publicly available College Affordability and Transparency Center List4 website by July 1.
Following are the six annually published CATC lists:
Highest Tuition and Fees: A list of the 5 percent of institutions from each sector that have the
highest tuition and required fees for the most recent academic year.
Highest Net Price: A list of the 5 percent of institutions from each sector that have the highest
net price for the most recent academic year.
Lowest Tuition and Fees: A list of the 10 percent of institutions from each sector that have the
lowest tuition and required fees for the most recent academic year.
Lowest Net Price: A list of the 10 percent of institutions from each sector that have the lowest
net price for the most recent academic year.
Highest Increase in Tuition and Fees: A list of the 5 percent of institutions from each sector that
have the largest (percentage) increase in tuition and required fees, expressed as a percentage
change, over the most recent 3-year period.
Highest Increase in Net Price: A list of the 5 percent of institutions from each sector that have
the largest (percentage) increase in net price, expressed as a percentage change, over the most
recent three-year period.
3 IPEDS is a mandatory data collection for institutions that participate in, or are applicants for participation in, any Federal student financial aid program authorized by Title IV of the HEA, as amended 20 USC 1094 (a)(17), HEA section 487(a)(17) and 34 CFR 668.14(b)(19). More information is available at the IPEDS Website. 4 Once the CATC list website is updated with new data, the previous data is archived and available for download at the bottom of the page.
2
The Highest Increase in Tuition and Fees and Highest Increase in Net Price lists were calculated for
institutions that have full-time, first-time degree/certificate-seeking undergraduate students. Each year,
institutions on the Highest Increase in Tuition and Fees and Highest Increase in Net Price lists are required
to provide additional information concerning college costs through the online CATEF.5 Institutions on both
lists were required to complete a separate CATEF form for each list.
For the 2015 CATC lists, 320 institutions were identified for highest increases in net price and 318
institutions were identified for highest increases in tuition and fees, some of which were on both lists.
Due to institution closures and loss of Title IV status, 37 of these institutions were not required to
complete the CATEF (19 from the Net Price CATEF and 18 from the Tuition and Fees CATEF).
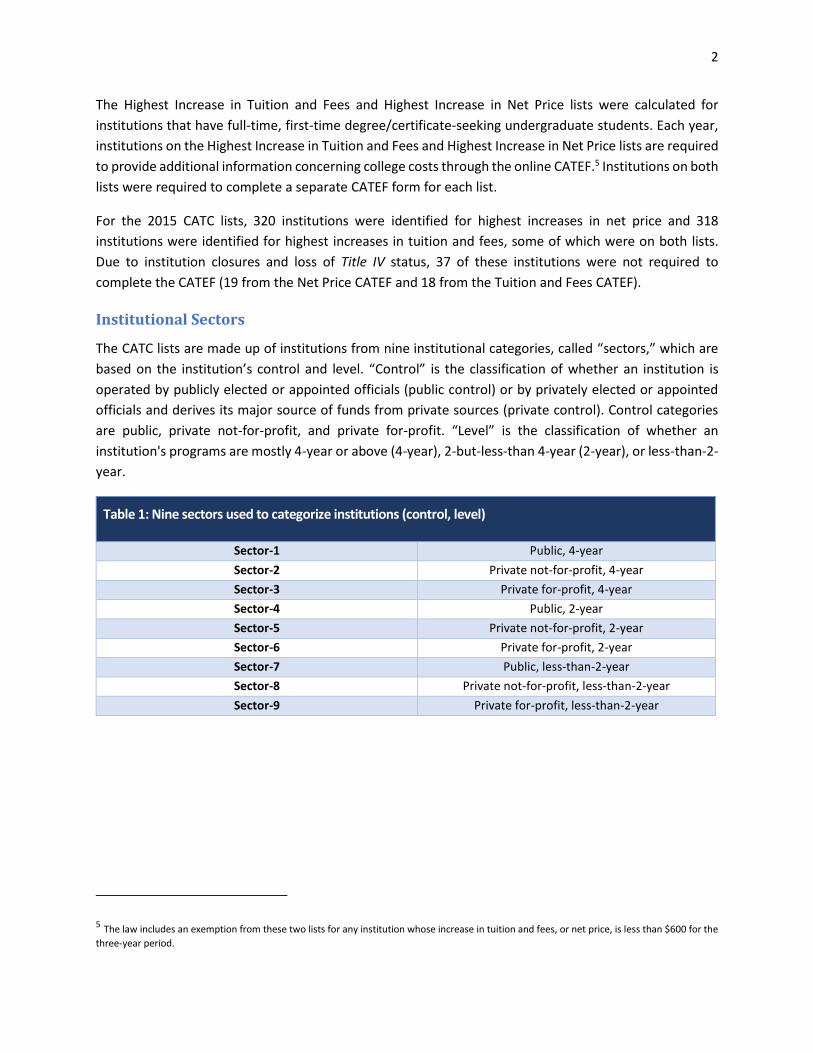
Institutional Sectors
The CATC lists are made up of institutions from nine institutional categories, called “sectors,” which are
based on the institution’s control and level. “Control” is the classification of whether an institution is
operated by publicly elected or appointed officials (public control) or by privately elected or appointed
officials and derives its major source of funds from private sources (private control). Control categories
are public, private not-for-profit, and private for-profit. “Level” is the classification of whether an
institution's programs are mostly 4-year or above (4-year), 2-but-less-than 4-year (2-year), or less-than-2-
year.
Table 1: Nine sectors used to categorize institutions (control, level)
Sector-1 Public, 4-year
Sector-2 Private not-for-profit, 4-year
Sector-3 Private for-profit, 4-year
Sector-4 Public, 2-year
Sector-5 Private not-for-profit, 2-year
Sector-6 Private for-profit, 2-year
Sector-7 Public, less-than-2-year
Sector-8 Private not-for-profit, less-than-2-year
Sector-9 Private for-profit, less-than-2-year
5 The law includes an exemption from these two lists for any institution whose increase in tuition and fees, or net price, is less than $600 for the
three-year period.
3
IPEDS Data Used in CATC and CATEF
The 2015 CATC lists were generated using data collected during the 2013–14 IPEDS data collection cycle.
The reported data are available via the IPEDS Data Center. In IPEDS, tuition and fees are collected through
the IPEDS Institutional Characteristics component for the current data year; while net price is collected
through the IPEDS Student Financial Aid component using data from the previous year.
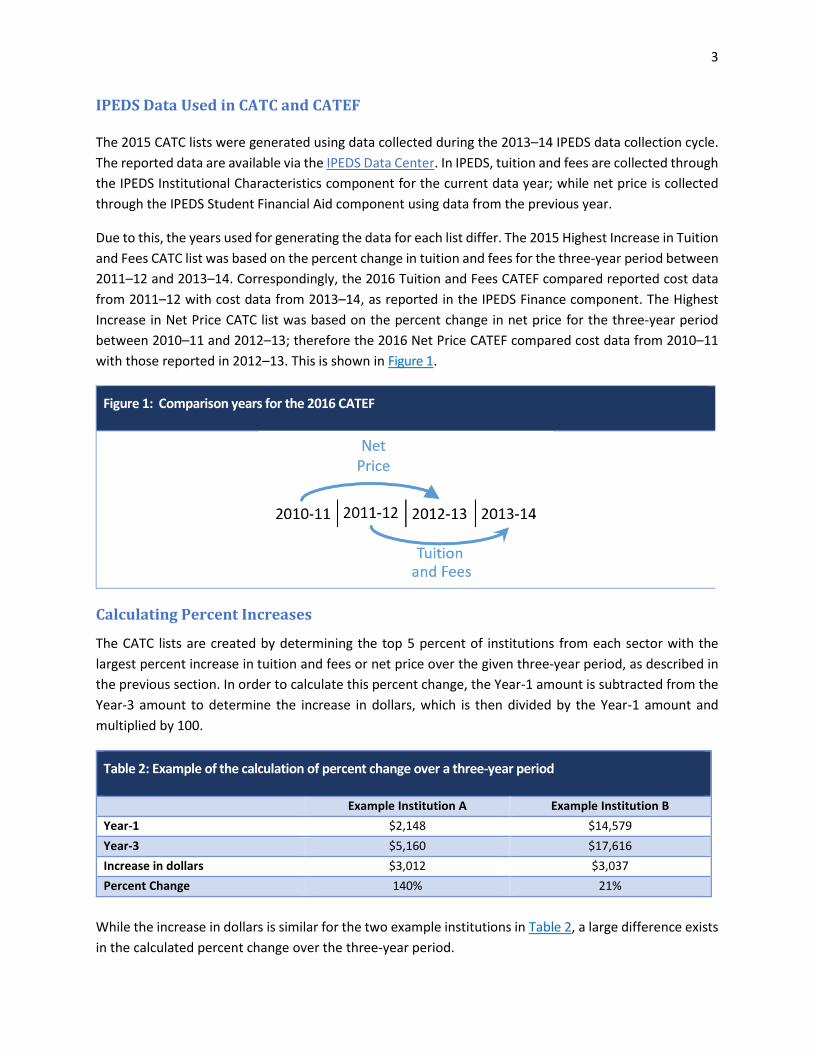
Due to this, the years used for generating the data for each list differ. The 2015 Highest Increase in Tuition
and Fees CATC list was based on the percent change in tuition and fees for the three-year period between
2011–12 and 2013–14. Correspondingly, the 2016 Tuition and Fees CATEF compared reported cost data
from 2011–12 with cost data from 2013–14, as reported in the IPEDS Finance component. The Highest
Increase in Net Price CATC list was based on the percent change in net price for the three-year period
between 2010–11 and 2012–13; therefore the 2016 Net Price CATEF compared cost data from 2010–11
with those reported in 2012–13. This is shown in Figure 1.
Figure 1: Comparison years for the 2016 CATEF
Calculating Percent Increases
The CATC lists are created by determining the top 5 percent of institutions from each sector with the
largest percent increase in tuition and fees or net price over the given three-year period, as described in
the previous section. In order to calculate this percent change, the Year-1 amount is subtracted from the
Year-3 amount to determine the increase in dollars, which is then divided by the Year-1 amount and
multiplied by 100.
Table 2: Example of the calculation of percent change over a three-year period
Example Institution A Example Institution B
Year-1 $2,148 $14,579
Year-3 $5,160 $17,616
Increase in dollars $3,012 $3,037
Percent Change 140% 21%
While the increase in dollars is similar for the two example institutions in Table 2, a large difference exists
in the calculated percent change over the three-year period.
4
Tuition and Fees
For institutions that charge different tuition and fees for in-district, in-state, or out-of-state students and
report tuition and fees for the full academic year, the CATC lists are based on the in-state or in-district
tuition rate. For institutions that charge by program rather than by academic year, referred to in IPEDS
as “program reporters,” tuition and fees are reported for the institution’s largest program. These values
represent what a typical student would be charged and may not be the same for all students at an
institution.
For institutions on the 2015 CATC Highest Increase in Tuition and Fees list, the percent changes ranged
from a 14 percent increase for a Sector-3 (private for-profit, 4-year) school that raised its tuition and fees
from $13,609 to $15,508, to a 1,300 percent increase for a Sector-7 (public, less-than-2-year) school that
raised its tuition and fees from $500 to $7,000. The actual 2013–14 tuition and fees charges to students
on the same list ranged from $1,969 to $45,140.
Net Price
The tuition and fees amount is also included as part of the calculation of the net price. The HEA defines
net price as “the average yearly price of attendance actually charged to first-time, full-time undergraduate
students receiving student aid at an institution of higher education after deducting such aid.” In IPEDS,
the total cost of attendance is the sum of published tuition and required fees, books and supplies, and the
weighted average for room and board and other expenses by living arrangement. The weighted average
is calculated based on the room and board and other expenses for each living arrangement (on-campus,
off-campus with family, and off-campus not-with-family) and the number of first-time, full-time
undergraduate students reported for each living arrangement. The net price is then generated by
subtracting the average amount of federal, state/local, or institutional grant or scholarship aid from the
total cost of attendance.
For institutions on the 2015 CATC Highest Increase in Net Price list, the percent changes ranged from a 24
percent increase for a Sector-3 (private for-profit, 4-year) school that raised its net price from $29,924 to
$37,246, to a 4,710 percent increase for a Sector-7 (public, less-than-2-year) school that raised its new
price from $41 to $1,972. The actual 2012-13 net price charges on the same list ranged from $958 to
$41,243.
5
The CATEF Survey
To aid institutions in complying with HEA’s requirement to explain why costs have risen at their schools
and how they might reduce those costs, ED established the online CATEF survey. Specifically, the 2016
CATEF allowed institutions on the 2015 Highest Increase CATC lists to provide (1) an explanation for the
cost areas in their budget with the highest percentage increases in costs over the 3-year time period; (2)
a description of any steps they have taken (or intend to take) toward reducing costs or the reason for not
reducing costs; and (3) whether student charges were within the exclusive control of the institution, and
if not, the identity of the agency (or agencies) responsible for determining student charges. In addition,
institutions that appeared on the same highest increase lists for two or more consecutive years were
asked to explain the progress made on their steps to reduce costs reported on the previous year’s CATEF.6
The 2016 CATEF examined six major cost areas: (1) academic support, student services, and institutional
support; (2) auxiliary enterprises; (3) instruction; (4) net grant aid to students / scholarships and
fellowships; (5) other expenses; and (6) research and public service. For each institution completing the
CATEF, the three cost areas with the highest percent increases over a three-year period were
automatically identified and prepopulated in the CATEF based on data previously reported by the
institution in the expenses portion of the IPEDS Finance component. Institutions that did not report data
in the IPEDS Finance component for Year-1 of the three-year period were asked to select their cost areas
of highest increase.
The institutional responses provided for the six evaluated cost areas allow for a better understanding of
the expense increases that may have resulted in the rise of costs. Each submitted 2016 CATEF went
through a review and approval process7 to ensure that institutions gave thorough and relevant responses
for each required cost area.
Finance Data
Depending on the accounting standards used by the institutions for their IPEDS Finance component forms,
institutions either reported combined expenses for some cost area categories or reported expenses
separately for each cost area. For the purpose of this report, any cost areas that some schools reported
as combined have been combined across all institutions for comparability. Specifically, this included the
combination of academic support, student services, and institutional support and the combination of
research and public service. Additionally, two cost areas available to certain institutions were excluded
from this report. The first, hospital services, is only available to 4-year institutions. This cost area was
identified as an area of highest increase for one Sector-1 (public, 4-year) institution. The second,
independent operations, is only available to Sector-1 and Sector-2 (private not-for-profit, 4-year). Only
two Sector-2 institutions, one on the Net Price CATEF and one on the Tuition and Fees CATEF, had
independent operations as one of the areas of highest increase.
6 The 2016 CATEF instruments can be found in Appendix V: 2016 Tuition and Fees CATEF Instrument and Appendix VI: 2016 Net Price CATEF
Instrument. 7 For details on the review and approval process, see Appendix IV: CATEF Review Guidelines.
6
Another major change occurred in the 2014–15 IPEDS data collection where cost data is collected for
2013–14. This change affected reporting for for-profit institutions (Sector-3, Sector-6, and Sector-9) on
the Tuition and Fees CATEF. A number of changes were made to the Financial Accounting Standards Board
(FASB) forms for for-profit institutions to increase data comparability across institutional sectors and
utility to institutions and decision makers, while also ensuring data being reported were appropriate for
the sector and accurately represent the institutions. Additional details about this change are available on
the Archived Changes8 page of the IPEDS website. In order to compare the Year-1 and Year-3 data for
these institutions, fields that were combined in the 2013–14 data collection and separated in 2014–15
data collection were combined again for the purpose of identifying the top three increases. Additionally,
degree-granting for-profit institutions began reporting the hospital services expense in 2014-15. Because
there is no comparison to prior years, this expense item was excluded from the form so it would not be
considered one of the greatest increases.
8 The Archived Changes page can be found at http://nces.ed.gov/ipeds/InsidePages/ArchivedChanges?year=2014-15.
7
Summary of Results
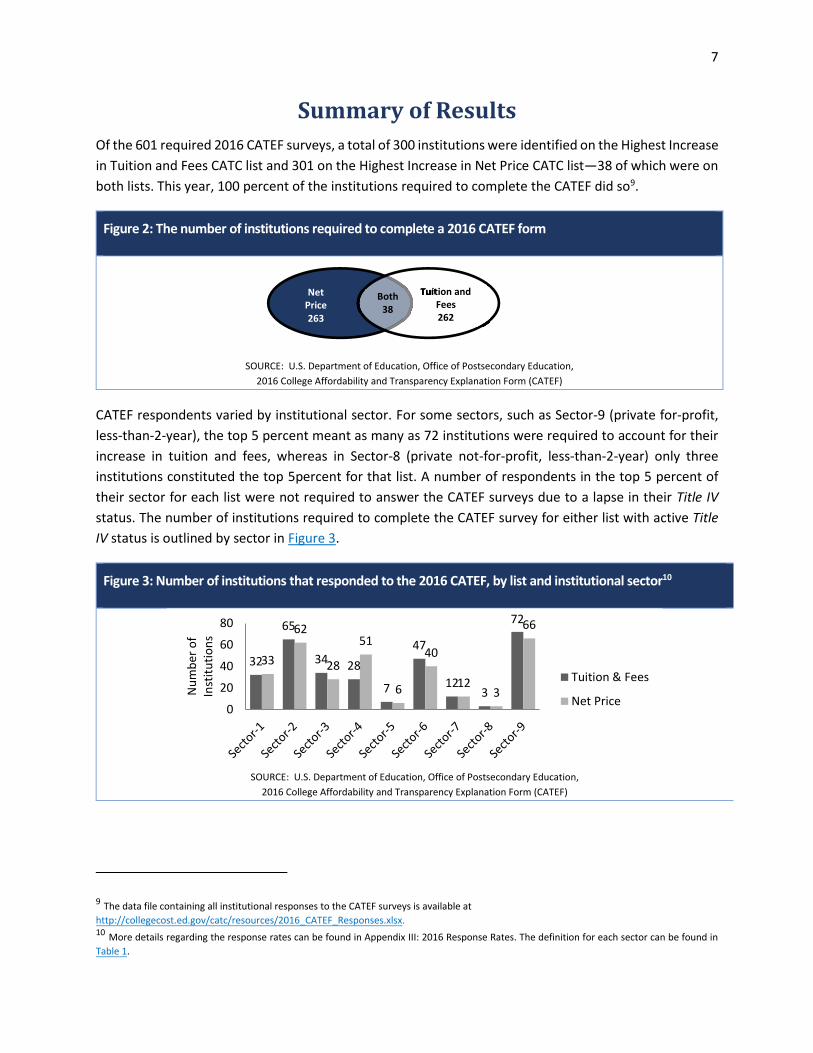
Of the 601 required 2016 CATEF surveys, a total of 300 institutions were identified on the Highest Increase
in Tuition and Fees CATC list and 301 on the Highest Increase in Net Price CATC list—38 of which were on
both lists. This year, 100 percent of the institutions required to complete the CATEF did so9.
Figure 2: The number of institutions required to complete a 2016 CATEF form
SOURCE: U.S. Department of Education, Office of Postsecondary Education,
2016 College Affordability and Transparency Explanation Form (CATEF)
CATEF respondents varied by institutional sector. For some sectors, such as Sector-9 (private for-profit,
less-than-2-year), the top 5 percent meant as many as 72 institutions were required to account for their
increase in tuition and fees, whereas in Sector-8 (private not-for-profit, less-than-2-year) only three
institutions constituted the top 5percent for that list. A number of respondents in the top 5 percent of
their sector for each list were not required to answer the CATEF surveys due to a lapse in their Title IV status. The number of institutions required to complete the CATEF survey for either list with active Title IV status is outlined by sector in Figure 3.
Figure 3: Number of institutions that responded to the 2016 CATEF, by list and institutional sector10
SOURCE: U.S. Department of Education, Office of Postsecondary Education,
2016 College Affordability and Transparency Explanation Form (CATEF)
9 The data file containing all institutional responses to the CATEF surveys is available at
http://collegecost.ed.gov/catc/resources/2016_CATEF_Responses.xlsx.10 More details regarding the response rates can be found in Appendix III: 2016 Response Rates. The definition for each sector can be found in
Table 1.
32
65
34 28
7
47
123
72
33
62
28
51
6
40
123
66
0
20
40
60
80
Nu
mb
er o
fIn
stit
uti
on
s
Tuition & Fees
Net Price
Net Price 263
Tuition and Fees 262
Tuition and Both 38
8
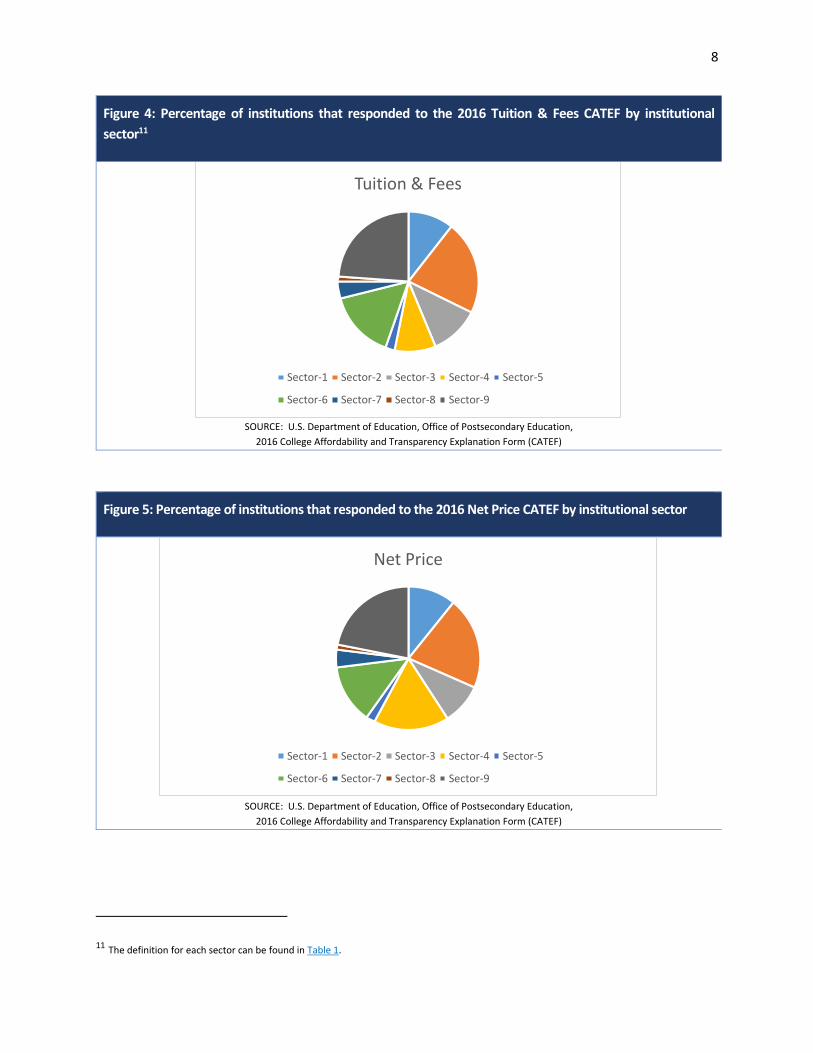
Figure 4: Percentage of institutions that responded to the 2016 Tuition & Fees CATEF by institutional
sector11
SOURCE: U.S. Department of Education, Office of Postsecondary Education,
2016 College Affordability and Transparency Explanation Form (CATEF)
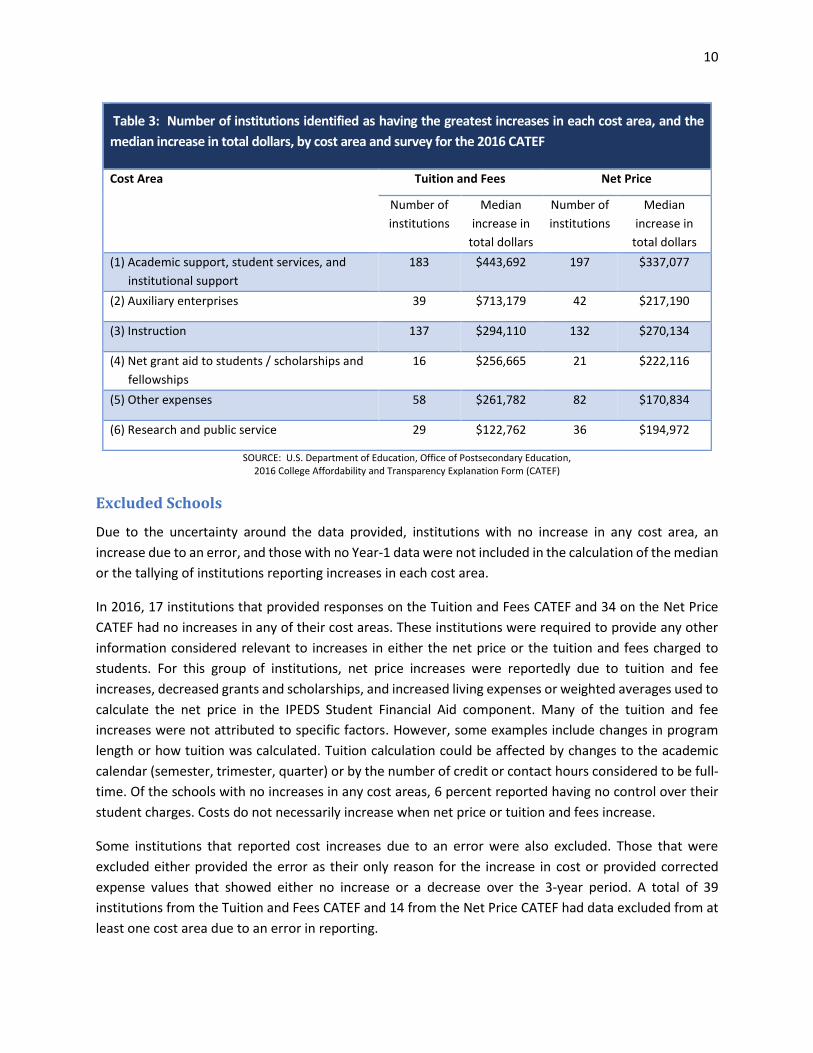
Figure 5: Percentage of institutions that responded to the 2016 Net Price CATEF by institutional sector
SOURCE: U.S. Department of Education, Office of Postsecondary Education,
2016 College Affordability and Transparency Explanation Form (CATEF)
11 The definition for each sector can be found in Table 1.
Tuition & Fees
Sector-1 Sector-2 Sector-3 Sector-4 Sector-5
Sector-6 Sector-7 Sector-8 Sector-9
Net Price
Sector-1 Sector-2 Sector-3 Sector-4 Sector-5
Sector-6 Sector-7 Sector-8 Sector-9

9
Analysis of Cost Areas
As previously stated, the cost areas evaluated in the CATEF for the Tuition and Fees and Net Price surveys
were (1) academic support, student services, and institutional support; (2) auxiliary enterprises; (3)
instruction; (4) net grant aid to students/scholarships and fellowships; (5) other expenses; and
(6) research and public service. Figure 6 shows the amount of increase for each of the six cost areas
examined by the 2016 CATEF.
Figure 6: Total dollar amount increase for each cost area on the 2016 CATEF
SOURCE: U.S. Department of Education, Office of Postsecondary Education,
2016 College Affordability and Transparency Explanation Form (CATEF)
For many institutions, the IPEDS Finance component split each cost area into the following expense types:
salaries and wages, employee fringe benefits, operation and maintenance of plant, depreciation, interest,
and all other. This means that for each of the cost areas, the contributing factor for the rise in cost can be
directly attributed to one or more of these types. However, because of differences in reporting and the
varying explanations for each cost area, a comparison of the expense types was not possible. To provide
a better representation of the overall results, the median increase for each cost area has been identified
in Table 3.
$23,042,856
$122,767,962
$6,196,567
$215,522,830
$104,730,475
$297,435,803
$35,797,635
$124,862,633
$27,328,621
$124,902,569
$103,957,118
$243,359,781
$0 $100,000,000 $200,000,000 $300,000,000
(6) Research and public service
(5) Other expenses
(4) Net grant aid to students / scholarshipsand fellowships
(3) Instruction
(2) Auxiliary enterprises
(1) Academic support, student services, andinstitutional support
Net Price Tuition & Fees
10
SOURCE: U.S. Department of Education, Office of Postsecondary Education, 2016 College Affordability and Transparency Explanation Form (CATEF)
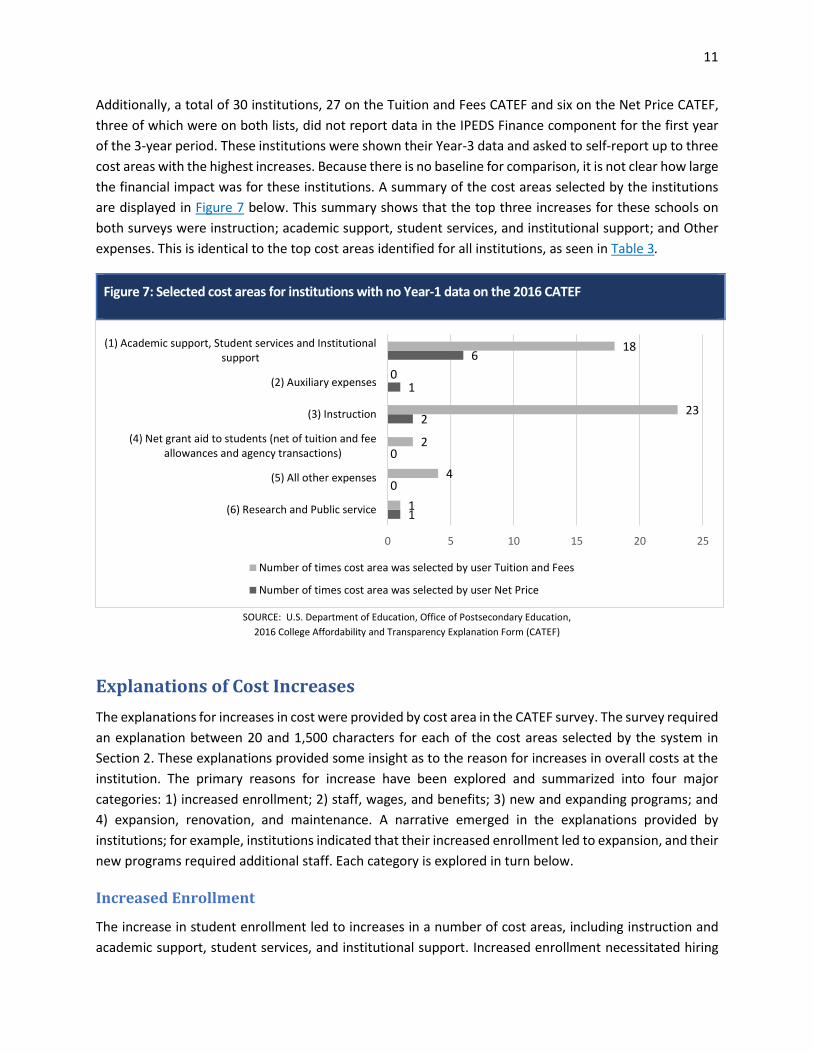
Excluded Schools
Due to the uncertainty around the data provided, institutions with no increase in any cost area, an
increase due to an error, and those with no Year-1 data were not included in the calculation of the median
or the tallying of institutions reporting increases in each cost area.
In 2016, 17 institutions that provided responses on the Tuition and Fees CATEF and 34 on the Net Price
CATEF had no increases in any of their cost areas. These institutions were required to provide any other
information considered relevant to increases in either the net price or the tuition and fees charged to
students. For this group of institutions, net price increases were reportedly due to tuition and fee
increases, decreased grants and scholarships, and increased living expenses or weighted averages used to
calculate the net price in the IPEDS Student Financial Aid component. Many of the tuition and fee
increases were not attributed to specific factors. However, some examples include changes in program
length or how tuition was calculated. Tuition calculation could be affected by changes to the academic
calendar (semester, trimester, quarter) or by the number of credit or contact hours considered to be full-
time. Of the schools with no increases in any cost areas, 6 percent reported having no control over their
student charges. Costs do not necessarily increase when net price or tuition and fees increase.
Some institutions that reported cost increases due to an error were also excluded. Those that were
excluded either provided the error as their only reason for the increase in cost or provided corrected
expense values that showed either no increase or a decrease over the 3-year period. A total of 39
institutions from the Tuition and Fees CATEF and 14 from the Net Price CATEF had data excluded from at
least one cost area due to an error in reporting.
Table 3: Number of institutions identified as having the greatest increases in each cost area, and the
median increase in total dollars, by cost area and survey for the 2016 CATEF
Cost Area Tuition and Fees Net Price
Number of
institutions
Median
increase in
total dollars
Number of
institutions
Median
increase in
total dollars
(1) Academic support, student services, and
institutional support
183 $443,692 197 $337,077
(2) Auxiliary enterprises 39 $713,179 42 $217,190
(3) Instruction 137 $294,110 132 $270,134
(4) Net grant aid to students / scholarships and
fellowships
16 $256,665 21 $222,116
(5) Other expenses 58 $261,782 82 $170,834
(6) Research and public service 29 $122,762 36 $194,972
11
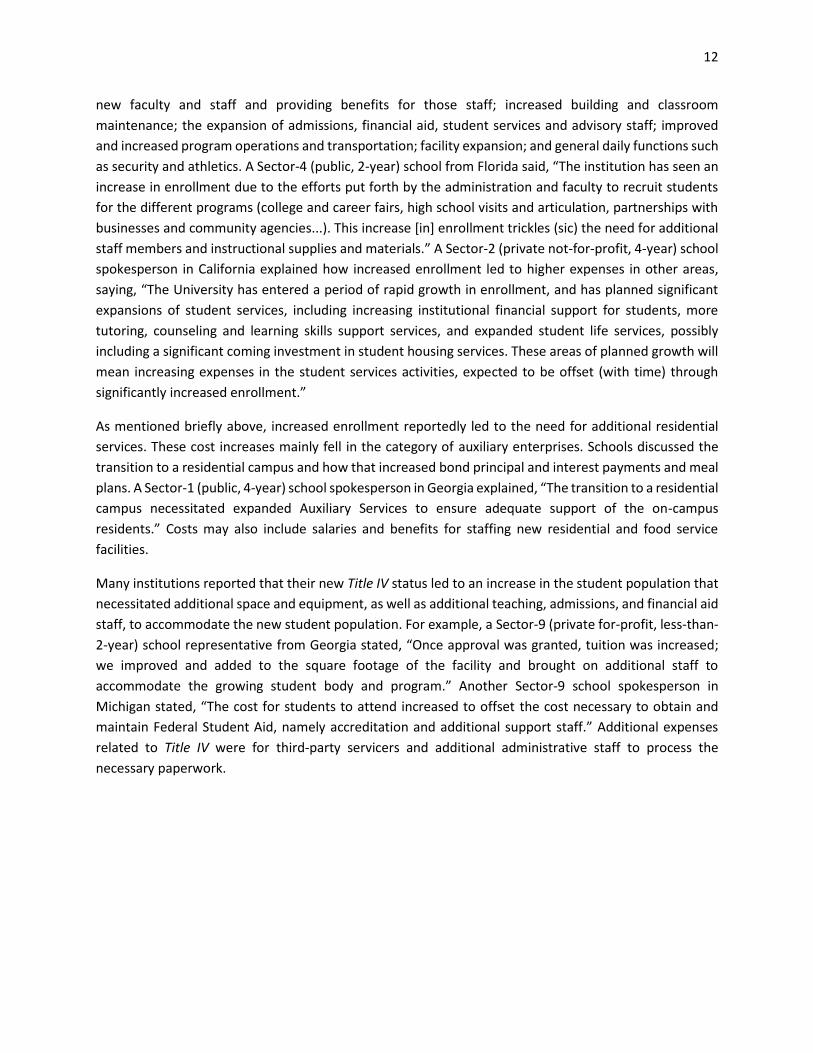
Additionally, a total of 30 institutions, 27 on the Tuition and Fees CATEF and six on the Net Price CATEF,
three of which were on both lists, did not report data in the IPEDS Finance component for the first year
of the 3-year period. These institutions were shown their Year-3 data and asked to self-report up to three
cost areas with the highest increases. Because there is no baseline for comparison, it is not clear how large
the financial impact was for these institutions. A summary of the cost areas selected by the institutions
are displayed in Figure 7 below. This summary shows that the top three increases for these schools on
both surveys were instruction; academic support, student services, and institutional support; and Other
expenses. This is identical to the top cost areas identified for all institutions, as seen in Table 3.
Figure 7: Selected cost areas for institutions with no Year-1 data on the 2016 CATEF
SOURCE: U.S. Department of Education, Office of Postsecondary Education,
2016 College Affordability and Transparency Explanation Form (CATEF)
Explanations of Cost Increases
The explanations for increases in cost were provided by cost area in the CATEF survey. The survey required
an explanation between 20 and 1,500 characters for each of the cost areas selected by the system in
Section 2. These explanations provided some insight as to the reason for increases in overall costs at the
institution. The primary reasons for increase have been explored and summarized into four major
categories: 1) increased enrollment; 2) staff, wages, and benefits; 3) new and expanding programs; and
4) expansion, renovation, and maintenance. A narrative emerged in the explanations provided by
institutions; for example, institutions indicated that their increased enrollment led to expansion, and their
new programs required additional staff. Each category is explored in turn below.
Increased Enrollment
The increase in student enrollment led to increases in a number of cost areas, including instruction and
academic support, student services, and institutional support. Increased enrollment necessitated hiring
1
0
0
2
1
6
1
4
2
23
0
18
0 5 10 15 20 25
(6) Research and Public service
(5) All other expenses
(4) Net grant aid to students (net of tuition and feeallowances and agency transactions)
(3) Instruction
(2) Auxiliary expenses
(1) Academic support, Student services and Institutionalsupport
Number of times cost area was selected by user Tuition and Fees
Number of times cost area was selected by user Net Price
12
new faculty and staff and providing benefits for those staff; increased building and classroom
maintenance; the expansion of admissions, financial aid, student services and advisory staff; improved
and increased program operations and transportation; facility expansion; and general daily functions such
as security and athletics. A Sector-4 (public, 2-year) school from Florida said, “The institution has seen an
increase in enrollment due to the efforts put forth by the administration and faculty to recruit students
for the different programs (college and career fairs, high school visits and articulation, partnerships with
businesses and community agencies...). This increase [in] enrollment trickles (sic) the need for additional
staff members and instructional supplies and materials.” A Sector-2 (private not-for-profit, 4-year) school
spokesperson in California explained how increased enrollment led to higher expenses in other areas,
saying, “The University has entered a period of rapid growth in enrollment, and has planned significant
expansions of student services, including increasing institutional financial support for students, more
tutoring, counseling and learning skills support services, and expanded student life services, possibly
including a significant coming investment in student housing services. These areas of planned growth will
mean increasing expenses in the student services activities, expected to be offset (with time) through
significantly increased enrollment.”
As mentioned briefly above, increased enrollment reportedly led to the need for additional residential
services. These cost increases mainly fell in the category of auxiliary enterprises. Schools discussed the
transition to a residential campus and how that increased bond principal and interest payments and meal
plans. A Sector-1 (public, 4-year) school spokesperson in Georgia explained, “The transition to a residential
campus necessitated expanded Auxiliary Services to ensure adequate support of the on-campus
residents.” Costs may also include salaries and benefits for staffing new residential and food service
facilities.
Many institutions reported that their new Title IV status led to an increase in the student population that
necessitated additional space and equipment, as well as additional teaching, admissions, and financial aid
staff, to accommodate the new student population. For example, a Sector-9 (private for-profit, less-than-
2-year) school representative from Georgia stated, “Once approval was granted, tuition was increased;
we improved and added to the square footage of the facility and brought on additional staff to
accommodate the growing student body and program.” Another Sector-9 school spokesperson in
Michigan stated, “The cost for students to attend increased to offset the cost necessary to obtain and
maintain Federal Student Aid, namely accreditation and additional support staff.” Additional expenses
related to Title IV were for third-party servicers and additional administrative staff to process the
necessary paperwork.
13
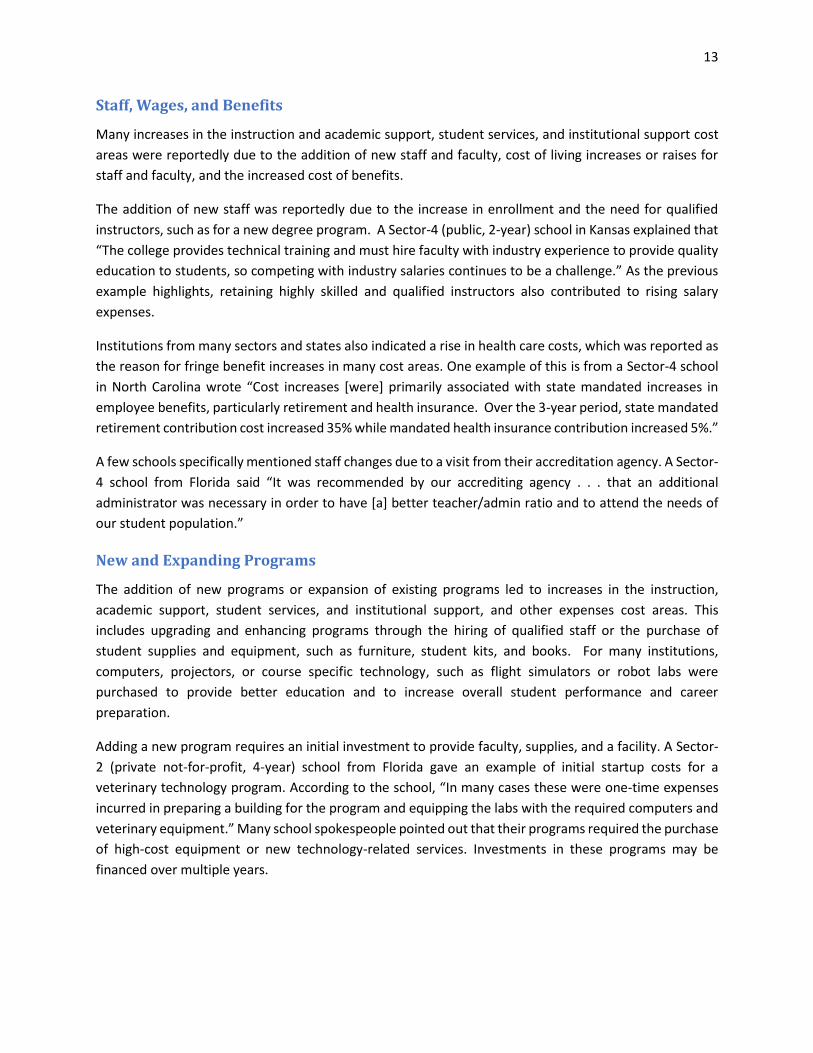
Staff, Wages, and Benefits
Many increases in the instruction and academic support, student services, and institutional support cost
areas were reportedly due to the addition of new staff and faculty, cost of living increases or raises for
staff and faculty, and the increased cost of benefits.
The addition of new staff was reportedly due to the increase in enrollment and the need for qualified
instructors, such as for a new degree program. A Sector-4 (public, 2-year) school in Kansas explained that
“The college provides technical training and must hire faculty with industry experience to provide quality
education to students, so competing with industry salaries continues to be a challenge.” As the previous
example highlights, retaining highly skilled and qualified instructors also contributed to rising salary
expenses.
Institutions from many sectors and states also indicated a rise in health care costs, which was reported as
the reason for fringe benefit increases in many cost areas. One example of this is from a Sector-4 school
in North Carolina wrote “Cost increases [were] primarily associated with state mandated increases in
employee benefits, particularly retirement and health insurance. Over the 3-year period, state mandated
retirement contribution cost increased 35% while mandated health insurance contribution increased 5%.”
A few schools specifically mentioned staff changes due to a visit from their accreditation agency. A Sector-
4 school from Florida said “It was recommended by our accrediting agency . . . that an additional
administrator was necessary in order to have [a] better teacher/admin ratio and to attend the needs of
our student population.”
New and Expanding Programs
The addition of new programs or expansion of existing programs led to increases in the instruction,
academic support, student services, and institutional support, and other expenses cost areas. This
includes upgrading and enhancing programs through the hiring of qualified staff or the purchase of
student supplies and equipment, such as furniture, student kits, and books. For many institutions,
computers, projectors, or course specific technology, such as flight simulators or robot labs were
purchased to provide better education and to increase overall student performance and career
preparation.
Adding a new program requires an initial investment to provide faculty, supplies, and a facility. A Sector-
2 (private not-for-profit, 4-year) school from Florida gave an example of initial startup costs for a
veterinary technology program. According to the school, “In many cases these were one-time expenses
incurred in preparing a building for the program and equipping the labs with the required computers and
veterinary equipment.” Many school spokespeople pointed out that their programs required the purchase
of high-cost equipment or new technology-related services. Investments in these programs may be
financed over multiple years.
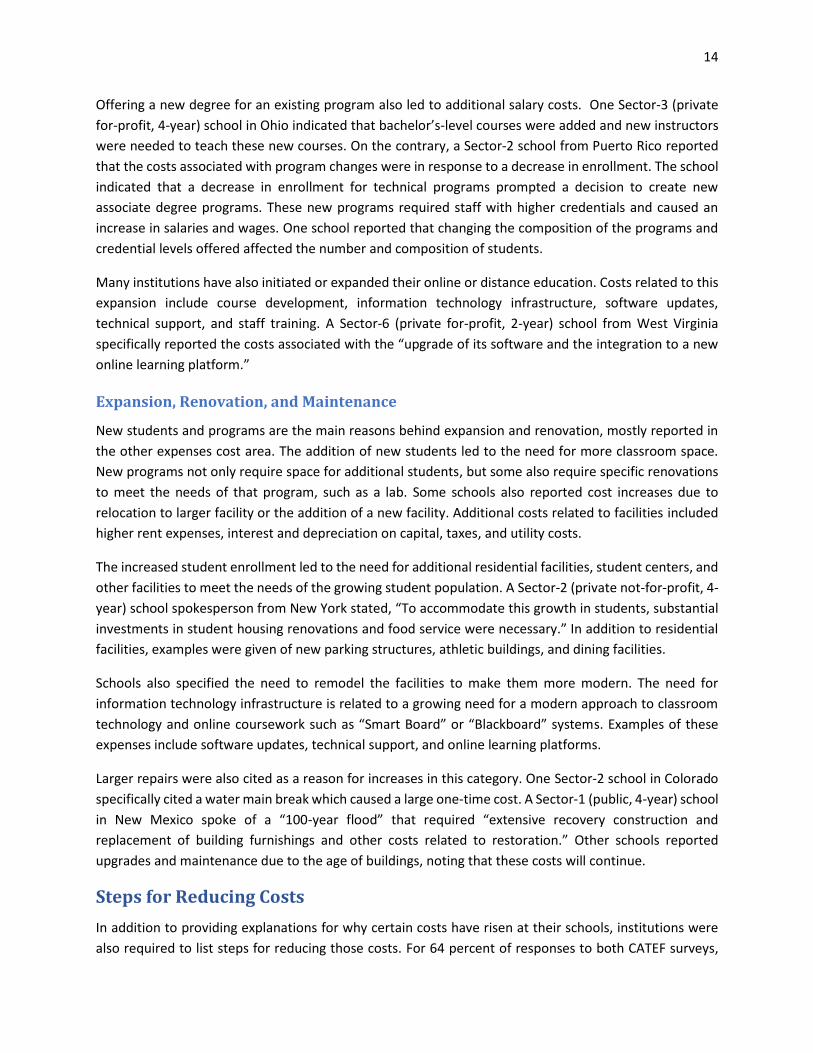
14
Offering a new degree for an existing program also led to additional salary costs. One Sector-3 (private
for-profit, 4-year) school in Ohio indicated that bachelor’s-level courses were added and new instructors
were needed to teach these new courses. On the contrary, a Sector-2 school from Puerto Rico reported
that the costs associated with program changes were in response to a decrease in enrollment. The school
indicated that a decrease in enrollment for technical programs prompted a decision to create new
associate degree programs. These new programs required staff with higher credentials and caused an
increase in salaries and wages. One school reported that changing the composition of the programs and
credential levels offered affected the number and composition of students.
Many institutions have also initiated or expanded their online or distance education. Costs related to this
expansion include course development, information technology infrastructure, software updates,
technical support, and staff training. A Sector-6 (private for-profit, 2-year) school from West Virginia
specifically reported the costs associated with the “upgrade of its software and the integration to a new
online learning platform.”
Expansion, Renovation, and Maintenance
New students and programs are the main reasons behind expansion and renovation, mostly reported in
the other expenses cost area. The addition of new students led to the need for more classroom space.
New programs not only require space for additional students, but some also require specific renovations
to meet the needs of that program, such as a lab. Some schools also reported cost increases due to
relocation to larger facility or the addition of a new facility. Additional costs related to facilities included
higher rent expenses, interest and depreciation on capital, taxes, and utility costs.
The increased student enrollment led to the need for additional residential facilities, student centers, and
other facilities to meet the needs of the growing student population. A Sector-2 (private not-for-profit, 4-
year) school spokesperson from New York stated, “To accommodate this growth in students, substantial
investments in student housing renovations and food service were necessary.” In addition to residential
facilities, examples were given of new parking structures, athletic buildings, and dining facilities.
Schools also specified the need to remodel the facilities to make them more modern. The need for
information technology infrastructure is related to a growing need for a modern approach to classroom
technology and online coursework such as “Smart Board” or “Blackboard” systems. Examples of these
expenses include software updates, technical support, and online learning platforms.
Larger repairs were also cited as a reason for increases in this category. One Sector-2 school in Colorado
specifically cited a water main break which caused a large one-time cost. A Sector-1 (public, 4-year) school
in New Mexico spoke of a “100-year flood” that required “extensive recovery construction and
replacement of building furnishings and other costs related to restoration.” Other schools reported
upgrades and maintenance due to the age of buildings, noting that these costs will continue.
Steps for Reducing Costs
In addition to providing explanations for why certain costs have risen at their schools, institutions were
also required to list steps for reducing those costs. For 64 percent of responses to both CATEF surveys,
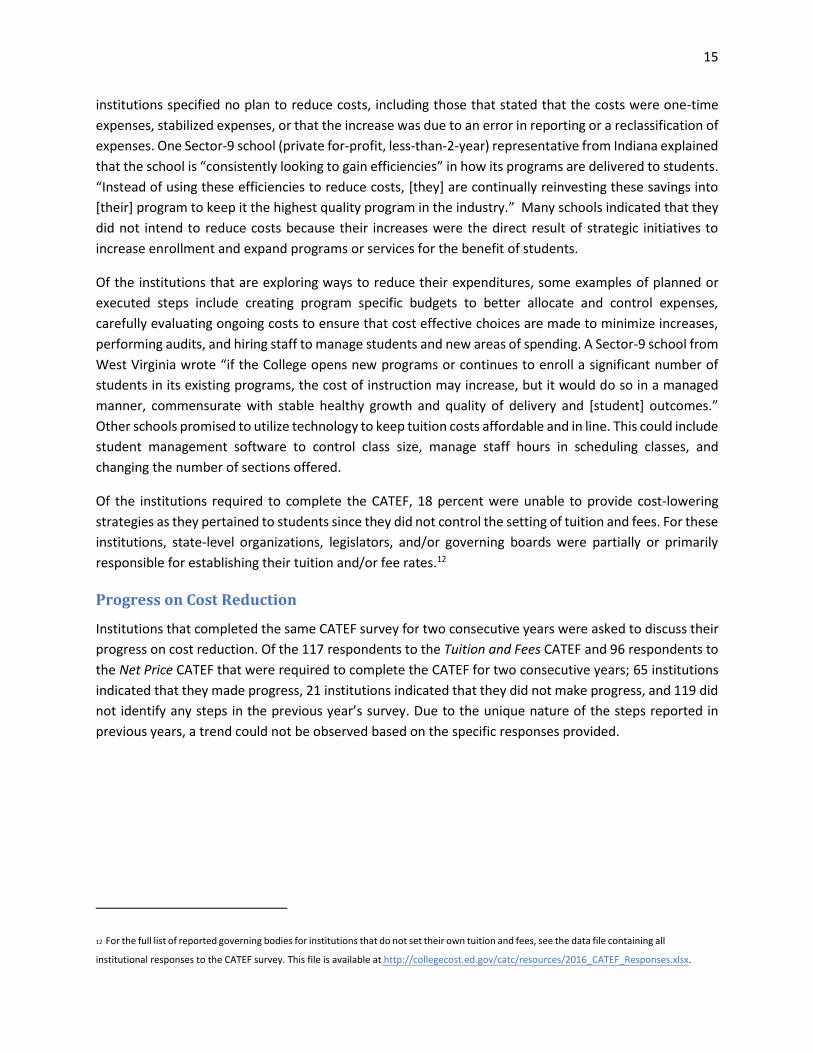
15
institutions specified no plan to reduce costs, including those that stated that the costs were one-time
expenses, stabilized expenses, or that the increase was due to an error in reporting or a reclassification of
expenses. One Sector-9 school (private for-profit, less-than-2-year) representative from Indiana explained
that the school is “consistently looking to gain efficiencies” in how its programs are delivered to students.
“Instead of using these efficiencies to reduce costs, [they] are continually reinvesting these savings into
[their] program to keep it the highest quality program in the industry.” Many schools indicated that they
did not intend to reduce costs because their increases were the direct result of strategic initiatives to
increase enrollment and expand programs or services for the benefit of students.
Of the institutions that are exploring ways to reduce their expenditures, some examples of planned or
executed steps include creating program specific budgets to better allocate and control expenses,
carefully evaluating ongoing costs to ensure that cost effective choices are made to minimize increases,
performing audits, and hiring staff to manage students and new areas of spending. A Sector-9 school from
West Virginia wrote “if the College opens new programs or continues to enroll a significant number of
students in its existing programs, the cost of instruction may increase, but it would do so in a managed
manner, commensurate with stable healthy growth and quality of delivery and [student] outcomes.”
Other schools promised to utilize technology to keep tuition costs affordable and in line. This could include
student management software to control class size, manage staff hours in scheduling classes, and
changing the number of sections offered.
Of the institutions required to complete the CATEF, 18 percent were unable to provide cost-lowering
strategies as they pertained to students since they did not control the setting of tuition and fees. For these
institutions, state-level organizations, legislators, and/or governing boards were partially or primarily
responsible for establishing their tuition and/or fee rates.12
Progress on Cost Reduction
Institutions that completed the same CATEF survey for two consecutive years were asked to discuss their
progress on cost reduction. Of the 117 respondents to the Tuition and Fees CATEF and 96 respondents to
the Net Price CATEF that were required to complete the CATEF for two consecutive years; 65 institutions
indicated that they made progress, 21 institutions indicated that they did not make progress, and 119 did
not identify any steps in the previous year’s survey. Due to the unique nature of the steps reported in
previous years, a trend could not be observed based on the specific responses provided.
12 For the full list of reported governing bodies for institutions that do not set their own tuition and fees, see the data file containing all
institutional responses to the CATEF survey. This file is available at http://collegecost.ed.gov/catc/resources/2016_CATEF_Responses.xlsx.

16
Conclusion
Beginning in 2012, Section 132 of the Higher Education Act of 1965, as amended (HEA), requires schools
with the highest increases in tuition and fees and/or net price (cost of attendance after grant and
scholarship aid) to explain to the secretary of education why their costs have gone up and how they will
address these rising costs. In response to this, the first CATEF survey and summary report were released
in 2012. While the first year of the survey differed slightly, subsequent years asked institutions to provide
(1) an explanation for the areas in the institution’s budget with the highest percentage increase in costs;
(2) a description of any steps they have taken (or intended to take) toward reducing costs or the reason
for not reducing costs; and (3) whether student charges are within the exclusive control of the institution.
Figure 8: Number of institutions that responded to the CATEF, by list and year
SOURCE: U.S. Department of Education, Office of Postsecondary Education, 2012-2016 College Affordability and Transparency Explanation Form (CATEF)
For each year of the CATEF survey, the same cost areas were identified as having the highest increases
over each corresponding three-year period. These cost areas were (1) academic support, student services,
and institutional support; (2) instruction; and (3) other expenses. Despite the fact that the group of
institutions required to complete the CATEF survey varied year to year, there were observable trends in
the reasons provided for the increase in costs. Upon analysis of the 2016 survey responses, it was found
that the explanations closely resembled those provided in prior-year surveys.
In all years of the CATEF survey, the primary reasons for increases were reported to be a direct result of
higher student enrollment. Institutions reported that the increase in enrollment necessitated additional
staff, as well as a greater investment in facilities and student services. Notably, these institutions
overwhelmingly concluded that the increase in costs directly benefitted their students and that they did
not have plans to reduce spending in the identified cost areas for which explanations were provided.
However, most noted that efforts were made to curtail costs in other areas or to limit increases in student
expenses wherever possible.
It is important to note that the initial reason for increases in tuition and fees and net price that relegated
institutions to the college affordability lists and required them to complete the CATEF survey were not
243
276300
250 262244
280 288259 263
41 28 40 30 38
0
50
100
150
200
250
300
350
2012 2013 2014 2015 2016
Nu
mb
er o
f In
stit
uti
on
s
Tuition & Fees
Net Price
Both

17
directly explored in the survey questions. The latest CATEF survey was released in February 2017 and the
related summary report can be expected in the summer of 2018.
18
Appendices
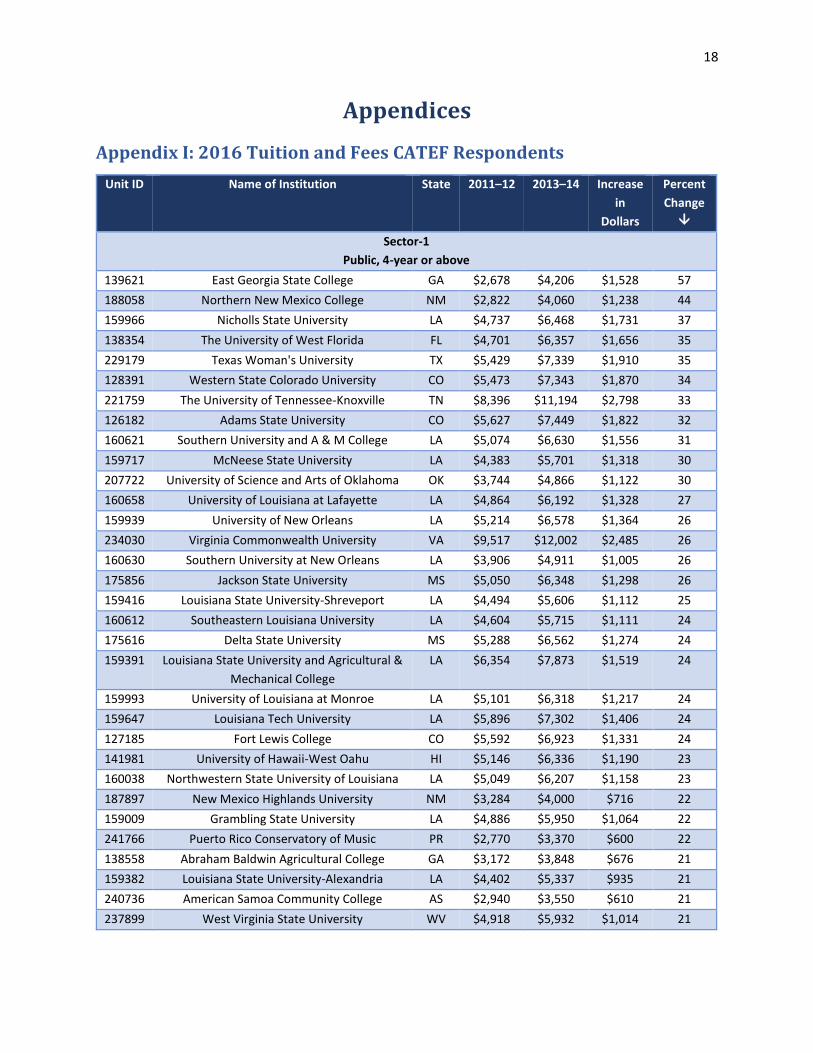
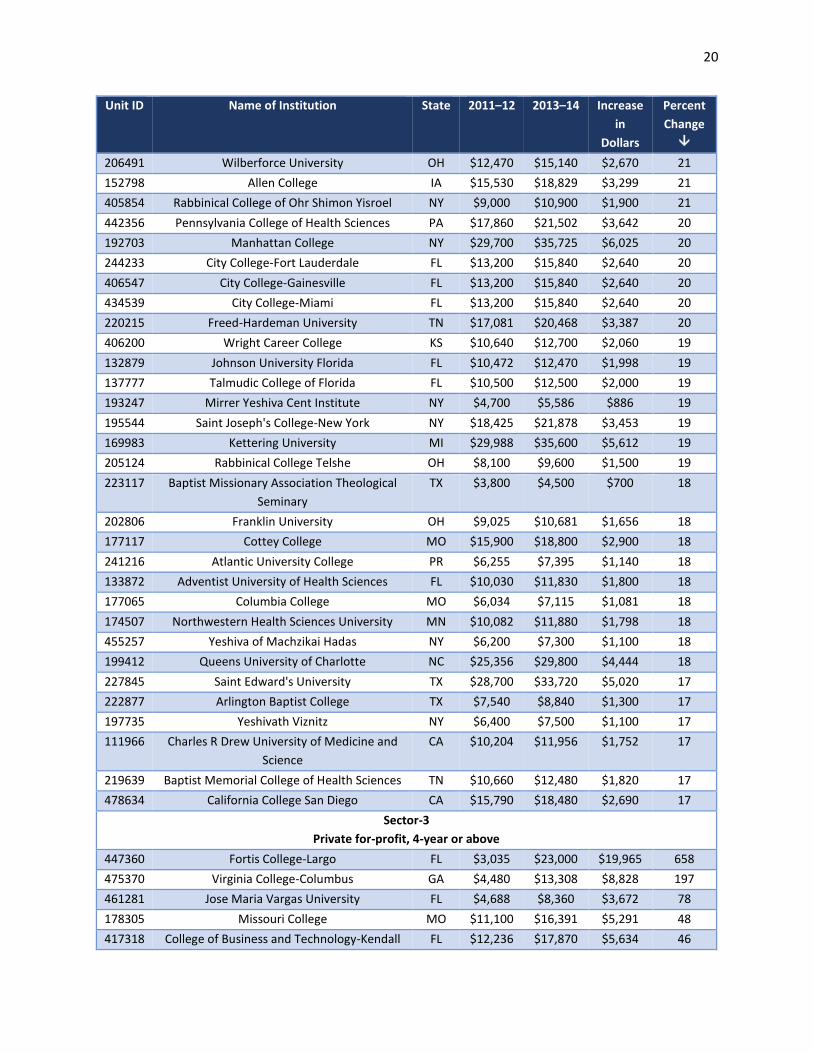
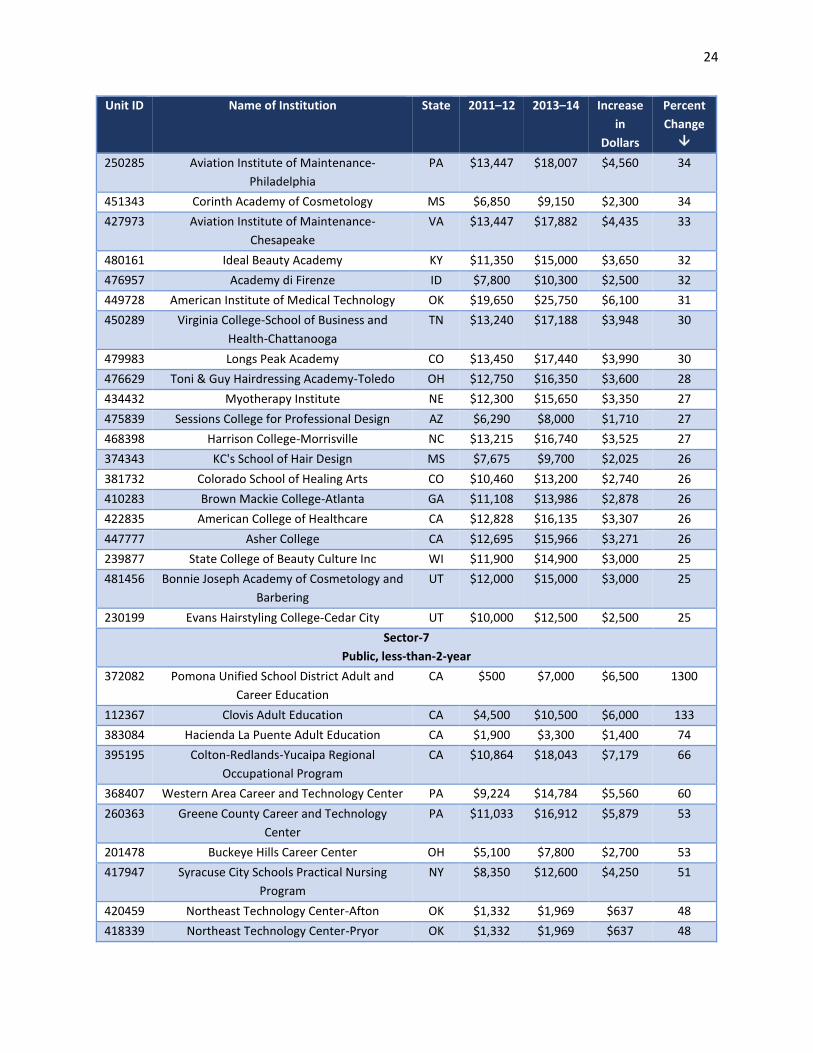
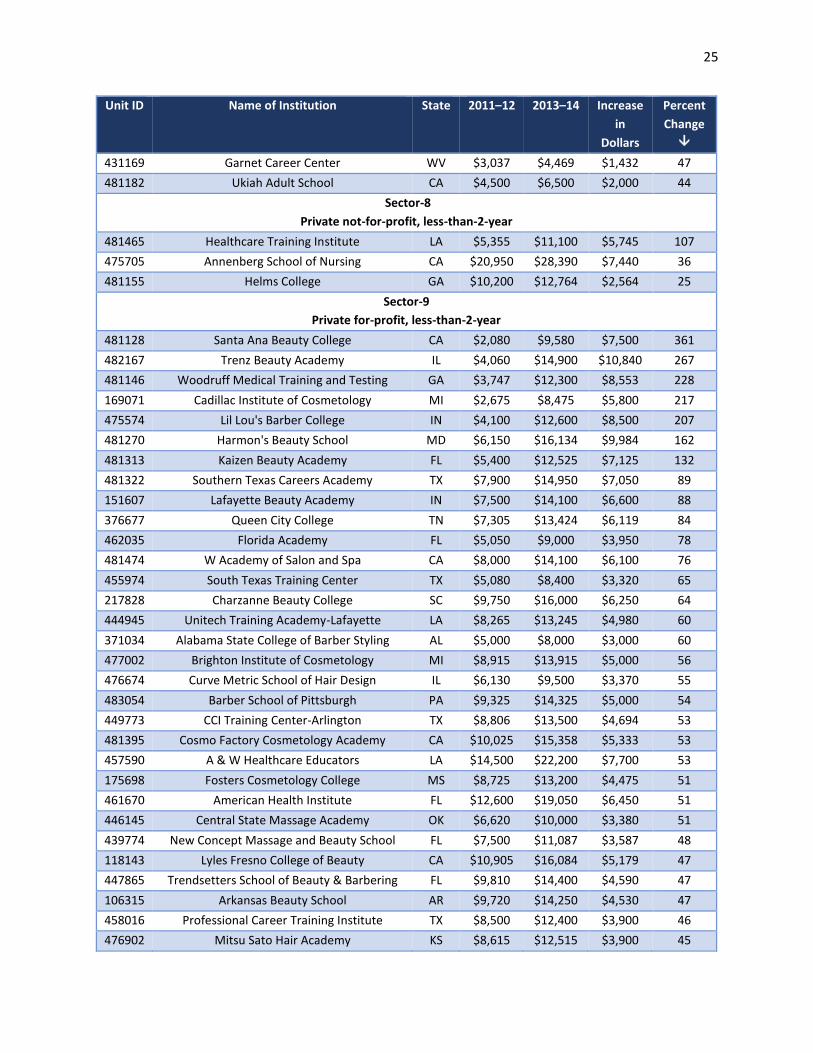
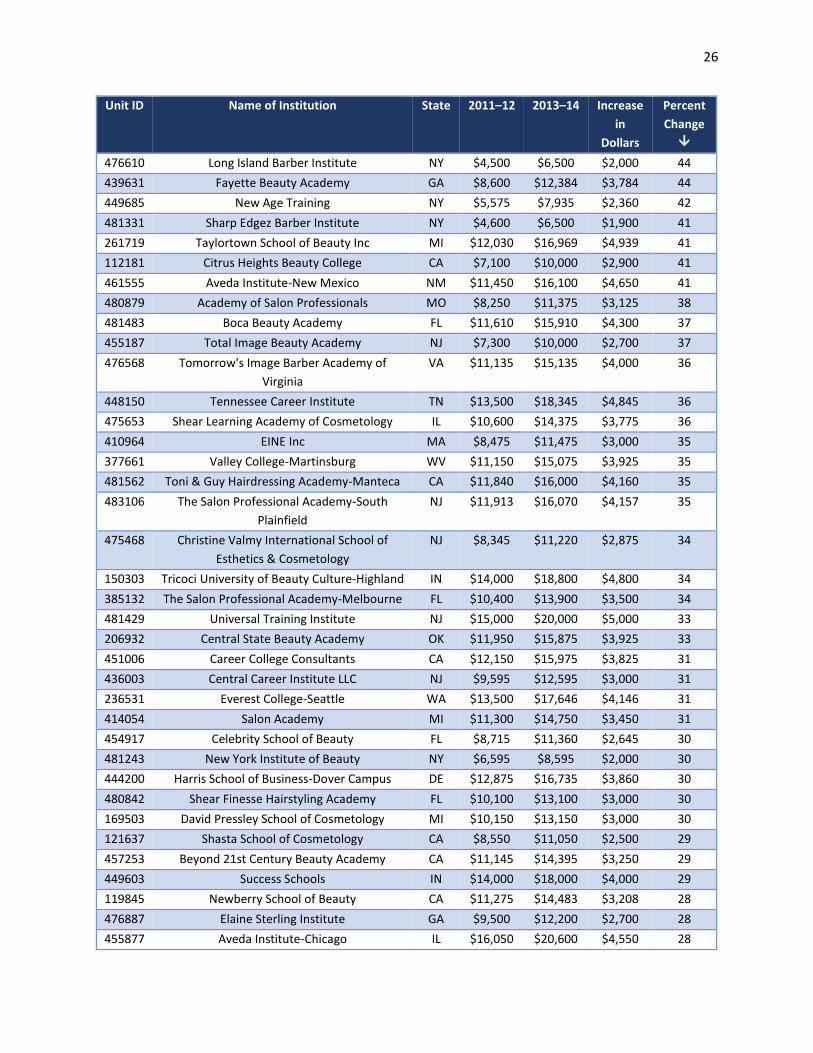
Appendix I: 2016 Tuition and Fees CATEF Respondents
Unit ID Name of Institution State 2011–12 2013–14 Increase
in
Dollars
Percent
Change
Sector-1
Public, 4-year or above
139621 East Georgia State College GA $2,678 $4,206 $1,528 57
188058 Northern New Mexico College NM $2,822 $4,060 $1,238 44
159966 Nicholls State University LA $4,737 $6,468 $1,731 37
138354 The University of West Florida FL $4,701 $6,357 $1,656 35
229179 Texas Woman's University TX $5,429 $7,339 $1,910 35
128391 Western State Colorado University CO $5,473 $7,343 $1,870 34
221759 The University of Tennessee-Knoxville TN $8,396 $11,194 $2,798 33
126182 Adams State University CO $5,627 $7,449 $1,822 32
160621 Southern University and A & M College LA $5,074 $6,630 $1,556 31
159717 McNeese State University LA $4,383 $5,701 $1,318 30
207722 University of Science and Arts of Oklahoma OK $3,744 $4,866 $1,122 30
160658 University of Louisiana at Lafayette LA $4,864 $6,192 $1,328 27
159939 University of New Orleans LA $5,214 $6,578 $1,364 26
234030 Virginia Commonwealth University VA $9,517 $12,002 $2,485 26
160630 Southern University at New Orleans LA $3,906 $4,911 $1,005 26
175856 Jackson State University MS $5,050 $6,348 $1,298 26
159416 Louisiana State University-Shreveport LA $4,494 $5,606 $1,112 25
160612 Southeastern Louisiana University LA $4,604 $5,715 $1,111 24
175616 Delta State University MS $5,288 $6,562 $1,274 24
159391 Louisiana State University and Agricultural &
Mechanical College
LA $6,354 $7,873 $1,519 24
159993 University of Louisiana at Monroe LA $5,101 $6,318 $1,217 24
159647 Louisiana Tech University LA $5,896 $7,302 $1,406 24
127185 Fort Lewis College CO $5,592 $6,923 $1,331 24
141981 University of Hawaii-West Oahu HI $5,146 $6,336 $1,190 23
160038 Northwestern State University of Louisiana LA $5,049 $6,207 $1,158 23
187897 New Mexico Highlands University NM $3,284 $4,000 $716 22
159009 Grambling State University LA $4,886 $5,950 $1,064 22
241766 Puerto Rico Conservatory of Music PR $2,770 $3,370 $600 22
138558 Abraham Baldwin Agricultural College GA $3,172 $3,848 $676 21
159382 Louisiana State University-Alexandria LA $4,402 $5,337 $935 21
240736 American Samoa Community College AS $2,940 $3,550 $610 21
237899 West Virginia State University WV $4,918 $5,932 $1,014 21

19
Unit ID Name of Institution State 2011–12 2013–14 Increase
in
Dollars
Percent
Change
Sector-2
Private not-for profit, 4-year or above
461485 Shepherds Theological Seminary NC $4,250 $7,170 $2,920 69
465812 Independence University UT $9,656 $15,728 $6,072 63
164872 Boston Architectural College MA $16,826 $27,312 $10,486 62
237905 West Virginia University Hospital
Departments of Rad Tech and Nutrition
WV $4,000 $6,000 $2,000 50
197018 United Talmudical Seminary NY $9,000 $13,200 $4,200 47
457226 Horizon University CA $6,340 $9,250 $2,910 46
461528 Grace College of Divinity NC $2,450 $3,520 $1,070 44
448284 Doane College-Lincoln Grand Island and
Master
NE $6,568 $9,065 $2,497 38
438151 Stevens-Henager College-Murray UT $15,790 $21,600 $5,810 37
440651 Atenas College PR $5,117 $6,945 $1,828 36
200554 United Tribes Technical College ND $3,840 $5,210 $1,370 36
130448 St Vincent's College CT $14,531 $19,650 $5,119 35
110060 Bethesda University of California CA $5,664 $7,620 $1,956 35
194116 New York School of Interior Design NY $19,774 $26,540 $6,766 34
203757 Lourdes University OH $13,176 $17,655 $4,479 34
147129 Methodist College IL $12,780 $17,030 $4,250 33
458113 Bethel College VA $6,075 $8,050 $1,975 33
201821 The Christ College of Nursing and Health
Sciences
OH $14,305 $18,883 $4,578 32
481058 Grace Mission University CA $2,065 $2,690 $625 30
167677 Saint John's Seminary MA $13,750 $17,750 $4,000 29
102580 Alaska Bible College AK $7,130 $9,200 $2,070 29
231651 Regent University VA $12,340 $15,838 $3,498 28
192165 Kehilath Yakov Rabbinical Seminary NY $6,900 $8,600 $1,700 25
199643 Shaw University NC $13,226 $16,480 $3,254 25
414878 Trine University-Regional/Non-Traditional
Campuses
IN $7,920 $9,840 $1,920 24
137272 Saint John Vianney College Seminary FL $17,000 $21,100 $4,100 24
367839 Colorado Heights University CO $4,556 $5,634 $1,078 24
446604 Uta Mesivta of Kiryas Joel NY $7,300 $9,000 $1,700 23
165264 Laboure College MA $26,855 $32,833 $5,978 22
123952 Southern California Institute of Architecture CA $30,600 $37,300 $6,700 22
158477 Centenary College of Louisiana LA $25,290 $30,740 $5,450 22
141644 Hawaii Pacific University HI $16,610 $20,180 $3,570 21
235769 Trinity Lutheran College WA $22,260 $27,042 $4,782 21
480754 Manthano Christian College MI $4,200 $5,100 $900 21
20
Unit ID Name of Institution State 2011–12 2013–14 Increase
in
Dollars
Percent
Change
206491 Wilberforce University OH $12,470 $15,140 $2,670 21
152798 Allen College IA $15,530 $18,829 $3,299 21
405854 Rabbinical College of Ohr Shimon Yisroel NY $9,000 $10,900 $1,900 21
442356 Pennsylvania College of Health Sciences PA $17,860 $21,502 $3,642 20
192703 Manhattan College NY $29,700 $35,725 $6,025 20
244233 City College-Fort Lauderdale FL $13,200 $15,840 $2,640 20
406547 City College-Gainesville FL $13,200 $15,840 $2,640 20
434539 City College-Miami FL $13,200 $15,840 $2,640 20
220215 Freed-Hardeman University TN $17,081 $20,468 $3,387 20
406200 Wright Career College KS $10,640 $12,700 $2,060 19
132879 Johnson University Florida FL $10,472 $12,470 $1,998 19
137777 Talmudic College of Florida FL $10,500 $12,500 $2,000 19
193247 Mirrer Yeshiva Cent Institute NY $4,700 $5,586 $886 19
195544 Saint Joseph's College-New York NY $18,425 $21,878 $3,453 19
169983 Kettering University MI $29,988 $35,600 $5,612 19
205124 Rabbinical College Telshe OH $8,100 $9,600 $1,500 19
223117 Baptist Missionary Association Theological
Seminary
TX $3,800 $4,500 $700 18
202806 Franklin University OH $9,025 $10,681 $1,656 18
177117 Cottey College MO $15,900 $18,800 $2,900 18
241216 Atlantic University College PR $6,255 $7,395 $1,140 18
133872 Adventist University of Health Sciences FL $10,030 $11,830 $1,800 18
177065 Columbia College MO $6,034 $7,115 $1,081 18
174507 Northwestern Health Sciences University MN $10,082 $11,880 $1,798 18
455257 Yeshiva of Machzikai Hadas NY $6,200 $7,300 $1,100 18
199412 Queens University of Charlotte NC $25,356 $29,800 $4,444 18
227845 Saint Edward's University TX $28,700 $33,720 $5,020 17
222877 Arlington Baptist College TX $7,540 $8,840 $1,300 17
197735 Yeshivath Viznitz NY $6,400 $7,500 $1,100 17
111966 Charles R Drew University of Medicine and
Science
CA $10,204 $11,956 $1,752 17
219639 Baptist Memorial College of Health Sciences TN $10,660 $12,480 $1,820 17
478634 California College San Diego CA $15,790 $18,480 $2,690 17
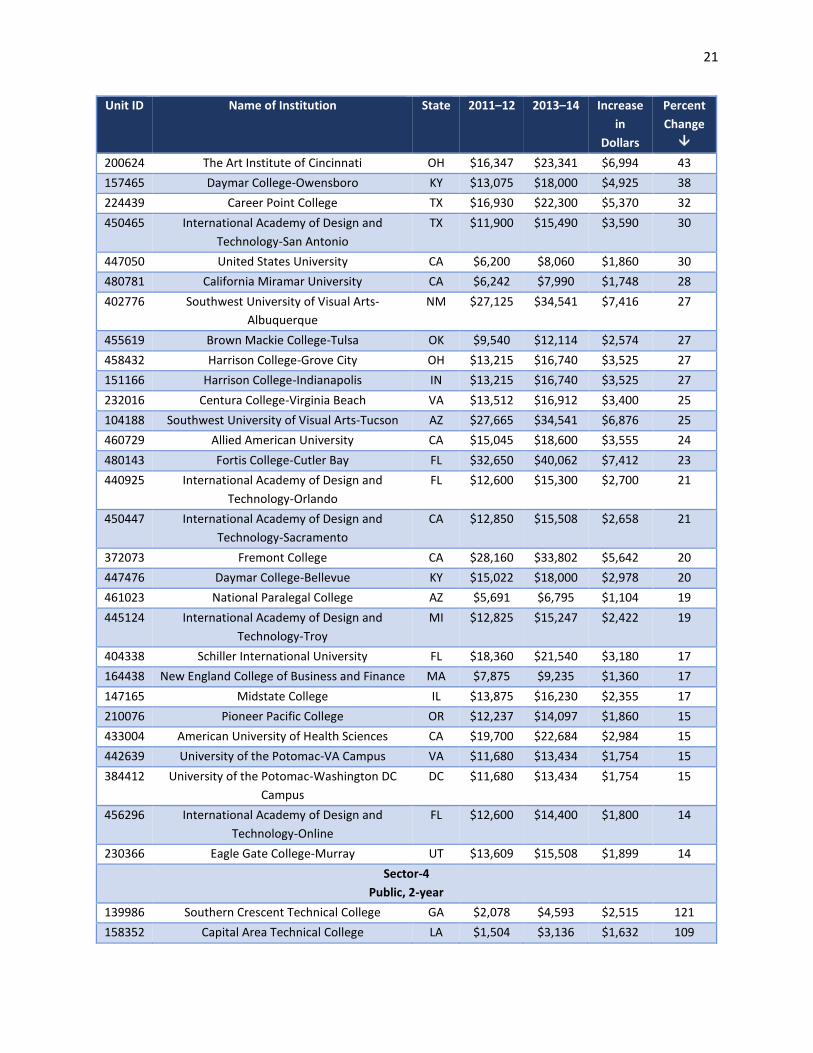
Sector-3
Private for-profit, 4-year or above
447360 Fortis College-Largo FL $3,035 $23,000 $19,965 658
475370 Virginia College-Columbus GA $4,480 $13,308 $8,828 197
461281 Jose Maria Vargas University FL $4,688 $8,360 $3,672 78
178305 Missouri College MO $11,100 $16,391 $5,291 48
417318 College of Business and Technology-Kendall FL $12,236 $17,870 $5,634 46
21
Unit ID Name of Institution State 2011–12 2013–14 Increase
in
Dollars
Percent
Change
200624 The Art Institute of Cincinnati OH $16,347 $23,341 $6,994 43
157465 Daymar College-Owensboro KY $13,075 $18,000 $4,925 38
224439 Career Point College TX $16,930 $22,300 $5,370 32
450465 International Academy of Design and
Technology-San Antonio
TX $11,900 $15,490 $3,590 30
447050 United States University CA $6,200 $8,060 $1,860 30
480781 California Miramar University CA $6,242 $7,990 $1,748 28
402776 Southwest University of Visual Arts-
Albuquerque
NM $27,125 $34,541 $7,416 27
455619 Brown Mackie College-Tulsa OK $9,540 $12,114 $2,574 27
458432 Harrison College-Grove City OH $13,215 $16,740 $3,525 27
151166 Harrison College-Indianapolis IN $13,215 $16,740 $3,525 27
232016 Centura College-Virginia Beach VA $13,512 $16,912 $3,400 25
104188 Southwest University of Visual Arts-Tucson AZ $27,665 $34,541 $6,876 25
460729 Allied American University CA $15,045 $18,600 $3,555 24
480143 Fortis College-Cutler Bay FL $32,650 $40,062 $7,412 23
440925 International Academy of Design and
Technology-Orlando
FL $12,600 $15,300 $2,700 21
450447 International Academy of Design and
Technology-Sacramento
CA $12,850 $15,508 $2,658 21
372073 Fremont College CA $28,160 $33,802 $5,642 20
447476 Daymar College-Bellevue KY $15,022 $18,000 $2,978 20
461023 National Paralegal College AZ $5,691 $6,795 $1,104 19
445124 International Academy of Design and
Technology-Troy
MI $12,825 $15,247 $2,422 19
404338 Schiller International University FL $18,360 $21,540 $3,180 17
164438 New England College of Business and Finance MA $7,875 $9,235 $1,360 17
147165 Midstate College IL $13,875 $16,230 $2,355 17
210076 Pioneer Pacific College OR $12,237 $14,097 $1,860 15
433004 American University of Health Sciences CA $19,700 $22,684 $2,984 15
442639 University of the Potomac-VA Campus VA $11,680 $13,434 $1,754 15
384412 University of the Potomac-Washington DC
Campus
DC $11,680 $13,434 $1,754 15
456296 International Academy of Design and
Technology-Online
FL $12,600 $14,400 $1,800 14
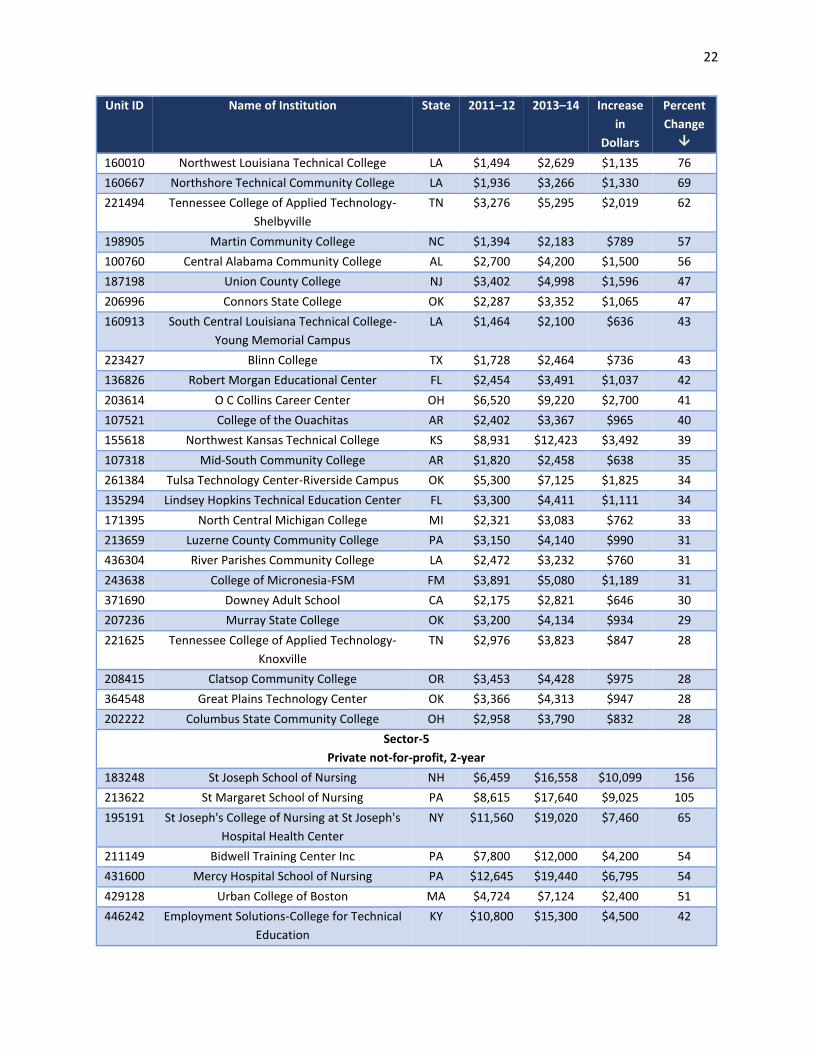
230366 Eagle Gate College-Murray UT $13,609 $15,508 $1,899 14
Sector-4
Public, 2-year
139986 Southern Crescent Technical College GA $2,078 $4,593 $2,515 121
158352 Capital Area Technical College LA $1,504 $3,136 $1,632 109
22
Unit ID Name of Institution State 2011–12 2013–14 Increase
in
Dollars
Percent
Change
160010 Northwest Louisiana Technical College LA $1,494 $2,629 $1,135 76
160667 Northshore Technical Community College LA $1,936 $3,266 $1,330 69
221494 Tennessee College of Applied Technology-
Shelbyville
TN $3,276 $5,295 $2,019 62
198905 Martin Community College NC $1,394 $2,183 $789 57
100760 Central Alabama Community College AL $2,700 $4,200 $1,500 56
187198 Union County College NJ $3,402 $4,998 $1,596 47
206996 Connors State College OK $2,287 $3,352 $1,065 47
160913 South Central Louisiana Technical College-
Young Memorial Campus
LA $1,464 $2,100 $636 43
223427 Blinn College TX $1,728 $2,464 $736 43
136826 Robert Morgan Educational Center FL $2,454 $3,491 $1,037 42
203614 O C Collins Career Center OH $6,520 $9,220 $2,700 41
107521 College of the Ouachitas AR $2,402 $3,367 $965 40
155618 Northwest Kansas Technical College KS $8,931 $12,423 $3,492 39
107318 Mid-South Community College AR $1,820 $2,458 $638 35
261384 Tulsa Technology Center-Riverside Campus OK $5,300 $7,125 $1,825 34
135294 Lindsey Hopkins Technical Education Center FL $3,300 $4,411 $1,111 34
171395 North Central Michigan College MI $2,321 $3,083 $762 33
213659 Luzerne County Community College PA $3,150 $4,140 $990 31
436304 River Parishes Community College LA $2,472 $3,232 $760 31
243638 College of Micronesia-FSM FM $3,891 $5,080 $1,189 31
371690 Downey Adult School CA $2,175 $2,821 $646 30
207236 Murray State College OK $3,200 $4,134 $934 29
221625 Tennessee College of Applied Technology-
Knoxville
TN $2,976 $3,823 $847 28
208415 Clatsop Community College OR $3,453 $4,428 $975 28
364548 Great Plains Technology Center OK $3,366 $4,313 $947 28
202222 Columbus State Community College OH $2,958 $3,790 $832 28
Sector-5
Private not-for-profit, 2-year
183248 St Joseph School of Nursing NH $6,459 $16,558 $10,099 156
213622 St Margaret School of Nursing PA $8,615 $17,640 $9,025 105
195191 St Joseph's College of Nursing at St Joseph's
Hospital Health Center
NY $11,560 $19,020 $7,460 65
211149 Bidwell Training Center Inc PA $7,800 $12,000 $4,200 54
431600 Mercy Hospital School of Nursing PA $12,645 $19,440 $6,795 54
429128 Urban College of Boston MA $4,724 $7,124 $2,400 51
446242 Employment Solutions-College for Technical
Education
KY $10,800 $15,300 $4,500 42
23
Unit ID Name of Institution State 2011–12 2013–14 Increase
in
Dollars
Percent
Change
183248 St Joseph School of Nursing NH $6,459 $16,558 $10,099 156
213622 St Margaret School of Nursing PA $8,615 $17,640 $9,025 105
195191 St Joseph's College of Nursing at St Joseph's
Hospital Health Center
NY $11,560 $19,020 $7,460 65
211149 Bidwell Training Center Inc PA $7,800 $12,000 $4,200 54
431600 Mercy Hospital School of Nursing PA $12,645 $19,440 $6,795 54
429128 Urban College of Boston MA $4,724 $7,124 $2,400 51
446242 Employment Solutions-College for Technical
Education
KY $10,800 $15,300 $4,500 42
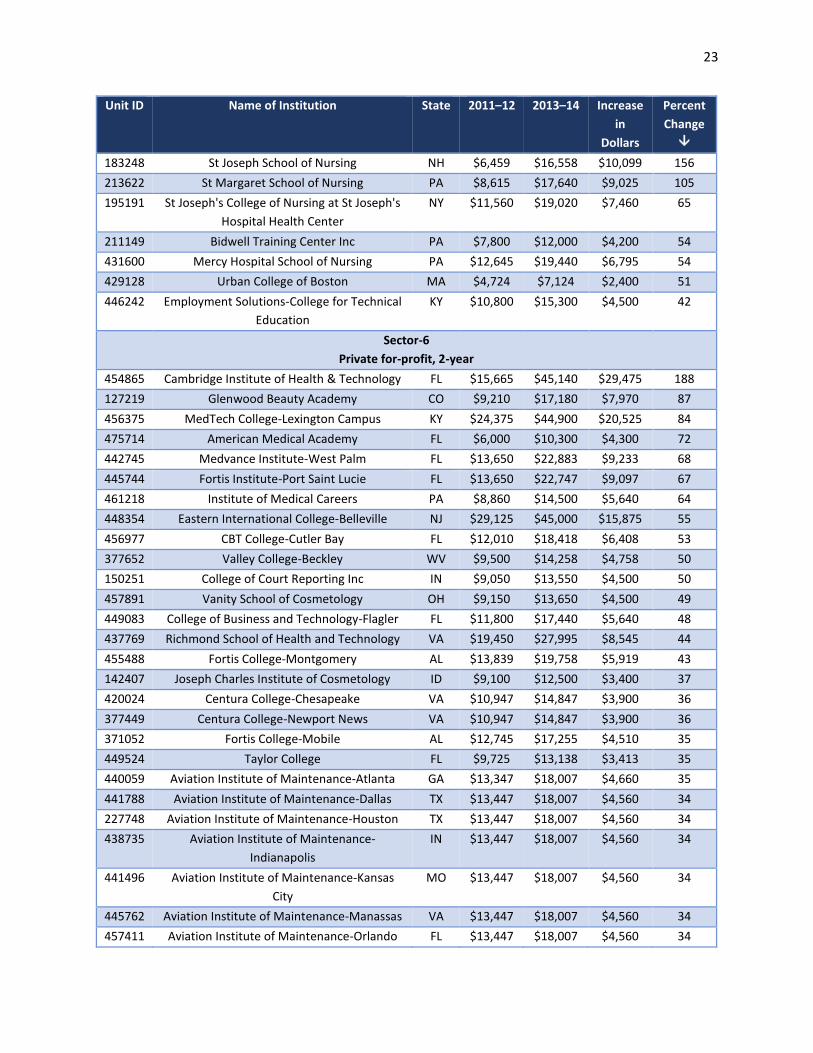
Sector-6
Private for-profit, 2-year
454865 Cambridge Institute of Health & Technology FL $15,665 $45,140 $29,475 188
127219 Glenwood Beauty Academy CO $9,210 $17,180 $7,970 87
456375 MedTech College-Lexington Campus KY $24,375 $44,900 $20,525 84
475714 American Medical Academy FL $6,000 $10,300 $4,300 72
442745 Medvance Institute-West Palm FL $13,650 $22,883 $9,233 68
445744 Fortis Institute-Port Saint Lucie FL $13,650 $22,747 $9,097 67
461218 Institute of Medical Careers PA $8,860 $14,500 $5,640 64
448354 Eastern International College-Belleville NJ $29,125 $45,000 $15,875 55
456977 CBT College-Cutler Bay FL $12,010 $18,418 $6,408 53
377652 Valley College-Beckley WV $9,500 $14,258 $4,758 50
150251 College of Court Reporting Inc IN $9,050 $13,550 $4,500 50
457891 Vanity School of Cosmetology OH $9,150 $13,650 $4,500 49
449083 College of Business and Technology-Flagler FL $11,800 $17,440 $5,640 48
437769 Richmond School of Health and Technology VA $19,450 $27,995 $8,545 44
455488 Fortis College-Montgomery AL $13,839 $19,758 $5,919 43
142407 Joseph Charles Institute of Cosmetology ID $9,100 $12,500 $3,400 37
420024 Centura College-Chesapeake VA $10,947 $14,847 $3,900 36
377449 Centura College-Newport News VA $10,947 $14,847 $3,900 36
371052 Fortis College-Mobile AL $12,745 $17,255 $4,510 35
449524 Taylor College FL $9,725 $13,138 $3,413 35
440059 Aviation Institute of Maintenance-Atlanta GA $13,347 $18,007 $4,660 35
441788 Aviation Institute of Maintenance-Dallas TX $13,447 $18,007 $4,560 34
227748 Aviation Institute of Maintenance-Houston TX $13,447 $18,007 $4,560 34
438735 Aviation Institute of Maintenance-
Indianapolis
IN $13,447 $18,007 $4,560 34
441496 Aviation Institute of Maintenance-Kansas
City
MO $13,447 $18,007 $4,560 34
445762 Aviation Institute of Maintenance-Manassas VA $13,447 $18,007 $4,560 34
457411 Aviation Institute of Maintenance-Orlando FL $13,447 $18,007 $4,560 34
24
Unit ID Name of Institution State 2011–12 2013–14 Increase
in
Dollars
Percent
Change
250285 Aviation Institute of Maintenance-
Philadelphia
PA $13,447 $18,007 $4,560 34
451343 Corinth Academy of Cosmetology MS $6,850 $9,150 $2,300 34
427973 Aviation Institute of Maintenance-
Chesapeake
VA $13,447 $17,882 $4,435 33
480161 Ideal Beauty Academy KY $11,350 $15,000 $3,650 32
476957 Academy di Firenze ID $7,800 $10,300 $2,500 32
449728 American Institute of Medical Technology OK $19,650 $25,750 $6,100 31
450289 Virginia College-School of Business and
Health-Chattanooga
TN $13,240 $17,188 $3,948 30
479983 Longs Peak Academy CO $13,450 $17,440 $3,990 30
476629 Toni & Guy Hairdressing Academy-Toledo OH $12,750 $16,350 $3,600 28
434432 Myotherapy Institute NE $12,300 $15,650 $3,350 27
475839 Sessions College for Professional Design AZ $6,290 $8,000 $1,710 27
468398 Harrison College-Morrisville NC $13,215 $16,740 $3,525 27
374343 KC's School of Hair Design MS $7,675 $9,700 $2,025 26
381732 Colorado School of Healing Arts CO $10,460 $13,200 $2,740 26
410283 Brown Mackie College-Atlanta GA $11,108 $13,986 $2,878 26
422835 American College of Healthcare CA $12,828 $16,135 $3,307 26
447777 Asher College CA $12,695 $15,966 $3,271 26
239877 State College of Beauty Culture Inc WI $11,900 $14,900 $3,000 25
481456 Bonnie Joseph Academy of Cosmetology and
Barbering
UT $12,000 $15,000 $3,000 25
230199 Evans Hairstyling College-Cedar City UT $10,000 $12,500 $2,500 25
Sector-7
Public, less-than-2-year
372082 Pomona Unified School District Adult and
Career Education
CA $500 $7,000 $6,500 1300
112367 Clovis Adult Education CA $4,500 $10,500 $6,000 133
383084 Hacienda La Puente Adult Education CA $1,900 $3,300 $1,400 74
395195 Colton-Redlands-Yucaipa Regional
Occupational Program
CA $10,864 $18,043 $7,179 66
368407 Western Area Career and Technology Center PA $9,224 $14,784 $5,560 60
260363 Greene County Career and Technology
Center
PA $11,033 $16,912 $5,879 53
201478 Buckeye Hills Career Center OH $5,100 $7,800 $2,700 53
417947 Syracuse City Schools Practical Nursing
Program
NY $8,350 $12,600 $4,250 51
420459 Northeast Technology Center-Afton OK $1,332 $1,969 $637 48
418339 Northeast Technology Center-Pryor OK $1,332 $1,969 $637 48
25
Unit ID Name of Institution State 2011–12 2013–14 Increase
in
Dollars
Percent
Change
431169 Garnet Career Center WV $3,037 $4,469 $1,432 47
481182 Ukiah Adult School CA $4,500 $6,500 $2,000 44
Sector-8
Private not-for-profit, less-than-2-year
481465 Healthcare Training Institute LA $5,355 $11,100 $5,745 107
475705 Annenberg School of Nursing CA $20,950 $28,390 $7,440 36
481155 Helms College GA $10,200 $12,764 $2,564 25
Sector-9
Private for-profit, less-than-2-year
481128 Santa Ana Beauty College CA $2,080 $9,580 $7,500 361
482167 Trenz Beauty Academy IL $4,060 $14,900 $10,840 267
481146 Woodruff Medical Training and Testing GA $3,747 $12,300 $8,553 228
169071 Cadillac Institute of Cosmetology MI $2,675 $8,475 $5,800 217
475574 Lil Lou's Barber College IN $4,100 $12,600 $8,500 207
481270 Harmon's Beauty School MD $6,150 $16,134 $9,984 162
481313 Kaizen Beauty Academy FL $5,400 $12,525 $7,125 132
481322 Southern Texas Careers Academy TX $7,900 $14,950 $7,050 89
151607 Lafayette Beauty Academy IN $7,500 $14,100 $6,600 88
376677 Queen City College TN $7,305 $13,424 $6,119 84
462035 Florida Academy FL $5,050 $9,000 $3,950 78
481474 W Academy of Salon and Spa CA $8,000 $14,100 $6,100 76
455974 South Texas Training Center TX $5,080 $8,400 $3,320 65
217828 Charzanne Beauty College SC $9,750 $16,000 $6,250 64
444945 Unitech Training Academy-Lafayette LA $8,265 $13,245 $4,980 60
371034 Alabama State College of Barber Styling AL $5,000 $8,000 $3,000 60
477002 Brighton Institute of Cosmetology MI $8,915 $13,915 $5,000 56
476674 Curve Metric School of Hair Design IL $6,130 $9,500 $3,370 55
483054 Barber School of Pittsburgh PA $9,325 $14,325 $5,000 54
449773 CCI Training Center-Arlington TX $8,806 $13,500 $4,694 53
481395 Cosmo Factory Cosmetology Academy CA $10,025 $15,358 $5,333 53
457590 A & W Healthcare Educators LA $14,500 $22,200 $7,700 53
175698 Fosters Cosmetology College MS $8,725 $13,200 $4,475 51
461670 American Health Institute FL $12,600 $19,050 $6,450 51
446145 Central State Massage Academy OK $6,620 $10,000 $3,380 51
439774 New Concept Massage and Beauty School FL $7,500 $11,087 $3,587 48
118143 Lyles Fresno College of Beauty CA $10,905 $16,084 $5,179 47
447865 Trendsetters School of Beauty & Barbering FL $9,810 $14,400 $4,590 47
106315 Arkansas Beauty School AR $9,720 $14,250 $4,530 47
458016 Professional Career Training Institute TX $8,500 $12,400 $3,900 46
476902 Mitsu Sato Hair Academy KS $8,615 $12,515 $3,900 45
26
Unit ID Name of Institution State 2011–12 2013–14 Increase
in
Dollars
Percent
Change
476610 Long Island Barber Institute NY $4,500 $6,500 $2,000 44
439631 Fayette Beauty Academy GA $8,600 $12,384 $3,784 44
449685 New Age Training NY $5,575 $7,935 $2,360 42
481331 Sharp Edgez Barber Institute NY $4,600 $6,500 $1,900 41
261719 Taylortown School of Beauty Inc MI $12,030 $16,969 $4,939 41
112181 Citrus Heights Beauty College CA $7,100 $10,000 $2,900 41
461555 Aveda Institute-New Mexico NM $11,450 $16,100 $4,650 41
480879 Academy of Salon Professionals MO $8,250 $11,375 $3,125 38
481483 Boca Beauty Academy FL $11,610 $15,910 $4,300 37
455187 Total Image Beauty Academy NJ $7,300 $10,000 $2,700 37
476568 Tomorrow's Image Barber Academy of
Virginia
VA $11,135 $15,135 $4,000 36
448150 Tennessee Career Institute TN $13,500 $18,345 $4,845 36
475653 Shear Learning Academy of Cosmetology IL $10,600 $14,375 $3,775 36
410964 EINE Inc MA $8,475 $11,475 $3,000 35
377661 Valley College-Martinsburg WV $11,150 $15,075 $3,925 35
481562 Toni & Guy Hairdressing Academy-Manteca CA $11,840 $16,000 $4,160 35
483106 The Salon Professional Academy-South
Plainfield
NJ $11,913 $16,070 $4,157 35
475468 Christine Valmy International School of
Esthetics & Cosmetology
NJ $8,345 $11,220 $2,875 34
150303 Tricoci University of Beauty Culture-Highland IN $14,000 $18,800 $4,800 34
385132 The Salon Professional Academy-Melbourne FL $10,400 $13,900 $3,500 34
481429 Universal Training Institute NJ $15,000 $20,000 $5,000 33
206932 Central State Beauty Academy OK $11,950 $15,875 $3,925 33
451006 Career College Consultants CA $12,150 $15,975 $3,825 31
436003 Central Career Institute LLC NJ $9,595 $12,595 $3,000 31
236531 Everest College-Seattle WA $13,500 $17,646 $4,146 31
414054 Salon Academy MI $11,300 $14,750 $3,450 31
454917 Celebrity School of Beauty FL $8,715 $11,360 $2,645 30
481243 New York Institute of Beauty NY $6,595 $8,595 $2,000 30
444200 Harris School of Business-Dover Campus DE $12,875 $16,735 $3,860 30
480842 Shear Finesse Hairstyling Academy FL $10,100 $13,100 $3,000 30
169503 David Pressley School of Cosmetology MI $10,150 $13,150 $3,000 30
121637 Shasta School of Cosmetology CA $8,550 $11,050 $2,500 29
457253 Beyond 21st Century Beauty Academy CA $11,145 $14,395 $3,250 29
449603 Success Schools IN $14,000 $18,000 $4,000 29
119845 Newberry School of Beauty CA $11,275 $14,483 $3,208 28
476887 Elaine Sterling Institute GA $9,500 $12,200 $2,700 28
455877 Aveda Institute-Chicago IL $16,050 $20,600 $4,550 28

27
Unit ID Name of Institution State 2011–12 2013–14 Increase
in
Dollars
Percent
Change
261436 Douglas J Aveda Institute MI $16,050 $20,600 $4,550 28
460561 Park Avenue School of Cosmetology MN $10,600 $13,498 $2,898 27
221829 Tennessee School of Beauty of Knoxville Inc TN $10,995 $13,995 $3,000 27
215530 The Salon Professional Academy-Altoona PA $9,400 $11,925 $2,525 27
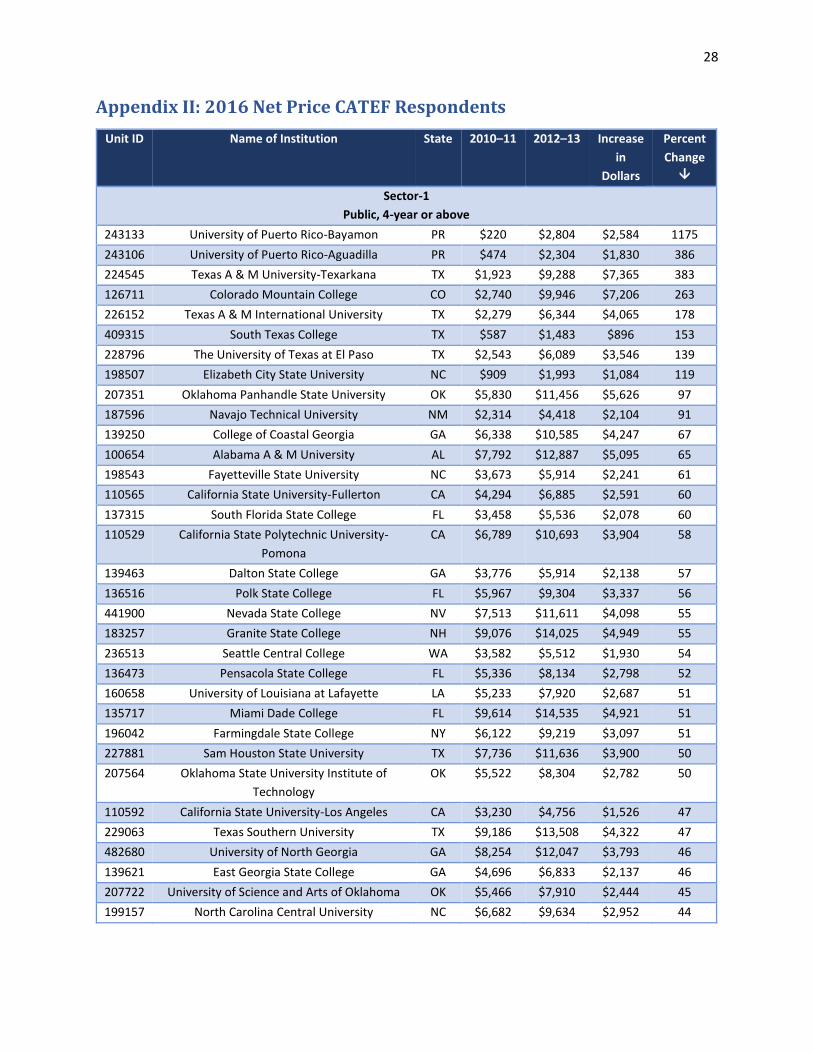
28
Appendix II: 2016 Net Price CATEF Respondents
Unit ID Name of Institution State 2010–11 2012–13 Increase
in
Dollars
Percent
Change
Sector-1
Public, 4-year or above
243133 University of Puerto Rico-Bayamon PR $220 $2,804 $2,584 1175
243106 University of Puerto Rico-Aguadilla PR $474 $2,304 $1,830 386
224545 Texas A & M University-Texarkana TX $1,923 $9,288 $7,365 383
126711 Colorado Mountain College CO $2,740 $9,946 $7,206 263
226152 Texas A & M International University TX $2,279 $6,344 $4,065 178
409315 South Texas College TX $587 $1,483 $896 153
228796 The University of Texas at El Paso TX $2,543 $6,089 $3,546 139
198507 Elizabeth City State University NC $909 $1,993 $1,084 119
207351 Oklahoma Panhandle State University OK $5,830 $11,456 $5,626 97
187596 Navajo Technical University NM $2,314 $4,418 $2,104 91
139250 College of Coastal Georgia GA $6,338 $10,585 $4,247 67
100654 Alabama A & M University AL $7,792 $12,887 $5,095 65
198543 Fayetteville State University NC $3,673 $5,914 $2,241 61
110565 California State University-Fullerton CA $4,294 $6,885 $2,591 60
137315 South Florida State College FL $3,458 $5,536 $2,078 60
110529 California State Polytechnic University-
Pomona
CA $6,789 $10,693 $3,904 58
139463 Dalton State College GA $3,776 $5,914 $2,138 57
136516 Polk State College FL $5,967 $9,304 $3,337 56
441900 Nevada State College NV $7,513 $11,611 $4,098 55
183257 Granite State College NH $9,076 $14,025 $4,949 55
236513 Seattle Central College WA $3,582 $5,512 $1,930 54
136473 Pensacola State College FL $5,336 $8,134 $2,798 52
160658 University of Louisiana at Lafayette LA $5,233 $7,920 $2,687 51
135717 Miami Dade College FL $9,614 $14,535 $4,921 51
196042 Farmingdale State College NY $6,122 $9,219 $3,097 51
227881 Sam Houston State University TX $7,736 $11,636 $3,900 50
207564 Oklahoma State University Institute of
Technology
OK $5,522 $8,304 $2,782 50
110592 California State University-Los Angeles CA $3,230 $4,756 $1,526 47
229063 Texas Southern University TX $9,186 $13,508 $4,322 47
482680 University of North Georgia GA $8,254 $12,047 $3,793 46
139621 East Georgia State College GA $4,696 $6,833 $2,137 46
207722 University of Science and Arts of Oklahoma OK $5,466 $7,910 $2,444 45
199157 North Carolina Central University NC $6,682 $9,634 $2,952 44
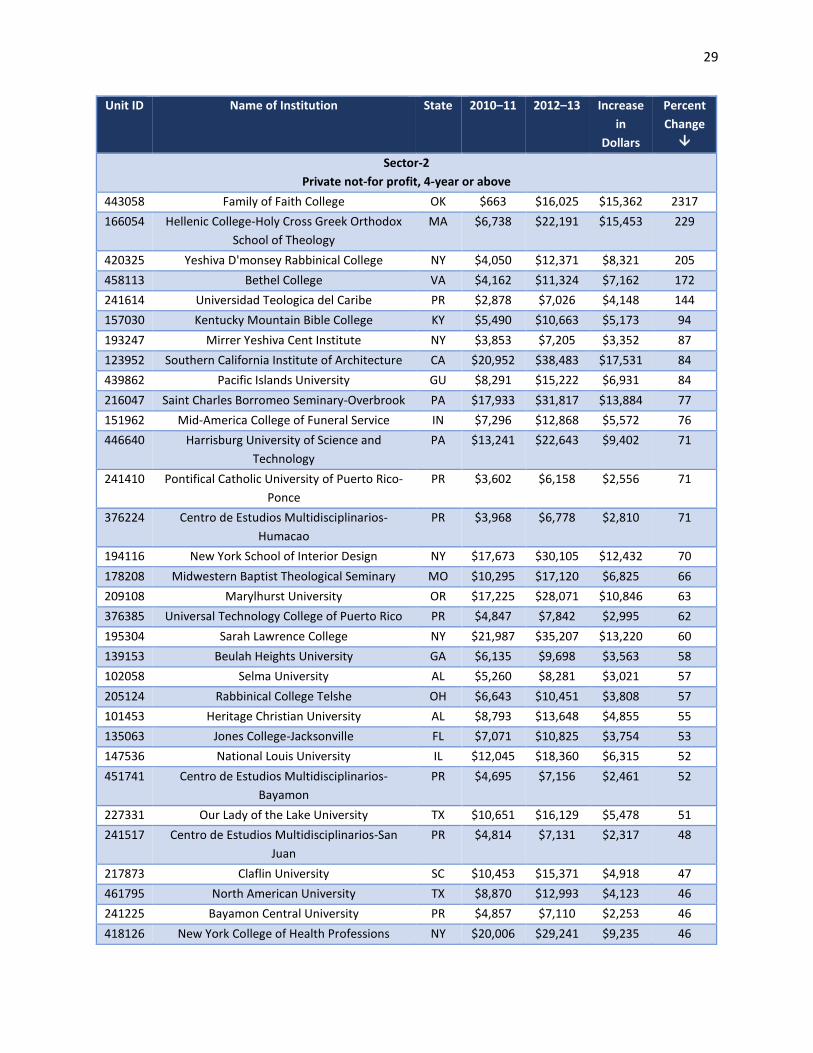
29
Unit ID Name of Institution State 2010–11 2012–13 Increase
in
Dollars
Percent
Change
Sector-2
Private not-for profit, 4-year or above
443058 Family of Faith College OK $663 $16,025 $15,362 2317
166054 Hellenic College-Holy Cross Greek Orthodox
School of Theology
MA $6,738 $22,191 $15,453 229
420325 Yeshiva D'monsey Rabbinical College NY $4,050 $12,371 $8,321 205
458113 Bethel College VA $4,162 $11,324 $7,162 172
241614 Universidad Teologica del Caribe PR $2,878 $7,026 $4,148 144
157030 Kentucky Mountain Bible College KY $5,490 $10,663 $5,173 94
193247 Mirrer Yeshiva Cent Institute NY $3,853 $7,205 $3,352 87
123952 Southern California Institute of Architecture CA $20,952 $38,483 $17,531 84
439862 Pacific Islands University GU $8,291 $15,222 $6,931 84
216047 Saint Charles Borromeo Seminary-Overbrook PA $17,933 $31,817 $13,884 77
151962 Mid-America College of Funeral Service IN $7,296 $12,868 $5,572 76
446640 Harrisburg University of Science and
Technology
PA $13,241 $22,643 $9,402 71
241410 Pontifical Catholic University of Puerto Rico-
Ponce
PR $3,602 $6,158 $2,556 71
376224 Centro de Estudios Multidisciplinarios-
Humacao
PR $3,968 $6,778 $2,810 71
194116 New York School of Interior Design NY $17,673 $30,105 $12,432 70
178208 Midwestern Baptist Theological Seminary MO $10,295 $17,120 $6,825 66
209108 Marylhurst University OR $17,225 $28,071 $10,846 63
376385 Universal Technology College of Puerto Rico PR $4,847 $7,842 $2,995 62
195304 Sarah Lawrence College NY $21,987 $35,207 $13,220 60
139153 Beulah Heights University GA $6,135 $9,698 $3,563 58
102058 Selma University AL $5,260 $8,281 $3,021 57
205124 Rabbinical College Telshe OH $6,643 $10,451 $3,808 57
101453 Heritage Christian University AL $8,793 $13,648 $4,855 55
135063 Jones College-Jacksonville FL $7,071 $10,825 $3,754 53
147536 National Louis University IL $12,045 $18,360 $6,315 52
451741 Centro de Estudios Multidisciplinarios-
Bayamon
PR $4,695 $7,156 $2,461 52
227331 Our Lady of the Lake University TX $10,651 $16,129 $5,478 51
241517 Centro de Estudios Multidisciplinarios-San
Juan
PR $4,814 $7,131 $2,317 48
217873 Claflin University SC $10,453 $15,371 $4,918 47
461795 North American University TX $8,870 $12,993 $4,123 46
241225 Bayamon Central University PR $4,857 $7,110 $2,253 46
418126 New York College of Health Professions NY $20,006 $29,241 $9,235 46

30
Unit ID Name of Institution State 2010–11 2012–13 Increase
in
Dollars
Percent
Change
196592 Touro College NY $9,771 $14,259 $4,488 46
160074 Our Lady of the Lake College LA $10,066 $14,632 $4,566 45
181330 Midland University NE $14,442 $20,886 $6,444 45
198136 Campbell University NC $18,162 $26,163 $8,001 44
388520 College of Biblical Studies-Houston TX $14,577 $20,983 $6,406 44
228486 Southwestern Christian College TX $4,641 $6,618 $1,977 43
137953 Trinity Baptist College FL $8,169 $11,606 $3,437 42
146667 Lincoln Christian University IL $12,910 $18,292 $5,382 42
438151 Stevens-Henager College-Murray UT $18,884 $26,600 $7,716 41
392840 Watkins College of Art Design & Film TN $17,995 $25,317 $7,322 41
217891 Clinton College SC $3,323 $4,669 $1,346 41
260947 Christian Life College IL $13,489 $18,932 $5,443 40
217907 Coker College SC $12,142 $16,994 $4,852 40
194693 Rabbinical College Beth Shraga NY $8,850 $12,288 $3,438 39
440651 Atenas College PR $5,538 $7,634 $2,096 38
192624 Machzikei Hadath Rabbinical College NY $6,616 $9,115 $2,499 38
160959 College of the Atlantic ME $15,958 $21,970 $6,012 38
154262 St Luke's College IA $15,797 $21,626 $5,829 37
219505 American Baptist College TN $17,185 $23,507 $6,322 37
148849 Shimer College IL $25,539 $34,903 $9,364 37
154174 Palmer College of Chiropractic-Davenport IA $16,501 $22,547 $6,046 37
196653 Trocaire College NY $10,210 $13,943 $3,733 37
141167 Thomas University GA $10,986 $14,992 $4,006 36
153977 Mercy College of Health Sciences IA $13,179 $17,897 $4,718 36
449764 Visible Music College TN $22,039 $29,813 $7,774 35
147129 Methodist College IL $19,621 $26,473 $6,852 35
457697 City Vision College MO $7,277 $9,800 $2,523 35
189273 Beth Hamedrash Shaarei Yosher Institute NY $5,718 $7,683 $1,965 34
200554 United Tribes Technical College ND $4,788 $6,415 $1,627 34
204176 Mount Carmel College of Nursing OH $17,658 $23,602 $5,944 34
Sector-3
Private for-profit, 4-year or above
447360 Fortis College-Largo FL $946 $10,323 $9,377 991
459091 Broadview Entertainment Arts University UT $15,350 $24,544 $9,194 60
203386 Hondros College OH $20,735 $32,312 $11,577 56
457299 Angeles College CA $10,077 $15,285 $5,208 52
459842 Herzing University-Kenosha WI $13,130 $19,194 $6,064 46
433536 Herzing University-Kenner LA $16,480 $24,061 $7,581 46
237783 Salem International University WV $16,253 $21,933 $5,680 35
456056 Virginia College-Charleston SC $13,654 $18,421 $4,767 35
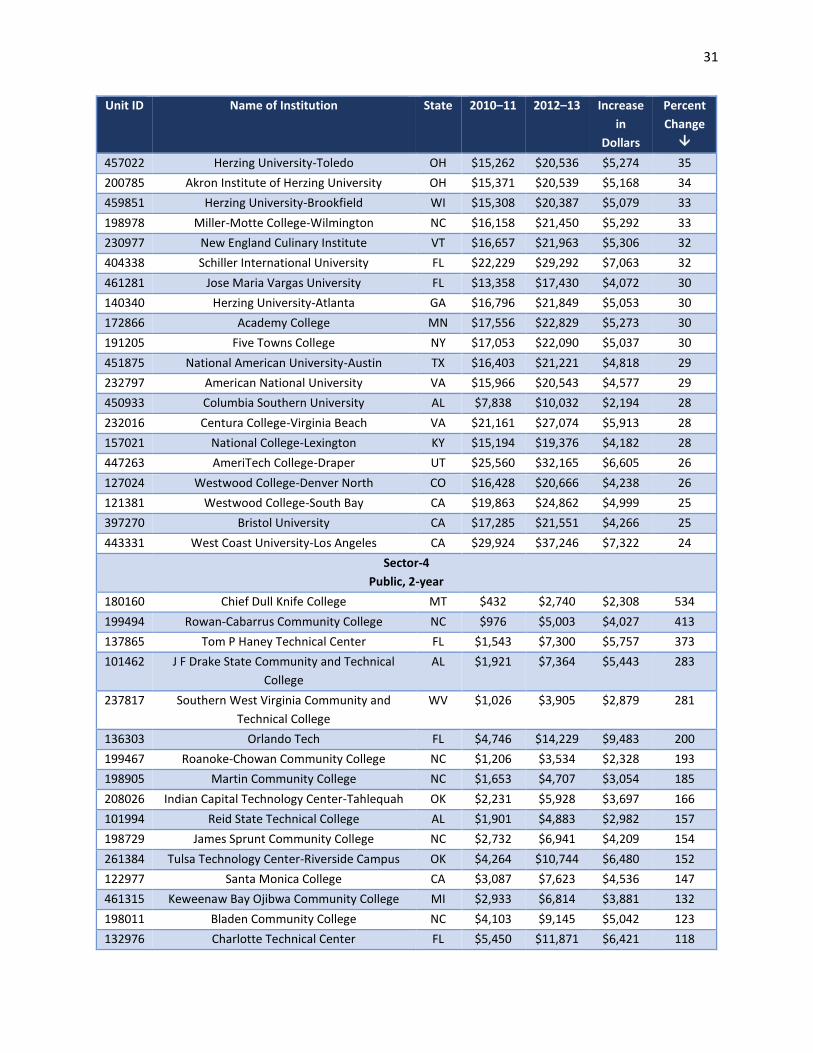
31
Unit ID Name of Institution State 2010–11 2012–13 Increase
in
Dollars
Percent
Change
457022 Herzing University-Toledo OH $15,262 $20,536 $5,274 35
200785 Akron Institute of Herzing University OH $15,371 $20,539 $5,168 34
459851 Herzing University-Brookfield WI $15,308 $20,387 $5,079 33
198978 Miller-Motte College-Wilmington NC $16,158 $21,450 $5,292 33
230977 New England Culinary Institute VT $16,657 $21,963 $5,306 32
404338 Schiller International University FL $22,229 $29,292 $7,063 32
461281 Jose Maria Vargas University FL $13,358 $17,430 $4,072 30
140340 Herzing University-Atlanta GA $16,796 $21,849 $5,053 30
172866 Academy College MN $17,556 $22,829 $5,273 30
191205 Five Towns College NY $17,053 $22,090 $5,037 30
451875 National American University-Austin TX $16,403 $21,221 $4,818 29
232797 American National University VA $15,966 $20,543 $4,577 29
450933 Columbia Southern University AL $7,838 $10,032 $2,194 28
232016 Centura College-Virginia Beach VA $21,161 $27,074 $5,913 28
157021 National College-Lexington KY $15,194 $19,376 $4,182 28
447263 AmeriTech College-Draper UT $25,560 $32,165 $6,605 26
127024 Westwood College-Denver North CO $16,428 $20,666 $4,238 26
121381 Westwood College-South Bay CA $19,863 $24,862 $4,999 25
397270 Bristol University CA $17,285 $21,551 $4,266 25
443331 West Coast University-Los Angeles CA $29,924 $37,246 $7,322 24
Sector-4
Public, 2-year
180160 Chief Dull Knife College MT $432 $2,740 $2,308 534
199494 Rowan-Cabarrus Community College NC $976 $5,003 $4,027 413
137865 Tom P Haney Technical Center FL $1,543 $7,300 $5,757 373
101462 J F Drake State Community and Technical
College
AL $1,921 $7,364 $5,443 283
237817 Southern West Virginia Community and
Technical College
WV $1,026 $3,905 $2,879 281
136303 Orlando Tech FL $4,746 $14,229 $9,483 200
199467 Roanoke-Chowan Community College NC $1,206 $3,534 $2,328 193
198905 Martin Community College NC $1,653 $4,707 $3,054 185
208026 Indian Capital Technology Center-Tahlequah OK $2,231 $5,928 $3,697 166
101994 Reid State Technical College AL $1,901 $4,883 $2,982 157
198729 James Sprunt Community College NC $2,732 $6,941 $4,209 154
261384 Tulsa Technology Center-Riverside Campus OK $4,264 $10,744 $6,480 152
122977 Santa Monica College CA $3,087 $7,623 $4,536 147
461315 Keweenaw Bay Ojibwa Community College MI $2,933 $6,814 $3,881 132
198011 Bladen Community College NC $4,103 $9,145 $5,042 123
132976 Charlotte Technical Center FL $5,450 $11,871 $6,421 118
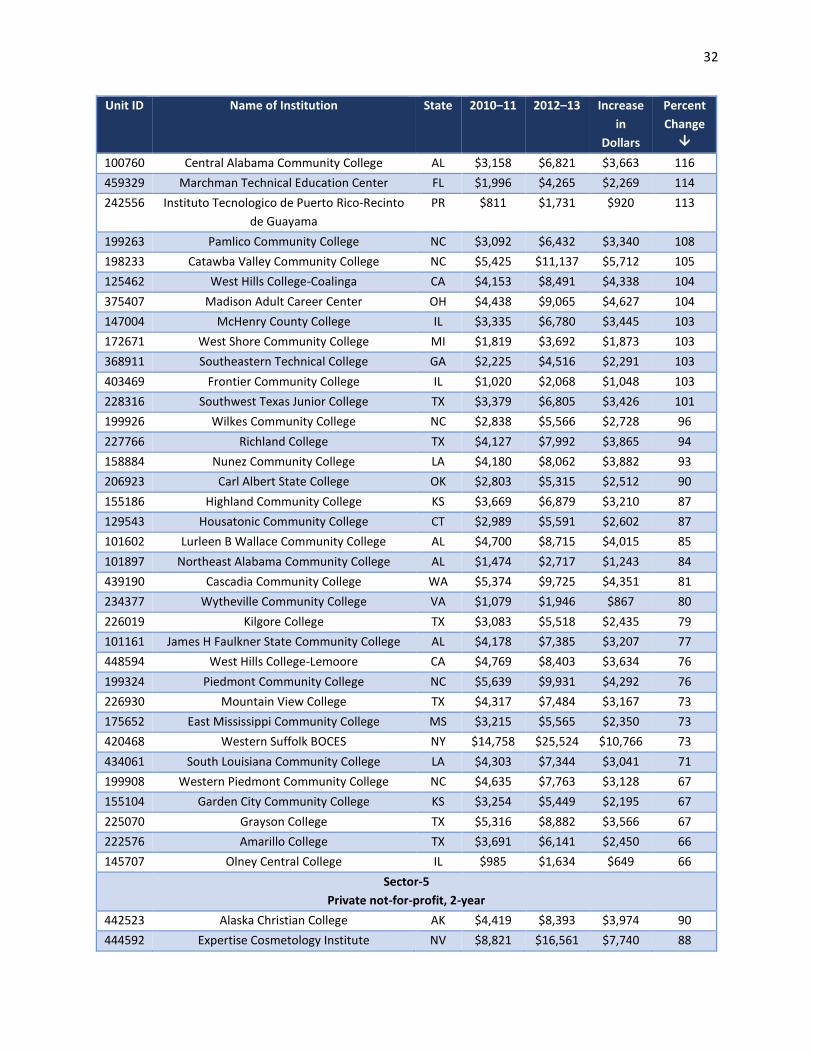
32
Unit ID Name of Institution State 2010–11 2012–13 Increase
in
Dollars
Percent
Change
100760 Central Alabama Community College AL $3,158 $6,821 $3,663 116
459329 Marchman Technical Education Center FL $1,996 $4,265 $2,269 114
242556 Instituto Tecnologico de Puerto Rico-Recinto
de Guayama
PR $811 $1,731 $920 113
199263 Pamlico Community College NC $3,092 $6,432 $3,340 108
198233 Catawba Valley Community College NC $5,425 $11,137 $5,712 105
125462 West Hills College-Coalinga CA $4,153 $8,491 $4,338 104
375407 Madison Adult Career Center OH $4,438 $9,065 $4,627 104
147004 McHenry County College IL $3,335 $6,780 $3,445 103
172671 West Shore Community College MI $1,819 $3,692 $1,873 103
368911 Southeastern Technical College GA $2,225 $4,516 $2,291 103
403469 Frontier Community College IL $1,020 $2,068 $1,048 103
228316 Southwest Texas Junior College TX $3,379 $6,805 $3,426 101
199926 Wilkes Community College NC $2,838 $5,566 $2,728 96
227766 Richland College TX $4,127 $7,992 $3,865 94
158884 Nunez Community College LA $4,180 $8,062 $3,882 93
206923 Carl Albert State College OK $2,803 $5,315 $2,512 90
155186 Highland Community College KS $3,669 $6,879 $3,210 87
129543 Housatonic Community College CT $2,989 $5,591 $2,602 87
101602 Lurleen B Wallace Community College AL $4,700 $8,715 $4,015 85
101897 Northeast Alabama Community College AL $1,474 $2,717 $1,243 84
439190 Cascadia Community College WA $5,374 $9,725 $4,351 81
234377 Wytheville Community College VA $1,079 $1,946 $867 80
226019 Kilgore College TX $3,083 $5,518 $2,435 79
101161 James H Faulkner State Community College AL $4,178 $7,385 $3,207 77
448594 West Hills College-Lemoore CA $4,769 $8,403 $3,634 76
199324 Piedmont Community College NC $5,639 $9,931 $4,292 76
226930 Mountain View College TX $4,317 $7,484 $3,167 73
175652 East Mississippi Community College MS $3,215 $5,565 $2,350 73
420468 Western Suffolk BOCES NY $14,758 $25,524 $10,766 73
434061 South Louisiana Community College LA $4,303 $7,344 $3,041 71
199908 Western Piedmont Community College NC $4,635 $7,763 $3,128 67
155104 Garden City Community College KS $3,254 $5,449 $2,195 67
225070 Grayson College TX $5,316 $8,882 $3,566 67
222576 Amarillo College TX $3,691 $6,141 $2,450 66
145707 Olney Central College IL $985 $1,634 $649 66
Sector-5
Private not-for-profit, 2-year
442523 Alaska Christian College AK $4,419 $8,393 $3,974 90
444592 Expertise Cosmetology Institute NV $8,821 $16,561 $7,740 88
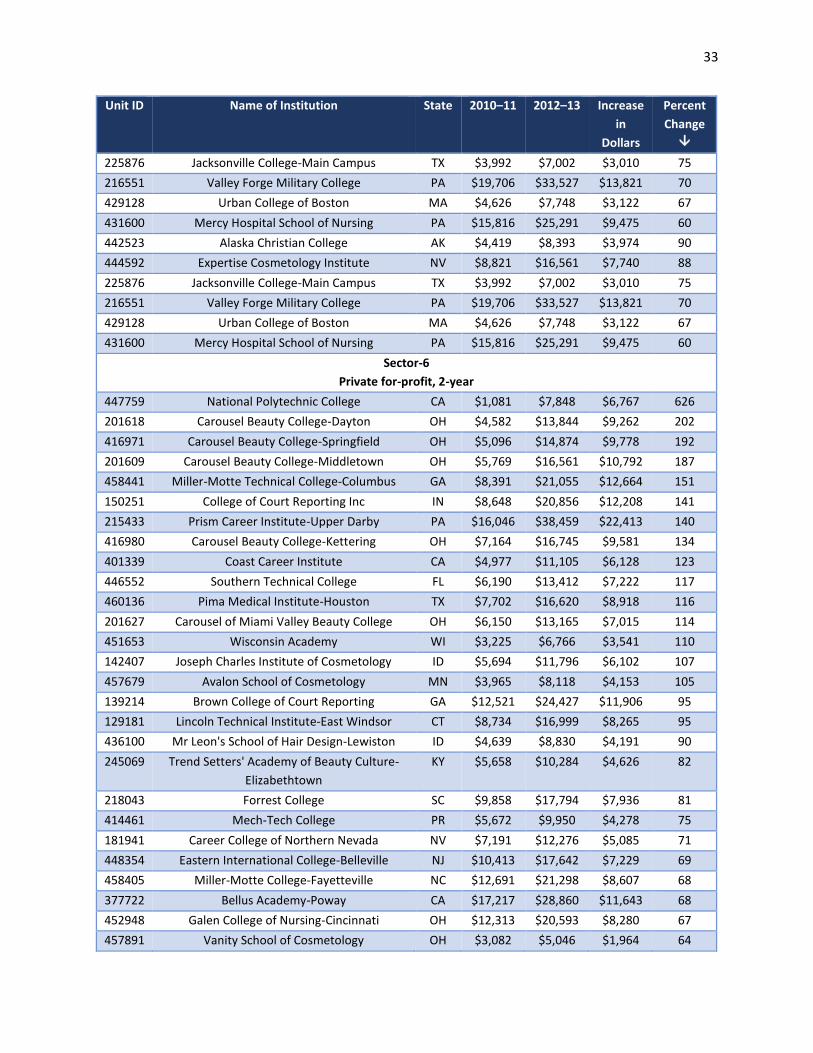
33
Unit ID Name of Institution State 2010–11 2012–13 Increase
in
Dollars
Percent
Change
225876 Jacksonville College-Main Campus TX $3,992 $7,002 $3,010 75
216551 Valley Forge Military College PA $19,706 $33,527 $13,821 70
429128 Urban College of Boston MA $4,626 $7,748 $3,122 67
431600 Mercy Hospital School of Nursing PA $15,816 $25,291 $9,475 60
442523 Alaska Christian College AK $4,419 $8,393 $3,974 90
444592 Expertise Cosmetology Institute NV $8,821 $16,561 $7,740 88
225876 Jacksonville College-Main Campus TX $3,992 $7,002 $3,010 75
216551 Valley Forge Military College PA $19,706 $33,527 $13,821 70
429128 Urban College of Boston MA $4,626 $7,748 $3,122 67
431600 Mercy Hospital School of Nursing PA $15,816 $25,291 $9,475 60
Sector-6
Private for-profit, 2-year
447759 National Polytechnic College CA $1,081 $7,848 $6,767 626
201618 Carousel Beauty College-Dayton OH $4,582 $13,844 $9,262 202
416971 Carousel Beauty College-Springfield OH $5,096 $14,874 $9,778 192
201609 Carousel Beauty College-Middletown OH $5,769 $16,561 $10,792 187
458441 Miller-Motte Technical College-Columbus GA $8,391 $21,055 $12,664 151
150251 College of Court Reporting Inc IN $8,648 $20,856 $12,208 141
215433 Prism Career Institute-Upper Darby PA $16,046 $38,459 $22,413 140
416980 Carousel Beauty College-Kettering OH $7,164 $16,745 $9,581 134
401339 Coast Career Institute CA $4,977 $11,105 $6,128 123
446552 Southern Technical College FL $6,190 $13,412 $7,222 117
460136 Pima Medical Institute-Houston TX $7,702 $16,620 $8,918 116
201627 Carousel of Miami Valley Beauty College OH $6,150 $13,165 $7,015 114
451653 Wisconsin Academy WI $3,225 $6,766 $3,541 110
142407 Joseph Charles Institute of Cosmetology ID $5,694 $11,796 $6,102 107
457679 Avalon School of Cosmetology MN $3,965 $8,118 $4,153 105
139214 Brown College of Court Reporting GA $12,521 $24,427 $11,906 95
129181 Lincoln Technical Institute-East Windsor CT $8,734 $16,999 $8,265 95
436100 Mr Leon's School of Hair Design-Lewiston ID $4,639 $8,830 $4,191 90
245069 Trend Setters' Academy of Beauty Culture-
Elizabethtown
KY $5,658 $10,284 $4,626 82
218043 Forrest College SC $9,858 $17,794 $7,936 81
414461 Mech-Tech College PR $5,672 $9,950 $4,278 75
181941 Career College of Northern Nevada NV $7,191 $12,276 $5,085 71
448354 Eastern International College-Belleville NJ $10,413 $17,642 $7,229 69
458405 Miller-Motte College-Fayetteville NC $12,691 $21,298 $8,607 68
377722 Bellus Academy-Poway CA $17,217 $28,860 $11,643 68
452948 Galen College of Nursing-Cincinnati OH $12,313 $20,593 $8,280 67
457891 Vanity School of Cosmetology OH $3,082 $5,046 $1,964 64
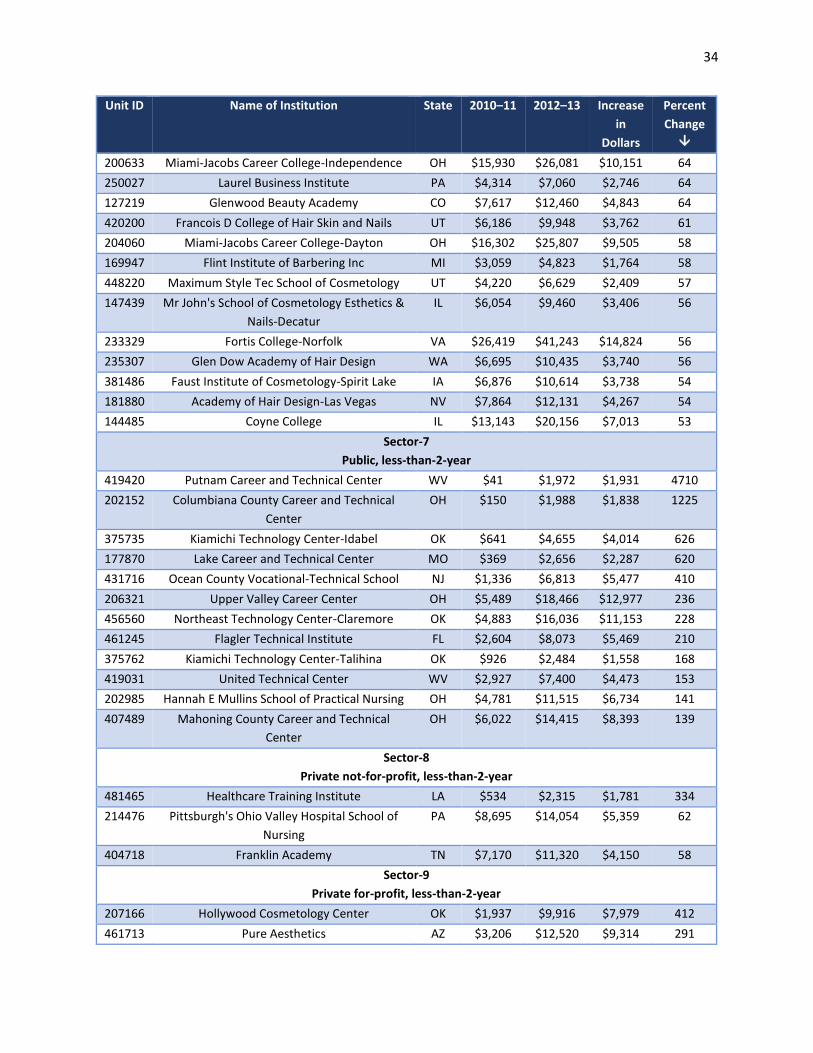
34
Unit ID Name of Institution State 2010–11 2012–13 Increase
in
Dollars
Percent
Change
200633 Miami-Jacobs Career College-Independence OH $15,930 $26,081 $10,151 64
250027 Laurel Business Institute PA $4,314 $7,060 $2,746 64
127219 Glenwood Beauty Academy CO $7,617 $12,460 $4,843 64
420200 Francois D College of Hair Skin and Nails UT $6,186 $9,948 $3,762 61
204060 Miami-Jacobs Career College-Dayton OH $16,302 $25,807 $9,505 58
169947 Flint Institute of Barbering Inc MI $3,059 $4,823 $1,764 58
448220 Maximum Style Tec School of Cosmetology UT $4,220 $6,629 $2,409 57
147439 Mr John's School of Cosmetology Esthetics &
Nails-Decatur
IL $6,054 $9,460 $3,406 56
233329 Fortis College-Norfolk VA $26,419 $41,243 $14,824 56
235307 Glen Dow Academy of Hair Design WA $6,695 $10,435 $3,740 56
381486 Faust Institute of Cosmetology-Spirit Lake IA $6,876 $10,614 $3,738 54
181880 Academy of Hair Design-Las Vegas NV $7,864 $12,131 $4,267 54
144485 Coyne College IL $13,143 $20,156 $7,013 53
Sector-7
Public, less-than-2-year
419420 Putnam Career and Technical Center WV $41 $1,972 $1,931 4710
202152 Columbiana County Career and Technical
Center
OH $150 $1,988 $1,838 1225
375735 Kiamichi Technology Center-Idabel OK $641 $4,655 $4,014 626
177870 Lake Career and Technical Center MO $369 $2,656 $2,287 620
431716 Ocean County Vocational-Technical School NJ $1,336 $6,813 $5,477 410
206321 Upper Valley Career Center OH $5,489 $18,466 $12,977 236
456560 Northeast Technology Center-Claremore OK $4,883 $16,036 $11,153 228
461245 Flagler Technical Institute FL $2,604 $8,073 $5,469 210
375762 Kiamichi Technology Center-Talihina OK $926 $2,484 $1,558 168
419031 United Technical Center WV $2,927 $7,400 $4,473 153
202985 Hannah E Mullins School of Practical Nursing OH $4,781 $11,515 $6,734 141
407489 Mahoning County Career and Technical
Center
OH $6,022 $14,415 $8,393 139
Sector-8
Private not-for-profit, less-than-2-year
481465 Healthcare Training Institute LA $534 $2,315 $1,781 334
214476 Pittsburgh's Ohio Valley Hospital School of
Nursing
PA $8,695 $14,054 $5,359 62
404718 Franklin Academy TN $7,170 $11,320 $4,150 58
Sector-9
Private for-profit, less-than-2-year
207166 Hollywood Cosmetology Center OK $1,937 $9,916 $7,979 412
461713 Pure Aesthetics AZ $3,206 $12,520 $9,314 291
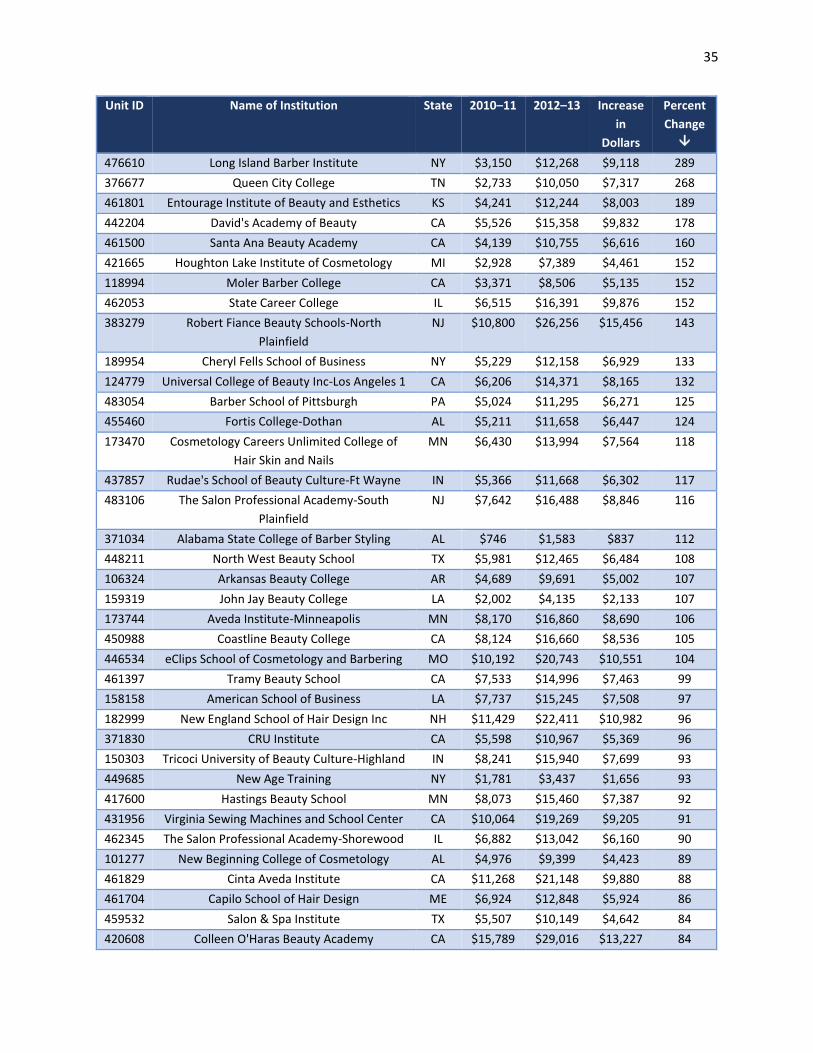
35
Unit ID Name of Institution State 2010–11 2012–13 Increase
in
Dollars
Percent
Change
476610 Long Island Barber Institute NY $3,150 $12,268 $9,118 289
376677 Queen City College TN $2,733 $10,050 $7,317 268
461801 Entourage Institute of Beauty and Esthetics KS $4,241 $12,244 $8,003 189
442204 David's Academy of Beauty CA $5,526 $15,358 $9,832 178
461500 Santa Ana Beauty Academy CA $4,139 $10,755 $6,616 160
421665 Houghton Lake Institute of Cosmetology MI $2,928 $7,389 $4,461 152
118994 Moler Barber College CA $3,371 $8,506 $5,135 152
462053 State Career College IL $6,515 $16,391 $9,876 152
383279 Robert Fiance Beauty Schools-North
Plainfield
NJ $10,800 $26,256 $15,456 143
189954 Cheryl Fells School of Business NY $5,229 $12,158 $6,929 133
124779 Universal College of Beauty Inc-Los Angeles 1 CA $6,206 $14,371 $8,165 132
483054 Barber School of Pittsburgh PA $5,024 $11,295 $6,271 125
455460 Fortis College-Dothan AL $5,211 $11,658 $6,447 124
173470 Cosmetology Careers Unlimited College of
Hair Skin and Nails
MN $6,430 $13,994 $7,564 118
437857 Rudae's School of Beauty Culture-Ft Wayne IN $5,366 $11,668 $6,302 117
483106 The Salon Professional Academy-South
Plainfield
NJ $7,642 $16,488 $8,846 116
371034 Alabama State College of Barber Styling AL $746 $1,583 $837 112
448211 North West Beauty School TX $5,981 $12,465 $6,484 108
106324 Arkansas Beauty College AR $4,689 $9,691 $5,002 107
159319 John Jay Beauty College LA $2,002 $4,135 $2,133 107
173744 Aveda Institute-Minneapolis MN $8,170 $16,860 $8,690 106
450988 Coastline Beauty College CA $8,124 $16,660 $8,536 105
446534 eClips School of Cosmetology and Barbering MO $10,192 $20,743 $10,551 104
461397 Tramy Beauty School CA $7,533 $14,996 $7,463 99
158158 American School of Business LA $7,737 $15,245 $7,508 97
182999 New England School of Hair Design Inc NH $11,429 $22,411 $10,982 96
371830 CRU Institute CA $5,598 $10,967 $5,369 96
150303 Tricoci University of Beauty Culture-Highland IN $8,241 $15,940 $7,699 93
449685 New Age Training NY $1,781 $3,437 $1,656 93
417600 Hastings Beauty School MN $8,073 $15,460 $7,387 92
431956 Virginia Sewing Machines and School Center CA $10,064 $19,269 $9,205 91
462345 The Salon Professional Academy-Shorewood IL $6,882 $13,042 $6,160 90
101277 New Beginning College of Cosmetology AL $4,976 $9,399 $4,423 89
461829 Cinta Aveda Institute CA $11,268 $21,148 $9,880 88
461704 Capilo School of Hair Design ME $6,924 $12,848 $5,924 86
459532 Salon & Spa Institute TX $5,507 $10,149 $4,642 84
420608 Colleen O'Haras Beauty Academy CA $15,789 $29,016 $13,227 84
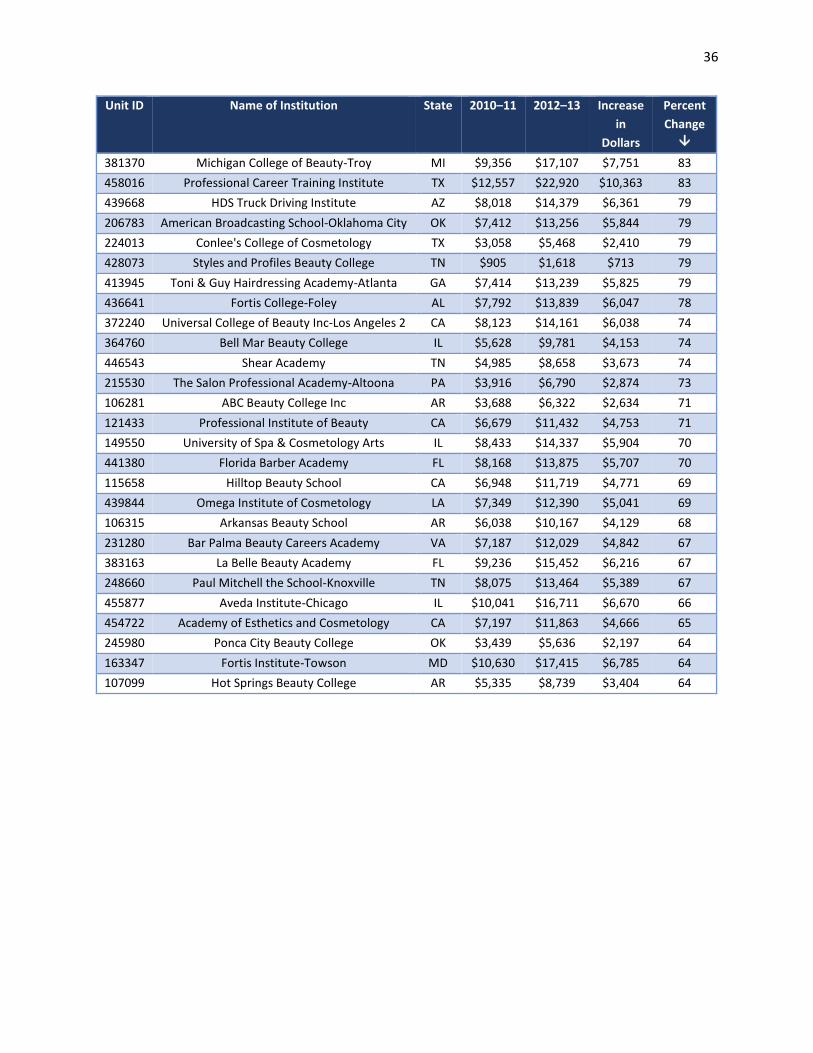
36
Unit ID Name of Institution State 2010–11 2012–13 Increase
in
Dollars
Percent
Change
381370 Michigan College of Beauty-Troy MI $9,356 $17,107 $7,751 83
458016 Professional Career Training Institute TX $12,557 $22,920 $10,363 83
439668 HDS Truck Driving Institute AZ $8,018 $14,379 $6,361 79
206783 American Broadcasting School-Oklahoma City OK $7,412 $13,256 $5,844 79
224013 Conlee's College of Cosmetology TX $3,058 $5,468 $2,410 79
428073 Styles and Profiles Beauty College TN $905 $1,618 $713 79
413945 Toni & Guy Hairdressing Academy-Atlanta GA $7,414 $13,239 $5,825 79
436641 Fortis College-Foley AL $7,792 $13,839 $6,047 78
372240 Universal College of Beauty Inc-Los Angeles 2 CA $8,123 $14,161 $6,038 74
364760 Bell Mar Beauty College IL $5,628 $9,781 $4,153 74
446543 Shear Academy TN $4,985 $8,658 $3,673 74
215530 The Salon Professional Academy-Altoona PA $3,916 $6,790 $2,874 73
106281 ABC Beauty College Inc AR $3,688 $6,322 $2,634 71
121433 Professional Institute of Beauty CA $6,679 $11,432 $4,753 71
149550 University of Spa & Cosmetology Arts IL $8,433 $14,337 $5,904 70
441380 Florida Barber Academy FL $8,168 $13,875 $5,707 70
115658 Hilltop Beauty School CA $6,948 $11,719 $4,771 69
439844 Omega Institute of Cosmetology LA $7,349 $12,390 $5,041 69
106315 Arkansas Beauty School AR $6,038 $10,167 $4,129 68
231280 Bar Palma Beauty Careers Academy VA $7,187 $12,029 $4,842 67
383163 La Belle Beauty Academy FL $9,236 $15,452 $6,216 67
248660 Paul Mitchell the School-Knoxville TN $8,075 $13,464 $5,389 67
455877 Aveda Institute-Chicago IL $10,041 $16,711 $6,670 66
454722 Academy of Esthetics and Cosmetology CA $7,197 $11,863 $4,666 65
245980 Ponca City Beauty College OK $3,439 $5,636 $2,197 64
163347 Fortis Institute-Towson MD $10,630 $17,415 $6,785 64
107099 Hot Springs Beauty College AR $5,335 $8,739 $3,404 64
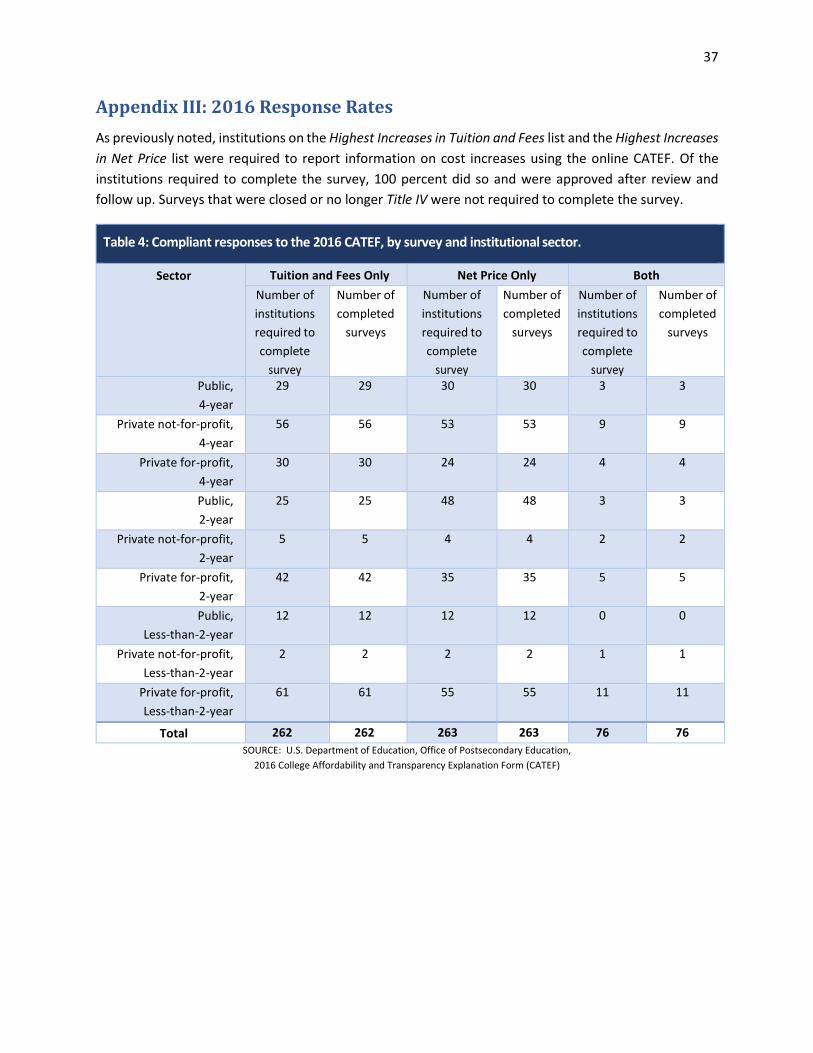
37
Appendix III: 2016 Response Rates
As previously noted, institutions on the Highest Increases in Tuition and Fees list and the Highest Increases
in Net Price list were required to report information on cost increases using the online CATEF. Of the
institutions required to complete the survey, 100 percent did so and were approved after review and
follow up. Surveys that were closed or no longer Title IV were not required to complete the survey.
Table 4: Compliant responses to the 2016 CATEF, by survey and institutional sector.
Sector Tuition and Fees Only Net Price Only Both
Number of
institutions
required to
complete
survey
Number of
completed
surveys
Number of
institutions
required to
complete
survey
Number of
completed
surveys
Number of
institutions
required to
complete
survey
Number of
completed
surveys
Public,
4-year
29 29 30 30 3 3
Private not-for-profit,
4-year
56 56 53 53 9 9
Private for-profit,
4-year
30 30 24 24 4 4
Public,
2-year
25 25 48 48 3 3
Private not-for-profit,
2-year
5 5 4 4 2 2
Private for-profit,
2-year
42 42 35 35 5 5
Public,
Less-than-2-year
12 12 12 12 0 0
Private not-for-profit,
Less-than-2-year
2 2 2 2 1 1
Private for-profit,
Less-than-2-year
61 61 55 55 11 11
Total 262 262 263 263 76 76
SOURCE: U.S. Department of Education, Office of Postsecondary Education,
2016 College Affordability and Transparency Explanation Form (CATEF)
38
Appendix IV: CATEF Review Guidelines
After a CATEF survey has been completed and locked, a reviewer reads all responses to determine if
institutions gave thorough and relevant responses for each required cost area. The guidelines below
outline the questions considered during the review process. If one or more problems are found during
review, the survey is sent back to the CATEF contact person for further clarification. Institutions are
required to make corrections to their surveys and resubmit them by a new deadline.
Review guidelines:
Did the user answer the question?
Did the response match data for the years relevant to the survey?
Does the user’s explanation contradict the IPEDS Finance data and data from other sources?
For example, the explanation mentioned decrease in FTE, but IPEDS data showed an increase.
Did the user explain what “other expenses” consisted of?
Were any of the institution’s other expenses already accounted for in another area? For
example, scholarships, research, salaries, etc.
If the same response was provided for each cost area, did the response appropriately address
the specific increase in each cost area with enough depth and clarity?
If the institution had no increase or a negative increase in its expenses, did the user explain
why their school is on the CATC list?
If the user explained a change in their school’s methodology, did they provide an explanation
of the changes and how the change affected the outcome of their costs?
If the user provided explanations in the form of a list, were the explanations clear and
complete? For example, “staff, students” would not be an appropriate response; they would need
to explain what specifically occurred with their staff and students.
If the user entered a response in the form of a table, request clarification. Note: Tables are
difficult to read on the survey summary screen.
If the user claimed a mistake in reporting, they were required to thoroughly explain these
mistakes, including how they will avoid the mistakes in reporting in the future. Note: Ensure they
were looking at the correct data years.
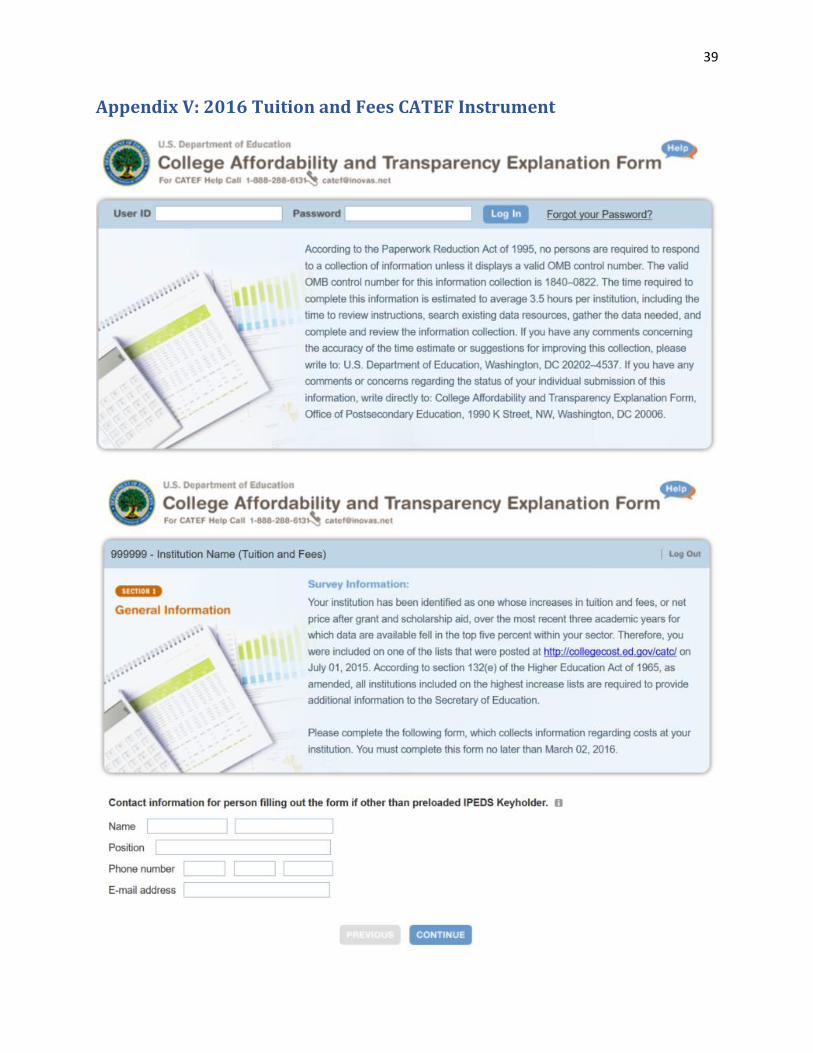
39
Appendix V: 2016 Tuition and Fees CATEF Instrument

40
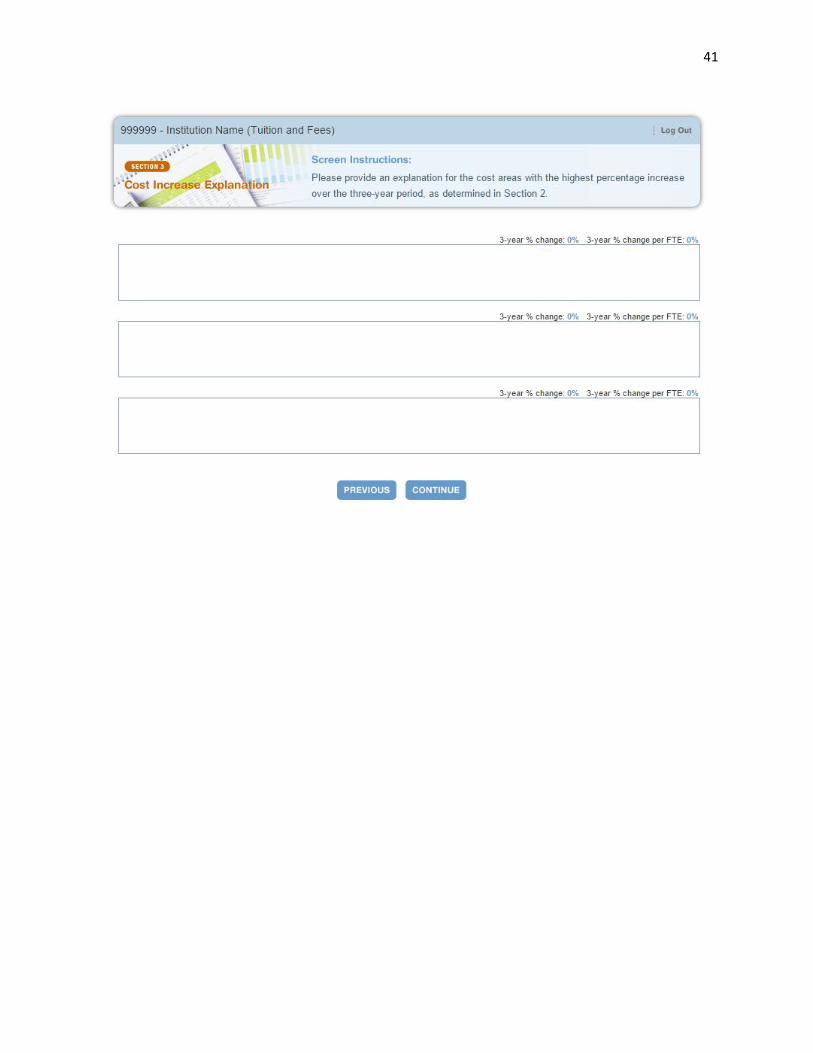
41
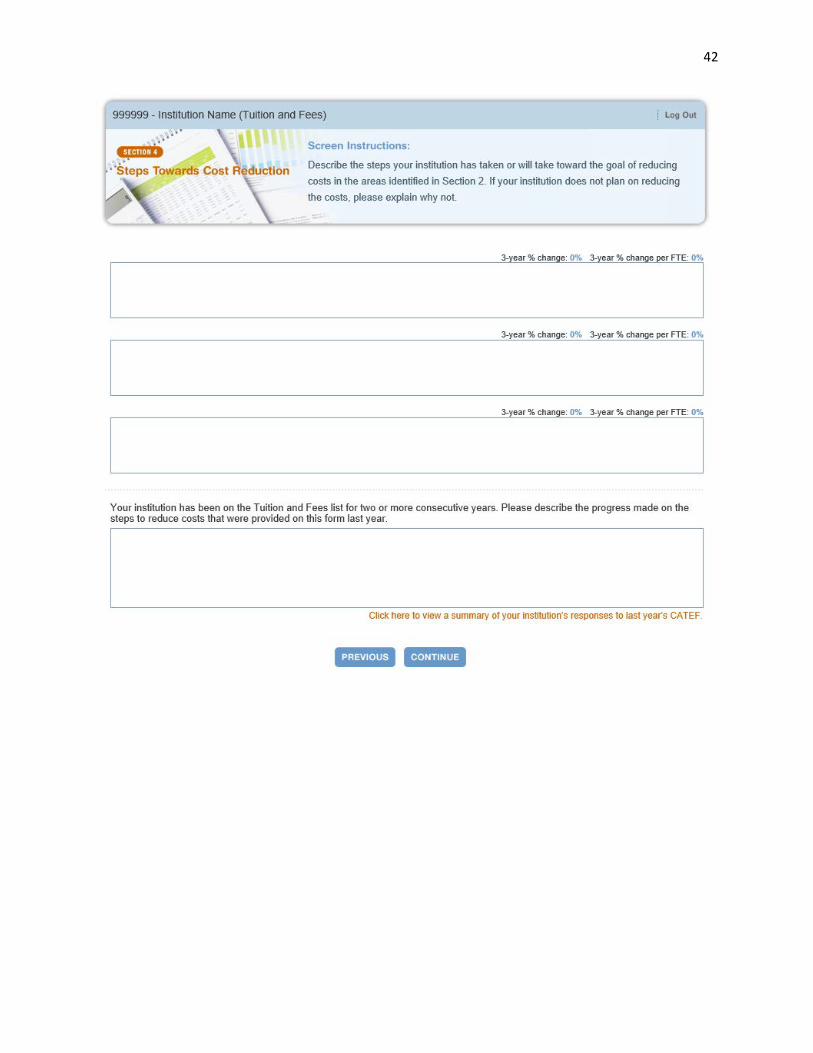
42
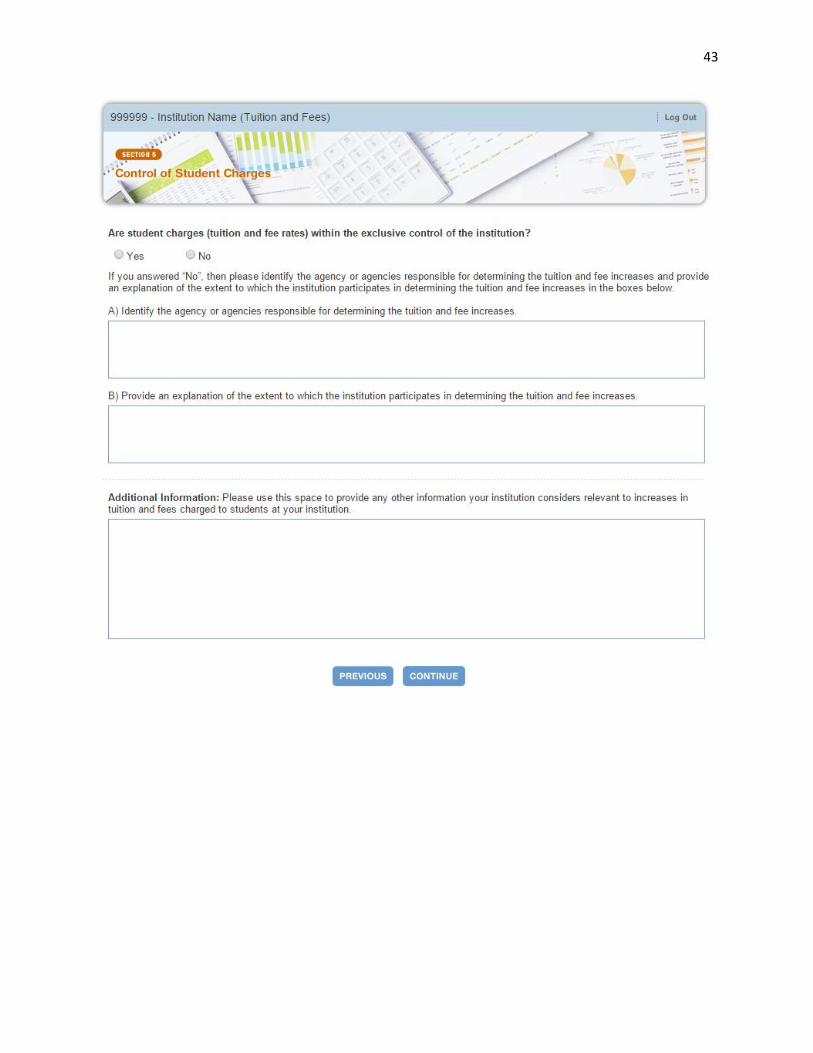
43

44
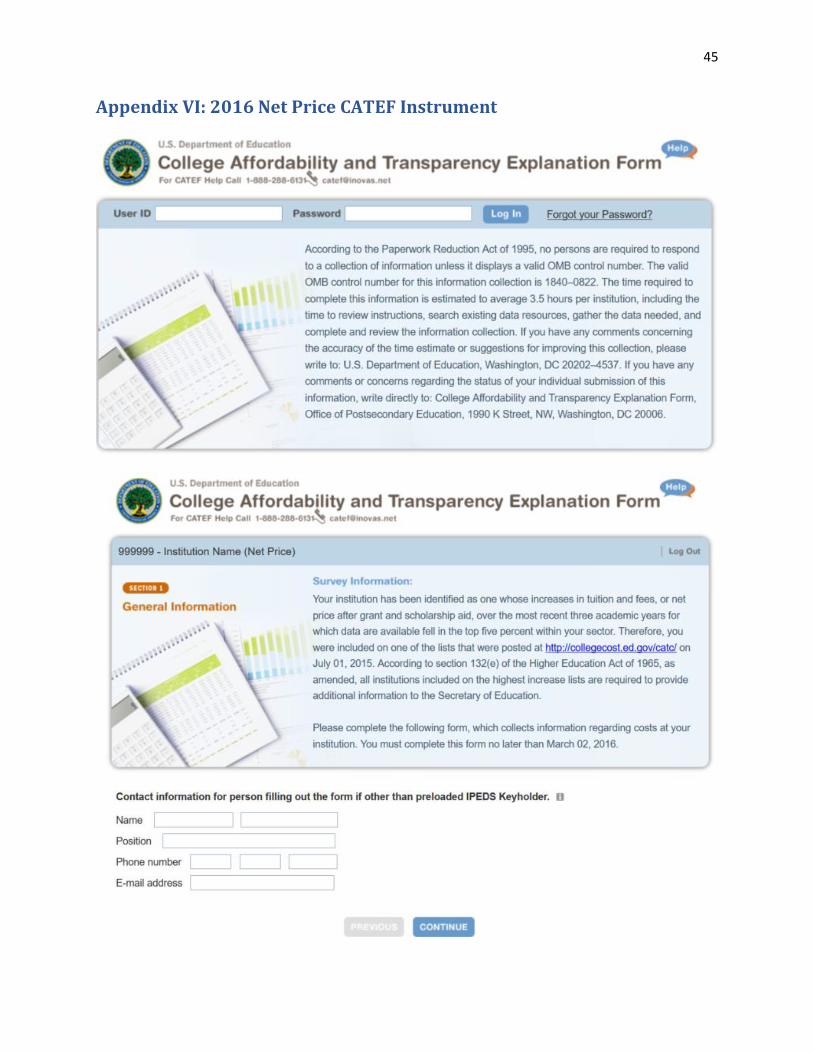
45
Appendix VI: 2016 Net Price CATEF Instrument
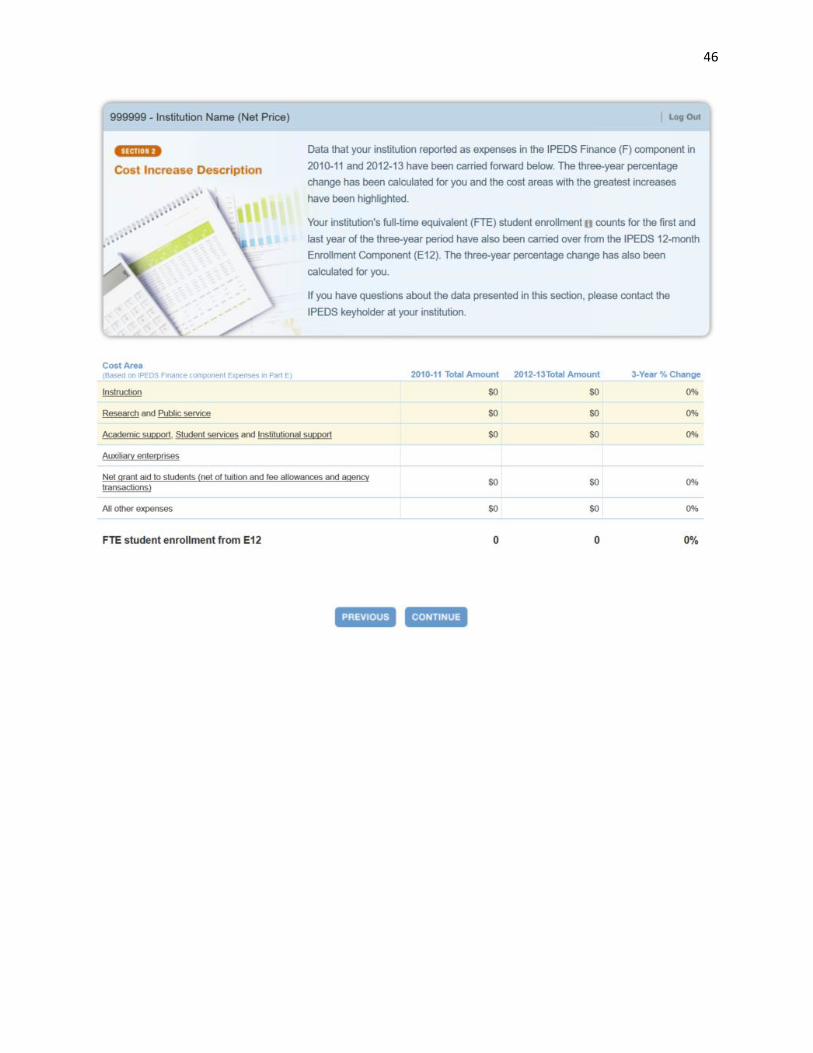
46
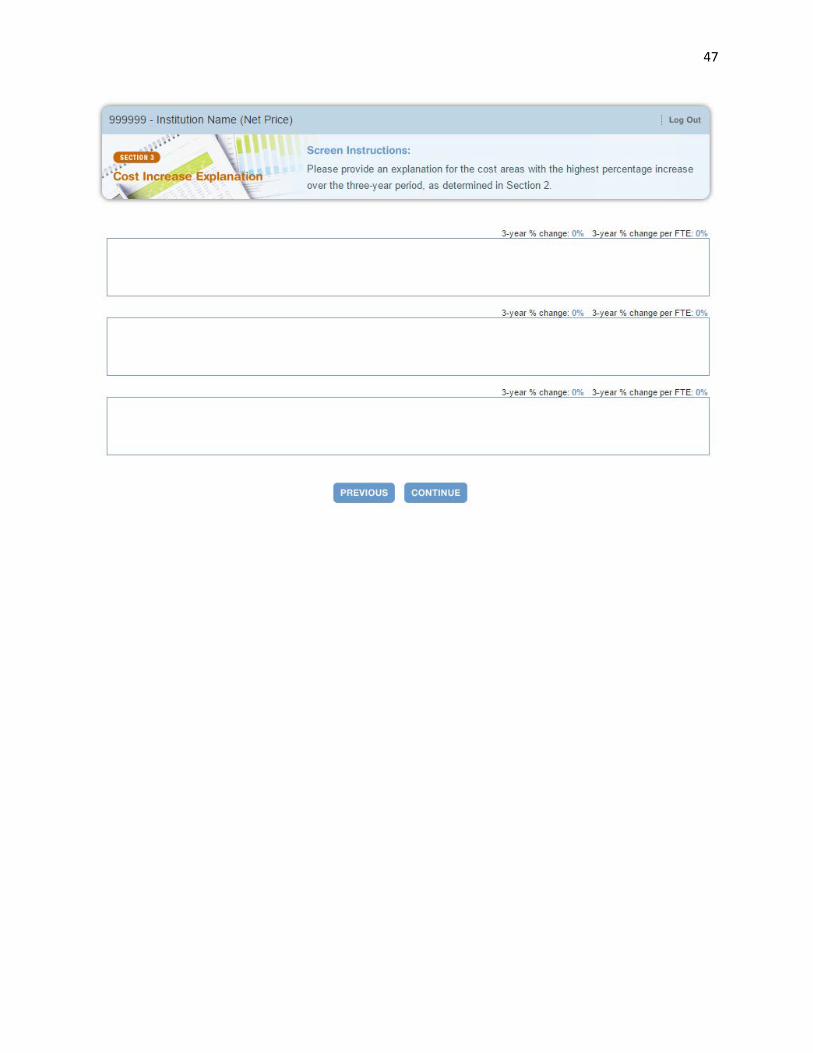
47
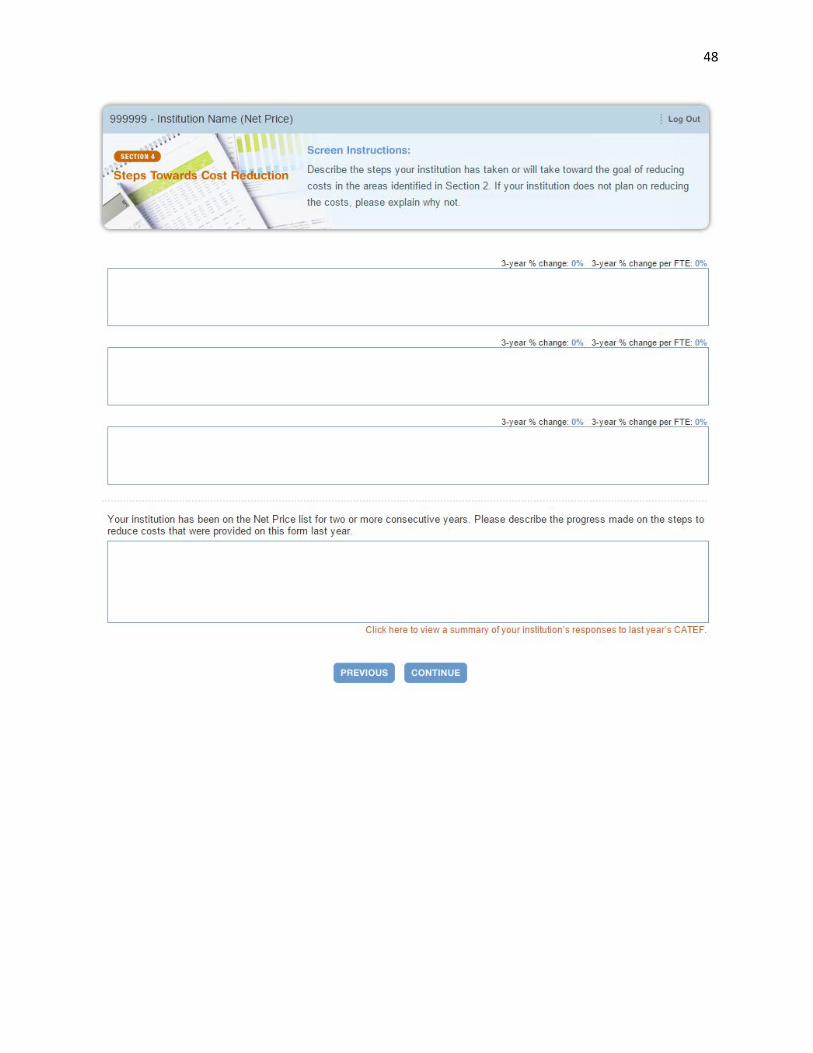
48
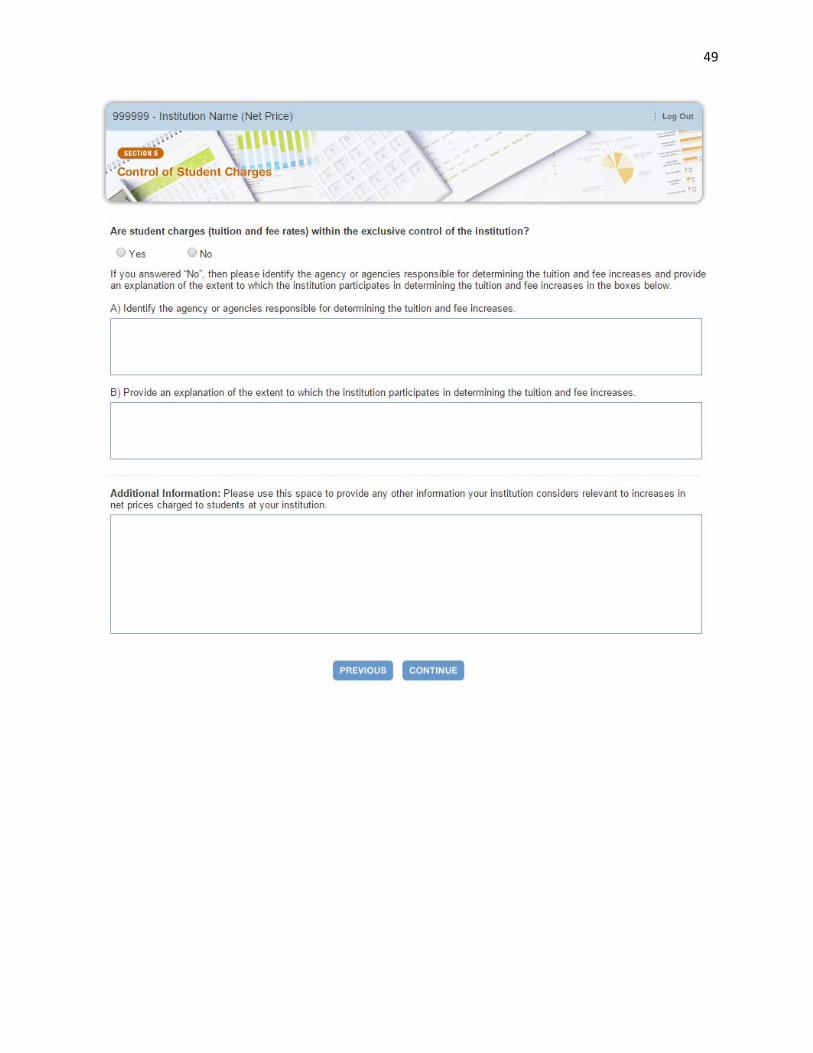
49

50
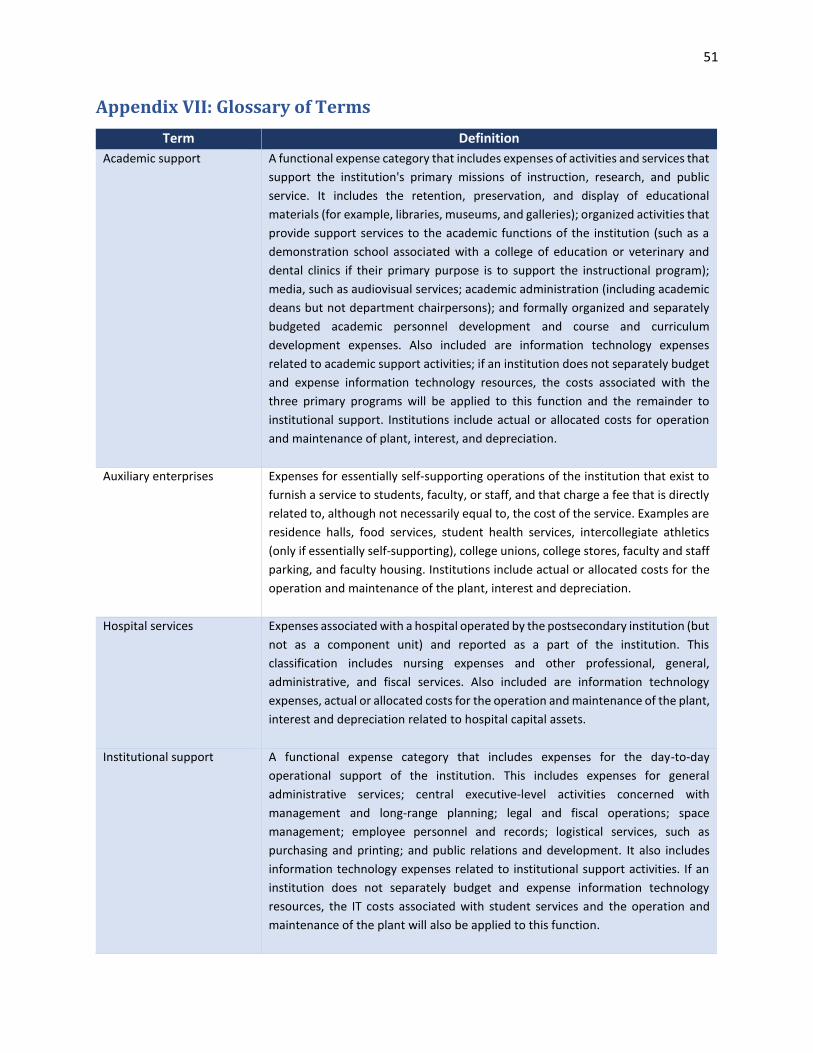
51
Appendix VII: Glossary of Terms
Term Definition
Academic support A functional expense category that includes expenses of activities and services that
support the institution's primary missions of instruction, research, and public
service. It includes the retention, preservation, and display of educational
materials (for example, libraries, museums, and galleries); organized activities that
provide support services to the academic functions of the institution (such as a
demonstration school associated with a college of education or veterinary and
dental clinics if their primary purpose is to support the instructional program);
media, such as audiovisual services; academic administration (including academic
deans but not department chairpersons); and formally organized and separately
budgeted academic personnel development and course and curriculum
development expenses. Also included are information technology expenses
related to academic support activities; if an institution does not separately budget
and expense information technology resources, the costs associated with the
three primary programs will be applied to this function and the remainder to
institutional support. Institutions include actual or allocated costs for operation
and maintenance of plant, interest, and depreciation.
Auxiliary enterprises Expenses for essentially self-supporting operations of the institution that exist to
furnish a service to students, faculty, or staff, and that charge a fee that is directly
related to, although not necessarily equal to, the cost of the service. Examples are
residence halls, food services, student health services, intercollegiate athletics
(only if essentially self-supporting), college unions, college stores, faculty and staff
parking, and faculty housing. Institutions include actual or allocated costs for the
operation and maintenance of the plant, interest and depreciation.
Hospital services Expenses associated with a hospital operated by the postsecondary institution (but
not as a component unit) and reported as a part of the institution. This
classification includes nursing expenses and other professional, general,
administrative, and fiscal services. Also included are information technology
expenses, actual or allocated costs for the operation and maintenance of the plant,
interest and depreciation related to hospital capital assets.
Institutional support A functional expense category that includes expenses for the day-to-day
operational support of the institution. This includes expenses for general
administrative services; central executive-level activities concerned with
management and long-range planning; legal and fiscal operations; space
management; employee personnel and records; logistical services, such as
purchasing and printing; and public relations and development. It also includes
information technology expenses related to institutional support activities. If an
institution does not separately budget and expense information technology
resources, the IT costs associated with student services and the operation and
maintenance of the plant will also be applied to this function.

52
Term Definition
Instruction A functional expense category that includes expenses of the colleges, schools,
departments, and other instructional divisions of the institution and expenses for
departmental research and public service that are not separately budgeted. This
includes general academic instruction; occupational and vocational instruction;
community education; preparatory and adult basic education; and regular, special,
and extension sessions. It also includes expenses for both credit and non-credit
activities. It excludes expenses for academic administration where the primary
function is administration (e.g., academic deans). Information technology
expenses related to instructional activities, if the institution separately budgets
and expenses information technology resources, are included (otherwise these
expenses are included in academic support). Institutions include actual or
allocated costs for the operation and maintenance of the plant, interest, and
depreciation.
Net grant aid to students The portion of scholarships and fellowships granted by an institution that exceeds
the amount applied to institutional charges, such as tuition and fees or room and
board. The amount reported as expense excludes allowances.
Net price The Higher Education Opportunity Act of 2008 defines “institutional net price” as
"the average yearly price actually charged to first-time, full-time undergraduate
students receiving student aid at an institution of higher education after deducting
such aid." In IPEDS, average institutional net price is generated by subtracting the
average amount of federal, state/local government, or institutional grant and
scholarship aid from the total cost of attendance. The total cost of attendance is
the sum of the published tuition and required fees (lower of in-district or in-state
for public institutions), books and supplies, and the weighted average for room
and board and other expenses. The cost of attendance data are collected in the
Institutional Characteristics (IC) component of IPEDS, and financial aid data are
collected in the Student Financial Aid (SFA) component of IPEDS.
Public service A functional expense category that includes expenses for activities established
primarily to provide non-instructional services beneficial to individuals and groups
external to the institution. Examples are conferences, institutes, general advisory
service, reference bureaus, and similar services provided to particular sectors of
the community. This function includes expenses for community services,
cooperative extension services, and public broadcasting services. It also includes
information technology expenses related to the public service activities if the
institution separately budgets and expenses information technology resources
(otherwise these expenses are included in academic support). Institutions include
actual or allocated costs for the operation and maintenance of the plant, interest,
and depreciation.

53
Term Definition
Research A functional expense category that includes expenses for activities specifically
organized to produce research outcomes and commissioned by an agency either
external to the institution or separately budgeted by an organizational unit within
the institution. The category includes institutes and research centers, and
individual and project research. This function does not include non-research
sponsored programs (e.g., training programs). Also included are information
technology expenses related to research activities if the institution separately
budgets and expenses information technology resources (otherwise these
expenses are included in academic support.) Institutions include actual or
allocated costs for the operation and maintenance of the plant, interest, and
depreciation.
Scholarships and
fellowships
That portion of scholarships and fellowships granted that exceeds the amount
applied to institutional charges, such as tuition and fees or room and board. The
amount reported as expense excludes allowances and discounts. The FASB survey
uses the term "net grants in aid to students" rather than "scholarships and
fellowships."
Student services A functional expense category that includes expenses for admissions, registrar
activities, and activities whose primary purpose is to contribute to students’
emotional and physical well-being and to their intellectual, cultural, and social
development outside the context of the formal instructional program. Examples
include student activities, cultural events, student newspapers, intramural
athletics, student organizations, supplemental instruction outside the normal
administration, and student records. Intercollegiate athletics and student health
services may also be included except when operated as self-supporting auxiliary
enterprises. It also may include information technology expenses related to
student service activities if the institution separately budgets and expenses
information technology resources (otherwise these expenses are included in
institutional support.) Institutions include actual or allocated costs for the
operation and maintenance of the plant, interest, and depreciation.
Tuition and fees (published
charges)
The amount of tuition and required fees covering a full academic year most
frequently charged to students. These values represent what a typical student
would be charged and may not be the same for all students at an institution. If
tuition is charged on a per-credit-hour basis, the average full-time credit hour load
for an entire academic year is used to estimate average tuition. Required fees
include all fixed sum charges that are required of such a large proportion of all
students that the student who does not pay the charges is an exception.