Embed Size (px)
Citation preview
College Affordability and Transparency
Explanation Form
Summary Guide to College Costs for the 2017 Collection Year
June 2018

The views expressed herein do not necessarily represent the positions or policies of the Department of Education. No official endorsement by the U.S. Department of Education of any product, commodity, service or enterprise mentioned in this publication is intended or should be inferred. U.S. Department of Education Betsy DeVos Secretary Office of Postsecondary Education Lynn Mahaffie Deputy Assistant Secretary for Policy, Planning and Innovation June 2018 This report is in the public domain. Authorization to reproduce it in whole or in part is granted. While permission to reprint this publication is not necessary, the citation should be: U.S. Department of Education, Office of Postsecondary Education, College Affordability and Transparency Explanation Form: Summary Guide to College Costs for the 2017 Collection Year. Washington, D.C., 2018. This report is available on the Department’s website at https://collegecost.ed.gov/catc/resources/2017College_Affordability_and_Transparency_Explanation_Form_Summary.pdf. Availability of Alternate Formats Requests for documents in alternate formats, such as Braille or large print, should be submitted to the Alternate Format Center by calling 202-260-0852 or by contacting the 504 coordinator via email at [email protected]. Notice to Limited English Proficient Persons If you have difficulty understanding English, you may request language assistance services for Department information that is available to the public. These language assistance services are available free of charge. If you need more information about interpretation or translation services, please call 1–800–USA–LEARN (1-800-872-5327) (TTY: 1-800-437-0833), email us at [email protected], or write to U.S. Department of Education, Information Resource Center, 400 Maryland Ave., SW, Washington, DC 20202.

iii
Contents List of Tables ................................................................................................................................................ iv
List of Figures ............................................................................................................................................... iv
Abstract ......................................................................................................................................................... v
1.0 Introduction ............................................................................................................................................ 1
2.0 Methodology ........................................................................................................................................... 2
2.1 The College Affordability and Transparency Center Lists ................................................................... 2
2.1.1 Institutional Sectors .................................................................................................................... 3
2.1.2 IPEDS Data Used in CATC and CATEF .......................................................................................... 4
2.1.3 Tuition and Fees .......................................................................................................................... 5
2.1.4 Net Price ...................................................................................................................................... 5
2.2 The CATEF Survey ............................................................................................................................... 6
2.2.1 Finance Data ................................................................................................................................ 7
2.2.2 Excluded Responses .................................................................................................................... 8
3.0 Summary of Results .............................................................................................................................. 11
3.1 Demographics ................................................................................................................................... 11
3.1.1 Locations ................................................................................................................................... 11
3.1.2 Calendar System ........................................................................................................................ 13
3.1.3 Sector ........................................................................................................................................ 14
3.2 Analysis of Cost Areas ....................................................................................................................... 16
3.3 Explanations of Increased Cost ......................................................................................................... 19
3.3.1 Staff, Benefits, and Salaries and Wages .................................................................................... 19
3.3.2 Increased Enrollment ................................................................................................................ 20
3.3.3 Changes to Reporting Methodology ......................................................................................... 23
3.3.4 Purchased Supplies and Equipment .......................................................................................... 24
3.3.5 Added Programs ........................................................................................................................ 25
3.4 Steps for Reducing Costs .................................................................................................................. 26
3.4.1 Progress on Cost Reduction ...................................................................................................... 27
3.5 Control of Student Charges .............................................................................................................. 28
3.6 Burden Estimate ............................................................................................................................... 30
4.0 Increases in Tuition and Fees and Net Price ......................................................................................... 31
5.0 Conclusion ............................................................................................................................................. 33
Appendices .................................................................................................................................................. 34
Appendix I: 2017 Tuition and Fees CATEF Respondents ........................................................................ 34
Appendix II: 2017 Net Price CATEF Respondents ................................................................................... 43
Appendix III: CATEF Review Guidelines .................................................................................................. 52
Appendix IV: 2017 Tuition and Fees CATEF ............................................................................................ 53
Appendix V: 2017 Net Price CATEF ......................................................................................................... 61
Appendix VI: Glossary of Terms .............................................................................................................. 69

iv
List of Tables
Table 1: Nine sectors used to categorize institutions (control, level) .......................................................... 3
Table 2: Institutions excluded from the 2017 CATEF due to closure or lapse in Title IV status, by survey and
institutional sector ........................................................................................................................................ 8
Table 3: Institutions with at least one cost area excluded from the 2017 CATEF analysis due to a lack of
increase, by survey and institutional sector ................................................................................................. 9
Table 4: Institutions with at least one cost area excluded from CATEF analysis due to an error in reporting,
by survey and institutional sector ............................................................................................................... 10
Table 5: States with a higher representation of schools in IPEDS and/or Tuition and Fees or Net Price CATEF
.................................................................................................................................................................... 12
Table 6: Median cost area percent change in the 2017 CATEF, by survey and cost area .......................... 17
Table 7: Median cost area percent change per FTE in the 2017 CATEF, by survey and cost area ............. 17
Table 8: Control of student charges on the 2017 CATEF, by survey ........................................................... 28
Table 9: Average reported burden in hours, by survey and institutional sector ........................................ 30
List of Figures
Figure 1: Comparison years for the 2017 CATEF .......................................................................................... 4
Figure 2: Institutions required to complete a 2017 CATEF form, by survey ............................................... 11
Figure 3: Most represented states in 2017 CATEF ...................................................................................... 11
Figure 4: Proportion of institutions required to complete the CATEF and IPEDS, by academic reporters and
program reporters ...................................................................................................................................... 13
Figure 5: Institutions that responded to the 2017 CATEF, by survey and institutional sector ................... 14
Figure 6: Institutional sector percentages in CATEF and IPEDS .................................................................. 15
Figure 7: Number of times each cost area was selected in the 2017 CATEF, by survey and cost area ...... 16
Figure 8: Median cost area dollar increases in the 2017 CATEF, by survey and cost area ......................... 18
Figure 9: Median cost area dollar increases per FTE in the 2017 CATEF, by survey and cost area ............ 18
Figure 10: Top reasons given for increases in each cost area on the 2017 CATEF, by survey .................... 19
Figure 11: Differences in FTE student enrollment for institutions required to complete the 2017 Tuition
and Fees CATEF ........................................................................................................................................... 22
Figure 12: Differences in FTE student enrollment for institutions required to complete the 2017 Net Price
CATEF .......................................................................................................................................................... 22
Figure 13: Institutions in the 2017 CATEF with no control of student charges, by institutional sector ..... 29
Figure 14: Institutions in the 2017 CATEF with no control of student charges, by state ........................... 29
Figure 15: Institutions required to complete the CATEF, by survey and year ............................................ 33

v
Abstract
Section 132(e) of the Higher Education Act of 1965, as amended (HEA), requires schools with the highest
increases in tuition and fees and net price (cost of attendance after grant and scholarship aid) to explain
to the secretary of education why their costs have gone up and how they will address these rising costs.
Further, the HEA requires the secretary to issue an annual report summarizing the responses provided by
these institutions and outlining the methodology employed to collect and interpret the information.
The 2017 College Affordability and Transparency Explanation Form (CATEF) examined the cost areas
reported by these institutions via the expenses section of the Integrated Postsecondary Education Data
System (IPEDS) Finance component. For the cost areas with the greatest increases, the institutions were
then asked to provide (A) a free-text explanation for the areas in the institution’s budget with the highest
percentage increase in costs; (B) a free-text description of any steps they have taken (or intended to take)
toward reducing costs or the reason for not reducing costs; and (C) evidence of whether student charges
are within the exclusive control of the institution. These responses were then analyzed to determine the
reasons for increases across all cost areas.
The most common increases reported by institutions were in the academic support, student services,
and institutional support cost area and the instruction cost area. Based on the analysis of responses for
all cost areas, the predominant explanations for the cost increases included the addition of staff,
additional resources required due to an increase in enrollment, changes in reporting methodologies,
additional supplies and equipment, and the addition of new programs. Additionally, 81 percent of
institutions indicated having control over their student charges.
While institutions were required to complete the survey due to an increase in tuition and fees and/or net
price, the survey does not request or require institutions to provide an explanation for this increase.
Nevertheless, some institutions chose to include in their responses an explanation of the increase in costs
to students. The reasons given for tuition and fees increases included staying competitive, tuition
restructuring, decreases in state appropriations, and expense increases. The reasons given for the
increases in net price included issues related to the methodology used to calculate net price, cost of living
increases, and errors in reporting.
The 2017 CATC lists were posted in the summer of 2017 for the next CATEF collection in early 2018.

1
1.0 Introduction
Section 132 of the Higher Education Act of 1965, as amended (HEA), requires the secretary of education
to make publicly available, and update annually, a list of the top 5 percent of institutions from each Sector
that have the largest increase, expressed as a percentage change, in tuition and required fees; and a
similar list for institutions with increases in net price (cost of attendance after grant and scholarship aid).
These lists are posted to the College Affordability and Transparency Center1 (CATC) website annually.
Institutions on either list are required to explain to the secretary of education why their costs have gone
up and how they will address these rising costs. The College Affordability and Transparency Explanation
Form (CATEF) was created to collect this information.
The CATEF examined six major cost areas2 based on data reported by these institutions via the Integrated
Postsecondary Education Data System (IPEDS) Finance component: (1) academic support, student
services, and institutional support; (2) auxiliary enterprises; (3) instruction; (4) net grant aid to students /
scholarships and fellowships; (5) other expenses; and (6) research and public service. For the cost areas
with the greatest increases, institutions were required to provide free-text explanations for the increases
in cost and the steps they will take to reduce those costs, and to indicate whether they are in control of
their student charges. The responses were then analyzed to determine the reasons behind the increase
in costs for these institutions.
The HEA also requires the secretary to issue an annual report summarizing the responses provided by
these institutions and outlining the methodology employed to collect and interpret the information.
Accordingly, this summary guide to college costs compiles the responses that institutions on the 2016
CATC list website provided to the U.S. Department of Education (ED) through the online 2017 College
Affordability Transparency Explanation Form (CATEF), and describes ED’s methodology.
1 The College Affordability and Transparency Center (CATC) list can be found at https://collegecost.ed.gov/catc/. 2 Depending on the accounting standards used in the IPEDS Finance component forms, institutions either reported combined expenses for some
cost area categories or reported expenses separately for each cost area. For the purpose of this report, any cost areas that some schools reported as combined have been combined across all institutions for comparability. This is explained further in 2.2.1 Finance Data.

2
2.0 Methodology
2.1 The College Affordability and Transparency Center Lists
Since 2011, in an effort to improve transparency in college tuition prices for potential students and
families, ED has been required to release six lists related to student costs at America’s colleges and
universities. Using data collected by the National Center for Education Statistics (NCES) through the
Integrated Postsecondary Education Data System (IPEDS),3 each list is generated annually and released
via the publicly available CATC website by July 1.
Following are the six annually published CATC lists:
⚫ Highest Tuition and Fees: A list of the 5 percent of institutions from each sector that have the
highest tuition and required fees for the most recent academic year.
⚫ Highest Net Price: A list of the 5 percent of institutions from each sector that have the highest
net price for the most recent academic year.
⚫ Lowest Tuition and Fees: A list of the 10 percent of institutions from each sector that have the
lowest tuition and required fees for the most recent academic year.
⚫ Lowest Net Price: A list of the 10 percent of institutions from each sector that have the lowest
net price for the most recent academic year.
⚫ Highest Increase in Tuition and Fees: A list of the 5 percent of institutions from each sector that
have the largest (percentage) increase in tuition and required fees, expressed as a percentage
change, over the most recent three-year period.
⚫ Highest Increase in Net Price: A list of the 5 percent of institutions from each sector that have
the largest (percentage) increase in net price, expressed as a percentage change, over the most
recent three-year period.
The Highest Increase in Tuition and Fees and Highest Increase in Net Price lists were calculated for
institutions that have full-time, first-time degree/certificate-seeking undergraduate students. Each year,
institutions on the Highest Increase in Tuition and Fees and Highest Increase in Net Price lists are required
to provide additional information concerning college costs through the online CATEF.4 Institutions on both
lists were required to complete a separate CATEF form for each list.
For the 2016 CATC lists,5 315 institutions were identified for having the highest increases in tuition and
fees and 287 institutions were identified for having the highest increases in net price, 40 of which were
on both lists. Due to institution closures and loss of Title IV status, 33 of these institutions (16 from the
3 IPEDS is a mandatory data collection for institutions that participate in, or are applicants for participation in, any Federal student financial aid
program authorized by section 487(a)(17) of the HEA and 34 CFR 668.14(b)(19). More information is available at the IPEDS Website at http://nces.ed.gov/ipeds/. 4 The law includes an exemption from these two lists for any institution whose increase in tuition and fees, or net price, is less than $600 for the
three-year period.
5 The data file used to generate the 2016 CATC lists can be found at https://collegecost.ed.gov/catc/resources/CATClists2014.xlsx.

3
Tuition and Fees CATEF and 19 from the Net Price CATEF, two of which were on both lists) were not
required to complete the CATEF.
2.1.1 Institutional Sectors
The CATC lists are made up of institutions from nine institutional categories, called sectors, which
are based on the institution’s control and level. “Control” is the classification of whether an
institution is operated by publicly elected or appointed officials (public control) or by privately
elected or appointed officials and derives its major source of funds from private sources (private
control). Control categories are public, private not-for-profit, and private for-profit. “Level” is the
classification of whether an institution's programs are mostly four-year or above (four-year), two-
but-less-than four-year (two-year), or less-than-two-year.
Table 1: Nine sectors used to categorize institutions (control, level)
Sector-1 Public, 4-year
Sector-2 Private not-for-profit, 4-year
Sector-3 Private for-profit, 4-year
Sector-4 Public, 2-year
Sector-5 Private not-for-profit, 2-year
Sector-6 Private for-profit, 2-year
Sector-7 Public, less-than-2-year
Sector-8 Private not-for-profit, less-than-2-year
Sector-9 Private for-profit, less-than-2-year
4
2.1.2 IPEDS Data Used in CATC and CATEF
The 2016 CATC lists were generated using data collected during the 2014–15 IPEDS data collection
cycle.6 In IPEDS, tuition and fees are collected through the IPEDS Institutional Characteristics
component for the current year; while net price is collected through the IPEDS Student Financial
Aid component with data from the previous year. Due to this discrepancy, the years used for
generating the data for each list differ.
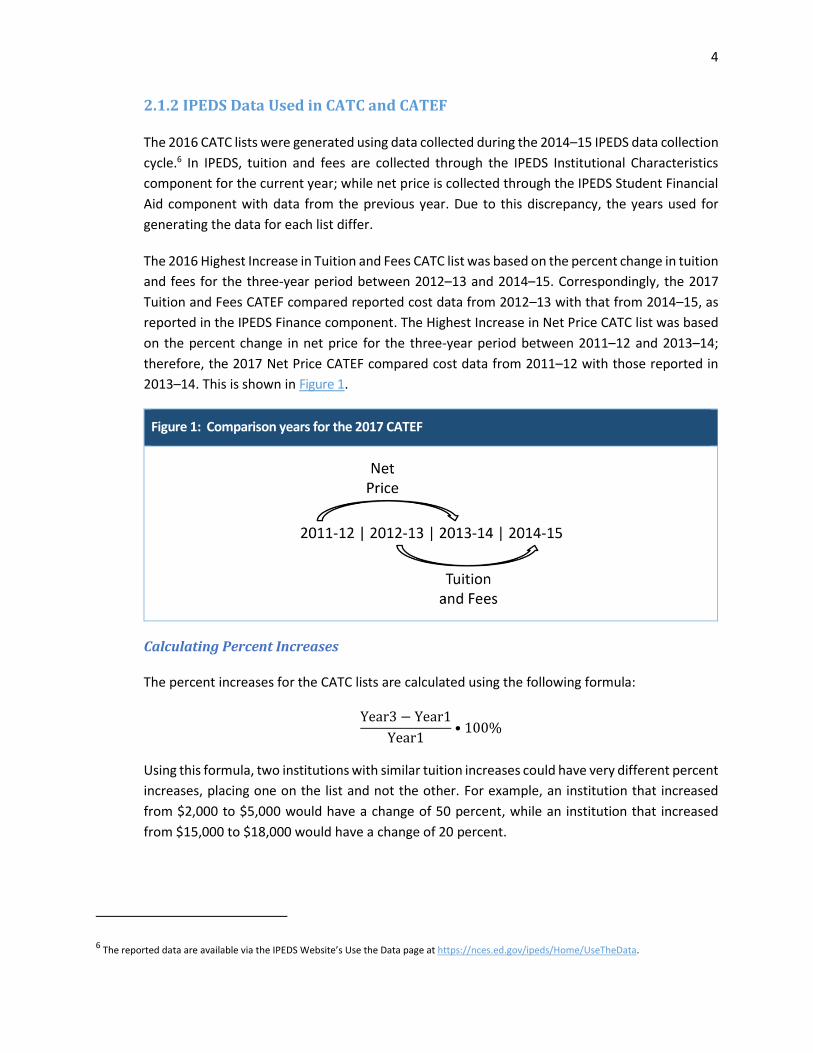
The 2016 Highest Increase in Tuition and Fees CATC list was based on the percent change in tuition
and fees for the three-year period between 2012–13 and 2014–15. Correspondingly, the 2017
Tuition and Fees CATEF compared reported cost data from 2012–13 with that from 2014–15, as
reported in the IPEDS Finance component. The Highest Increase in Net Price CATC list was based
on the percent change in net price for the three-year period between 2011–12 and 2013–14;
therefore, the 2017 Net Price CATEF compared cost data from 2011–12 with those reported in
2013–14. This is shown in Figure 1.
Figure 1: Comparison years for the 2017 CATEF
Calculating Percent Increases
The percent increases for the CATC lists are calculated using the following formula:
Year3 − Year1
Year1• 100%
Using this formula, two institutions with similar tuition increases could have very different percent
increases, placing one on the list and not the other. For example, an institution that increased
from $2,000 to $5,000 would have a change of 50 percent, while an institution that increased
from $15,000 to $18,000 would have a change of 20 percent.
6 The reported data are available via the IPEDS Website’s Use the Data page at https://nces.ed.gov/ipeds/Home/UseTheData.

5
2.1.3 Tuition and Fees
For institutions that charge different tuition and fees for in-district, in-state, or out-of-state
students and report tuition and fees for the full academic year, the CATC lists are based on the in-
state or in-district tuition rate. For institutions that charge by program rather than by academic
year, referred to in IPEDS as “program reporters,” tuition and fees are reported for the
institution’s largest program. These values represent what a typical student would be charged
and may not be the same for all students at an institution.
For institutions on the 2016 CATC Highest Increase in Tuition and Fees list, the percent changes
ranged from a 13 percent increase for a private for-profit, four-year school that raised its tuition
and fees from $13,485 to $15,230, to a 581 percent increase for another private for-profit, four-
year school that raised its tuition and fees from $1,919 to $13,071. The actual 2014–15 tuition
and fees charges to students on the same list ranged from a tuition of $2,550 for a private for-
profit, less-than-two-year school to a tuition of $74,787 for a private for-profit, two-year school.
2.1.4 Net Price
The tuition and fees amount is also included as part of the calculation of the net price. The HEA
defines net price as “the average yearly price of attendance actually charged to first-time, full-
time undergraduate students receiving student aid at an institution of higher education after
deducting such aid.” In IPEDS, the total cost of attendance is the sum of published academic year
costs for tuition and required fees, books and supplies, and the weighted average for room and
board and other expenses by living arrangement. The weighted average is calculated based on
the room and board and other expenses for each living arrangement (on-campus, off-campus with
family, and off-campus not-with-family) and the number of first-time, full-time undergraduate
students reported for each living arrangement. The net price is then generated by subtracting the
average amount of federal, state/local, or institutional grant or scholarship aid from the total cost
of attendance.
For institutions on the 2016 CATC Highest Increase in Net Price list, the percent changes ranged
from a 17 percent increase for a private for-profit, four-year school that raised its net price from
$11,698 to $13,709, to a 4,625 percent increase for another private for-profit, four-year school
that raised its net price from $449 to $21,215. The actual 2013–14 net price charges on the same
list ranged from $1,334 to $46,164.

6
2.2 The CATEF Survey
To aid institutions in complying with the HEA’s requirement to explain why costs have risen at their schools
and how they might reduce those costs, ED established the online CATEF survey.7 Specifically, the 2017
CATEF required institutions on the 2016 Highest Increase CATC lists to provide (A) a free-text explanation
for the cost areas in their budget with the highest percentage increases in costs over the three-year time
period; (B) a free-text description of any steps they have taken (or intend to take) toward reducing costs
or the reason for not reducing costs; and (C) whether student charges were within the exclusive control
of the institution, and if not, the identity of the agency (or agencies) responsible for determining student
charges. In addition, institutions that appeared on the same highest increase list for two or more
consecutive years were asked to explain the progress made on their steps to reduce costs, as reported on
the previous year’s CATEF.8
In order to determine the cost areas in an institution’s budget with the highest percentage increases in
costs over the three-year time period, the expenses portion of the IPEDS Finance component was
displayed and the three cost areas with the highest percent increases over the relevant three-year period
were automatically identified and prepopulated in the CATEF. Though differences exist between the
expense screens of the IPEDS Finance component, as explained further in 2.2.1 Finance Data, six major
cost areas can be identified: (1) academic support, student services, and institutional support; (2) auxiliary
enterprises; (3) instruction; (4) net grant aid to students/scholarships and fellowships; (5) other expenses;
and (6) research and public service.
The “other expenses” value was calculated by deducting the sum of the cost areas from the reported total.
As reported by responses to the CATEF survey, examples of other expenses included new construction,
renovations and maintenance, supplies and equipment, and operational costs.
Institutions that did not report data in the IPEDS Finance component for the first year of the three-year
period were shown their year-three data and asked to self-report up to three cost areas with the highest
increases. This included a total of 39 institutions, 37 on the Tuition and Fees CATEF and four on the Net
Price CATEF, two of which were on both lists. For the 2017 CATEF, the majority of schools on both lists
selected the (1) academic support, student services, and/or institutional support cost area and/or the (3)
instruction cost area as their area of highest increase.
Surveys that were closed or lost their Title IV status were not required to complete the survey, as
explained in 2.2.2 Excluded Responses. Each submitted 2017 CATEF went through a review and approval
process9 to ensure that institutions gave thorough and relevant responses for each required cost area.
The final responses were then evaluated to determine the reasons for the increases in costs.
7 Screenshots of the 2017 CATEF surveys can be found in Appendix IV: 2017 Tuition and Fees CATEF and Appendix V: 2017 Net Price CATEF. 8 A PDF of the previous year’s submission is provided to these institutions. 9 For details on the review and approval process, see Appendix III: CATEF Review Guidelines.

7
2.2.1 Finance Data
Depending on the accounting standards used by the institutions for their IPEDS Finance
component forms, institutions either reported combined expenses for some cost area categories
or reported expenses separately for each cost area. For the purpose of this report, any cost areas
that some schools reported as combined have been combined across all institutions for
comparability. Specifically, this included the combination of academic support, student services,
and institutional support and the combination of research and public service. Additionally, some
forms ask institutions to report net grant aid to students, while others refer to this item as
scholarships and fellowships.10
Additionally, two cost areas available to certain institutions were excluded from this report. The
first, hospital services, is only available to four-year institutions. This cost area was identified as
an area of highest increase for one public, four-year institution. The second, independent
operations, is only available to public, four-year and private not-for-profit, four-year institutions.
Four institutions, one on the Tuition and Fees CATEF and three on the Net Price CATEF, had
independent operations as one of the areas of highest increase.
Another major change occurred in the 2014–15 IPEDS Finance component where cost data is
collected for 2013–14. This change affected reporting for all for-profit institutions (Sector-3,
Sector-6, and Sector-9) on both surveys. A number of changes were made to the Financial
Accounting Standards Board (FASB) forms for for-profit institutions to increase data comparability
across institutional sectors and utility to institutions and decision makers, while also ensuring data
being reported were appropriate for the sector and accurately represent the institutions.
Additional details about this change are available on the Archived Changes11 page of the IPEDS
website. In order to compare the year-one and year-three data for these institutions, fields that
were combined in the 2013–14 data collection and separated in 2014–15 data collection were
combined again for the purpose of identifying the top three increases. Additionally, degree-
granting for-profit institutions began reporting the hospital services expense in 2014–15. Because
there is no comparison to prior years, this expense item was excluded from the form so it would
not be considered one of the greatest increases.
10 Glossary definitions provided to institutions for each of these fields are available in Appendix VI: Glossary of Terms. 11 The Archived Changes page can be found at http://nces.ed.gov/ipeds/InsidePages/ArchivedChanges?year=2014-15.

8
2.2.2 Excluded Responses
Some schools on the CATC lists were not required to complete the CATEF; others had certain
responses excluded due to the uncertainty of the data provided. These scenarios are explained in
detail below.
Closed or No Longer Title IV
A number of institutions in the top 5 percent of their sector for increases were not required to
answer the CATEF surveys due to closure or a lapse in their Title IV status. A total of 47 institutions,
21 from the Tuition and Fees CATEF and 29 from the Net Price CATEF, three of which were on
both lists, were excluded from the results and this report. The number of affected institutions by
sector and survey is displayed in Table 2.
Table 2: Institutions excluded from the 2017 CATEF due to closure or lapse in Title IV status, by
survey and institutional sector
Sector Tuition and Fees Net Price Both
Public, 4-year 0 0 0
Private not-for-profit, 4-year 4 0 0
Private for-profit, 4-year 1 4 1
Public, 2-year 0 2 0
Private not-for-profit, 2-year 0 1 0
Private for-profit, 2-year 8 6 2
Public, less-than-2-year 1 0 0
Private not-for-profit, less-than-2-year 0 0 0
Private for-profit, less-than-2-year 4 13 0
Total 18 26 3 SOURCE: U.S. Department of Education, Office of Postsecondary Education,
2017 College Affordability and Transparency Explanation Form (CATEF)
As shown in Table 2, 84 percent of institutions that closed or had a lapse in their Title IV status
are private-for-profit institutions. Of the 47 institutions considered here, 16 are still active but
no longer Title IV.

9
No Increase
A total of 29 institutions, 19 from the Tuition and Fees CATEF and 11 from the Net Price CATEF,
one of which was on both lists, had responses excluded due to the fact that there was no cost
increase. For institutions with no increases in any cost area over the three-year period, a default
area is selected to give them an opportunity to explain their increases in tuition and fees or net
price, though they are not required to do so. This was the case for 26 of the 30 responses. These
responses were still included in the count of responses, but the default cost area was excluded
from analysis. Any information provided in the additional information field was considered for the
report.
For one Tuition and Fees CATEF, the institution had no year-one data and was required to select
up to three cost areas. One of the three cost areas selected had a $0 expense for year three. This
cost area was excluded from analysis. An additional three institutions had their (five) other
expenses cost area excluded from analysis due to the field being automatically calculated in the
IPEDS component. The increases in other expenses for the three institutions were $0 to $1, $0 to
$2, and $0 to $22. The institutions did not provide explanations for these increases.
These institutions were still included in the count of responses; and while the affected cost areas
were excluded from the analysis, the explanations provided by these schools for the remaining
cost areas and the narrative provided in the additional information field were included in the
report. The number of affected institutions by sector and survey is displayed in Table 3.
Table 3: Institutions with at least one cost area excluded from the 2017 CATEF analysis due to a lack of increase, by survey and institutional sector
Sector Tuition and Fees Net Price
Public, 4-year 0 0
Private not-for-profit, 4-year 4 3
Private for-profit, 4-year 5 2
Public, 2-year 1 1
Private not-for-profit, 2-year 1 0
Private for-profit, 2-year 6 2
Public, less-than-2-year 0 1
Private not-for-profit, less-than-2-year 0 0
Private for-profit, less-than-2-year 2 2
Total 19 11 SOURCE: U.S. Department of Education, Office of Postsecondary Education,
2017 College Affordability and Transparency Explanation Form (CATEF)

10
Reporting Error
An additional group of responses explained the increase in a cost area by citing an error in their
reporting to IPEDS. Some of these institutions did not specify the dollar amount and did not
provide any additional explanation for the cost area. For example, the explanation provided by a
private for-profit, two-year college on the Net Price list explained their $55,486 increase in other
expenses by saying, “There are not increases. In fact, there are decreases in all costs reported.
(sic) The perceived increases resulted from an error in reporting in the 2011–12 cohort." Other
institutions cited an error in the classification of expenses as their explanation for the increase.
These institutions were still included in the count of responses; and while the affected cost areas
were excluded from the analysis, the explanations provided by these schools for the remaining
cost areas and the narrative provided in the additional information field were included in the
report. The number of affected institutions by sector and survey is displayed in Table 4. The totals
below include one count per institution, though many institutions reported an error in more than
one cost areas or survey.
Table 4: Institutions with at least one cost area excluded from CATEF analysis due to an error in reporting, by survey and institutional sector
Sector Tuition and Fees Net Price
Public, 4-year 3 2
Private not-for-profit, 4-year 5 1
Private for-profit, 4-year 0 2
Public, 2-year 4 8
Private not-for-profit, 2-year 1 0
Private for-profit, 2-year 8 6
Public, less-than-2-year 0 3
Private not-for-profit, less-than-2-year 0 0
Private for-profit, less-than-2-year 6 13
Total 27 35 SOURCE: U.S. Department of Education, Office of Postsecondary Education,
2017 College Affordability and Transparency Explanation Form (CATEF)
While most institutions did not provide updated figures, some institutions that reported an error
in their IPEDS data included corrected dollar amounts that still showed an increase over the three-
year period. These institutions were still required to explain their increase and were included in
all areas of the report.

11
3.0 Summary of Results
Of the 567 required 2017 CATEF surveys, a total of 299 institutions were identified on the Highest Increase
in Tuition and Fees CATC list and 268 on the Highest Increase in Net Price CATC list—38 of which were on
both lists.12 This collection year, 100 percent of the institutions required to complete the CATEF did so.
Figure 2: Institutions required to complete a 2017 CATEF form, by survey
SOURCE: U.S. Department of Education, Office of Postsecondary Education,
2017 College Affordability and Transparency Explanation Form (CATEF)
3.1 Demographics
The institutions required to complete the survey came from an array of states and outlying areas, calendar
systems, and sectors. These are explored in detail below.
3.1.1 Locations
When considering all institutions from both CATEF surveys, the majority of schools are found in
Florida, California, Louisiana, Texas, New York, Pennsylvania, Georgia, Michigan, and Ohio, as
shown in Figure 3.
Figure 3: Most represented states in 2017 CATEF
SOURCE: U.S. Department of Education, Office of Postsecondary Education, 2017 College Affordability and Transparency Explanation Form (CATEF)
12 The data file containing all institutional responses to the CATEF surveys is available at
http://collegecost.ed.gov/catc/resources/2017_CATEF_Responses.xlsx.

12
Based on the 2014–15 IPEDS collection, from which the CATC lists are derived, the majority of
institutions participating in Title IV programs are located in California, New York, Texas, Florida,
Pennsylvania, Ohio, Illinois, Missouri, North Carolina, Michigan, Massachusetts, and Tennessee.
The majority of institutions on the Tuition and Fees CATEF were in Louisiana, Florida, California,
New York, Texas, Pennsylvania, and Georgia. For the Net Price CATEF, the majority of institutions
were in Florida, Texas, California, Georgia, Louisiana, Michigan, North Carolina, Pennsylvania,
Ohio, and Oklahoma.
As shown in Table 5, the states with a higher representation of schools in IPEDS are also likely to
represent the majority on one or both of the CATEF lists. Notably, Georgia, Louisiana, and
Oklahoma are found on the CATEF lists but are not part of the IPEDS majority. Additionally, Illinois,
Massachusetts, and Missouri represent a large portion of IPEDS institutions but are not found on
either CATEF list.
Table 5: States with a higher representation of schools in IPEDS and/or Tuition and Fees or Net Price CATEF
State IPEDS Tuition and Fees CATEF Net Price CATEF
California X X X
Florida X X X
Georgia X X
Illinois X
Louisiana X X
Massachusetts X
Michigan X X
Missouri X
New York X X
North Carolina X X
Ohio X X
Oklahoma X
Pennsylvania X X X
Texas X X X Note: Marked states contain at least 50 percent of all institutions within the survey.
SOURCES: U.S. Department of Education, Office of Postsecondary Education, 2017 College Affordability and Transparency Explanation Form (CATEF); and
U.S. Department of Education, National Center for Education Statistics (NCES), 2014–15 Integrated Postsecondary Education Data System (IPEDS), “Institutional Characteristics Header” component

13
3.1.2 Calendar System
In IPEDS, institutions can be considered “academic reporters” or “program reporters” based on
their calendar system. “Academic reporters” include those whose predominant calendar system
is semester, quarter, or trimester. “Program reporters” may have a calendar system that differs
by program or enrolls on a continuous basis. Generally speaking, many program reporters are
career and vocational institutions. As shown in Figure 4, the proportion of institutions required to
complete the CATEF survey is similar to the national representation in IPEDS.
Figure 4: Proportion of institutions required to complete the CATEF and IPEDS, by academic
reporters and program reporters
SOURCES: U.S. Department of Education, Office of Postsecondary Education, 2017 College Affordability and Transparency Explanation Form (CATEF); and
U.S. Department of Education, National Center for Education Statistics (NCES), 2014–15 Integrated Postsecondary Education Data System (IPEDS), “Institutional Characteristics” component
SOURCE: U.S. Department of Education, National Center for Education Statistics (NCES),
2014–15 Integrated Postsecondary Education Data System (IPEDS), “Institutional Characteristics” component
58%
42%
CATEF
Academic Reporters Program Reporters
63%
37%
IPEDS
Academic Reporters Program Reporters
14
3.1.3 Sector
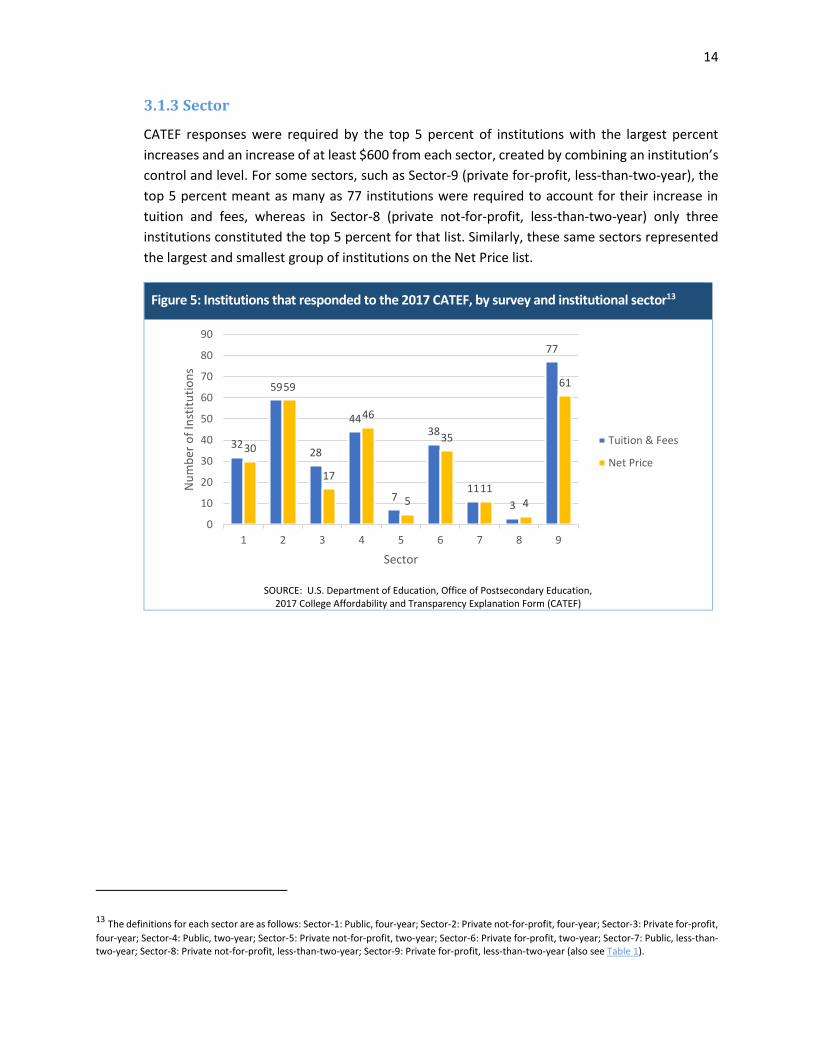
CATEF responses were required by the top 5 percent of institutions with the largest percent
increases and an increase of at least $600 from each sector, created by combining an institution’s
control and level. For some sectors, such as Sector-9 (private for-profit, less-than-two-year), the
top 5 percent meant as many as 77 institutions were required to account for their increase in
tuition and fees, whereas in Sector-8 (private not-for-profit, less-than-two-year) only three
institutions constituted the top 5 percent for that list. Similarly, these same sectors represented
the largest and smallest group of institutions on the Net Price list.
Figure 5: Institutions that responded to the 2017 CATEF, by survey and institutional sector13
SOURCE: U.S. Department of Education, Office of Postsecondary Education,
2017 College Affordability and Transparency Explanation Form (CATEF)
13 The definitions for each sector are as follows: Sector-1: Public, four-year; Sector-2: Private not-for-profit, four-year; Sector-3: Private for-profit,
four-year; Sector-4: Public, two-year; Sector-5: Private not-for-profit, two-year; Sector-6: Private for-profit, two-year; Sector-7: Public, less-than-two-year; Sector-8: Private not-for-profit, less-than-two-year; Sector-9: Private for-profit, less-than-two-year (also see Table 1).
32
59
28
44
7
38
11
3
77
30
59
17
46
5
35
114
61
0
10
20
30
40
50
60
70
80
90
1 2 3 4 5 6 7 8 9
Nu
mb
er o
f In
stit
uti
on
s
Sector
Tuition & Fees
Net Price
15
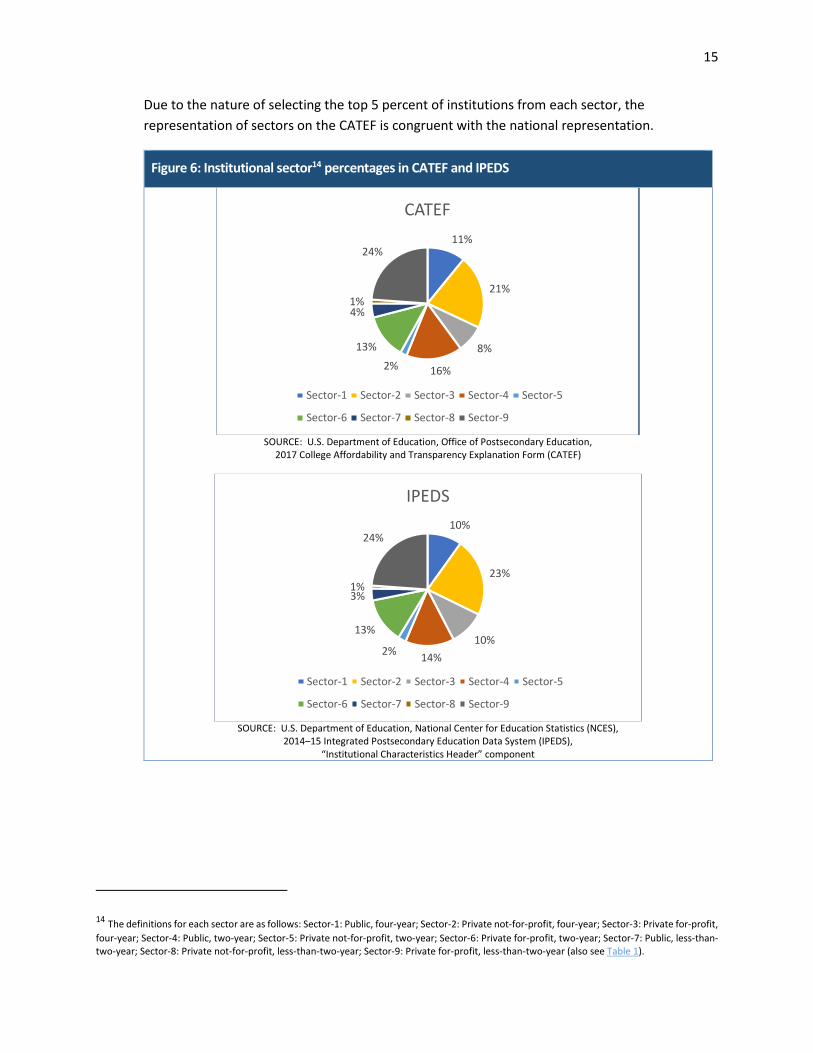
Due to the nature of selecting the top 5 percent of institutions from each sector, the
representation of sectors on the CATEF is congruent with the national representation.
Figure 6: Institutional sector14 percentages in CATEF and IPEDS
SOURCE: U.S. Department of Education, Office of Postsecondary Education,
2017 College Affordability and Transparency Explanation Form (CATEF)
SOURCE: U.S. Department of Education, National Center for Education Statistics (NCES),
2014–15 Integrated Postsecondary Education Data System (IPEDS), “Institutional Characteristics Header” component
14 The definitions for each sector are as follows: Sector-1: Public, four-year; Sector-2: Private not-for-profit, four-year; Sector-3: Private for-profit,
four-year; Sector-4: Public, two-year; Sector-5: Private not-for-profit, two-year; Sector-6: Private for-profit, two-year; Sector-7: Public, less-than-two-year; Sector-8: Private not-for-profit, less-than-two-year; Sector-9: Private for-profit, less-than-two-year (also see Table 1).
11%
21%
8%
16%2%
13%
4%1%
24%
CATEF
Sector-1 Sector-2 Sector-3 Sector-4 Sector-5
Sector-6 Sector-7 Sector-8 Sector-9
10%
23%
10%
14%2%
13%
3%1%
24%
IPEDS
Sector-1 Sector-2 Sector-3 Sector-4 Sector-5
Sector-6 Sector-7 Sector-8 Sector-9
16
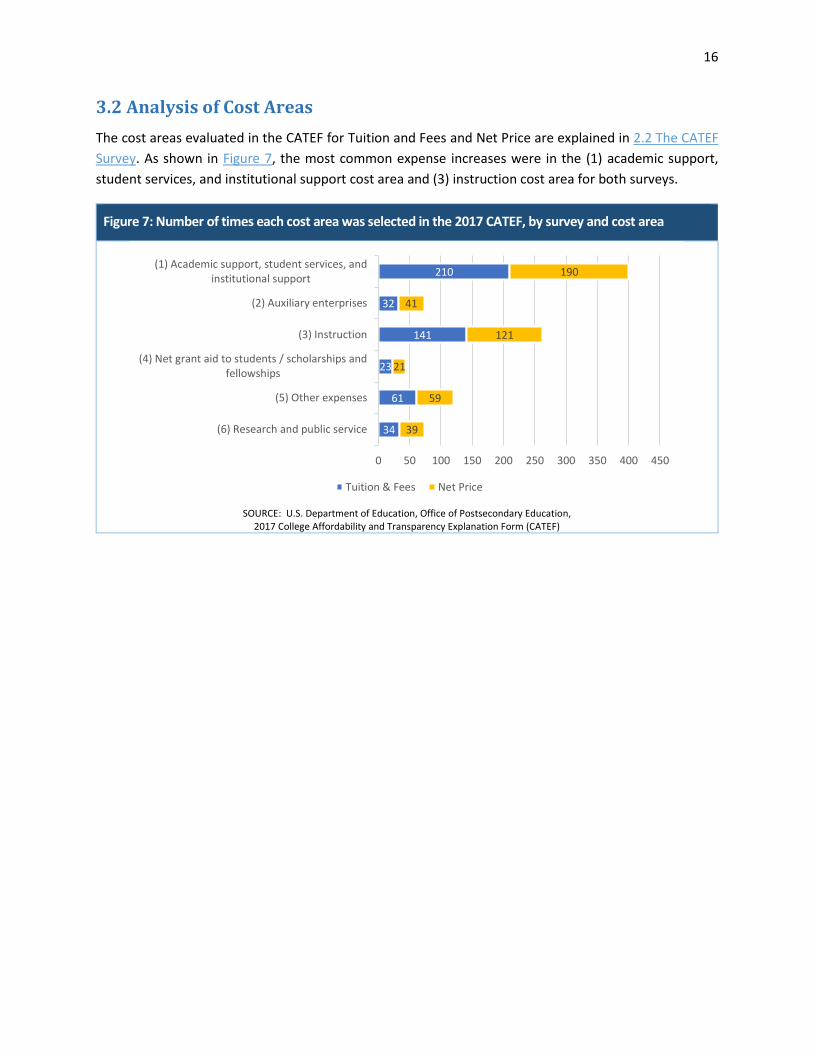
3.2 Analysis of Cost Areas
The cost areas evaluated in the CATEF for Tuition and Fees and Net Price are explained in 2.2 The CATEF
Survey. As shown in Figure 7, the most common expense increases were in the (1) academic support,
student services, and institutional support cost area and (3) instruction cost area for both surveys.
Figure 7: Number of times each cost area was selected in the 2017 CATEF, by survey and cost area
SOURCE: U.S. Department of Education, Office of Postsecondary Education,
2017 College Affordability and Transparency Explanation Form (CATEF)
34
61
23
141
32
210
39
59
21
121
41
190
0 50 100 150 200 250 300 350 400 450
(6) Research and public service
(5) Other expenses
(4) Net grant aid to students / scholarships andfellowships
(3) Instruction
(2) Auxiliary enterprises
(1) Academic support, student services, andinstitutional support
Tuition & Fees Net Price

17
The median percent change increases for each cost area are shown in Table 6. The medians do not include
institutions with no expense data in the first year of the three-year period since their percent increases
cannot be calculated.15 The highest median percent changes were found in the (5) other expenses cost
area and the (6) research and public service cost area for both surveys.
Table 6: Median cost area percent change in the 2017 CATEF, by survey and cost area
Cost Area Tuition and Fees Net Price
(1) Academic support, student services, and institutional support
24% 27%
(2) Auxiliary enterprises 28% 19%
(3) Instruction 19% 26%
(4) Net grant aid to students / scholarships and fellowships
24% 61%
(5) Other expenses >100% >100%
(6) Research and public service 82% 74% Note: Median excludes institutions with no data for Year-1
SOURCE: U.S. Department of Education, Office of Postsecondary Education,
2017 College Affordability and Transparency Explanation Form (CATEF)
While the FTE enrollment numbers are not collected via the CATEF, they are preloaded as a reference
from the IPEDS 12-month Enrollment component. When considering the percent change per FTE, there
are some differences, but the highest median percent changes still occur in the same cost areas. This is
shown in Table 7.
Table 7: Median cost area percent change per FTE in the 2017 CATEF, by survey and cost area
Cost Area Tuition and Fees Net Price
(1) Academic support, student services, and institutional support
25% 37%
(2) Auxiliary enterprises 35% 25%
(3) Instruction 15% 31%
(4) Net grant aid to students / scholarships and fellowships
34% 66%
(5) Other expenses >100% >100%
(6) Research and public service 100% 87% Note: Median excludes institutions with no data for Year-1
SOURCE: U.S. Department of Education, Office of Postsecondary Education,
2017 College Affordability and Transparency Explanation Form (CATEF)
15 For more information on the percent increase calculations, see Calculating Percent Increases.

18
Similarly, the median dollar increases for each cost area are shown in Figure 8. The medians do not
include institutions with no expense data in the first year of the three-year period since the dollar
increase cannot be calculated. The highest median dollar increases were found in the (2) auxiliary
enterprises cost area and the (5) other expenses cost area.
Figure 8: Median cost area dollar increases in the 2017 CATEF, by survey and cost area
Note: Median excludes institutions with no data for Year-1
SOURCE: U.S. Department of Education, Office of Postsecondary Education, 2017 College Affordability and Transparency Explanation Form (CATEF)
When considering the percent change per FTE, the cost areas with the largest dollar increases are (3)
instruction and (5) other expenses. This is shown in Figure 9.
Figure 9: Median cost area dollar increases per FTE in the 2017 CATEF, by survey and cost area
Note: Median excludes institutions with no data for Year-1
SOURCE: U.S. Department of Education, Office of Postsecondary Education, 2017 College Affordability and Transparency Explanation Form (CATEF)
$108,560
$378,814
$195,945
$296,289
$209,958
$310,024
$81,380
$304,513
$264,198
$307,060
$462,485
$282,624
$0 $200,000 $400,000 $600,000 $800,000
(6) Research and public service
(5) Other expenses
(4) Net grant aid to students / scholarships and…
(3) Instruction
(2) Auxiliary enterprises
(1) Academic support, student services, and…
Tuition & Fees Net Price
$111$449
$300
$688
$357
$441
$78
$1,221
$402
$1,085
$419
$608
$0 $200 $400 $600 $800$1,000$1,200$1,400$1,600$1,800$2,000
(6) Research and public service
(5) Other expenses
(4) Net grant aid to students / scholarships and…
(3) Instruction
(2) Auxiliary enterprises
(1) Academic support, student services, and…
Tuition & Fees Net Price

19
3.3 Explanations of Increased Cost
As explained in 2.2 The CATEF Survey, responses were required to include a free-text explanation of the
increase in each of the selected cost areas. These explanations were analyzed to provide some insight
into the reason for increases in overall costs at the institution and then placed into one or more
categories. The categories referenced the most across all cost areas and in the additional information
field were determined to be the top reasons given for the increases in cost. This is displayed in Figure
10. The explanations given for each of the top categories are explored further below.
Figure 10: Top reasons given for increases in each cost area on the 2017 CATEF, by survey
SOURCE: U.S. Department of Education, Office of Postsecondary Education,
2017 College Affordability and Transparency Explanation Form (CATEF)
3.3.1 Staff, Benefits, and Salaries and Wages
The top reason for increases across all cost areas was reportedly the hiring of staff. Explanations
provided for increases in staffing included enrollment gains, the addition of various student
services, the maintenance of federal or accreditation compliance standards, and expanded
program offerings.
Many institutions stated that rising enrollment led to the need for additional staff and resources.
For example, the spokesperson from a private for-profit, less-than-two-year barber college in
California said, “We have added staff and increased the amount of resources allocated to student
services. We have had to keep up with a rising enrollment as well as provide better services for
our students.”
Compliance requirements for Title IV and accreditation also led to additional staff for some
schools. According to a private for-profit, less-than-two-year medical academy in California, “The
number of support staff grew because in this time period, we reorganized, added staff in
compliance, retention and career [services] and managed to complete our national accreditation
0 50 100 150 200 250 300 350
Added Staff
Increased Enrollment
Salaries and Wages
Change in Reporting Methodology
Benefits
Purchased Supplies/Equipment
Added Programs
Tuition and Fees Net Price

20
successfully (2013) and Title IV approval (2014).” Overwhelmingly, the reasons that necessitated
the need for additional staff can be viewed as a positive result of increased enrollment, new
program or course offerings, or added services for students.
On the other hand, increased staffing was associated with higher salary outlays and an increased
benefits expense. Of the institutions that included additional staff as a reason for their increase,
27 percent also reported salaries and wages and/or benefits as a reason. As the representative
from a four-year, private for-profit college in Puerto Rico explained, “The increase in the salary
entry of 39% is due to the implementation of new specialized associate degree programs in the
allied health field. These programs require for faculty to be specialized in their field of study, in
order to recruit these professionals a salary match has to be done to compete with what they
would earn in the field (hospitals and medical offices).” Additionally, the spokesperson from a
public, four-year college in Colorado noted, “The higher percentage increase for full-timers is due
to the accelerated rate at which health benefits increase each year.”
3.3.2 Increased Enrollment
While gains in enrollment were cited as the cause of increased expenses, they were also cited as
the desired effect of the increases in expenses. Institutions noted that while rising enrollment
raised expenses it has allowed them to expand services or programs. According to the public, four-
year school in Georgia quoted earlier, “Providing our students with services that will ensure their
success is critical to the institution. As our enrollment continues to grow due to larger-scale
programs such as the highly publicized (and affordable) Online Master of Science in Computer
Science, [our school] will enable its students to take advantage of these services that are
population-specific (veterans, first-generation students, community involvement, etc.) to ensure
a positive experience from any place in the world.”
The response from a private for-profit, two-year beauty school in Idaho explained how the
$159,326 increase in other expenses was the cause of their increased student enrollment and
upgrades. They said, “[We] purchased an existing school in late 2012. The previous owners had
not kept up with the location. Most of the equipment was dated and not in working order. The
school only had two licensed instructors that also doubled as administration. The new owners
moved the school to a more modern location with working equipment, [and] hired more trained
staff. These upgrades made this school a more desirable choice and in turn increased our
enrollment. This provided a better learning environment and instruction.”
Increased enrollment was given as an explanation for increases in many different cost areas.
When increased enrollment was indicated as a reason, it was in combination with another reason
84 percent of the time. For example, one response indicated that additional staff were required
as a result of increased enrollment. Another example given indicated that increased enrollment
led to increases in supplies, kits and educational wages. The representative from a public, two-
year technical college in Florida said, “The increase of enrollment over the past three years
requires an increase in personnel, resources, and equipment.”

21
In addition to changes in staff and supplies and equipment, the enrollment increases reportedly
required additional services and resources for the increased student population. The
spokesperson from a public, four-year institution in Georgia said, “While [our] FTE rose by 788
students, there were nearly 1,000 more students enrolled in FY2014 than in FY2012. Services for
mental health, career development, student integrity, veterans, first-generation students and
other provisions were enhanced to accommodate the increase in enrollment.”
Several institutions noted that that while overall costs have increased, the full-time equivalent
(FTE) expense has remained stable or even decreased as a result of achieving economies of scale.
Twelve percent of institutions had a negative increase or no increase in their percent changes per
FTE. For example, the spokesperson from a private not-for-profit, four-year university in Florida
said, “Costs in [academic support] have grown in proportion to the increases that have been
experienced in enrollment numbers.” This university, like many others, does not believe that a
reduction in the indicated costs area is required; they state that, “The university does continually
strive to create efficiencies by ensuring that technology is being leveraged in library resource,
thereby reducing the reliance upon printed materials. However, in its efforts to ensure that tools
and helps, such as needed library resources, tutoring, and remedial educational efforts, are
available to the university's students, the university does not believe that this is a prudent area to
make any sharp reductions in cost. Therefore, it is anticipated that costs for academic support will
continue to increase in proportion to the student population.”
Of the institutions required to complete the 2017 CATEF, the majority of institutions on each
survey had increases in their reported FTE enrollment numbers. Of the institutions with increases
in their FTE enrollment, the median increase for the Tuition and Fees CATEF was 52 FTE students,
and the median increase for the Net Price CATEF was 56 FTE students.

22
Figure 11: Differences in FTE student enrollment for institutions required to complete the 2017 Tuition and Fees CATEF
SOURCE: U.S. Department of Education, Office of Postsecondary Education,
2017 College Affordability and Transparency Explanation Form (CATEF); and
U.S. Department of Education, National Center for Education Statistics (NCES),
Integrated Postsecondary Education Data System (IPEDS), “12-month Enrollment” component
Figure 12: Differences in FTE student enrollment for institutions required to complete the 2017 Net Price CATEF
SOURCE: U.S. Department of Education, Office of Postsecondary Education,
2017 College Affordability and Transparency Explanation Form (CATEF); and
U.S. Department of Education, National Center for Education Statistics (NCES),
Integrated Postsecondary Education Data System (IPEDS), “12-month Enrollment” component
51%
37%
12%
Increase in FTE enrollment betweenYear-1 and Year-3
Decrease (or no increase) in FTEenrollment between Year-1 andYear-3
62%
37%
1%
Increase in FTE enrollment betweenYear-1 and Year-3
Decrease (or no increase) in FTEenrollment between Year-1 andYear-3
23
3.3.3 Changes to Reporting Methodology
Many institutions stated that their increase in a certain cost area was not due to actual dollar
increases but to a change in how the dollar amounts were collected or reported to IPEDS. For
example, the spokesperson from a public, two-year applied technology school in Tennessee
explained that “The difference in instruction is due to a change of reporting methodology for
operation and maintenance of plant that was effective FYE 14.” They stated that they will be
consistent in their reporting method moving forward.
The spokesperson from a public, four-year college in Virginia indicated that their large increase in
other expenses was due to the handling of one-time expenses. They said, “The growth in
expenditures between FY13 and FY15 reflected several one-time actions related to changes in the
handling of expenses attributed to the university’s art museum and a change in methodology
related to expenses for the university’s intellectual property foundation. FY16 figures will show
that costs in this category have moderated and are actually below FY13 levels.”
Another scenario was specified by a public, two-year college in California with increases in
instruction and academic support that reported, “The increase was due to an update in the
allocation method to more accurately reflect the higher enrollment at the Lemoore campus
compared to the Coalinga campus within the same district.” They continued to say, “The district
makes periodic allocation adjustments to reflect a multi-college district accounting structure. No
additional changes have been identified as these adjustments are not passed through to the
student cost of education.”

24
3.3.4 Purchased Supplies and Equipment
As well as the relationship supplies and equipment have to enrollment, as outlined in 3.3.2
Increased Enrollment, increases in costs were also attributed to the need for additional supplies
and equipment to keep up with industry standards, or the increase in cost for supplies required
by the program. For example, the representative from a private for-profit, less-than-two-year
beauty school in Indiana said, “The institution needed to bring the curriculum, technical and
consumable supplies, educator talent, facilities, and equipment up to industry standards to best
prepare graduates for their State licensing exams. As a result, the cost of education increased to
cover the expenses associated with educating students.”
Schools also associated the increase in supplies and equipment with the need to stay competitive.
The spokesperson from a public, two-year technical college in Florida also said, “With inflation,
equipment and resources' prices increase (sic); still we have to provide quality tools and
equipment to offer effective training for our students to become competitive in the global
market.”
Generally, speaking, supplies and equipment costs included student kits, books, computers and
other technology investments, educational software, learning and business management
software, vehicles, and start-up costs for launching new programs, campuses and buildings.

25
3.3.5 Added Programs
Another reason commonly given for increases in expenses was the addition or expansion of
programs. According to the response from a public, four-year college in Colorado, “During these
particular years [our] new bachelor programs were really getting off the ground. As a result, there
was a substantial increase in FTE and spending for our B.A. in Sustainability Studies program, and
we launched our new B.S. in Nursing. These increases totaled new spending of $450,000 relative
to FY2012.”
A private for-profit, four-year medical institute in Arizona spoke to the cost of new programs that
are offered via distance education. They said, “In review of the historical data for [one] campus,
it appears the 28% increase in the instruction category is primarily due to a change in educational
offerings and degree scope. The campus began offering five Bachelor of Science degree programs
in 2011–2013. Given that the new programs were developed and offered fully via distance
education, prior to inception the institution thoughtfully and carefully invested in the Learning
Management System (LMS) to deliver sound education, ensured appropriate structures were in
place within the platform itself to provide an adequate experience for both faculty and students,
and ensured education resources were sufficient. With the programs being delivered fully online,
there are additional costs associated with the platform such as securing adequate bandwidth,
server space, and required systems to comply with governing bodies.”
The addition of new programs also requires hiring new staff and faculty. The representative from
a private not-for-profit, four-year university of health sciences in Florida said, “The ramping up of
four new graduate programs is the primary driver for the increase in instruction. Hiring of new
faculty to support the new programs significantly increased instruction.” Similarly, a public, two-
year technical college in Florida reported, “We have added new programs which increases the
staffing to support the new programs. The net price increase does not affect the increase in staff.”
While these explanations give insight into some common reasons for the increases in expenses,
many institutions consider the expense increases related to each of these areas as the cost of
doing business. Increased enrollment leads to the need for additional staff, supplies, equipment,
and program offerings. In turn, additional staff are required when enrollment increases, new
programs are added, and additional student services are provided. There are also expected
increases in wages, benefits, and supplies due to inflation. The response from a private not-for-
profit, four-year university in Florida summed this up by saying, “The university has experienced
an increase in total enrollment from 2,703 to 3,834 students during this period, a 42% increase.
Based upon this growth in enrollment, comparable increases in the number of faculty and class
sessions offered were needed to meet the educational delivery needs for this population. Further,
the university has continued to offer new programs each year that have necessitated new faculty,
development costs of these new programs, and additional library resources.”

26
3.4 Steps for Reducing Costs
In addition to providing explanations for why certain costs have risen at their schools, institutions were
required to list steps for reducing those costs. For 87 percent of responses to both CATEF surveys,
institutions specified no plan to reduce costs. For the institutions that indicated a plan to reduce costs,
examples included changes to staffing, eliminating underperforming programs, finding ways to make
current course offerings more efficient, renegotiating contracts, becoming more energy efficient, and
streamlining operations. These are explored further below.
As staffing was cited as the number one reason for increased expenses, staffing changes also composed
the top steps cited for reducing costs. The proposed changes included reducing staff, eliminating
positions, freezing hiring, not filling vacancies, offering early retirement incentives, and shifting to part-
time or adjunct staff. For example, the representative from a public, two-year technical college in Florida
said, “The school has seen a trend of increased enrollment which requires the hiring of new employees.
In an effort to reduce costs, the school has made every effort to hire part-time employees instead of full-
time. Such decision has almost [cut] expenses for new employees in half. In addition, whenever a full-time
employee retires, he [or] she is replaced by a part-time employee if possible.”
Some institutions indicated that they intend to eliminate underperforming programs. An example of this
comes from a representative of a public, four-year university in Alabama who said, “With the new
leadership onboard, the university plans to eliminate four low producing programs and eliminate
duplication of programs and focus on growth programs that can help promote economic development in
the region.” A private not-for-profit, four-year university in Florida spokesperson said, “The university will
evaluate the viability of its new graduate programs, and may suspend and/or eliminate graduate programs
which do not have the enrollment necessary to justify continued expenditures."
Some institutions also indicated that they intend to achieve efficiencies through more efficient course
scheduling and larger class sizes. For example, the spokesperson from a private for-profit, four-year
university in California said, “The costs have been driven down as the institution focused on increasing
the class sizes with less diversified course offerings. Additionally, courses have not been offer[ed] every
session and they are scheduled based upon student needs to optimize instructional costs. We have
continued to drive down the instructional costs by appropriately managing our full-time faculty costs in
relation to the students count in the programs and utilizing adjunct faculty as necessary. During calendar
year 2015, the institution had a reduction in force to adequately right size the faculty headcount with the
teaching loads.”
Other institutions indicated they will be renegotiating contracts with vendors and/or third-party servicers.
The representative from a public, two-year college in Illinois said, “[The] College is doing everything in its
power to maintain low costs which includes strict budgetary controls, streamlining of operations
identifying and implementing potential savings and negotiating contracts. However, some expenses are
beyond our control such as rising health insurance, services, and costs.” Additionally, a private for-profit,
less-than-two-year career college with multiple campuses in Tennessee said, “[The school] was able to

27
negotiate vendor costs and streamline payroll to lower the overall cost to students. The change also
resulted from a dramatically reduced FTE over a 3 year span.”
A few institutions had plans in place to become more energy efficient. For example, the representative
from a public, 2two-year college in Michigan stated that “The college manages facility energy usage with
a temperature control system to keep costs down. In addition, the College actively reviews natural gas
market pricing to lock in favorable natural gas rates for the College to keep energy costs in line.” Another
example comes from a four-year, private not-for-profit college in Tennessee spokesperson who said, “The
college has installed energy-saving measures in our student housing such as LED lighting fixtures and
water reduction fixtures. Additionally, we hope that our food costs will stabilize. With the intentional
switch to a higher quality of food, we should not continue to see the same increases there.”
The remaining institutions had various plans in place to achieve operational efficiencies through
consolidation and streamlining operations. For example, the spokesperson from a public, two-year
community college in Massachusetts said, “We are continuously creating efficiencies to try and better
consolidate student support services while ensuring student services are not compromised. Since this
report our enrollment has declined a little so we would expect to see some decrease in costs related to
student services.” As reported from another community college in Louisiana, “The College continues to
streamline operations, increase operational efficiencies, and reduce costs as it can without sacrificing the
quality of instructional services and regulatory compliance. We also continue to explore opportunities for
participation in shared services with other institutions, both within and outside of [the College] System
and with other institutions.” Another representative from a public, four-year university in Arkansas said,
“In order to improve efficiencies, the university realigned and merged colleges in order to streamline
processes and to curtail administrative costs.”
3.4.1 Progress on Cost Reduction
Institutions that completed the same CATEF survey for two consecutive years were asked to discuss their
progress on reducing their costs. Of the 106 responses to the Tuition and Fees CATEF and 74 responses to
the Net Price CATEF that were on the same CATC list for two consecutive years, 77 institutions indicated
that they made progress, nine institutions indicated that they did not make progress, and 94 institutions
did not identify any plans to reduce costs in the previous year’s survey. Many of the institutions that
reported progress in the reduction of cost neglected to identify specific steps that led to the reduction.
Some of the institutions that indicated no plans to reduce costs noted that reporting errors led to their
inclusion on the previous year’s list. For example, the representative from a private not-for-profit, four-
year school in New York stated, “[The school] has actually held its tuition constant for two-year intervals
for the past four years. Tuition is the same in 2016–17 as it was in 2015–16. In 2015–16, tuition increased
by 6.2% over 2014–15. The 2014–15 tuition was the same as 2013–14. [It] has appeared on the Tuition
and Fees list for two plus years because of a change in how we were reporting tuition on the IPEDS Student
Financial Aid (SFA) Survey. We moved from using a 24-credit tuition total to 30 credits, and then back to
the old method of 24 credits." Due to the unique nature of the steps reported in previous years, a trend
could not be observed based on the responses provided.

28
3.5 Control of Student Charges
Institutions were also asked whether student charges (tuition and fee rates) are in the exclusive control
of the institution. Those that answered “no” were asked to identify the agencies responsible for
determining increases and to provide an explanation of the extent to which the institution participates in
that determination.
Table 8: Control of student charges on the 2017 CATEF, by survey
Are student charges (tuition and fee rates) within the exclusive control of
the institution? Tuition and Fees Net Price Both
Yes 242 220 33
No 57 48 5 SOURCE: U.S. Department of Education, Office of Postsecondary Education,
2017 College Affordability and Transparency Explanation Form (CATEF)
Of the institutions required to complete the CATEF, 19 percent indicated that they did not control the
setting of tuition and fees. The agencies responsible for determining the tuition and fee increases included
specific community college systems, governing boards, and state legislatures. Others indicated their
university systems office or explained that they advise the state higher education board to increase their
tuition and fees after analysis of their financial data. Two responses included institutions that insisted
tuition and fees were not within their control due to having no control over third party costs.16
Of the 100 institutions that reported they did not have control over student charges, 44 of these
institutions were on the list for two or more consecutive years.
16 For the full list of reported governing bodies for institutions that do not set their own tuition and fees, see the data file containing all
institutional responses to the CATEF survey. This file is available at http://collegecost.ed.gov/catc/resources/2017_CATEF_Responses.xlsx.

29
As shown in Figure 13, 95 percent of institutions with no control over student charges were public
institutions. The majority of public institutions on the CATEF reported no control over student charges.
Figure 13: Institutions in the 2017 CATEF with no control of student charges, by institutional sector17
SOURCE: U.S. Department of Education, Office of Postsecondary Education,
2017 College Affordability and Transparency Explanation Form (CATEF)
The majority of institutions with no control over their student charges were from Louisiana, Georgia,
Florida, and North Carolina, as shown in Figure 14. As noted in 3.1.1 Locations, Florida, Louisiana, and
Georgia were also included among the most represented states.
Figure 14: Institutions in the 2017 CATEF with no control of student charges, by state
SOURCE: U.S. Department of Education, Office of Postsecondary Education,
2017 College Affordability and Transparency Explanation Form (CATEF)
17 The definitions for each sector are as follows: Sector-1: Public, four-year; Sector-2: Private not-for-profit, four-year; Sector-3: Private for-profit,
four-year; Sector-4: Public, two-year; Sector-5: Private not-for-profit, two-year; Sector-6: Private for-profit, two-year; Sector-7: Public, less-than-two-year; Sector-8: Private not-for-profit, less-than-two-year; Sector-9: Private for-profit, less-than-two-year (also see Table 1).
Sector-1
Sector-2
Sector-4
Sector-5
Sector-6Sector-7 Sector-8 Sector-9
AL AR CA
CO
FL
GA
ID
ILKYLA
MAMD
MI
MO
NCNMNY
OKOR
PA
RI
TNTX
UTVA WA WV
AL AR CA CO FL GA ID IL KY
LA MA MD MI MO NC NM NY OK
OR PA RI TN TX UT VA WA WV

30
3.6 Burden Estimate
Finally, institutions were asked if the estimated burden of 3.5 hours for the survey was found to be
accurate. By default, this was set to “yes,” and 331 institutions (63 percent) did not change the response.
The average of all responses to this question for both surveys was 3.27 hours.
Of the 201 institutions that changed their response to “no,” 73 percent of responses reported a number
lower than the original burden estimate of 3.5 hours. The provided burden estimates ranged from 0.25
hours from a private for-profit, less-than-two-year institution to 30 hours from a public four-year
institution. Of the 12 institutions that entered a burden estimate of 10 or more hours, nine were four-
year schools.
Table 9: Average reported burden in hours, by survey and institutional sector
Sector Tuition and Fees Net Price
Public, 4-year 6.10 3.72
Private not-for-profit, 4-year 3.24 3.97
Private for-profit, 4-year 3.15 3.14
Public, 2-year 3.99 3.63
Private not-for-profit, 2-year 4.20 3.50
Private for-profit, 2-year 2.63 2.64
Public, less-than-2-year 3.50 2.77
Private not-for-profit, less-than-2-year 3.13 1.83
Private for-profit, less-than-2-year 2.42 2.21 SOURCE: U.S. Department of Education, Office of Postsecondary Education,
2017 College Affordability and Transparency Explanation Form (CATEF)

31
4.0 Increases in Tuition and Fees and Net Price
Though the initial reasons for the increases in tuition and fees and net price that relegated institutions to
the college affordability lists and required them to complete the CATEF survey were not directly explored
in the survey questions, many institutions spoke specifically to their increase in student costs while
responding.
One reason for tuition increases included raising the tuition to be more in-line with similar schools and to
stay competitive. For example, the spokesperson from a private for-profit, less-than-two-year beauty
school in Arkansas said, “[We] increased [our] tuition to [be]come more equivalent to other schools and
we now offer students loans to help cover the increase. [Our school] for 20 years [has] been significantly
below the average charge for cosmetology school in the south. Our administration was encouraged to
increase our tuition.” Similarly, the representative from a private not-for-profit, four-year funeral service
school in Indiana said, “The increase of tuition charges throughout this time period was from a per quarter
standpoint - from $3,500 to $3,700 a 5% increase of tuition - this adjustment was made to ensure industry
competitiveness.” The response from a public, two-year technical college in Louisiana stated, “Our
institution has merged with [a] Community College and in doing so, our tuition has increased to match
the tuition of the community college.”
Other schools showed an increase in tuition and fees because of a change in how tuition was charged to
students. An example of this is given by a private not-for-profit, four-year college representative who said,
“Tuition increases during this period were largely the result of a transition to block tuition to include all
student fees. This change simplified student billing, provided greater transparency to the student
regarding overall cost of attendance, and resulted in an increased FTE for the institution. Students taking
31 hours in an academic year actually realized a savings in tuition and fees of $507. This flat rate has not
increased more than 3% per annum since this transition and there are no expectations of increases greater
than 3% in the near future.” Similarly, schools reported restructuring their tuition to be more transparent
or changing how many credit or clock hours were considered full-time.
A public, four-year university in Louisiana highlighted the relationship between tuition and state
appropriations. Its response indicated that “The decision to increase tuition at [the institution] was not a
function of increasing costs. It was, instead, a function of declining state appropriations. Even after
substantial increases in tuition revenues over the three-year period from Fall 2012 through Spring 2015
to cover these appropriations shortfalls, there was still a net decrease in total revenues available to [the
institution] to serve its students over this time period.”
A private for-profit, less-than-two-year beauty college in Texas specifically attributed the expense
increases explored in this survey to its tuition increase as follows, “The tuition has increased from [years]
2011–12 to 2013–14 from $8,700 to $9,500. This increase was based on our increased cost of our supplies
in our kits, book increase, and the increased staff to support the higher student count.”
Since the net price calculation includes weighted averages for room and board both on-campus and off-
campus, increases were sometimes attributed to the increased cost of living near the school. According

32
to a representative from a public, two-year school in California, “During the period mentioned, housing
cost and living expenses increased in Orange County at a rate higher than national average. The sharp
increase resulted in the high increase of cost.” Similarly, a public, two-year college in New York
spokesperson said, “The increase in the net price is directly related to the addition of residence halls in
the 2012–13 academic year. The net price was directly impacted by the addition of room and meal plan
charges.” The spokesperson also stated that “The increase in operating costs did not impact our net price.”
This school, like many others on the net price list, claims that its tuition is lower than other schools in its
region and/or industry. Additionally, an institution’s net price can change based on factors outside the
institution’s control, such as the increase in expense when more students are living off-campus, not with
family.
A public, two-year technical college in Florida’s representative explained the increase in each of the three
selected cost areas, as required, but added that the increase was not related to an increase in net price.
The reason for the school’s increase in net price in the additional information field was given as follows,
“We had a substantial net price increase between 2011–12 and 2012–13. Upon investigation, it was
discovered that the calculations for room, board and other expenses in the IPEDS Student Financial Aid
survey for 2011–12 was based incorrectly on students who lived with relatives instead of students who
were independent. This made the cost of attendance lower. The following year and subsequent years the
calculation was correctly done, but it caused a large increase from 2011–12 to 2012–13.”
While some institutions aligned their increases in tuition and fees and/or net price with their increases in
expenses, others specifically stated that their expenses were not the reason for the increases. While
control of student charges explains some of the increases, reporting changes at the IPEDS or institutional
level, restructuring, competition with other institutions, decreases in revenues, and cost increases beyond
the institution’s control account for many of the increases in costs to students.

33
5.0 Conclusion
Section 132 of the HEA, requires schools in the top 5 percent for increases in tuition and fees and/or net
price (cost of attendance after grant and scholarship aid) to explain to the secretary of education why
their costs have gone up and how they will address these rising costs. The first CATEF survey and summary
report was released in 2012.
Figure 15: Institutions required to complete the CATEF, by survey and year
SOURCE: U.S. Department of Education, Office of Postsecondary Education, 2012-2017 College Affordability and Transparency Explanation Form (CATEF)
For each year of the CATEF survey, the same cost areas were identified as having the highest increases
over the corresponding three-year periods; these cost areas were (1) academic support, student services,
and institutional support; (2) instruction; and (3) other expenses. Despite the fact that the group of
institutions required to complete the CATEF survey varied year to year, there were observable trends in
the reasons provided for the increase in costs. Upon analysis of the 2017 survey responses, it was found
that the explanations closely resembled those provided in prior-year surveys. The increase in expenses
could again be attributed to increased enrollment, hiring and wages, and investments in students, such
as new programs and supplies. The majority of institutions reported that they had no plans to reduce costs
in these areas.
While not required to do so, some institutions spoke specifically to their increases in tuition and fees
and/or net price. Reasons given for the increases in tuition and fees included staying competitive, tuition
restructuring, decreases in state appropriations, and expense increases. Reasons given for the increases
in net price included net price calculation methodology, cost of living increases, and errors in reporting.
Based on this analysis, ED may want to consider changes to the collection, including asking institutions
why their tuition and fees or net price went up, to determine whether expense increases are the driving
factor; allowing users to choose from high-level reasons instead of depending on free-form text, which
then needs to be categorized for analysis; and determining the highest cost increases based on the
increase per full-time equivalent value to control for expenses related to positive changes in enrollment.
0
50
100
150
200
250
300
2012 2013 2014 2015 2016 2017
Nu
mb
er o
f In
stit
uti
on
s
Tuition and Fees
Net Price
Both

34
Appendices
Appendix I: 2017 Tuition and Fees CATEF Respondents
Unit ID Name of Institution State 2012–13 2014–15
Increase in
Dollars
Percent Change
Sector-1 Public, four-year or above
142328 Lewis-Clark State College ID $5,562 $8,624 $3,062 55
227526 Prairie View A & M University TX $6,404 $9,461 $3,057 48
207722 University of Science and Arts of Oklahoma OK $4,320 $6,270 $1,950 45
188058 Northern New Mexico College NM $2,827 $4,060 $1,233 44
226806 Midland College TX $2,160 $2,970 $810 38
187596 Navajo Technical University NM $2,590 $3,400 $810 31
221759 The University of Tennessee-Knoxville TN $9,092 $11,876 $2,784 31
482149 Georgia Regents University GA $5,622 $7,326 $1,704 30
159382 Louisiana State University-Alexandria LA $4,617 $6,009 $1,392 30
231624 College of William and Mary VA $13,570 $17,656 $4,086 30
187897 New Mexico Highlands University NM $3,504 $4,500 $996 28
159993 University of Louisiana at Monroe LA $5,443 $6,963 $1,520 28
160658 University of Louisiana at Lafayette LA $5,374 $6,872 $1,498 28
159966 Nicholls State University LA $5,679 $7,234 $1,555 27
148654 University of Illinois at Springfield IL $8,952 $11,367 $2,415 27
100654 Alabama A & M University AL $7,182 $9,096 $1,914 27
159939 University of New Orleans LA $5,850 $7,392 $1,542 26
234030 Virginia Commonwealth University VA $9,886 $12,398 $2,512 25
159391 Louisiana State University and Agricultural &
Mechanical College LA $6,989 $8,750 $1,761 25
160612 Southeastern Louisiana University LA $5,242 $6,547 $1,305 25
159416 Louisiana State University-Shreveport LA $4,943 $6,168 $1,225 25
159717 McNeese State University LA $5,088 $6,334 $1,246 24
126182 Adams State University CO $6,448 $8,014 $1,566 24
188304 Western New Mexico University NM $4,314 $5,346 $1,032 24
159009 Grambling State University LA $5,273 $6,525 $1,252 24
160038 Northwestern State University of Louisiana LA $5,557 $6,863 $1,306 24
234951 Clover Park Technical College WA $4,561 $5,617 $1,056 23
141981 University of Hawaii-West Oahu HI $5,602 $6,888 $1,286 23
159647 Louisiana Tech University LA $6,574 $8,052 $1,478 22
133508 Florida SouthWestern State College FL $2,728 $3,341 $613 22
128391 Western State Colorado University CO $6,449 $7,874 $1,425 22
139621 East Georgia State College GA $3,513 $4,284 $771 22
157058 Kentucky State University KY $6,096 $7,404 $1,308 21
Sector-2 Private not-for profit, four-year or above
376385 Universal Technology College of Puerto Rico PR $10,920 $18,800 $7,880 72
238324 Bellin College WI $12,135 $20,500 $8,365 69
483984 Morthland College IL $6,225 $10,470 $4,245 68

35
Unit ID Name of Institution State 2012–13 2014–15
Increase in
Dollars
Percent Change
110060 Bethesda University CA $5,664 $9,120 $3,456 61
480198 Warner Pacific College Adult Degree Program OR $6,960 $10,800 $3,840 55
457226 Horizon University CA $6,340 $9,250 $2,910 46
169327 Cleary University MI $13,860 $19,200 $5,340 39
448284 Doane College-Lincoln Grand Island and
Master NE $6,916 $9,520 $2,604 38
220206 Welch College TN $12,348 $16,890 $4,542 37
132879 Johnson University Florida FL $10,472 $14,270 $3,798 36
154837 Central Baptist Theological Seminary KS $6,780 $9,140 $2,360 35
465812 Independence University UT $12,696 $16,968 $4,272 34
178721 Park University MO $8,404 $11,170 $2,766 33
102580 Alaska Bible College AK $7,130 $9,300 $2,170 30
212054 Drexel University PA $36,090 $47,051 $10,961 30
167677 Saint John's Seminary MA $16,750 $21,650 $4,900 29
194116 New York School of Interior Design NY $20,542 $26,540 $5,998 29
201821 The Christ College of Nursing and Health
Sciences OH $15,505 $20,031 $4,526 29
101073 Concordia College Alabama AL $8,090 $10,320 $2,230 28
480754 Manthano Christian College MI $4,650 $5,900 $1,250 27
367839 Colorado Heights University CO $5,166 $6,546 $1,380 27
197018 United Talmudical Seminary NY $10,800 $13,535 $2,735 25
373827 New England School of Communications ME $13,482 $16,847 $3,365 25
111966 Charles R Drew University of Medicine and
Science CA $9,957 $12,436 $2,479 25
482228 Virginia Baptist College VA $4,200 $5,200 $1,000 24
137272 Saint John Vianney College Seminary FL $17,100 $21,100 $4,000 23
366003 South Florida Bible College and Theological
Seminary FL $5,028 $6,200 $1,172 23
205124 Rabbinical College Telshe OH $8,100 $9,900 $1,800 22
414878 Trine University-Regional/Non-Traditional
Campuses IN $8,280 $10,080 $1,800 22
181376 Nebraska Christian College NE $10,900 $13,200 $2,300 21
137564 Southeastern University FL $18,596 $22,202 $3,606 19
192165 Kehilath Yakov Rabbinical Seminary NY $7,800 $9,300 $1,500 19
193247 Mirrer Yeshiva Cent Institute NY $5,125 $6,100 $975 19
241216 Atlantic University College PR $6,255 $7,395 $1,140 18
235769 Trinity Lutheran College WA $23,900 $28,240 $4,340 18
222877 Arlington Baptist College TX $7,640 $9,000 $1,360 18
237312 University of Charleston WV $19,700 $23,200 $3,500 18
138293 Webber International University FL $20,418 $24,034 $3,616 18
176664 Baptist Bible College MO $7,690 $9,050 $1,360 18
476717 Be'er Yaakov Talmudic Seminary NY $7,100 $8,350 $1,250 18
220473 Johnson University TN $10,250 $12,050 $1,800 18
227845 Saint Edward's University TX $31,110 $36,550 $5,440 17
208725 New Hope Christian College-Eugene OR $13,590 $15,950 $2,360 17
131450 Gallaudet University DC $12,806 $15,024 $2,218 17

36
Unit ID Name of Institution State 2012–13 2014–15
Increase in
Dollars
Percent Change
123952 Southern California Institute of Architecture CA $34,326 $40,262 $5,936 17
155308 Kansas City College & Bible School KS $4,180 $4,900 $720 17
405854 Rabbinical College of Ohr Shimon Yisroel NY $9,900 $11,600 $1,700 17
175005 St Catherine University MN $31,120 $36,420 $5,300 17
152798 Allen College IA $16,489 $19,295 $2,806 17
151962 Mid-America College of Funeral Service IN $9,050 $10,550 $1,500 17
137962 Trinity College of Florida FL $12,608 $14,660 $2,052 16
195173 St Francis College NY $19,200 $22,300 $3,100 16
197601 Yeshiva Karlin Stolin NY $7,600 $8,800 $1,200 16
139630 Emmanuel College GA $15,700 $18,170 $2,470 16
197735 Yeshivath Viznitz NY $7,000 $8,100 $1,100 16
237358 Davis & Elkins College WV $23,820 $27,492 $3,672 15
133872 Adventist University of Health Sciences FL $10,780 $12,430 $1,650 15
160904 Xavier University of Louisiana LA $18,700 $21,552 $2,852 15
439701 King's University TX $10,755 $12,390 $1,635 15
199759 Southeastern Baptist Theological Seminary NC $6,670 $7,682 $1,012 15
139287 Carver Bible College GA $8,060 $9,260 $1,200 15
217891 Clinton College SC $4,635 $5,320 $685 15
444413 Beis Medrash Heichal Dovid NY $7,500 $8,600 $1,100 15
418126 New York College of Health Professions NY $12,066 $13,830 $1,764 15
192785 Maria College of Albany NY $10,520 $12,050 $1,530 15
164173 Stevenson University MD $25,310 $28,980 $3,670 15
Sector-3 Private for-profit, four-year or above
482361 National American University-Wichita West KS $1,919 $13,071 $11,152 581
447360 Fortis College-Largo FL $13,000 $26,780 $13,780 106
461281 Jose Maria Vargas University FL $6,320 $10,480 $4,160 66
447050 United States University CA $6,200 $10,140 $3,940 64
450979 Trident University International CA $6,120 $8,400 $2,280 37
417318 College of Business and Technology-Kendall FL $13,070 $17,870 $4,800 37
482024 College of Business and Technology-Miami
Gardens FL $13,070 $17,870 $4,800 37
447476 Daymar College-Bellevue KY $12,450 $17,000 $4,550 37
164438 New England College of Business and Finance MA $7,875 $10,525 $2,650 34
224439 Career Point College TX $18,700 $24,982 $6,282 34
480143 Fortis College-Cutler Bay FL $32,650 $43,017 $10,367 32
122852 Santa Barbara Business College-Santa Maria CA $11,674 $15,226 $3,552 30
480781 California Miramar University CA $6,242 $8,050 $1,808 29
205179 Fortis College-Centerville OH $13,475 $17,201 $3,726 28
122834 Santa Barbara Business College-Bakersfield CA $11,674 $14,642 $2,968 25
368452 Nossi College of Art TN $14,200 $17,800 $3,600 25
212993 Hussian School of Art PA $14,600 $18,200 $3,600 25
420307 Virginia College-Birmingham AL $11,519 $13,932 $2,413 21
454856 Denver School of Nursing CO $15,295 $18,407 $3,112 20
404338 Schiller International University FL $17,940 $21,540 $3,600 20
444787 Nightingale College UT $33,600 $40,080 $6,480 19

37
Unit ID Name of Institution State 2012–13 2014–15
Increase in
Dollars
Percent Change
433420 Santa Barbara Business College-Ventura CA $11,674 $13,663 $1,989 17
433004 American University of Health Sciences CA $19,846 $23,162 $3,316 17
174154 Herzing University-Minneapolis MN $11,150 $12,910 $1,760 16
140340 Herzing University-Atlanta GA $11,880 $13,670 $1,790 15
457022 Herzing University-Toledo OH $10,660 $12,250 $1,590 15
200785 Akron Institute of Herzing University OH $10,665 $12,250 $1,585 15
101365 Herzing University-Birmingham AL $11,150 $12,790 $1,640 15
459851 Herzing University-Brookfield WI $11,150 $12,790 $1,640 15
433536 Herzing University-Kenner LA $11,150 $12,790 $1,640 15
459842 Herzing University-Kenosha WI $11,150 $12,790 $1,640 15
240392 Herzing University-Madison WI $11,150 $12,790 $1,640 15
461883 Millennia Atlantic University FL $7,340 $8,372 $1,032 14
381787 Westwood College-Denver South CO $13,485 $15,230 $1,745 13
Sector-4 Public, two-year
485458 Coastal Pines Technical College GA $2,293 $4,770 $2,477 108
106449 Arkansas State University-Beebe AR $1,365 $2,808 $1,443 106
158352 Capital Area Technical College LA $1,941 $3,693 $1,752 90
138682 Albany Technical College GA $2,644 $4,746 $2,102 80
198905 Martin Community College NC $1,394 $2,238 $844 61
139986 Southern Crescent Technical College GA $2,528 $4,017 $1,489 59
365213 Autry Technology Center OK $2,400 $3,750 $1,350 56
135294 Lindsey Hopkins Technical Education Center FL $3,255 $5,055 $1,800 55
155618 Northwest Kansas Technical College KS $10,647 $16,400 $5,753 54
223320 Coastal Bend College TX $1,776 $2,646 $870 49
140243 Lanier Technical College GA $2,246 $3,164 $918 41
227225 Northeast Texas Community College TX $1,740 $2,446 $706 41
206996 Connors State College OK $2,539 $3,563 $1,024 40
233338 Richard Bland College of the College of
William and Mary VA $3,658 $5,058 $1,400 38
198376 Davidson County Community College NC $1,786 $2,438 $652 37
199263 Pamlico Community College NC $1,738 $2,347 $609 35
107585 University of Arkansas Community College-
Morrilton AR $2,024 $2,732 $708 35
160010 Northwest Louisiana Technical College LA $1,931 $2,566 $635 33
221050 Tennessee College of Applied Technology-
Morristown TN $3,447 $4,566 $1,119 32
136826 Robert Morgan Educational Center FL $2,715 $3,571 $856 32
371690 Downey Adult School CA $2,295 $2,999 $704 31
243638 College of Micronesia-FSM FM $3,891 $5,080 $1,189 31
107521 College of the Ouachitas AR $2,547 $3,310 $763 30
162706 Harford Community College MD $2,339 $2,995 $656 28
154642 Allen County Community College KS $2,176 $2,784 $608 28
160579 SOWELA Technical Community College LA $2,871 $3,662 $791 28
213659 Luzerne County Community College PA $3,600 $4,590 $990 28
160481 Fletcher Technical Community College LA $2,832 $3,596 $764 27

38
Unit ID Name of Institution State 2012–13 2014–15
Increase in
Dollars
Percent Change
436304 River Parishes Community College LA $2,803 $3,556 $753 27
107664 Pulaski Technical College AR $3,183 $4,013 $830 26
375407 Madison Adult Career Center OH $4,680 $5,880 $1,200 26
126748 Colorado Northwestern Community College CO $2,962 $3,718 $756 26
168883 Bay de Noc Community College MI $3,485 $4,367 $882 25
220279 Tennessee College of Applied Technology-
Hartsville TN $2,976 $3,726 $750 25
434061 South Louisiana Community College LA $2,861 $3,581 $720 25
159407 Louisiana State University-Eunice LA $2,820 $3,522 $702 25
158884 Nunez Community College LA $2,875 $3,590 $715 25
146418 Kishwaukee College IL $3,060 $3,810 $750 25
158431 Bossier Parish Community College LA $2,911 $3,616 $705 24
107992 Southern Arkansas University Tech AR $3,769 $4,677 $908 24
160667 Northshore Technical Community College LA $2,885 $3,580 $695 24
483212 Louisiana Delta Community College LA $2,931 $3,635 $704 24
158662 Delgado Community College LA $2,991 $3,695 $704 24
144865 College of DuPage IL $4,352 $5,371 $1,019 23
Sector-5 Private not-for-profit, two-year
107840 Shorter College AR $1,650 $4,200 $2,550 155
195191 St Joseph's College of Nursing at St Joseph's
Hospital Health Center NY $12,112 $18,000 $5,888 49
217572 St Joseph School of Nursing RI $12,689 $16,861 $4,172 33
213622 St Margaret School of Nursing PA $11,220 $14,620 $3,400 30
215381 Pittsburgh Institute of Aeronautics PA $14,865 $19,125 $4,260 29
451413 New York Methodist Hospital Center for
Allied Health Education NY $17,025 $21,525 $4,500 26
212568 Aria Health School of Nursing PA $13,037 $16,311 $3,274 25
Sector-6 Private for-profit, two-year
475370 Virginia College-Columbus GA $4,380 $13,932 $9,552 218
454865 Cambridge Institute of Health & Technology FL $15,665 $47,113 $31,448 201
484181 Burnett International College FL $21,430 $36,280 $14,850 69
152044 West Michigan College of Barbering and
Beauty MI $8,216 $13,700 $5,484 67
447625 Eagle Gate College-Salt Lake City UT $14,886 $24,788 $9,902 67
457891 Vanity School of Cosmetology OH $10,450 $15,650 $5,200 50
150251 College of Court Reporting Inc IN $9,050 $13,550 $4,500 50
157456 Nutek Academy of Beauty Inc KY $10,415 $15,200 $4,785 46
451343 Corinth Academy of Cosmetology MS $6,850 $9,850 $3,000 44
483814 Standard Healthcare Services-College of
Nursing VA $11,745 $16,505 $4,760 41
216782 Pittsburgh Career Institute PA $12,774 $17,547 $4,773 37
456977 College of Business and Technology-Cutler
Bay FL $13,070 $17,870 $4,800 37
480161 Ideal Beauty Academy KY $11,350 $15,400 $4,050 36

39
Unit ID Name of Institution State 2012–13 2014–15
Increase in
Dollars
Percent Change
225779 International Business College-El Paso TX $17,300 $23,300 $6,000 35
225788 International Business College-El Paso TX $17,300 $23,300 $6,000 35
449083 College of Business and Technology-Flagler FL $13,070 $17,440 $4,370 33
459143 Golden State College of Court Reporting CA $31,390 $41,800 $10,410 33
421610 Hairitage Hair Academy UT $7,900 $10,400 $2,500 32
438674 The Academy of Hair Design Six MS $9,950 $13,020 $3,070 31
175722 Academy of Hair Design-Grenada MS $9,960 $13,020 $3,060 31
374316 Academy of Hair Design-Jackson MS $9,960 $13,020 $3,060 31
382461 Academy of Hair Design-Pearl MS $9,960 $13,020 $3,060 31
441636 American Institute of Alternative Medicine OH $26,762 $34,968 $8,206 31
200110 Josef's School of Hair Design Inc-Grand Forks ND $13,100 $17,000 $3,900 30
437769 Richmond School of Health and Technology VA $23,340 $29,995 $6,655 29
449524 Taylor College FL $11,210 $14,224 $3,014 27
190974 Elmira Business Institute NY $15,300 $19,400 $4,100 27
476762 Velvet Touch Academy of Cosmetology ID $11,500 $14,500 $3,000 26
455390 Global Health College VA $16,139 $20,338 $4,199 26
200165 Josef's School of Hair Design Inc-Fargo
Downtown ND $13,100 $16,500 $3,400 26
239877 State College of Beauty Culture Inc WI $11,900 $14,900 $3,000 25
469610 Allen School-Phoenix AZ $11,176 $13,971 $2,795 25
230205 Evans Hairstyling College-St George UT $10,100 $12,500 $2,400 24
433563 Spencerian College-Lexington KY $15,874 $19,590 $3,716 23
455868 National Career College CA $9,025 $11,106 $2,081 23
444547 Court Reporting Institute of Louisiana LA $8,975 $11,025 $2,050 23
145406 Hair Professionals Academy of Cosmetology IL $12,256 $15,023 $2,767 23
246008 Career Point College OK $17,050 $20,879 $3,829 22
445780 Cosmetology School of Arts and Science LLC ID $11,300 $13,820 $2,520 22
479983 Montage Academy CO $14,550 $17,490 $2,940 20
246035 Carrington College-Portland OR $14,050 $16,848 $2,798 20
156277 Barrett and Company School of Hair Design KY $12,975 $15,500 $2,525 19
153588 American College of Hairstyling-Des Moines IA $16,552 $19,767 $3,215 19
401339 Coast Career Institute-Los Angeles CA $4,338 $5,175 $837 19
470302 Coast Career Institute-Colton CA $4,338 $5,175 $837 19
450058 Fortis College-Columbus OH $12,308 $14,641 $2,333 19
447847 Aviator College of Aeronautical Science and
Technology FL $63,073 $74,787 $11,714 19
476850 Boise Barber College ID $7,496 $8,883 $1,387 19
Sector-7 Public, less-than-two-year
112367 Clovis Adult Education CA $6,000 $10,500 $4,500 75
395195 Colton-Redlands-Yucaipa Regional
Occupational Program CA $11,614 $18,787 $7,173 62
431877 Sullivan County BOCES-Practical Nursing
Program NY $8,500 $13,000 $4,500 53
417947 Syracuse City Schools Practical Nursing
Program NY $8,350 $12,600 $4,250 51

40
Unit ID Name of Institution State 2012–13 2014–15
Increase in
Dollars
Percent Change
440730 Onondaga Cortland Madison BOCES NY $8,000 $11,800 $3,800 48
418357 Wes Watkins Technology Center OK $4,696 $6,809 $2,113 45
368407 Western Area Career & Technology Center PA $10,364 $14,941 $4,577 44
418199 Penta County Joint Vocational School OH $4,358 $5,955 $1,597 37
248624 Fayette County Career & Technical Institute
Practical Nursing Program PA $6,968 $9,390 $2,422 35
406325 Schuyler Steuben Chemung Tioga Allegany
BOCES NY $9,495 $12,595 $3,100 33
417646 Saline County Career Center MO $7,450 $9,850 $2,400 32
260363 Greene County Career and Technology
Center PA $14,061 $18,553 $4,492 32
Sector-8 Private not-for-profit, less-than-two-year
215983 Sharon Regional Health System School of
Nursing PA $11,500 $24,113 $12,613 110
481155 Helms College GA $10,200 $15,064 $4,864 48
483823 Philadelphia Technician Training PA $8,650 $12,050 $3,400 39
111726 CET-El Centro CA $9,307 $11,182 $1,875 20
111744 CET-San Bernardino CA $9,307 $11,182 $1,875 20
111708 CET-San Diego CA $9,307 $11,182 $1,875 20
Sector-9 Private for-profit, less-than-two-year
484154 Preparing People Barber Styling College TX $3,000 $15,175 $12,175 406
483470 More Tech Institute FL $1,350 $6,482 $5,132 380
482167 Trenz Beauty Academy IL $4,060 $15,900 $11,840 292
482981 Alamo City Barber College TX $4,950 $16,177 $11,227 227
169071 Cadillac Institute of Cosmetology MI $2,675 $8,475 $5,800 217
483948 Bos-Man's Barber College LA $5,285 $16,300 $11,015 208
483230 Fab School CA $8,750 $25,750 $17,000 194
484020 Beyond Measure Barbering Institute NC $4,945 $13,600 $8,655 175
483753 Champ's Barber School PA $6,295 $16,550 $10,255 163
483869 InterAmerican Technical Institute FL $1,007 $2,550 $1,543 153
484172 Lee Professional Institute FL $3,500 $8,500 $5,000 143
484075 First Coast Barber Academy FL $5,500 $13,250 $7,750 141
151607 Tricoci University of Beauty Culture-Lafayette IN $7,500 $16,900 $9,400 125
482200 Cosmetology Academy of Texarkana TX $7,500 $16,500 $9,000 120
484048 Barber Institute of Texas TX $10,735 $23,025 $12,290 114
199670 Sherrill's University of Barber & Cosmetology NC $6,000 $12,750 $6,750 113
484190 Park Place Premier Barber School LA $5,600 $10,700 $5,100 91
481395 Cosmo Factory Cosmetology Academy CA $10,025 $18,600 $8,575 86
373456 Blalock's Professional Beauty College LA $8,000 $14,000 $6,000 75
483276 JB's Hair Design and Barber College OK $6,000 $10,500 $4,500 75
483966 Healthcare Preparatory Institute NV $10,000 $17,000 $7,000 70
485254 MCI Institute of Technology-Boca Raton FL $7,150 $12,000 $4,850 68
160126 Celebrity Stylist Beauty School LA $8,198 $13,500 $5,302 65
482103 Finger Lakes School of Massage MD $6,800 $10,850 $4,050 60

41
Unit ID Name of Institution State 2012–13 2014–15
Increase in
Dollars
Percent Change
484118 Excel Academies of Cosmetology MI $7,265 $11,515 $4,250 59
475468 Christine Valmy International School of
Esthetics & Cosmetology NJ $9,220 $14,525 $5,305 58
451228 MyComputerCareer.com-Indianapolis IN $10,288 $16,136 $5,848 57
191409 Gloria Francis School of Make-Up Artistry NY $8,100 $12,600 $4,500 56
175698 Fosters Cosmetology College MS $8,725 $13,200 $4,475 51
483878 Bay Area Medical Academy CA $8,000 $12,000 $4,000 50
178314 Missouri School of Barbering & Hairstyling-
St. Louis MO $7,810 $11,570 $3,760 48
481632 MedTech Institute-Orlando Campus FL $15,550 $23,000 $7,450 48
439774 New Concept Massage and Beauty School FL $7,500 $11,087 $3,587 48
118143 Lyles Fresno College of Beauty CA $10,905 $16,084 $5,179 47
168555 Hillsdale Beauty College MI $10,700 $15,750 $5,050 47
481465 Healthcare Training Institute LA $7,550 $11,100 $3,550 47
483425 Alexander Paul Institute of Hair Design NC $7,000 $10,125 $3,125 45
483054 Barber School of Pittsburgh PA $11,325 $16,325 $5,000 44
371034 Alabama State College of Barber Styling AL $5,550 $8,000 $2,450 44
135559 Merryfield School of Pet Grooming FL $7,500 $10,800 $3,300 44
447449 Academy of Hair Design-Jasper TX $9,400 $13,500 $4,100 44
434274 Academy of Hair Design-Lufkin TX $9,400 $13,500 $4,100 44
451477 MyComputerCareer.com-Columbus OH $11,250 $16,136 $4,886 43
401764 John Amico School of Hair Design IL $10,200 $14,600 $4,400 43
484163 Arizona School of Integrative Studies AZ $6,500 $9,300 $2,800 43
439631 Fayette Beauty Academy GA $10,320 $14,600 $4,280 41
485184 Fayette Beauty Academy-Ritz Beauty
Academy GA $10,320 $14,600 $4,280 41
485193 Fayette Beauty Academy-Ritz Beauty
Academy GA $10,320 $14,600 $4,280 41
462035 Florida Academy FL $9,000 $12,500 $3,500 39
461218 Institute of Medical Careers PA $10,860 $15,000 $4,140 38
447908 Florida Academy of Health & Beauty FL $8,050 $11,050 $3,000 37
484039 Beauty Anatomy Institute of Cosmetology
and Wellness FL $9,750 $13,350 $3,600 37
172680 Excel Academies of Cosmetology-Kentwood MI $8,415 $11,515 $3,100 37
444945 Unitech Training Academy-Lafayette LA $9,765 $13,245 $3,480 36
410964 EINE Inc MA $8,475 $11,475 $3,000 35
447980 Nuvo College of Cosmetology MI $8,465 $11,450 $2,985 35
481474 W Academy of Salon and Spa CA $12,250 $16,500 $4,250 35
461865 Best Care Training Institute NJ $12,953 $17,380 $4,427 34
207786 Southern School of Beauty Inc OK $9,200 $12,200 $3,000 33
484066 MedQuest College KY $10,200 $13,500 $3,300 32
483726 Luckes Beauty Academy VA $9,000 $11,900 $2,900 32
483896 Parisian Spa Institute FL $6,350 $8,350 $2,000 31
220765 Genesis Career College-Cookeville TN $11,455 $14,995 $3,540 31
382780 Genesis Career College-Lebanon TN $11,455 $14,995 $3,540 31

42
Unit ID Name of Institution State 2012–13 2014–15
Increase in
Dollars
Percent Change
481298 Lawrence & Company College of
Cosmetology CA $10,400 $13,608 $3,208 31
236531 Everest College-Seattle WA $13,500 $17,646 $4,146 31
189990 Christine Valmy International School for
Esthetics, Skin Care & Makeup NY $5,750 $7,500 $1,750 30
454722 Academy of Esthetics and Cosmetology CA $13,140 $17,108 $3,968 30
108065 Velvatex College of Beauty Culture AR $7,500 $9,750 $2,250 30
434283 Academy of Hair Design-Beaumont TX $9,400 $12,200 $2,800 30
461892 Abcott Institute MI $8,500 $11,000 $2,500 29
446145 Central State Massage Academy OK $9,000 $11,595 $2,595 29
172802 Wright Beauty Academy MI $9,400 $12,100 $2,700 29
476832 Jolei's Hair Institute SC $11,090 $14,275 $3,185 29
483939 Setting the Standard Barbering and Natural
Hair Academy LA $10,000 $12,865 $2,865 29
481483 Boca Beauty Academy FL $13,310 $17,110 $3,800 29
119845 Newberry School of Beauty CA $11,275 $14,483 $3,208 28
206932 Central State Beauty Academy OK $12,400 $15,875 $3,475 28
150437 Don Roberts Beauty School IN $13,400 $17,100 $3,700 28
177685 Paul Mitchell the School-Missouri Columbia MO $10,660 $13,600 $2,940 28
460570 Salter School of Nursing and Allied Health NH $18,256 $23,175 $4,919 27
152309 Rogers Academy of Hair Design IN $11,700 $14,850 $3,150 27
169503 David Pressley School of Cosmetology MI $11,150 $14,150 $3,000 27
483735 Total Transformation Institute of
Cosmetology TX $11,184 $14,184 $3,000 27
184870 Harris School of Business-Cherry Hill Campus NJ $13,200 $16,735 $3,535 27
453552 Harris School of Business-Hamilton Campus NJ $13,200 $16,735 $3,535 27
448983 Harris School of Business-Linwood Campus NJ $13,200 $16,735 $3,535 27

43
Appendix II: 2017 Net Price CATEF Respondents
Unit ID Name of Institution State 2011–12 2013–14
Increase in
Dollars
Percent Change
Sector-1 Public, four-year or above
200466 Sitting Bull College ND $1,060 $3,291 $2,231 210
240790 Northern Marianas College MP $692 $1,919 $1,227 177
126711 Colorado Mountain College CO $4,104 $9,523 $5,419 132
188058 Northern New Mexico College NM $4,181 $8,736 $4,555 109
207351 Oklahoma Panhandle State University OK $6,718 $11,945 $5,227 78
380377 Northwest Indian College WA $4,614 $7,144 $2,530 55
236072 North Seattle College WA $3,594 $5,554 $1,960 55
160658 University of Louisiana at Lafayette LA $5,891 $8,463 $2,572 44
190558 College of Staten Island CUNY NY $6,773 $9,575 $2,802 41
224545 Texas A & M University-Texarkana TX $5,829 $8,221 $2,392 41
198543 Fayetteville State University NC $4,906 $6,848 $1,942 40
207564 Oklahoma State University Institute of
Technology OK $6,033 $8,381 $2,348 39
235343 Green River Community College WA $6,500 $8,978 $2,478 38
171137 University of Michigan-Dearborn MI $8,940 $12,347 $3,407 38
228705 Texas A & M University-Kingsville TX $8,930 $12,275 $3,345 37
139463 Dalton State College GA $4,562 $6,256 $1,694 37
159382 Louisiana State University-Alexandria LA $7,168 $9,813 $2,645 37
200086 Fort Berthold Community College ND $5,510 $7,491 $1,981 36
190512 CUNY Bernard M Baruch College NY $6,016 $8,151 $2,135 35
236513 Seattle Central College WA $3,666 $4,953 $1,287 35
198507 Elizabeth City State University NC $1,846 $2,490 $644 35
106245 University of Arkansas at Little Rock AR $9,506 $12,780 $3,274 34
230597 Snow College UT $7,816 $10,461 $2,645 34
139755 Georgia Institute of Technology-Main
Campus GA $9,116 $12,187 $3,071 34
100654 Alabama A & M University AL $11,108 $14,746 $3,638 33
139968 Gordon State College GA $7,939 $10,515 $2,576 32
100830 Auburn University at Montgomery AL $9,690 $12,827 $3,137 32
106458 Arkansas State University-Main Campus AR $8,708 $11,499 $2,791 32
185262 Kean University NJ $11,456 $15,110 $3,654 32
190549 CUNY Brooklyn College NY $5,485 $7,220 $1,735 32
137315 South Florida State College FL $4,137 $5,436 $1,299 31
229018 The University of Texas of the Permian Basin TX $6,290 $8,245 $1,955 31
133508 Florida SouthWestern State College FL $6,459 $8,420 $1,961 30
Sector-2 Private not-for profit, four-year or above
190752 Yeshiva of Far Rockaway Derech Ayson
Rabbinical Seminary NY $2,673 $10,964 $8,291 310
461759 Simmons College of Kentucky KY $928 $3,605 $2,677 288
363712 Yeshivah Gedolah Rabbinical College FL $2,959 $10,078 $7,119 241
443058 Family of Faith College OK $5,538 $14,860 $9,322 168

44
Unit ID Name of Institution State 2011–12 2013–14
Increase in
Dollars
Percent Change
459727 Touro University Worldwide CA $4,487 $11,988 $7,501 167
206154 Tri-State Bible College OH $9,502 $21,430 $11,928 126
241614 Universidad Teologica del Caribe PR $3,809 $8,468 $4,659 122
458113 Bethel College VA $5,643 $12,202 $6,559 116
220701 Martin Methodist College TN $11,266 $23,196 $11,930 106
111966 Charles R Drew University of Medicine and
Science CA $9,631 $19,338 $9,707 101
388520 College of Biblical Studies-Houston TX $13,032 $26,057 $13,025 100
152099 Oakland City University IN $10,317 $19,344 $9,027 87
141167 Thomas University GA $11,179 $20,535 $9,356 84
139205 Brewton-Parker College GA $7,467 $13,368 $5,901 79
439862 Pacific Islands University GU $6,420 $11,470 $5,050 79
228486 Southwestern Christian College TX $5,189 $9,268 $4,079 79
151962 Mid-America College of Funeral Service IN $10,502 $18,402 $7,900 75
439701 King's University TX $12,488 $21,856 $9,368 75
137777 Talmudic College of Florida FL $8,016 $13,979 $5,963 74
193052 Mesivta Torah Vodaath Rabbinical Seminary NY $6,671 $11,396 $4,725 71
211893 Curtis Institute of Music PA $4,140 $6,751 $2,611 63
123952 Southern California Institute of Architecture CA $29,068 $46,164 $17,096 59
157030 Kentucky Mountain Bible College KY $7,191 $11,410 $4,219 59
375230 Yeshiva Gedolah Imrei Yosef D'spinka NY $7,140 $11,225 $4,085 57
153241 Divine Word College IA $5,881 $9,192 $3,311 56
208725 New Hope Christian College-Eugene OR $11,418 $17,451 $6,033 53
385619 Everglades University FL $22,303 $33,930 $11,627 52
154262 St Luke's College IA $15,426 $23,163 $7,737 50
241377 Caribbean University-Bayamon PR $1,787 $2,652 $865 48
440651 Atenas College PR $4,086 $6,050 $1,964 48
139153 Beulah Heights University GA $8,572 $12,682 $4,110 48
192624 Machzikei Hadath Rabbinical College NY $8,203 $12,048 $3,845 47
160074 Our Lady of the Lake College LA $11,392 $16,700 $5,308 47
165802 Fisher College MA $18,369 $26,504 $8,135 44
431983 Yeshiva of the Telshe Alumni NY $7,323 $10,470 $3,147 43
213303 Keystone College PA $12,153 $17,261 $5,108 42
217925 Columbia International University SC $13,850 $19,649 $5,799 42
197018 United Talmudical Seminary NY $5,595 $7,928 $2,333 42
147129 Methodist College IL $18,513 $26,203 $7,690 42
230621 Stevens-Henager College UT $17,977 $24,959 $6,982 39
227331 Our Lady of the Lake University TX $13,325 $18,431 $5,106 38
156417 Clear Creek Baptist Bible College KY $5,149 $7,102 $1,953 38
201177 Aultman College of Nursing and Health
Sciences OH $13,228 $18,201 $4,973 38
417752 Messenger College TX $13,051 $17,751 $4,700 36
220598 Lane College TN $8,491 $11,527 $3,036 36
198136 Campbell University NC $19,818 $26,865 $7,047 36
117575 Southern California Seminary CA $24,846 $33,551 $8,705 35
200873 Allegheny Wesleyan College OH $3,571 $4,809 $1,238 35

45
Unit ID Name of Institution State 2011–12 2013–14
Increase in
Dollars
Percent Change
206817 Bacone College OK $16,944 $22,764 $5,820 34
198677 Heritage Bible College NC $7,934 $10,655 $2,721 34
465812 Independence University UT $18,828 $25,268 $6,440 34
126872 CollegeAmerica-Denver CO $17,945 $24,049 $6,104 34
401223 World Mission University CA $12,941 $17,312 $4,371 34
139630 Emmanuel College GA $11,075 $14,746 $3,671 33
483984 Morthland College IL $13,850 $18,407 $4,557 33
118541 Marymount California University CA $19,964 $26,479 $6,515 33
217040 Yeshivath Beth Moshe PA $5,299 $7,017 $1,718 32
137476 St Thomas University FL $17,563 $23,212 $5,649 32
229780 Wayland Baptist University TX $12,511 $16,452 $3,941 32
147369 Moody Bible Institute IL $14,793 $19,417 $4,624 31
229887 Wiley College TX $10,225 $13,382 $3,157 31
164872 Boston Architectural College MA $25,467 $33,313 $7,846 31
194310 Pace University-New York NY $22,681 $29,641 $6,960 31
Sector-3 Private for-profit, four-year or above
447360 Fortis College-Largo FL $449 $21,215 $20,766 4625
457129 Chamberlain College of Nursing-Florida FL $15,938 $29,337 $13,399 84
417318 College of Business and Technology-Kendall FL $15,752 $24,560 $8,808 56
457688 American Business and Technology University MO $15,368 $22,761 $7,393 48
178305 Missouri College MO $12,862 $18,707 $5,845 45
102845 Charter College-Anchorage AK $18,797 $26,494 $7,697 41
172866 Academy College MN $23,330 $32,168 $8,838 38
230977 New England Culinary Institute VT $18,689 $24,290 $5,601 30
454245 Chamberlain College of Nursing-Arizona AZ $24,706 $32,096 $7,390 30
421832 Living Arts College NC $20,097 $25,819 $5,722 28
224439 Career Point College TX $20,320 $25,734 $5,414 27
105534 Pima Medical Institute-Tucson AZ $15,657 $19,756 $4,099 26
157465 Daymar College-Owensboro KY $19,158 $23,969 $4,811 25
457299 Angeles College CA $11,473 $14,286 $2,813 25
447421 Eagle Gate College-Layton UT $19,883 $24,664 $4,781 24
372073 Fremont College CA $17,181 $21,269 $4,088 24
451796 The Art Institute of Michigan MI $19,221 $23,740 $4,519 24
434557 ITT Technical Institute-Oak Brook IL $20,246 $24,776 $4,530 22
459648 ITT Technical Institute-Johnson City TN $20,440 $24,943 $4,503 22
459091 Broadview Entertainment Arts University UT $16,413 $19,823 $3,410 21
203386 Hondros College OH $27,353 $32,767 $5,414 20
121275 Platt College-San Diego CA $31,574 $37,627 $6,053 19
460729 Allied American University CA $12,505 $14,898 $2,393 19
183789 Berkeley College-Woodland Park NJ $21,133 $25,003 $3,870 18
460871 Chamberlain College of Nursing-Virginia VA $23,293 $27,558 $4,265 18
440299 Everest College-Ontario Metro CA $20,508 $24,248 $3,740 18
454227 Chamberlain College of Nursing-Illinois IL $22,441 $26,447 $4,006 18
419457 Argosy University-Washington DC VA $18,674 $22,003 $3,329 18
461023 National Paralegal College AZ $11,698 $13,709 $2,011 17

46
Unit ID Name of Institution State 2011–12 2013–14
Increase in
Dollars
Percent Change
200624 The Art Institute of Cincinnati-AIC College of
Design OH $19,984 $23,402 $3,418 17
Sector-4 Public, two-year
452106 Escuela De Troqueleria Y Herramentaje PR $184 $1,570 $1,386 753
175519 Coahoma Community College MS $900 $2,461 $1,561 173
138682 Albany Technical College GA $628 $1,677 $1,049 167
111887 Cerritos College CA $3,602 $8,234 $4,632 129
171234 Montcalm Community College MI $7,203 $15,747 $8,544 119
158884 Nunez Community College LA $4,141 $8,770 $4,629 112
148007 Prairie State College IL $3,634 $7,553 $3,919 108
198817 Lenoir Community College NC $4,022 $8,211 $4,189 104
136303 Orlando Tech FL $7,008 $14,256 $7,248 103
223320 Coastal Bend College TX $3,787 $7,629 $3,842 101
166823 Massasoit Community College MA $3,496 $6,946 $3,450 99
101897 Northeast Alabama Community College AL $1,684 $3,192 $1,508 90
132976 Charlotte Technical Center FL $5,813 $10,869 $5,056 87
176239 Pearl River Community College MS $986 $1,837 $851 86
237817 Southern West Virginia Community and
Technical College WV $3,562 $6,576 $3,014 85
419226 Marion County Community Technical and
Adult Education Center FL $3,989 $7,354 $3,365 84
171395 North Central Michigan College MI $1,123 $2,021 $898 80
364946 Caddo Kiowa Technology Center OK $3,566 $6,320 $2,754 77
198233 Catawba Valley Community College NC $7,026 $12,353 $5,327 76
199494 Rowan-Cabarrus Community College NC $3,213 $5,636 $2,423 75
226134 Laredo Community College TX $2,702 $4,730 $2,028 75
134307 George T Baker Aviation School FL $1,199 $2,038 $839 70
448594 West Hills College-Lemoore CA $4,755 $8,048 $3,293 69
141680 Honolulu Community College HI $3,882 $6,551 $2,669 69
439190 Cascadia College WA $5,658 $9,544 $3,886 69
190840 Dutchess Community College NY $3,730 $6,264 $2,534 68
138479 William T McFatter Technical College FL $5,642 $9,442 $3,800 67
461315 Keweenaw Bay Ojibwa Community College MI $4,442 $7,389 $2,947 66
145682 Illinois Central College IL $5,368 $8,904 $3,536 66
101736 Northwest-Shoals Community College AL $4,043 $6,674 $2,631 65
135735 Mid Florida Tech FL $5,159 $8,486 $3,327 64
199023 Montgomery Community College NC $3,640 $5,952 $2,312 64
210234 Treasure Valley Community College OR $8,593 $13,937 $5,344 62
434061 South Louisiana Community College LA $4,737 $7,598 $2,861 60
179052 Rolla Technical Institute/Center MO $6,021 $9,640 $3,619 60
138956 Augusta Technical College GA $5,858 $9,334 $3,476 59
168607 Alpena Community College MI $2,300 $3,626 $1,326 58
218858 Central Carolina Technical College SC $5,068 $7,969 $2,901 57
418533 Lancaster County Career and Technology
Center PA $6,406 $10,065 $3,659 57

47
Unit ID Name of Institution State 2011–12 2013–14
Increase in
Dollars
Percent Change
130916 Delaware Technical Community College-
Stanton/Wilmington DE $4,419 $6,925 $2,506 57
113236 Cypress College CA $4,478 $6,993 $2,515 56
221184 Nashville State Community College TN $5,083 $7,898 $2,815 55
130891 Delaware Technical Community College-
Owens DE $4,283 $6,614 $2,331 54
125462 West Hills College-Coalinga CA $4,777 $7,306 $2,529 53
216296 Thaddeus Stevens College of Technology PA $3,084 $4,710 $1,626 53
218894 Trident Technical College SC $5,553 $8,444 $2,891 52
193946 Niagara County Community College NY $3,675 $5,578 $1,903 52
165033 Bristol Community College MA $4,925 $7,336 $2,411 49
420398 Northwest Vista College TX $4,348 $6,472 $2,124 49
452106 Escuela De Troqueleria Y Herramentaje PR $184 $1,570 $1,386 753
175519 Coahoma Community College MS $900 $2,461 $1,561 173
Sector-5 Private not-for-profit, two-year
191764 Institute of Design and Construction NY $3,287 $6,543 $3,256 99
216773 Western Pennsylvania Hospital School of
Nursing PA $8,138 $15,927 $7,789 96
442523 Alaska Christian College AK $4,360 $8,029 $3,669 84
434751 White Earth Tribal and Community College MN $4,359 $7,779 $3,420 78
131830 National Conservatory of Dramatic Arts DC $6,263 $10,653 $4,390 70
225876 Jacksonville College-Main Campus TX $4,304 $6,904 $2,600 60
Sector-6 Private for-profit, two-year
421610 Hairitage Hair Academy UT $1,614 $6,175 $4,561 283
457891 Vanity School of Cosmetology OH $2,390 $7,554 $5,164 216
142407 Joseph Charles Institute of Cosmetology ID $4,301 $11,588 $7,287 169
479983 Montage Academy CO $6,050 $15,734 $9,684 160
248192 Jenny Lea Academy of Cosmetology KY $1,630 $4,184 $2,554 157
440776 Interactive College of Technology TX $4,218 $9,941 $5,723 136
181941 Career College of Northern Nevada NV $8,735 $20,257 $11,522 132
139214 Brown College of Court Reporting GA $11,990 $26,425 $14,435 120
454865 Cambridge Institute of Health & Technology FL $9,923 $20,820 $10,897 110
225779 International Business College-El Paso TX $7,847 $16,277 $8,430 107
245069 Trend Setters' Academy of Beauty Culture-
Elizabethtown KY $6,429 $13,033 $6,604 103
454883 Allied Health Institute FL $9,395 $18,322 $8,927 95
156949 Jenny Lea Academy of Cosmetology KY $8,935 $17,381 $8,446 95

48
Unit ID Name of Institution State 2011–12 2013–14
Increase in
Dollars
Percent Change
178004 Lutheran School of Nursing MO $13,351 $24,585 $11,234 84
127219 Glenwood Beauty Academy CO $8,214 $14,656 $6,442 78
248165 Heads West Kentucky Beauty College KY $5,861 $10,404 $4,543 78
451343 Corinth Academy of Cosmetology MS $4,547 $7,811 $3,264 72
455479 Fortis Institute-Pensacola FL $11,189 $19,116 $7,927 71
414461 Mech-Tech College PR $6,166 $10,490 $4,324 70
118198 MTI College CA $9,307 $15,553 $6,246 67
445744 Fortis Institute-Port Saint Lucie FL $19,318 $31,992 $12,674 66
476762 Velvet Touch Academy of Cosmetology ID $7,264 $12,026 $4,762 66
444909 Total Look School of Cosmetology & Massage
Therapy IA $5,387 $8,688 $3,301 61
378956 National Aviation Academy of Tampa Bay FL $13,217 $21,135 $7,918 60
140827 Portfolio Center GA $22,269 $35,393 $13,124 59
456977 College of Business and Technology-Cutler
Bay FL $15,125 $23,829 $8,704 58
442745 Fortis Institute FL $19,038 $29,742 $10,704 56
365693 Capitol School of Hairstyling and Esthetics NE $7,909 $12,337 $4,428 56
468705 Trend Setters' Academy of Beauty Culture-
Louisville KY $5,437 $8,339 $2,902 53
175607 Delta Beauty College MS $3,546 $5,381 $1,835 52
456375 MedTech College-Lexington Campus KY $15,037 $22,676 $7,639 51
461999 Elite School of Cosmetology OH $5,343 $8,021 $2,678 50
434821 Blue Cliff College-Metairie LA $8,188 $12,193 $4,005 49
145406 Hair Professionals Academy of Cosmetology IL $15,222 $22,297 $7,075 46
445753 Fortis Institute-Miami FL $9,801 $14,246 $4,445 45
450128 Blue Cliff College-Alexandria LA $15,155 $22,028 $6,873 45
455202 American Institute of Medical Sciences &
Education NJ $12,583 $17,996 $5,413 43
153171 Iowa School of Beauty-Marshalltown IA $6,869 $9,779 $2,910 42
441502 Blue Cliff College-Gulfport MS $16,044 $22,697 $6,653 41
381486 Faust Institute of Cosmetology-Spirit Lake IA $7,338 $10,286 $2,948 40
215433 Prism Career Institute-Upper Darby PA $25,860 $36,196 $10,336 40
377449 Centura College-Newport News VA $16,159 $22,580 $6,421 40
459958 Fortis Institute-Houston TX $15,140 $21,003 $5,863 39
181880 Academy of Hair Design-Las Vegas NV $9,455 $13,114 $3,659 39
123642 South Coast College CA $16,017 $22,139 $6,122 38
Sector-7 Public, less-than-two-year
407489 Mahoning County Career and Technical
Center OH $2,614 $14,578 $11,964 458
441353 Windham Technical High School CT $1,898 $9,715 $7,817 412
440217 Huntingdon County Career and Technology
Center PA $3,143 $10,149 $7,006 223
375692 Kiamichi Technology Center-Atoka OK $2,231 $6,046 $3,815 171
382416 Greater Lowell Technical School MA $6,280 $16,998 $10,718 171
381529 Seattle Vocational Institute WA $1,080 $2,733 $1,653 153

49
Unit ID Name of Institution State 2011–12 2013–14
Increase in
Dollars
Percent Change
260363 Greene County Career and Technology
Center PA $8,015 $19,792 $11,777 147
138488 Winter Park Tech FL $11,213 $26,025 $14,812 132
178828 Poplar Bluff Technical Career Center MO $7,912 $17,978 $10,066 127
375762 Kiamichi Technology Center-Talihina OK $1,354 $2,930 $1,576 116
138372 Westside Tech FL $9,509 $18,581 $9,072 95
Sector-8 Private not-for-profit, less-than-two-year
383172 Advanced Technical Centers FL $87 $1,764 $1,677 1928
437705 Monteclaro Escuela de Hoteleria y Artes
Culinarias PR $1,890 $3,489 $1,599 85
475705 Annenberg School of Nursing CA $12,877 $19,731 $6,854 53
446455 Precision Manufacturing Institute PA $14,876 $21,944 $7,068 48
Sector-9 Private for-profit, less-than-two-year
371034 Alabama State College of Barber Styling AL $388 $3,748 $3,360 866
108065 Velvatex College of Beauty Culture AR $543 $2,608 $2,065 380
207166 Hollywood Cosmetology Center OK $2,280 $8,970 $6,690 293
475574 Lil Lou's Barber College IN $2,383 $8,214 $5,831 245
476531 Tri-State Institute of Hair Design KY $4,317 $13,240 $8,923 207
160117 Pat Goins Benton Road Beauty School LA $3,268 $9,192 $5,924 181
439774 New Concept Massage and Beauty School FL $3,104 $8,606 $5,502 177
461625 American Technical Institute PR $1,430 $3,757 $2,327 163
481331 Sharp Edgez Barber Institute NY $2,502 $6,354 $3,852 154
151607 Tricoci University of Beauty Culture-Lafayette IN $6,219 $14,968 $8,749 141
383279 Robert Fiance Beauty Schools-North
Plainfield NJ $10,623 $24,603 $13,980 132
434274 Academy of Hair Design-Lufkin TX $2,792 $6,463 $3,671 131
459532 Salon & Spa Institute TX $6,757 $15,326 $8,569 127
461555 Aveda Institute-New Mexico NM $7,534 $16,882 $9,348 124
376677 Queen City College TN $4,369 $9,726 $5,357 123
210748 Altoona Beauty School Inc PA $7,646 $16,636 $8,990 118
101277 New Beginning College of Cosmetology AL $4,951 $10,696 $5,745 116
383464 Central Texas Beauty College-Temple TX $2,687 $5,773 $3,086 115
374440 Mitchells Hairstyling Academy-Goldsboro NC $2,450 $5,150 $2,700 110
118143 Lyles Fresno College of Beauty CA $6,874 $14,355 $7,481 109
444653 In Session Arts of Cosmetology Beauty School MI $641 $1,334 $693 108
215530 The Salon Professional Academy-Altoona PA $4,149 $8,575 $4,426 107
421665 Houghton Lake Institute of Cosmetology MI $5,183 $10,524 $5,341 103
155441 La Baron Hairdressing Academy-Overland
Park KS $4,754 $9,531 $4,777 100
170736 M J Murphy Beauty College of Mount
Pleasant MI $1,516 $3,022 $1,506 99
449685 New Age Training NY $2,444 $4,751 $2,307 94
160126 Celebrity Stylist Beauty School LA $7,104 $13,723 $6,619 93
246460 Central Texas Beauty College-Round Rock TX $2,966 $5,720 $2,754 93

50
Unit ID Name of Institution State 2011–12 2013–14
Increase in
Dollars
Percent Change
480170 Minnesota School of Cosmetology-Plymouth
Campus MN $7,531 $14,474 $6,943 92
170514 Wright Beauty Academy MI $1,223 $2,328 $1,105 90
461704 Capilo School of Hair Design ME $6,484 $12,276 $5,792 89
159531 Louisiana Academy of Beauty LA $6,015 $11,335 $5,320 88
451316 Trend Setters School of Cosmetology MO $7,329 $13,799 $6,470 88
418913 Pipo Academy of Hair Design TX $3,237 $6,091 $2,854 88
461740 Buckner Barber School TX $4,296 $8,073 $3,777 88
458016 Professional Career Training Institute TX $13,300 $24,886 $11,586 87
458061 Texas Beauty College TX $5,753 $10,672 $4,919 86
381370 Michigan College of Beauty-Troy MI $9,519 $17,131 $7,612 80
441618 Leon Studio One School of Hair Design NY $15,777 $28,386 $12,609 80
236027 Northwest Hair Academy WA $9,037 $16,227 $7,190 80
202888 Gerbers Akron Beauty School OH $4,467 $7,988 $3,521 79
476674 Curve Metric School of Hair Design IL $2,450 $4,361 $1,911 78
151564 Knox Beauty College IN $1,686 $2,979 $1,293 77
175698 Fosters Cosmetology College MS $7,230 $12,735 $5,505 76
459523 ABC Beauty Academy TX $5,284 $9,119 $3,835 73
479248 Columbia College MD $3,731 $6,318 $2,587 69
401764 John Amico School of Hair Design IL $4,338 $7,252 $2,914 67
441380 Florida Barber Academy FL $8,659 $14,467 $5,808 67
439631 Fayette Beauty Academy GA $6,257 $10,437 $4,180 67
182999 New England School of Hair Design NH $12,941 $21,539 $8,598 66
166595 Mansfield Beauty Schools-Quincy MA $10,776 $17,780 $7,004 65
449746 Carib Technological Institute PR $1,528 $2,521 $993 65
160320 Aveda Institute-Covington LA $10,937 $17,996 $7,059 65
159513 Aveda Institute-Baton Rouge LA $11,732 $19,132 $7,400 63
142869 Alvareitas College of Cosmetology-
Edwardsville IL $8,146 $13,188 $5,042 62
476902 Mitsu Sato Hair Academy KS $7,780 $12,587 $4,807 62
208044 Woodward Beauty College OK $13,060 $21,055 $7,995 61
469647 Star Career Academy-Clifton NJ $15,236 $24,519 $9,283 61
118994 Moler Barber College CA $7,354 $11,784 $4,430 60
166586 Mansfield Beauty Schools-Springfield MA $11,522 $18,375 $6,853 59
105701 Hair Academy of Safford AZ $3,404 $5,403 $1,999 59
459295 The Salon Professional Academy-Colorado
Springs CO $8,909 $14,130 $5,221 59
217828 Charzanne Beauty College SC $9,403 $14,817 $5,414 58
383163 La Belle Beauty Academy FL $10,533 $16,588 $6,055 57
449603 Success Schools IN $9,565 $14,884 $5,319 56
117955 Lu Ross Academy CA $9,999 $15,492 $5,493 55
199005 Mitchells Hairstyling Academy-Wilson NC $4,811 $7,413 $2,602 54
419271 St Louis Hair Academy MO $15,396 $23,671 $8,275 54
456144 MediaTech Institute-Austin TX $12,014 $18,455 $6,441 54
177287 Elaine Steven Beauty College MO $9,110 $13,943 $4,833 53
431026 BIR Training Center IL $10,676 $16,287 $5,611 53

51
Unit ID Name of Institution State 2011–12 2013–14
Increase in
Dollars
Percent Change
123350 Sierra College of Beauty CA $7,355 $11,198 $3,843 52
457642 Marketti Academy of Cosmetology MI $5,108 $7,753 $2,645 52
440086 Star Career Academy-Egg Harbor NJ $13,136 $19,902 $6,766 52

52
Appendix III: CATEF Review Guidelines
After a CATEF survey has been completed and locked, a reviewer reads all responses to determine if
institutions gave thorough and relevant responses for each required cost area. The guidelines below
outline the questions considered during the review process. If one or more problems are found during
review, the survey is sent back to the CATEF contact person for further clarification. Institutions are
required to make corrections to their surveys and resubmit them by a new deadline.
Review Guidelines:
⚫ Did the user answer the question?
⚫ Did the response match data for the years relevant to the survey?
⚫ Does the user’s explanation contradict the IPEDS Finance data and data from other sources?
For example, the explanation mentioned a decrease in FTE but IPEDS data showed an
increase.
⚫ Did the user explain what “other expenses” consisted of?
⚫ Were any of the institution’s other expenses already accounted for in another area? For
example, scholarships, research, salaries, etc.
⚫ If the same response was provided for each cost area, did the response appropriately address
the specific increase in each cost area with enough depth and clarity?
⚫ If the institution had no increase or a negative increase in its expenses, did the user explain
why the school is on the CATC list?
⚫ If the user explained a change in the school’s methodology, did the user provide an
explanation of the changes and how the change affected the outcome of the school’s costs?
⚫ If the user provided explanations in the form of a list, were the explanations clear and
complete? For example, “staff, students” would not be an appropriate response; the user
would need to explain what specifically occurred with the school’s staff and students.
⚫ If the user entered a response in the form of a table, request clarification. Note: Tables are
difficult to read on the survey summary screen.
⚫ If the user claimed a mistake in reporting, the user was required to thoroughly explain these
mistakes, including how the reporting mistakes will be avoided in the future. Note: Ensure the
user was looking at the correct data years.

53
Appendix IV: 2017 Tuition and Fees CATEF
The following is an example of the Tuition and Fees CATEF. The IPEDS Finance component chart found in
Section 2 may differ depending on the format for the collection of this data in IPEDS. This and other survey
details are explained in 2.2 The CATEF Survey.

54

55

56

57

58

59

60
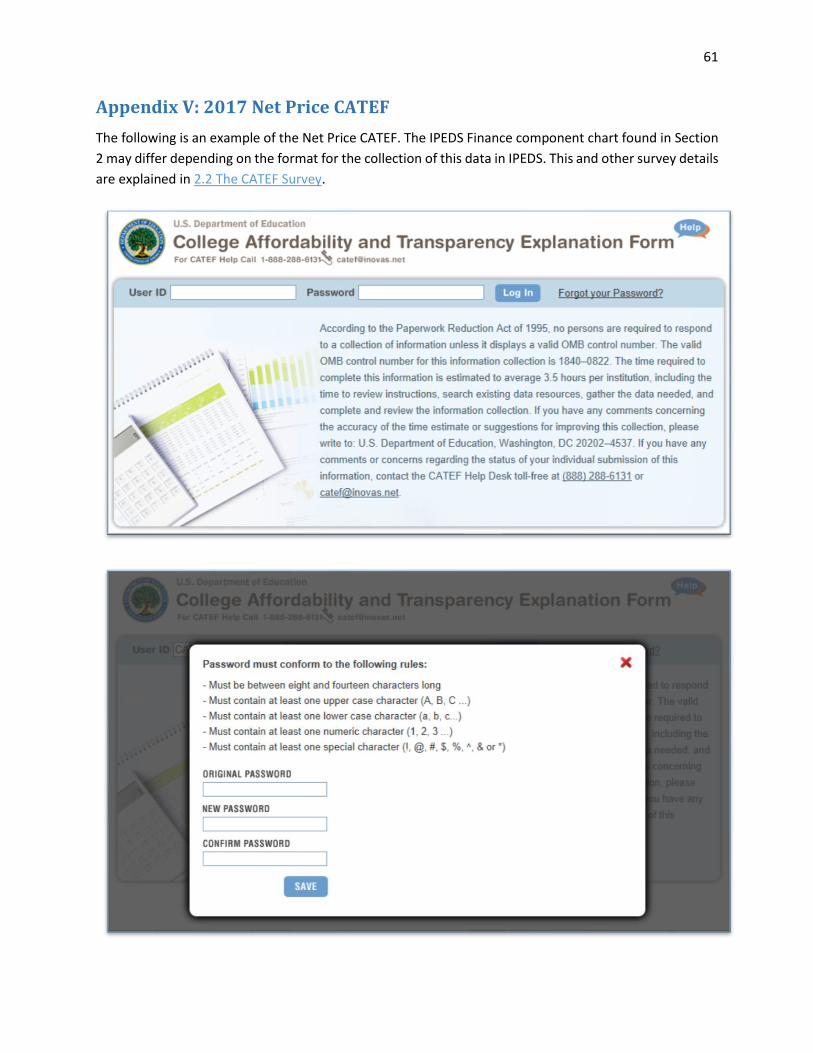
61
Appendix V: 2017 Net Price CATEF
The following is an example of the Net Price CATEF. The IPEDS Finance component chart found in Section
2 may differ depending on the format for the collection of this data in IPEDS. This and other survey details
are explained in 2.2 The CATEF Survey.
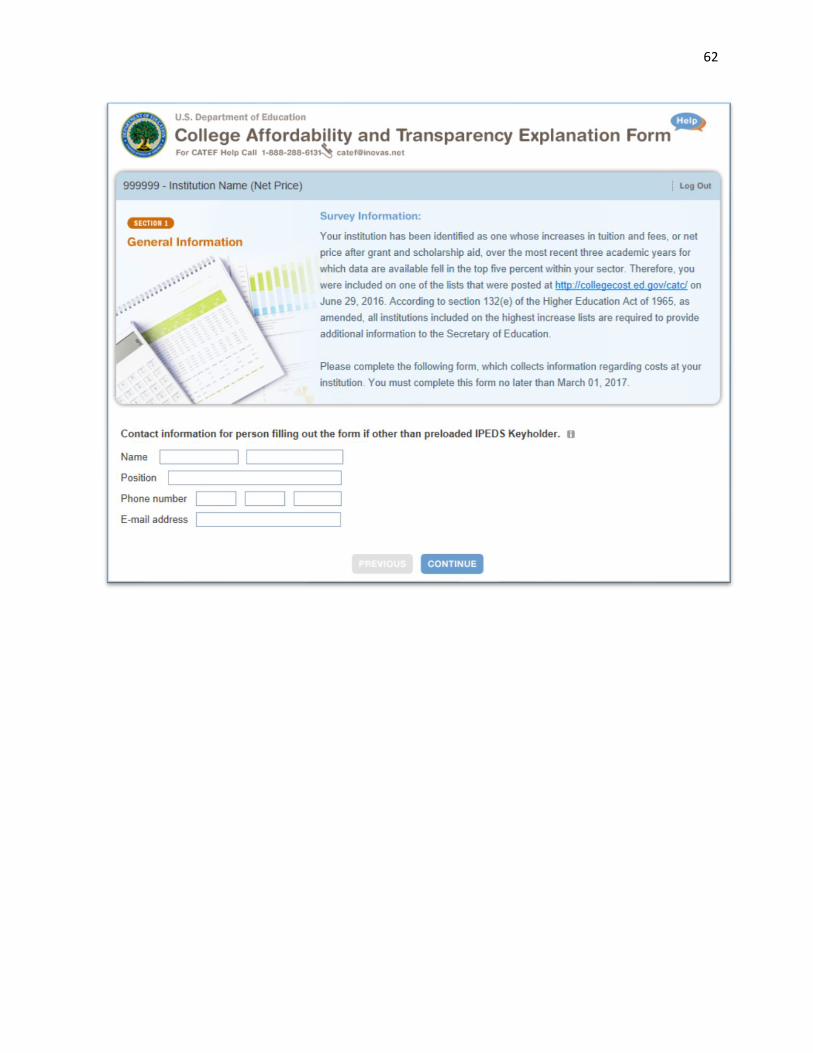
62

63

64

65

66
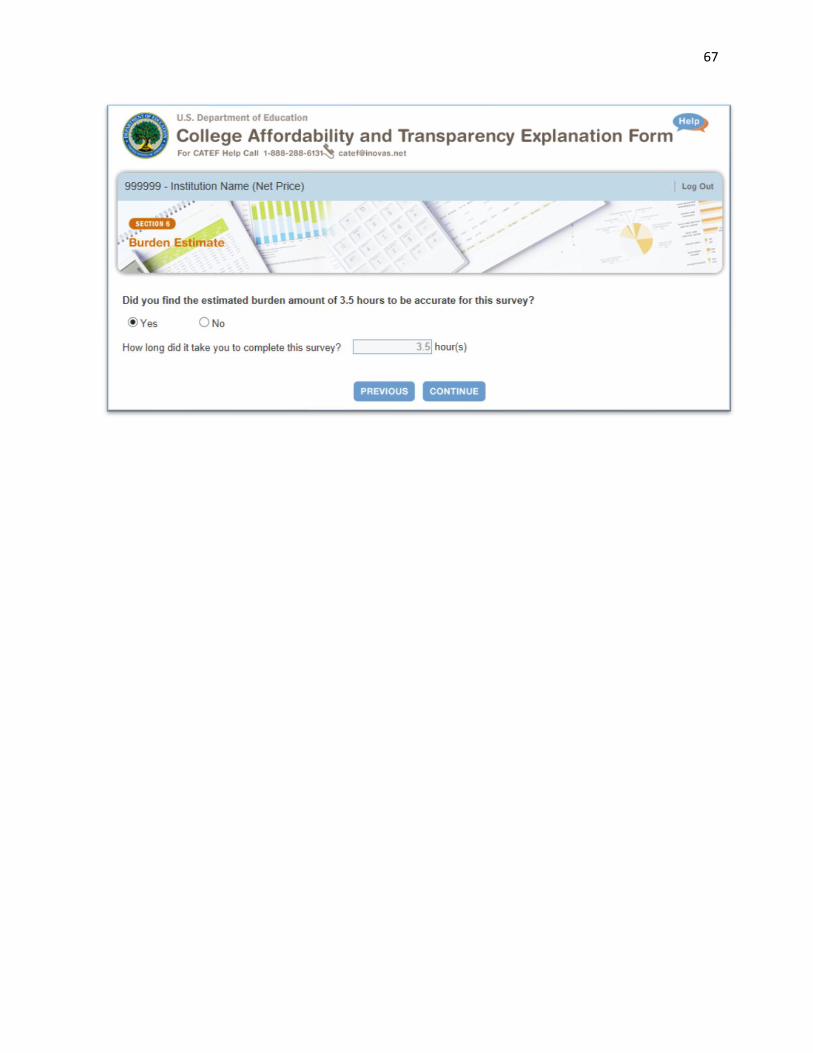
67

68

69
Appendix VI: Glossary of Terms
Term Definition
Academic support A functional expense category that includes expenses of activities and services that support the institution's primary missions of instruction, research, and public service. It includes the retention, preservation, and display of educational materials (for example, libraries, museums, and galleries); organized activities that provide support services to the academic functions of the institution (such as a demonstration school associated with a college of education or veterinary and dental clinics if their primary purpose is to support the instructional program); media, such as audiovisual services; academic administration (including academic deans but not department chairpersons); and formally organized and separately budgeted academic personnel development and course and curriculum development expenses. Also included are information technology expenses related to academic support activities; if an institution does not separately budget and expense information technology resources, the costs associated with the three primary programs will be applied to this function and the remainder to institutional support. Institutions include actual or allocated costs for operation and maintenance of plant, interest, and depreciation.
Auxiliary enterprises Expenses for essentially self-supporting operations of the institution that exist to furnish a service to students, faculty, or staff, and that charge a fee that is directly related to, although not necessarily equal to, the cost of the service. Examples are residence halls, food services, student health services, intercollegiate athletics (only if essentially self-supporting), college unions, college stores, faculty and staff parking, and faculty housing. Institutions include actual or allocated costs for operation and maintenance of plant, interest and depreciation.
Hospital services Expenses associated with a hospital operated by the postsecondary institution (but not as a component unit) and reported as a part of the institution. This classification includes nursing expenses, other professional services, general services, administrative services, and fiscal services. Also included are information technology expenses, actual or allocated costs for operation and maintenance of the plant, interest and depreciation related to hospital capital assets.
Institutional support A functional expense category that includes expenses for the day-to-day operational support of the institution. Includes expenses for general administrative services, central executive-level activities concerned with management and long-range planning, legal and fiscal operations, space management, employee personnel and records, logistical services, such as purchasing and printing, and public relations and development. Also includes information technology expenses related to institutional support activities. If an institution does not separately budget and expense information technology resources, the IT costs associated with student services and operation and maintenance of plant will also be applied to this function.

70
Term Definition
Instruction A functional expense category that includes expenses of the colleges, schools, departments, and other instructional divisions of the institution and expenses for departmental research and public service that are not separately budgeted. Includes general academic instruction, occupational and vocational instruction, community education, preparatory and adult basic education, and regular, special, and extension sessions. Also includes expenses for both credit and non-credit activities. Excludes expenses for academic administration where the primary function is administration (e.g., academic deans). Information technology expenses related to instructional activities are included if the institution separately budgets and expenses information technology resources (otherwise these expenses are included in academic support). Institutions include actual or allocated costs for operation and maintenance of the plant, interest, and depreciation.
Net grant aid to students The portion of scholarships and fellowships granted by an institution that exceeds the amount applied to institutional charges, such as tuition and fees or room and board. The amount reported as expense excludes allowances.
Net Price The Higher Education Opportunity Act of 2008 defines institutional net price as "the average yearly price actually charged to first-time, full-time undergraduate students receiving student aid at an institution of higher education after deducting such aid." In IPEDS, average institutional net price is generated by subtracting the average amount of federal, state/local government, or institutional grant and scholarship aid from the total cost of attendance. Total cost of attendance is the sum of published tuition and required fees (lower of in-district or in-state for public institutions), books and supplies, and the weighted average for room and board and other expenses. Cost of attendance data are collected in the Institutional Characteristics (IC) component of IPEDS, and financial aid data are collected in the Student Financial Aid (SFA) component of IPEDS.
Public service A functional expense category that includes expenses for activities established primarily to provide noninstructional services beneficial to individuals and groups external to the institution. Examples are conferences, institutes, general advisory service, reference bureaus, and similar services provided to particular sectors of the community. This function includes expenses for community services, cooperative extension services, and public broadcasting services. Also includes information technology expenses related to the public service activities if the institution separately budgets and expenses information technology resources (otherwise these expenses are included in academic support). Institutions include actual or allocated costs for operation and maintenance of the plant, interest, and depreciation.
Research A functional expense category that includes expenses for activities specifically organized to produce research outcomes and commissioned by an agency either external to the institution or separately budgeted by an organizational unit within the institution. The category includes institutes and research centers, and individual and project research. This function does not include nonresearch sponsored programs (e.g., training programs). Also included are information technology expenses related to research activities if the institution separately budgets and expenses information technology resources (otherwise these expenses are included in academic support). Institutions include actual or allocated costs for operation and maintenance of the plant, interest, and depreciation.

71
Term Definition
Scholarships and fellowships
That portion of scholarships and fellowships granted that exceeds the amount applied to institutional charges, such as tuition and fees or room and board. The amount reported as expense excludes allowances and discounts.
Sector One of nine institutional categories resulting from dividing the universe according to control and level. Control categories are public, private not-for-profit, and private for-profit. Level categories are four-year and higher (four year), two-but-less-than four-year (two year), and less than two-year. For example: Public, four-year is one of the institution sectors.
Student services A functional expense category that includes expenses for admissions, registrar activities, and activities whose primary purpose is to contribute to students’ emotional and physical well-being and to their intellectual, cultural, and social development outside the context of the formal instructional program. Examples include student activities, cultural events, student newspapers, intramural athletics, student organizations, supplemental instruction outside the normal administration, and student records. Intercollegiate athletics and student health services may also be included except when operated as self-supporting auxiliary enterprises. Also may include information technology expenses related to student service activities if the institution separately budgets and expenses information technology resources (otherwise these expenses are included in institutional support). Institutions include actual or allocated costs for operation and maintenance of the plant, interest, and depreciation.
Title IV institution An institution that has a written agreement with the secretary of education that allows the institution to participate in any of the Title IV federal student financial assistance programs (other than the State Student Incentive Grant (SSIG) and the National Early Intervention Scholarship and Partnership (NEISP) programs).
Tuition and fees (published charges)
The amount of tuition and required fees covering a full academic year most frequently charged to students. These values represent what a typical student would be charged and may not be the same for all students at an institution. If tuition is charged on a per-credit-hour basis, the average full-time credit hour load for an entire academic year is used to estimate average tuition. Required fees include all fixed sum charges that are required of such a large proportion of all students that the student who does not pay the charges is an exception.