Embed Size (px)
Citation preview

2013
Julia Spaude
SURCA: Showcase for Undergraduate
Research and Creative Activities
3/29/2013
Commercial Farming in Guatemala Correlated with Chronic Malnutrition
for Indigenous Mayan Population

1
“The gods made the first Maqya-Quices out of clay. Few survived. They were soft, lacking
strength; they fell apart before they could walk.
Then the gods tried wood. The wooden dolls talked and walked but were dry; they had no blood
or substance, no memory and no purpose. They didn’t know how to talk to the gods, or couldn’t
think of anything to say to them.
Then the gods made mothers and fathers of corn. They molded their flesh with yellow and white
corn.
The women and men of corn saw as much as the gods. Their gaze ranged over the whole world.
The gods breathed on them and left their eyes forever clouded, because they didn’t want people
to see over the horizon.”
Popol Vuh1 (K’iche’ Mayan creation text, title translated as “Book of the Community”)
“Sown to be eaten, it is the sacred substance of the men who were made of maize. Sown to make
money, it means famine for the men who were made of maize.”
‘Men of Maize’ Miguel Angel Asturias2
“… those who sow maize for profit leave the Earth empty of bones, because it is the bones of the
forefathers that give the maize, and then the Earth demands bones, and the softest ones, those of
children, pile up on top of her and beneath her black crust to feed her.”
‘Men of Maize’ Miguel Angel Asturias3
1 Anonymous. [revision of original document] Dennis Tedlock. Popol Vuh: The Mayan Book of
the Dawn of Life. 2nd
ed. 2011. [translation]
2 Asturias, Miguel Angel. Men of Maize. Buenos Aires: Dell Publishing Co., Inc., 1975.
[translation] 3 Asturias, Miguel Angel. Men of Maize. 1975. [translation]

2
I. PREFACE
The data for this study has been drawn from international agencies with the professed
goal of collecting and organizing statistical data for the bettering of the economies participating
in the global market. Data from agencies primarily concerned with regional economic
development for the advance of global trade and development such as The World Bank (WB),
The Food and Agricultural Organization of the United Nations (FAOSTAT), and The National
Institute of Statistics of Guatemala (INE), have been reviewed and used. Data from agencies
primarily concerned with advancing social welfare and regional standards of living has also been
included, these include United Nations International Children’s Emergency Fund (UNICEF),
The World Health Organization (WTO), and The United Nations Development Programme
(UNDP). Data from a wealth of academic sources documenting the life and challenges of the
impoverished Mayan natives of Guatemala, as well as select primary accounts have been
integrated into this essay as well.
The data in this essay compares changes in the quantities of crops produced, the
percentage of crops exported rather than consumed domestically, and the prices of the Maya
population’s staple crops; maize and beans. The data covers a 10-year span of time, contrasting
the year 2001 with 2010. This data interval was chosen simply because it avoided the devastating
civil wars in Guatemala which lasted until 1996, which in addition to the damage to human life,
wreaked havoc on the economy and halted many sectors of production crucial to a socio-
economic analysis. As 2010 is the most recent publication of complete data in all of the
economic sectors analyzed, this 10-year interval best serves to capture the adjustments in
economic outputs & inputs over a recent period of time. This data is then compared to various
markers of economic power to determine if there is a significant correlation between agricultural

3
production trends and the ability of people in Guatemala, particularly the Mayan people, to
purchase the basic foodstuffs they need to meet their daily needs. The markers of economic
power used are the Income Gini Coefficient, the Multidimensional Poverty Index (MPI), and the
PPP GNI or the Gross National Income per capita converted to international dollars using
purchasing power parity.
This essay concerns trends in Guatemala’s domestic agricultural production within the
corporate commercialized farming industry, and how these changes relate to the distribution of
food within the nation of Guatemala. Focused upon, is the variation in the degree of agricultural
production which is produced as cash crops to be exported, as opposed to production for local
consumption. Particularly the study uses monetary measures of income and purchasing power
within the population with a specific focus on poverty within the indigenous Mayan population.
The hypothesis of this research was that as the intensification of land for agricultural use
increased, economic power and consequently rates of malnutrition would decline among the
urban population and increase among the rural populations, particularly populations which were
either not fully integrated into the wage labor system or were among the lowest earning
occupations. The reasoning for this was that as the production of cash crops, or primarily export-
oriented agricultural production increases, the degree of poverty and malnutrition in the overall
population would decrease. This would be due to the construction of infrastructure and
transportation systems in the country, as private industry oriented the economy towards
participation in the global market. As the construction of infrastructure resulted in increased
urbanization, the concentration of the domestic market would result in an incrementally raised
standard of living for the urban population alone. However, the appropriation of land for use in
both cash crop production and for the production of food for sale to the domestic population

4
presents a disadvantage for populations not integrated into the wage-labor system and
populations in the lowest earning occupations. These populations previously engaged in small-
scale agricultural production would be eventually forced to sell off their land to the large-scale
production corporations as land taxes and other variables, such as hunger brought on by
decreased yields due to environmental conditions, required them to utilize monetary currency to
either pay bills or buy food. With the loss of their land previously used for self-subsistence, this
population would be forced to engage in wage-labor to buy their food, likely occupations which
require a large, unskilled labor force, such as hard labor, factory work, and manual agricultural
labor for large corporations. These jobs would be by their profit-oriented nature, very low wage
jobs which would create a high rate of poverty and malnutrition among this particular
population.
From these deliberations, it can be hypothesized that in such a situation the indigenous
Maya population would depict very low levels of purchasing power which would result in high
rates of malnutrition in comparison to the overall population. Research has found that high rates
of malnourishment are particularly concentrated among the rural agricultural worker class,
particularly the indigenous populations of the region, which also have a significantly lower
salary than the average of the population as a whole.

5
CONTENTS
I. PREFACE……………………………………………………………………………. 1
a. Statistical sources
b. Research methods
c. Summary
II. INTRODUCTION……………………………………………….…………………… 6
a. Issue & thesis
b. Colonial history
III. DISTRIBUTION OF ECONOMIC POWER…………………………………..……. 9
a. Demography
b. Distribution of wealth
IV. PRODUCTION PRIORITIES FOR COMMERCIAL FARMING……………….... 10
a. Trends in agricultural production
b. Production of export-oriented crops
c. Production preferences for commercial farmers
V. CONCLUSION……………………………………………….……………………. 24
a. Summary of findings and conclusions
b. Appendix of Tables
c. Bibliography

6
II. INTRODUCTION
The mass privatization of Guatemala’s arable land to commercialized farming
corporations results in the expansion of the production & export of cash crops rather than the
production of subsistence goods for domestic consumption. This trend has greatly undermined
the ability of the rural Guatemalan people to sustain themselves. The farmland in the nation is
used primarily for cash-crop agriculture which in turn makes it so a disproportionate amount of
food-goods are available for local consumption which raises the prices on these goods due to
scarcity. The people who were previously land-owning, self-sustaining farmers in their own right
are now becoming reliant on the very low wage jobs within the commercialized farming industry
to buy their food. The resulting lack of purchasing power among rural Guatemalans, particularly
of the indigenous Mayan population, has resulted in wide spread malnutrition and poverty in
Guatemala. However, while the standard of living for rural Guatemalans either stays stagnant or
declines, the income of the small group of wealthy Ladino landowners is climbing as they
increasingly convert what was previously land used for growing staple food crops to much more
profitable crops such as sugar, bananas, and oil palm fruit for export to the wealthy nations of the
world. In the attempt to develop their economy, Guatemala is urbanizing, privatizing land, and
expanding commercialized farming; all strategies which impoverish the Maya of their cropland,
creating vast malnourishment and forcing the Maya into a cycle of debt-slavery similar to that of
the colonial era. As commercialized farms expand in Guatemala, the Maya’s cropland is split up
forcing them in the wage-labor economy, this results in an increase in malnutrition among the
rural populations, particularly populations which are either not fully integrated into the wage
labor system or are among the lowest earning occupations.

7
Guatemala is a lush nation located in Central America just South of the U.S. and is on the
border of Mexico and Belize to the North, and Honduras, and El Salvador to the Southeast. The
Human Development Index (HDI) is a widely used economic measure from the United Nation’s
Development Program (UNDP), which calculates economic growth within nations around the
globe to determine how it affects levels of human development within the nation4. Variables
calculated into determining a nation’s score are; life expectancy, education, income, inequality,
poverty, gender equality, sustainability, demography, access to basic technology, and economic
trade and production 5. In the most recent 2013 publication of the United Nation’s Development
Programme’s (UNDP) Human Development Index (HDI), Guatemala ranked low at #133 out of
the 186 countries with workable data collected6. On a scale of 1.000 as the marker of the highest
HDI in a nation, Guatemala has a score of 0.581, an improvement of only 0.149 from its 1980
score of 0.4327. Guatemala’s low ranking is primarily due to the nation’s high level of poverty,
high gender inequality in the labor force, high maternal mortality ratio, high infant mortality
rates, and a low life expectancy within the rural population8. Guatemala places above only one
nation in the entirety of Latin America and the Caribbean, Haiti, which ranks at #161 on the HDI
with a score of 0.4569. Guatemala’s HDI score is just barely ahead of the vastly impoverished
nations of Ghana (#135) & India (#136), while in comparison, the United States of America
4 United Nations Development Programme. Human Development Report: Guatemala 2013. 2013.
http://hdr.undp.org/en/. 5 United Nations Development Programme. Human Development Report: Guatemala 2013. 2013.
6 United Nations Development Programme. Human Development Report: Guatemala 2013. 2013.
7 United Nations Development Programme. Human Development Report: Guatemala 2013. 2013.
8 United Nations Development Programme. Human Development Report: Guatemala 2013. 2013.
9 United Nations Development Programme. Human Development Report: Guatemala 2013. 2013.

8
ranks #3 on the HDI with a high score of 0.93710
. Knowledge of the history of Guatemala is
absolutely essential in understanding the roots of the nation’s economic situation, as well as
nature of the unequal relationship between the Ladino & Maya populations.
The indigenous Maya population was colonized c. 1524 by the Spanish whom turned the
region into a cash crop economy for almost three centuries11
. The Spanish seized the land of the
indigenous people, mostly Maya, and through violence and hunger from the loss of theirs lands,
the Maya were forced to work for the Spanish in the cultivation of cash crops on their land12
.
After gaining independence from Spain in 1821, control of Guatemala quickly fell to a long
series of dictators whose control over the people was facilitated by the United Fruit Company
(now called Chiquita), which further seized large tracts of land from the natives in order to
expand the production of its cash crops, such as sugar, bananas, and coffee13
. Throughout the
Cold War, the United States also backed both the efforts of the UFC as well as dictators in their
effort to halt the spread of communism and efforts at the redistribution of land in the nation14
.
Civil war broke out in Guatemala in 1960 and lasted until 1996, as leftist groups such as The
Guerrilla Army of the Poor (EGP) and the Organization of the People in Arms (ORPA) sought to
overthrow the tyrannical government and its army15
. The leftist groups joined together with
others in the region to form the Guatemalan National Revolutionary Party (URNG). Notably, the
10
United Nations Development Programme. Human Development Report: Guatemala 2013. 2013. 11
Central Intelligence Agency. “Central America and the Caribbean: Guatemala”. The World Factbook. U.S.A: U.S. Government, February 13, 2013. www.cia.gov.
12 Central Intelligence Agency. The World Factbook. 2013.
13 Central Intelligence Agency. The World Factbook. 2013.
14 Central Intelligence Agency. The World Factbook. 2013.
15 Guatemalan National Revolutionary Party. 2013. www.urng-maiz.org.gt.

9
URNG’s symbol is an open ear of maize- a symbolization of their direct opposition to the cash-
crop oriented economics of the dictatorships and UFC16
.
The history of the nation is important because the forced appropriation of land from the
Maya people by the descendants of the Spanish colonizers, the Ladinos, is still a large issue
today, and one of the major causes of the poverty of the Maya. In the text Guatemala: A Guide to
People, Politics, and Cultures, Trish O’ Kane goes as far as to refer to Guatemala by its
longstanding nickname, the “banana republic” for it is colonial markers of the extreme unequal
distribution of land and wealth, its unequal development, and its heavy dependence on both its
export crops and foreign investment17
. In fact, Guatemala’s economic development has changed
only remotely over the centuries, the nation is still based on the original colonial model of
landholding elites appropriating the land of the indigenous population, and then employing them
at extremely low wages to increase their own profits, while reinvesting very little back into the
local economy18
. The agricultural industry still leans heavily on the cultivation of cash crops for
the export industry, and land is still appropriated from the Maya for this purpose, increasing the
fortunes of the rich while systematically trapping the Maya people in a vicious cycle of poverty.
16
Guatemalan National Revolutionary Party. 2013.
17 O’ Kane, Trish. Guatemala: A Guide to People, Politics, and Culture. New York: Interlink Publishing Group, Inc.,
1999. 42. 18
O’ Kane, Trish. Guatemala: A Guide to People, Politics, and Culture. 42.

10
III. DISTRIBUTION OF ECONOMIC POWER
The Central Intelligence Agency’s World Factbook hosts an expansive collection of
statistics and other data on the nations of the world, ranging from history, population,
government, and the military to economics, energy use, and communications and transportation
systems. Guatemala is rife with poverty, violence, and malnutrition and an astonishing 73% of
the indigenous population which make up 40% of the entire nation’s population, live in poverty,
and around 50% of the nation’s children under the age of 5 are moderately to severely
malnourished19
. Currently, as of 2012, 54% of the entire population of Guatemala, or roughly
7,613,477 people, are at or below the poverty line20
. The nation has both the highest population
growth rate in Latin America at 1.948% and the youngest population with around half being
younger than 19 years of age21
. Income distribution is vastly unequal and mainly divided along
the lines of who owns land and who doesn’t, the lowest 10% hold only 1.3% of the nation’s
wealth while the highest 10% hold 29.9%22
.
In Table 1: Demography; 2001, 2010 [Guatemala], the statistics show currently over
half of the population of Guatemala live in rural areas , the majority of which are both employed
in agricultural production and are of Maya ethnicity (Table 1 ). The contemporary urban capital
of the nation is Guatemala City, where a majority of Spanish-speaking 59.4% of Ladino and
European population reside, as well as the majority of the middle and upper class population23
.
19
Central Intelligence Agency. The World Factbook. 2013.
20 Central Intelligence Agency. The World Factbook. 2013.
21 Central Intelligence Agency. The World Factbook. 2013.
22 Central Intelligence Agency. The World Factbook. 2013.
23 Central Intelligence Agency. The World Factbook. 2013.

11
Table 1
Demography; 2001-2010 [Guatemala]
Year Agricultural
Population
Rural Population Indigenous Population
(Maya)
Total Population
in millions percent of
total
in millions percent of
total
in millions percent of total in millions percent of
total
2010 6,059,000 42.1% 8,330,000 57.9% 5,827,545 40.5% 14,389,000 100%
2001 5,720,000 49.7% 5,793,000 50.3% 4,662,765 40.5% 11,513,000 100%
Total
Source: FAOSTAT; 2001, 2010
*all data values have been rounded to the 1000th
place
*Indigenous population constitutes the Mayan groups K’lche (9.1%), Kaqchikel (8.4%), Mam
(7.9%), Q’eqchi (6.3%), Other Mayan (8.6%), and indigenous non-Mayan (0.2%)
*40.5% is FAOSTAT’s set approximation of the indigenous population for the years 2001-2010
The 2nd
half of the population is made up by the Maya, a people indigenous to the land,
with a complex culture, social structure, and advanced agricultural techniques. In 2010, near
58% of the population of Guatemala lived in rural settings, and 42% worked in agriculture,
mainly Maya who make up about 41% of this ( Table 1). According to many international
economics organizations such as the World Bank and the International Monetary Fund, the
standard of living is improving in Guatemala. However, even as wealth and economic activity
increases in the nation, the living situation of the poor is not improving, and in many cases it is
getting worse.
While per capita GNI (Gross National Income) of a nation is a popular measure of
poverty, it is only useful in measuring monetary wealth on an average at the macro scale and
cannot pinpoint which populations in society are benefiting. While this is much more effective
when applied to urban populations, it has very limited use when measuring purchasing power in
rural communities. For instance, in the case of the Guatemala, while the GNI of the nation is

12
increasing the income share of the lowest classes are stagnant or declining and as the population
grows, the purchasing power of these people is actually declining ion most areas. Data from the
World Bank’s statistics World Development Indicators, while having incomplete data from
2007-2012, shows that income shares in Guatemala have not improved much in the lower
classes. The lowest 20% & 10% of the population actually saw a significant decline in their
income shares from 2000 to 2006, with the lowest 20% going from 3.54% of the GNI in 2000 to
only 3.08 in the year 200624
. Similarly, the lowest 10% of Guatemala’s population went from
making a tiny 1.13% of the GNI in 2000 to only 1.06 in 200625
! By using the GNI we can
calculate the income of these groups, shown in Table 2 : Measures of Economic Wealth; 2000,
2006 [Guatemala], we can see that while the amount of money which these groups made
increased slightly, their actual purchasing power declined in response to other variables in the
market.
All variables taken into account, even though the GNI grew by almost $10 ½ billion
between the year 2000 and 2006, the percent of this increase which benefited the poorest 20%
and below actually declined instead of increased (Table 2 ). This means that the average person
living in poverty, the majority of which are rural Maya agricultural workers, saw their monthly
wages in the fields go up by around $5 in a period of 7 years (Table 2). In Howard Leathers and
Phillip Foster’s text The World Food Problem, the issues of both unequal income distribution
and malnutrition are noted in the correlation they have with the rising standard of living, both
domestically and internationally. As the average income of an individual increases, both the
24 World Bank Group. World Development Indicators. New York: United Nations, 2013.
www.worldbank.org. 25 World Bank Group. World Development Indicators. 2013. www.worldbank.org.

13
Table 2
Measures of Economic Wealth; 2000, 2006 [Guatemala]
Economic Wealth Measure by Population 2000 2006
Total Population
Population (total) 11,237,101 13,034,904
GNI $19,064,941,281.80 $29,550,730,543.00
GNI per capita $1,730.00 $2,220.00
Lowest 20% of Population
Population (20% of total) 2,247,420 2,606,981
Income Share (total) $674,898,921.37 $910,162,500.72
Percent of GNI 3.54% 3.08%
Annual Income per Person (average) $300.30 $349.12
Monthly Income per Person (average) $25.02 $29.09
Daily Income per Person (average) $0.82 $0.96
Lowest 10% of Population
Population (10% of total) 1,123,710 1,303,490
Income Share (total) 215,433,836.48 333,923,255.14
Percent of GNI 1.13% 1.06%
Annual Income per Person (average) $191.72 $256.18
Monthly Income per Person (average) $15.98 $21.35
Daily Income per Person (average) $0.53 $0.70
Source: World Bank, World Development Indicators; 2000, 2006
*All values are in current USD
*All data values are approximations rounded to the nearest 10th
quantity and variety of food they consume also increases drastically, leaving less for those
without such purchasing power26
.For Guatemala, the affordability of food for the poorest people
26 Leathers, Howard D., Foster, Phillips. The World Food Problem: Tackling the Causes of
Undernutrition in the Third World. 3rd
ed. London: Lynne Rienner Publishers, 2004.

14
is determined by the consumption patterns of the people they nations exports to, the people who
are often in much more wealthier countries of the world, for Guatemala, primarily the U.S.27
.
II. PRODUCTION PRIORITIES FOR COMMERCIAL FARMING IN GUATEMALA
Guatemala’s primary agricultural products are sugarcane, maize, bananas, coffee, beans,
cardamom, cattle, sheep, pigs, and chickens28
. The most recent data from 2012, shows that the
nation exported around $9.864 billion, largely coffee, sugar, petroleum, apparel, bananas, fruits
and vegetables, and cardamom29
. Imported goods totaled $15.57 billion and were composed
primarily of fuels, machinery, construction materials, grain, fertilizers, electricity, mineral
products, chemical products, and plastic materials30
.
While Guatemala’s major export products in the manufacturing industry, the natural
resources industry, and in processed livestock products form a large and important part of the
nation’s economy, as well as their land and labor use, they are not variables which have been
included in this study. This is primarily for the reason that the focus of this study is the
appropriation of the indigenous population’s agricultural land for use in agricultural cash
cropping specifically, and the effect that has on access to food in the nation. Therefore non-food
sources, while relevant as wage-earning jobs enabling food purchase, are not included in the
narrow scope of this study. Also, livestock products are not included because their historically
27
Leathers, Howard D., Foster, Phillips. The World Food Problem: Tackling the Causes of
Undernutrition in the Third World. 2004 28
Central Intelligence Agency. The World Factbook. 2013. 29
Central Intelligence Agency. The World Factbook. 2013. 30
Central Intelligence Agency. The World Factbook. 2013.

15
high prices greatly limit their consumption by the lowest wage earners in Guatemala, to the
degree that vegetables are almost always a more fiscally accessible alternative. In order to
measure only the largest-scale agricultural products, only crops which were produced in excess
of 99,999 tonnes annually between the years 2001 and 2010 have been analyzed in this study.
Access to food, as aforementioned, has consistently been one of the biggest problems in
Guatemala’s history due to the long colonization of the nation, which brought both the nation’s
economic transformation into a cash crop economy, in addition to the prejudice and violence
against the indigenous population. The Food and Agricultural Organization of the United
Nations (FAOSTAT) provides a wealth of detailed statistics on production, trade, population,
and land use among other things on the vast majority of the nations of the world in the FAOSTAT
Database, which have been used to configure the tables in this study.
As seen in Table 3: Agricultural Production over a 10 year span;2001-2010
[Guatemala], between the years 2001-2010, the primary agricultural products, produced in
excess of 999,999 tons were bananas, maize, oil palm fruit, and sugar cane (Table 3). Notably,
only one crop, maize, is a food with nutritional value which is also domestically consumed in
Guatemala, while oil palm fruit is wholly an export crop as are the majority of bananas (Table 3).
However, while the production of maize did increase in this interval by 542,520 tons that is still
just a 33.2% increase from its production 10 years ago (Table 3), which is along the lines of a
20% increase in population (Table 3). The majority of Maya grow their own maize however, as it
is a staple crop in their everyday diet.

16
Table 3
Agricultural Production over a 10-year span; 2001-2010 [Guatemala]
Crop Production (tons)
2001
Production (tons)
2010
Change in
tons,
2001-2010
Percentage
Change
2001-2010
For production values at or in excess of 999,999 tons in 2010
Bananas 1,100,000 2,637,570 +1,537,570 +58.2%
Maize 1,091,480 1,634,000 +542,520 +33.2%
Oil Palm Fruit 466,600 1,213,000 +746,400 +61.5%
Sugar Cane 16,934,900 22,216,700 +5,281,800 +23.7%
For production values at or in excess of 99,999 tons in 2010
Beans (dry) 94,656 196,411 +101,755 +51.8%
Coffee (green) 275,700 247,501 -28,199 -10.2%
Lemons & Limes 130,762 107,796 -22,966 -17.5%
Mangos, Guavas, Mangosteens 82,980 105,909 +22,929 +21.6%
Onions (dry) 105,828 121,744 +15,916 +13.0%
Oranges, Mandarins 120,000 149,504 +29,504 +19.7%
Other Melons; Cantaloupes 188,163 480,434 +292,271 +60.8%
Palm Kernels 46,660 121,300 +76,640 +63.1%
Palm Oil 70,000 182,000 +112,000 +61.5%
Papayas 39,000 203,182 +164,182 +80.8%
Pineapples 101,287 234,326 +133,039 +56.7%
Plantains 266,500 192,607 -73,893 -27.7%
Potatoes 226,578 480,994 +254,416 +52.8%
Tomatoes 174,950 300,193 +125,243 +41.7%
Vegetables* 1,020,501 1,553,445 +532,944 +34.3%
Watermelons 126,150 125,163 -987 -0.7%
Total X X X
Source: FAOSTAT; 2001, 2010
*Vegetables includes green beans, cabbages & other brassicas, carrots & turnips, cauliflowers &
broccoli, chillies & green peppers, garlic, leguminous vegetables, lettuce & chicory, okra, onions, green
peas, tomatoes, watermelons, and other melons (such as cantalopes).
*BOLD = production increase in excess of 50%
*Conversion: 1 ton = 2000lbs
17
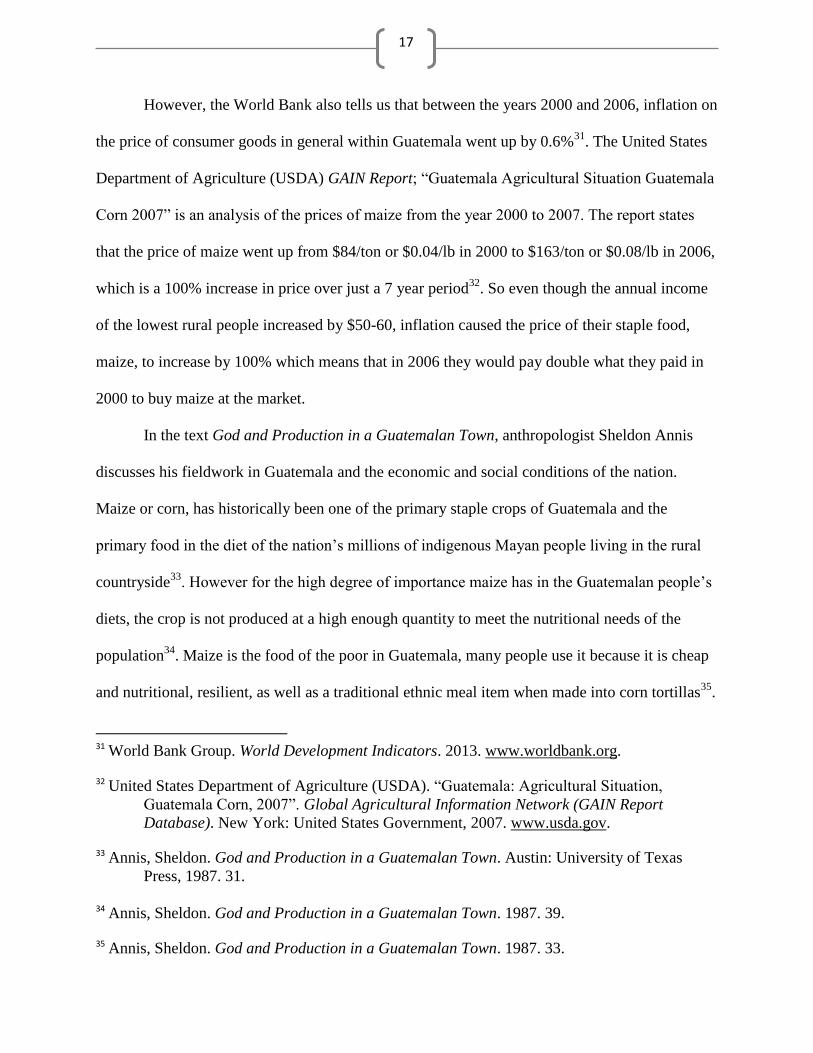
However, the World Bank also tells us that between the years 2000 and 2006, inflation on
the price of consumer goods in general within Guatemala went up by 0.6%31
. The United States
Department of Agriculture (USDA) GAIN Report; “Guatemala Agricultural Situation Guatemala
Corn 2007” is an analysis of the prices of maize from the year 2000 to 2007. The report states
that the price of maize went up from $84/ton or $0.04/lb in 2000 to $163/ton or $0.08/lb in 2006,
which is a 100% increase in price over just a 7 year period32
. So even though the annual income
of the lowest rural people increased by $50-60, inflation caused the price of their staple food,
maize, to increase by 100% which means that in 2006 they would pay double what they paid in
2000 to buy maize at the market.
In the text God and Production in a Guatemalan Town, anthropologist Sheldon Annis
discusses his fieldwork in Guatemala and the economic and social conditions of the nation.
Maize or corn, has historically been one of the primary staple crops of Guatemala and the
primary food in the diet of the nation’s millions of indigenous Mayan people living in the rural
countryside33
. However for the high degree of importance maize has in the Guatemalan people’s
diets, the crop is not produced at a high enough quantity to meet the nutritional needs of the
population34
. Maize is the food of the poor in Guatemala, many people use it because it is cheap
and nutritional, resilient, as well as a traditional ethnic meal item when made into corn tortillas35
.
31 World Bank Group. World Development Indicators. 2013. www.worldbank.org. 32 United States Department of Agriculture (USDA). “Guatemala: Agricultural Situation,
Guatemala Corn, 2007”. Global Agricultural Information Network (GAIN Report
Database). New York: United States Government, 2007. www.usda.gov. 33 Annis, Sheldon. God and Production in a Guatemalan Town. Austin: University of Texas
Press, 1987. 31.
34 Annis, Sheldon. God and Production in a Guatemalan Town. 1987. 39. 35 Annis, Sheldon. God and Production in a Guatemalan Town. 1987. 33.

18
However, maize is not a very profitable crop to produce and so commercial farms turn to crops
like sugar instead to reap a higher profit36
.
Sugar cane is historically one of the crops which has been produced in the largest
quantity in Guatemala due to high international demand, the nation produced over 22 million
tons in 2010, which represented only a 23.7% increase from the almost 17 million tons produced
in 2001 (Table 3 ). However, while the production of sugar did not increase as much as many
other crops, sugar is still produced in a quantity many times greater than any crop in Guatemala.
Cash crops that did increases steeply from 2001-1020 however were bananas and oil
palm fruit (Table 3). Banana production increased by 58.2% in this period, but only 52.6% of the
harvest was exported in 2010, as opposed to 79.4% in 2001 (Table 4 ). The exportation of food
crops such as potatoes and tomatoes also decreased significantly in this period, while their
production nearly doubled (Table 4). These crops were exceptions however, and the majority of
the cash crops had increasingly large quantities of their harvests exported. Coffee, palm oil, and
plantains all increased in the percent of their production exported, and watermelons exports
nearly tripled (Table 4).
In correlation with the changes in production and exportation the percent of the land’s
area which has been converted to permanent cropland has increased. In 2001, permanent
cropland made up 5.5% of the total land area which nearly doubled to 8.8% by the year 200937
.
Permanent cropland is an important concept, because it denotes land on which a particular crop
is cultivated year round, usually cash crops such as cocoa, coffee, and rubber- as such permanent
36 Annis, Sheldon. God and Production in a Guatemalan Town. 1987. 39. 37 Food & Agricultural Organization of the United Nations (FAOSTAT). FAOSTAT Database.
2012. www.faostat.fao.org.

19
Table 4
Export-Oriented Agricultural Production over a 10-year span; 2001-2010 [Guatemala]
Source: FAOSTAT; 2001, 2010
*Vegetables includes green beans, cabbages & other brassicas, carrots & turnips, cauliflowers & broccoli,
chillies & green peppers, garlic, leguminous vegetables, lettuce & chicory, okra, onions, green peas, tomatoes,
watermelons, and other melons (such as cantalopes).
BOLD= Exports in excess of 50% of production
*Conversion: 1 ton = 2000lbs
Crop Fraction of Production
Exported (tons)
2001
Percentage of
Production
Exported
2001
Fraction of Production
Exported (tons)
2010
Percentage of
Production
Exported
2010
For production values at or in excess of 999,999 tons in 2010
Bananas 873,829/1,100,000 79.4% 1,387,516/2,637,570 52.6%
Maize 6,321/1,091,480 0.5% 7,265/1,634,000 0.4%
Oil Palm Fruit N/A/466,600 N/A N/A/1,213,000 N/A
Sugar 1,130,249/16,934,900 6.6% 1,742,083/22,216,700 10.2%
For production values at or in excess of 99,999 tons in 2010
Beans (dry) 3,786/94,656 3.9% 3,451/196,411 1.7%
Coffee (green & roast) 247,590/275,700 89.0% 235,517/247,501 95.1%
Lemons & Limes 1,578/130,762 1.2% 6,041/107,796 5.6%
Mangos, Guavas,
Mangosteens
8,104/82,980 9.7% 15,116/105,909 14.2%
Onions (dry) 17,082/105,828 16.1% 17,925/121,744 14,7%
Oranges, Mandarins 57/120,000 0.04% 102/149,504 0.06%
Other Melons;
Cantaloupes
164,891/188,163 87.6% 323,636/480,434 67.3%
Palm Oil 48,899/70,000 69.8% 152,762/182,000 83.9%
Papayas 2,814/39,000 7.2% 12,470/203,182 6.1%
Pineapples 5,957/101,287 5.8% 10,624/234,326 4.5%
Plantains 76,975/266,500 28.8% 107,990/192,607 56.0%
Potatoes 72,745/226,578 32.1% 33,888/480,994 7.0%
Tomatoes 46,229/174,950 26.4% 31,723/300,193 10.5%
Vegetables* 377,482/1,020,501 36.9% 586,427/1,553,445 37.7%
Watermelons 21,340/126,150 16.9% 68,693/125,163 54.8%
Total X X X X

20
cropland is often a synonym for plantations, can tell us in part the rate at which commercial
farming is expanding38
. This is important when you note that the majority of this land was
appropriated as result of the land area once compromising the indigenous Mayan peoples village
area, communal farming plots, and the forestland and streams which had once supported these
people’s self-sufficient lifestyle. Rigoberta Menchu, a Guatemalan social activist for indigenous
rights expands on her own personal account of the effects which the fragmentation of their land
had on their ability to procure food for themselves in her biography I, Rigoberta Menchu.
When the government parceled the land out and tried to create divisions within the
community - everyone with their own plot, their own bit of land – there wasn’t enough
for us all to live in one place together. They gave us plots which were very separate, a
long way from each other, and many neighbors lived quite a distance away, and the
houses were very far apart… They used this method to separate us but the little plots of
land weren’t big enough to work. We had barely a manzana of land each (1.7 acres)39
.
The expansion of these commercial farms also results in either, the appropriation or the
fragmentation of the Maya’s agricultural land, the primary effect of this being that the Maya can
no longer produce a sufficient quantity of food crops on their land, increasing their dependence
on wage-labor for the commercial farms. Working for these farms also often requires workers to
relocate next to them during harvest season as company transportation is only offered seasonally,
and getting to the farms on foot is time-consuming and often highly dangerous40
. Repetitive
38
Food & Agricultural Organization of the United Nations (FAOSTAT). FAOSTAT Database.
2012. www.faostat.fao.org. 39 Menchu, Rigoberta. I, Rigoberta Menchu: An Indian Woman in Guatemala. Ed. Elisabeth
Burgos-Debray. Britain: Verso Editions and NLB, 1984. 28. [translation]. 40
Menchu, Rigoberta. I, Rigoberta Menchu: An Indian Woman in Guatemala. 1984. 34.
[translation].

21
relocation also decreases the Maya’s own ability to cultivate their harvests, leading to smaller
food yields, and breaks up a community which is highly interdependent.
However, while such export-oriented production policies are supported by international
organization like the World Bank and the International Monetary Fund because they integrate the
nation’s economy more fully into the global economy41
, such policies do not tend to produce
positive results for many people at all. While the notion of the “trickle-down-effect” has notably
raised the standard of living of the upper and middle socio-economic classes and resulted in an
increase in urbanization over the last few years, they tend to crush the poorer classes which are
utilized as mass, cheap labor to move development forward. In Guatemala, the rural Maya
women and their families make up this labor force which allows for the expansion of the
commercial farming industry. The allocation of land to export-oriented production is
problematic, because the practice relies on the theory of trickle-down economics, which
produces unequal costs and benefits across the population. For those in management positions
and those employed in the professional service industry, export-oriented economics tend to
produce an overall positive effect on these classes ability to access food and other resources.
However, as this approach also results in much higher food prices coupled with little to no
increase in the minimum wage afforded to workers at the bottom rungs of the agricultural &
service sectors, it is these people who feel the costs of the system. Particularly, small landholders
and farmers as well as indigenous people see their land appropriated because of rising land taxes,
government divisions of communal agricultural plots, and incorrectly filed land claims, which
41
Food & Agricultural Organization of the United Nations (FAOSTAT). FAOSTAT Database.
2012. www.faostat.fao.org.

22
force them into the low-wage industry due to their inability to produce adequate food on their
land42
.
Lack of food security in Guatemala is due in part to this these low wages in the service
sector combined with export-oriented production & appropriation of the land. According to The
International Food Policy Research Institute, the three pillars of food security are adequate food
production, economic access to available food, and nutritional security; all of which are centered
around sustainable food production43
. Worldwide, women make up more than 50% of the labor
force engaged in 3rd
world agricultural production and the majority of the labor force engaged in
marketing that food domestically44
. Gender norms also produce negative impacts on women,
particularly in the area of women’s health and nutritional needs. Women suffer
disproportionately from lack of economic access to food, as they tend to control a much smaller
fraction of household wealth than men, and the greatest proportion of food available tends to be
consumed by the men, while women’s food portions are often shared with their children45
. When
including non-paid domestic work, women also carry a disproportionate amount of the burden as
they as primarily responsible for child care, cooking, fetching water, washing laundry, as well as
buying clothing and other necessities for the family. Women are often also the primary tenders of
domestic gardens and the marketers of any sellable goods produced. Women often engage in
42
42
Menchu, Rigoberta. I, Rigoberta Menchu: An Indian Woman in Guatemala. 1984. 45.
[translation] 43
Quisumbing, Agnes R., Brown, Lynn R., Feldstein, Hilary Sims., Haddad, Lawrence., Pena, Christine.
“Women: The Key to Food Security.” Food Policy Report. Washington D.C.: The International Food
Policy Research Institute, 1995. 1. 44
Quisumbing, Agnes R., Brown, Lynn R., Feldstein, Hilary Sims., Haddad, Lawrence., Pena, Christine.
“Women: The Key to Food Security.” Food Policy Report. 1995. 2. 45
Quisumbing, Agnes R., Brown, Lynn R., Feldstein, Hilary Sims., Haddad, Lawrence., Pena, Christine.
“Women: The Key to Food Security.” Food Policy Report. 1995. 10.

23
both agricultural work on commercial farms with their husbands, in addition to weaving and
other crafts to generate extra income.
In “Women’s Work in the Global Economy” from the text, Women Worldwide, global
politics professor Juanita Elias discusses woman’s work in the agricultural sector and the many
challenges they face being forced to work for the very corporations which are slowly destroying
not only their way of life, but their community and families as well. Globally, the greatest
amount of woman’s labor force works in agriculture , and as such women play a vital role in the
food production process46
. Rigoberta Menchu, a Guatemalan social activist for indigenous rights
expands on her own personal account of the harsh life of a Maya mother working to support her
family in her biography I, Rigoberta Menchu, in which she recalls the death of her young
brothers.
Two of my brothers died in the finca. The first, he was the eldest, was called Felipe. I
never knew him. He died when my mother started working. They’d sprayed the coffee
with pesticide by plane while we were working, as they usually did, and my brother
couldn’t stand the fumes and died of intoxication. The second one, I did see die. His
name was Nicholas. He died when I was eight… He was two then. When my little
brother started crying, crying, crying, my mother didn’t know what to do with him
because his belly was swollen by malnutrition too… Then the caporal told my mother
that she could bury my brother in the finca but she had to pay a tax to keep him buried
there… So my mother decided that, even if she had to work a month without earning, she
would pay the tax to the landowner, or the overseer, to bury my brother in the finca…
46 Lee, Janet., Shaw, Susan M. “Women’s Work in the Global Economy”. Women Worldwide:
Transnational Feminist Perspectives on Women. New York, McGraw-Hill, 2011. 403.

24
That night the overseer told us…You missed a day’s work. You’re to leave at once and
you won’t get any pay… The fifteen days we worked we weren’t paid. Not only my
mother and I; but my brother had worked fifteen days and wasn’t paid either47
.
Menchu’s description of the utter callousness with which the commercial farm treated her
and her children with is an all too common story all across Guatemala. The Maya people are
looked at as no more than an expendable work force for the most part, and little is done by the
government to enforce laws to protect their civil rights. In addition, the jobs which the Maya can
get in the fields are very low paid, severely devaluing the work of the people, and their added
costs of living keep the Maya employed in a cycle of debt, barely surviving paycheck to
paycheck.
CONCLUSION.
The pushes by the World Bank and the IMF to industrialize and expand the economy of
Guatemala has not translated into an improved standard of living for the vast majority of the
rural Maya people in the nation. These organizations are promoting a developmental strategy that
calls for economic growth, increased urbanization, the mass privatization of space, and the high
consumption of material goods in a wage-labor economy. However, these are all trends in direct
opposition to both the indigenous people’s cultural and spiritual values and a massive detriment
to their very survival. Rather than this approach, a basic-needs developmental approach should
be taken to enable the people to develop medicinal care , improve literacy, and produce increased
quantities of nutritional food crops. In the attempt to develop their economy, Guatemala is
urbanizing, privatizing land, and expanding commercialized farming; all strategies which
47
Menchu, Rigoberta. I, Rigoberta Menchu: An Indian Woman in Guatemala. Ed. Elisabeth
Burgos-Debray. 1984. 38. [translation].

25
impoverish the Maya of their cropland, creating vast malnourishment and forcing the Maya into
a cycle of debt-slavery similar to that of the colonial era.

26
BIBLIOGRAPHY
Annis, Sheldon. God and Production in a Guatemalan Town. Austin: University of Texas Press,
1987.
Anonymous. [revision of original document] Dennis Tedlock. Popol Vuh: The Mayan Book of
the Dawn of Life. 2nd
ed. 2011. [translation]
Asturias, Miguel Angel. Men of Maize. Buenos Aires: Dell Publishing Co., Inc., 1975.
[translation]
Central Intelligence Agency (CIA). “Central America and the Caribbean: Guatemala”. The
World Factbook. New York: U.S. Government, February 13, 2013. www.cia.gov.
Food & Agricultural Organization of the United Nations (FAOSTAT). FAOSTAT Database.
New York: United Nations, 2012. www.faostat.fao.org.
Guatemalan National Revolutionary Party (URNG). Quienes Somos: Origen y desarrollo
(translation: Origin & development). Guatemala City: URNG, 2013. www.urng-
maiz.org.gt.
Kelleher, Ann., Klein, Laura. Global Perspectives: A Handbook for Understanding Global
Issues. 3rd
ed. New Jersey: Pearson-Prentice Hall, 2009.
Leathers, Howard D., Foster, Phillips. The World Food Problem: Tackling the Causes of
Undernutrition in the Third World. 3rd
ed. London: Lynne Rienner Publishers, 2004.
Lee, Janet., Shaw, Susan M. “Women’s Work in the Global Economy”. Women Worldwide:
Transnational Feminist Perspectives on Women. New York, McGraw-Hill, 2011.
Menchu, Rigoberta. I, Rigoberta Menchu: An Indian Woman in Guatemala. Ed. Elisabeth
Burgos-Debray. Britain: Verso Editions and NLB, 1984. [translation]

27
O’ Kane, Trish. Guatemala: A Guide to People, Politics, and Culture. New York: Interlink
Publishing Group, Inc., 1999.
Quisumbing, Agnes R., Brown, Lynn R., Feldstein, Hilary Sims., Haddad, Lawrence., Pena,
Christine. “Women: The Key to Food Security.” Food Policy Report. Washington D.C.:
The International Food Policy Research Institute, 1995.
Schieber, Barbara. Guatemala: “60 Percent of Workers Earn Less then Minimum wage”. The
Guatemala Times. Guatemala City: The Guatemala Times, November 16 2011.
http://www.guatemala-times.com.
United Nations Development Programme. Human Development Report: Guatemala 2013. New
York: United Nations, 2013. http://hdr.undp.org/en/.
United States Department of Agriculture (USDA). “Guatemala: Agricultural Situation,
Guatemala Corn, 2007”. Global Agricultural Information Network (GAIN Report
Database). New York: United States Government, 2007. www.usda.gov.
World Bank Group. World Development Indicators. New York: United Nations, 2013.
www.worldbank.org.