Embed Size (px)
Citation preview
Commercial Fisheries Baseline Economic Assessment -
U.S. Waters of the Great Lakes, Upper Mississippi
River, and Ohio River Basins
April 2012
U.S. Army Corps
of Engineers
Product of the GLMRIS Team
The Great Lakes and Mississippi River Interbasin Study (GLMRIS) Team consists of a regional,
collaborative effort led by the U.S. Army Corps of Engineers (Corps), including various District
and Division offices, as well as Corps Centers of Expertise and Research Laboratories. Products
of the GLMRIS Team are also made possible in collaboration with various federal, state, local,
and non-governmental stakeholders.

(This Page Intentionally Left Blank)
Commercial Fisheries Baseline Economic Assessment i
Table of Contents:
Purpose of Commercial Fisheries Baseline Economic Assessment: .............................................. 1
Terminology: Definitions and Applications ................................................................................... 2
GLMRIS Background Information: ................................................................................................ 5
GLMRIS Study Area ...................................................................................................................... 7
Navigation and Economics Product Delivery Team: ...................................................................... 8
Fisheries Economics Team: ........................................................................................................ 8
Commercial Fisheries Focus: ...................................................................................................... 8
Commercial Fisheries Assessment Overview:.............................................................................. 10
Overview of Study Areas: ......................................................................................................... 10
Great Lakes Basin:................................................................................................................. 10
Upper Mississippi River and Ohio River Basins: .................................................................. 11
Streams Included in Assessment ............................................................................................... 11
Overview of Methodology: ....................................................................................................... 12
Overview of Findings ................................................................................................................ 14
Great Lakes Basin .................................................................................................................. 14
Upper Mississippi River Basin .............................................................................................. 14
Ohio River Basin ................................................................................................................... 14
Great Lakes Basin Baseline Assessment ...................................................................................... 15
Lake Michigan Baseline Assessment ........................................................................................ 19
Lake Erie Baseline Assessment ................................................................................................. 23
Lake Huron Baseline Assessment ............................................................................................. 27
Lake Superior Baseline Assessment ......................................................................................... 31
Lake Ontario Baseline Assessment ........................................................................................... 35
Upper Mississippi River Basin Baseline Assessment ................................................................... 38
Ohio River Basin Baseline Assessment ........................................................................................ 43
Conclusion .................................................................................................................................... 47
References ..................................................................................................................................... 49
Table of Figures:
Table 1: Great Lakes Basin Water Bodies Included in Baseline Economic Assessment ............. 10
Table 2: UMR and Ohio River Basin Water Bodies Included in Baseline Economic Assessment
....................................................................................................................................................... 11
Table 3: Harvest Data Provided by State Agencies ...................................................................... 12
Table 4: Great Lakes Baseline Harvest and Values ...................................................................... 15
Table 5: Great Lakes Commercial Fishing Harvest Levels (Values Shown in Thousands) ......... 16
Table 6: Great Lakes Commercial Fishing Ex-Vessel Values (Values Shown in Thousands) .... 17
Table 7: Summary Statistics for Great Lakes Basin ..................................................................... 18
Table 8: Lake Michigan’s Total Commercial Fishing Harvests ................................................... 19
Table 9: Summary Statistics for Lake Michigan .......................................................................... 20
Table 10: Lake Michigan Baseline Harvest Data by Species ....................................................... 22
Table 11: Harvest Data for Lake Erie ........................................................................................... 23
Table 12: Summary Statistics for Lake Erie ................................................................................. 25
Table 13: Lake Erie Baseline Harvest Data by Species ................................................................ 26
Table 14: Harvest Data for Lake Huron ....................................................................................... 27
Commercial Fisheries Baseline Economic Assessment ii
Table 15: Summary Statistics for Lake Huron ............................................................................. 28
Table 16: Lake Huron Baseline Harvest Data by Species ............................................................ 30
Table 17: Harvest Data for Lake Superior .................................................................................... 31
Table 18: Summary Statistics for Lake Superior .......................................................................... 33
Table 19: Lake Superior Baseline Harvest Data by Species ......................................................... 34
Table 20: Lake Ontario Harvest Data ........................................................................................... 35
Table 21: Summary Statistics for Lake Ontario ........................................................................... 36
Table 22: Lake Ontario Baseline Harvest Data by Species .......................................................... 37
Table 23: Upper Mississippi River Basin Baseline Harvest and Values ...................................... 38
Table 24: Upper Mississippi River Basin Harvest Levels and Values ......................................... 39
Table 25: Summary Statistics for the Upper Mississippi River Basin .......................................... 40
Table 26: Upper Mississippi River Basin Baseline Harvest Data by Species .............................. 42
Table 27: Ohio River Basin Baseline Harvest and Ex-Vessel Value ........................................... 43
Table 28: Ohio River Basin Harvest Levels and Values .............................................................. 44
Table 29: Summary Statistics for the Ohio River Basin ............................................................... 44
Table 30: Ohio River Basin Baseline Harvest Data by Species ................................................... 46
Table 31: Summary Data .............................................................................................................. 48
Figure 1: GLMRIS Study Area Map .............................................................................................. 7
Figure 2: Great Lakes Commercial Fishing Harvest Data ............................................................ 18
Figure 3: Lake Michigan Commercial Fishing Harvests .............................................................. 21
Figure 4: Lake Erie Commercial Fishing Harvests ....................................................................... 25
Figure 5: Lake Huron Commercial Fishing Harvests ................................................................... 29
Figure 6: Lake Superior Commercial Fishing Harvests ............................................................... 34
Figure 7: Lake Ontario Commercial Fishing Harvests ................................................................. 37
Figure 8: Upper Mississippi River Basin Commercial Fishing Harvest Data .............................. 41
Figure 9: Ohio River Basin Commercial Fishing Harvest Data ................................................... 45
Table of Equations:
Equation 1: Ex-Vessel Price ......................................................................................................... 12
Equation 2: Ex-Vessel Value ........................................................................................................ 13
Equation 3: Single Species Harvest Level on a Lake or River ..................................................... 13
Equation 4: Harvest Level of All Species on a Single Lake or River ........................................... 13
Equation 5: Harvest Level of All Species In a Basin .................................................................... 13
Table of Plates:
Plate 1: Great Lakes Basin …...……….…………………………………………………………50
Plate 2: Upper Mississippi River Basin……………………………...…..……………………...51
Plate 3: Ohio River Basin………………………………………………………………………..52
Table of Appendices:
Appendix A: Commercial Fisheries Baseline Economic Assessment Methodology
Commercial Fisheries Baseline Economic Assessment 1
PURPOSE OF COMMERCIAL FISHERIES BASELINE ECONOMIC ASSESSMENT:
In support of the Great Lakes and Mississippi River Interbasin Study (GLMRIS), this report will
establish the current economic value of the commercial fisheries in the U.S. waters of the Great
Lakes, Upper Mississippi River, and Ohio River Basins based on the most recent annual harvest
data available from state agencies (or equivalents) and inter-tribal agencies or organizations. This
document is an assessment of the ex-vessel value of commercial fisheries in these basins- this
includes both tribal and state-licensed commercial harvests. These values will set the baseline
against which future conditions will be compared in GLMRIS.
Commercial Fisheries Baseline Economic Assessment 2
TERMINOLOGY: DEFINITIONS AND APPLICATIONS
Baseline Condition:
According to the U.S. Army Corps of Engineers’ IWR 96-R-21, Planning Manual, the base
condition- referred to as the baseline condition in this report- is the “conditions that exist at the
time of the study.” The Planning Manual states that the study may “rely on average conditions in
recent years rather than precise data for the year of the study” if “the average reasonably
represents the relevant study area conditions.”
This report establishes the baseline condition by utilizing the average of the most recent five
years of harvest data (harvest levels and ex-vessel prices) for commercial fisheries in the U.S.
waters of the Great Lakes Basin, Upper Mississippi River Basin, and Ohio River Basin. The
average was determined to be a more accurate representation of commercial fishing harvests due
to annual harvest level fluctuations.
Without-Project Condition:
According to the U.S. Army Corps of Engineers’ ER 1105-2-100, Planning Guidance Notebook,
the without-project condition is “the most likely condition expected to exist in the future in the
absence of a proposed water resources project. The future without-project condition constitutes
the benchmark against which plans are evaluated. Forecasts of future without-project conditions
shall consider all other actions, plans and ER 1105-2-100 programs that would be implemented
in the future to address the problems and opportunities in the study area in the absence of a Corps
project. Forecasts should extend from the base year (the year when the proposed project is
expected to be operational) to the end of the period of analysis.”
The commercial fisheries without-project condition will assess the impacts to commercial
fisheries assuming that no action is taken to prevent the transfer of aquatic nuisance species
between the U.S. waters of the Great Lakes Basin, and Upper Mississippi River and Ohio River
Basins1.
With-Project Condition:
According to the U.S. Army Corps of Engineers’ Planning Guidance Notebook, “the with-
project condition is the most likely condition expected to exist in the future with the
implementation of a particular water resources development project. Comparison of conditions
with the project to conditions without the project will be performed to identify the beneficial and
adverse effects of the proposed plans.” The commercial fisheries with-project condition will
assess the impacts to commercial fisheries associated with a plan(s) that may be implemented to
1 The GLMRIS team recognizes that the transfer of ANS between the Great Lakes, Upper
Mississippi River, and Ohio River Basins may potentially impact fisheries in the U.S. and
Canadian waters of the Great Lakes. The Team is also aware of ongoing practices to manage the
Great Lakes fisheries as a bi-national effort. The GLMRIS team will continue to remain
cognizant of potential environmental, economic, and social impacts of ANS transfer to Canadian
interests.
Commercial Fisheries Baseline Economic Assessment 3
prevent the transfer of aquatic nuisance species between the Great Lakes, Upper Mississippi
River, and Ohio River Basins. This is not addressed in the Commercial Fisheries Baseline
Economic Assessment - U.S. Waters of the Great Lakes, Upper Mississippi River, and Ohio River
Basins, but will be assessed in a subsequent report.
Ex-Vessel Value:
According to the National Oceanic and Atmospheric Association’s (NOAA) National Marine
Fisheries Services’ (NMFS) report Our Living Oceans; Report on the Status of U.S. Living
Marine Resources, 1999, the ex-vessel revenue is defined as “the quantity of fish landed by
commercial fishermen multiplied by the average price [ex-vessel price] received by them at the
first point of sale… The estimate of economic value often takes…commercial catches and
multiplies them by an average price to arrive at a baseline measure of economic worth among
various user groups.” This report establishes a baseline “ex-vessel value” for all commercial
fishing harvests in the Great Lakes, Upper Mississippi River, and Ohio River Basins by applying
the following equation:
Harvest Level (Pounds) × Ex-Vessel Price (Dollars per Pound) = Ex-Vessel Value (Dollars).
Commercial Fishing:
The Magnuson-Stevens Fishery Conservation and Management Act (MSA) Public Law 94-265,
established by the U.S. Department of Commerce, National Oceanic and Atmospheric
Association (NOAA) and National Marine Fisheries Service is the “primary law governing
marine fisheries management in the United States federal waters.” According to the MSA, “the
term ‘commercial fishing’ means fishing in which the fish harvested, either in whole or in part,
are intended to enter commerce or enter commerce through sale, barter or trade.” Commercial
harvests include both native and non-native fish2.
This definition is utilized to describe commercial fishing activities that take place in the U.S.
waters of the Great Lakes, Upper Mississippi River and Ohio River Basins by both native and
non-native commercial fishermen. Note that subsistence fishing is not included as part of the
definition of “commercial fishing.” This is a separate activity which will be addressed in a
subsequent complementary report: Subsistence Fishing in the Great Lakes, Upper Mississippi
River, and Ohio River Basins.
2 In this report, there will be an asterisk present when indicating a non-native species.
Commercial Fisheries Baseline Economic Assessment 4
Subsistence Fishing:
In support of the Great Lakes and Mississippi River Interbasin Study, an assessment of
subsistence activities in the Great Lakes, Upper Mississippi, and Ohio River Basins was
generated. The report Treaty Rights and Subsistence Fishing in the U.S. Waters of the Great
Lakes, Upper Mississippi River, and Ohio River Basin, establishes a working definition of
subsistence fishing which encompasses the following criteria:
“1. A long-term consistent pattern of use, excluding interruptions beyond the control of
the community or area;
2. A pattern of use recurring in specific seasons for many years;
3. A pattern of use consisting of methods and means of harvest which are characterized
by efficiency and economy of effort and cost, conditioned by local characteristics;
4. The consistent harvest and use of fish or wildlife as related to past methods and means
of taking; near, or reasonably accessible from, the community or area;
5. A means of handling, preparing, preserving, and storing fish or wildlife which has been
traditionally used by past generations, including consideration of alteration of past
practices due to recent technological advances, where appropriate;
6. A pattern of use which includes the handing down of knowledge of fishing and hunting
skills, values, and lore from generation to generation;
7. A pattern of use in which the harvest is shared or distributed within a definable
community of persons; and
8. A pattern of use which relates to reliance upon a wide diversity of fish and wildlife
resources of the area and which provides substantial cultural, economic, social, and
nutritional elements to the community or area.”
This working definition is used to differentiate commercial fishing activities from subsistence
fishing activities. This report solely generates a baseline assessment of commercial fishing
activities. All documentation of subsistence fishing practices will be included in a subsequent
report: Treaty Rights and Subsistence Fishing in the U.S. Waters of the Great Lakes, Upper
Mississippi River, and Ohio River Basin.
Commercial Fisheries Baseline Economic Assessment 5
GLMRIS BACKGROUND INFORMATION:
The United States Army Corps of Engineers (USACE), in consultation with other federal
agencies, Native American tribes, state agencies, local governments and non-governmental
organizations, is conducting the Great Lakes and Mississippi River Interbasin Study (GLMRIS).
In accordance with the study authorization, USACE will evaluate a range of options and
technologies (collectively known as "ANS controls") to prevent the spread of aquatic nuisance
species between the Great Lakes and Mississippi River basins by aquatic pathways
An aquatic nuisance species (ANS) is a nonindigenous species that threatens the diversity or
abundance of native species or the ecological stability of infested waters, or commercial,
agricultural, aquacultural or recreational activities dependent on such waters. See 16 U.S.C. §
4702(1) (2010).
As a result of international commerce, travel and local practices, ANS have been introduced
throughout the Mississippi River and Great Lakes basins. These two basins are connected by
man-made channels that, in the past, exhibited poor water quality, which was an impediment to
the transfer of organisms between the basins. Now that water quality has improved, these canals
allow the transfer of both indigenous and nonindigenous invasive species.
USACE is conducting a comprehensive analysis of ANS controls and will analyze the effects
each ANS control or combination of ANS controls may have on current uses of: i) the Chicago
Area Waterway System (CAWS), the only known continuous aquatic pathway between the Great
Lakes and Mississippi River basins; and ii) other aquatic pathways between these basins.
Following the Economic and Environmental Principles and Guidelines for Water and Related
Land Resource Implementation Studies, Water Resource Council, March 10, 1983, USACE will:
Inventory current and forecast future conditions within the study area;
Identify aquatic pathways that may exist between the Great Lakes and Mississippi River
basins;
Inventory current and future potential aquatic nuisance species;
Analyze possible ANS controls to prevent ANS transfer, to include hydrologic separation
of the basins;
Analyze the impacts each ANS control may have on significant natural resources and
existing and forecasted uses of the lakes and waterways within the study area; and
Recommend a plan to prevent ANS transfer between the basins. If necessary, the plan
will include mitigation measures for impacted waterway uses and significant natural
resources.
Significant issues associated with GLMRIS may include, but are not limited to:
Significant natural resources such as ecosystems and threatened and endangered species;
Commercial and recreational fisheries;
Current recreational uses of the lakes and waterways;
ANS effects on water users;
Commercial Fisheries Baseline Economic Assessment 6
Effects of potential ANS controls on current waterway uses such as flood risk
management, commercial and recreational navigation, recreation, water supply,
hydropower and conveyance of effluent from wastewater treatment plants and other
industries; and
Statutory and legal responsibilities relative to the lakes and waterways.
Commercial Fisheries Baseline Economic Assessment 7
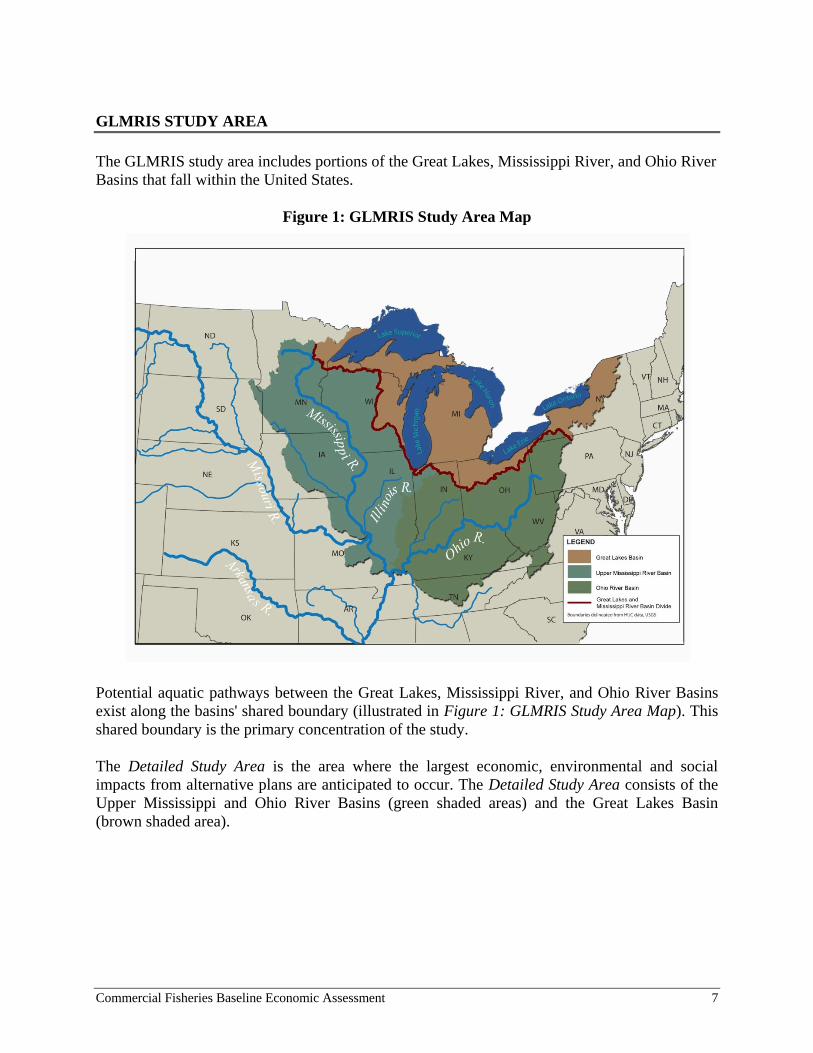
GLMRIS STUDY AREA
The GLMRIS study area includes portions of the Great Lakes, Mississippi River, and Ohio River
Basins that fall within the United States.
Figure 1: GLMRIS Study Area Map
Potential aquatic pathways between the Great Lakes, Mississippi River, and Ohio River Basins
exist along the basins' shared boundary (illustrated in Figure 1: GLMRIS Study Area Map). This
shared boundary is the primary concentration of the study.
The Detailed Study Area is the area where the largest economic, environmental and social
impacts from alternative plans are anticipated to occur. The Detailed Study Area consists of the
Upper Mississippi and Ohio River Basins (green shaded areas) and the Great Lakes Basin
(brown shaded area).
Commercial Fisheries Baseline Economic Assessment 8
NAVIGATION AND ECONOMICS PRODUCT DELIVERY TEAM:
In support of the Great Lakes and Mississippi River Interbasin Study, the Navigation and
Economics Product Delivery Team (PDT) was formed. The PDT will assess: 1) the economic
impacts from Aquatic Nuisance Species (ANS), and 2) the economic impact from the potential
implementation of ANS control measures. The plan of study can be generalized into two large
concerns: the Navigation related economics and all other economic concerns. Under each of the
two concern areas are study categories.
Navigation Related Economic Impacts
Commercial Cargo
Non-Cargo Related Navigation
Other Related Economic Impacts
Flood Risk Management
Hydropower
Commercial and Recreational Fishery3
Water Quality
Water Supply
Regional Economic Development
Fisheries Economics Team:
The Fisheries Economics Team (Team) was formed in order to assess the impacts of aquatic
nuisance species (ANS) transfer between the fisheries in the Great Lakes Basin and the Upper
Mississippi River and Ohio River Basins. The Team will assess the impacts to the following:
commercial fisheries, subsistence fisheries, water-related recreation, pro-fishing tournaments,
and the charter fishing industry. A separate report will be produced for each of these five
fisheries categories. The Commercial Fisheries Baseline Economic Assessment – U.S. Waters of
the Great Lakes, Upper Mississippi River, and Ohio River Basins (this study) focuses solely on
the commercial fisheries in the U.S. waters of the Great Lakes, Upper Mississippi River, and
Ohio River Basins.
Commercial Fisheries Focus:
The Fisheries Economics Team was formed in order to assess the impacts associated with the
transfer of ANS to the fisheries in the Great Lakes and the Upper Mississippi River and Ohio
3 The recreational fishery will be assessed via a survey of recreational anglers’ current behavior
as well as how their behavior may change if ANS were introduced to their respective basins. The
charter fishing industry, subsistence fishing, and pro-fishing tournaments will also be assessed.
The charter fishing industry will be assessed via a survey of charter captains’ current behavior
and likely behavioral changes in the case of ANS transfer. A subsistence fishing assessment will
be completed by contacting the tribes in the Great Lakes, Upper Mississippi River, and Ohio
River Basins in order to determine their subsistence fishing harvests and the cultural significance
of these harvests. Pro-fishing tournaments will be assessed via a literature review focusing on
existing pro-fishing tournaments, what they entail, and where they are located.
Commercial Fisheries Baseline Economic Assessment 9
River Basins. One component of this fisheries analysis is to determine the impacts to the
commercial fisheries in the aforementioned basins.
This task will be completed in three steps. First, this baseline assessment will establish the
current value of the commercial fisheries in each basin. A follow-up report will document the
anticipated impacts to the commercial fisheries in the event that no actions are undertaken to
prevent aquatic nuisance species transfer. Finally, the Fisheries Economics Team will assess the
impacts to the commercial fishing industry in the case of the various with-project condition
alternatives.
Commercial Fisheries Baseline Economic Assessment 10
COMMERCIAL FISHERIES ASSESSMENT OVERVIEW:
In order for the Fisheries Economics Team to be able to determine the impacts of aquatic
nuisance species transfer between the commercial fisheries in the U.S. waters of the Great Lakes
basin and the Upper Mississippi River and Ohio River Basins, an assessment of the current state
of the commercial fisheries in the each basin was imperative. The difference between the state of
the fisheries in the event of aquatic nuisance species transfer and the current state of the fisheries
will yield the total impacts associated with ANS transfer between the basins.
Overview of Study Areas:
The Fisheries Economics Team established its study areas in the Great Lakes Basin and the
Upper Mississippi River and Ohio River Basins in accordance with the overall GLMRIS study
area. The GLMRIS Geographic -Information System (GIS) Team was consulted to establish the
specific study areas for the fisheries economics team. The process by which the GIS team
established these focus areas is included in Appendix A of this report.
This baseline assessment of fisheries focuses on the major water bodies within the Great Lakes
basin and the Upper Mississippi River and Ohio River Basins. The Great Lakes, Upper
Mississippi River, Ohio River and their major tributaries are assessed but disjunct water bodies
are not included since ANS cannot travel via aquatic pathways to these. The following describes
the study areas within the two water basins in more detail:
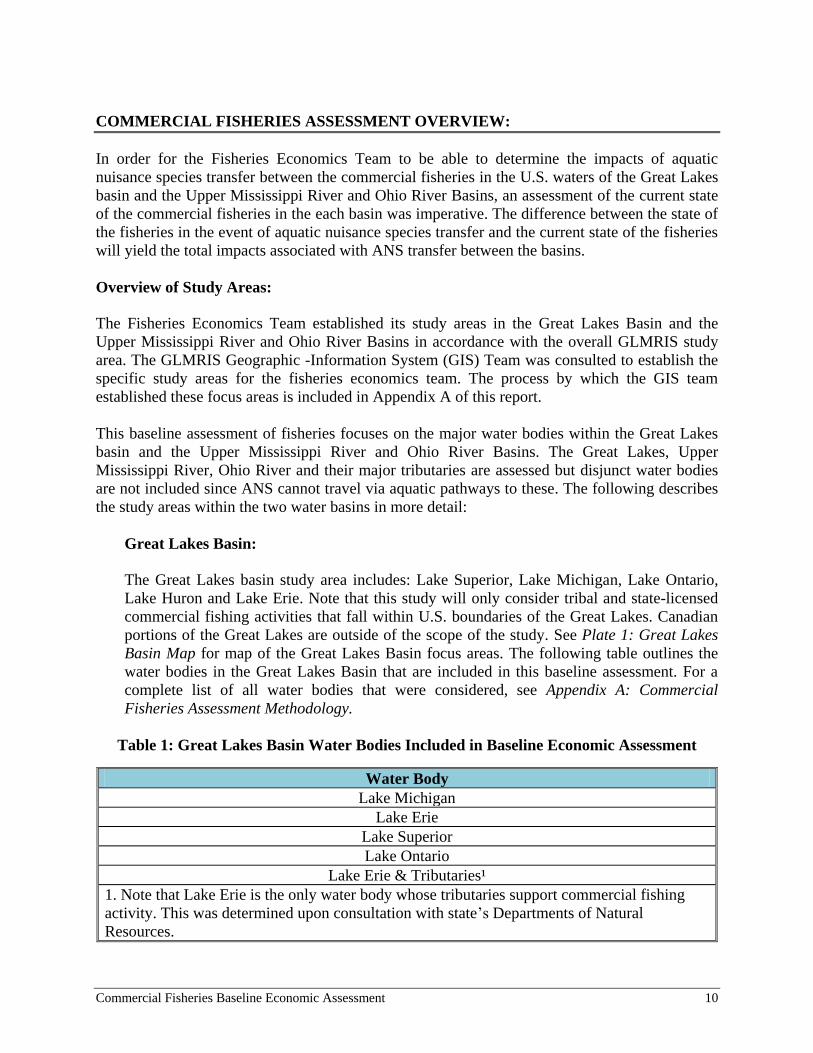
Great Lakes Basin:
The Great Lakes basin study area includes: Lake Superior, Lake Michigan, Lake Ontario,
Lake Huron and Lake Erie. Note that this study will only consider tribal and state-licensed
commercial fishing activities that fall within U.S. boundaries of the Great Lakes. Canadian
portions of the Great Lakes are outside of the scope of the study. See Plate 1: Great Lakes
Basin Map for map of the Great Lakes Basin focus areas. The following table outlines the
water bodies in the Great Lakes Basin that are included in this baseline assessment. For a
complete list of all water bodies that were considered, see Appendix A: Commercial
Fisheries Assessment Methodology.
Table 1: Great Lakes Basin Water Bodies Included in Baseline Economic Assessment
Water Body
Lake Michigan
Lake Erie
Lake Superior
Lake Ontario
Lake Erie & Tributaries¹
1. Note that Lake Erie is the only water body whose tributaries support commercial fishing
activity. This was determined upon consultation with state’s Departments of Natural
Resources.
Commercial Fisheries Baseline Economic Assessment 11
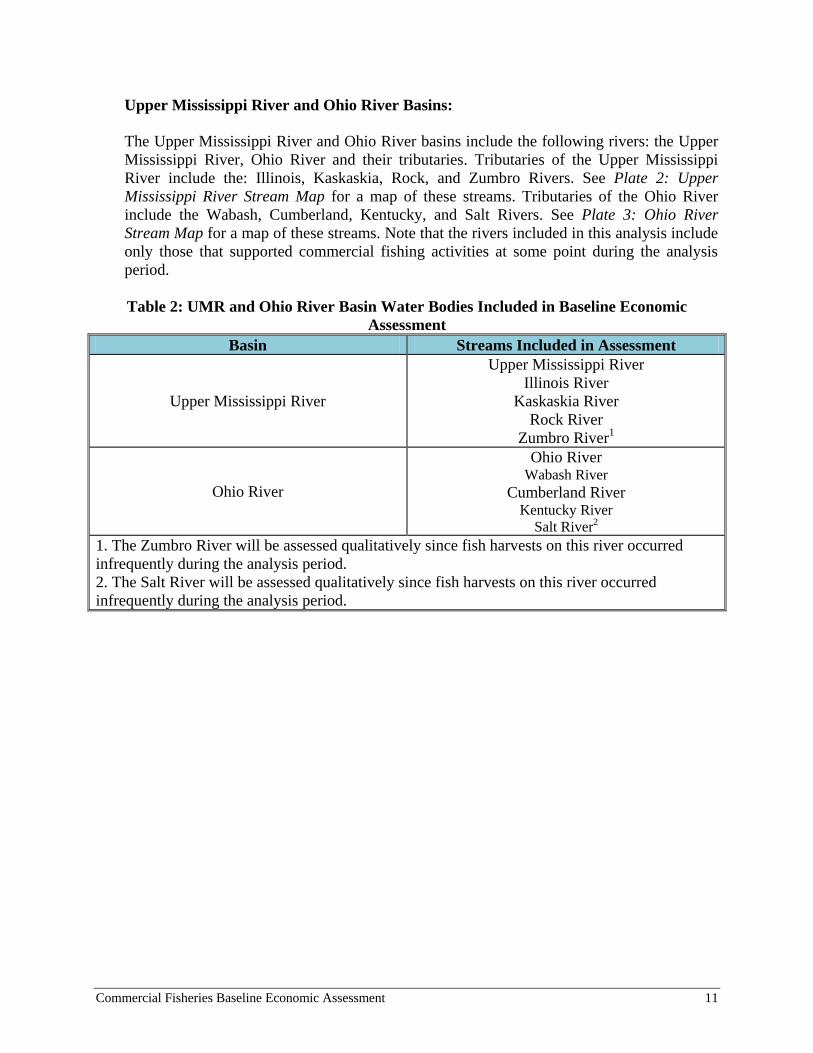
Upper Mississippi River and Ohio River Basins:
The Upper Mississippi River and Ohio River basins include the following rivers: the Upper
Mississippi River, Ohio River and their tributaries. Tributaries of the Upper Mississippi
River include the: Illinois, Kaskaskia, Rock, and Zumbro Rivers. See Plate 2: Upper
Mississippi River Stream Map for a map of these streams. Tributaries of the Ohio River
include the Wabash, Cumberland, Kentucky, and Salt Rivers. See Plate 3: Ohio River
Stream Map for a map of these streams. Note that the rivers included in this analysis include
only those that supported commercial fishing activities at some point during the analysis
period.
Table 2: UMR and Ohio River Basin Water Bodies Included in Baseline Economic
Assessment
Basin Streams Included in Assessment
Upper Mississippi River
Upper Mississippi River
Illinois River
Kaskaskia River
Rock River
Zumbro River1
Ohio River
Ohio River Wabash River
Cumberland River Kentucky River
Salt River2
1. The Zumbro River will be assessed qualitatively since fish harvests on this river occurred
infrequently during the analysis period.
2. The Salt River will be assessed qualitatively since fish harvests on this river occurred
infrequently during the analysis period.
Commercial Fisheries Baseline Economic Assessment 12
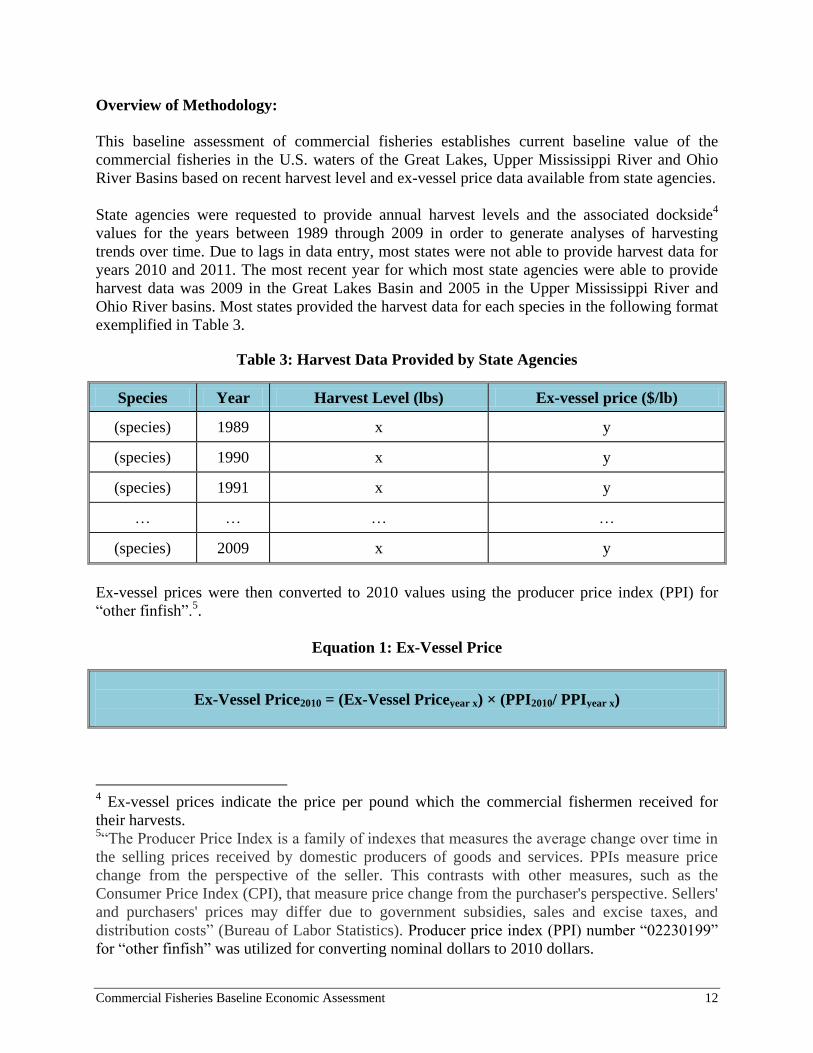
Overview of Methodology:
This baseline assessment of commercial fisheries establishes current baseline value of the
commercial fisheries in the U.S. waters of the Great Lakes, Upper Mississippi River and Ohio
River Basins based on recent harvest level and ex-vessel price data available from state agencies.
State agencies were requested to provide annual harvest levels and the associated dockside4
values for the years between 1989 through 2009 in order to generate analyses of harvesting
trends over time. Due to lags in data entry, most states were not able to provide harvest data for
years 2010 and 2011. The most recent year for which most state agencies were able to provide
harvest data was 2009 in the Great Lakes Basin and 2005 in the Upper Mississippi River and
Ohio River basins. Most states provided the harvest data for each species in the following format
exemplified in Table 3.
Table 3: Harvest Data Provided by State Agencies
Species Year Harvest Level (lbs) Ex-vessel price ($/lb)
(species) 1989 x y
(species) 1990 x y
(species) 1991 x y
… … … …
(species) 2009 x y
Ex-vessel prices were then converted to 2010 values using the producer price index (PPI) for
“other finfish”.5.
Equation 1: Ex-Vessel Price
Ex-Vessel Price2010 = (Ex-Vessel Priceyear x) × (PPI2010/ PPIyear x)
4 Ex-vessel prices indicate the price per pound which the commercial fishermen received for
their harvests. 5“The Producer Price Index is a family of indexes that measures the average change over time in
the selling prices received by domestic producers of goods and services. PPIs measure price
change from the perspective of the seller. This contrasts with other measures, such as the
Consumer Price Index (CPI), that measure price change from the purchaser's perspective. Sellers'
and purchasers' prices may differ due to government subsidies, sales and excise taxes, and
distribution costs” (Bureau of Labor Statistics). Producer price index (PPI) number “02230199”
for “other finfish” was utilized for converting nominal dollars to 2010 dollars.
Commercial Fisheries Baseline Economic Assessment 13
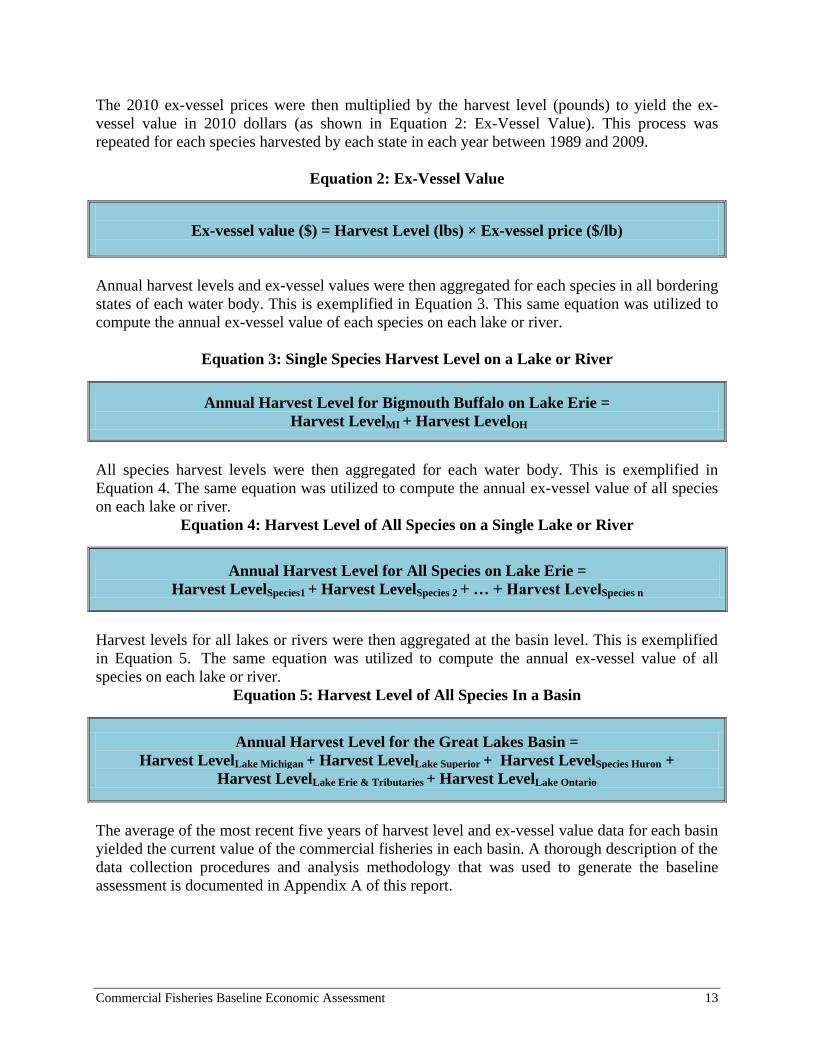
The 2010 ex-vessel prices were then multiplied by the harvest level (pounds) to yield the ex-
vessel value in 2010 dollars (as shown in Equation 2: Ex-Vessel Value). This process was
repeated for each species harvested by each state in each year between 1989 and 2009.
Equation 2: Ex-Vessel Value
Ex-vessel value ($) = Harvest Level (lbs) × Ex-vessel price ($/lb)
Annual harvest levels and ex-vessel values were then aggregated for each species in all bordering
states of each water body. This is exemplified in Equation 3. This same equation was utilized to
compute the annual ex-vessel value of each species on each lake or river.
Equation 3: Single Species Harvest Level on a Lake or River
Annual Harvest Level for Bigmouth Buffalo on Lake Erie =
Harvest LevelMI + Harvest LevelOH
All species harvest levels were then aggregated for each water body. This is exemplified in
Equation 4. The same equation was utilized to compute the annual ex-vessel value of all species
on each lake or river.
Equation 4: Harvest Level of All Species on a Single Lake or River
Annual Harvest Level for All Species on Lake Erie =
Harvest LevelSpecies1 + Harvest LevelSpecies 2 + … + Harvest LevelSpecies n
Harvest levels for all lakes or rivers were then aggregated at the basin level. This is exemplified
in Equation 5. The same equation was utilized to compute the annual ex-vessel value of all
species on each lake or river.
Equation 5: Harvest Level of All Species In a Basin
Annual Harvest Level for the Great Lakes Basin =
Harvest LevelLake Michigan + Harvest LevelLake Superior + Harvest LevelSpecies Huron +
Harvest LevelLake Erie & Tributaries + Harvest LevelLake Ontario
The average of the most recent five years of harvest level and ex-vessel value data for each basin
yielded the current value of the commercial fisheries in each basin. A thorough description of the
data collection procedures and analysis methodology that was used to generate the baseline
assessment is documented in Appendix A of this report.
Commercial Fisheries Baseline Economic Assessment 14
Overview of Findings
Values for the commercial fisheries in the U.S. waters of the Great Lakes, Upper Mississippi
River, and Ohio River Basins are as follows:
Great Lakes Basin
The average harvest level from the most recent 5 years (2005 through 2009) for the U.S.
waters of the Great Lakes Basin was determined to be approximately 19.3 million pounds
with an associated ex-vessel value of about $22.5 million in 2010 dollars. This forms the
baseline harvest and value against which future conditions will be compared.
Upper Mississippi River Basin
The average harvest level from the most recent 5 years (2001 through 2005) for the
Upper Mississippi River Basin was determined to be approximately 10.0 million pounds
with an associated ex-vessel value of about $4.0 million in 2010 dollars. This forms the
baseline harvest and value against which future conditions will be compared.
Ohio River Basin
The average harvest level from the most recent 5 years (2001 through 2005) for the Ohio
River Basin was determined to be approximately 1.4 million pounds with an associated
ex-vessel value of about $2.0 million in 2010 dollars. This forms the baseline harvest and
value against which future conditions will be compared.
The analyses of these basins were kept separate due to the fact that the overall goal of the
Fisheries Economics Team is to determine the impacts to commercial fisheries in the case of
aquatic nuisance species transfer between the Great Lakes basin and the Upper Mississippi River
and Ohio River Basins. Consequently, this called for the analyst to formulate a separate baseline
assessment for each basin as a prerequisite for the forthcoming analysis which seeks to determine
the impacts of ANS transfer on each of the three basins' commercial fisheries.

Commercial Fisheries Baseline Economic Assessment 15
GREAT LAKES BASIN BASELINE ASSESSMENT
The fisheries that lie within U.S. waters of the Great Lakes Basin were assessed. The U.S.
portion of the Great Lakes Basin fishery is valued at $22.5 million with a harvest level of 19.3
million pounds.
Baseline figures reflect the average of 2005 through 2009 harvest level and ex-vessel value data.
Table 4: Great Lakes Baseline Harvest and Values displays the contribution to the total Great
Lakes Basin fishery harvest level and ex-vessel value by each of the Great Lakes. Note that Lake
Michigan and Lake Erie support the greatest amount of commercial fishing (58.1 percent of the
total pounds) and the greatest value (61.9 percent of the total).
Table 4: Great Lakes Baseline Harvest and Values
Lake Harvest Level¹ (lbs) Total Harvest
Level (%) Ex-Vessel Value¹ ($)
Total Ex-
vessel value
(%)
Lake Michigan 6,363,000 32.9 8,920,000 39.6
Lake Erie 4,880,000 25.2 5,013,000 22.3
Lake Huron 3,539,000 18.3 4,553,000 20.2
Lake Superior 4,541,000 23.5 3,990,000 17.7
Lake Ontario 21,000 0.1 32,000 0.1
Total: All
Lakes 19,345,000 100.0 22,506,000 100.0
1. Harvest levels and values reflect a five-year average from 2005 through 2009. All values are
rounded to the nearest thousand. Ex-vessel values are in 2010 dollars.
Table 4 exhibits that Lake Michigan’s baseline harvest level is approximately 6.4 million pounds
with an associated value of $8.9 million. The primary contributor to Lake Michigan’s harvest
levels and values is comprised of lake whitefish, which is harvested by state-licensed commercial
fishermen in Michigan and Wisconsin, as well as tribal commercial fishermen (of the CORA
member tribes6). Lake Whitefish accounted for approximately 88 percent of Lake Michigan’s
total harvest level and 29 percent of the total Great Lakes harvest level in Year 2009.
Lake Erie’s baseline harvest level is 4.9 million pounds with an associated value of $5.0 million.
The harvest of species in the Temperate Bass and Perch families (such as white bass, white
perch*, yellow perch, and walleye) account for the majority of the harvest level and ex-vessel
value on Lake Erie. In 2009, the total harvest of all these species accounted for approximately
3.0 million pounds. This represented 55 percent of the Lake’s total harvest level in 2009.
6 CORA is an acronym for the Chippewa Ottawa Resource Authority. Member tribes include the:
Bay Mills Indian Community, Grand Traverse Band of Ottawa and Chippewa Indians in
Michigan, Little River Band of Ottawa Indians, Little Traverse Bay Band of Odawa Indians, and
Sault Ste. Marie Tribe of Chippewa Indians of Michigan. CORA reports commercial fishing
harvests by tribal commercial fishermen to the state for fisheries management purposes.
Commercial Fisheries Baseline Economic Assessment 16
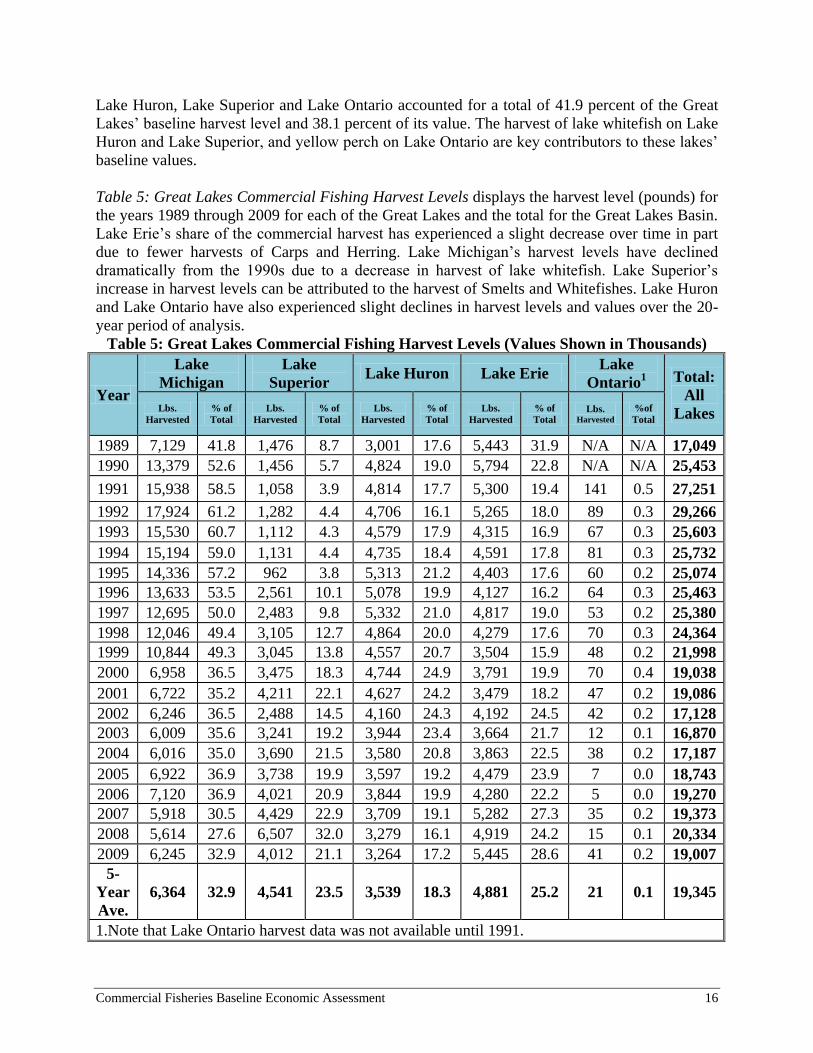
Lake Huron, Lake Superior and Lake Ontario accounted for a total of 41.9 percent of the Great
Lakes’ baseline harvest level and 38.1 percent of its value. The harvest of lake whitefish on Lake
Huron and Lake Superior, and yellow perch on Lake Ontario are key contributors to these lakes’
baseline values.
Table 5: Great Lakes Commercial Fishing Harvest Levels displays the harvest level (pounds) for
the years 1989 through 2009 for each of the Great Lakes and the total for the Great Lakes Basin.
Lake Erie’s share of the commercial harvest has experienced a slight decrease over time in part
due to fewer harvests of Carps and Herring. Lake Michigan’s harvest levels have declined
dramatically from the 1990s due to a decrease in harvest of lake whitefish. Lake Superior’s
increase in harvest levels can be attributed to the harvest of Smelts and Whitefishes. Lake Huron
and Lake Ontario have also experienced slight declines in harvest levels and values over the 20-
year period of analysis.
Table 5: Great Lakes Commercial Fishing Harvest Levels (Values Shown in Thousands)
Year
Lake
Michigan
Lake
Superior Lake Huron Lake Erie
Lake
Ontario1 Total:
All
Lakes Lbs.
Harvested
% of
Total
Lbs.
Harvested
% of
Total
Lbs.
Harvested
% of
Total
Lbs.
Harvested
% of
Total Lbs.
Harvested %of
Total
1989 7,129 41.8 1,476 8.7 3,001 17.6 5,443 31.9 N/A N/A 17,049
1990 13,379 52.6 1,456 5.7 4,824 19.0 5,794 22.8 N/A N/A 25,453
1991 15,938 58.5 1,058 3.9 4,814 17.7 5,300 19.4 141 0.5 27,251
1992 17,924 61.2 1,282 4.4 4,706 16.1 5,265 18.0 89 0.3 29,266
1993 15,530 60.7 1,112 4.3 4,579 17.9 4,315 16.9 67 0.3 25,603
1994 15,194 59.0 1,131 4.4 4,735 18.4 4,591 17.8 81 0.3 25,732
1995 14,336 57.2 962 3.8 5,313 21.2 4,403 17.6 60 0.2 25,074
1996 13,633 53.5 2,561 10.1 5,078 19.9 4,127 16.2 64 0.3 25,463
1997 12,695 50.0 2,483 9.8 5,332 21.0 4,817 19.0 53 0.2 25,380
1998 12,046 49.4 3,105 12.7 4,864 20.0 4,279 17.6 70 0.3 24,364
1999 10,844 49.3 3,045 13.8 4,557 20.7 3,504 15.9 48 0.2 21,998
2000 6,958 36.5 3,475 18.3 4,744 24.9 3,791 19.9 70 0.4 19,038
2001 6,722 35.2 4,211 22.1 4,627 24.2 3,479 18.2 47 0.2 19,086
2002 6,246 36.5 2,488 14.5 4,160 24.3 4,192 24.5 42 0.2 17,128
2003 6,009 35.6 3,241 19.2 3,944 23.4 3,664 21.7 12 0.1 16,870
2004 6,016 35.0 3,690 21.5 3,580 20.8 3,863 22.5 38 0.2 17,187
2005 6,922 36.9 3,738 19.9 3,597 19.2 4,479 23.9 7 0.0 18,743
2006 7,120 36.9 4,021 20.9 3,844 19.9 4,280 22.2 5 0.0 19,270
2007 5,918 30.5 4,429 22.9 3,709 19.1 5,282 27.3 35 0.2 19,373
2008 5,614 27.6 6,507 32.0 3,279 16.1 4,919 24.2 15 0.1 20,334
2009 6,245 32.9 4,012 21.1 3,264 17.2 5,445 28.6 41 0.2 19,007
5-
Year
Ave.
6,364 32.9 4,541 23.5 3,539 18.3 4,881 25.2 21 0.1 19,345
1.Note that Lake Ontario harvest data was not available until 1991.
Commercial Fisheries Baseline Economic Assessment 17
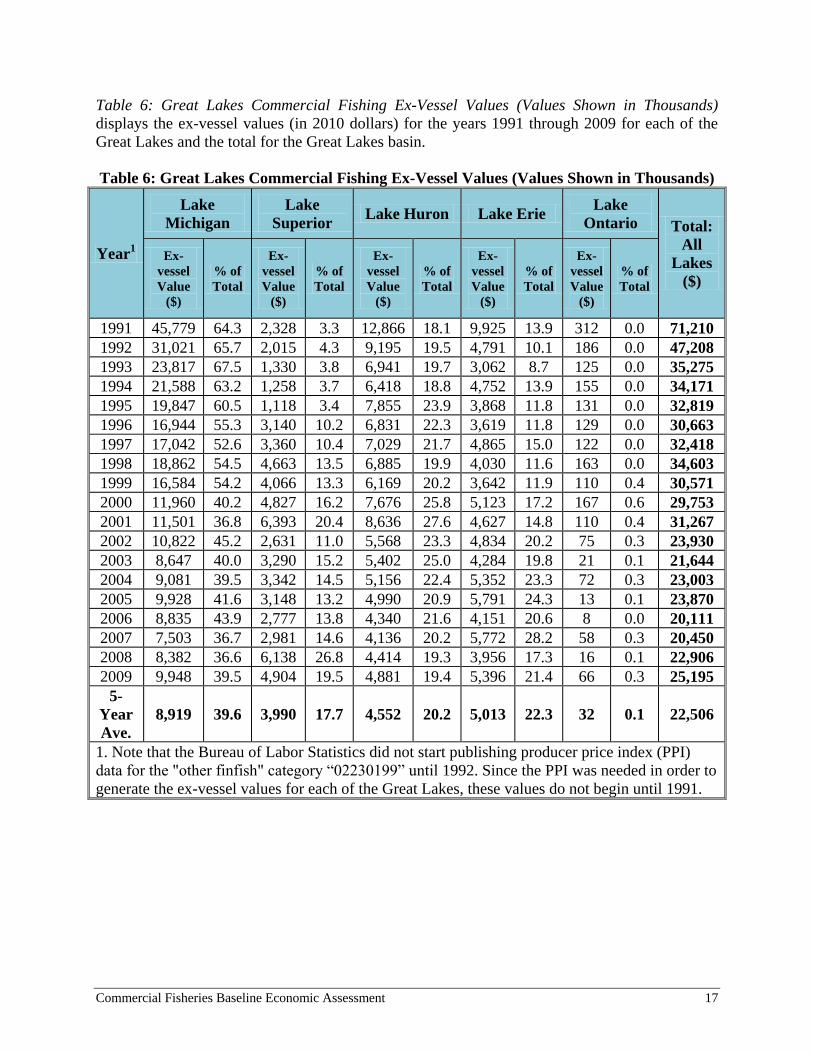
Table 6: Great Lakes Commercial Fishing Ex-Vessel Values (Values Shown in Thousands)
displays the ex-vessel values (in 2010 dollars) for the years 1991 through 2009 for each of the
Great Lakes and the total for the Great Lakes basin.
Table 6: Great Lakes Commercial Fishing Ex-Vessel Values (Values Shown in Thousands)
Year1
Lake
Michigan
Lake
Superior Lake Huron Lake Erie
Lake
Ontario Total:
All
Lakes
($)
Ex-
vessel
Value
($)
% of
Total
Ex-
vessel
Value
($)
% of
Total
Ex-
vessel
Value
($)
% of
Total
Ex-
vessel
Value
($)
% of
Total
Ex-
vessel
Value
($)
% of
Total
1991 45,779 64.3 2,328 3.3 12,866 18.1 9,925 13.9 312 0.0 71,210
1992 31,021 65.7 2,015 4.3 9,195 19.5 4,791 10.1 186 0.0 47,208
1993 23,817 67.5 1,330 3.8 6,941 19.7 3,062 8.7 125 0.0 35,275
1994 21,588 63.2 1,258 3.7 6,418 18.8 4,752 13.9 155 0.0 34,171
1995 19,847 60.5 1,118 3.4 7,855 23.9 3,868 11.8 131 0.0 32,819
1996 16,944 55.3 3,140 10.2 6,831 22.3 3,619 11.8 129 0.0 30,663
1997 17,042 52.6 3,360 10.4 7,029 21.7 4,865 15.0 122 0.0 32,418
1998 18,862 54.5 4,663 13.5 6,885 19.9 4,030 11.6 163 0.0 34,603
1999 16,584 54.2 4,066 13.3 6,169 20.2 3,642 11.9 110 0.4 30,571
2000 11,960 40.2 4,827 16.2 7,676 25.8 5,123 17.2 167 0.6 29,753
2001 11,501 36.8 6,393 20.4 8,636 27.6 4,627 14.8 110 0.4 31,267
2002 10,822 45.2 2,631 11.0 5,568 23.3 4,834 20.2 75 0.3 23,930
2003 8,647 40.0 3,290 15.2 5,402 25.0 4,284 19.8 21 0.1 21,644
2004 9,081 39.5 3,342 14.5 5,156 22.4 5,352 23.3 72 0.3 23,003
2005 9,928 41.6 3,148 13.2 4,990 20.9 5,791 24.3 13 0.1 23,870
2006 8,835 43.9 2,777 13.8 4,340 21.6 4,151 20.6 8 0.0 20,111
2007 7,503 36.7 2,981 14.6 4,136 20.2 5,772 28.2 58 0.3 20,450
2008 8,382 36.6 6,138 26.8 4,414 19.3 3,956 17.3 16 0.1 22,906
2009 9,948 39.5 4,904 19.5 4,881 19.4 5,396 21.4 66 0.3 25,195
5-
Year
Ave.
8,919 39.6 3,990 17.7 4,552 20.2 5,013 22.3 32 0.1 22,506
1. Note that the Bureau of Labor Statistics did not start publishing producer price index (PPI)
data for the "other finfish" category “02230199” until 1992. Since the PPI was needed in order to
generate the ex-vessel values for each of the Great Lakes, these values do not begin until 1991.
Commercial Fisheries Baseline Economic Assessment 18
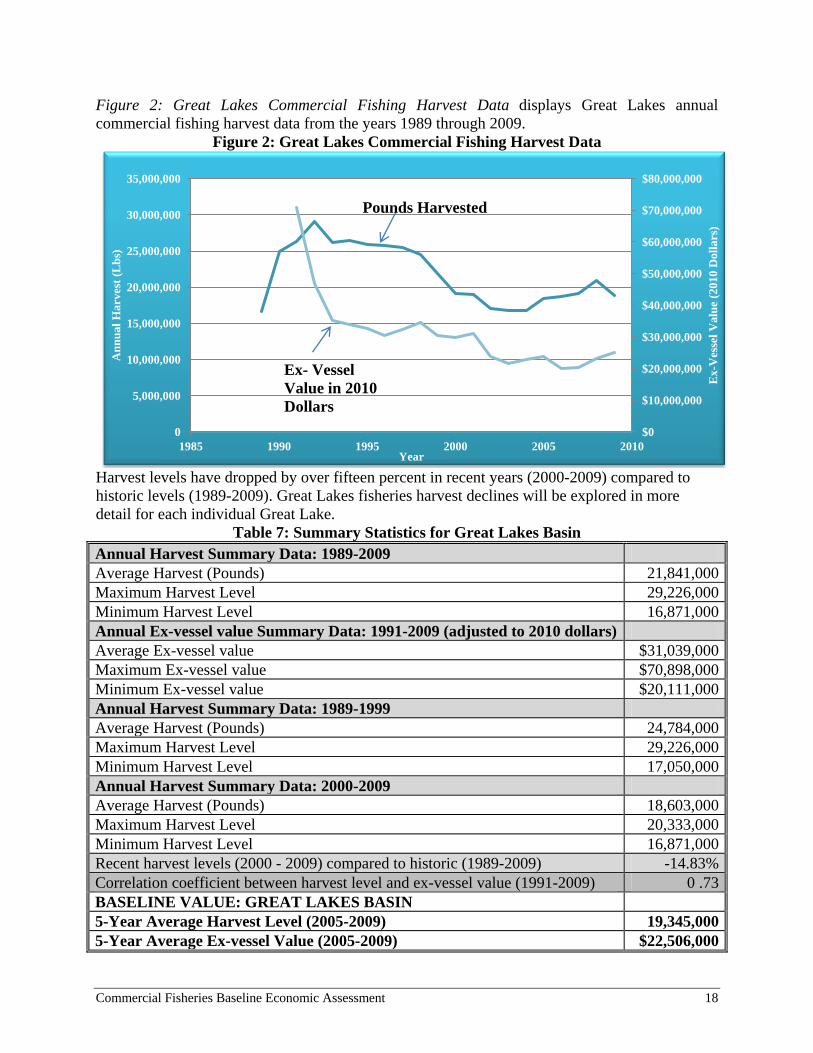
Figure 2: Great Lakes Commercial Fishing Harvest Data displays Great Lakes annual
commercial fishing harvest data from the years 1989 through 2009.
Figure 2: Great Lakes Commercial Fishing Harvest Data
Harvest levels have dropped by over fifteen percent in recent years (2000-2009) compared to
historic levels (1989-2009). Great Lakes fisheries harvest declines will be explored in more
detail for each individual Great Lake.
Table 7: Summary Statistics for Great Lakes Basin
Annual Harvest Summary Data: 1989-2009
Average Harvest (Pounds) 21,841,000
Maximum Harvest Level 29,226,000
Minimum Harvest Level 16,871,000
Annual Ex-vessel value Summary Data: 1991-2009 (adjusted to 2010 dollars)
Average Ex-vessel value $31,039,000
Maximum Ex-vessel value $70,898,000
Minimum Ex-vessel value $20,111,000
Annual Harvest Summary Data: 1989-1999
Average Harvest (Pounds) 24,784,000
Maximum Harvest Level 29,226,000
Minimum Harvest Level 17,050,000
Annual Harvest Summary Data: 2000-2009
Average Harvest (Pounds) 18,603,000
Maximum Harvest Level 20,333,000
Minimum Harvest Level 16,871,000
Recent harvest levels (2000 - 2009) compared to historic (1989-2009) -14.83%
Correlation coefficient between harvest level and ex-vessel value (1991-2009) 0 .73
BASELINE VALUE: GREAT LAKES BASIN
5-Year Average Harvest Level (2005-2009) 19,345,000
5-Year Average Ex-vessel Value (2005-2009) $22,506,000
$0
$10,000,000
$20,000,000
$30,000,000
$40,000,000
$50,000,000
$60,000,000
$70,000,000
$80,000,000
0
5,000,000
10,000,000
15,000,000
20,000,000
25,000,000
30,000,000
35,000,000
1985 1990 1995 2000 2005 2010
Ex-V
esse
l V
alu
e (2
010 D
oll
ars
)
An
nu
al
Harves
t (L
bs)
Year
Ex- Vessel
Value in 2010
Dollars
Pounds Harvested
Commercial Fisheries Baseline Economic Assessment 19
Lake Michigan Baseline Assessment
Harvest data for each of the Great Lakes will be explored in the order of commercial fishing ex-
vessel value contribution (from greatest to least)7. Therefore, Lake Michigan is analyzed first.
Lake Michigan’s baseline (5-year average from 2005-2009) harvest level is 6.4 million pounds
with an associated ex-vessel value of $8.9 million. It contributes a total of 32.9 percent to the
total harvest of fish on the Great Lakes and 39.6 percent to the total ex-vessel value of Great
Lakes fisheries8. Tribal and state-licensed fishermen participating in commercial fishing activity
on Lake Michigan during the analysis period (years 1989 through 2009) include those from:
Illinois, Indiana, Michigan and Wisconsin, as well as CORA member tribes. Lake Michigan
experienced a rapid decline in harvest levels since 1989. While the maximum harvest level in the
1990s was 17.9 million pounds (1992) and accounted for about 61.2 percent of the total
commercial fishing harvests on the Great Lakes; the maximum harvest level since year 2000 was
about 7.1 million pounds (2006) and accounted for approximately 36.9 percent of the Great
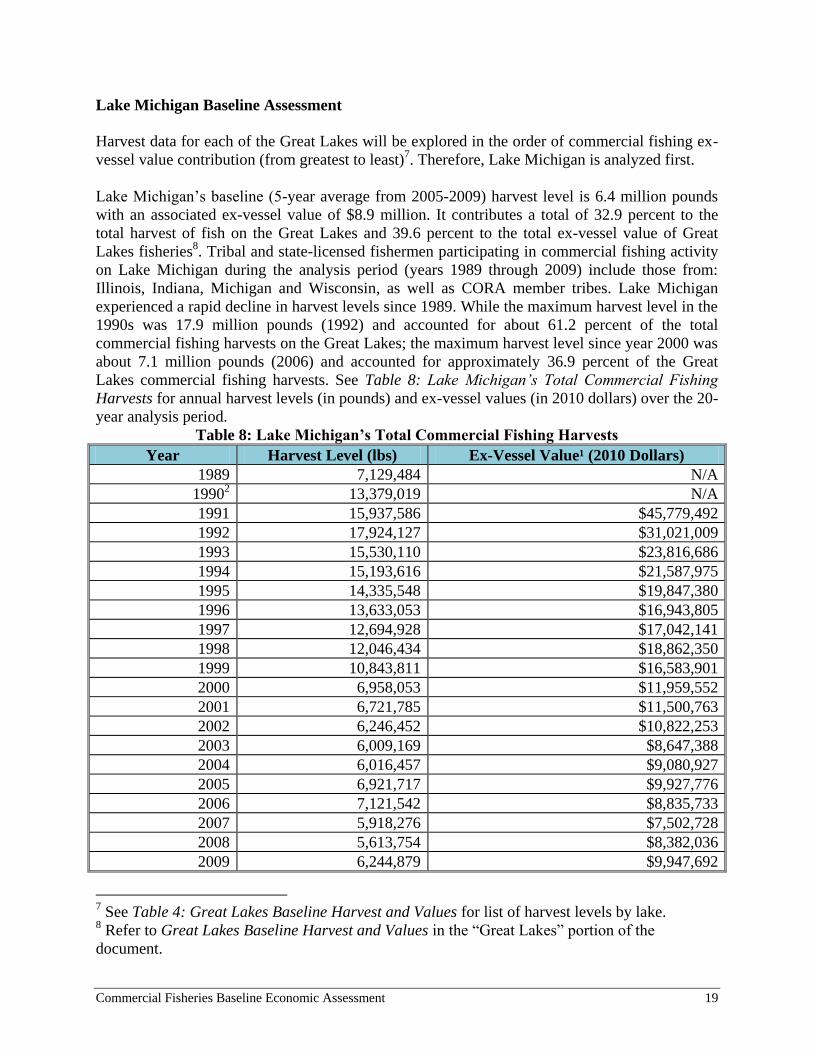
Lakes commercial fishing harvests. See Table 8: Lake Michigan’s Total Commercial Fishing
Harvests for annual harvest levels (in pounds) and ex-vessel values (in 2010 dollars) over the 20-
year analysis period.
Table 8: Lake Michigan’s Total Commercial Fishing Harvests
Year Harvest Level (lbs) Ex-Vessel Value¹ (2010 Dollars)
1989 7,129,484 N/A
19902 13,379,019 N/A
1991 15,937,586 $45,779,492
1992 17,924,127 $31,021,009
1993 15,530,110 $23,816,686
1994 15,193,616 $21,587,975
1995 14,335,548 $19,847,380
1996 13,633,053 $16,943,805
1997 12,694,928 $17,042,141
1998 12,046,434 $18,862,350
1999 10,843,811 $16,583,901
2000 6,958,053 $11,959,552
2001 6,721,785 $11,500,763
2002 6,246,452 $10,822,253
2003 6,009,169 $8,647,388
2004 6,016,457 $9,080,927
2005 6,921,717 $9,927,776
2006 7,121,542 $8,835,733
2007 5,918,276 $7,502,728
2008 5,613,754 $8,382,036
2009 6,244,879 $9,947,692
7 See Table 4: Great Lakes Baseline Harvest and Values for list of harvest levels by lake.
8 Refer to Great Lakes Baseline Harvest and Values in the “Great Lakes” portion of the
document.
Commercial Fisheries Baseline Economic Assessment 20
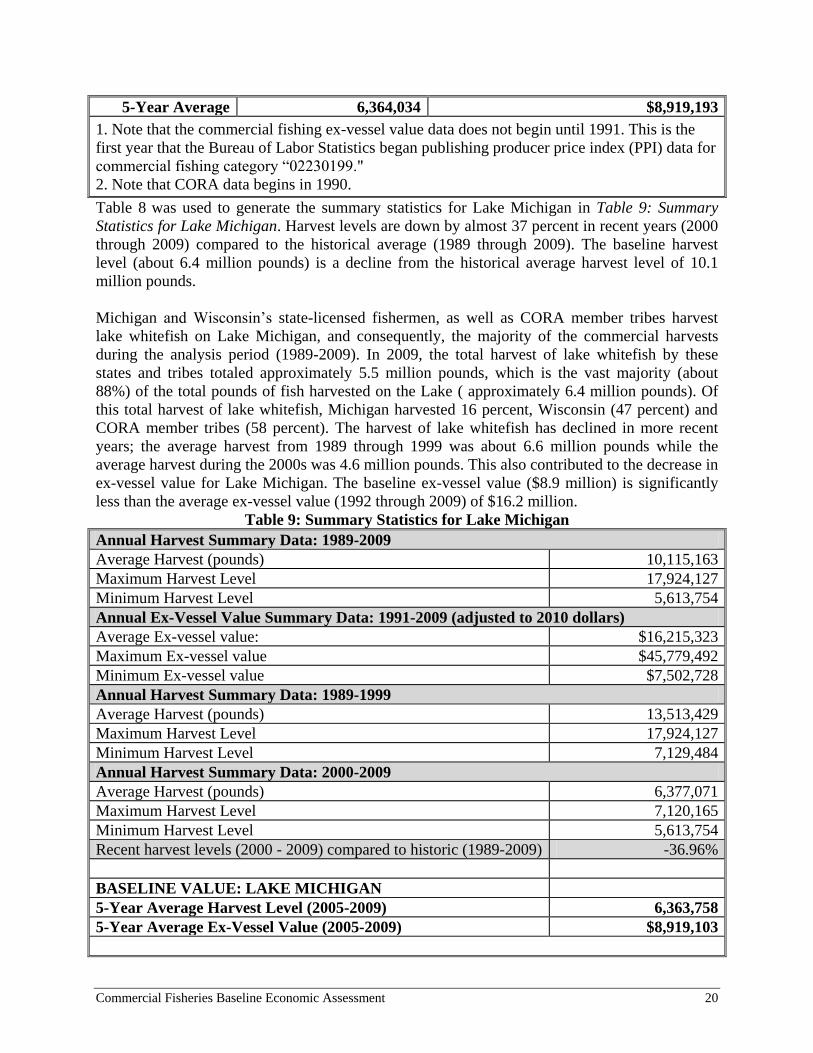
5-Year Average 6,364,034 $8,919,193
1. Note that the commercial fishing ex-vessel value data does not begin until 1991. This is the
first year that the Bureau of Labor Statistics began publishing producer price index (PPI) data for
commercial fishing category “02230199."
2. Note that CORA data begins in 1990.
Table 8 was used to generate the summary statistics for Lake Michigan in Table 9: Summary
Statistics for Lake Michigan. Harvest levels are down by almost 37 percent in recent years (2000
through 2009) compared to the historical average (1989 through 2009). The baseline harvest
level (about 6.4 million pounds) is a decline from the historical average harvest level of 10.1
million pounds.
Michigan and Wisconsin’s state-licensed fishermen, as well as CORA member tribes harvest
lake whitefish on Lake Michigan, and consequently, the majority of the commercial harvests
during the analysis period (1989-2009). In 2009, the total harvest of lake whitefish by these
states and tribes totaled approximately 5.5 million pounds, which is the vast majority (about
88%) of the total pounds of fish harvested on the Lake ( approximately 6.4 million pounds). Of
this total harvest of lake whitefish, Michigan harvested 16 percent, Wisconsin (47 percent) and
CORA member tribes (58 percent). The harvest of lake whitefish has declined in more recent
years; the average harvest from 1989 through 1999 was about 6.6 million pounds while the
average harvest during the 2000s was 4.6 million pounds. This also contributed to the decrease in
ex-vessel value for Lake Michigan. The baseline ex-vessel value ($8.9 million) is significantly
less than the average ex-vessel value (1992 through 2009) of $16.2 million.
Table 9: Summary Statistics for Lake Michigan
Annual Harvest Summary Data: 1989-2009
Average Harvest (pounds) 10,115,163
Maximum Harvest Level 17,924,127
Minimum Harvest Level 5,613,754
Annual Ex-Vessel Value Summary Data: 1991-2009 (adjusted to 2010 dollars)
Average Ex-vessel value: $16,215,323
Maximum Ex-vessel value $45,779,492
Minimum Ex-vessel value $7,502,728
Annual Harvest Summary Data: 1989-1999
Average Harvest (pounds) 13,513,429
Maximum Harvest Level 17,924,127
Minimum Harvest Level 7,129,484
Annual Harvest Summary Data: 2000-2009
Average Harvest (pounds) 6,377,071
Maximum Harvest Level 7,120,165
Minimum Harvest Level 5,613,754
Recent harvest levels (2000 - 2009) compared to historic (1989-2009) -36.96%
BASELINE VALUE: LAKE MICHIGAN
5-Year Average Harvest Level (2005-2009) 6,363,758
5-Year Average Ex-Vessel Value (2005-2009) $8,919,103
Commercial Fisheries Baseline Economic Assessment 21
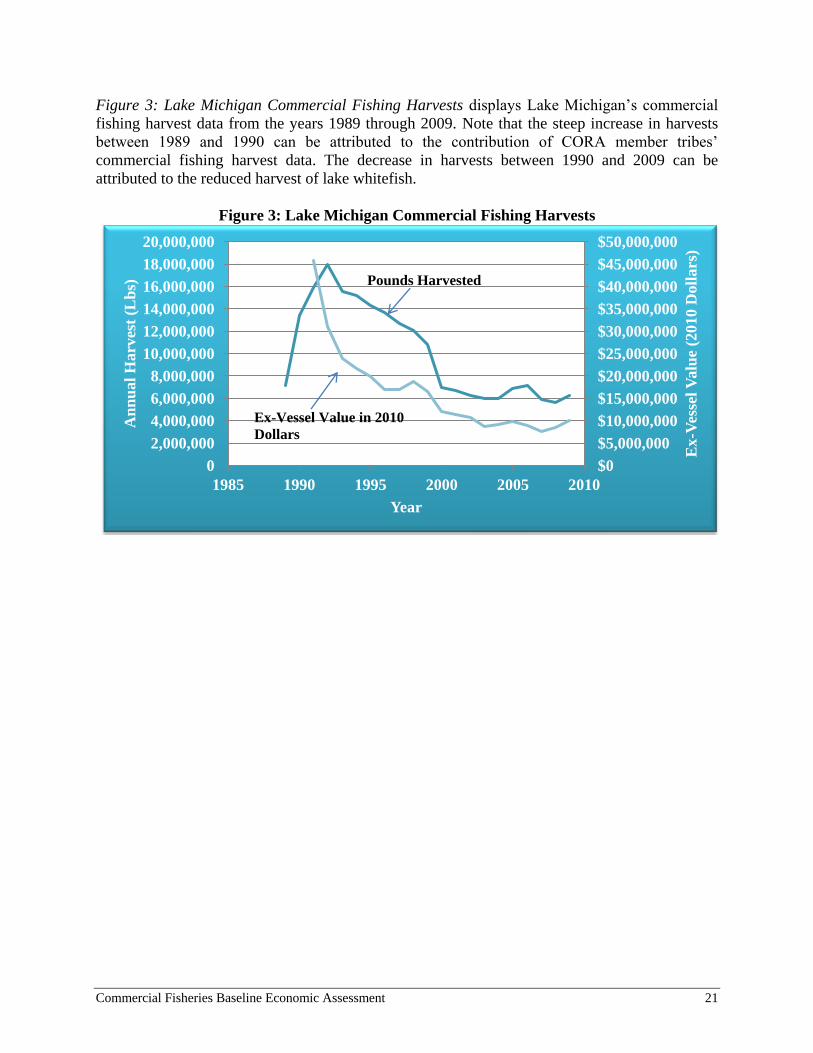
Figure 3: Lake Michigan Commercial Fishing Harvests displays Lake Michigan’s commercial
fishing harvest data from the years 1989 through 2009. Note that the steep increase in harvests
between 1989 and 1990 can be attributed to the contribution of CORA member tribes’
commercial fishing harvest data. The decrease in harvests between 1990 and 2009 can be
attributed to the reduced harvest of lake whitefish.
Figure 3: Lake Michigan Commercial Fishing Harvests
$0
$5,000,000
$10,000,000
$15,000,000
$20,000,000
$25,000,000
$30,000,000
$35,000,000
$40,000,000
$45,000,000
$50,000,000
0
2,000,000
4,000,000
6,000,000
8,000,000
10,000,000
12,000,000
14,000,000
16,000,000
18,000,000
20,000,000
1985 1990 1995 2000 2005 2010
Ex-V
esse
l V
alu
e (2
010 D
oll
ars
)
An
nu
al
Harv
est
(Lb
s)
Year
Ex-Vessel Value in 2010
Dollars
Pounds Harvested

Commercial Fisheries Baseline Economic Assessment 22
Table 10: Lake Michigan Baseline Harvest Data by Species exemplifies the contribution of
species to the total harvest level and ex-vessel value of commercial fishing on Lake Michigan.
Note that almost all of the commercial fishing harvests are generated from the harvest of three
families: whitefishes, smelt, and shads and herrings.
Lake whitefish (a species in the Whitefishes, Smelts, and Shads and Herrings family) alone
account for approximately 4.9 million pounds of this total baseline harvest (6.4 million pounds)
and approximately $6.4 million of the baseline ex-vessel value for Lake Michigan ($8.9 million).
Table 10: Lake Michigan Baseline Harvest Data by Species
Family¹ Harvested
Species
Harvest
Level² (lbs)
% of
Total
Ex-Vessel
Value³ ($)
% of
Total
Whitefishes, Smelts,
and Shads & Herrings
chubs, lake
whitefish,
menominee,
rainbow smelt*,
gizzard shad,
alewife*, cisco
5,983,930 94.0 8,527,618 96
Salmon, Trout, Chars,
and Cods
coho salmon,
chinook salmon,
rainbow trout,
lake char*,
burbot
298,622 4.7 226,988 3
Perches
yellow perch,
walleye 76,677 1.2 163,858 2
Suckers sucker 4,530 0.1 640 0
Drums freshwater drum 0 0.0 0 0
Catfishes channel catfish 0 0.0 0 0
Carp common carp* 0 0.0 0 0
Total: All Species 6,363,758 100.0 8,919,103 100
1. Refer to Appendix A for description as to why the GLMRIS Natural Resources Team grouped
some families together.
2. This is a five-year average (2005-2009) of the annual harvest levels.
3. This is a five-year average (2005-2009) of the annual ex-vessel values displayed in 2010
dollars.
Commercial Fisheries Baseline Economic Assessment 23
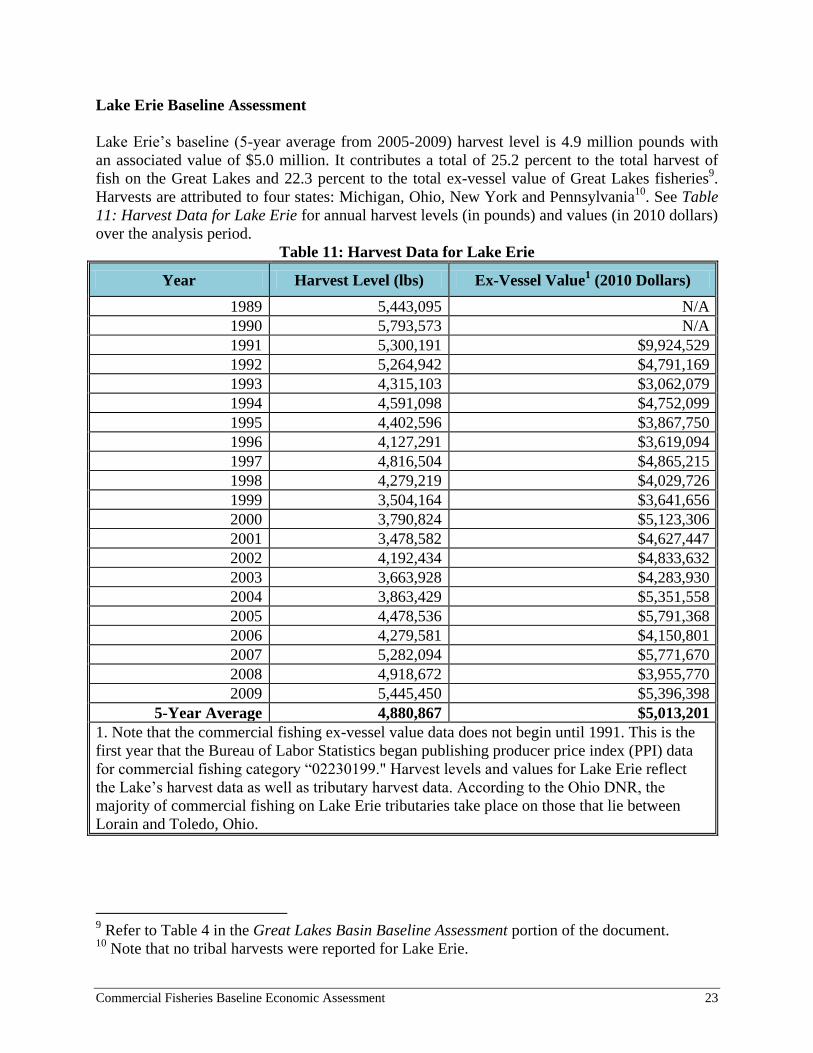
Lake Erie Baseline Assessment
Lake Erie’s baseline (5-year average from 2005-2009) harvest level is 4.9 million pounds with
an associated value of $5.0 million. It contributes a total of 25.2 percent to the total harvest of
fish on the Great Lakes and 22.3 percent to the total ex-vessel value of Great Lakes fisheries9.
Harvests are attributed to four states: Michigan, Ohio, New York and Pennsylvania10
. See Table
11: Harvest Data for Lake Erie for annual harvest levels (in pounds) and values (in 2010 dollars)
over the analysis period.
Table 11: Harvest Data for Lake Erie
Year Harvest Level (lbs) Ex-Vessel Value1 (2010 Dollars)
1989 5,443,095 N/A
1990 5,793,573 N/A
1991 5,300,191 $9,924,529
1992 5,264,942 $4,791,169
1993 4,315,103 $3,062,079
1994 4,591,098 $4,752,099
1995 4,402,596 $3,867,750
1996 4,127,291 $3,619,094
1997 4,816,504 $4,865,215
1998 4,279,219 $4,029,726
1999 3,504,164 $3,641,656
2000 3,790,824 $5,123,306
2001 3,478,582 $4,627,447
2002 4,192,434 $4,833,632
2003 3,663,928 $4,283,930
2004 3,863,429 $5,351,558
2005 4,478,536 $5,791,368
2006 4,279,581 $4,150,801
2007 5,282,094 $5,771,670
2008 4,918,672 $3,955,770
2009 5,445,450 $5,396,398
5-Year Average 4,880,867 $5,013,201
1. Note that the commercial fishing ex-vessel value data does not begin until 1991. This is the
first year that the Bureau of Labor Statistics began publishing producer price index (PPI) data
for commercial fishing category “02230199." Harvest levels and values for Lake Erie reflect
the Lake’s harvest data as well as tributary harvest data. According to the Ohio DNR, the
majority of commercial fishing on Lake Erie tributaries take place on those that lie between
Lorain and Toledo, Ohio.
9 Refer to Table 4 in the Great Lakes Basin Baseline Assessment portion of the document.
10 Note that no tribal harvests were reported for Lake Erie.
Commercial Fisheries Baseline Economic Assessment 24
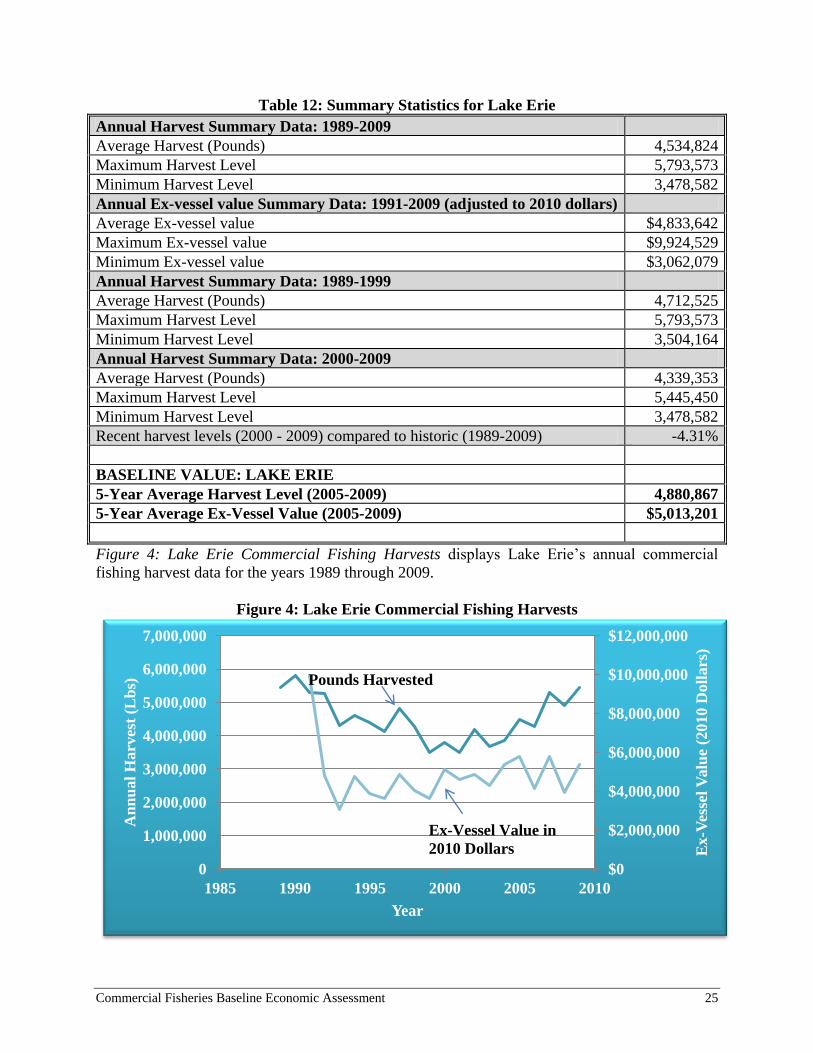
Table 11: Harvest Data for Lake Erie was used to generate the summary statistics for Lake Erie
displayed in Table 12: Summary Statistics for Lake Erie. Lake Erie experienced little fluctuation
in harvest levels and values over the 21-year analysis period.
Harvest levels are only down 4 percent in recent years compared to the historical average. The
baseline harvest level (about 4.9 million pounds) is greater than the average harvest level of 4.5
million pounds. Further, the baseline ex-vessel value ($5.0 million) is also higher than the
average ex-vessel value of about $4.8 million.
The majority of the harvest on Lake Erie is attributed to the harvest of species in the Temperate
Bass and Perch families. Their contribution to Lake Erie’s baseline harvest level was
approximately 2.7 million pounds. The total harvest of Temperate Bass and Perches increased by
over 30 percent in recent years compared to the historical average (1989 through 2009).
The total harvest of white bass, white perch*, yellow perch and walleye in 2009 was
approximately 3.0 million pounds. Ohio harvested the majority of these pounds (2.8 million) in
2009, while Michigan harvested 131 thousand pounds, Pennsylvania (42 thousand) and New
York (13 thousand).
Other families of species witnessed similar increases in harvest levels or have maintained
constant harvest levels. For instance, the Catfish and Bullhead family (which includes species
such as channel catfish and brown bullhead), which accounted for roughly 12 percent of the
baseline harvest level, experienced a 12 percent increase in harvest levels.
The increase in harvest levels experienced by the Temperate Bass, Perch, Catfish and Bullhead
families are offset by the decrease in harvest levels of other species. The harvest of Carp* and
Herring is down by 48 percent in recent years (2000s) compared to the historical average. The
harvest of common carp* dropped from 1.2 million pounds in year 2000 to 556,000 pounds in
2004.
Other species, such as freshwater drum (which accounts for approximately 494,000 pounds of
the baseline harvest level) experienced similar decreases in harvest levels over the analysis
period. The harvest of freshwater drum decreased by 36 percent in the 2000s compared to the
historical average.
Commercial Fisheries Baseline Economic Assessment 25
Table 12: Summary Statistics for Lake Erie
Annual Harvest Summary Data: 1989-2009
Average Harvest (Pounds) 4,534,824
Maximum Harvest Level 5,793,573
Minimum Harvest Level 3,478,582
Annual Ex-vessel value Summary Data: 1991-2009 (adjusted to 2010 dollars)
Average Ex-vessel value $4,833,642
Maximum Ex-vessel value $9,924,529
Minimum Ex-vessel value $3,062,079
Annual Harvest Summary Data: 1989-1999
Average Harvest (Pounds) 4,712,525
Maximum Harvest Level 5,793,573
Minimum Harvest Level 3,504,164
Annual Harvest Summary Data: 2000-2009
Average Harvest (Pounds) 4,339,353
Maximum Harvest Level 5,445,450
Minimum Harvest Level 3,478,582
Recent harvest levels (2000 - 2009) compared to historic (1989-2009) -4.31%
BASELINE VALUE: LAKE ERIE
5-Year Average Harvest Level (2005-2009) 4,880,867
5-Year Average Ex-Vessel Value (2005-2009) $5,013,201
Figure 4: Lake Erie Commercial Fishing Harvests displays Lake Erie’s annual commercial
fishing harvest data for the years 1989 through 2009.
Figure 4: Lake Erie Commercial Fishing Harvests
$0
$2,000,000
$4,000,000
$6,000,000
$8,000,000
$10,000,000
$12,000,000
0
1,000,000
2,000,000
3,000,000
4,000,000
5,000,000
6,000,000
7,000,000
1985 1990 1995 2000 2005 2010
Ex-V
esse
l V
alu
e (2
010 D
oll
ars
)
An
nu
al
Harv
est
(Lb
s)
Year
Pounds Harvested
Ex-Vessel Value in
2010 Dollars
Commercial Fisheries Baseline Economic Assessment 26
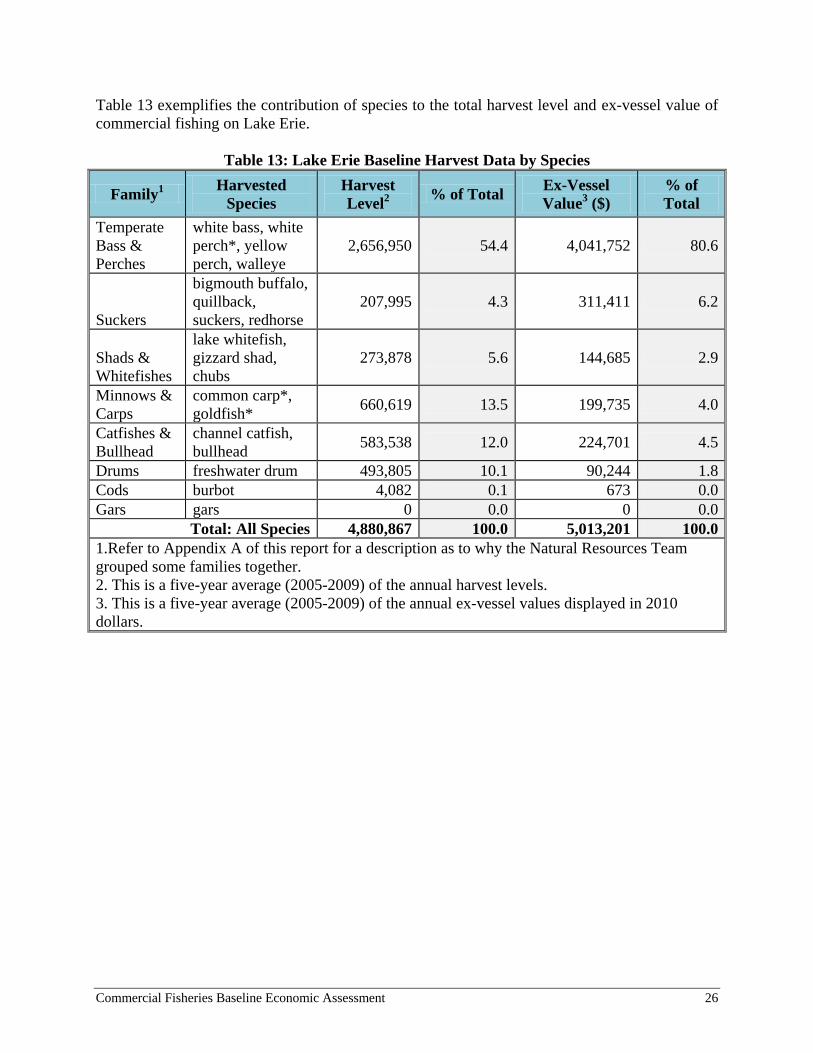
Table 13 exemplifies the contribution of species to the total harvest level and ex-vessel value of
commercial fishing on Lake Erie.
Table 13: Lake Erie Baseline Harvest Data by Species
Family1
Harvested
Species
Harvest
Level2
% of Total Ex-Vessel
Value3 ($)
% of
Total
Temperate
Bass &
Perches
white bass, white
perch*, yellow
perch, walleye
2,656,950 54.4 4,041,752 80.6
Suckers
bigmouth buffalo,
quillback,
suckers, redhorse
207,995 4.3 311,411 6.2
Shads &
Whitefishes
lake whitefish,
gizzard shad,
chubs
273,878 5.6 144,685 2.9
Minnows &
Carps
common carp*,
goldfish* 660,619 13.5 199,735 4.0
Catfishes &
Bullhead
channel catfish,
bullhead 583,538 12.0 224,701 4.5
Drums freshwater drum 493,805 10.1 90,244 1.8
Cods burbot 4,082 0.1 673 0.0
Gars gars 0 0.0 0 0.0
Total: All Species 4,880,867 100.0 5,013,201 100.0
1.Refer to Appendix A of this report for a description as to why the Natural Resources Team
grouped some families together.
2. This is a five-year average (2005-2009) of the annual harvest levels.
3. This is a five-year average (2005-2009) of the annual ex-vessel values displayed in 2010
dollars.
Commercial Fisheries Baseline Economic Assessment 27
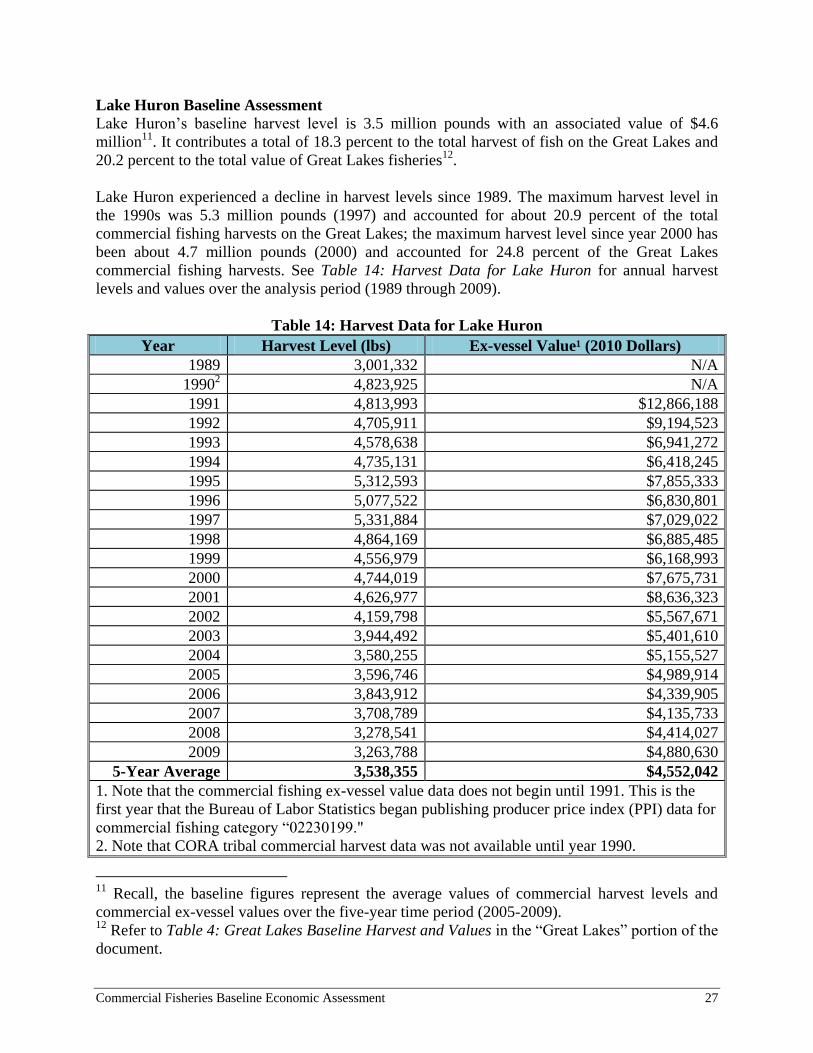
Lake Huron Baseline Assessment
Lake Huron’s baseline harvest level is 3.5 million pounds with an associated value of $4.6
million11
. It contributes a total of 18.3 percent to the total harvest of fish on the Great Lakes and
20.2 percent to the total value of Great Lakes fisheries12
.
Lake Huron experienced a decline in harvest levels since 1989. The maximum harvest level in
the 1990s was 5.3 million pounds (1997) and accounted for about 20.9 percent of the total
commercial fishing harvests on the Great Lakes; the maximum harvest level since year 2000 has
been about 4.7 million pounds (2000) and accounted for 24.8 percent of the Great Lakes
commercial fishing harvests. See Table 14: Harvest Data for Lake Huron for annual harvest
levels and values over the analysis period (1989 through 2009).
Table 14: Harvest Data for Lake Huron
Year Harvest Level (lbs) Ex-vessel Value¹ (2010 Dollars)
1989 3,001,332 N/A
19902 4,823,925 N/A
1991 4,813,993 $12,866,188
1992 4,705,911 $9,194,523
1993 4,578,638 $6,941,272
1994 4,735,131 $6,418,245
1995 5,312,593 $7,855,333
1996 5,077,522 $6,830,801
1997 5,331,884 $7,029,022
1998 4,864,169 $6,885,485
1999 4,556,979 $6,168,993
2000 4,744,019 $7,675,731
2001 4,626,977 $8,636,323
2002 4,159,798 $5,567,671
2003 3,944,492 $5,401,610
2004 3,580,255 $5,155,527
2005 3,596,746 $4,989,914
2006 3,843,912 $4,339,905
2007 3,708,789 $4,135,733
2008 3,278,541 $4,414,027
2009 3,263,788 $4,880,630
5-Year Average 3,538,355 $4,552,042
1. Note that the commercial fishing ex-vessel value data does not begin until 1991. This is the
first year that the Bureau of Labor Statistics began publishing producer price index (PPI) data for
commercial fishing category “02230199."
2. Note that CORA tribal commercial harvest data was not available until year 1990.
11
Recall, the baseline figures represent the average values of commercial harvest levels and
commercial ex-vessel values over the five-year time period (2005-2009). 12
Refer to Table 4: Great Lakes Baseline Harvest and Values in the “Great Lakes” portion of the
document.
Commercial Fisheries Baseline Economic Assessment 28
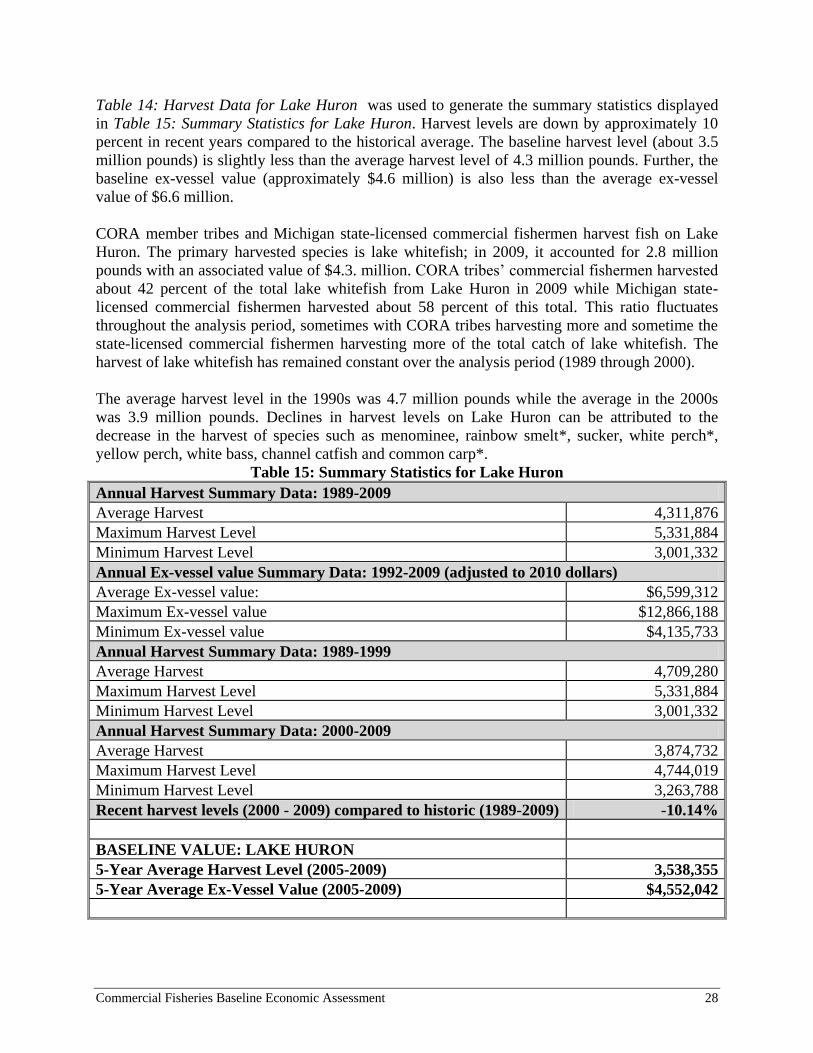
Table 14: Harvest Data for Lake Huron was used to generate the summary statistics displayed
in Table 15: Summary Statistics for Lake Huron. Harvest levels are down by approximately 10
percent in recent years compared to the historical average. The baseline harvest level (about 3.5
million pounds) is slightly less than the average harvest level of 4.3 million pounds. Further, the
baseline ex-vessel value (approximately $4.6 million) is also less than the average ex-vessel
value of $6.6 million.
CORA member tribes and Michigan state-licensed commercial fishermen harvest fish on Lake
Huron. The primary harvested species is lake whitefish; in 2009, it accounted for 2.8 million
pounds with an associated value of $4.3. million. CORA tribes’ commercial fishermen harvested
about 42 percent of the total lake whitefish from Lake Huron in 2009 while Michigan state-
licensed commercial fishermen harvested about 58 percent of this total. This ratio fluctuates
throughout the analysis period, sometimes with CORA tribes harvesting more and sometime the
state-licensed commercial fishermen harvesting more of the total catch of lake whitefish. The
harvest of lake whitefish has remained constant over the analysis period (1989 through 2000).
The average harvest level in the 1990s was 4.7 million pounds while the average in the 2000s
was 3.9 million pounds. Declines in harvest levels on Lake Huron can be attributed to the
decrease in the harvest of species such as menominee, rainbow smelt*, sucker, white perch*,
yellow perch, white bass, channel catfish and common carp*.
Table 15: Summary Statistics for Lake Huron
Annual Harvest Summary Data: 1989-2009
Average Harvest 4,311,876
Maximum Harvest Level 5,331,884
Minimum Harvest Level 3,001,332
Annual Ex-vessel value Summary Data: 1992-2009 (adjusted to 2010 dollars)
Average Ex-vessel value: $6,599,312
Maximum Ex-vessel value $12,866,188
Minimum Ex-vessel value $4,135,733
Annual Harvest Summary Data: 1989-1999
Average Harvest 4,709,280
Maximum Harvest Level 5,331,884
Minimum Harvest Level 3,001,332
Annual Harvest Summary Data: 2000-2009
Average Harvest 3,874,732
Maximum Harvest Level 4,744,019
Minimum Harvest Level 3,263,788
Recent harvest levels (2000 - 2009) compared to historic (1989-2009) -10.14%
BASELINE VALUE: LAKE HURON
5-Year Average Harvest Level (2005-2009) 3,538,355
5-Year Average Ex-Vessel Value (2005-2009) $4,552,042
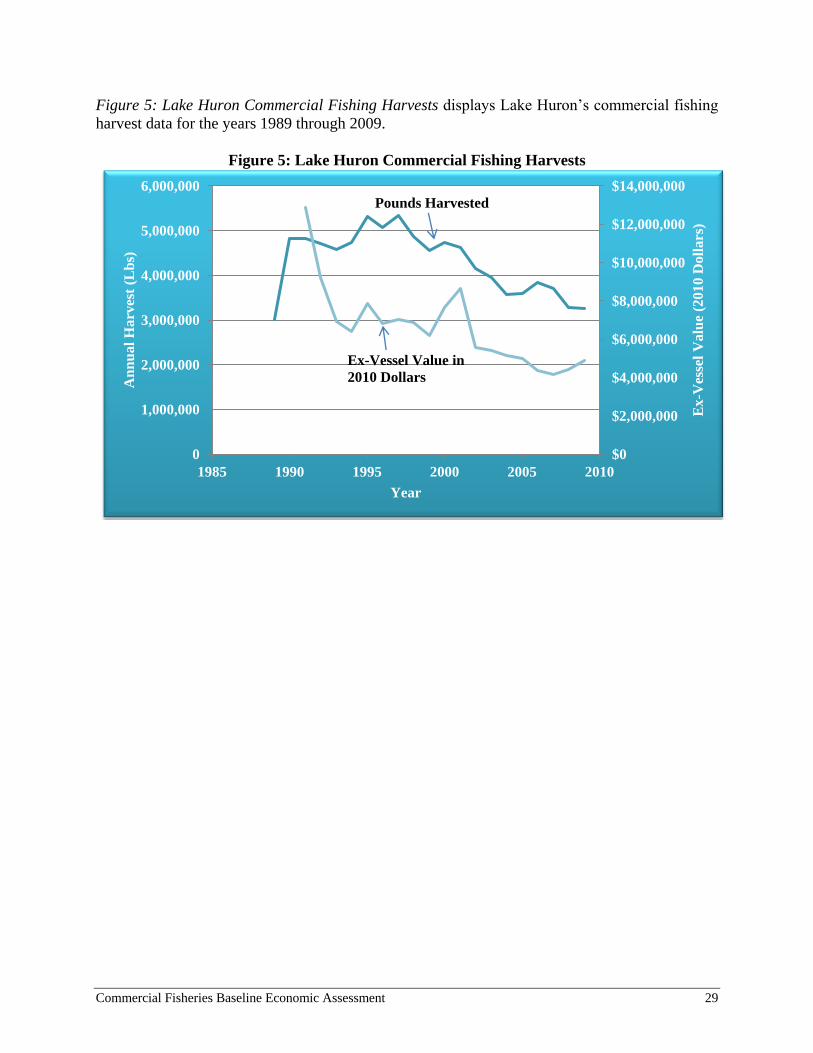
Commercial Fisheries Baseline Economic Assessment 29
Figure 5: Lake Huron Commercial Fishing Harvests displays Lake Huron’s commercial fishing
harvest data for the years 1989 through 2009.
Figure 5: Lake Huron Commercial Fishing Harvests
$0
$2,000,000
$4,000,000
$6,000,000
$8,000,000
$10,000,000
$12,000,000
$14,000,000
0
1,000,000
2,000,000
3,000,000
4,000,000
5,000,000
6,000,000
1985 1990 1995 2000 2005 2010
Ex
-Ves
sel
Valu
e (2
01
0 D
oll
ars
)
An
nu
al
Harv
est
(Lb
s)
Year
Ex-Vessel Value in
2010 Dollars
Pounds Harvested
Commercial Fisheries Baseline Economic Assessment 30
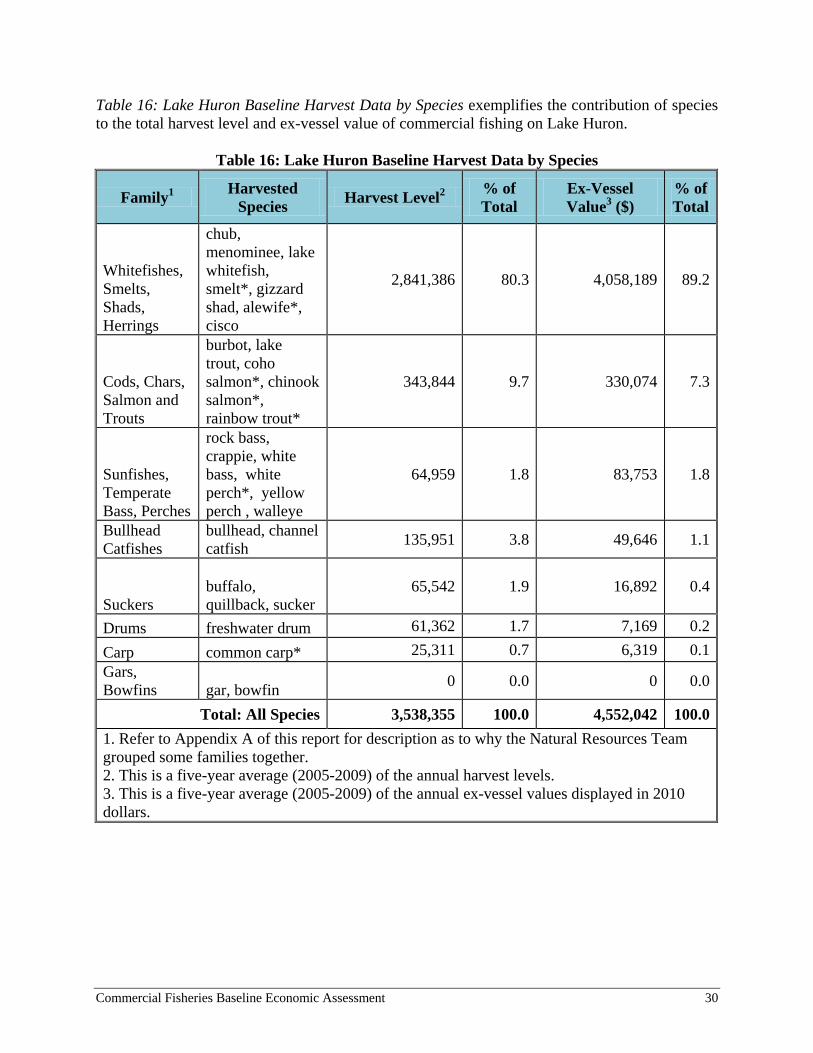
Table 16: Lake Huron Baseline Harvest Data by Species exemplifies the contribution of species
to the total harvest level and ex-vessel value of commercial fishing on Lake Huron.
Table 16: Lake Huron Baseline Harvest Data by Species
Family1
Harvested
Species Harvest Level
2
% of
Total
Ex-Vessel
Value3 ($)
% of
Total
Whitefishes,
Smelts,
Shads,
Herrings
chub,
menominee, lake
whitefish,
smelt*, gizzard
shad, alewife*,
cisco
2,841,386 80.3 4,058,189 89.2
Cods, Chars,
Salmon and
Trouts
burbot, lake
trout, coho
salmon*, chinook
salmon*,
rainbow trout*
343,844 9.7 330,074 7.3
Sunfishes,
Temperate
Bass, Perches
rock bass,
crappie, white
bass, white
perch*, yellow
perch , walleye
64,959 1.8 83,753 1.8
Bullhead
Catfishes
bullhead, channel
catfish 135,951 3.8 49,646 1.1
Suckers
buffalo,
quillback, sucker
65,542 1.9 16,892 0.4
Drums freshwater drum 61,362 1.7 7,169 0.2
Carp common carp* 25,311 0.7 6,319 0.1
Gars,
Bowfins gar, bowfin 0 0.0 0 0.0
Total: All Species 3,538,355 100.0 4,552,042 100.0
1. Refer to Appendix A of this report for description as to why the Natural Resources Team
grouped some families together.
2. This is a five-year average (2005-2009) of the annual harvest levels.
3. This is a five-year average (2005-2009) of the annual ex-vessel values displayed in 2010
dollars.
Commercial Fisheries Baseline Economic Assessment 31
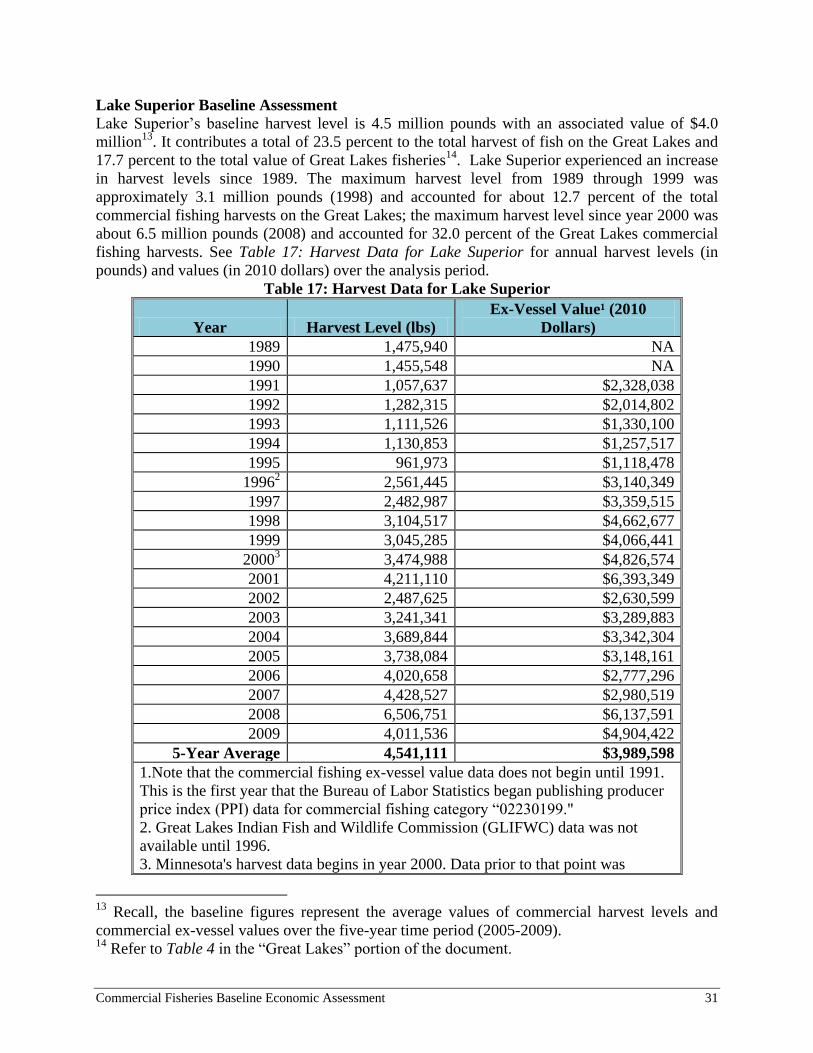
Lake Superior Baseline Assessment
Lake Superior’s baseline harvest level is 4.5 million pounds with an associated value of $4.0
million13
. It contributes a total of 23.5 percent to the total harvest of fish on the Great Lakes and
17.7 percent to the total value of Great Lakes fisheries14
. Lake Superior experienced an increase
in harvest levels since 1989. The maximum harvest level from 1989 through 1999 was
approximately 3.1 million pounds (1998) and accounted for about 12.7 percent of the total
commercial fishing harvests on the Great Lakes; the maximum harvest level since year 2000 was
about 6.5 million pounds (2008) and accounted for 32.0 percent of the Great Lakes commercial
fishing harvests. See Table 17: Harvest Data for Lake Superior for annual harvest levels (in
pounds) and values (in 2010 dollars) over the analysis period.
Table 17: Harvest Data for Lake Superior
Year Harvest Level (lbs)
Ex-Vessel Value¹ (2010
Dollars)
1989 1,475,940 NA
1990 1,455,548 NA
1991 1,057,637 $2,328,038
1992 1,282,315 $2,014,802
1993 1,111,526 $1,330,100
1994 1,130,853 $1,257,517
1995 961,973 $1,118,478
19962 2,561,445 $3,140,349
1997 2,482,987 $3,359,515
1998 3,104,517 $4,662,677
1999 3,045,285 $4,066,441
20003 3,474,988 $4,826,574
2001 4,211,110 $6,393,349
2002 2,487,625 $2,630,599
2003 3,241,341 $3,289,883
2004 3,689,844 $3,342,304
2005 3,738,084 $3,148,161
2006 4,020,658 $2,777,296
2007 4,428,527 $2,980,519
2008 6,506,751 $6,137,591
2009 4,011,536 $4,904,422
5-Year Average 4,541,111 $3,989,598
1.Note that the commercial fishing ex-vessel value data does not begin until 1991.
This is the first year that the Bureau of Labor Statistics began publishing producer
price index (PPI) data for commercial fishing category “02230199."
2. Great Lakes Indian Fish and Wildlife Commission (GLIFWC) data was not
available until 1996.
3. Minnesota's harvest data begins in year 2000. Data prior to that point was
13
Recall, the baseline figures represent the average values of commercial harvest levels and
commercial ex-vessel values over the five-year time period (2005-2009). 14
Refer to Table 4 in the “Great Lakes” portion of the document.
Commercial Fisheries Baseline Economic Assessment 32
unavailable.
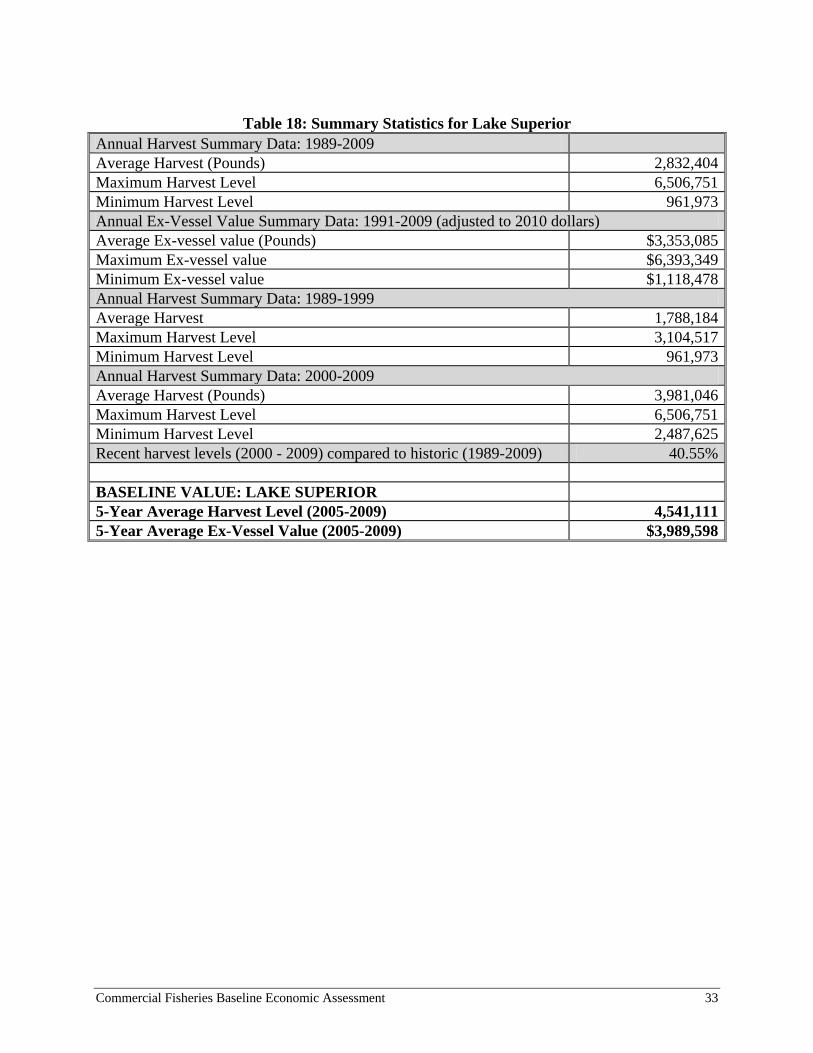
Table 17: Harvest Data for Lake Superior was used to generate the summary statistics for Lake
Superior displayed in Table 18: Summary Statistics for Lake Superior. Harvest levels are up
about 41 percent in recent years compared to the historical average.
The baseline harvest level (about 4.5 million pounds) is greater than the historical average
harvest level of 2.8 million pounds. Further, the baseline ex-vessel value ($4.0 million) is greater
the average ex-vessel value of $3.4 million.
Harvest levels and ex-vessel values in the 1990s reflect the totals of two states’ tribe and state-
licensed commercial fishing harvests: Michigan and Wisconsin. However, the Great Lakes
Indian Fish and Wildlife Commission data contribution does not begin until 1996; therefore,
some increase in the harvest since then can be attributed to this data contribution.
The Great Lakes Indian Fish and Wildlife Commission (GLIFWC) represents the following
tribes: Bay Mills Indian Community, Lac Vieux Desert Band of Lake Superior Chippewa
Indians, Bad River Band of Lake Superior Chippewa Indians of Wisconsin, Red Cliff Band of
Lake Superior Chippewa Indians of Wisconsin, Lac du Flambeau Band of Lake Superior
Chippewa Indians of Wisconsin, Lac Courte Oreilles Band of Lake Superior Chippewa Indians
of Wisconsin, St. Croix Chippewa Indians of Wisconsin, Mille Lacs Band of Ojibwe, and Fond
du Lac Band of Lake Superior Chippewa Indians of Minnesota15
.
Minnesota’s data contribution begins in year 2000. Therefore, increases in harvest levels during
the 2000s are partially attributed to Minnesota’s data contribution.
The majority of the harvests on Lake Superior are comprised of lake whitefish. In 2009, the total
harvest of this species was approximately 2.5 million pounds. This is less than the average
harvest level of species in the 2000s (about 4.0 million pounds). The remainder of the total
harvest in 2009 is attributed to the harvest of species such as lake herring (approximately
618,000 pounds).
15
Note that the 1854 Treaty Authority member tribes (which border Lake Superior) did not
provide harvest data for any year during the Great Lakes analysis period (1989 through 2009).
These tribes include the Grand Portage Band of Lake Superior Chippewa Indians, and the Bois
Forte Band of Lake Superior Chippewa Indians.
Commercial Fisheries Baseline Economic Assessment 33
Table 18: Summary Statistics for Lake Superior
Annual Harvest Summary Data: 1989-2009
Average Harvest (Pounds) 2,832,404
Maximum Harvest Level 6,506,751
Minimum Harvest Level 961,973
Annual Ex-Vessel Value Summary Data: 1991-2009 (adjusted to 2010 dollars)
Average Ex-vessel value (Pounds) $3,353,085
Maximum Ex-vessel value $6,393,349
Minimum Ex-vessel value $1,118,478
Annual Harvest Summary Data: 1989-1999
Average Harvest 1,788,184
Maximum Harvest Level 3,104,517
Minimum Harvest Level 961,973
Annual Harvest Summary Data: 2000-2009
Average Harvest (Pounds) 3,981,046
Maximum Harvest Level 6,506,751
Minimum Harvest Level 2,487,625
Recent harvest levels (2000 - 2009) compared to historic (1989-2009) 40.55%
BASELINE VALUE: LAKE SUPERIOR
5-Year Average Harvest Level (2005-2009) 4,541,111
5-Year Average Ex-Vessel Value (2005-2009) $3,989,598
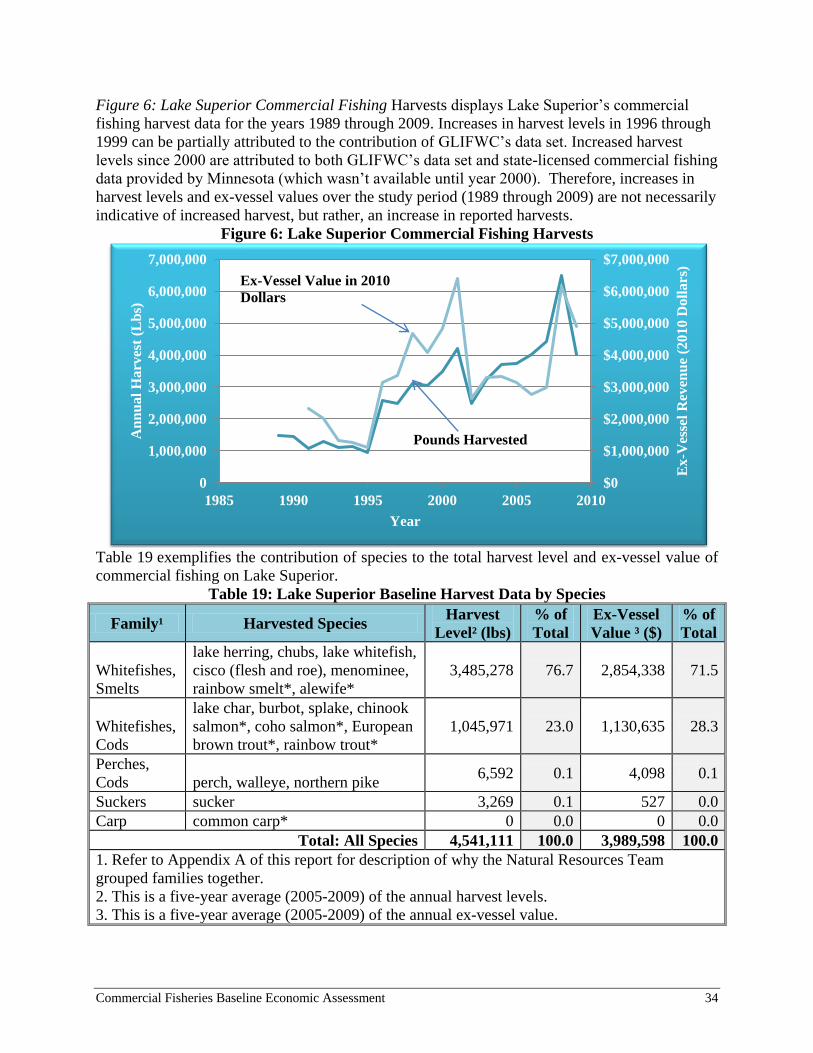
Commercial Fisheries Baseline Economic Assessment 34
Figure 6: Lake Superior Commercial Fishing Harvests displays Lake Superior’s commercial
fishing harvest data for the years 1989 through 2009. Increases in harvest levels in 1996 through
1999 can be partially attributed to the contribution of GLIFWC’s data set. Increased harvest
levels since 2000 are attributed to both GLIFWC’s data set and state-licensed commercial fishing
data provided by Minnesota (which wasn’t available until year 2000). Therefore, increases in
harvest levels and ex-vessel values over the study period (1989 through 2009) are not necessarily
indicative of increased harvest, but rather, an increase in reported harvests.
Figure 6: Lake Superior Commercial Fishing Harvests
Table 19 exemplifies the contribution of species to the total harvest level and ex-vessel value of
commercial fishing on Lake Superior.
Table 19: Lake Superior Baseline Harvest Data by Species
Family¹ Harvested Species Harvest
Level² (lbs)
% of
Total
Ex-Vessel
Value ³ ($)
% of
Total
Whitefishes,
Smelts
lake herring, chubs, lake whitefish,
cisco (flesh and roe), menominee,
rainbow smelt*, alewife*
3,485,278 76.7 2,854,338 71.5
Whitefishes,
Cods
lake char, burbot, splake, chinook
salmon*, coho salmon*, European
brown trout*, rainbow trout*
1,045,971 23.0 1,130,635 28.3
Perches,
Cods perch, walleye, northern pike 6,592 0.1 4,098 0.1
Suckers sucker 3,269 0.1 527 0.0
Carp common carp* 0 0.0 0 0.0
Total: All Species 4,541,111 100.0 3,989,598 100.0
1. Refer to Appendix A of this report for description of why the Natural Resources Team
grouped families together.
2. This is a five-year average (2005-2009) of the annual harvest levels.
3. This is a five-year average (2005-2009) of the annual ex-vessel value.
$0
$1,000,000
$2,000,000
$3,000,000
$4,000,000
$5,000,000
$6,000,000
$7,000,000
0
1,000,000
2,000,000
3,000,000
4,000,000
5,000,000
6,000,000
7,000,000
1985 1990 1995 2000 2005 2010
Ex
-Ves
sel
Rev
enu
e (2
01
0 D
oll
ars
)
An
nu
al
Harv
est
(Lb
s)
Year
Ex-Vessel Value in 2010
Dollars
Pounds Harvested
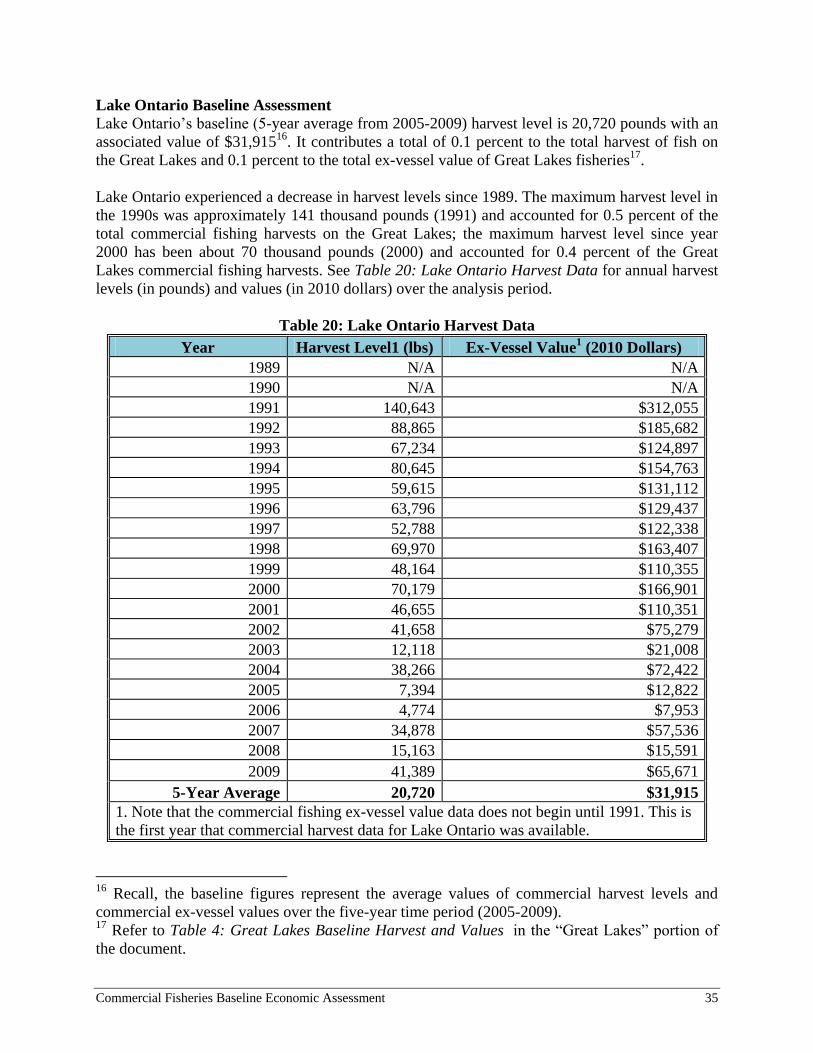
Commercial Fisheries Baseline Economic Assessment 35
Lake Ontario Baseline Assessment
Lake Ontario’s baseline (5-year average from 2005-2009) harvest level is 20,720 pounds with an
associated value of $31,91516
. It contributes a total of 0.1 percent to the total harvest of fish on
the Great Lakes and 0.1 percent to the total ex-vessel value of Great Lakes fisheries17
.
Lake Ontario experienced a decrease in harvest levels since 1989. The maximum harvest level in
the 1990s was approximately 141 thousand pounds (1991) and accounted for 0.5 percent of the
total commercial fishing harvests on the Great Lakes; the maximum harvest level since year
2000 has been about 70 thousand pounds (2000) and accounted for 0.4 percent of the Great
Lakes commercial fishing harvests. See Table 20: Lake Ontario Harvest Data for annual harvest
levels (in pounds) and values (in 2010 dollars) over the analysis period.
Table 20: Lake Ontario Harvest Data
Year Harvest Level1 (lbs) Ex-Vessel Value1 (2010 Dollars)
1989 N/A N/A
1990 N/A N/A
1991 140,643 $312,055
1992 88,865 $185,682
1993 67,234 $124,897
1994 80,645 $154,763
1995 59,615 $131,112
1996 63,796 $129,437
1997 52,788 $122,338
1998 69,970 $163,407
1999 48,164 $110,355
2000 70,179 $166,901
2001 46,655 $110,351
2002 41,658 $75,279
2003 12,118 $21,008
2004 38,266 $72,422
2005 7,394 $12,822
2006 4,774 $7,953
2007 34,878 $57,536
2008 15,163 $15,591
2009 41,389 $65,671
5-Year Average 20,720 $31,915
1. Note that the commercial fishing ex-vessel value data does not begin until 1991. This is
the first year that commercial harvest data for Lake Ontario was available.
16
Recall, the baseline figures represent the average values of commercial harvest levels and
commercial ex-vessel values over the five-year time period (2005-2009). 17
Refer to Table 4: Great Lakes Baseline Harvest and Values in the “Great Lakes” portion of
the document.
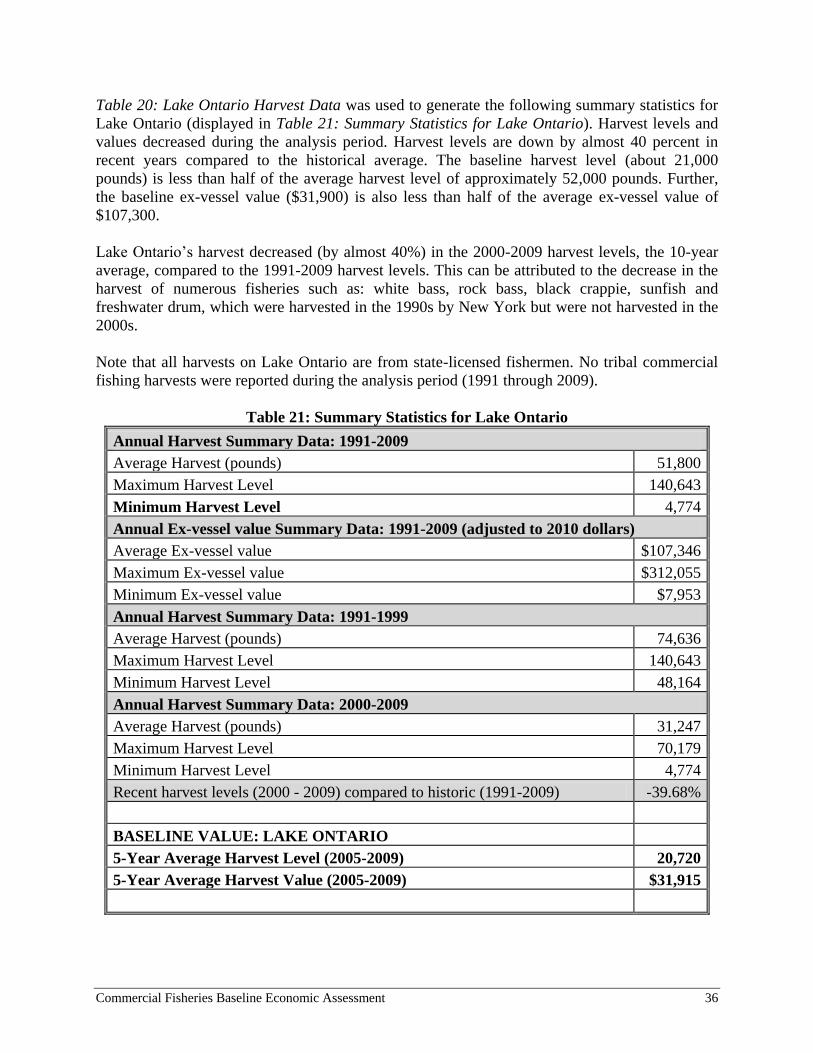
Commercial Fisheries Baseline Economic Assessment 36
Table 20: Lake Ontario Harvest Data was used to generate the following summary statistics for
Lake Ontario (displayed in Table 21: Summary Statistics for Lake Ontario). Harvest levels and
values decreased during the analysis period. Harvest levels are down by almost 40 percent in
recent years compared to the historical average. The baseline harvest level (about 21,000
pounds) is less than half of the average harvest level of approximately 52,000 pounds. Further,
the baseline ex-vessel value ($31,900) is also less than half of the average ex-vessel value of
$107,300.
Lake Ontario’s harvest decreased (by almost 40%) in the 2000-2009 harvest levels, the 10-year
average, compared to the 1991-2009 harvest levels. This can be attributed to the decrease in the
harvest of numerous fisheries such as: white bass, rock bass, black crappie, sunfish and
freshwater drum, which were harvested in the 1990s by New York but were not harvested in the
2000s.
Note that all harvests on Lake Ontario are from state-licensed fishermen. No tribal commercial
fishing harvests were reported during the analysis period (1991 through 2009).
Table 21: Summary Statistics for Lake Ontario
Annual Harvest Summary Data: 1991-2009
Average Harvest (pounds) 51,800
Maximum Harvest Level 140,643
Minimum Harvest Level 4,774
Annual Ex-vessel value Summary Data: 1991-2009 (adjusted to 2010 dollars)
Average Ex-vessel value $107,346
Maximum Ex-vessel value $312,055
Minimum Ex-vessel value $7,953
Annual Harvest Summary Data: 1991-1999
Average Harvest (pounds) 74,636
Maximum Harvest Level 140,643
Minimum Harvest Level 48,164
Annual Harvest Summary Data: 2000-2009
Average Harvest (pounds) 31,247
Maximum Harvest Level 70,179
Minimum Harvest Level 4,774
Recent harvest levels (2000 - 2009) compared to historic (1991-2009) -39.68%
BASELINE VALUE: LAKE ONTARIO
5-Year Average Harvest Level (2005-2009) 20,720
5-Year Average Harvest Value (2005-2009) $31,915
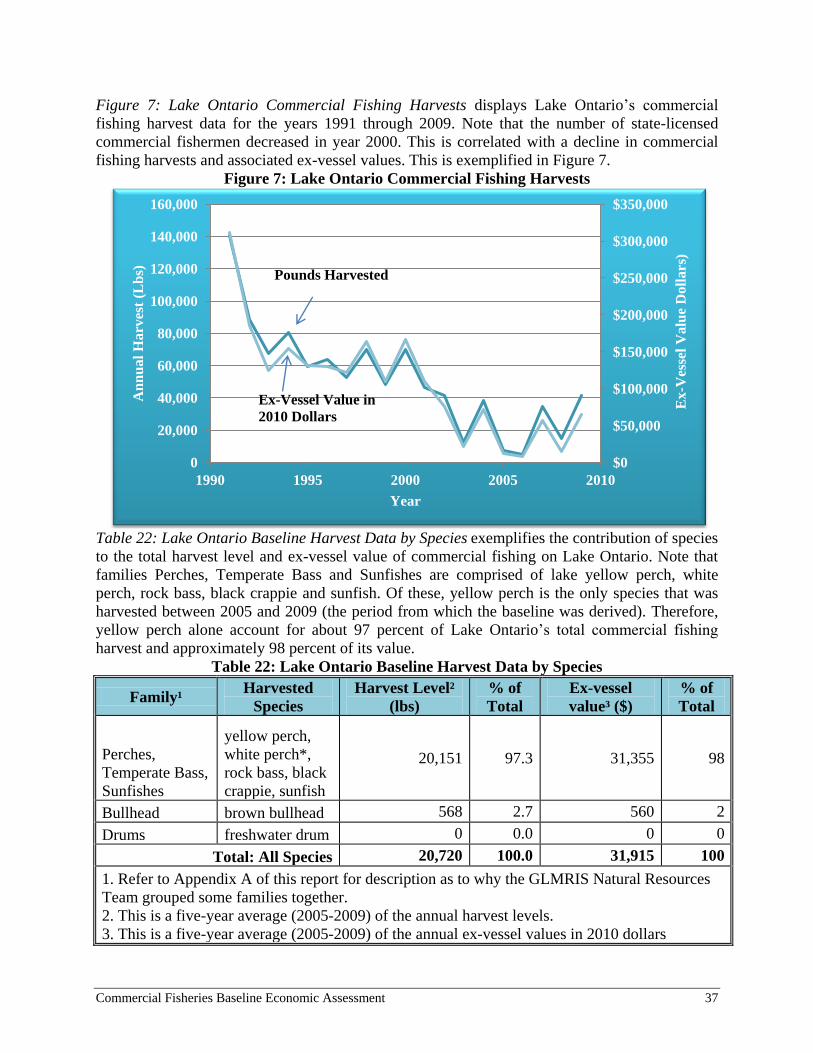
Commercial Fisheries Baseline Economic Assessment 37
Figure 7: Lake Ontario Commercial Fishing Harvests displays Lake Ontario’s commercial
fishing harvest data for the years 1991 through 2009. Note that the number of state-licensed
commercial fishermen decreased in year 2000. This is correlated with a decline in commercial
fishing harvests and associated ex-vessel values. This is exemplified in Figure 7.
Figure 7: Lake Ontario Commercial Fishing Harvests
Table 22: Lake Ontario Baseline Harvest Data by Species exemplifies the contribution of species
to the total harvest level and ex-vessel value of commercial fishing on Lake Ontario. Note that
families Perches, Temperate Bass and Sunfishes are comprised of lake yellow perch, white
perch, rock bass, black crappie and sunfish. Of these, yellow perch is the only species that was
harvested between 2005 and 2009 (the period from which the baseline was derived). Therefore,
yellow perch alone account for about 97 percent of Lake Ontario’s total commercial fishing
harvest and approximately 98 percent of its value.
Table 22: Lake Ontario Baseline Harvest Data by Species
Family¹ Harvested
Species
Harvest Level²
(lbs)
% of
Total
Ex-vessel
value³ ($)
% of
Total
Perches,
Temperate Bass,
Sunfishes
yellow perch,
white perch*,
rock bass, black
crappie, sunfish
20,151 97.3 31,355 98
Bullhead brown bullhead 568 2.7 560 2
Drums freshwater drum 0 0.0 0 0
Total: All Species 20,720 100.0 31,915 100
1. Refer to Appendix A of this report for description as to why the GLMRIS Natural Resources
Team grouped some families together.
2. This is a five-year average (2005-2009) of the annual harvest levels.
3. This is a five-year average (2005-2009) of the annual ex-vessel values in 2010 dollars
$0
$50,000
$100,000
$150,000
$200,000
$250,000
$300,000
$350,000
0
20,000
40,000
60,000
80,000
100,000
120,000
140,000
160,000
1990 1995 2000 2005 2010
Ex
-Ves
sel
Valu
e D
oll
ars
)
An
nu
al
Harv
est
(Lb
s)
Year
Ex-Vessel Value in
2010 Dollars
Pounds Harvested
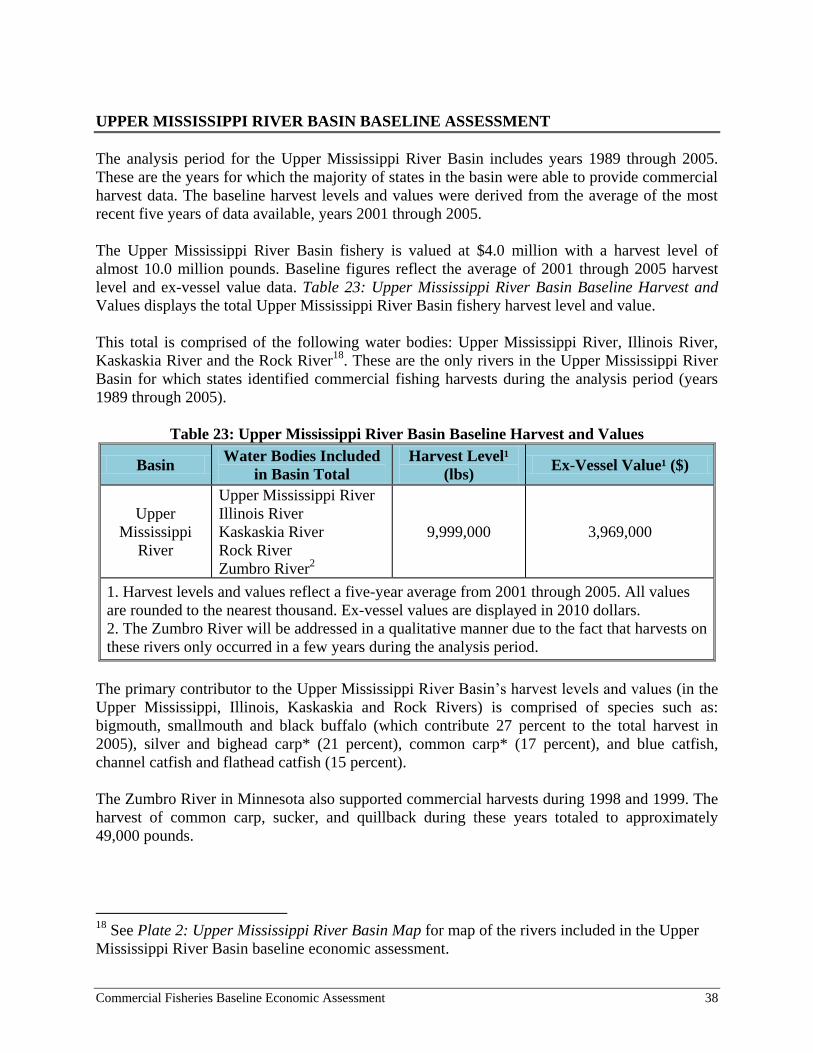
Commercial Fisheries Baseline Economic Assessment 38
UPPER MISSISSIPPI RIVER BASIN BASELINE ASSESSMENT
The analysis period for the Upper Mississippi River Basin includes years 1989 through 2005.
These are the years for which the majority of states in the basin were able to provide commercial
harvest data. The baseline harvest levels and values were derived from the average of the most
recent five years of data available, years 2001 through 2005.
The Upper Mississippi River Basin fishery is valued at $4.0 million with a harvest level of
almost 10.0 million pounds. Baseline figures reflect the average of 2001 through 2005 harvest
level and ex-vessel value data. Table 23: Upper Mississippi River Basin Baseline Harvest and
Values displays the total Upper Mississippi River Basin fishery harvest level and value.
This total is comprised of the following water bodies: Upper Mississippi River, Illinois River,
Kaskaskia River and the Rock River18
. These are the only rivers in the Upper Mississippi River
Basin for which states identified commercial fishing harvests during the analysis period (years
1989 through 2005).
Table 23: Upper Mississippi River Basin Baseline Harvest and Values
Basin Water Bodies Included
in Basin Total
Harvest Level¹
(lbs) Ex-Vessel Value¹ ($)
Upper
Mississippi
River
Upper Mississippi River
Illinois River
Kaskaskia River
Rock River
Zumbro River2
9,999,000 3,969,000
1. Harvest levels and values reflect a five-year average from 2001 through 2005. All values
are rounded to the nearest thousand. Ex-vessel values are displayed in 2010 dollars.
2. The Zumbro River will be addressed in a qualitative manner due to the fact that harvests on
these rivers only occurred in a few years during the analysis period.
The primary contributor to the Upper Mississippi River Basin’s harvest levels and values (in the
Upper Mississippi, Illinois, Kaskaskia and Rock Rivers) is comprised of species such as:
bigmouth, smallmouth and black buffalo (which contribute 27 percent to the total harvest in
2005), silver and bighead carp* (21 percent), common carp* (17 percent), and blue catfish,
channel catfish and flathead catfish (15 percent).
The Zumbro River in Minnesota also supported commercial harvests during 1998 and 1999. The
harvest of common carp, sucker, and quillback during these years totaled to approximately
49,000 pounds.
18
See Plate 2: Upper Mississippi River Basin Map for map of the rivers included in the Upper
Mississippi River Basin baseline economic assessment.
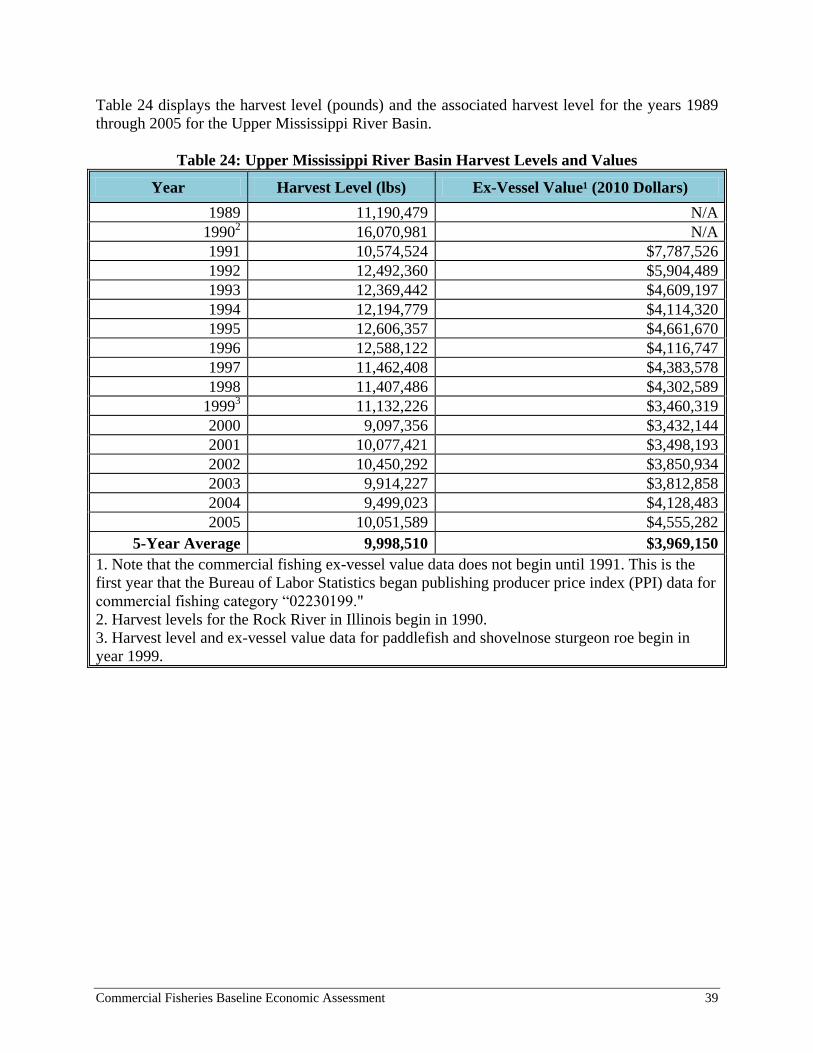
Commercial Fisheries Baseline Economic Assessment 39
Table 24 displays the harvest level (pounds) and the associated harvest level for the years 1989
through 2005 for the Upper Mississippi River Basin.
Table 24: Upper Mississippi River Basin Harvest Levels and Values
Year Harvest Level (lbs) Ex-Vessel Value¹ (2010 Dollars)
1989 11,190,479 N/A
19902 16,070,981 N/A
1991 10,574,524 $7,787,526
1992 12,492,360 $5,904,489
1993 12,369,442 $4,609,197
1994 12,194,779 $4,114,320
1995 12,606,357 $4,661,670
1996 12,588,122 $4,116,747
1997 11,462,408 $4,383,578
1998 11,407,486 $4,302,589
19993 11,132,226 $3,460,319
2000 9,097,356 $3,432,144
2001 10,077,421 $3,498,193
2002 10,450,292 $3,850,934
2003 9,914,227 $3,812,858
2004 9,499,023 $4,128,483
2005 10,051,589 $4,555,282
5-Year Average 9,998,510 $3,969,150
1. Note that the commercial fishing ex-vessel value data does not begin until 1991. This is the
first year that the Bureau of Labor Statistics began publishing producer price index (PPI) data for
commercial fishing category “02230199."
2. Harvest levels for the Rock River in Illinois begin in 1990.
3. Harvest level and ex-vessel value data for paddlefish and shovelnose sturgeon roe begin in
year 1999.
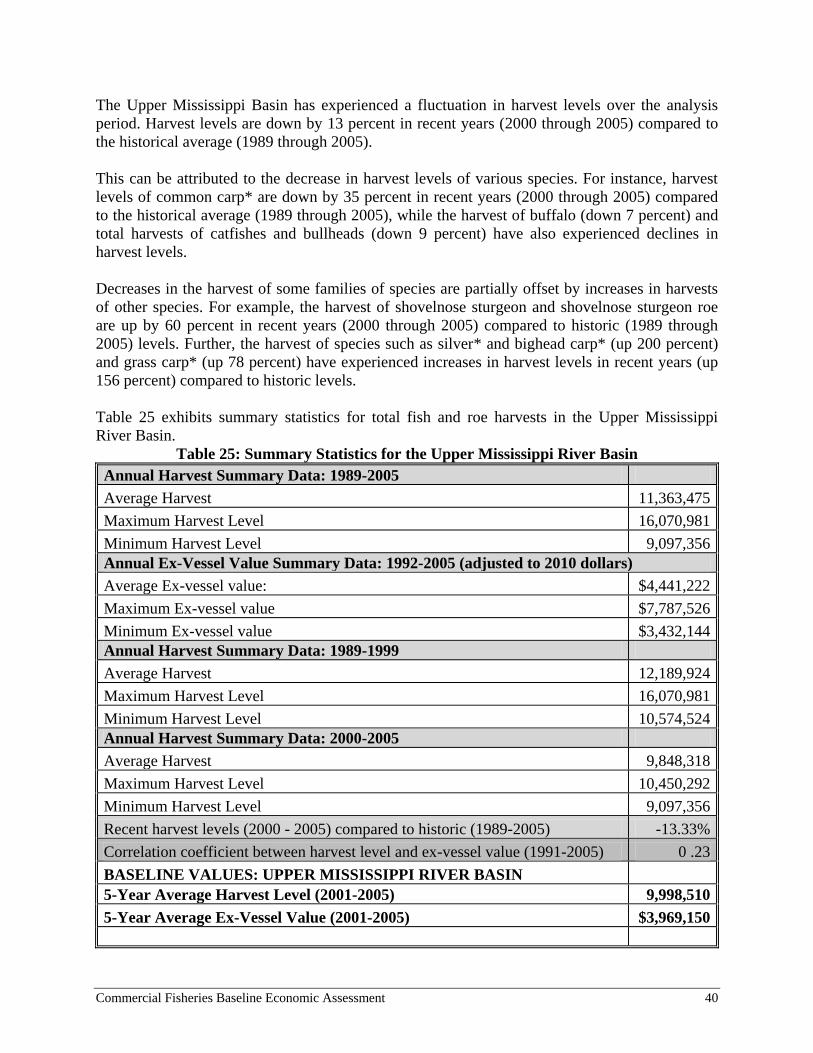
Commercial Fisheries Baseline Economic Assessment 40
The Upper Mississippi Basin has experienced a fluctuation in harvest levels over the analysis
period. Harvest levels are down by 13 percent in recent years (2000 through 2005) compared to
the historical average (1989 through 2005).
This can be attributed to the decrease in harvest levels of various species. For instance, harvest
levels of common carp* are down by 35 percent in recent years (2000 through 2005) compared
to the historical average (1989 through 2005), while the harvest of buffalo (down 7 percent) and
total harvests of catfishes and bullheads (down 9 percent) have also experienced declines in
harvest levels.
Decreases in the harvest of some families of species are partially offset by increases in harvests
of other species. For example, the harvest of shovelnose sturgeon and shovelnose sturgeon roe
are up by 60 percent in recent years (2000 through 2005) compared to historic (1989 through
2005) levels. Further, the harvest of species such as silver* and bighead carp* (up 200 percent)
and grass carp* (up 78 percent) have experienced increases in harvest levels in recent years (up
156 percent) compared to historic levels.
Table 25 exhibits summary statistics for total fish and roe harvests in the Upper Mississippi
River Basin.
Table 25: Summary Statistics for the Upper Mississippi River Basin
Annual Harvest Summary Data: 1989-2005
Average Harvest 11,363,475
Maximum Harvest Level 16,070,981
Minimum Harvest Level 9,097,356
Annual Ex-Vessel Value Summary Data: 1992-2005 (adjusted to 2010 dollars)
Average Ex-vessel value: $4,441,222
Maximum Ex-vessel value $7,787,526
Minimum Ex-vessel value $3,432,144
Annual Harvest Summary Data: 1989-1999
Average Harvest 12,189,924
Maximum Harvest Level 16,070,981
Minimum Harvest Level 10,574,524
Annual Harvest Summary Data: 2000-2005
Average Harvest 9,848,318
Maximum Harvest Level 10,450,292
Minimum Harvest Level 9,097,356
Recent harvest levels (2000 - 2005) compared to historic (1989-2005) -13.33%
Correlation coefficient between harvest level and ex-vessel value (1991-2005) 0 .23
BASELINE VALUES: UPPER MISSISSIPPI RIVER BASIN
5-Year Average Harvest Level (2001-2005) 9,998,510
5-Year Average Ex-Vessel Value (2001-2005) $3,969,150
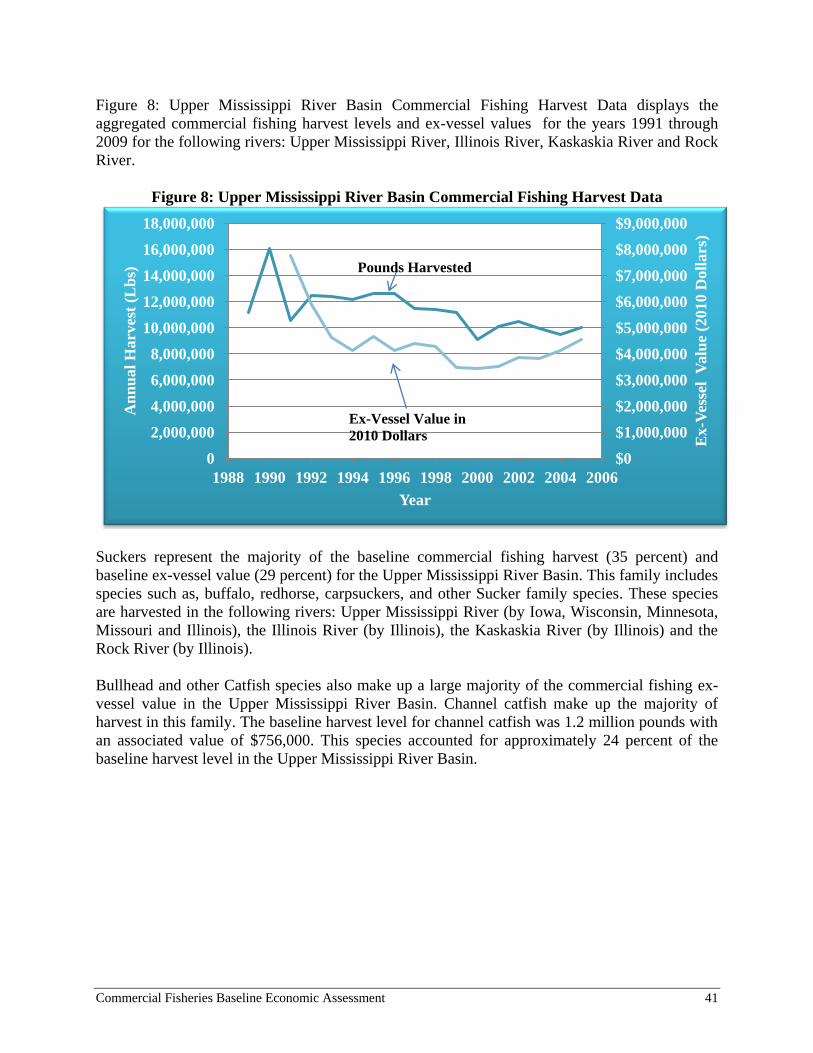
Commercial Fisheries Baseline Economic Assessment 41
Figure 8: Upper Mississippi River Basin Commercial Fishing Harvest Data displays the
aggregated commercial fishing harvest levels and ex-vessel values for the years 1991 through
2009 for the following rivers: Upper Mississippi River, Illinois River, Kaskaskia River and Rock
River.
Figure 8: Upper Mississippi River Basin Commercial Fishing Harvest Data
Suckers represent the majority of the baseline commercial fishing harvest (35 percent) and
baseline ex-vessel value (29 percent) for the Upper Mississippi River Basin. This family includes
species such as, buffalo, redhorse, carpsuckers, and other Sucker family species. These species
are harvested in the following rivers: Upper Mississippi River (by Iowa, Wisconsin, Minnesota,
Missouri and Illinois), the Illinois River (by Illinois), the Kaskaskia River (by Illinois) and the
Rock River (by Illinois).
Bullhead and other Catfish species also make up a large majority of the commercial fishing ex-
vessel value in the Upper Mississippi River Basin. Channel catfish make up the majority of
harvest in this family. The baseline harvest level for channel catfish was 1.2 million pounds with
an associated value of $756,000. This species accounted for approximately 24 percent of the
baseline harvest level in the Upper Mississippi River Basin.
$0
$1,000,000
$2,000,000
$3,000,000
$4,000,000
$5,000,000
$6,000,000
$7,000,000
$8,000,000
$9,000,000
0
2,000,000
4,000,000
6,000,000
8,000,000
10,000,000
12,000,000
14,000,000
16,000,000
18,000,000
1988 1990 1992 1994 1996 1998 2000 2002 2004 2006
Ex-V
esse
l V
alu
e (2
010 D
oll
ars
)
An
nu
al
Harv
est
(Lb
s)
Year
Ex-Vessel Value in
2010 Dollars
Pounds Harvested
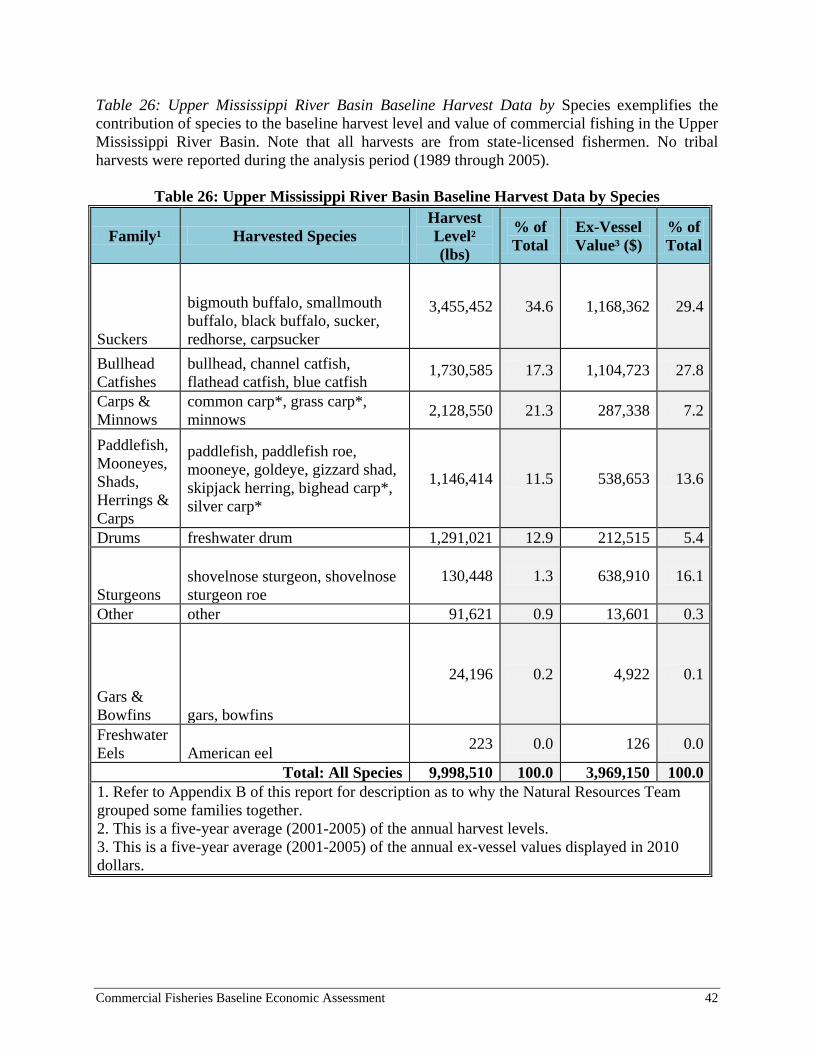
Commercial Fisheries Baseline Economic Assessment 42
Table 26: Upper Mississippi River Basin Baseline Harvest Data by Species exemplifies the
contribution of species to the baseline harvest level and value of commercial fishing in the Upper
Mississippi River Basin. Note that all harvests are from state-licensed fishermen. No tribal
harvests were reported during the analysis period (1989 through 2005).
Table 26: Upper Mississippi River Basin Baseline Harvest Data by Species
Family¹ Harvested Species
Harvest
Level²
(lbs)
% of
Total
Ex-Vessel
Value³ ($)
% of
Total
Suckers
bigmouth buffalo, smallmouth
buffalo, black buffalo, sucker,
redhorse, carpsucker
3,455,452 34.6 1,168,362 29.4
Bullhead
Catfishes
bullhead, channel catfish,
flathead catfish, blue catfish 1,730,585 17.3 1,104,723 27.8
Carps &
Minnows
common carp*, grass carp*,
minnows 2,128,550 21.3 287,338 7.2
Paddlefish,
Mooneyes,
Shads,
Herrings &
Carps
paddlefish, paddlefish roe,
mooneye, goldeye, gizzard shad,
skipjack herring, bighead carp*,
silver carp*
1,146,414 11.5 538,653 13.6
Drums freshwater drum 1,291,021 12.9 212,515 5.4
Sturgeons
shovelnose sturgeon, shovelnose
sturgeon roe
130,448 1.3 638,910 16.1
Other other 91,621 0.9 13,601 0.3
Gars &
Bowfins gars, bowfins
24,196 0.2 4,922 0.1
Freshwater
Eels American eel 223 0.0 126 0.0
Total: All Species 9,998,510 100.0 3,969,150 100.0
1. Refer to Appendix B of this report for description as to why the Natural Resources Team
grouped some families together.
2. This is a five-year average (2001-2005) of the annual harvest levels.
3. This is a five-year average (2001-2005) of the annual ex-vessel values displayed in 2010
dollars.
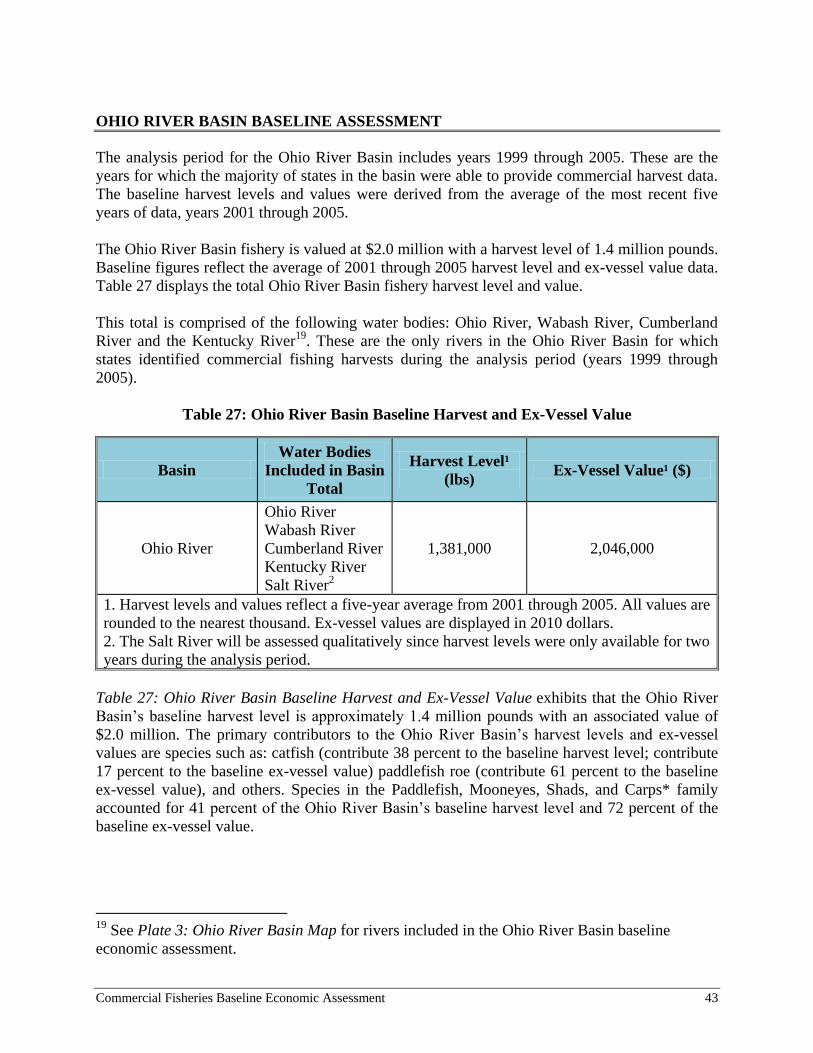
Commercial Fisheries Baseline Economic Assessment 43
OHIO RIVER BASIN BASELINE ASSESSMENT
The analysis period for the Ohio River Basin includes years 1999 through 2005. These are the
years for which the majority of states in the basin were able to provide commercial harvest data.
The baseline harvest levels and values were derived from the average of the most recent five
years of data, years 2001 through 2005.
The Ohio River Basin fishery is valued at $2.0 million with a harvest level of 1.4 million pounds.
Baseline figures reflect the average of 2001 through 2005 harvest level and ex-vessel value data.
Table 27 displays the total Ohio River Basin fishery harvest level and value.
This total is comprised of the following water bodies: Ohio River, Wabash River, Cumberland
River and the Kentucky River19
. These are the only rivers in the Ohio River Basin for which
states identified commercial fishing harvests during the analysis period (years 1999 through
2005).
Table 27: Ohio River Basin Baseline Harvest and Ex-Vessel Value
Basin
Water Bodies
Included in Basin
Total
Harvest Level¹
(lbs) Ex-Vessel Value¹ ($)
Ohio River
Ohio River
Wabash River
Cumberland River
Kentucky River
Salt River2
1,381,000 2,046,000
1. Harvest levels and values reflect a five-year average from 2001 through 2005. All values are
rounded to the nearest thousand. Ex-vessel values are displayed in 2010 dollars.
2. The Salt River will be assessed qualitatively since harvest levels were only available for two
years during the analysis period.
Table 27: Ohio River Basin Baseline Harvest and Ex-Vessel Value exhibits that the Ohio River
Basin’s baseline harvest level is approximately 1.4 million pounds with an associated value of
$2.0 million. The primary contributors to the Ohio River Basin’s harvest levels and ex-vessel
values are species such as: catfish (contribute 38 percent to the baseline harvest level; contribute
17 percent to the baseline ex-vessel value) paddlefish roe (contribute 61 percent to the baseline
ex-vessel value), and others. Species in the Paddlefish, Mooneyes, Shads, and Carps* family
accounted for 41 percent of the Ohio River Basin’s baseline harvest level and 72 percent of the
baseline ex-vessel value.
19
See Plate 3: Ohio River Basin Map for rivers included in the Ohio River Basin baseline
economic assessment.
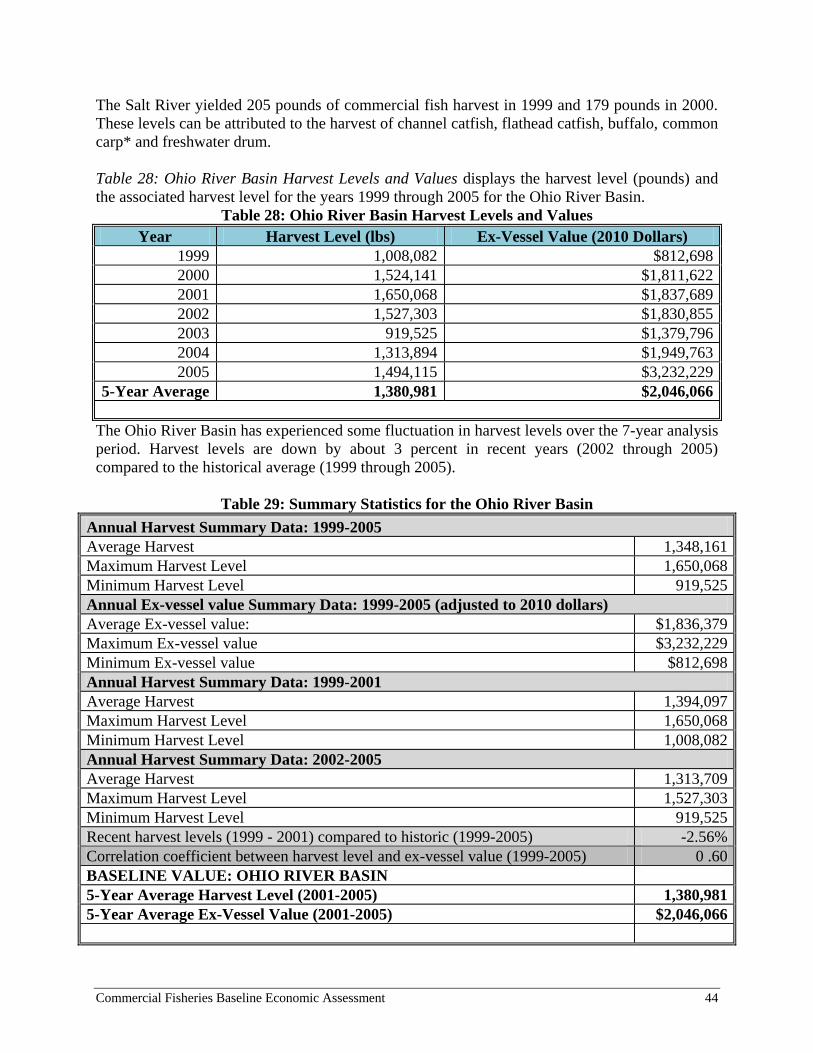
Commercial Fisheries Baseline Economic Assessment 44
The Salt River yielded 205 pounds of commercial fish harvest in 1999 and 179 pounds in 2000.
These levels can be attributed to the harvest of channel catfish, flathead catfish, buffalo, common
carp* and freshwater drum.
Table 28: Ohio River Basin Harvest Levels and Values displays the harvest level (pounds) and
the associated harvest level for the years 1999 through 2005 for the Ohio River Basin.
Table 28: Ohio River Basin Harvest Levels and Values
Year Harvest Level (lbs) Ex-Vessel Value (2010 Dollars)
1999 1,008,082 $812,698
2000 1,524,141 $1,811,622
2001 1,650,068 $1,837,689
2002 1,527,303 $1,830,855
2003 919,525 $1,379,796
2004 1,313,894 $1,949,763
2005 1,494,115 $3,232,229
5-Year Average 1,380,981 $2,046,066
The Ohio River Basin has experienced some fluctuation in harvest levels over the 7-year analysis
period. Harvest levels are down by about 3 percent in recent years (2002 through 2005)
compared to the historical average (1999 through 2005).
Table 29: Summary Statistics for the Ohio River Basin
Annual Harvest Summary Data: 1999-2005
Average Harvest 1,348,161
Maximum Harvest Level 1,650,068
Minimum Harvest Level 919,525
Annual Ex-vessel value Summary Data: 1999-2005 (adjusted to 2010 dollars)
Average Ex-vessel value: $1,836,379
Maximum Ex-vessel value $3,232,229
Minimum Ex-vessel value $812,698
Annual Harvest Summary Data: 1999-2001
Average Harvest 1,394,097
Maximum Harvest Level 1,650,068
Minimum Harvest Level 1,008,082
Annual Harvest Summary Data: 2002-2005
Average Harvest 1,313,709
Maximum Harvest Level 1,527,303
Minimum Harvest Level 919,525
Recent harvest levels (1999 - 2001) compared to historic (1999-2005) -2.56%
Correlation coefficient between harvest level and ex-vessel value (1999-2005) 0 .60
BASELINE VALUE: OHIO RIVER BASIN
5-Year Average Harvest Level (2001-2005) 1,380,981
5-Year Average Ex-Vessel Value (2001-2005) $2,046,066
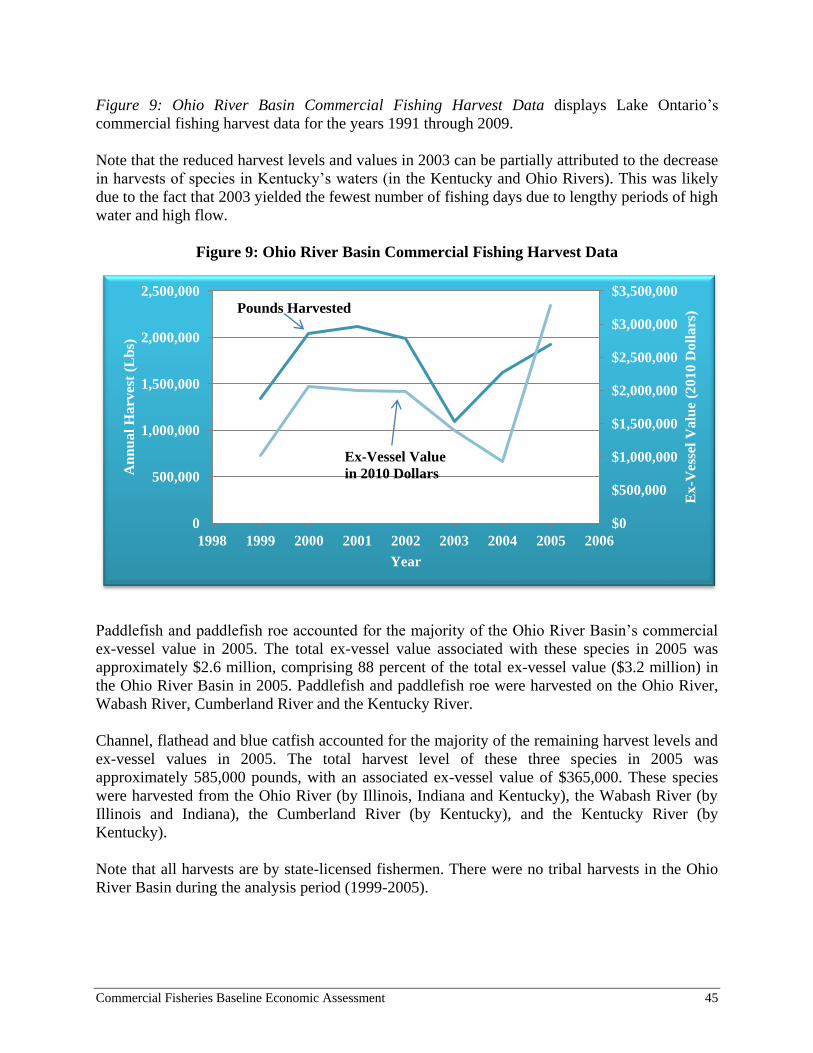
Commercial Fisheries Baseline Economic Assessment 45
Figure 9: Ohio River Basin Commercial Fishing Harvest Data displays Lake Ontario’s
commercial fishing harvest data for the years 1991 through 2009.
Note that the reduced harvest levels and values in 2003 can be partially attributed to the decrease
in harvests of species in Kentucky’s waters (in the Kentucky and Ohio Rivers). This was likely
due to the fact that 2003 yielded the fewest number of fishing days due to lengthy periods of high
water and high flow.
Figure 9: Ohio River Basin Commercial Fishing Harvest Data
Paddlefish and paddlefish roe accounted for the majority of the Ohio River Basin’s commercial
ex-vessel value in 2005. The total ex-vessel value associated with these species in 2005 was
approximately $2.6 million, comprising 88 percent of the total ex-vessel value ($3.2 million) in
the Ohio River Basin in 2005. Paddlefish and paddlefish roe were harvested on the Ohio River,
Wabash River, Cumberland River and the Kentucky River.
Channel, flathead and blue catfish accounted for the majority of the remaining harvest levels and
ex-vessel values in 2005. The total harvest level of these three species in 2005 was
approximately 585,000 pounds, with an associated ex-vessel value of $365,000. These species
were harvested from the Ohio River (by Illinois, Indiana and Kentucky), the Wabash River (by
Illinois and Indiana), the Cumberland River (by Kentucky), and the Kentucky River (by
Kentucky).
Note that all harvests are by state-licensed fishermen. There were no tribal harvests in the Ohio
River Basin during the analysis period (1999-2005).
$0
$500,000
$1,000,000
$1,500,000
$2,000,000
$2,500,000
$3,000,000
$3,500,000
0
500,000
1,000,000
1,500,000
2,000,000
2,500,000
1998 1999 2000 2001 2002 2003 2004 2005 2006
Ex
-Ves
sel
Valu
e (2
01
0 D
oll
ars
)
An
nu
al
Harv
est
(Lb
s)
Year
Ex-Vessel Value
in 2010 Dollars
Pounds Harvested
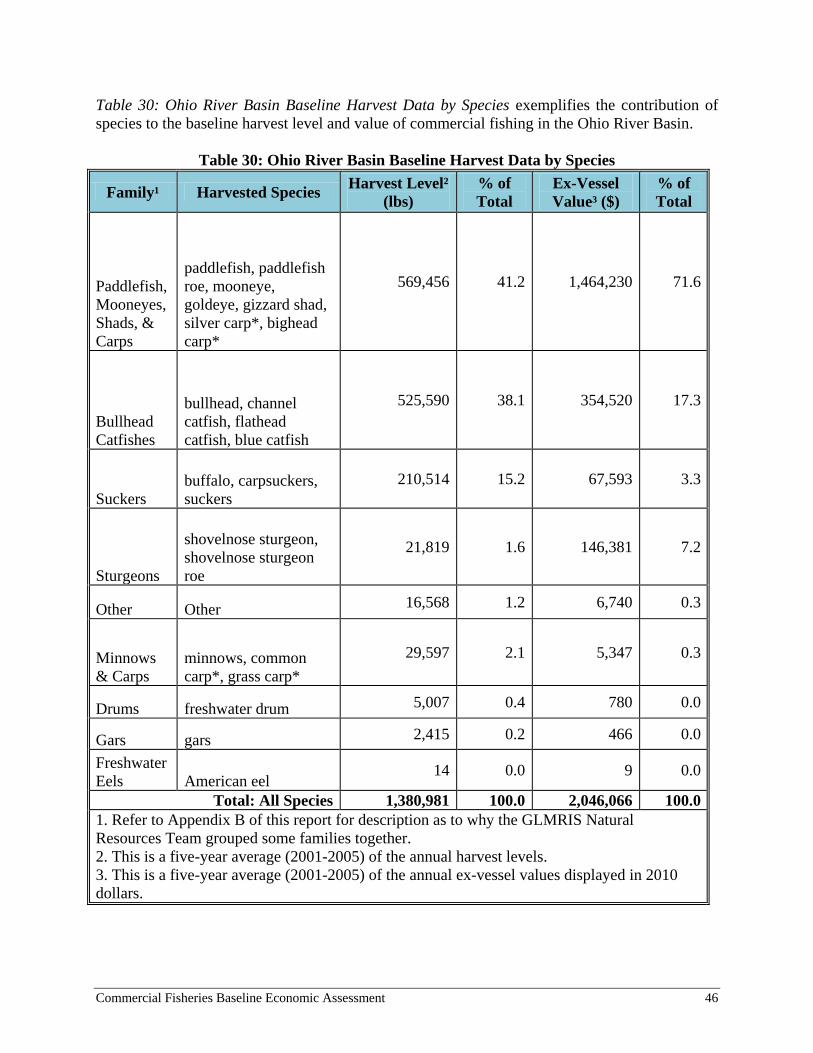
Commercial Fisheries Baseline Economic Assessment 46
Table 30: Ohio River Basin Baseline Harvest Data by Species exemplifies the contribution of
species to the baseline harvest level and value of commercial fishing in the Ohio River Basin.
Table 30: Ohio River Basin Baseline Harvest Data by Species
Family¹ Harvested Species Harvest Level²
(lbs)
% of
Total
Ex-Vessel
Value³ ($)
% of
Total
Paddlefish,
Mooneyes,
Shads, &
Carps
paddlefish, paddlefish
roe, mooneye,
goldeye, gizzard shad,
silver carp*, bighead
carp*
569,456 41.2 1,464,230 71.6
Bullhead
Catfishes
bullhead, channel
catfish, flathead
catfish, blue catfish
525,590 38.1 354,520 17.3
Suckers
buffalo, carpsuckers,
suckers
210,514 15.2 67,593 3.3
Sturgeons
shovelnose sturgeon,
shovelnose sturgeon
roe
21,819 1.6 146,381 7.2
Other Other 16,568 1.2 6,740 0.3
Minnows
& Carps
minnows, common
carp*, grass carp*
29,597 2.1 5,347 0.3
Drums freshwater drum 5,007 0.4 780 0.0
Gars gars 2,415 0.2 466 0.0
Freshwater
Eels American eel 14 0.0 9 0.0
Total: All Species 1,380,981 100.0 2,046,066 100.0
1. Refer to Appendix B of this report for description as to why the GLMRIS Natural
Resources Team grouped some families together.
2. This is a five-year average (2001-2005) of the annual harvest levels.
3. This is a five-year average (2001-2005) of the annual ex-vessel values displayed in 2010
dollars.
Commercial Fisheries Baseline Economic Assessment 47
CONCLUSION
The commercial fishing industry on the U.S. waters of the Great Lakes, Upper Mississippi River,
and Ohio River basins are an economic engine for the region. While many fishery harvests have
declined in the last twenty years, some have enjoyed increased harvests and values. Changes in
harvests and values are driven by multiple factors, some biological, some concerning tastes and
preferences of the consumer. This evaluation does not attempt to determine why the fisheries
experienced changes in the past. The purpose of this evaluation is to establish the current
conditions for the commercial fisheries in the region for use in GLMRIS. The current condition
will be utilized as a starting point to predict what might happen to the fisheries over the perid of
analysis with or without implementation of controls for aquatic nuisance species. From there, we
will establish what might happen to the fisheries with controls in place.
This evaluation summarizes the available commercial harvests and values for the U.S. waters of
each of the Great Lakes, the Upper Mississippi River and its tributaries, and the Ohio River and
its tributaries. The team worked closely with the reporting agencies and the Tribes to acquire the
most current data set. Since there are yearly fluctuations in catch and value, the team determined
that using the most recent five years of data would be an appropriate estimation of the current
conditions of commercial fisheries, and will serve as the baseline from which future forecasts
will be projected. Findings from this evaluation include:
The U.S. waters of the Great Lakes are harvesting an average of 19.3 million pounds of
fish product for resale. The ex-vessel value of this harvest is $22.5 million (in 2010
dollars).
The Upper Mississippi River basin harvest on average is about 10 million pounds of fish
product for resale with an associated ex-vessel value of $4.0 million (in 2010 dollars).
The Ohio River basin harvest on average is 1.4 million pounds with an associated ex-
vessel of $2.0 million (in 2010 dollars).
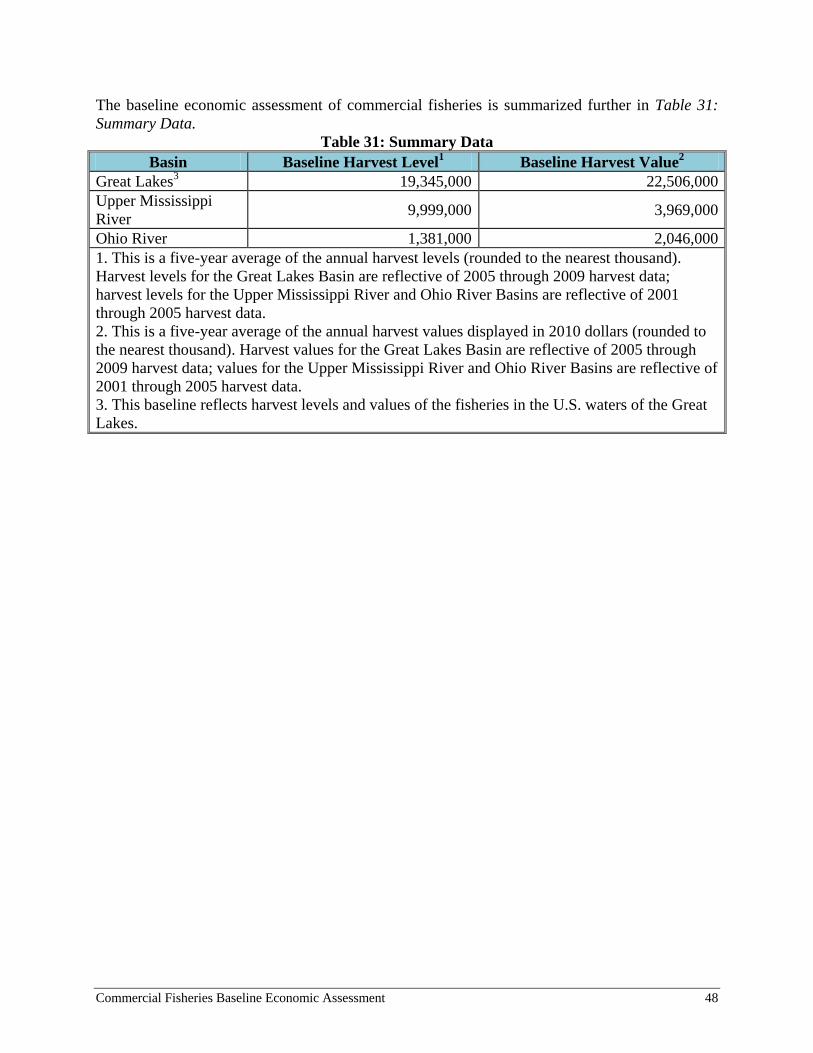
Commercial Fisheries Baseline Economic Assessment 48
The baseline economic assessment of commercial fisheries is summarized further in Table 31:
Summary Data.
Table 31: Summary Data
Basin Baseline Harvest Level1 Baseline Harvest Value
2
Great Lakes3 19,345,000 22,506,000
Upper Mississippi
River 9,999,000 3,969,000
Ohio River 1,381,000 2,046,000
1. This is a five-year average of the annual harvest levels (rounded to the nearest thousand).
Harvest levels for the Great Lakes Basin are reflective of 2005 through 2009 harvest data;
harvest levels for the Upper Mississippi River and Ohio River Basins are reflective of 2001
through 2005 harvest data.
2. This is a five-year average of the annual harvest values displayed in 2010 dollars (rounded to
the nearest thousand). Harvest values for the Great Lakes Basin are reflective of 2005 through
2009 harvest data; values for the Upper Mississippi River and Ohio River Basins are reflective of
2001 through 2005 harvest data.
3. This baseline reflects harvest levels and values of the fisheries in the U.S. waters of the Great
Lakes.
Commercial Fisheries Baseline Economic Assessment 49
REFERENCES
Bureau of Labor Statistics. United States Department of Labor. Web. 27 February 2012.
Chippewa Ottawa Resource Authority; Preserving the Resource for Future Generations.
Chippewa Ottawa Resource Authority. Web. 17 April 2012.
Environmental Science Division; Argonne National Laboratory. Treaty Rights and Subsistence
Fishing in the U.S. Waters of the Great Lakes, Upper Mississippi River, and Ohio River Basin -
Draft. 2012. Print.
Great Lakes Indian Fish and Wildlife Commission (GLIFWC). Great Lakes Indian Fish and
Wildlife Commission (GLIFWC). Web. 17 April 2012.
U.S. Department of Commerce; National Oceanic and Atmospheric Association; National
Marine Fisheries Service. Magnuson-Stevens Fishery Conservation and Management Act; As
Amended Through January 12, 2007. 2007. Web.
United States Army Corps of Engineers. Planning; Planning Guidance Notebook. Washington:
2000. Web.
United States Army Corps of Engineers; Water Resources Support Center; Institute for Water
Resources. Planning Manual. 1996. Print.
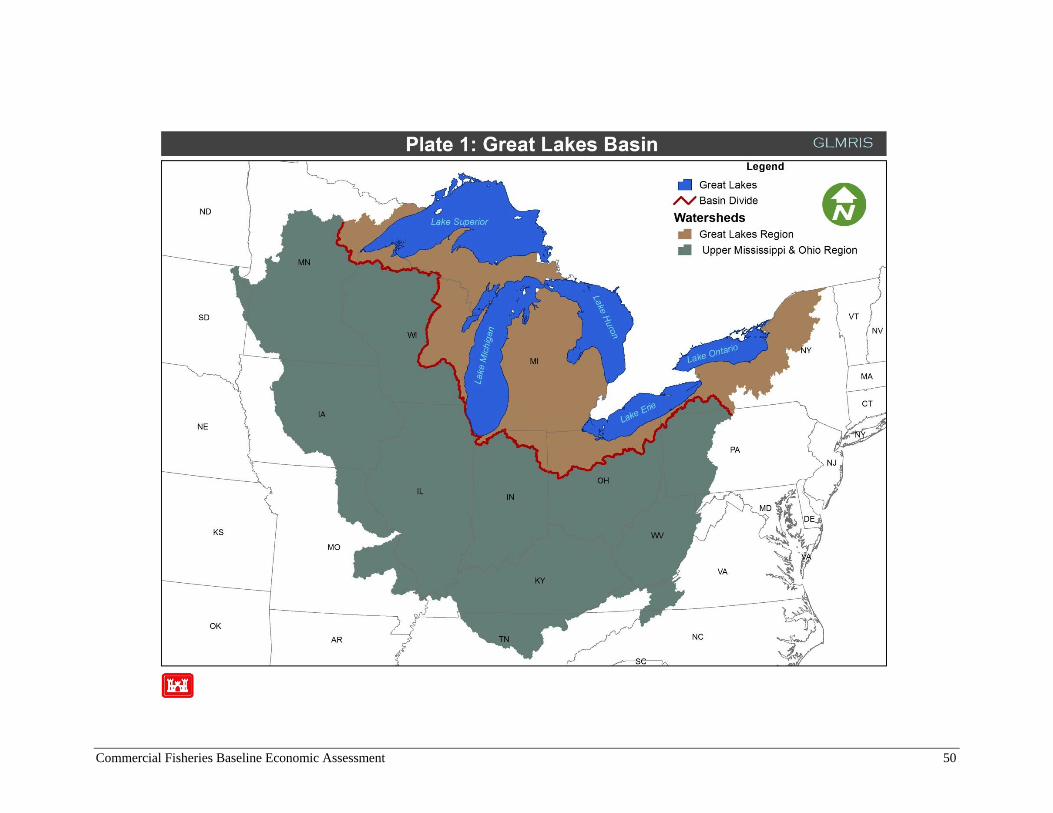
Commercial Fisheries Baseline Economic Assessment 50
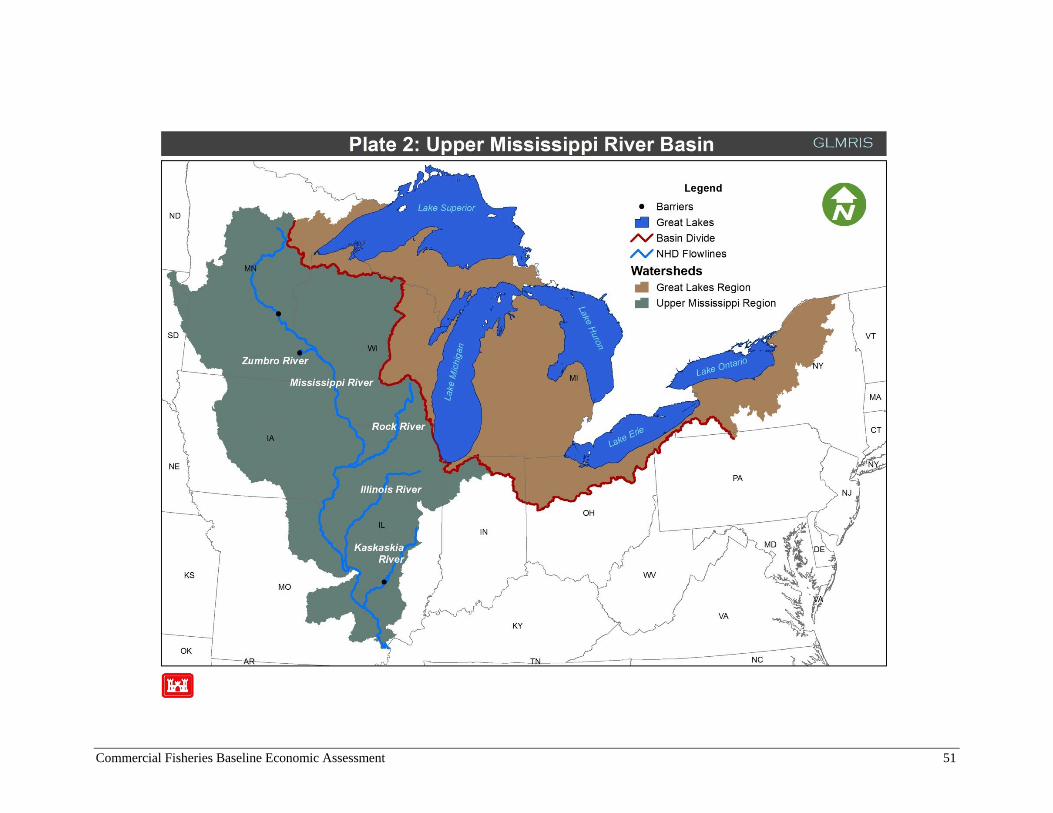
Commercial Fisheries Baseline Economic Assessment 51
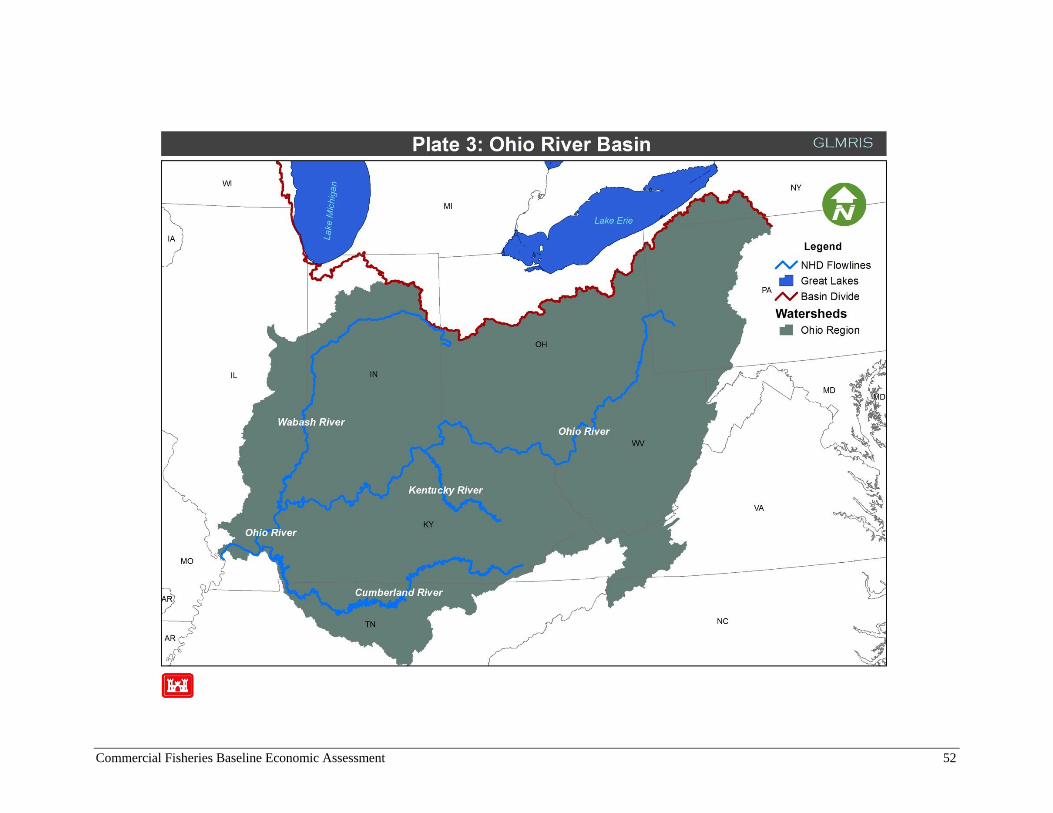
Commercial Fisheries Baseline Economic Assessment 52
Appendix A: Commercial Fisheries Baseline
Economic Assessment Methodology
TABLE OF CONTENTS
Introduction ..................................................................................................................................... 1
Focus Areas ..................................................................................................................................... 1
Great Lakes Basin ........................................................................................................................ 2
Upper Mississippi & Ohio River Basins ..................................................................................... 2
Data Collection ............................................................................................................................... 3
Agency Assistance For The Great Lakes Basin .......................................................................... 3
Data Contribution for the Great Lakes Basin .............................................................................. 9
Agency Assistance For The UMR and Ohio River Basins: ...................................................... 10
Data Contributions for the UMR & Ohio River Basin .............................................................. 11
Data Analysis ................................................................................................................................ 13
Data Organization ...................................................................................................................... 13
Converting Nominal Dollars to Real Dollars ............................................................................ 14
Missing Harvest Levels: ......................................................................................................... 16
Missing Ex-vessel Values: ..................................................................................................... 16
Categorizing Species in Each Water Body: .................................................................................. 24
Aggregating Harvest Data............................................................................................................. 27
Baseline Values ............................................................................................................................. 31
Lake or River Baseline Values .................................................................................................. 31
Basin Baseline Values ............................................................................................................... 31
Table of Figures:
Table 1: Data Limitations ............................................................................................................... 4
Table 2: Lake Superior Agency Assistance .................................................................................... 8
Table 3: Lake Michigan Agency Assistance .................................................................................. 8
Table 4: Lake Huron Agency Assistance ........................................................................................ 8
Table 5: Lake Erie Agency Assistance ........................................................................................... 8
Table 6: Lake Ontario Agency Assistance ...................................................................................... 8
Table 7: Lake St. Clair Agency Assistance .................................................................................... 9
Table 8: Great Lakes Commercial Fishing Activity ....................................................................... 9
Table 9: Data Provided For The Great Lakes ................................................................................. 9
Table 10: UMR Agency Assistance .............................................................................................. 10
Table 11: UMR Tributary Agency Assistance .............................................................................. 10
Table 12: Ohio River Agency Assistance ..................................................................................... 10
Table 13: Ohio River Tributary Agency Assistance ..................................................................... 11
Table 14: States with Commercial Fishing in the UMR Basin ..................................................... 11
Table 15: Data Provided for the UMR Basin ................................................................................ 11
Table 16: States With Commercial Fishing in the Ohio River Basin ........................................... 12
Table 17: Data Provided for the Ohio River Basin ....................................................................... 12
Table 18: Example of Derivation of Current Ex-Vessel Value .................................................... 15
Table 19: Lake Whitefish Ex-Vessel Value Derivation ............................................................... 16
Table 20: Choosing a Method To Generate Ex-vessel Value Proxies .......................................... 17
Table 21: Missing Ex-vessel Value: Case 1 ................................................................................. 17
Table 22: Evaluation Method for Missing Ex-Vessel Value- Case 1 ........................................... 18
Table 23: Missing Ex-Vessel Values- Case 3 ............................................................................... 19
Commercial Fisheries Baseline Economic Assessment Methodology ii
Table 24: Evaluation Method For Missing Ex-Vessel Value- Case 3 .......................................... 19
Table 25: Missing Ex-Vessel Value: Case 2................................................................................. 20
Table 26: Evaluation Method For Missing Ex-Vessel Value- Case 2 .......................................... 20
Table 27: Evaluation Method For Missing Ex-Vessel Value- Case 4 .......................................... 21
Table 28: Ex-vessel Value Approximattions- GL Basin .............................................................. 21
Table 29: Ex-vessel Value approximations- UMR Basin ............................................................. 22
Table 30: Ex-vessel Value approximation: Ohio River Basin ...................................................... 23
Table 31: Harvestable Species in the Great Lakes Basin ............................................................. 25
Table 32: Harvestable Fish Species in the UMR and Ohio River Basins ..................................... 26
Table 33: Lake Erie Harvest Data by Fishery Family .................................................................. 27
Table 34: Michigan's Harvest of Bigmouth Buffalo on Lake Erie ............................................... 28
Table 35: Ohio’s harvest of Bigmouth Buffalo on Lake Erie ....................................................... 28
Table 36: Lake Erie Combined Harvest ........................................................................................ 29
Table 37: Great Lakes Basin Combined Harvest .......................................................................... 32
Figure 1: GLMRIS Study Area Map .............................................................................................. 1
Figure 2: GLIFWC Member Tribes ................................................................................................ 7
Figure 3: Initial Organization of Commercial Harvest Data ........................................................ 13
Figure 4: Data Collection Concept ............................................................................................... 14
Figure 5: Example of Aggregation of Species .............................................................................. 29
Figure 6: Final Aggregation of all species for Lake Erie .............................................................. 30
Figure 7: Aggregation of data for the Great Lakes Basin ............................................................. 32
Equation 1: Ex-Vessel Value ........................................................................................................ 14
Equation 2: Ex-Vessel Value ........................................................................................................ 15
Equation 3: Baseline Harvest Level .............................................................................................. 31
Equation 4: Baseline Ex-Vessel Value ......................................................................................... 31
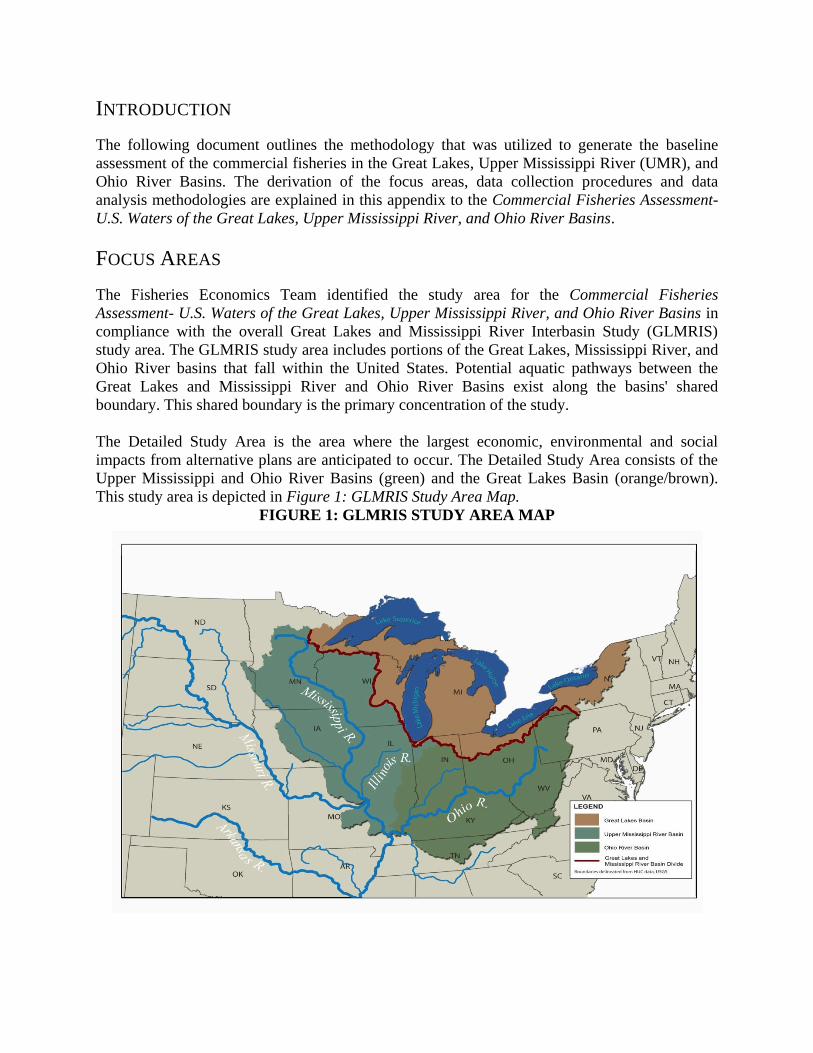
INTRODUCTION
The following document outlines the methodology that was utilized to generate the baseline
assessment of the commercial fisheries in the Great Lakes, Upper Mississippi River (UMR), and
Ohio River Basins. The derivation of the focus areas, data collection procedures and data
analysis methodologies are explained in this appendix to the Commercial Fisheries Assessment-
U.S. Waters of the Great Lakes, Upper Mississippi River, and Ohio River Basins.
FOCUS AREAS
The Fisheries Economics Team identified the study area for the Commercial Fisheries
Assessment- U.S. Waters of the Great Lakes, Upper Mississippi River, and Ohio River Basins in
compliance with the overall Great Lakes and Mississippi River Interbasin Study (GLMRIS)
study area. The GLMRIS study area includes portions of the Great Lakes, Mississippi River, and
Ohio River basins that fall within the United States. Potential aquatic pathways between the
Great Lakes and Mississippi River and Ohio River Basins exist along the basins' shared
boundary. This shared boundary is the primary concentration of the study.
The Detailed Study Area is the area where the largest economic, environmental and social
impacts from alternative plans are anticipated to occur. The Detailed Study Area consists of the
Upper Mississippi and Ohio River Basins (green) and the Great Lakes Basin (orange/brown).
This study area is depicted in Figure 1: GLMRIS Study Area Map.
FIGURE 1: GLMRIS STUDY AREA MAP
Commercial Fisheries Baseline Economic Assessment Methodology 2
GREAT LAKES BASIN
The Fisheries Economics Team examined the fisheries within the Great Lakes Basin in the
following water bodies: Lake Michigan, Lake Superior, Lake Huron, Lake Erie and Lake
Ontario1. Great Lakes tributaries were also considered for the analysis. Disjunct water bodies
within the Great Lakes Basin were not assessed due to the fact that Aquatic Nuisance Species
(ANS) cannot transfer via aquatic pathways to separate water bodies.
The Fisheries Economics Team contacted agencies (such as Departments of Natural Resources)
in order to determine whether the Great Lakes tributaries that fell within their state boundaries
supported commercial fishing activity during the analysis period (years 1989 through 2009). If
this criterion was met, then the tributary was included in this economic assessment.
The final Great Lakes Basin study area includes the following water bodies: Lake Michigan,
Lake Erie (and its tributaries that lie between Lorain, Ohio and Toledo, Ohio), Lake Superior,
Lake Huron, and Lake Ontario2.
UPPER MISSISSIPPI & OHIO RIVER BASINS
The Fisheries Economics Team examined the fisheries within the Upper Mississippi River Basin
and the Ohio River Basin. In order to determine which streams to include in the baseline
economic assessment, tribal commissions and state agencies (such as Departments of Natural
Resources) were contacted in order to identify which streams supported commercial fishing
activity at some point during the analysis period (years 1989 through 2009)3.
In order to limit the fisheries analysis to the portions of these rivers that are at risk of being
invaded by ANS via aquatic pathways, the GLMRIS Geographic Information System (GIS)
Team located dams along the rivers. Working outward from Cairo, Illinois towards the rivers in
the Upper Mississippi River Basin and Ohio River Basin, if an impassible dam was located, then
the remaining portion of the river was excluded from the analysis.
For instance, since there were neither physical or technological barriers along the Illinois and
Ohio Rivers that would prevent an ANS from transferring from the Great Lakes Basin into these
rivers, the entire Illinois River and Ohio River were included in this analysis. However, the Coon
Rapids Dam was located along the Upper Mississippi River in southern Minnesota and was
determined to be a barrier to ANS transfer. Therefore, it is between Cairo, Illinois and the
1 Note that the Commercial Fisheries Assessment- U.S. Waters of the Great Lakes, Upper
Mississippi River, and Ohio River Basins will focus only on the commercial fisheries in U.S.
waters. Canadian portions of the Great Lakes and their tributaries will not be included in the analysis
due to the fact that they are outside the scope of the GLMRIS study. 2 According to the Michigan Department of Natural Resources, no commercial fishing activity takes
place on Lake St. Clair so it has been omitted from this analysis. 3 Disjunct water bodies within the UMR and Ohio River Basins were not assessed due to the fact
that Aquatic Nuisance Species (ANS) have limited ability to transfer via aquatic pathways to
separate water bodies.
Commercial Fisheries Baseline Economic Assessment Methodology 3
aforementioned dam in Coon Rapids, Minnesota that will be the focus of the UMR. This dam
identification process was applied to all rivers in both basins.
The final Upper Mississippi River Basin study area includes the following rivers: the Upper
Mississippi River, Illinois River, Kaskaskia River, Rock River, and Zumbro River. The final
Ohio River Basin study area includes the: Ohio River, Wabash River, Cumberland River,
Kentucky River, and Salt River.
DATA COLLECTION The following discussion focuses on the data collection procedures that were employed in order
to obtain harvest level and ex-vessel price4 data for the fisheries in the Great Lakes, Upper
Mississippi River, and Ohio River Basins.
AGENCY ASSISTANCE FOR THE GREAT LAKES BASIN
The Commercial Fisheries Assessment - U.S. Waters of the Great Lakes, Upper Mississippi
River, and Ohio River Basins seeks to identify the current value of the fisheries in the Great
Lakes, Upper Mississippi River, and Ohio River Basins.
In order to accomplish this task, the Fisheries Economics Team collaborated with fisheries
specialists at state and inter-tribal agencies such as Departments of Natural Resources and the
Great Lakes Indian Fish and Wildlife Commission, to obtain data regarding states’ commercial
fishing harvests and their associated ex-vessel values.
These agencies each collect commercial fishing harvest data from commercial fishermen on a
monthly basis5 for fisheries management purposes
6. Note that all harvest levels and associated
ex-vessel prices utilized to generate the Commercial Fisheries Assessment - U.S. Waters of the
Great Lakes, Upper Mississippi River, and Ohio River Basins reflect those that are reported by
the fishermen to state or inter-tribal agencies7. Irregularities or outliers in the data sets were
4 Ex-vessel prices indicate the price per pound which the commercial fishermen received for their
harvests. 5 Note that some states collect commercial fishing harvest data (harvest level and ex-vessel price
data) on a daily basis (such as Ohio’s trap net fishermen harvesting from Lake Erie) while the
Michigan Department of Natural Resources requires that state-licensed commercial fishermen
report their harvests on an annual basis. However, the remaining state agencies require reporting
on a monthly basis. 6 Tribal commercial fishermen report their harvests to the tribes, which then report them to the
inter-tribal agencies, who then provide the data to the state’s Department of Natural Resources
for fisheries management purposes. 7 The use of this data has certain implications, the first being that the data that was utilized for
the formation of the Commercial Fisheries Assessment - U.S. Waters of the Great Lakes, Upper
Mississippi River, and Ohio River Basins is secondary data. Therefore, USACE did not have the
ability to ensure that all data was reported in a consistent manner. It is assumed that there may be
some misrepresentation of actual harvests, as well as some errors regarding data entry. USACE
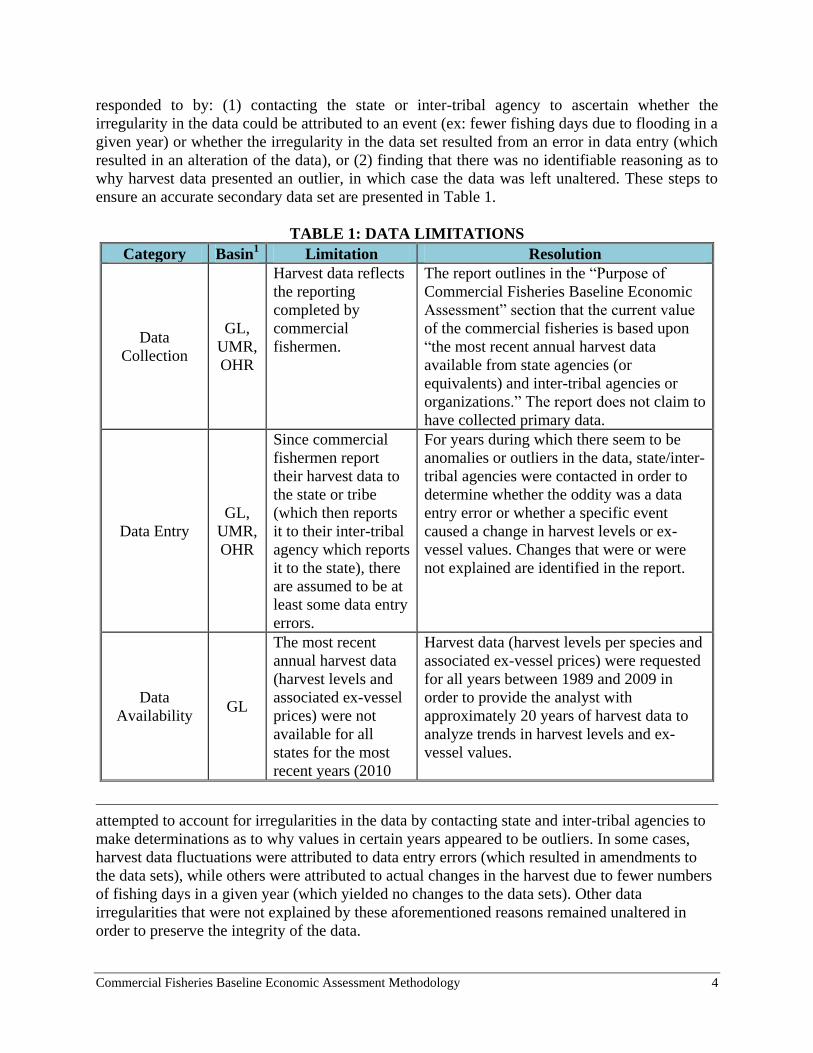
Commercial Fisheries Baseline Economic Assessment Methodology 4
responded to by: (1) contacting the state or inter-tribal agency to ascertain whether the
irregularity in the data could be attributed to an event (ex: fewer fishing days due to flooding in a
given year) or whether the irregularity in the data set resulted from an error in data entry (which
resulted in an alteration of the data), or (2) finding that there was no identifiable reasoning as to
why harvest data presented an outlier, in which case the data was left unaltered. These steps to
ensure an accurate secondary data set are presented in Table 1.
TABLE 1: DATA LIMITATIONS
Category Basin1 Limitation Resolution
Data
Collection
GL,
UMR,
OHR
Harvest data reflects
the reporting
completed by
commercial
fishermen.
The report outlines in the “Purpose of
Commercial Fisheries Baseline Economic
Assessment” section that the current value
of the commercial fisheries is based upon
“the most recent annual harvest data
available from state agencies (or
equivalents) and inter-tribal agencies or
organizations.” The report does not claim to
have collected primary data.
Data Entry
GL,
UMR,
OHR
Since commercial
fishermen report
their harvest data to
the state or tribe
(which then reports
it to their inter-tribal
agency which reports
it to the state), there
are assumed to be at
least some data entry
errors.
For years during which there seem to be
anomalies or outliers in the data, state/inter-
tribal agencies were contacted in order to
determine whether the oddity was a data
entry error or whether a specific event
caused a change in harvest levels or ex-
vessel values. Changes that were or were
not explained are identified in the report.
Data
Availability GL
The most recent
annual harvest data
(harvest levels and
associated ex-vessel
prices) were not
available for all
states for the most
recent years (2010
Harvest data (harvest levels per species and
associated ex-vessel prices) were requested
for all years between 1989 and 2009 in
order to provide the analyst with
approximately 20 years of harvest data to
analyze trends in harvest levels and ex-
vessel values.
attempted to account for irregularities in the data by contacting state and inter-tribal agencies to
make determinations as to why values in certain years appeared to be outliers. In some cases,
harvest data fluctuations were attributed to data entry errors (which resulted in amendments to
the data sets), while others were attributed to actual changes in the harvest due to fewer numbers
of fishing days in a given year (which yielded no changes to the data sets). Other data
irregularities that were not explained by these aforementioned reasons remained unaltered in
order to preserve the integrity of the data.
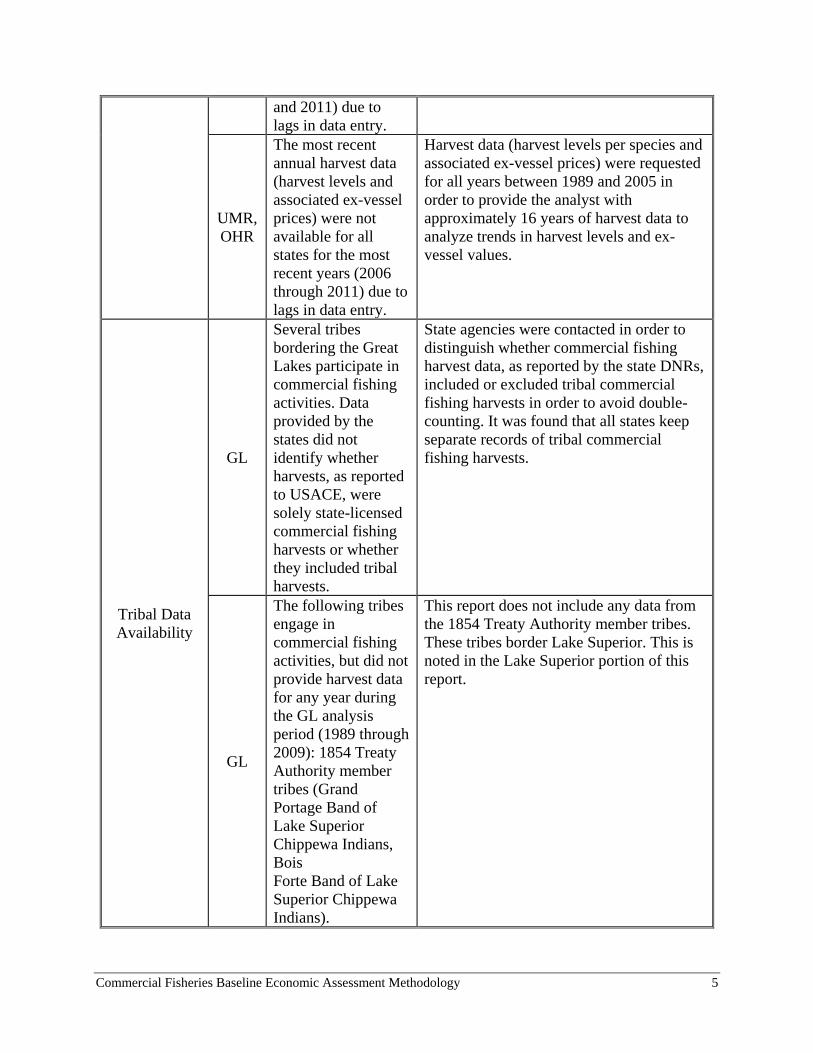
Commercial Fisheries Baseline Economic Assessment Methodology 5
and 2011) due to
lags in data entry.
UMR,
OHR
The most recent
annual harvest data
(harvest levels and
associated ex-vessel
prices) were not
available for all
states for the most
recent years (2006
through 2011) due to
lags in data entry.
Harvest data (harvest levels per species and
associated ex-vessel prices) were requested
for all years between 1989 and 2005 in
order to provide the analyst with
approximately 16 years of harvest data to
analyze trends in harvest levels and ex-
vessel values.
Tribal Data
Availability
GL
Several tribes
bordering the Great
Lakes participate in
commercial fishing
activities. Data
provided by the
states did not
identify whether
harvests, as reported
to USACE, were
solely state-licensed
commercial fishing
harvests or whether
they included tribal
harvests.
State agencies were contacted in order to
distinguish whether commercial fishing
harvest data, as reported by the state DNRs,
included or excluded tribal commercial
fishing harvests in order to avoid double-
counting. It was found that all states keep
separate records of tribal commercial
fishing harvests.
GL
The following tribes
engage in
commercial fishing
activities, but did not
provide harvest data
for any year during
the GL analysis
period (1989 through
2009): 1854 Treaty
Authority member
tribes (Grand
Portage Band of
Lake Superior
Chippewa Indians,
Bois
Forte Band of Lake
Superior Chippewa
Indians).
This report does not include any data from
the 1854 Treaty Authority member tribes.
These tribes border Lake Superior. This is
noted in the Lake Superior portion of this
report.
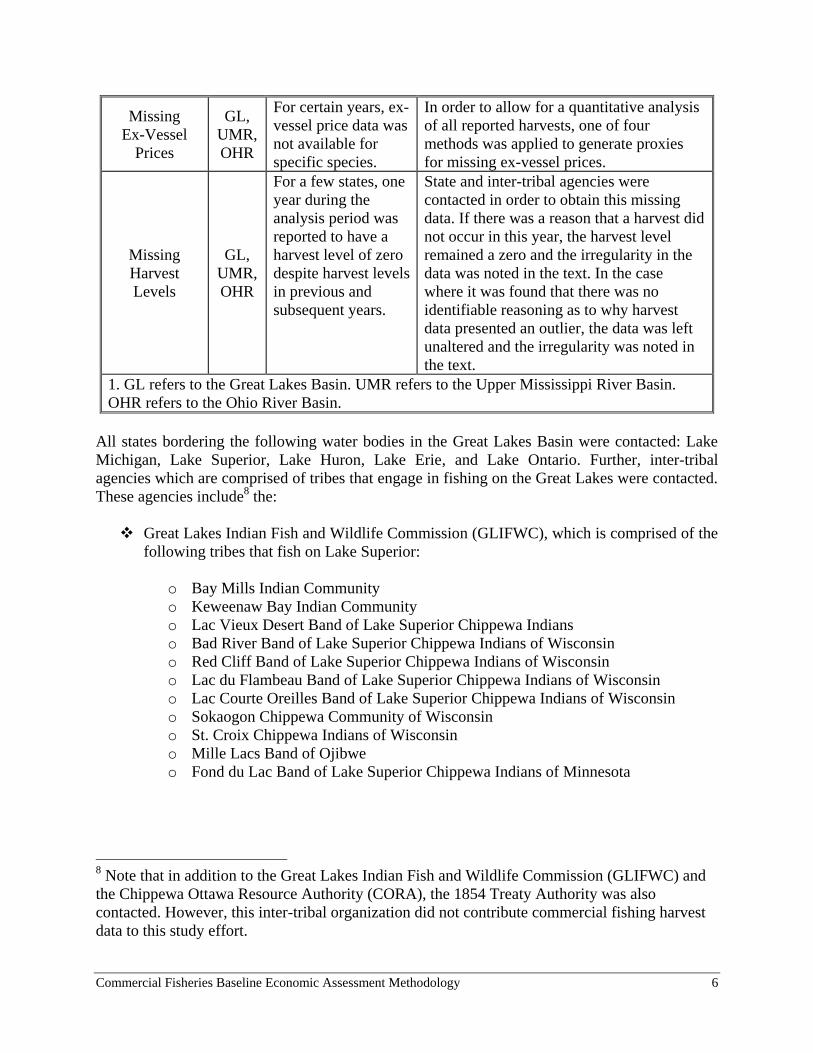
Commercial Fisheries Baseline Economic Assessment Methodology 6
Missing
Ex-Vessel
Prices
GL,
UMR,
OHR
For certain years, ex-
vessel price data was
not available for
specific species.
In order to allow for a quantitative analysis
of all reported harvests, one of four
methods was applied to generate proxies
for missing ex-vessel prices.
Missing
Harvest
Levels
GL,
UMR,
OHR
For a few states, one
year during the
analysis period was
reported to have a
harvest level of zero
despite harvest levels
in previous and
subsequent years.
State and inter-tribal agencies were
contacted in order to obtain this missing
data. If there was a reason that a harvest did
not occur in this year, the harvest level
remained a zero and the irregularity in the
data was noted in the text. In the case
where it was found that there was no
identifiable reasoning as to why harvest
data presented an outlier, the data was left
unaltered and the irregularity was noted in
the text.
1. GL refers to the Great Lakes Basin. UMR refers to the Upper Mississippi River Basin.
OHR refers to the Ohio River Basin.
All states bordering the following water bodies in the Great Lakes Basin were contacted: Lake
Michigan, Lake Superior, Lake Huron, Lake Erie, and Lake Ontario. Further, inter-tribal
agencies which are comprised of tribes that engage in fishing on the Great Lakes were contacted.
These agencies include8 the:
Great Lakes Indian Fish and Wildlife Commission (GLIFWC), which is comprised of the
following tribes that fish on Lake Superior:
o Bay Mills Indian Community
o Keweenaw Bay Indian Community
o Lac Vieux Desert Band of Lake Superior Chippewa Indians
o Bad River Band of Lake Superior Chippewa Indians of Wisconsin
o Red Cliff Band of Lake Superior Chippewa Indians of Wisconsin
o Lac du Flambeau Band of Lake Superior Chippewa Indians of Wisconsin
o Lac Courte Oreilles Band of Lake Superior Chippewa Indians of Wisconsin
o Sokaogon Chippewa Community of Wisconsin
o St. Croix Chippewa Indians of Wisconsin
o Mille Lacs Band of Ojibwe
o Fond du Lac Band of Lake Superior Chippewa Indians of Minnesota
8 Note that in addition to the Great Lakes Indian Fish and Wildlife Commission (GLIFWC) and
the Chippewa Ottawa Resource Authority (CORA), the 1854 Treaty Authority was also
contacted. However, this inter-tribal organization did not contribute commercial fishing harvest
data to this study effort.
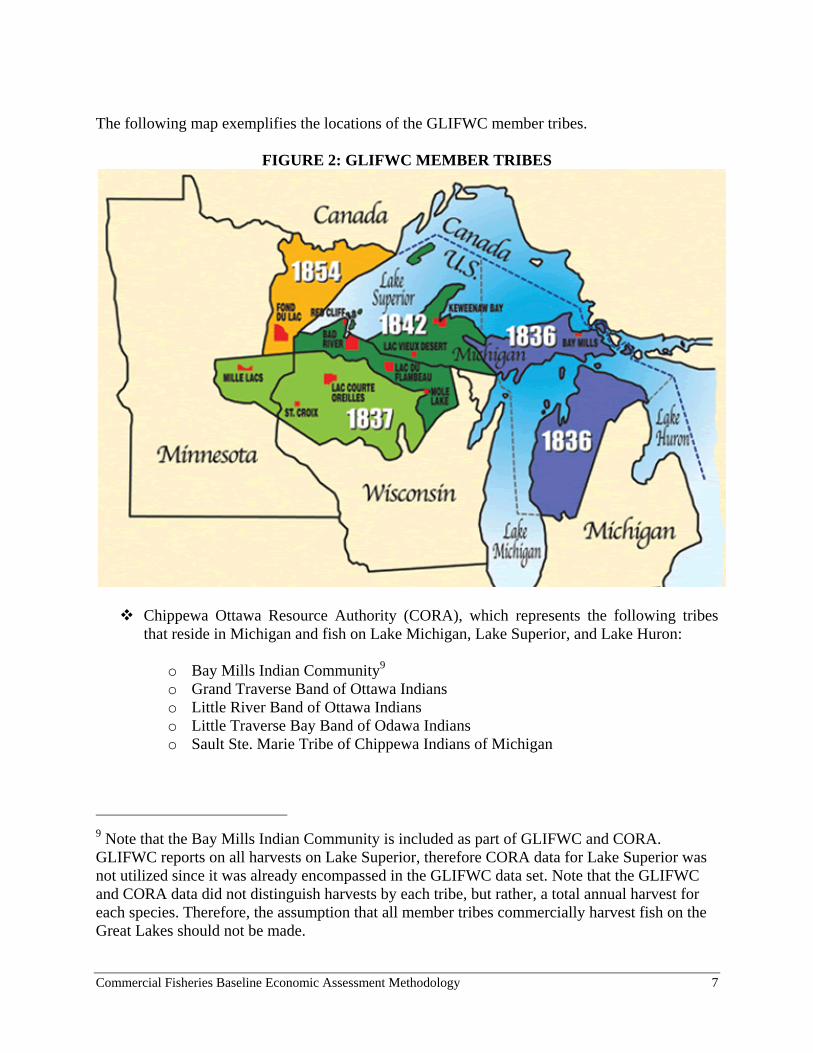
Commercial Fisheries Baseline Economic Assessment Methodology 7
The following map exemplifies the locations of the GLIFWC member tribes.
FIGURE 2: GLIFWC MEMBER TRIBES
Chippewa Ottawa Resource Authority (CORA), which represents the following tribes
that reside in Michigan and fish on Lake Michigan, Lake Superior, and Lake Huron:
o Bay Mills Indian Community9
o Grand Traverse Band of Ottawa Indians
o Little River Band of Ottawa Indians
o Little Traverse Bay Band of Odawa Indians
o Sault Ste. Marie Tribe of Chippewa Indians of Michigan
9 Note that the Bay Mills Indian Community is included as part of GLIFWC and CORA.
GLIFWC reports on all harvests on Lake Superior, therefore CORA data for Lake Superior was
not utilized since it was already encompassed in the GLIFWC data set. Note that the GLIFWC
and CORA data did not distinguish harvests by each tribe, but rather, a total annual harvest for
each species. Therefore, the assumption that all member tribes commercially harvest fish on the
Great Lakes should not be made.
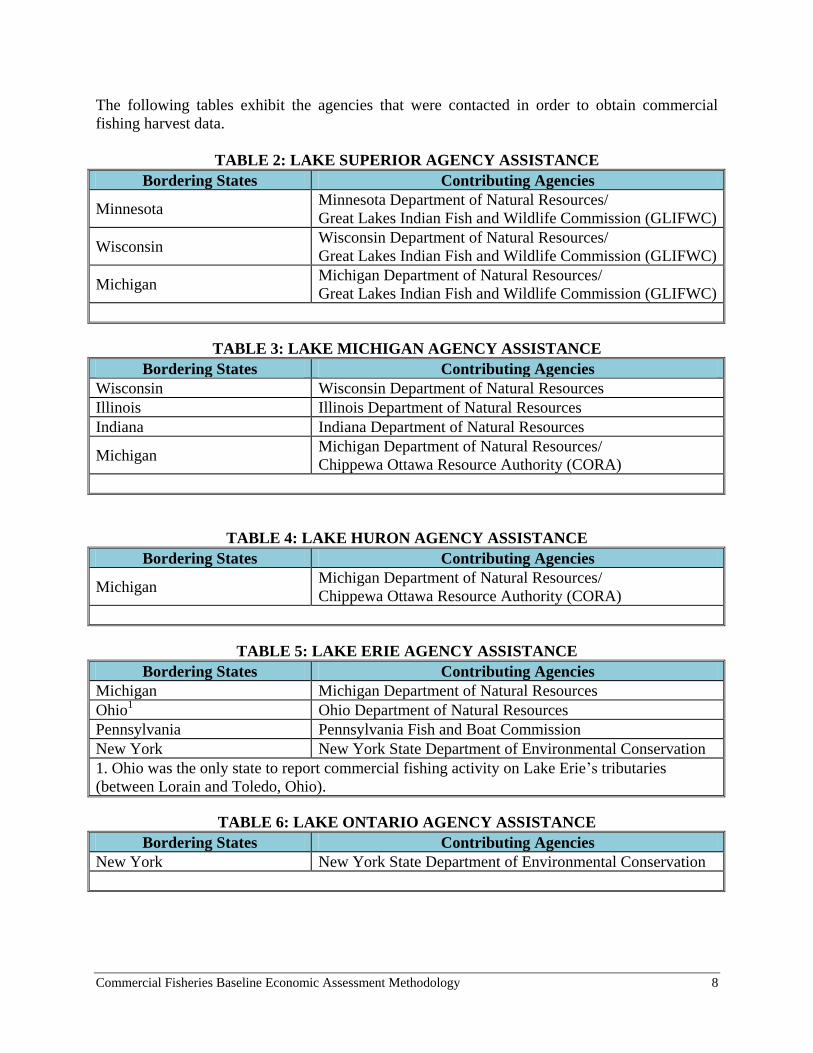
Commercial Fisheries Baseline Economic Assessment Methodology 8
The following tables exhibit the agencies that were contacted in order to obtain commercial
fishing harvest data.
TABLE 2: LAKE SUPERIOR AGENCY ASSISTANCE
Bordering States Contributing Agencies
Minnesota Minnesota Department of Natural Resources/
Great Lakes Indian Fish and Wildlife Commission (GLIFWC)
Wisconsin Wisconsin Department of Natural Resources/
Great Lakes Indian Fish and Wildlife Commission (GLIFWC)
Michigan Michigan Department of Natural Resources/
Great Lakes Indian Fish and Wildlife Commission (GLIFWC)
TABLE 3: LAKE MICHIGAN AGENCY ASSISTANCE
Bordering States Contributing Agencies
Wisconsin Wisconsin Department of Natural Resources
Illinois Illinois Department of Natural Resources
Indiana Indiana Department of Natural Resources
Michigan Michigan Department of Natural Resources/
Chippewa Ottawa Resource Authority (CORA)
TABLE 4: LAKE HURON AGENCY ASSISTANCE
Bordering States Contributing Agencies
Michigan Michigan Department of Natural Resources/
Chippewa Ottawa Resource Authority (CORA)
TABLE 5: LAKE ERIE AGENCY ASSISTANCE
Bordering States Contributing Agencies
Michigan Michigan Department of Natural Resources
Ohio1 Ohio Department of Natural Resources
Pennsylvania Pennsylvania Fish and Boat Commission
New York New York State Department of Environmental Conservation
1. Ohio was the only state to report commercial fishing activity on Lake Erie’s tributaries
(between Lorain and Toledo, Ohio).
TABLE 6: LAKE ONTARIO AGENCY ASSISTANCE
Bordering States Contributing Agencies
New York New York State Department of Environmental Conservation
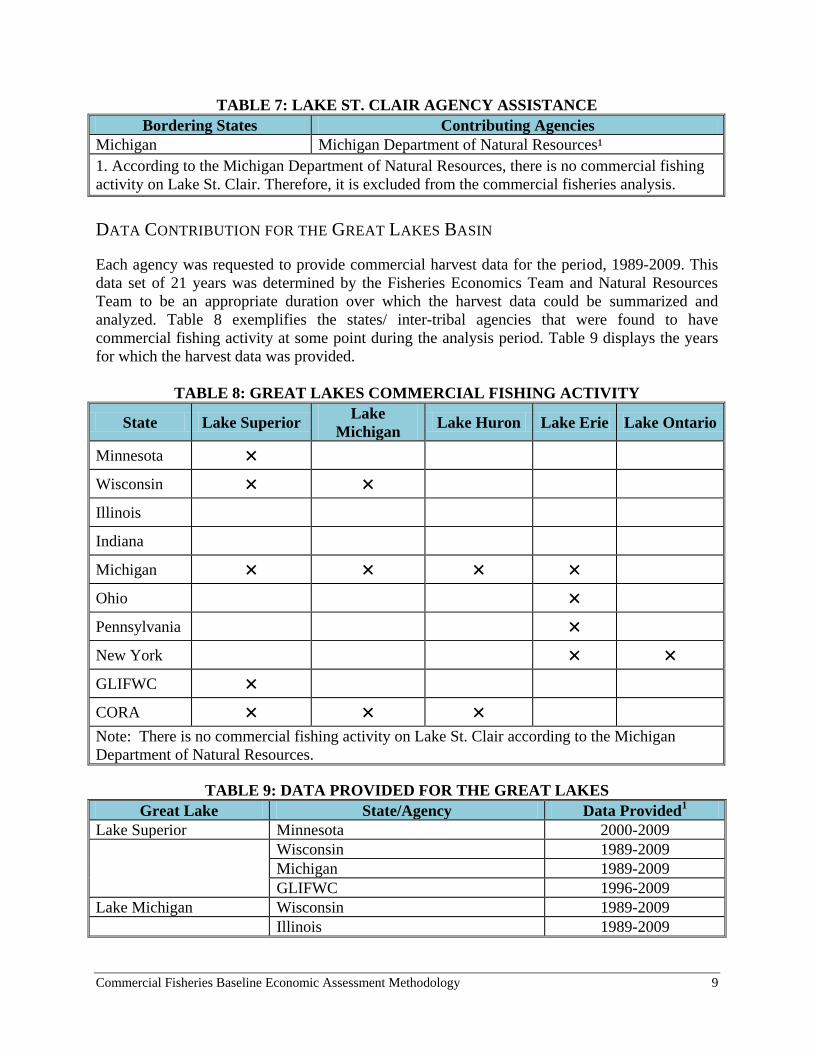
Commercial Fisheries Baseline Economic Assessment Methodology 9
TABLE 7: LAKE ST. CLAIR AGENCY ASSISTANCE
Bordering States Contributing Agencies
Michigan Michigan Department of Natural Resources¹
1. According to the Michigan Department of Natural Resources, there is no commercial fishing
activity on Lake St. Clair. Therefore, it is excluded from the commercial fisheries analysis.
DATA CONTRIBUTION FOR THE GREAT LAKES BASIN
Each agency was requested to provide commercial harvest data for the period, 1989-2009. This
data set of 21 years was determined by the Fisheries Economics Team and Natural Resources
Team to be an appropriate duration over which the harvest data could be summarized and
analyzed. Table 8 exemplifies the states/ inter-tribal agencies that were found to have
commercial fishing activity at some point during the analysis period. Table 9 displays the years
for which the harvest data was provided.
TABLE 8: GREAT LAKES COMMERCIAL FISHING ACTIVITY
State Lake Superior Lake
Michigan Lake Huron Lake Erie Lake Ontario
Minnesota × Wisconsin × × Illinois Indiana Michigan × × × × Ohio × Pennsylvania × New York × × GLIFWC × CORA × × × Note: There is no commercial fishing activity on Lake St. Clair according to the Michigan
Department of Natural Resources.
TABLE 9: DATA PROVIDED FOR THE GREAT LAKES
Great Lake State/Agency Data Provided1
Lake Superior Minnesota 2000-2009
Wisconsin 1989-2009
Michigan 1989-2009
GLIFWC 1996-2009
Lake Michigan Wisconsin 1989-2009
Illinois 1989-2009
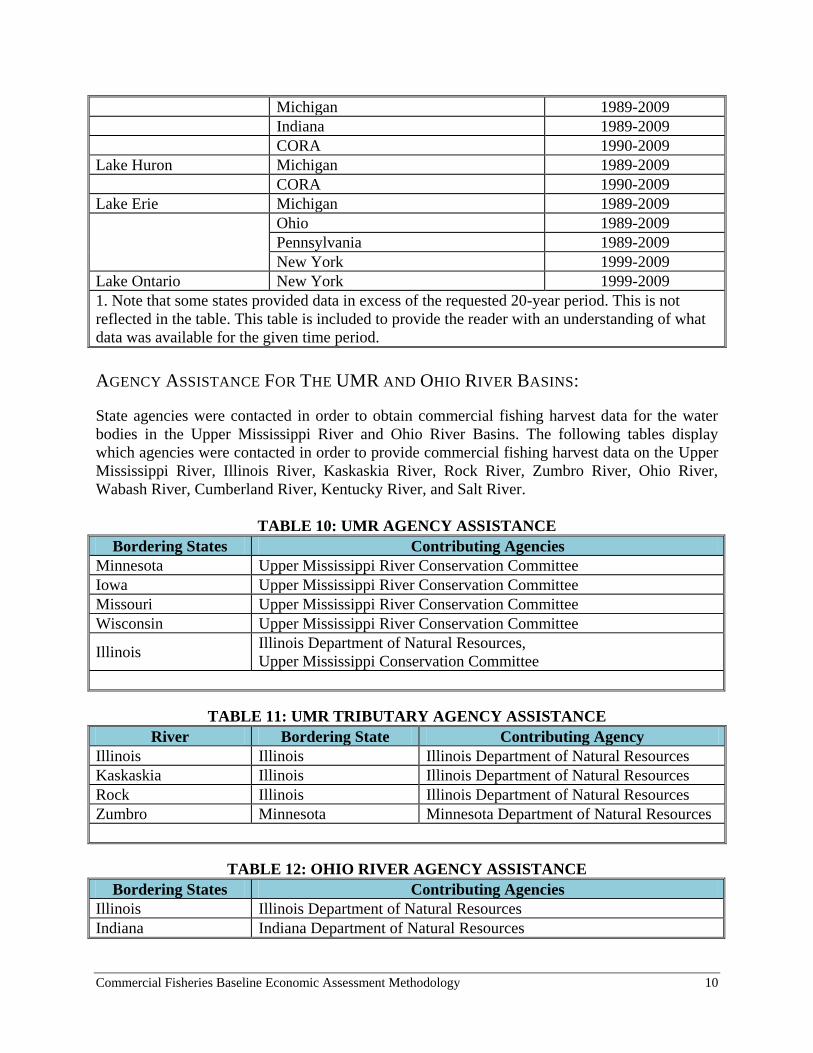
Commercial Fisheries Baseline Economic Assessment Methodology 10
Michigan 1989-2009
Indiana 1989-2009
CORA 1990-2009
Lake Huron Michigan 1989-2009
CORA 1990-2009
Lake Erie Michigan 1989-2009
Ohio 1989-2009
Pennsylvania 1989-2009
New York 1999-2009
Lake Ontario New York 1999-2009
1. Note that some states provided data in excess of the requested 20-year period. This is not
reflected in the table. This table is included to provide the reader with an understanding of what
data was available for the given time period.
AGENCY ASSISTANCE FOR THE UMR AND OHIO RIVER BASINS:
State agencies were contacted in order to obtain commercial fishing harvest data for the water
bodies in the Upper Mississippi River and Ohio River Basins. The following tables display
which agencies were contacted in order to provide commercial fishing harvest data on the Upper
Mississippi River, Illinois River, Kaskaskia River, Rock River, Zumbro River, Ohio River,
Wabash River, Cumberland River, Kentucky River, and Salt River.
TABLE 10: UMR AGENCY ASSISTANCE
Bordering States Contributing Agencies
Minnesota Upper Mississippi River Conservation Committee
Iowa Upper Mississippi River Conservation Committee
Missouri Upper Mississippi River Conservation Committee
Wisconsin Upper Mississippi River Conservation Committee
Illinois Illinois Department of Natural Resources,
Upper Mississippi Conservation Committee
TABLE 11: UMR TRIBUTARY AGENCY ASSISTANCE
River Bordering State Contributing Agency
Illinois Illinois Illinois Department of Natural Resources
Kaskaskia Illinois Illinois Department of Natural Resources
Rock Illinois Illinois Department of Natural Resources
Zumbro Minnesota Minnesota Department of Natural Resources
TABLE 12: OHIO RIVER AGENCY ASSISTANCE
Bordering States Contributing Agencies
Illinois Illinois Department of Natural Resources
Indiana Indiana Department of Natural Resources
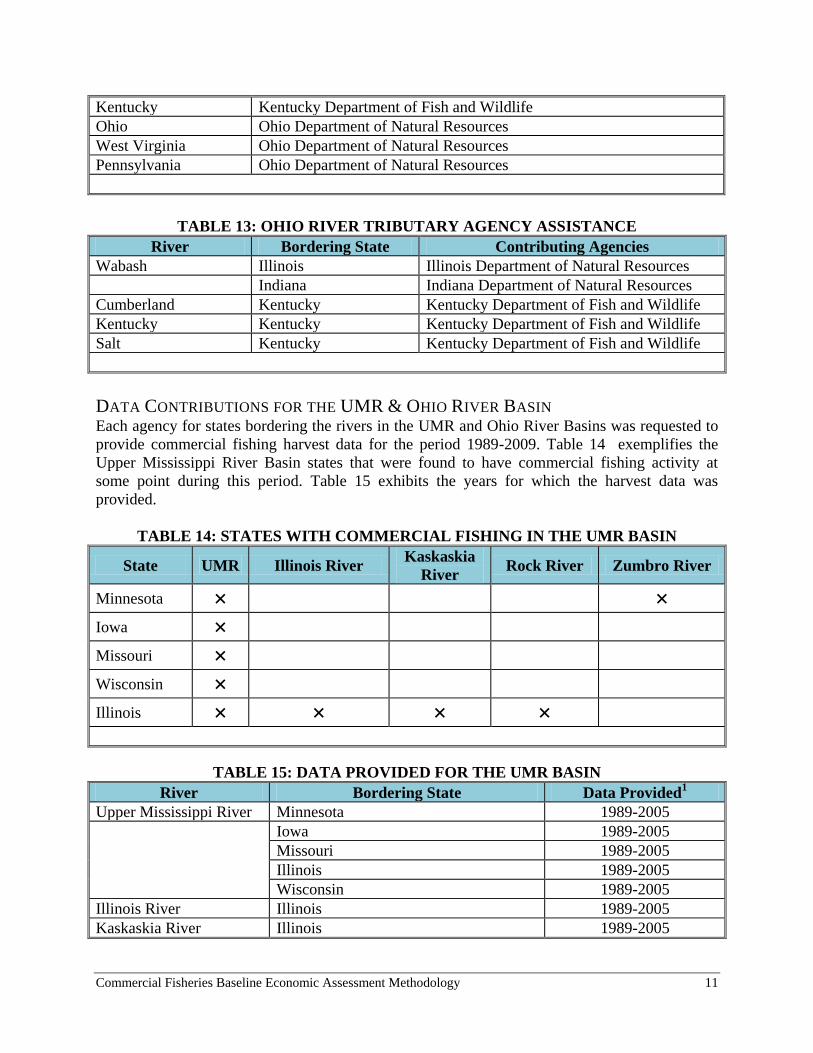
Commercial Fisheries Baseline Economic Assessment Methodology 11
Kentucky Kentucky Department of Fish and Wildlife
Ohio Ohio Department of Natural Resources
West Virginia Ohio Department of Natural Resources
Pennsylvania Ohio Department of Natural Resources
TABLE 13: OHIO RIVER TRIBUTARY AGENCY ASSISTANCE
River Bordering State Contributing Agencies
Wabash Illinois Illinois Department of Natural Resources
Indiana Indiana Department of Natural Resources
Cumberland Kentucky Kentucky Department of Fish and Wildlife
Kentucky Kentucky Kentucky Department of Fish and Wildlife
Salt Kentucky Kentucky Department of Fish and Wildlife
DATA CONTRIBUTIONS FOR THE UMR & OHIO RIVER BASIN Each agency for states bordering the rivers in the UMR and Ohio River Basins was requested to
provide commercial fishing harvest data for the period 1989-2009. Table 14 exemplifies the
Upper Mississippi River Basin states that were found to have commercial fishing activity at
some point during this period. Table 15 exhibits the years for which the harvest data was
provided.
TABLE 14: STATES WITH COMMERCIAL FISHING IN THE UMR BASIN
State UMR Illinois River Kaskaskia
River Rock River Zumbro River
Minnesota × × Iowa × Missouri × Wisconsin × Illinois × × × ×
TABLE 15: DATA PROVIDED FOR THE UMR BASIN
River Bordering State Data Provided1
Upper Mississippi River Minnesota 1989-2005
Iowa 1989-2005
Missouri 1989-2005
Illinois 1989-2005
Wisconsin 1989-2005
Illinois River Illinois 1989-2005
Kaskaskia River Illinois 1989-2005
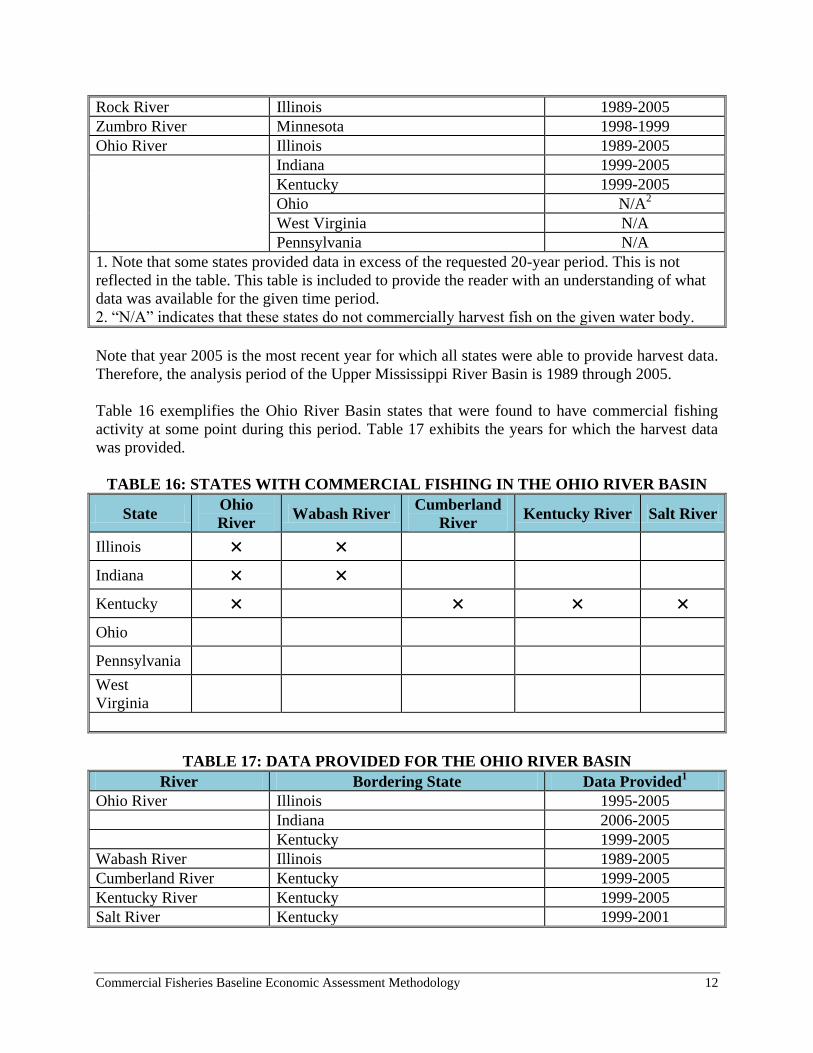
Commercial Fisheries Baseline Economic Assessment Methodology 12
Rock River Illinois 1989-2005
Zumbro River Minnesota 1998-1999
Ohio River Illinois 1989-2005
Indiana 1999-2005
Kentucky 1999-2005
Ohio N/A2
West Virginia N/A
Pennsylvania N/A
1. Note that some states provided data in excess of the requested 20-year period. This is not
reflected in the table. This table is included to provide the reader with an understanding of what
data was available for the given time period.
2. “N/A” indicates that these states do not commercially harvest fish on the given water body.
Note that year 2005 is the most recent year for which all states were able to provide harvest data.
Therefore, the analysis period of the Upper Mississippi River Basin is 1989 through 2005.
Table 16 exemplifies the Ohio River Basin states that were found to have commercial fishing
activity at some point during this period. Table 17 exhibits the years for which the harvest data
was provided.
TABLE 16: STATES WITH COMMERCIAL FISHING IN THE OHIO RIVER BASIN
State Ohio
River Wabash River
Cumberland
River Kentucky River Salt River
Illinois × × Indiana × × Kentucky × × × × Ohio Pennsylvania West
Virginia
TABLE 17: DATA PROVIDED FOR THE OHIO RIVER BASIN
River Bordering State Data Provided1
Ohio River Illinois 1995-2005
Indiana 2006-2005
Kentucky 1999-2005
Wabash River Illinois 1989-2005
Cumberland River Kentucky 1999-2005
Kentucky River Kentucky 1999-2005
Salt River Kentucky 1999-2001
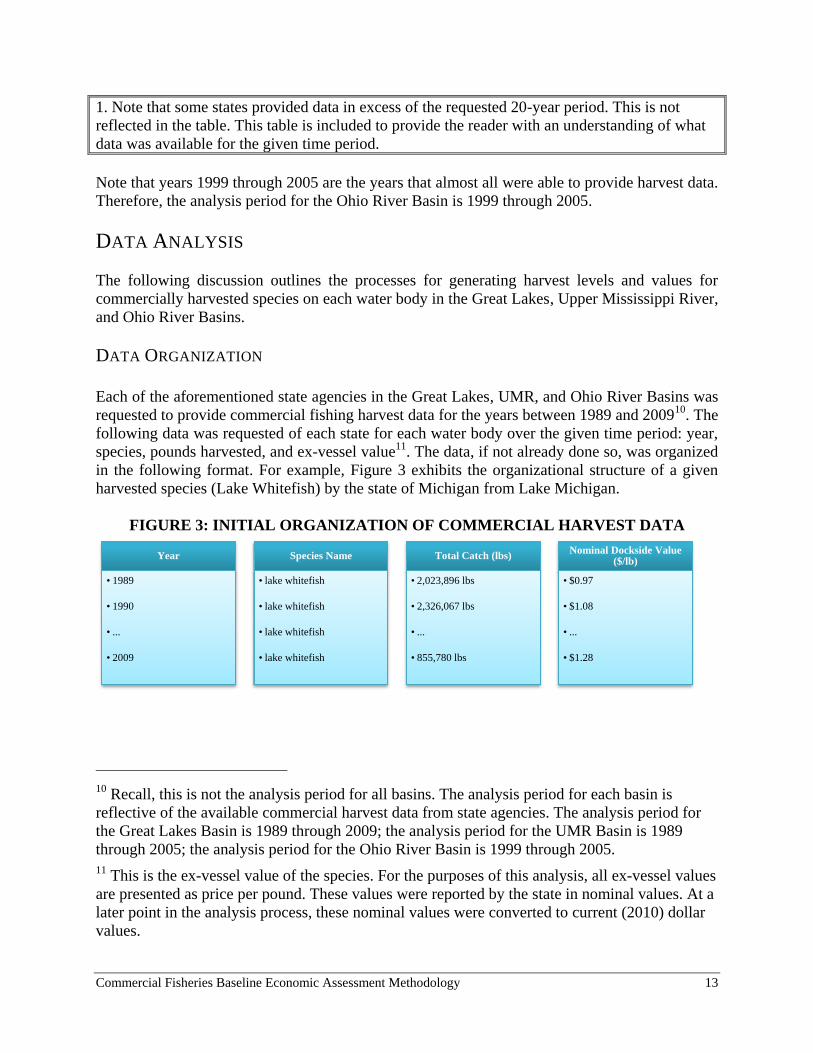
Commercial Fisheries Baseline Economic Assessment Methodology 13
1. Note that some states provided data in excess of the requested 20-year period. This is not
reflected in the table. This table is included to provide the reader with an understanding of what
data was available for the given time period.
Note that years 1999 through 2005 are the years that almost all were able to provide harvest data.
Therefore, the analysis period for the Ohio River Basin is 1999 through 2005.
DATA ANALYSIS
The following discussion outlines the processes for generating harvest levels and values for
commercially harvested species on each water body in the Great Lakes, Upper Mississippi River,
and Ohio River Basins.
DATA ORGANIZATION
Each of the aforementioned state agencies in the Great Lakes, UMR, and Ohio River Basins was
requested to provide commercial fishing harvest data for the years between 1989 and 200910
. The
following data was requested of each state for each water body over the given time period: year,
species, pounds harvested, and ex-vessel value11
. The data, if not already done so, was organized
in the following format. For example, Figure 3 exhibits the organizational structure of a given
harvested species (Lake Whitefish) by the state of Michigan from Lake Michigan.
FIGURE 3: INITIAL ORGANIZATION OF COMMERCIAL HARVEST DATA
10 Recall, this is not the analysis period for all basins. The analysis period for each basin is
reflective of the available commercial harvest data from state agencies. The analysis period for
the Great Lakes Basin is 1989 through 2009; the analysis period for the UMR Basin is 1989
through 2005; the analysis period for the Ohio River Basin is 1999 through 2005.
11 This is the ex-vessel value of the species. For the purposes of this analysis, all ex-vessel values
are presented as price per pound. These values were reported by the state in nominal values. At a
later point in the analysis process, these nominal values were converted to current (2010) dollar
values.
Year
• 1989
• 1990
• ...
• 2009
Species Name
• lake whitefish
• lake whitefish
• lake whitefish
• lake whitefish
Total Catch (lbs)
• 2,023,896 lbs
• 2,326,067 lbs
• ...
• 855,780 lbs
Nominal Dockside Value ($/lb)
• $0.97
• $1.08
• ...
• $1.28
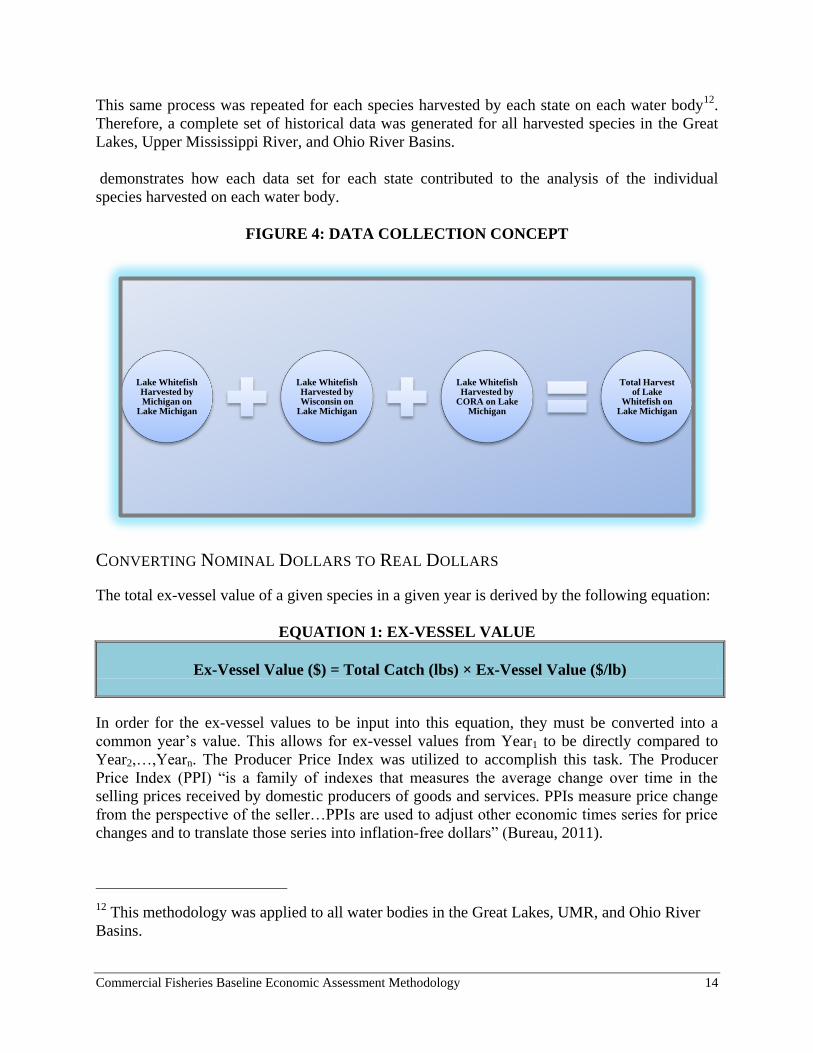
Commercial Fisheries Baseline Economic Assessment Methodology 14
This same process was repeated for each species harvested by each state on each water body12
.
Therefore, a complete set of historical data was generated for all harvested species in the Great
Lakes, Upper Mississippi River, and Ohio River Basins.
demonstrates how each data set for each state contributed to the analysis of the individual
species harvested on each water body.
FIGURE 4: DATA COLLECTION CONCEPT
CONVERTING NOMINAL DOLLARS TO REAL DOLLARS
The total ex-vessel value of a given species in a given year is derived by the following equation:
EQUATION 1: EX-VESSEL VALUE
Ex-Vessel Value ($) = Total Catch (lbs) × Ex-Vessel Value ($/lb)
In order for the ex-vessel values to be input into this equation, they must be converted into a
common year’s value. This allows for ex-vessel values from Year1 to be directly compared to
Year2,…,Yearn. The Producer Price Index was utilized to accomplish this task. The Producer
Price Index (PPI) “is a family of indexes that measures the average change over time in the
selling prices received by domestic producers of goods and services. PPIs measure price change
from the perspective of the seller…PPIs are used to adjust other economic times series for price
changes and to translate those series into inflation-free dollars” (Bureau, 2011).
12 This methodology was applied to all water bodies in the Great Lakes, UMR, and Ohio River
Basins.
Lake Whitefish Harvested by Michigan on
Lake Michigan
Lake Whitefish Harvested by Wisconsin on
Lake Michigan
Lake Whitefish Harvested by
CORA on Lake Michigan
Total Harvest of Lake
Whitefish on Lake Michigan
Commercial Fisheries Baseline Economic Assessment Methodology 15
State agencies provided ex-vessel value data in nominal dollars. The process for converting
nominal ex-vessel values to ex-vessel values in 201013
dollars is as exemplified in Equation 2:
Ex-Vessel Value.
EQUATION 2: EX-VESSEL VALUE
Ex-Vessel Value2010 = (Ex-vessel Valueyear x) × (PPI2010/ PPIyear x)
For example, when converting the ex-vessel value of lake whitefish harvested by Michigan from
Lake Michigan from 2002 into 2010 dollars (demonstrate in Table 18: Example of Derivation of
Current Ex-Vessel Value), the aforementioned equation was applied.
TABLE 18: EXAMPLE OF DERIVATION OF CURRENT EX-VESSEL VALUE
Equation Ex-vessel Value2010Dollars = (Ex-vessel Value2002) × (PPI2010 / PPI2002)
Input Values Ex-vessel Value2010 Dollars = ($0.89) × (325.20/220.40)
Final Value Ex-vessel Value2010 Dollars = $1.31
1. Note that the PPI values were generated by the Bureau of Labor Statistics for the category
“other finfish.”
Upon converting the nominal dollars to 2010 dollars, the analyst was then able to apply the ex-
vessel value formula. Table 19: Lake Whitefish Ex-Vessel Value Derivation exemplifies the
complete process of calculating the ex-vessel values for the years 1989 to 2009 for the
commercial harvest of Lake Whitefish by the State of Michigan on Lake Michigan. This
procedure was applied to each harvested species in each water body14
by each bordering state.
13 “The Producer Price Index is a family of indexes that measures the average change over time
in the selling prices received by domestic producers of goods and services. PPIs measure price
change from the perspective of the seller. This contrasts with other measures, such as the
Consumer Price Index (CPI), that measure price change from the purchaser's perspective. Sellers'
and purchasers' prices may differ due to government subsidies, sales and excise taxes, and
distribution costs” (Bureau, 2011). Producer price index (PPI) number “02230199” for “other
finfish” was utilized for converting nominal dollars to 2010 dollars. Note that this PPI was
utilized instead of the average PPI for all goods and services in order to ascertain a change in
price that more accurately reflects that of fish. The National Oceanic and Atmospheric
Association was contacted in order to determine the specific water bodies that the fish in PPI
category “other finfish” was comprised of. It was found that this PPI reflects changes in prices of
saltwater fish rather than freshwater fish. However, this PPI was utilized due to the fact that it is
assumed that it more accurately reflects the changes in prices of freshwater fish than does the
average PPI (for all goods and services). During the analysis process, year 2010 was the most
recent year for which the Bureau of Labor Statistics published an annual PPI for the “other
finfish” category.
14 “Each water body” refers to each analyzed water body in the Great Lakes, UMR, and Ohio
River Basins.
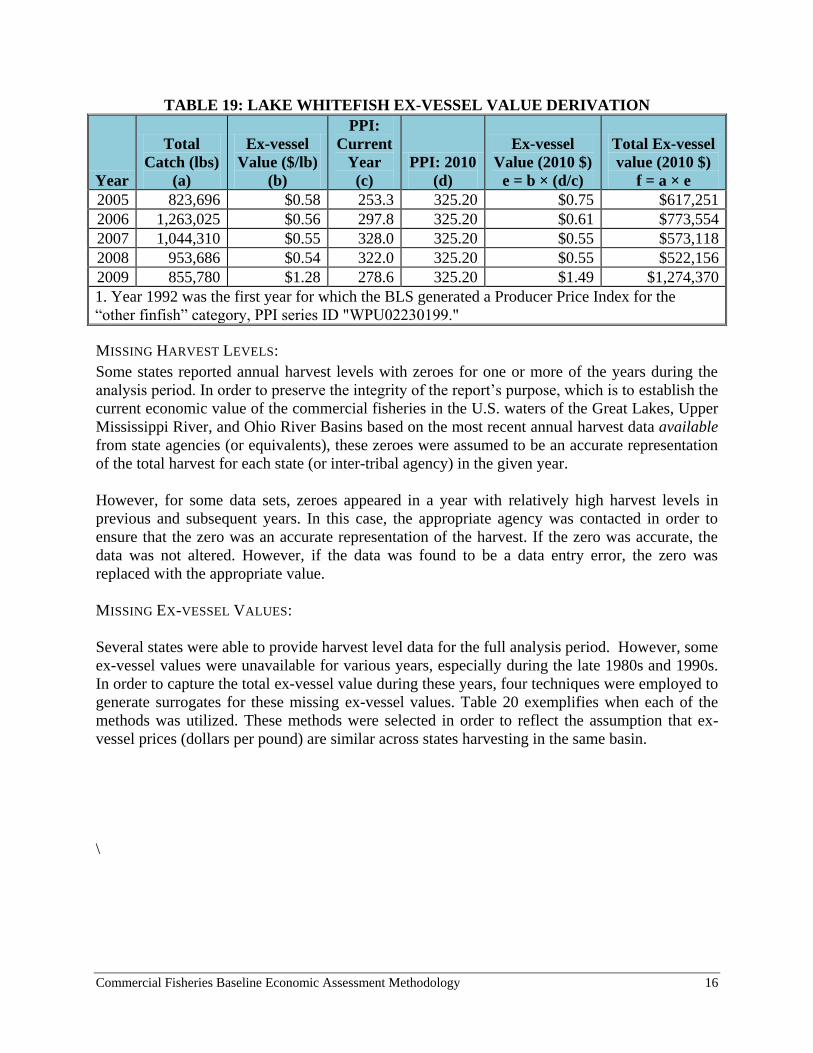
Commercial Fisheries Baseline Economic Assessment Methodology 16
TABLE 19: LAKE WHITEFISH EX-VESSEL VALUE DERIVATION
Year
Total
Catch (lbs)
(a)
Ex-vessel
Value ($/lb)
(b)
PPI:
Current
Year
(c)
PPI: 2010
(d)
Ex-vessel
Value (2010 $)
e = b × (d/c)
Total Ex-vessel
value (2010 $)
f = a × e
2005 823,696 $0.58 253.3 325.20 $0.75 $617,251
2006 1,263,025 $0.56 297.8 325.20 $0.61 $773,554
2007 1,044,310 $0.55 328.0 325.20 $0.55 $573,118
2008 953,686 $0.54 322.0 325.20 $0.55 $522,156
2009 855,780 $1.28 278.6 325.20 $1.49 $1,274,370
1. Year 1992 was the first year for which the BLS generated a Producer Price Index for the
“other finfish” category, PPI series ID "WPU02230199."
MISSING HARVEST LEVELS:
Some states reported annual harvest levels with zeroes for one or more of the years during the
analysis period. In order to preserve the integrity of the report’s purpose, which is to establish the
current economic value of the commercial fisheries in the U.S. waters of the Great Lakes, Upper
Mississippi River, and Ohio River Basins based on the most recent annual harvest data available
from state agencies (or equivalents), these zeroes were assumed to be an accurate representation
of the total harvest for each state (or inter-tribal agency) in the given year.
However, for some data sets, zeroes appeared in a year with relatively high harvest levels in
previous and subsequent years. In this case, the appropriate agency was contacted in order to
ensure that the zero was an accurate representation of the harvest. If the zero was accurate, the
data was not altered. However, if the data was found to be a data entry error, the zero was
replaced with the appropriate value.
MISSING EX-VESSEL VALUES:
Several states were able to provide harvest level data for the full analysis period. However, some
ex-vessel values were unavailable for various years, especially during the late 1980s and 1990s.
In order to capture the total ex-vessel value during these years, four techniques were employed to
generate surrogates for these missing ex-vessel values. Table 20 exemplifies when each of the
methods was utilized. These methods were selected in order to reflect the assumption that ex-
vessel prices (dollars per pound) are similar across states harvesting in the same basin.
\
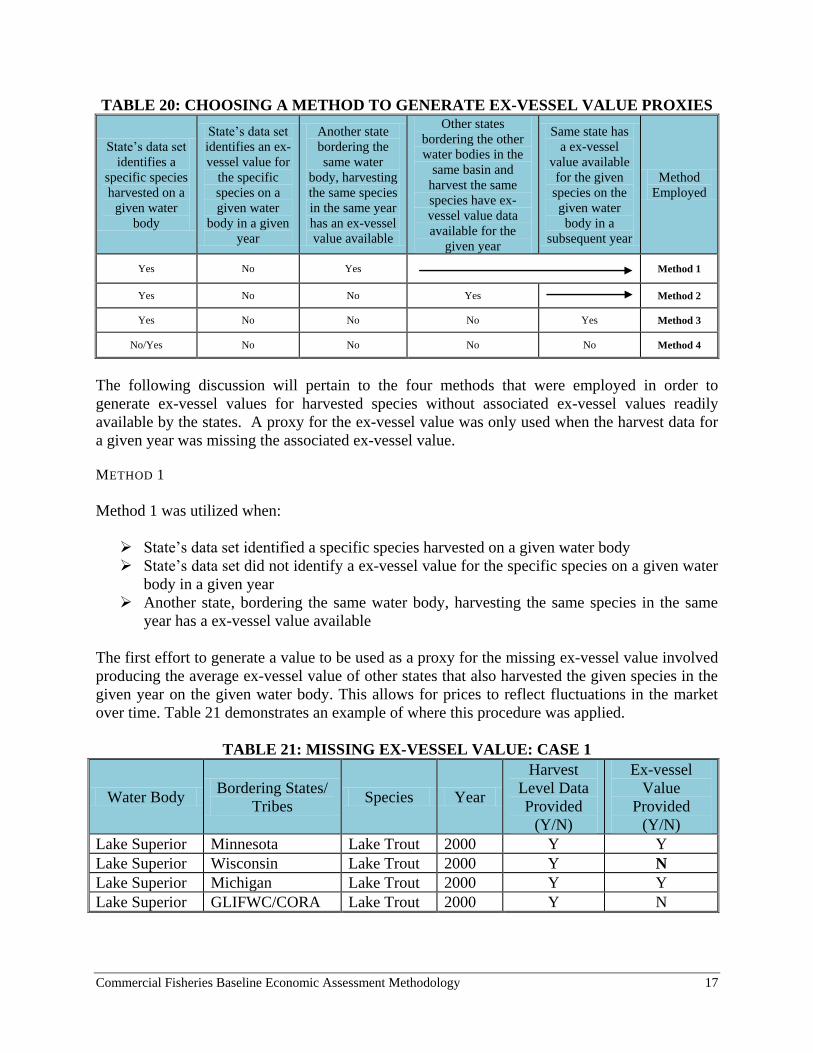
Commercial Fisheries Baseline Economic Assessment Methodology 17
TABLE 20: CHOOSING A METHOD TO GENERATE EX-VESSEL VALUE PROXIES
State’s data set
identifies a
specific species
harvested on a
given water
body
State’s data set
identifies an ex-
vessel value for
the specific
species on a
given water
body in a given
year
Another state
bordering the
same water
body, harvesting
the same species
in the same year
has an ex-vessel
value available
Other states
bordering the other
water bodies in the
same basin and
harvest the same
species have ex-
vessel value data
available for the
given year
Same state has
a ex-vessel
value available
for the given
species on the
given water
body in a
subsequent year
Method
Employed
Yes No Yes Method 1
Yes No No Yes Method 2
Yes No No No Yes Method 3
No/Yes No No No No Method 4
The following discussion will pertain to the four methods that were employed in order to
generate ex-vessel values for harvested species without associated ex-vessel values readily
available by the states. A proxy for the ex-vessel value was only used when the harvest data for
a given year was missing the associated ex-vessel value.
METHOD 1
Method 1 was utilized when:
State’s data set identified a specific species harvested on a given water body
State’s data set did not identify a ex-vessel value for the specific species on a given water
body in a given year
Another state, bordering the same water body, harvesting the same species in the same
year has a ex-vessel value available
The first effort to generate a value to be used as a proxy for the missing ex-vessel value involved
producing the average ex-vessel value of other states that also harvested the given species in the
given year on the given water body. This allows for prices to reflect fluctuations in the market
over time. Table 21 demonstrates an example of where this procedure was applied.
TABLE 21: MISSING EX-VESSEL VALUE: CASE 1
Water Body Bordering States/
Tribes Species Year
Harvest
Level Data
Provided
(Y/N)
Ex-vessel
Value
Provided
(Y/N)
Lake Superior Minnesota Lake Trout 2000 Y Y
Lake Superior Wisconsin Lake Trout 2000 Y N
Lake Superior Michigan Lake Trout 2000 Y Y
Lake Superior GLIFWC/CORA Lake Trout 2000 Y N
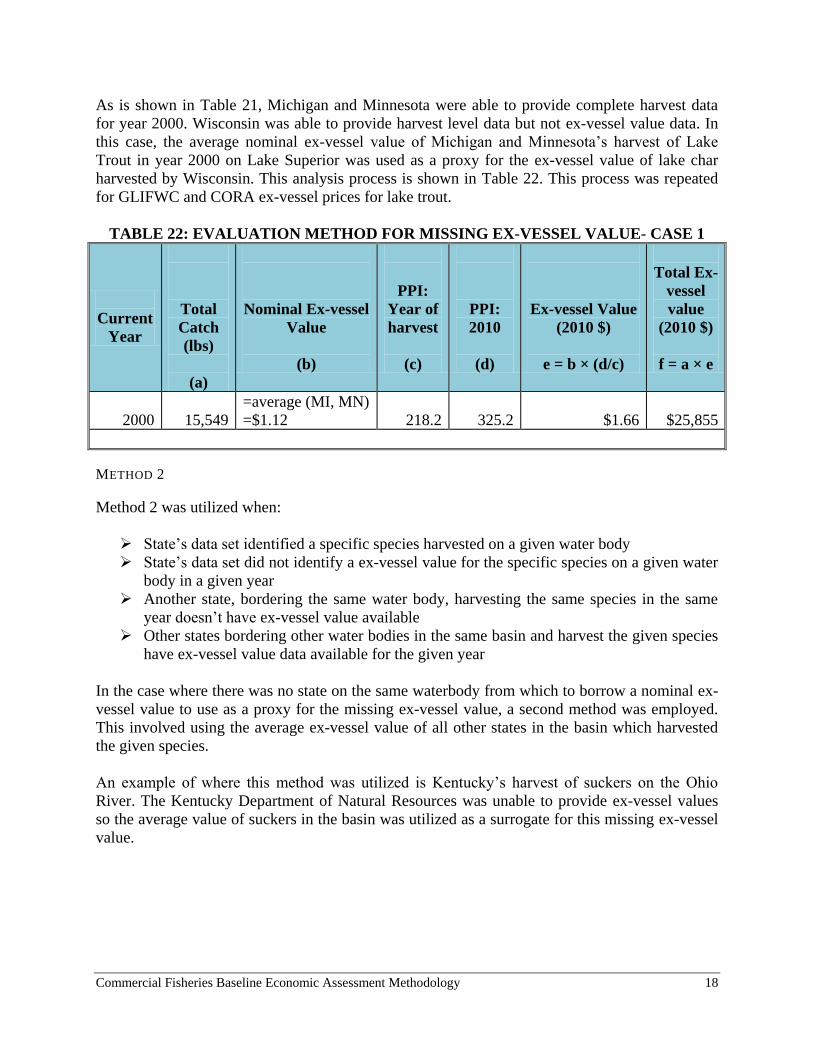
Commercial Fisheries Baseline Economic Assessment Methodology 18
As is shown in Table 21, Michigan and Minnesota were able to provide complete harvest data
for year 2000. Wisconsin was able to provide harvest level data but not ex-vessel value data. In
this case, the average nominal ex-vessel value of Michigan and Minnesota’s harvest of Lake
Trout in year 2000 on Lake Superior was used as a proxy for the ex-vessel value of lake char
harvested by Wisconsin. This analysis process is shown in Table 22. This process was repeated
for GLIFWC and CORA ex-vessel prices for lake trout.
TABLE 22: EVALUATION METHOD FOR MISSING EX-VESSEL VALUE- CASE 1
Current
Year
Total
Catch
(lbs)
(a)
Nominal Ex-vessel
Value
(b)
PPI:
Year of
harvest
(c)
PPI:
2010
(d)
Ex-vessel Value
(2010 $)
e = b × (d/c)
Total Ex-
vessel
value
(2010 $)
f = a × e
2000 15,549
=average (MI, MN)
=$1.12 218.2 325.2 $1.66 $25,855
METHOD 2
Method 2 was utilized when:
State’s data set identified a specific species harvested on a given water body
State’s data set did not identify a ex-vessel value for the specific species on a given water
body in a given year
Another state, bordering the same water body, harvesting the same species in the same
year doesn’t have ex-vessel value available
Other states bordering other water bodies in the same basin and harvest the given species
have ex-vessel value data available for the given year
In the case where there was no state on the same waterbody from which to borrow a nominal ex-
vessel value to use as a proxy for the missing ex-vessel value, a second method was employed.
This involved using the average ex-vessel value of all other states in the basin which harvested
the given species.
An example of where this method was utilized is Kentucky’s harvest of suckers on the Ohio
River. The Kentucky Department of Natural Resources was unable to provide ex-vessel values
so the average value of suckers in the basin was utilized as a surrogate for this missing ex-vessel
value.
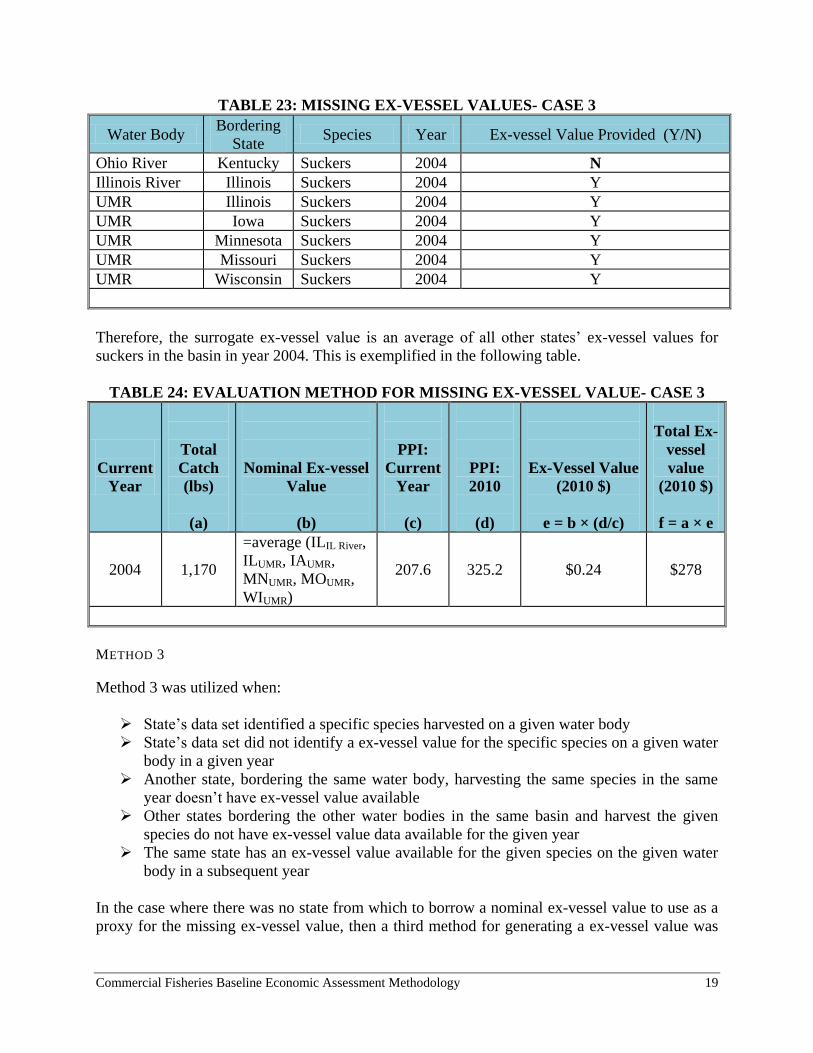
Commercial Fisheries Baseline Economic Assessment Methodology 19
TABLE 23: MISSING EX-VESSEL VALUES- CASE 3
Water Body Bordering
State Species Year Ex-vessel Value Provided (Y/N)
Ohio River Kentucky Suckers 2004 N
Illinois River Illinois Suckers 2004 Y
UMR Illinois Suckers 2004 Y
UMR Iowa Suckers 2004 Y
UMR Minnesota Suckers 2004 Y
UMR Missouri Suckers 2004 Y
UMR Wisconsin Suckers 2004 Y
Therefore, the surrogate ex-vessel value is an average of all other states’ ex-vessel values for
suckers in the basin in year 2004. This is exemplified in the following table.
TABLE 24: EVALUATION METHOD FOR MISSING EX-VESSEL VALUE- CASE 3
Current
Year
Total
Catch
(lbs)
(a)
Nominal Ex-vessel
Value
(b)
PPI:
Current
Year
(c)
PPI:
2010
(d)
Ex-Vessel Value
(2010 $)
e = b × (d/c)
Total Ex-
vessel
value
(2010 $)
f = a × e
2004 1,170
=average (ILIL River,
ILUMR, IAUMR,
MNUMR, MOUMR,
WIUMR)
207.6 325.2 $0.24 $278
METHOD 3
Method 3 was utilized when:
State’s data set identified a specific species harvested on a given water body
State’s data set did not identify a ex-vessel value for the specific species on a given water
body in a given year
Another state, bordering the same water body, harvesting the same species in the same
year doesn’t have ex-vessel value available
Other states bordering the other water bodies in the same basin and harvest the given
species do not have ex-vessel value data available for the given year
The same state has an ex-vessel value available for the given species on the given water
body in a subsequent year
In the case where there was no state from which to borrow a nominal ex-vessel value to use as a
proxy for the missing ex-vessel value, then a third method for generating a ex-vessel value was
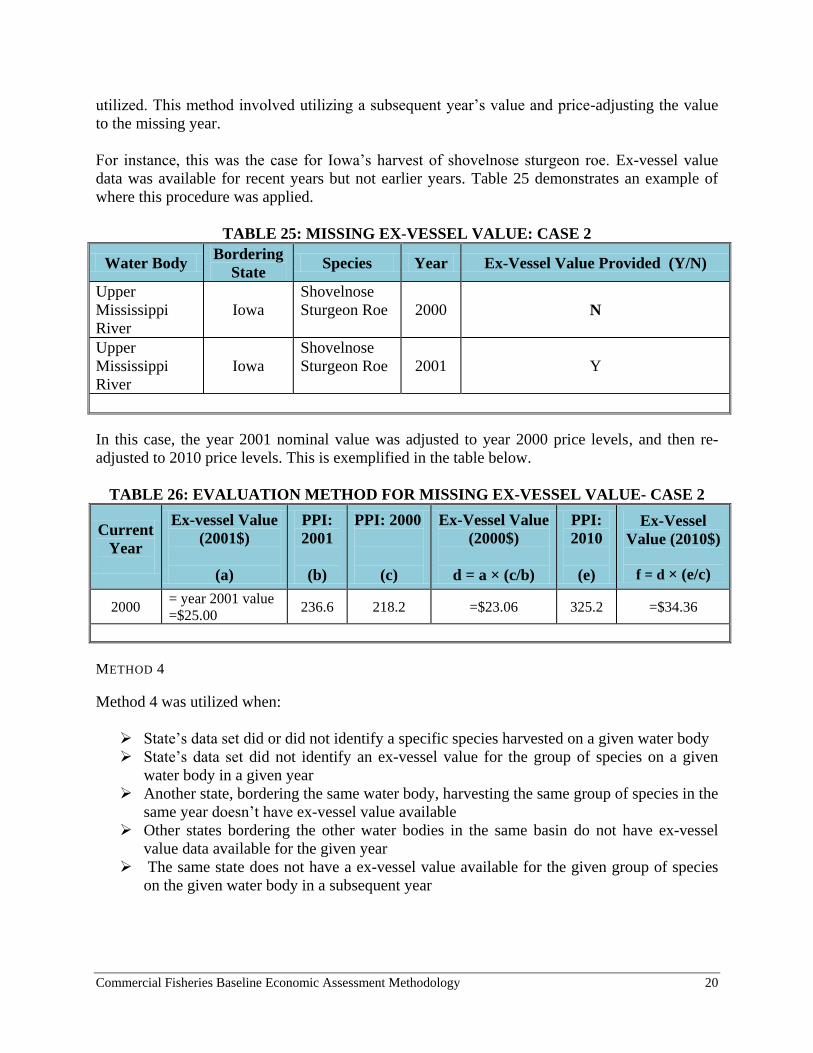
Commercial Fisheries Baseline Economic Assessment Methodology 20
utilized. This method involved utilizing a subsequent year’s value and price-adjusting the value
to the missing year.
For instance, this was the case for Iowa’s harvest of shovelnose sturgeon roe. Ex-vessel value
data was available for recent years but not earlier years. Table 25 demonstrates an example of
where this procedure was applied.
TABLE 25: MISSING EX-VESSEL VALUE: CASE 2
Water Body Bordering
State Species Year Ex-Vessel Value Provided (Y/N)
Upper
Mississippi
River
Iowa
Shovelnose
Sturgeon Roe 2000 N
Upper
Mississippi
River
Iowa
Shovelnose
Sturgeon Roe 2001 Y
In this case, the year 2001 nominal value was adjusted to year 2000 price levels, and then re-
adjusted to 2010 price levels. This is exemplified in the table below.
TABLE 26: EVALUATION METHOD FOR MISSING EX-VESSEL VALUE- CASE 2
Current
Year
Ex-vessel Value
(2001$)
(a)
PPI:
2001
(b)
PPI: 2000
(c)
Ex-Vessel Value
(2000$)
d = a × (c/b)
PPI:
2010
(e)
Ex-Vessel
Value (2010$)
f = d × (e/c)
2000 = year 2001 value
=$25.00 236.6 218.2 =$23.06 325.2 =$34.36
METHOD 4
Method 4 was utilized when:
State’s data set did or did not identify a specific species harvested on a given water body
State’s data set did not identify an ex-vessel value for the group of species on a given
water body in a given year
Another state, bordering the same water body, harvesting the same group of species in the
same year doesn’t have ex-vessel value available
Other states bordering the other water bodies in the same basin do not have ex-vessel
value data available for the given year
The same state does not have a ex-vessel value available for the given group of species
on the given water body in a subsequent year
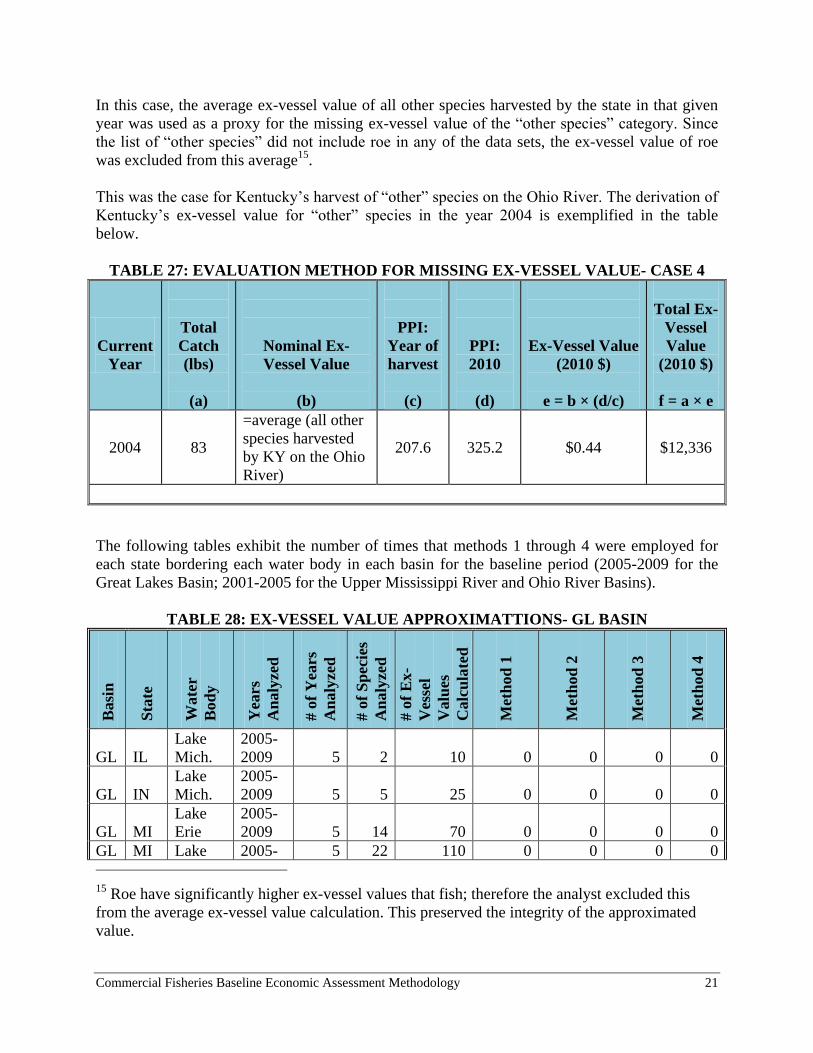
Commercial Fisheries Baseline Economic Assessment Methodology 21
In this case, the average ex-vessel value of all other species harvested by the state in that given
year was used as a proxy for the missing ex-vessel value of the “other species” category. Since
the list of “other species” did not include roe in any of the data sets, the ex-vessel value of roe
was excluded from this average15
.
This was the case for Kentucky’s harvest of “other” species on the Ohio River. The derivation of
Kentucky’s ex-vessel value for “other” species in the year 2004 is exemplified in the table
below.
TABLE 27: EVALUATION METHOD FOR MISSING EX-VESSEL VALUE- CASE 4
Current
Year
Total
Catch
(lbs)
(a)
Nominal Ex-
Vessel Value
(b)
PPI:
Year of
harvest
(c)
PPI:
2010
(d)
Ex-Vessel Value
(2010 $)
e = b × (d/c)
Total Ex-
Vessel
Value
(2010 $)
f = a × e
2004 83
=average (all other
species harvested
by KY on the Ohio
River)
207.6 325.2 $0.44 $12,336
The following tables exhibit the number of times that methods 1 through 4 were employed for
each state bordering each water body in each basin for the baseline period (2005-2009 for the
Great Lakes Basin; 2001-2005 for the Upper Mississippi River and Ohio River Basins).
TABLE 28: EX-VESSEL VALUE APPROXIMATTIONS- GL BASIN
Basi
n
Sta
te
Wate
r
Bod
y
Yea
rs
An
aly
zed
# o
f Y
ears
An
aly
zed
# o
f S
pec
ies
An
aly
zed
# o
f E
x-
Ves
sel
Valu
es
Calc
ula
ted
Met
hod
1
Met
hod
2
Met
hod
3
Met
hod
4
GL IL
Lake
Mich.
2005-
2009 5 2 10 0 0 0 0
GL IN
Lake
Mich.
2005-
2009 5 5 25 0 0 0 0
GL MI
Lake
Erie
2005-
2009 5 14 70 0 0 0 0
GL MI Lake 2005- 5 22 110 0 0 0 0
15 Roe have significantly higher ex-vessel values that fish; therefore the analyst excluded this
from the average ex-vessel value calculation. This preserved the integrity of the approximated
value.
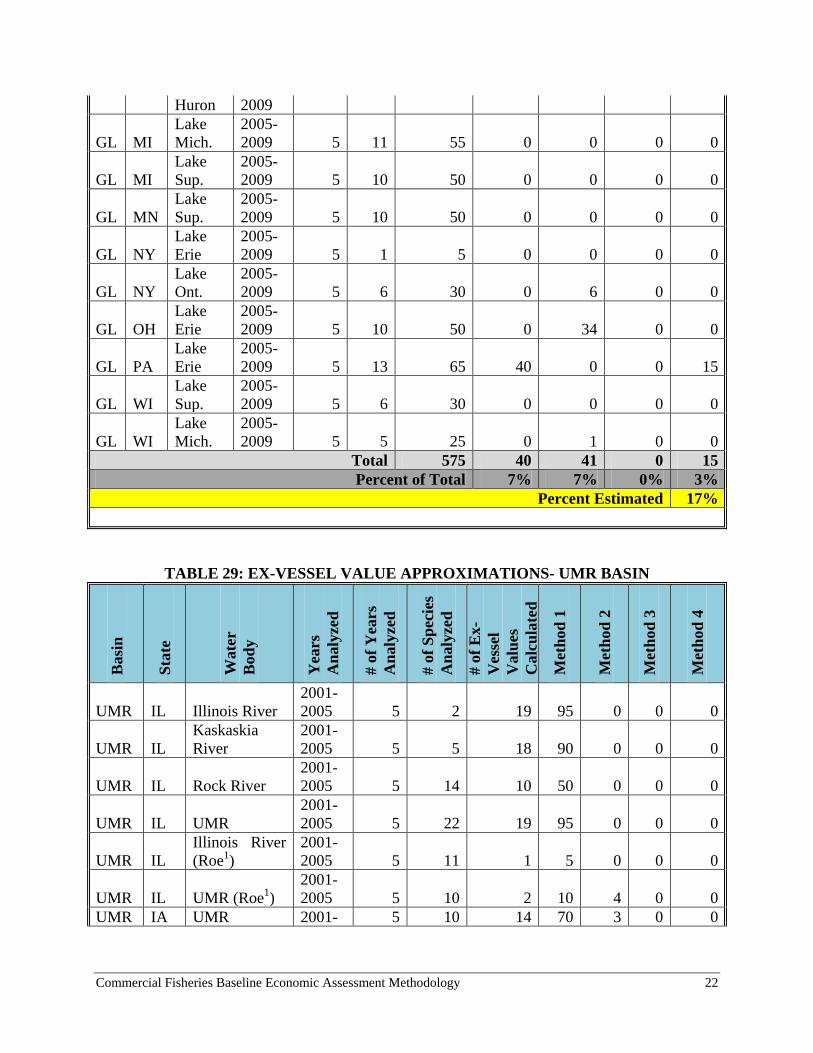
Commercial Fisheries Baseline Economic Assessment Methodology 22
Huron 2009
GL MI
Lake
Mich.
2005-
2009 5 11 55 0 0 0 0
GL MI
Lake
Sup.
2005-
2009 5 10 50 0 0 0 0
GL MN
Lake
Sup.
2005-
2009 5 10 50 0 0 0 0
GL NY
Lake
Erie
2005-
2009 5 1 5 0 0 0 0
GL NY
Lake
Ont.
2005-
2009 5 6 30 0 6 0 0
GL OH
Lake
Erie
2005-
2009 5 10 50 0 34 0 0
GL PA
Lake
Erie
2005-
2009 5 13 65 40 0 0 15
GL WI
Lake
Sup.
2005-
2009 5 6 30 0 0 0 0
GL WI
Lake
Mich.
2005-
2009 5 5 25 0 1 0 0
Total 575 40 41 0 15
Percent of Total 7% 7% 0% 3%
Percent Estimated 17%
TABLE 29: EX-VESSEL VALUE APPROXIMATIONS- UMR BASIN
Basi
n
Sta
te
Wate
r
Bod
y
Yea
rs
An
aly
zed
# o
f Y
ears
An
aly
zed
# o
f S
pec
ies
An
aly
zed
# o
f E
x-
Ves
sel
Valu
es
Calc
ula
ted
Met
hod
1
Met
hod
2
Met
hod
3
Met
hod
4
UMR IL Illinois River
2001-
2005 5 2 19 95 0 0 0
UMR IL
Kaskaskia
River
2001-
2005 5 5 18 90 0 0 0
UMR IL Rock River
2001-
2005 5 14 10 50 0 0 0
UMR IL UMR
2001-
2005 5 22 19 95 0 0 0
UMR IL
Illinois River
(Roe1)
2001-
2005 5 11 1 5 0 0 0
UMR IL UMR (Roe1)
2001-
2005 5 10 2 10 4 0 0
UMR IA UMR 2001- 5 10 14 70 3 0 0
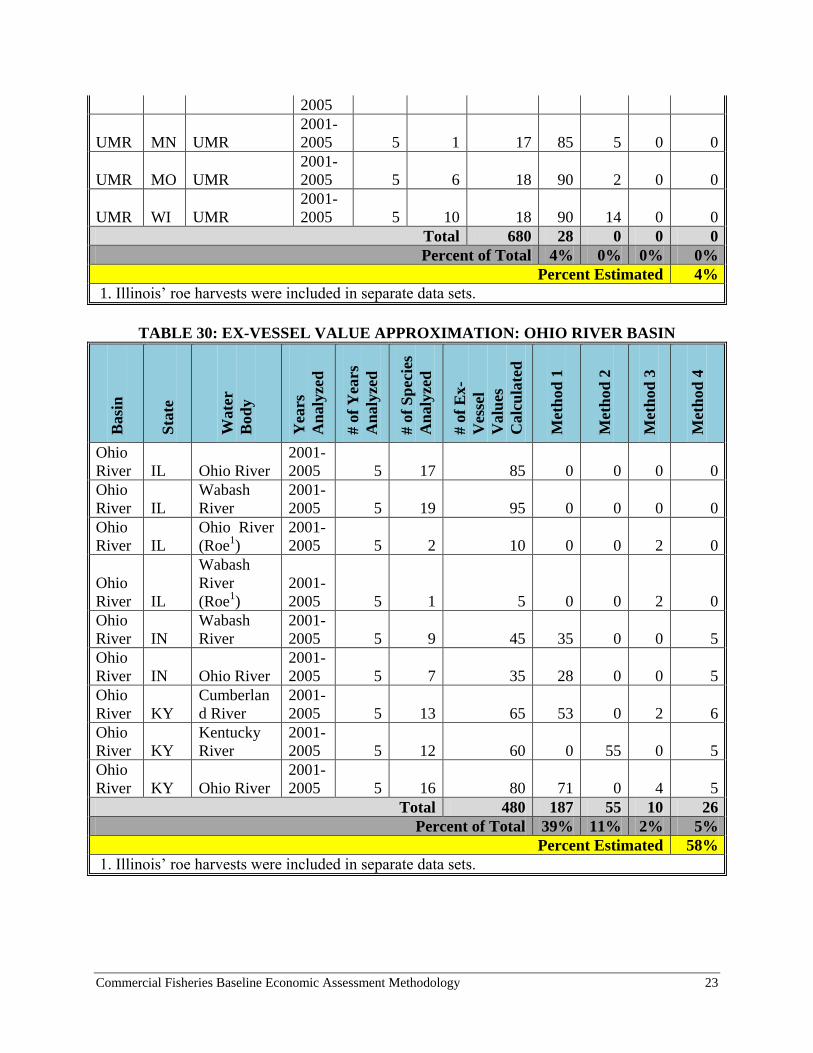
Commercial Fisheries Baseline Economic Assessment Methodology 23
2005
UMR MN UMR
2001-
2005 5 1 17 85 5 0 0
UMR MO UMR
2001-
2005 5 6 18 90 2 0 0
UMR WI UMR
2001-
2005 5 10 18 90 14 0 0
Total 680 28 0 0 0
Percent of Total 4% 0% 0% 0%
Percent Estimated 4%
1. Illinois’ roe harvests were included in separate data sets.
TABLE 30: EX-VESSEL VALUE APPROXIMATION: OHIO RIVER BASIN
Basi
n
Sta
te
Wate
r
Bod
y
Yea
rs
An
aly
zed
# o
f Y
ears
An
aly
zed
# o
f S
pec
ies
An
aly
zed
# o
f E
x-
Ves
sel
Valu
es
Calc
ula
ted
Met
hod
1
Met
hod
2
Met
hod
3
Met
hod
4
Ohio
River IL Ohio River
2001-
2005 5 17 85 0 0 0 0
Ohio
River IL
Wabash
River
2001-
2005 5 19 95 0 0 0 0
Ohio
River IL
Ohio River
(Roe1)
2001-
2005 5 2 10 0 0 2 0
Ohio
River IL
Wabash
River
(Roe1)
2001-
2005 5 1 5 0 0 2 0
Ohio
River IN
Wabash
River
2001-
2005 5 9 45 35 0 0 5
Ohio
River IN Ohio River
2001-
2005 5 7 35 28 0 0 5
Ohio
River KY
Cumberlan
d River
2001-
2005 5 13 65 53 0 2 6
Ohio
River KY
Kentucky
River
2001-
2005 5 12 60 0 55 0 5
Ohio
River KY Ohio River
2001-
2005 5 16 80 71 0 4 5
Total 480 187 55 10 26
Percent of Total 39% 11% 2% 5%
Percent Estimated 58%
1. Illinois’ roe harvests were included in separate data sets.
Commercial Fisheries Baseline Economic Assessment Methodology 24
CATEGORIZING SPECIES IN EACH WATER BODY:
Recall that this Commercial Fisheries Economic Baseline Assessment is intended to serve as part
one of a three-part process.
The first is to establish the current value of the commercial fisheries in the Great Lakes and
Upper Mississippi River basins. This is accomplished via the Commercial Fisheries Baseline
Economic Assessment.
The second part is to ascertain how the value of the fisheries would change in the event of
aquatic nuisance species (ANS) transfer between the basins. In order for the baseline assessment
to prepare the framework for the without-project condition, the GLMRIS Natural Resources
Team (NRT) was consulted in order to determine a method of aggregating the data.
It was determined that the harvest data for the species in each water body should be categorized
by Family and ecological similarities. Habitat utilization, feeding regimes, and other life history
characteristics were used to group species together using letter categories. By categorizing
species in this manner, the potential effects of aquatic nuisance species can be easily identified
based on ecological overlap. For example, the introduction of an invasive filter feeder could
have significant impacts on any of the commercial fish species that are also filter feeders. The
groupings are explained in the following:
A- This group consists of members from the families gars (Lepisosteidae) and bowfins
(Amiidae). These groups of fish are found in back water habitat and primarily feed on other fish.
B- Paddlefish (Polyodon spatula), mooneyes (Hiodon spp.), shads and herrings (Clupeidae), and
two species from the minnows and carps family (bighead carp and silver carp) are grouped
together. These fish are filter feeding species that inhabit the upper portions of the water
column.
C- Minnows and Carps (Cyprinidae) make up this category. These fish are omnivores that
consume everything from macrophytes to insects as they scavenge a diverse array of habitats.
D- These fish are primarily benthic feeders where they forage on macroinvertebrates. Most
species of suckers (Catostomidae) are categorized in this group.
E- Two species of sucker (river redhorse Moxostoma carinatum and greater redhorse Moxostoma
valenciennesi) as well as the only freshwatermember of the drum family (Sciaenidae:
Aplodinotus grunniens) are grouped together because they primarily feed on mollusks.
F- This group consists of the catfishes. Catfish (Ictaluridae) are predatory; however they tend to
be more general in their consumption of food. They will eat everything from macroinvertebrates
to fish.
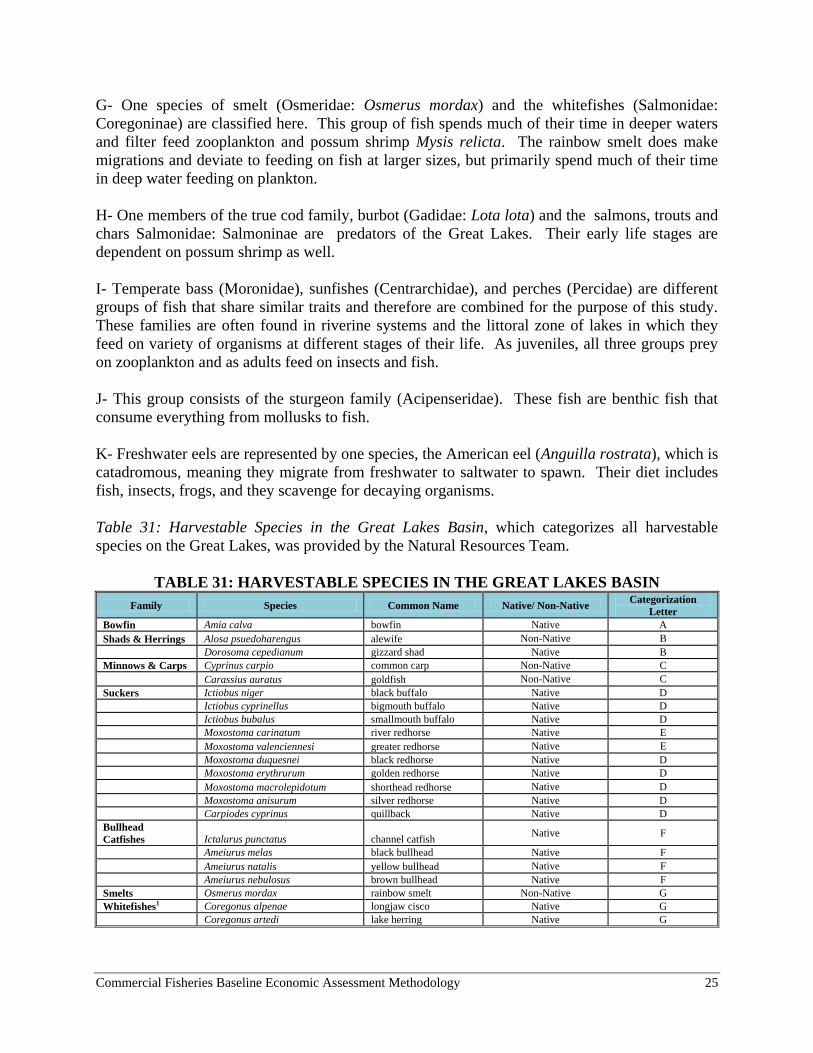
Commercial Fisheries Baseline Economic Assessment Methodology 25
G- One species of smelt (Osmeridae: Osmerus mordax) and the whitefishes (Salmonidae:
Coregoninae) are classified here. This group of fish spends much of their time in deeper waters
and filter feed zooplankton and possum shrimp Mysis relicta. The rainbow smelt does make
migrations and deviate to feeding on fish at larger sizes, but primarily spend much of their time
in deep water feeding on plankton.
H- One members of the true cod family, burbot (Gadidae: Lota lota) and the salmons, trouts and
chars Salmonidae: Salmoninae are predators of the Great Lakes. Their early life stages are
dependent on possum shrimp as well.
I- Temperate bass (Moronidae), sunfishes (Centrarchidae), and perches (Percidae) are different
groups of fish that share similar traits and therefore are combined for the purpose of this study.
These families are often found in riverine systems and the littoral zone of lakes in which they
feed on variety of organisms at different stages of their life. As juveniles, all three groups prey
on zooplankton and as adults feed on insects and fish.
J- This group consists of the sturgeon family (Acipenseridae). These fish are benthic fish that
consume everything from mollusks to fish.
K- Freshwater eels are represented by one species, the American eel (Anguilla rostrata), which is
catadromous, meaning they migrate from freshwater to saltwater to spawn. Their diet includes
fish, insects, frogs, and they scavenge for decaying organisms.
Table 31: Harvestable Species in the Great Lakes Basin, which categorizes all harvestable
species on the Great Lakes, was provided by the Natural Resources Team.
TABLE 31: HARVESTABLE SPECIES IN THE GREAT LAKES BASIN
Family Species Common Name Native/ Non-Native Categorization
Letter
Bowfin Amia calva bowfin Native A
Shads & Herrings Alosa psuedoharengus alewife Non-Native B
Dorosoma cepedianum gizzard shad Native B
Minnows & Carps Cyprinus carpio common carp Non-Native C
Carassius auratus goldfish Non-Native C
Suckers Ictiobus niger black buffalo Native D
Ictiobus cyprinellus bigmouth buffalo Native D
Ictiobus bubalus smallmouth buffalo Native D
Moxostoma carinatum river redhorse Native E
Moxostoma valenciennesi greater redhorse Native E
Moxostoma duquesnei black redhorse Native D
Moxostoma erythrurum golden redhorse Native D
Moxostoma macrolepidotum shorthead redhorse Native D
Moxostoma anisurum silver redhorse Native D
Carpiodes cyprinus quillback Native D
Bullhead
Catfishes Ictalurus punctatus channel catfish Native F
Ameiurus melas black bullhead Native F
Ameiurus natalis yellow bullhead Native F
Ameiurus nebulosus brown bullhead Native F
Smelts Osmerus mordax rainbow smelt Non-Native G
Whitefishes1 Coregonus alpenae longjaw cisco Native G
Coregonus artedi lake herring Native G
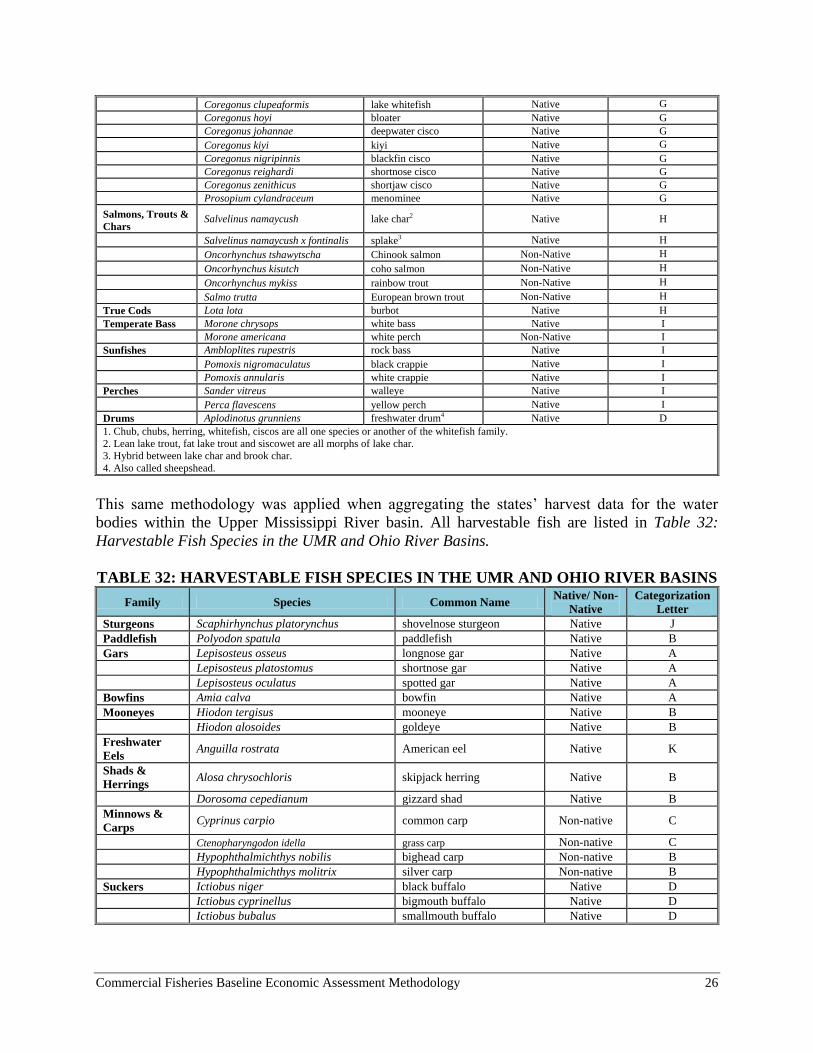
Commercial Fisheries Baseline Economic Assessment Methodology 26
Coregonus clupeaformis lake whitefish Native G
Coregonus hoyi bloater Native G
Coregonus johannae deepwater cisco Native G
Coregonus kiyi kiyi Native G
Coregonus nigripinnis blackfin cisco Native G
Coregonus reighardi shortnose cisco Native G
Coregonus zenithicus shortjaw cisco Native G
Prosopium cylandraceum menominee Native G
Salmons, Trouts &
Chars Salvelinus namaycush lake char2 Native H
Salvelinus namaycush x fontinalis splake3 Native H
Oncorhynchus tshawytscha Chinook salmon Non-Native H Oncorhynchus kisutch coho salmon Non-Native H Oncorhynchus mykiss rainbow trout Non-Native H Salmo trutta European brown trout Non-Native H True Cods Lota lota burbot Native H
Temperate Bass Morone chrysops white bass Native I
Morone americana white perch Non-Native I
Sunfishes Ambloplites rupestris rock bass Native I
Pomoxis nigromaculatus black crappie Native I
Pomoxis annularis white crappie Native I
Perches Sander vitreus walleye Native I
Perca flavescens yellow perch Native I
Drums Aplodinotus grunniens freshwater drum4 Native D
1. Chub, chubs, herring, whitefish, ciscos are all one species or another of the whitefish family.
2. Lean lake trout, fat lake trout and siscowet are all morphs of lake char.
3. Hybrid between lake char and brook char.
4. Also called sheepshead.
This same methodology was applied when aggregating the states’ harvest data for the water
bodies within the Upper Mississippi River basin. All harvestable fish are listed in Table 32:
Harvestable Fish Species in the UMR and Ohio River Basins.
TABLE 32: HARVESTABLE FISH SPECIES IN THE UMR AND OHIO RIVER BASINS
Family Species Common Name Native/ Non-
Native
Categorization
Letter
Sturgeons Scaphirhynchus platorynchus shovelnose sturgeon Native J
Paddlefish Polyodon spatula paddlefish Native B
Gars Lepisosteus osseus longnose gar Native A
Lepisosteus platostomus shortnose gar Native A
Lepisosteus oculatus spotted gar Native A
Bowfins Amia calva bowfin Native A
Mooneyes Hiodon tergisus mooneye Native B
Hiodon alosoides goldeye Native B
Freshwater
Eels Anguilla rostrata American eel Native K
Shads &
Herrings Alosa chrysochloris skipjack herring Native B
Dorosoma cepedianum gizzard shad Native B
Minnows &
Carps Cyprinus carpio common carp Non-native C
Ctenopharyngodon idella grass carp Non-native C
Hypophthalmichthys nobilis bighead carp Non-native B
Hypophthalmichthys molitrix silver carp Non-native B
Suckers Ictiobus niger black buffalo Native D
Ictiobus cyprinellus bigmouth buffalo Native D
Ictiobus bubalus smallmouth buffalo Native D
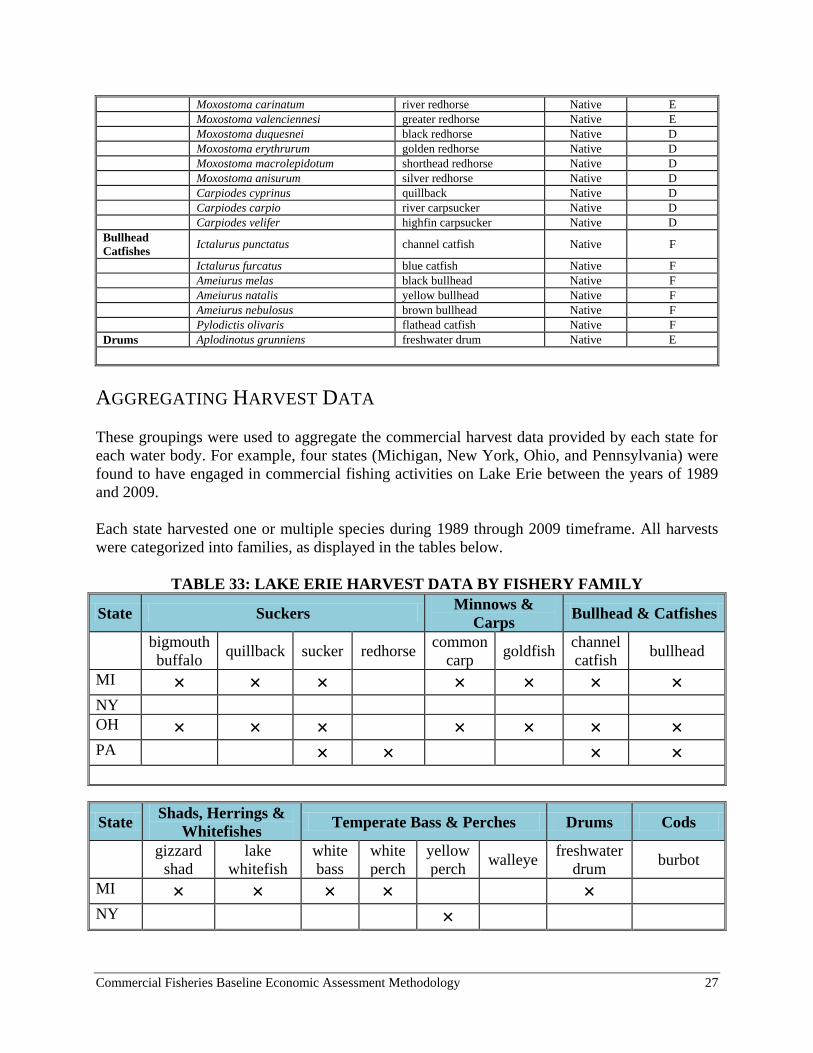
Commercial Fisheries Baseline Economic Assessment Methodology 27
Moxostoma carinatum river redhorse Native E
Moxostoma valenciennesi greater redhorse Native E
Moxostoma duquesnei black redhorse Native D
Moxostoma erythrurum golden redhorse Native D Moxostoma macrolepidotum shorthead redhorse Native D Moxostoma anisurum silver redhorse Native D Carpiodes cyprinus quillback Native D Carpiodes carpio river carpsucker Native D Carpiodes velifer highfin carpsucker Native D Bullhead
Catfishes Ictalurus punctatus channel catfish Native F
Ictalurus furcatus blue catfish Native F Ameiurus melas black bullhead Native F Ameiurus natalis yellow bullhead Native F Ameiurus nebulosus brown bullhead Native F Pylodictis olivaris flathead catfish Native F Drums Aplodinotus grunniens freshwater drum Native E
AGGREGATING HARVEST DATA
These groupings were used to aggregate the commercial harvest data provided by each state for
each water body. For example, four states (Michigan, New York, Ohio, and Pennsylvania) were
found to have engaged in commercial fishing activities on Lake Erie between the years of 1989
and 2009.
Each state harvested one or multiple species during 1989 through 2009 timeframe. All harvests
were categorized into families, as displayed in the tables below.
TABLE 33: LAKE ERIE HARVEST DATA BY FISHERY FAMILY
State Suckers Minnows &
Carps Bullhead & Catfishes
bigmouth
buffalo quillback sucker redhorse
common
carp goldfish
channel
catfish bullhead
MI × × × × × × ×
NY
OH × × × × × × ×
PA × × × ×
State Shads, Herrings &
Whitefishes Temperate Bass & Perches Drums Cods
gizzard
shad
lake
whitefish
white
bass
white
perch
yellow
perch walleye
freshwater
drum burbot
MI × × × × ×
NY ×
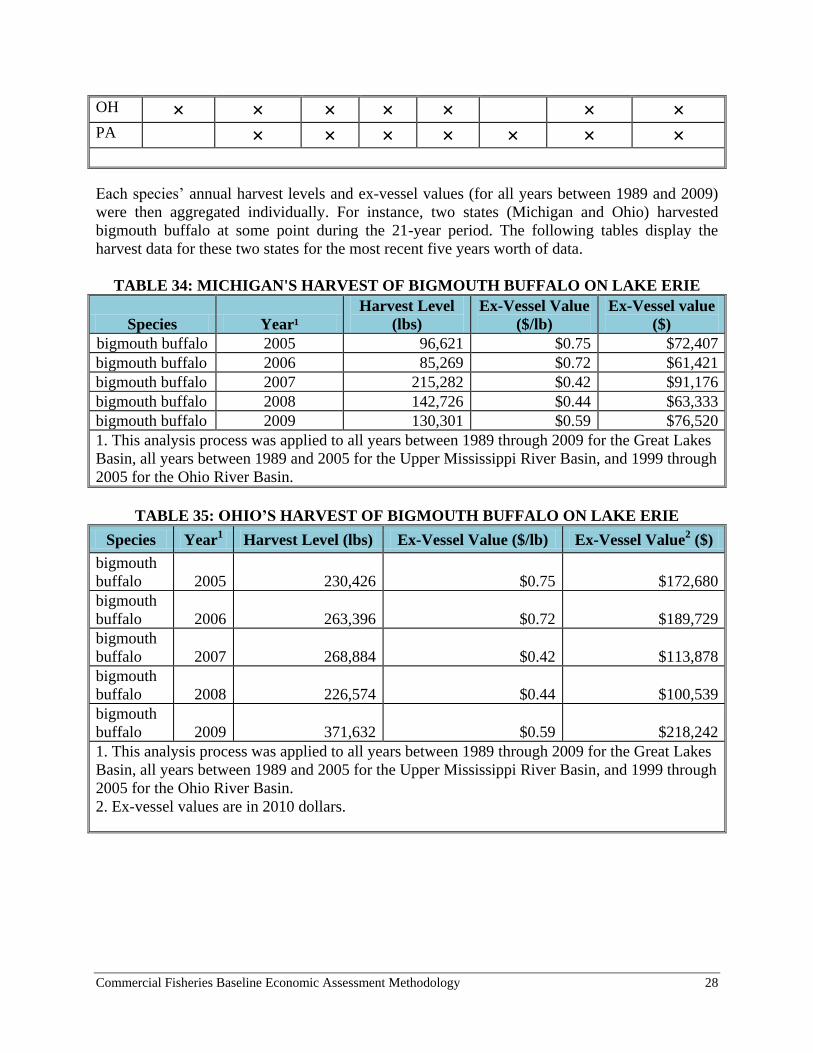
Commercial Fisheries Baseline Economic Assessment Methodology 28
OH × × × × × × ×
PA × × × × × × ×
Each species’ annual harvest levels and ex-vessel values (for all years between 1989 and 2009)
were then aggregated individually. For instance, two states (Michigan and Ohio) harvested
bigmouth buffalo at some point during the 21-year period. The following tables display the
harvest data for these two states for the most recent five years worth of data.
TABLE 34: MICHIGAN'S HARVEST OF BIGMOUTH BUFFALO ON LAKE ERIE
Species Year¹
Harvest Level
(lbs)
Ex-Vessel Value
($/lb)
Ex-Vessel value
($)
bigmouth buffalo 2005 96,621 $0.75 $72,407
bigmouth buffalo 2006 85,269 $0.72 $61,421
bigmouth buffalo 2007 215,282 $0.42 $91,176
bigmouth buffalo 2008 142,726 $0.44 $63,333
bigmouth buffalo 2009 130,301 $0.59 $76,520
1. This analysis process was applied to all years between 1989 through 2009 for the Great Lakes
Basin, all years between 1989 and 2005 for the Upper Mississippi River Basin, and 1999 through
2005 for the Ohio River Basin.
TABLE 35: OHIO’S HARVEST OF BIGMOUTH BUFFALO ON LAKE ERIE
Species Year1 Harvest Level (lbs) Ex-Vessel Value ($/lb) Ex-Vessel Value
2 ($)
bigmouth
buffalo 2005 230,426 $0.75 $172,680
bigmouth
buffalo 2006 263,396 $0.72 $189,729
bigmouth
buffalo 2007 268,884 $0.42 $113,878
bigmouth
buffalo 2008 226,574 $0.44 $100,539
bigmouth
buffalo 2009 371,632 $0.59 $218,242
1. This analysis process was applied to all years between 1989 through 2009 for the Great Lakes
Basin, all years between 1989 and 2005 for the Upper Mississippi River Basin, and 1999 through
2005 for the Ohio River Basin.
2. Ex-vessel values are in 2010 dollars.
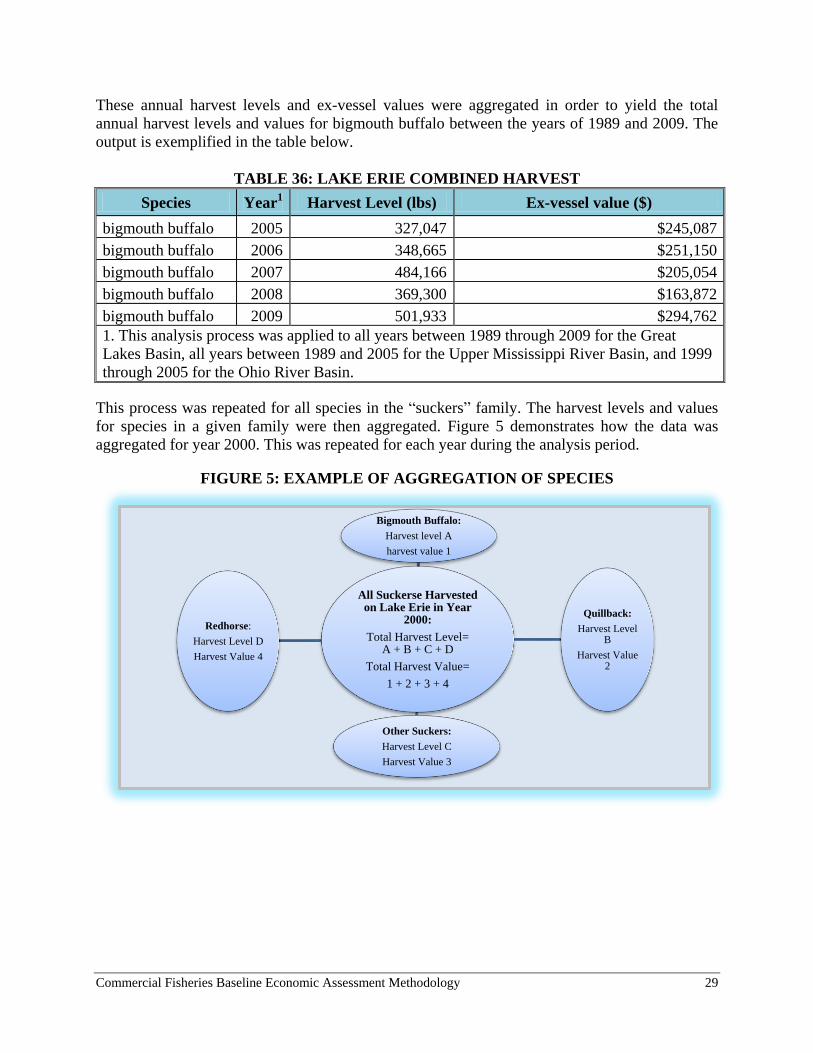
Commercial Fisheries Baseline Economic Assessment Methodology 29
These annual harvest levels and ex-vessel values were aggregated in order to yield the total
annual harvest levels and values for bigmouth buffalo between the years of 1989 and 2009. The
output is exemplified in the table below.
TABLE 36: LAKE ERIE COMBINED HARVEST
Species Year1 Harvest Level (lbs) Ex-vessel value ($)
bigmouth buffalo 2005 327,047 $245,087
bigmouth buffalo 2006 348,665 $251,150
bigmouth buffalo 2007 484,166 $205,054
bigmouth buffalo 2008 369,300 $163,872
bigmouth buffalo 2009 501,933 $294,762
1. This analysis process was applied to all years between 1989 through 2009 for the Great
Lakes Basin, all years between 1989 and 2005 for the Upper Mississippi River Basin, and 1999
through 2005 for the Ohio River Basin.
This process was repeated for all species in the “suckers” family. The harvest levels and values
for species in a given family were then aggregated. Figure 5 demonstrates how the data was
aggregated for year 2000. This was repeated for each year during the analysis period.
FIGURE 5: EXAMPLE OF AGGREGATION OF SPECIES
All Suckerse Harvested on Lake Erie in Year
2000:
Total Harvest Level= A + B + C + D
Total Harvest Value=
1 + 2 + 3 + 4
Bigmouth Buffalo:
Harvest level A
harvest value 1
Quillback:
Harvest Level B
Harvest Value 2
Other Suckers:
Harvest Level C
Harvest Value 3
Redhorse:
Harvest Level D
Harvest Value 4
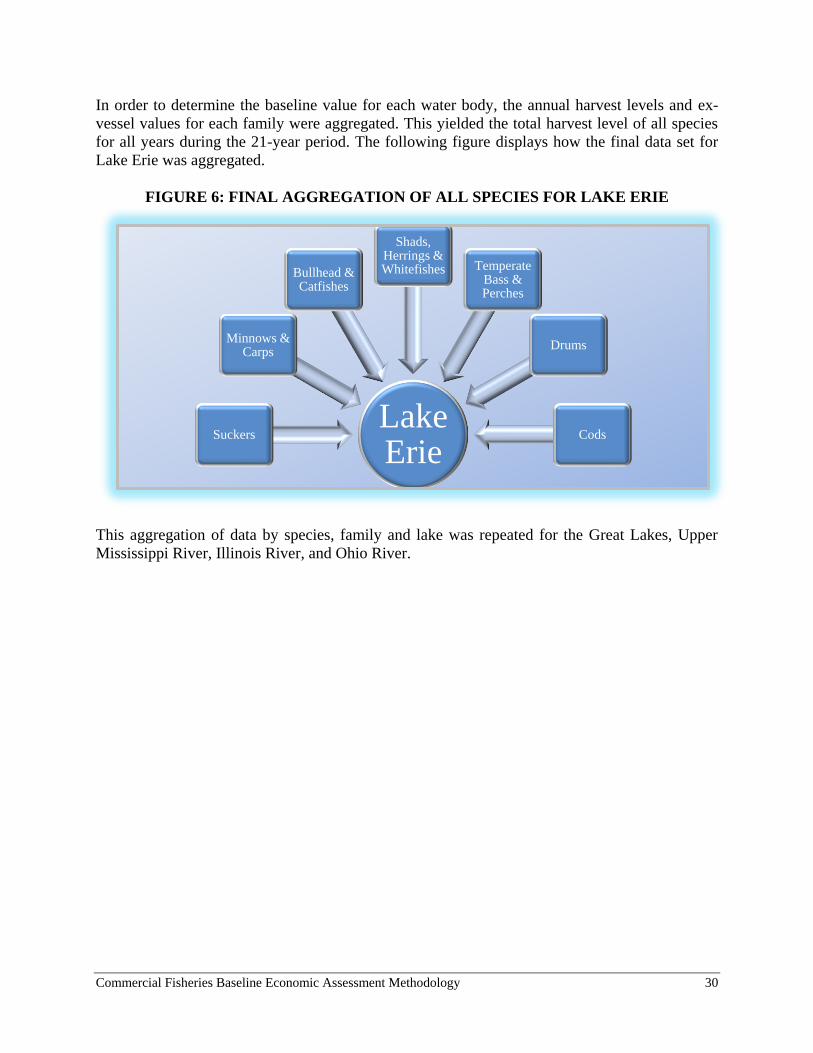
Commercial Fisheries Baseline Economic Assessment Methodology 30
In order to determine the baseline value for each water body, the annual harvest levels and ex-
vessel values for each family were aggregated. This yielded the total harvest level of all species
for all years during the 21-year period. The following figure displays how the final data set for
Lake Erie was aggregated.
FIGURE 6: FINAL AGGREGATION OF ALL SPECIES FOR LAKE ERIE
This aggregation of data by species, family and lake was repeated for the Great Lakes, Upper
Mississippi River, Illinois River, and Ohio River.
Lake Erie
Suckers
Minnows & Carps
Bullhead & Catfishes
Shads, Herrings & Whitefishes Temperate
Bass & Perches
Drums
Cods
Commercial Fisheries Baseline Economic Assessment Methodology 31
BASELINE VALUES
In order to determine the baseline value of the each of the water bodies in the Great Lakes and
Upper Mississippi River basins, the average harvest level and ex-vessel value were derived using
the most recent five years of harvest data. Note that the averages of harvest levels and ex-vessel
values for each water body were derived in order to present a more complete picture of recent
trends in commercial fishing harvests and values. Annual fluctuation in harvest levels and
associated ex-vessel values are apparent in the data. In order to ensure that the baselines best
reflect typical harvest levels, an average of the most recent five years of data was generated to
serve as baselines (current values) of the commercial fisheries in the Great Lakes, Upper
Mississippi River, and Ohio River Basins.
LAKE OR RIVER BASELINE VALUES
For instance, the baseline harvest level for Lake Erie (and each of the other water bodies in the
Great Lakes and Upper Mississippi River basins16
) was computed by taking the average of the
most recent five years of harvest level data. A five-year average was chosen in order to more
closely approximate current conditions and to account for any annual fluctuations. This equation
is shown below.
EQUATION 3: BASELINE HARVEST LEVEL
2009
Lake Erie Baseline Harvest Level= ( ∑ Harvest LevelY ) / 5
Y=2005
The baseline ex-vessel value for Lake Erie was computed by taking the average of the most
recent five years of ex-vessel value data17
. This equation is shown below.
EQUATION 4: BASELINE EX-VESSEL VALUE
2009
Lake Erie Baseline Ex-Vessel Value= ( ∑ Ex-Vessel ValueY ) / 5
Y=2005
BASIN BASELINE VALUES
In order to generate the baseline value of the entire Great Lakes basin, the annual harvest level
and ex-vessel value data for each water body were aggregated for each year during the analysis
period. The aggregation of the harvest data for each great lake yielded the total harvest levels and
ex-vessel values of the commercial fisheries in the Great Lakes basin. This is exemplified in
16 The water bodies analyzed in the Great Lakes basin include: Lake Erie, Lake Michigan, Lake
Superior, Lake Huron and Lake Ontario. The water bodies analyzed in the Upper Mississippi
River basin include: the Upper Mississippi River, the Illinois River and the Ohio River.
17 These values were normalized to 2010 values.
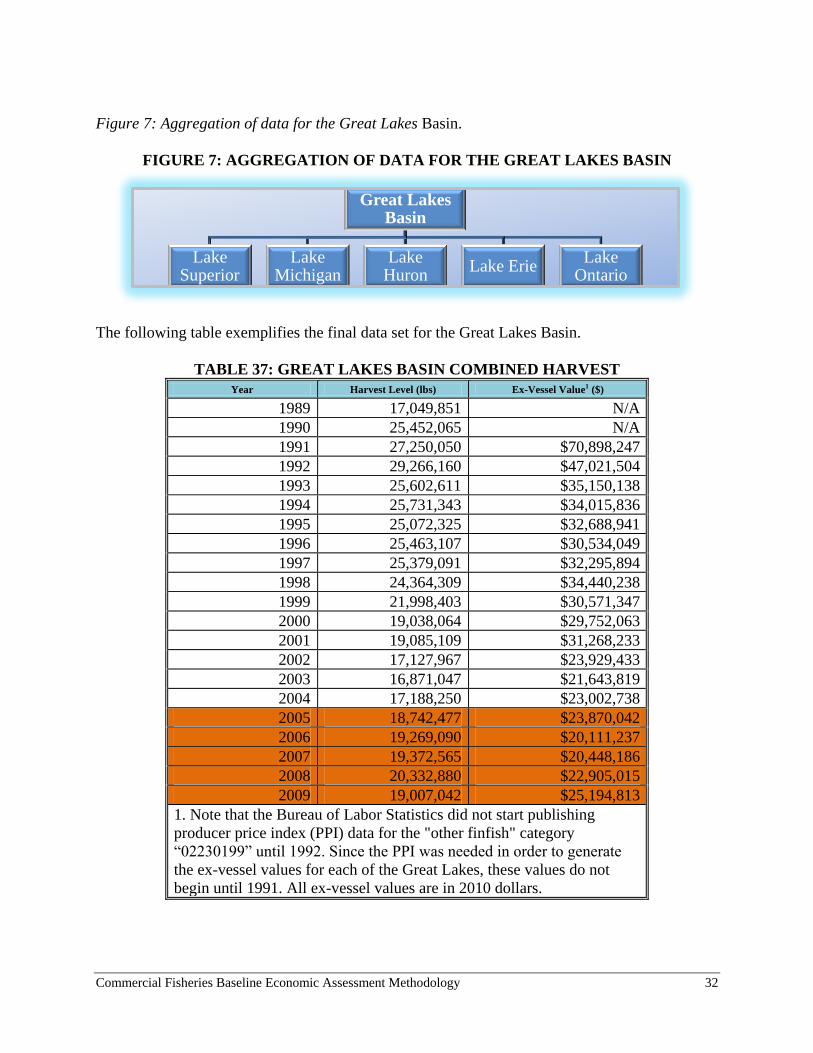
Commercial Fisheries Baseline Economic Assessment Methodology 32
Figure 7: Aggregation of data for the Great Lakes Basin.
FIGURE 7: AGGREGATION OF DATA FOR THE GREAT LAKES BASIN
The following table exemplifies the final data set for the Great Lakes Basin.
TABLE 37: GREAT LAKES BASIN COMBINED HARVEST
Year Harvest Level (lbs) Ex-Vessel Value1 ($)
1989 17,049,851 N/A
1990 25,452,065 N/A
1991 27,250,050 $70,898,247
1992 29,266,160 $47,021,504
1993 25,602,611 $35,150,138
1994 25,731,343 $34,015,836
1995 25,072,325 $32,688,941
1996 25,463,107 $30,534,049
1997 25,379,091 $32,295,894
1998 24,364,309 $34,440,238
1999 21,998,403 $30,571,347
2000 19,038,064 $29,752,063
2001 19,085,109 $31,268,233
2002 17,127,967 $23,929,433
2003 16,871,047 $21,643,819
2004 17,188,250 $23,002,738
2005 18,742,477 $23,870,042
2006 19,269,090 $20,111,237
2007 19,372,565 $20,448,186
2008 20,332,880 $22,905,015
2009 19,007,042 $25,194,813
1. Note that the Bureau of Labor Statistics did not start publishing
producer price index (PPI) data for the "other finfish" category
“02230199” until 1992. Since the PPI was needed in order to generate
the ex-vessel values for each of the Great Lakes, these values do not
begin until 1991. All ex-vessel values are in 2010 dollars.
Great Lakes Basin
Lake Superior
Lake Michigan
Lake Huron
Lake Erie Lake
Ontario
Commercial Fisheries Baseline Economic Assessment Methodology 33
Equation 3: Baseline Harvest Level and Equation 4: Baseline Ex-Vessel Value were utilized to
generate the baseline harvest levels and values for the Great Lakes basin. Note that these
equations utilize the most recent five years of harvest data (highlighted in orange in Table 37:
Great Lakes Basin Combined Harvest).
Similarly, the aggregation of the harvest data from each river in the Upper Mississippi and Ohio
River Basins yielded the total harvest levels and ex-vessel values of the commercial fisheries in
the Upper Mississippi River basin.