Embed Size (px)
Citation preview
Toll Roads│Indonesia│July 18, 2017
Company Note │ Alpha series
IMPORTANT DISCLOSURES, INCLUDING ANY REQUIRED RESEARCH CERTIFICATIONS, ARE PROVIDED AT THE END OF THIS REPORT. IF THIS REPORT IS DISTRIBUTED IN THE UNITED STATES IT IS DISTRIBUTED BY CIMB SECURITIES (USA), INC. AND IS CONSIDERED THIRD-PARTY AFFILIATED RESEARCH.
Powered by the EFA Platform
Jasa Marga King of the toll roads ■ JSMR is the oldest and best toll road proxy in the country, in our view. It is on track to
double the length of toll roads managed to 1,226km by FY20F (3-year CAGR of 20%). ■ We project revenue/core net profit CAGR of 16%/21% over FY16-26F. ■ We estimate its funding strategies would allow it to take on 31 toll road concessions
by FY20F, with manageable execution risk and strong government support. ■ At Rp61bn EV/km vs. weighted average replacement cost of Rp140bn/km and
weighted average portfolio IRR of 14%, we think JSMR is under appreciated. ■ We deem our new TP of Rp6,500 (based on 11.5x FY17F EV/EBITDA, historical 5-
year mean) attractive as it is below our DCF value estimate of Rp12,676/share. Add.
The oldest toll road operator is also the best JSMR became a pure toll road operator in 2005 with deregulation. Its toll road concessions total 1,260km (longest of all players), comprising 31 concessions (13 old, 18 new, Figure 18). At end-Apr 2017, it operated 600km of toll roads (660km under development), a c.60% market share, but by traffic volume, its market share was 80%. JSMR’s concessions comprise some of the most congested and mature toll roads, mostly around Greater Jakarta. It aims to own 2,000km of concessions by 2019F at the earliest.
To double toll roads by FY20F; 10-year core net profit CAGR of 21% We estimate JSMR will operate 210km of new toll roads in FY17F, 268km in FY18F and 112km in FY19F, implying 1,189km of total operational toll roads by FY19F (Figure 20). We project EBITDA/core net profit CAGRs of 26%/12% for FY16-19F, 20%/19% for FY16-21F and 13%/21% for FY16-26F. We expect earnings growth to accelerate in long term as toll roads mature and tariffs rise every two years. As most of the concessions would link with the most populous island of Java (c.60% of GDP), we believe growth visibility is strong.
High IRR concessions, with potential upside from linkages JSMR targets 14% average project IRR, which we believe is achievable as only three of its 31 toll road investments are located ex-Java. Java’s high population density, numerous manufacturing centres (more class 2-5 vehicles that pay higher tariffs) and high logistics costs suggest higher IRRs for toll roads in Java than outer islands. By 2019F, once Trans Java, Trans Sumatra and key seaports in Java, Sumatra, Kalimantan and Sulawesi are developed, we expect spike in traffic as linkages are formed.
Has a lot on its plate but sound funding strategies help JSMR expects to invest total Rp70tr-80tr (US$5bn-6bn, CIMBe: ~Rp76tr) in the 16 projects under development. If its plan to add 200km of new toll roads in FY17F materialises, we estimate additional capex of Rp41.8tr in FY17F. We expect capex/debt to peak in FY18F/FY20F. Although it has huge capex planned, we think JSMR’s sound funding strategies and government support would alleviate cash flow concerns. We also expect its cost of debt to fall in future, with its planned asset securitisation programme.
Underappreciated growth and value Our core EPS rises by 2-26% in FY17-19F, as we introduce new forecasts from transfer of analyst coverage. JSMR’s current share price of Rp5,275 (at 9.8x FY17F EV/EBITDA) is 25% below its FY15 peak, due to concerns about earnings pressure from its aggressive growth plan. Our higher TP of Rp6,500 is based on 11.5x FY17F EV/EBITDA (historical 5-year mean), which we deem attractive given our DCF value estimate (WACC: 9.6%, LTG: 0%) of Rp12,676/share. Risks: insufficient funding, delay in new project operations.
SOURCE: COMPANY DATA, CIMB FORECASTS
Financial Summary Dec-15A Dec-16A Dec-17F Dec-18F Dec-19F
Revenue (Rpb) 9,848 16,661 11,345 14,376 17,556
Operating EBITDA (Rpb) 4,334 5,275 6,202 6,946 8,469
Net Profit (Rpb) 1,466 1,889 2,563 2,468 2,603
Core EPS (Rp) 206.8 270.2 299.4 340.1 358.7
Core EPS Growth (0.6%) 30.7% 10.8% 13.6% 5.5%
FD Core P/E (x) 25.51 20.07 17.62 15.51 14.71
DPS (Rp) 43.13 43.38 55.58 68.41 72.15
Dividend Yield 0.82% 0.82% 1.05% 1.30% 1.37%
EV/EBITDA (x) 11.04 9.86 9.75 9.78 9.04
P/FCFE (x) NA 543.9 NA NA NA
Net Gearing 102% 128% 104% 99% 108%
P/BV (x) 3.44 2.80 2.42 2.15 1.92
ROE 14.1% 15.3% 14.7% 14.7% 13.8%
% Change In Core EPS Estimates 2.2% 14.8% 25.6%
CIMB/consensus EPS (x) 1.34 1.20 1.23
Indonesia
ADD (no change) Consensus ratings*: Buy 17 Hold 5 Sell 1
Current price: Rp5,275
Target price: Rp6,500
Previous target: Rp5,800
Up/downside: 23.2%
CIMB / Consensus: 11.3%
Reuters: JSMR.JK
Bloomberg: JSMR IJ
Market cap: US$2,873m
Rp38,285,272m
Average daily turnover: US$2.78m
Rp37,028m
Current shares o/s: 7,258m
Free float: 30.0% *Source: Bloomberg
Key changes in this note
FY17F core EPS increased by 2%.
FY18F core EPS increased by 15%.
FY19F core EPS increased by 26%.
Source: Bloomberg
Price performance 1M 3M 12M
Absolute (%) 2.4 14.4 -5
Relative (%) 0.3 9.7 -19.3
Major shareholders % held Government of Indonesia 70.0
Analyst(s)
Aurelia BARUS
T (62) 21 3006 1721 E [email protected]
66.0
74.0
82.0
90.0
98.0
106.0
3,700
4,200
4,700
5,200
5,700
6,200
Price Close Relative to JCI (RHS)
20
40
60
80
Jul-16 Oct-16 Jan-17 Apr-17
Vol m
Toll Roads│Indonesia│Jasa Marga│July 18, 2017
2
King of the toll roads
BACKGROUND
The oldest toll road operator in Indonesia
Based on Government Regulation No.4/1978 on Capital Investment of the Republic of Indonesia, the government of Indonesia established PT Jasa Marga (JSMR) on 1 Mar 1978. In 1978, JSMR operated the first toll road in Indonesia, Jakarta-Bogor-Ciawi (Jagorawi), the construction of which was funded by the state budget and foreign loan taken by the government. Subsequently, the Jagorawi toll road asset was handed over to JSMR through equity injection.
In 1980, with the issuance of Road Law No.3/1980, it was assigned the role of Indonesia’s toll road operator, and its key functions were to plan, build, operate, and maintain toll road facilities. This was to avoid over burdening the state budget with sizeable toll road investments. Until 1987, it was the only toll road operator in Indonesia. The development of toll roads was financed by the government of Indonesia via foreign loans and bond issuances by JSMR. The toll roads included Semarang toll road, Jakarta-Tangerang toll road, Prof. Dr. Ir. Sedyatmo toll road, Surabaya-Gempol toll road, and Belawan-Medan-Tanjung Morawa (Belmera) toll road.
By the end of 1980s, the government of Indonesia started to invite private entities to participate in toll road investment and development through a build, operate and transfer (BOT) scheme. As such, in 1990s, JSMR had a dual role as a toll road operator and the toll road authority, and gave out concession rights to private investors. During the financial crisis in 1998, most of the private toll road investors failed to realise their projects. Based on the prevailing rules and regulations at the time, JSMR, as the toll road authority, took over some of the concession rights, including those for Jakarta Outer Ring Road (JORR) and Cikampek-Purwakarta-Padalarang (Cipularang).
Deregulation turned JSMR into pure toll road operator in 2004
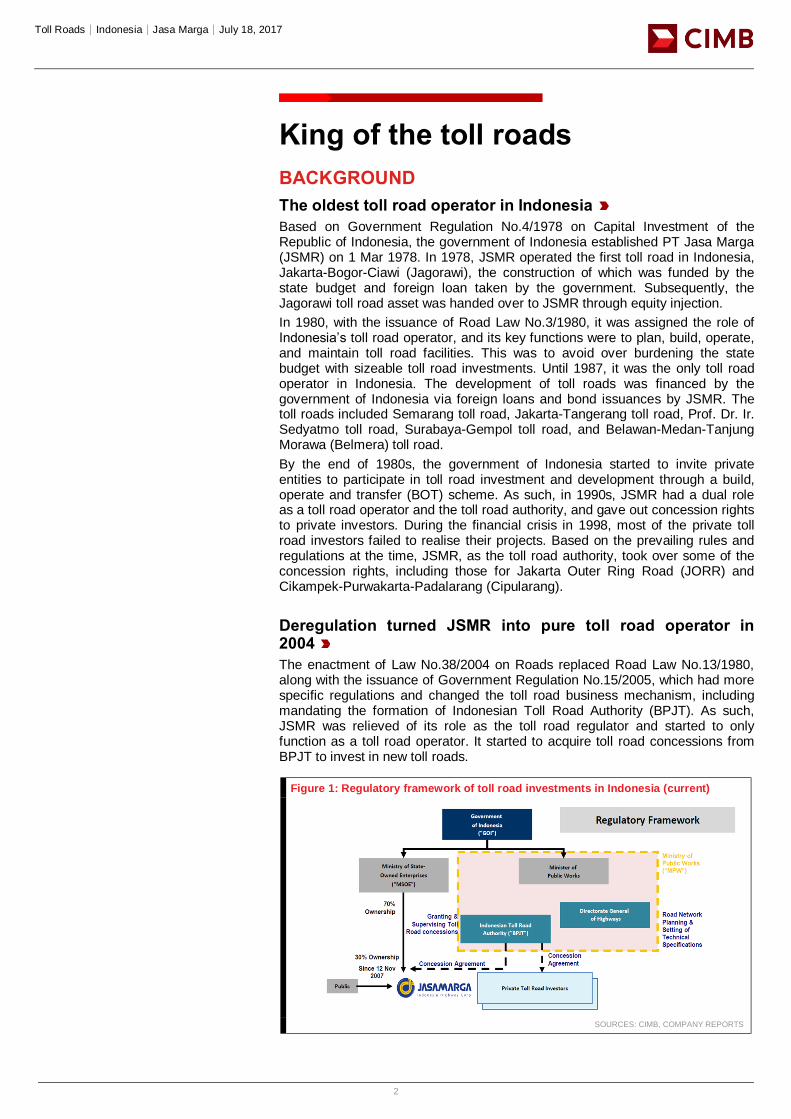
The enactment of Law No.38/2004 on Roads replaced Road Law No.13/1980, along with the issuance of Government Regulation No.15/2005, which had more specific regulations and changed the toll road business mechanism, including mandating the formation of Indonesian Toll Road Authority (BPJT). As such, JSMR was relieved of its role as the toll road regulator and started to only function as a toll road operator. It started to acquire toll road concessions from BPJT to invest in new toll roads.
Figure 1: Regulatory framework of toll road investments in Indonesia (current)
SOURCES: CIMB, COMPANY REPORTS
Toll Roads│Indonesia│Jasa Marga│July 18, 2017
3
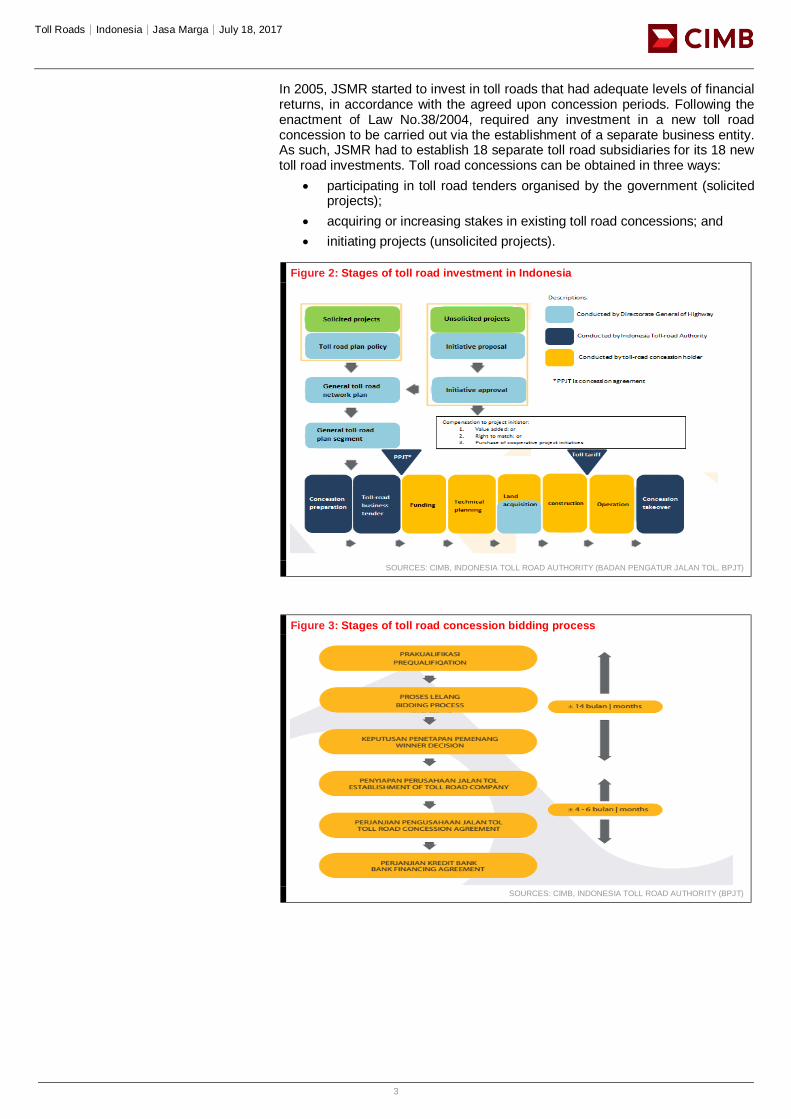
In 2005, JSMR started to invest in toll roads that had adequate levels of financial returns, in accordance with the agreed upon concession periods. Following the enactment of Law No.38/2004, required any investment in a new toll road concession to be carried out via the establishment of a separate business entity. As such, JSMR had to establish 18 separate toll road subsidiaries for its 18 new toll road investments. Toll road concessions can be obtained in three ways:
participating in toll road tenders organised by the government (solicited projects);
acquiring or increasing stakes in existing toll road concessions; and
initiating projects (unsolicited projects).
Figure 2: Stages of toll road investment in Indonesia
SOURCES: CIMB, INDONESIA TOLL ROAD AUTHORITY (BADAN PENGATUR JALAN TOL, BPJT)
Figure 3: Stages of toll road concession bidding process
SOURCES: CIMB, INDONESIA TOLL ROAD AUTHORITY (BPJT)
Toll Roads│Indonesia│Jasa Marga│July 18, 2017
4
Shareholding structure
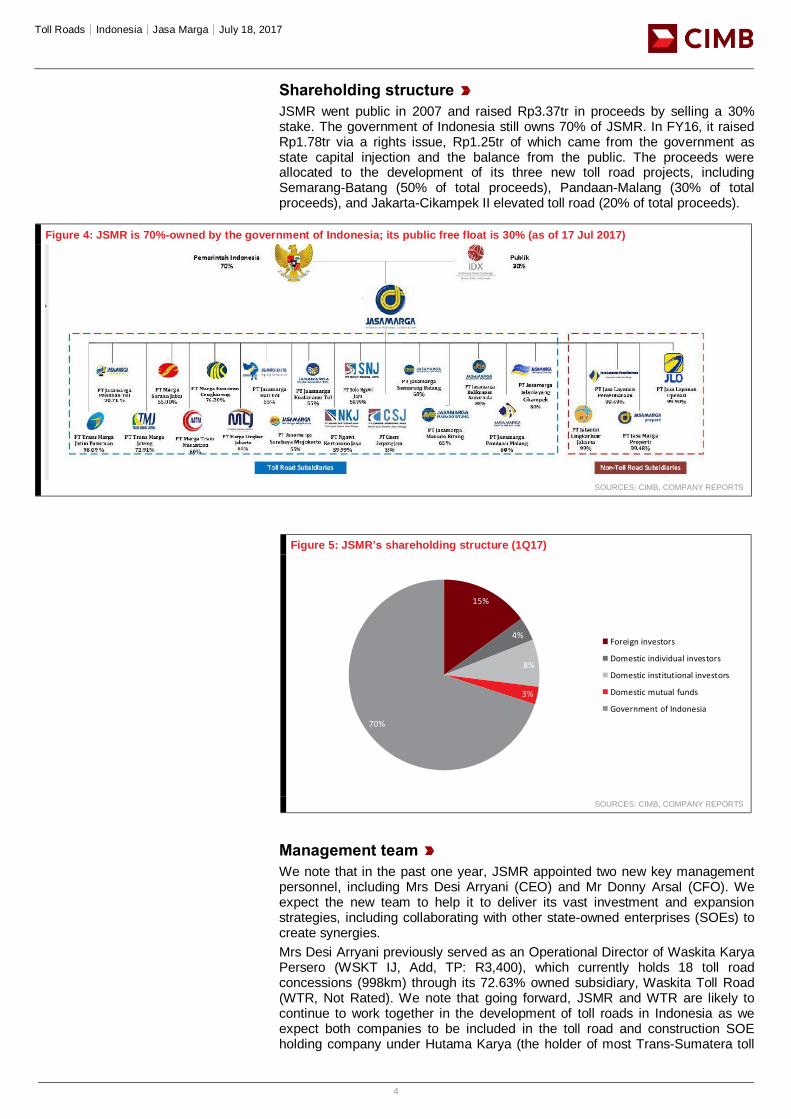
JSMR went public in 2007 and raised Rp3.37tr in proceeds by selling a 30% stake. The government of Indonesia still owns 70% of JSMR. In FY16, it raised Rp1.78tr via a rights issue, Rp1.25tr of which came from the government as state capital injection and the balance from the public. The proceeds were allocated to the development of its three new toll road projects, including Semarang-Batang (50% of total proceeds), Pandaan-Malang (30% of total proceeds), and Jakarta-Cikampek II elevated toll road (20% of total proceeds).
Figure 4: JSMR is 70%-owned by the government of Indonesia; its public free float is 30% (as of 17 Jul 2017)
SOURCES: CIMB, COMPANY REPORTS
Figure 5: JSMR’s shareholding structure (1Q17)
SOURCES: CIMB, COMPANY REPORTS
Management team
We note that in the past one year, JSMR appointed two new key management personnel, including Mrs Desi Arryani (CEO) and Mr Donny Arsal (CFO). We expect the new team to help it to deliver its vast investment and expansion strategies, including collaborating with other state-owned enterprises (SOEs) to create synergies.
Mrs Desi Arryani previously served as an Operational Director of Waskita Karya Persero (WSKT IJ, Add, TP: R3,400), which currently holds 18 toll road concessions (998km) through its 72.63% owned subsidiary, Waskita Toll Road (WTR, Not Rated). We note that going forward, JSMR and WTR are likely to continue to work together in the development of toll roads in Indonesia as we expect both companies to be included in the toll road and construction SOE holding company under Hutama Karya (the holder of most Trans-Sumatera toll
Title:
Source:
Please fill in the values above to have them entered in your report15%
4%
8%
3%
70%
Foreign investors
Domestic individual investors
Domestic institutional investors
Domestic mutual funds
Government of Indonesia
Toll Roads│Indonesia│Jasa Marga│July 18, 2017
5
road concessions). To see further details on the SOE holding formation, please refer to our note “Road to SOE holding companies” dated 7 Feb 2017.
Mr Donny Arsal was Head of Investment Banking for Mandiri Sekuritas (Unlisted, one of the largest SOE securities firms in Indonesia) in 2010-2017, after having served the company since 2003. As such, we believe his vast experience in the financial industry would help JSMR meet its immense funding requirements. We will discuss further details on JSMR’s funding needs in the section “Funding strategies” on pages 18-25 of this report.
Figure 6: JSMR's Board of Directors
SOURCES: CIMB, COMPANY REPORTS
INDUSTRY OVERVIEW
Importance of toll road developments in Indonesia
Fourth most populous country in the world
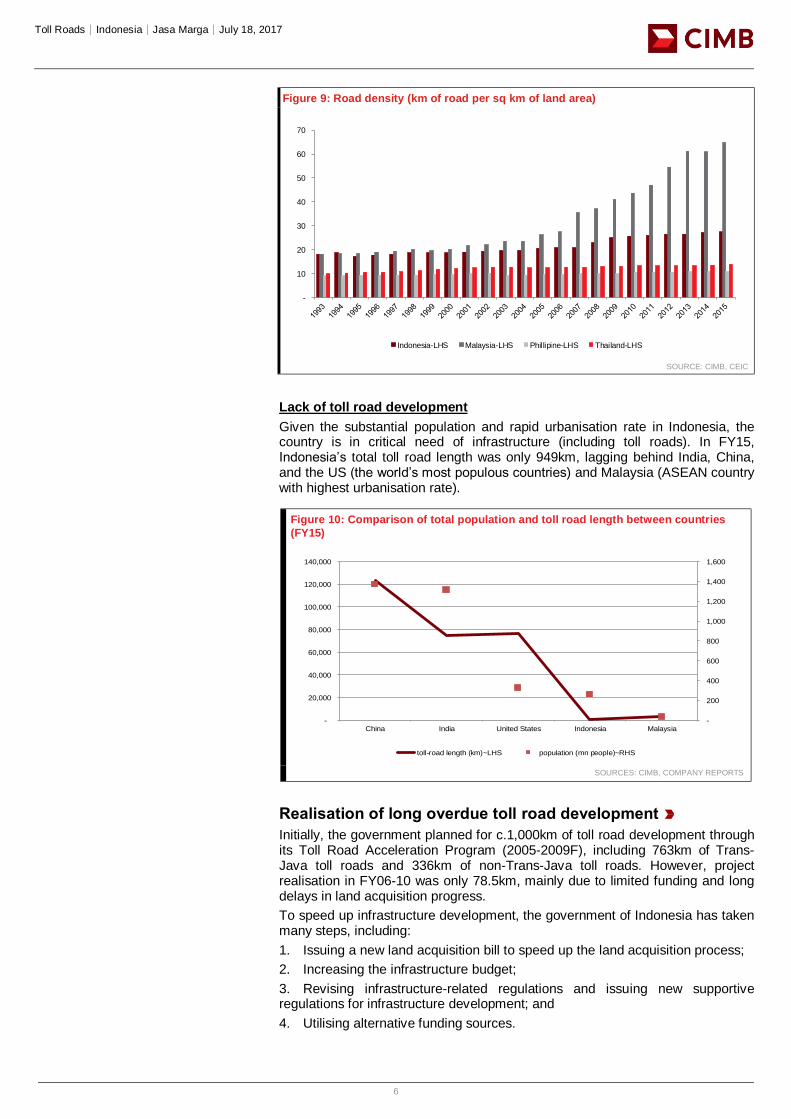
In FY15, Indonesia’s population stood at 258m, making it the fourth most populous country in the world, after China, the US, and India. In ASEAN, Indonesia has the highest population (1960-2015).
Figure 7: Indonesia is the 4th most populous country in the
world (2015)
Figure 8: Indonesia is the most populous country in ASEAN
(1960-2015)
SOURCES: CIMB, WORLD BANK SOURCES: CIMB, WORLD BANK
Rapid urbanisation rate
According to PWC data, Indonesia’s urbanisation rate in FY14 was 51.4% or second-highest among the ASEAN countries after Malaysia’s 73.4%. Indonesia’s Central Bureau of Statistics (BPS) projects that the country’s urbanisation rate will rise to 56.7% in FY20F and 66.6% in FY35F.
According to the World Bank, Indonesia only registered 4% GDP growth per capita for every 1% pt growth in urbanisation rate due to lack of infrastructure. Meanwhile, other Asian countries saw larger benefits from urbanisation. For instance, every 1% pt growth in urbanisation rate led to 13% GDP growth per capita in India, 10% GDP growth in China, and 7% GDP growth in Thailand.
Names Positions
Desi Arryani President DirectorBorn in 1962. Joined JSMR in 2016. Previous experience: Operational Director I of PT Waskita Karya (2013-2016);
Operational Director II of PT Waskita Karya (2011-2012).
Donny Arsal Finance Director
Born in 1970. Joined JSMR in 2017. Previous experience: Director-Head of Investment Banking of PT Mandiri Sekuritas
(2010-2017); Associate Director of PT Mandiri Sekuritas (2004-2010); Assistant Vice President of PT Mandiri Sekuritas
(2003).
Mohammad Sofyan Operational Director IBorn in 1971. Previous experience: Corporate Secretary of JSMR (2015-2017); VP of Corporate Planning of JSMR (2012-
2015); Division Head of Monitoring and Evaluation of JSMR (2010-2012).
Subakti Syukur Operational Director IIBorn in 1962. Previous experience: President Director of Marga Lingkar Jakarta (2014-2016); General Manager of
Cawang-Tomang-Cengkareng (2013-2014).
Hasanudin Development DirectorBorn in 1963. Previous experience: Division Head of Maintenance (2006-2012); Commisioner of PT Marga Mandala Sakti
(2008-2010; and Project Head of Cipularang Cipularang toll-road development (2004-2005).
Kushartanto KoeswirantoHuman Resources and
General Director
Born in 24 Apr 1961. Previous experience: President Director of Ktalents Asia (2016-2017); HR Group Director of Agung
Podomoro Group (2010-2015); HR and Business Support Director of Lotte Shopping Indonesia (2007-2010); Country
Director of Operations and HR of Watson-Hutchinson, Group HR Director of PT Mitra Adiperkasa; HR Director of Hero
(Dairy Farm International subsidiary), Coca-Cola Amatil Indonesia, and PT BAT Indonesia Tbk.
Title:
Source:
Please fill in the values above to have them entered in your report
-
200,000,000
400,000,000
600,000,000
800,000,000
1,000,000,000
1,200,000,000
1,400,000,000
1,600,000,000
1960
1962
1964
1966
1968
1970
1972
1974
1976
1978
1980
1982
1984
1986
1988
1990
1992
1994
1996
1998
2000
2002
2004
2006
2008
2010
2012
2014
China India United States Indonesia
Title:
Source:
Please fill in the values above to have them entered in your report
-
50,000,000
100,000,000
150,000,000
200,000,000
250,000,000
300,000,000
1960
1962
1964
1966
1968
1970
1972
1974
1976
1978
1980
1982
1984
1986
1988
1990
1992
1994
1996
1998
2000
2002
2004
2006
2008
2010
2012
2014
Indonesia Malaysia Thailand
Myanmar Singapore Cambodia
Lao PDR Philippines Vietnam
Brunei Darussalam
Toll Roads│Indonesia│Jasa Marga│July 18, 2017
6
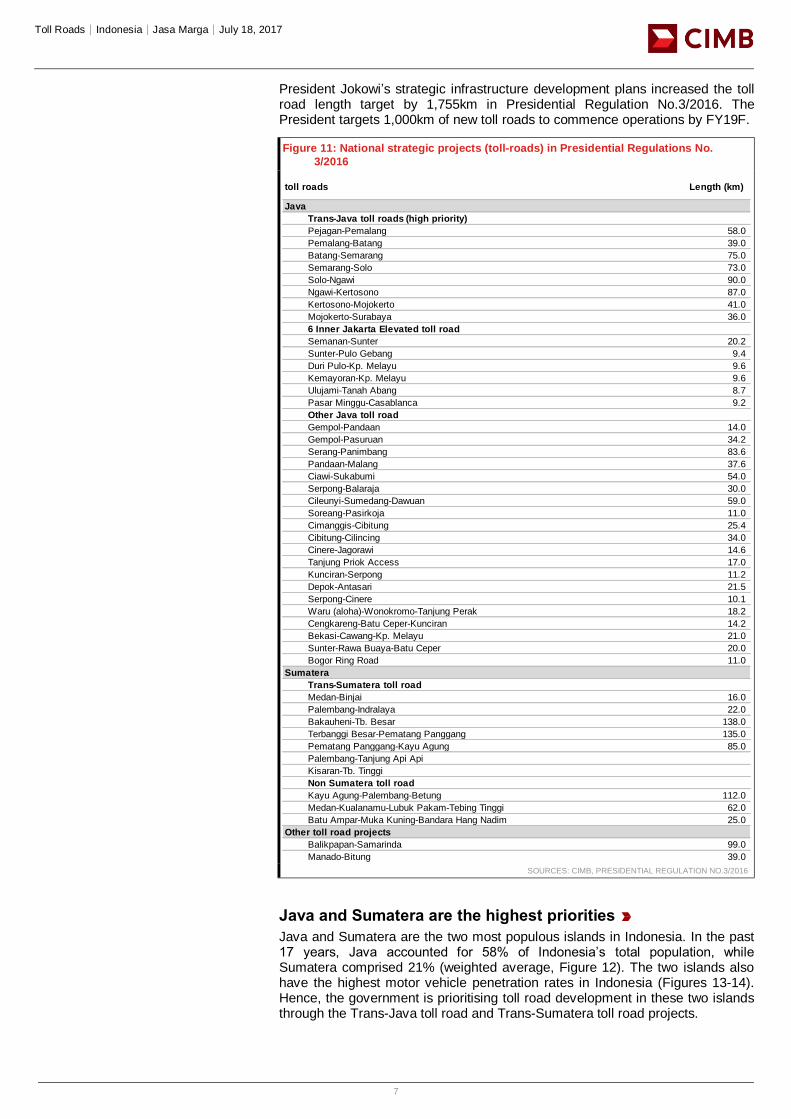
Figure 9: Road density (km of road per sq km of land area)
SOURCE: CIMB, CEIC
Lack of toll road development
Given the substantial population and rapid urbanisation rate in Indonesia, the country is in critical need of infrastructure (including toll roads). In FY15, Indonesia’s total toll road length was only 949km, lagging behind India, China, and the US (the world’s most populous countries) and Malaysia (ASEAN country with highest urbanisation rate).
Figure 10: Comparison of total population and toll road length between countries
(FY15)
SOURCES: CIMB, COMPANY REPORTS
Realisation of long overdue toll road development
Initially, the government planned for c.1,000km of toll road development through its Toll Road Acceleration Program (2005-2009F), including 763km of Trans-Java toll roads and 336km of non-Trans-Java toll roads. However, project realisation in FY06-10 was only 78.5km, mainly due to limited funding and long delays in land acquisition progress.
To speed up infrastructure development, the government of Indonesia has taken many steps, including:
1. Issuing a new land acquisition bill to speed up the land acquisition process;
2. Increasing the infrastructure budget;
3. Revising infrastructure-related regulations and issuing new supportive regulations for infrastructure development; and
4. Utilising alternative funding sources.
Title:
Source:
Please fill in the values above to have them entered in your report
-
10
20
30
40
50
60
70
Indonesia-LHS Malaysia-LHS Phillipine-LHS Thailand-LHS
Title:
Source:
Please fill in the values above to have them entered in your report
-
200
400
600
800
1,000
1,200
1,400
1,600
-
20,000
40,000
60,000
80,000
100,000
120,000
140,000
China India United States Indonesia Malaysia
toll-road length (km)~LHS population (mn people)~RHS
Toll Roads│Indonesia│Jasa Marga│July 18, 2017
7
President Jokowi’s strategic infrastructure development plans increased the toll road length target by 1,755km in Presidential Regulation No.3/2016. The President targets 1,000km of new toll roads to commence operations by FY19F.
Figure 11: National strategic projects (toll-roads) in Presidential Regulations No.
3/2016
SOURCES: CIMB, PRESIDENTIAL REGULATION NO.3/2016
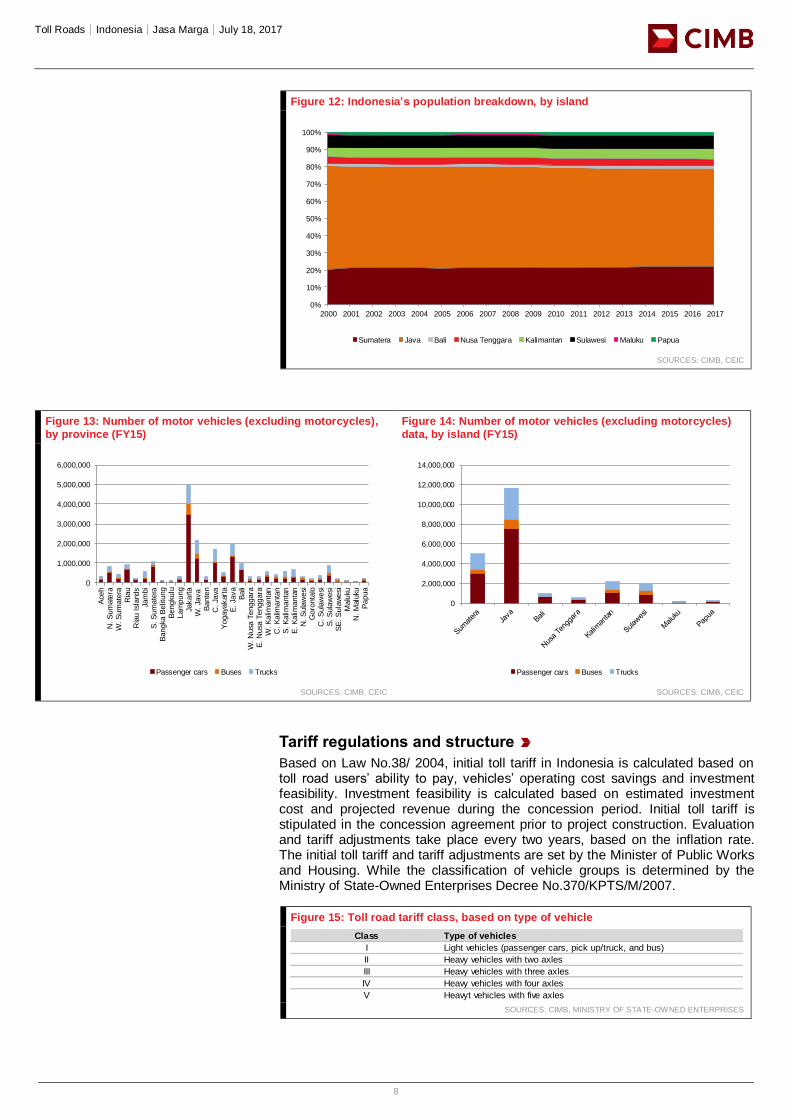
Java and Sumatera are the highest priorities
Java and Sumatera are the two most populous islands in Indonesia. In the past 17 years, Java accounted for 58% of Indonesia’s total population, while Sumatera comprised 21% (weighted average, Figure 12). The two islands also have the highest motor vehicle penetration rates in Indonesia (Figures 13-14). Hence, the government is prioritising toll road development in these two islands through the Trans-Java toll road and Trans-Sumatera toll road projects.
Length (km)
Java
Trans-Java toll roads (high priority)
Pejagan-Pemalang 58.0
Pemalang-Batang 39.0
Batang-Semarang 75.0
Semarang-Solo 73.0
Solo-Ngawi 90.0
Ngawi-Kertosono 87.0
Kertosono-Mojokerto 41.0
Mojokerto-Surabaya 36.0
6 Inner Jakarta Elevated toll road
Semanan-Sunter 20.2
Sunter-Pulo Gebang 9.4
Duri Pulo-Kp. Melayu 9.6
Kemayoran-Kp. Melayu 9.6
Ulujami-Tanah Abang 8.7
Pasar Minggu-Casablanca 9.2
Other Java toll road
Gempol-Pandaan 14.0
Gempol-Pasuruan 34.2
Serang-Panimbang 83.6
Pandaan-Malang 37.6
Ciawi-Sukabumi 54.0
Serpong-Balaraja 30.0
Cileunyi-Sumedang-Dawuan 59.0
Soreang-Pasirkoja 11.0
Cimanggis-Cibitung 25.4
Cibitung-Cilincing 34.0
Cinere-Jagorawi 14.6
Tanjung Priok Access 17.0
Kunciran-Serpong 11.2
Depok-Antasari 21.5
Serpong-Cinere 10.1
Waru (aloha)-Wonokromo-Tanjung Perak 18.2
Cengkareng-Batu Ceper-Kunciran 14.2
Bekasi-Cawang-Kp. Melayu 21.0
Sunter-Rawa Buaya-Batu Ceper 20.0
Bogor Ring Road 11.0
Sumatera
Trans-Sumatera toll road
Medan-Binjai 16.0
Palembang-Indralaya 22.0
Bakauheni-Tb. Besar 138.0
Terbanggi Besar-Pematang Panggang 135.0
Pematang Panggang-Kayu Agung 85.0
Palembang-Tanjung Api Api
Kisaran-Tb. Tinggi
Non Sumatera toll road
Kayu Agung-Palembang-Betung 112.0
Medan-Kualanamu-Lubuk Pakam-Tebing Tinggi 62.0
Batu Ampar-Muka Kuning-Bandara Hang Nadim 25.0
Other toll road projects
Balikpapan-Samarinda 99.0
Manado-Bitung 39.0
toll roads
Toll Roads│Indonesia│Jasa Marga│July 18, 2017
8
Figure 12: Indonesia’s population breakdown, by island
SOURCES: CIMB, CEIC
Figure 13: Number of motor vehicles (excluding motorcycles), by province (FY15)
Figure 14: Number of motor vehicles (excluding motorcycles) data, by island (FY15)
SOURCES: CIMB, CEIC SOURCES: CIMB, CEIC
Tariff regulations and structure
Based on Law No.38/ 2004, initial toll tariff in Indonesia is calculated based on toll road users’ ability to pay, vehicles’ operating cost savings and investment feasibility. Investment feasibility is calculated based on estimated investment cost and projected revenue during the concession period. Initial toll tariff is stipulated in the concession agreement prior to project construction. Evaluation and tariff adjustments take place every two years, based on the inflation rate. The initial toll tariff and tariff adjustments are set by the Minister of Public Works and Housing. While the classification of vehicle groups is determined by the Ministry of State-Owned Enterprises Decree No.370/KPTS/M/2007.
Figure 15: Toll road tariff class, based on type of vehicle
SOURCES: CIMB, MINISTRY OF STATE-OWNED ENTERPRISES
Title:
Source:
Please fill in the values above to have them entered in your report
0%
10%
20%
30%
40%
50%
60%
70%
80%
90%
100%
2000 2001 2002 2003 2004 2005 2006 2007 2008 2009 2010 2011 2012 2013 2014 2015 2016 2017
Sumatera Java Bali Nusa Tenggara Kalimantan Sulawesi Maluku Papua
Title:
Source:
Please fill in the values above to have them entered in your report
0
1,000,000
2,000,000
3,000,000
4,000,000
5,000,000
6,000,000
Ace
hN
. S
um
ate
raW
. S
um
ate
raR
iau
Ria
u Isl
and
sJa
mbi
S. S
um
ate
raB
angka
Belit
ung
Bengku
luLam
pung
Jakarta
W. Ja
va
Bante
nC
. Ja
vaY
ogaya
kar
taE
. Ja
va
Bali
W. N
usa
Tenggara
E. N
usa
Tenggara
W. K
alim
anta
nC
. K
alim
anta
nS
. K
alim
anta
nE
. K
alim
anta
nN
. S
ula
wesi
Goro
nta
loC
. S
ula
wesi
S. S
ula
wesi
SE
. S
ula
wesi
Malu
kuN
. M
aluku
Papua
Passenger cars Buses Trucks
Title:
Source:
Please fill in the values above to have them entered in your report
0
2,000,000
4,000,000
6,000,000
8,000,000
10,000,000
12,000,000
14,000,000
Passenger cars Buses Trucks
Class Type of vehicles
I Light vehicles (passenger cars, pick up/truck, and bus)
II Heavy vehicles with two axles
III Heavy vehicles with three axles
IV Heavy vehicles with four axles
V Heavyt vehicles with five axles
Toll Roads│Indonesia│Jasa Marga│July 18, 2017
9
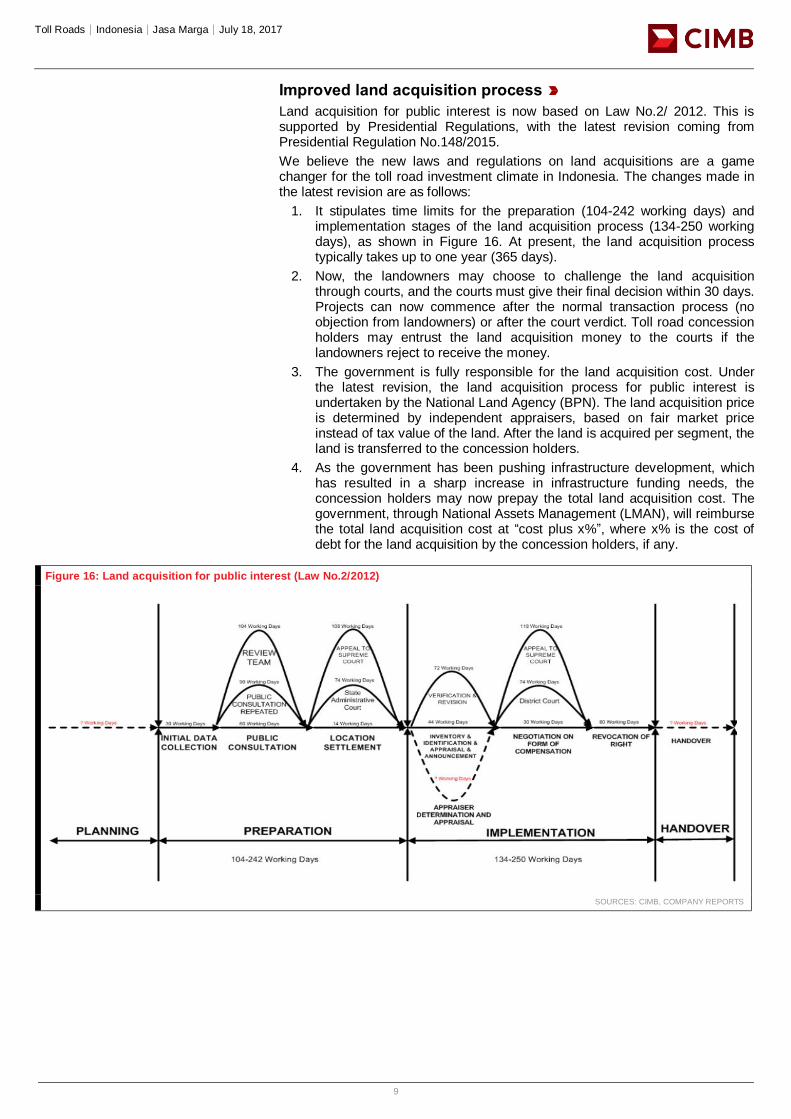
Improved land acquisition process
Land acquisition for public interest is now based on Law No.2/ 2012. This is supported by Presidential Regulations, with the latest revision coming from Presidential Regulation No.148/2015.
We believe the new laws and regulations on land acquisitions are a game changer for the toll road investment climate in Indonesia. The changes made in the latest revision are as follows:
1. It stipulates time limits for the preparation (104-242 working days) and implementation stages of the land acquisition process (134-250 working days), as shown in Figure 16. At present, the land acquisition process typically takes up to one year (365 days).
2. Now, the landowners may choose to challenge the land acquisition through courts, and the courts must give their final decision within 30 days. Projects can now commence after the normal transaction process (no objection from landowners) or after the court verdict. Toll road concession holders may entrust the land acquisition money to the courts if the landowners reject to receive the money.
3. The government is fully responsible for the land acquisition cost. Under the latest revision, the land acquisition process for public interest is undertaken by the National Land Agency (BPN). The land acquisition price is determined by independent appraisers, based on fair market price instead of tax value of the land. After the land is acquired per segment, the land is transferred to the concession holders.
4. As the government has been pushing infrastructure development, which has resulted in a sharp increase in infrastructure funding needs, the concession holders may now prepay the total land acquisition cost. The government, through National Assets Management (LMAN), will reimburse the total land acquisition cost at “cost plus x%”, where x% is the cost of debt for the land acquisition by the concession holders, if any.
Figure 16: Land acquisition for public interest (Law No.2/2012)
SOURCES: CIMB, COMPANY REPORTS
Toll Roads│Indonesia│Jasa Marga│July 18, 2017
10
LEADING TOLL ROAD OPERATOR IN INDONESIA
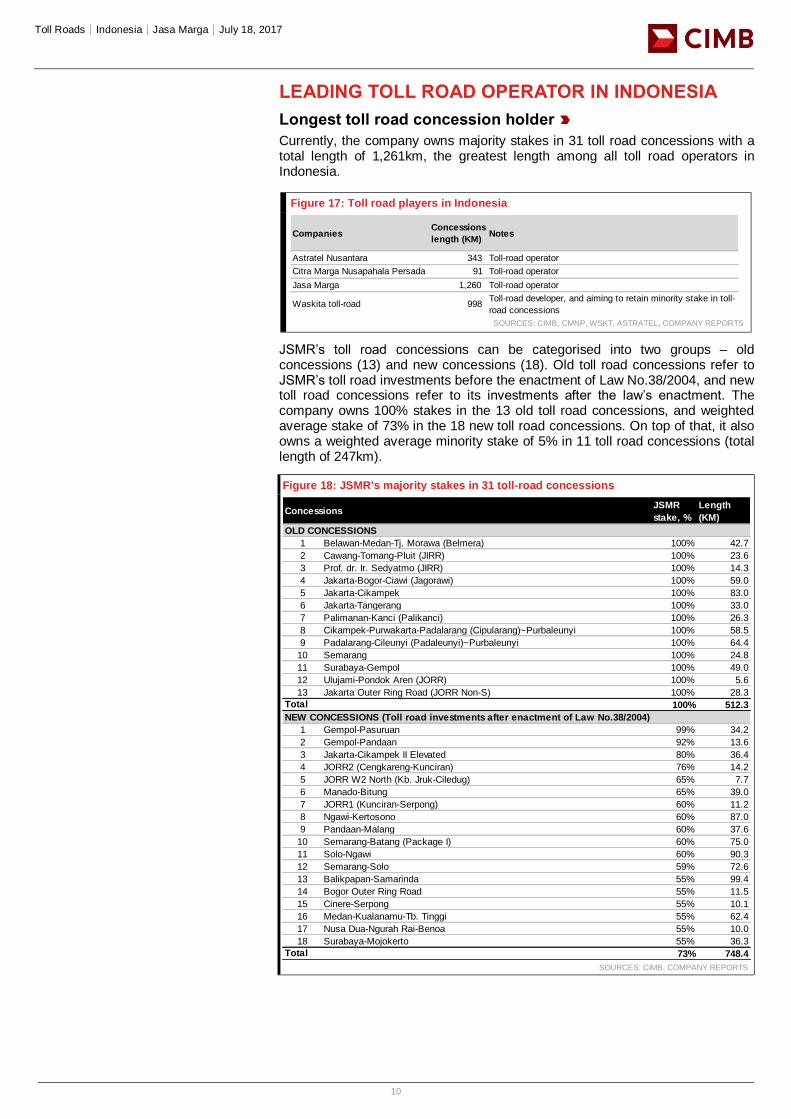
Longest toll road concession holder
Currently, the company owns majority stakes in 31 toll road concessions with a total length of 1,261km, the greatest length among all toll road operators in Indonesia.
Figure 17: Toll road players in Indonesia
SOURCES: CIMB, CMNP, WSKT, ASTRATEL, COMPANY REPORTS
JSMR’s toll road concessions can be categorised into two groups – old concessions (13) and new concessions (18). Old toll road concessions refer to JSMR’s toll road investments before the enactment of Law No.38/2004, and new toll road concessions refer to its investments after the law’s enactment. The company owns 100% stakes in the 13 old toll road concessions, and weighted average stake of 73% in the 18 new toll road concessions. On top of that, it also owns a weighted average minority stake of 5% in 11 toll road concessions (total length of 247km).
Figure 18: JSMR's majority stakes in 31 toll-road concessions
SOURCES: CIMB, COMPANY REPORTS
CompaniesConcessions
length (KM)Notes
Astratel Nusantara 343 Toll-road operator
Citra Marga Nusapahala Persada 91 Toll-road operator
Jasa Marga 1,260 Toll-road operator
Waskita toll-road 998 Toll-road developer, and aiming to retain minority stake in toll-
road concessions
JSMR
stake, %
Length
(KM)
OLD CONCESSIONS
1 Belawan-Medan-Tj. Morawa (Belmera) 100% 42.7
2 Cawang-Tomang-Pluit (JIRR) 100% 23.6
3 Prof. dr. Ir. Sedyatmo (JIRR) 100% 14.3
4 Jakarta-Bogor-Ciawi (Jagorawi) 100% 59.0
5 Jakarta-Cikampek 100% 83.0
6 Jakarta-Tangerang 100% 33.0
7 Palimanan-Kanci (Palikanci) 100% 26.3
8 Cikampek-Purwakarta-Padalarang (Cipularang)~Purbaleunyi 100% 58.5
9 Padalarang-Cileunyi (Padaleunyi)~Purbaleunyi 100% 64.4
10 Semarang 100% 24.8
11 Surabaya-Gempol 100% 49.0
12 Ulujami-Pondok Aren (JORR) 100% 5.6
13 Jakarta Outer Ring Road (JORR Non-S) 100% 28.3
100% 512.3
NEW CONCESSIONS (Toll road investments after enactment of Law No.38/2004)
1 Gempol-Pasuruan 99% 34.2
2 Gempol-Pandaan 92% 13.6
3 Jakarta-Cikampek II Elevated 80% 36.4
4 JORR2 (Cengkareng-Kunciran) 76% 14.2
5 JORR W2 North (Kb. Jruk-Ciledug) 65% 7.7
6 Manado-Bitung 65% 39.0
7 JORR1 (Kunciran-Serpong) 60% 11.2
8 Ngawi-Kertosono 60% 87.0
9 Pandaan-Malang 60% 37.6
10 Semarang-Batang (Package I) 60% 75.0
11 Solo-Ngawi 60% 90.3
12 Semarang-Solo 59% 72.6
13 Balikpapan-Samarinda 55% 99.4
14 Bogor Outer Ring Road 55% 11.5
15 Cinere-Serpong 55% 10.1
16 Medan-Kualanamu-Tb. Tinggi 55% 62.4
17 Nusa Dua-Ngurah Rai-Benoa 55% 10.0
18 Surabaya-Mojokerto 55% 36.3
73% 748.4
Total
Total
Concessions
Toll Roads│Indonesia│Jasa Marga│July 18, 2017
11
Figure 19: JSMR's minority stakes in 11 toll-road concessions
SOURCES: CIMB, COMPANY REPORTS
Largest market share
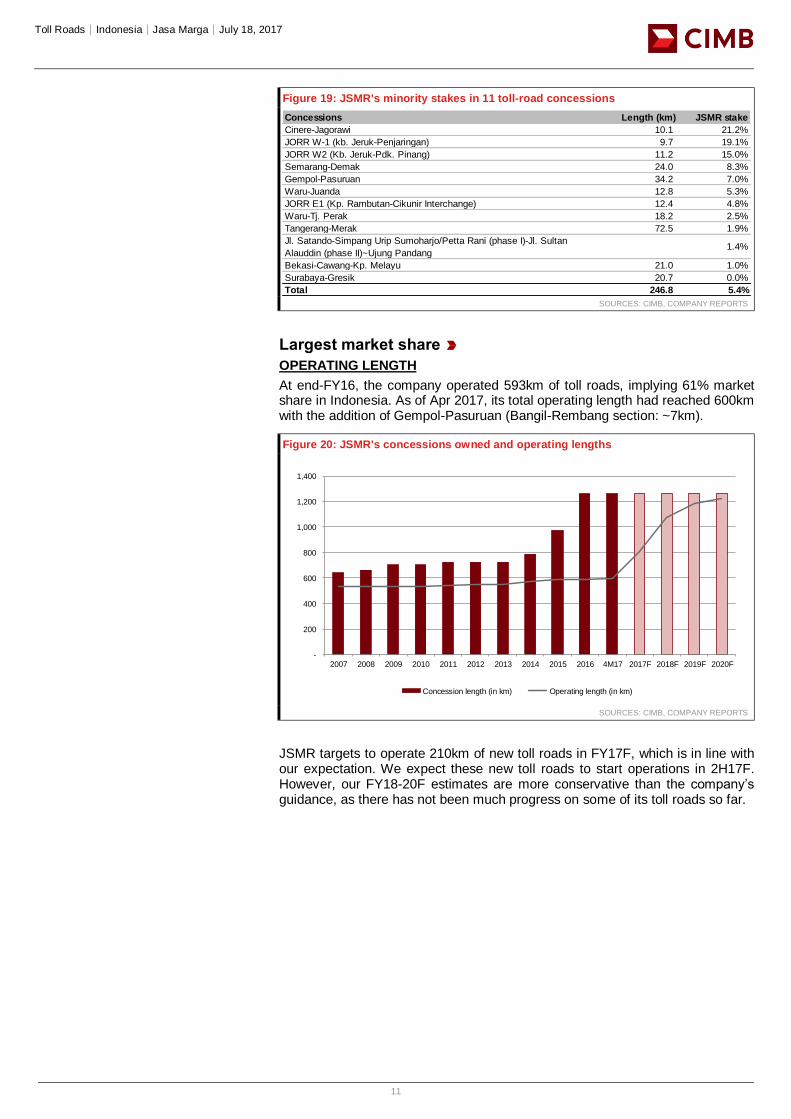
OPERATING LENGTH
At end-FY16, the company operated 593km of toll roads, implying 61% market share in Indonesia. As of Apr 2017, its total operating length had reached 600km with the addition of Gempol-Pasuruan (Bangil-Rembang section: ~7km).
Figure 20: JSMR's concessions owned and operating lengths
SOURCES: CIMB, COMPANY REPORTS
JSMR targets to operate 210km of new toll roads in FY17F, which is in line with our expectation. We expect these new toll roads to start operations in 2H17F. However, our FY18-20F estimates are more conservative than the company’s guidance, as there has not been much progress on some of its toll roads so far.
Concessions Length (km) JSMR stake
Cinere-Jagorawi 10.1 21.2%
JORR W-1 (kb. Jeruk-Penjaringan) 9.7 19.1%
JORR W2 (Kb. Jeruk-Pdk. Pinang) 11.2 15.0%
Semarang-Demak 24.0 8.3%
Gempol-Pasuruan 34.2 7.0%
Waru-Juanda 12.8 5.3%
JORR E1 (Kp. Rambutan-Cikunir Interchange) 12.4 4.8%
Waru-Tj. Perak 18.2 2.5%
Tangerang-Merak 72.5 1.9%
Jl. Satando-Simpang Urip Sumoharjo/Petta Rani (phase I)-Jl. Sultan
Alauddin (phase II)~Ujung Pandang1.4%
Bekasi-Cawang-Kp. Melayu 21.0 1.0%
Surabaya-Gresik 20.7 0.0%
Total 246.8 5.4%
Title:
Source:
Please fill in the values above to have them entered in your report
-
200
400
600
800
1,000
1,200
1,400
2007 2008 2009 2010 2011 2012 2013 2014 2015 2016 4M17 2017F 2018F 2019F 2020F
Concession length (in km) Operating length (in km)
Toll Roads│Indonesia│Jasa Marga│July 18, 2017
12
Figure 21: JSMR’s new toll roads target for FY17F
SOURCES: CIMB, COMPANY REPORTS
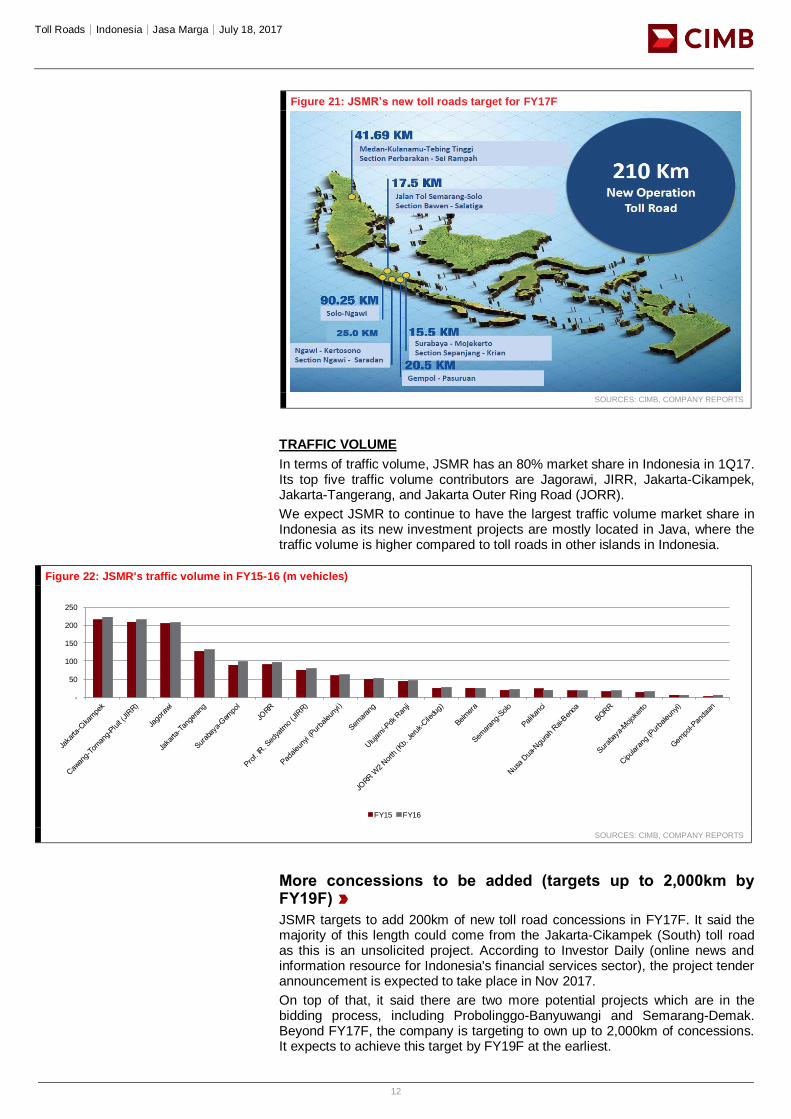
TRAFFIC VOLUME
In terms of traffic volume, JSMR has an 80% market share in Indonesia in 1Q17. Its top five traffic volume contributors are Jagorawi, JIRR, Jakarta-Cikampek, Jakarta-Tangerang, and Jakarta Outer Ring Road (JORR).
We expect JSMR to continue to have the largest traffic volume market share in Indonesia as its new investment projects are mostly located in Java, where the traffic volume is higher compared to toll roads in other islands in Indonesia.
Figure 22: JSMR's traffic volume in FY15-16 (m vehicles)
SOURCES: CIMB, COMPANY REPORTS
More concessions to be added (targets up to 2,000km by FY19F)
JSMR targets to add 200km of new toll road concessions in FY17F. It said the majority of this length could come from the Jakarta-Cikampek (South) toll road as this is an unsolicited project. According to Investor Daily (online news and information resource for Indonesia's financial services sector), the project tender announcement is expected to take place in Nov 2017.
On top of that, it said there are two more potential projects which are in the bidding process, including Probolinggo-Banyuwangi and Semarang-Demak. Beyond FY17F, the company is targeting to own up to 2,000km of concessions. It expects to achieve this target by FY19F at the earliest.
Title:
Source:
Please fill in the values above to have them entered in your report
-
50
100
150
200
250
FY15 FY16
Toll Roads│Indonesia│Jasa Marga│July 18, 2017
13
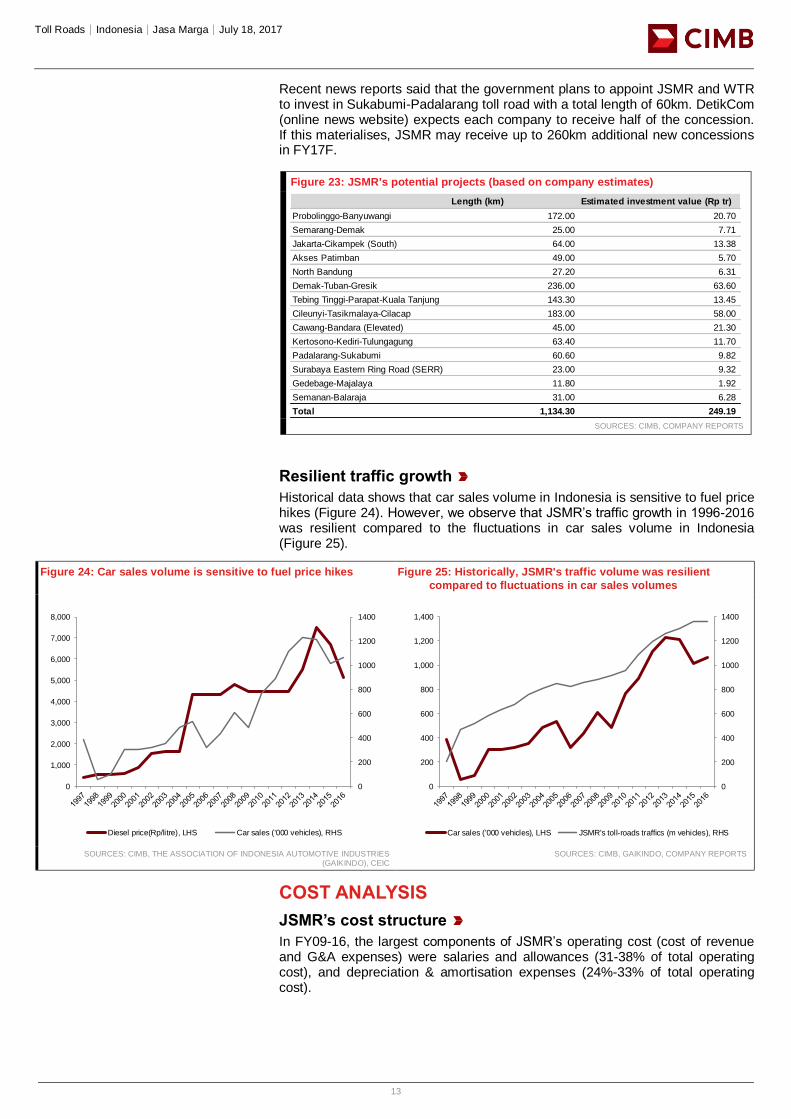
Recent news reports said that the government plans to appoint JSMR and WTR to invest in Sukabumi-Padalarang toll road with a total length of 60km. DetikCom (online news website) expects each company to receive half of the concession. If this materialises, JSMR may receive up to 260km additional new concessions in FY17F.
Figure 23: JSMR's potential projects (based on company estimates)
SOURCES: CIMB, COMPANY REPORTS
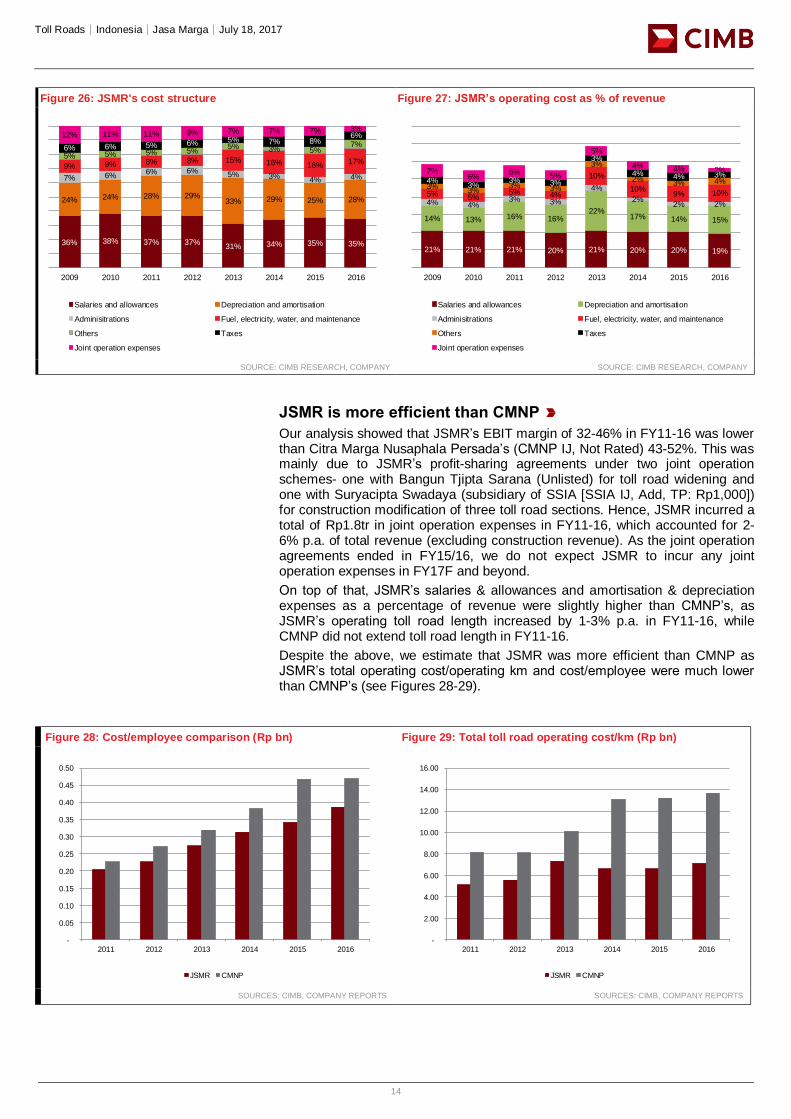
Resilient traffic growth
Historical data shows that car sales volume in Indonesia is sensitive to fuel price hikes (Figure 24). However, we observe that JSMR’s traffic growth in 1996-2016 was resilient compared to the fluctuations in car sales volume in Indonesia (Figure 25).
Figure 24: Car sales volume is sensitive to fuel price hikes Figure 25: Historically, JSMR's traffic volume was resilient
compared to fluctuations in car sales volumes
SOURCES: CIMB, THE ASSOCIATION OF INDONESIA AUTOMOTIVE INDUSTRIES
(GAIKINDO), CEIC SOURCES: CIMB, GAIKINDO, COMPANY REPORTS
COST ANALYSIS
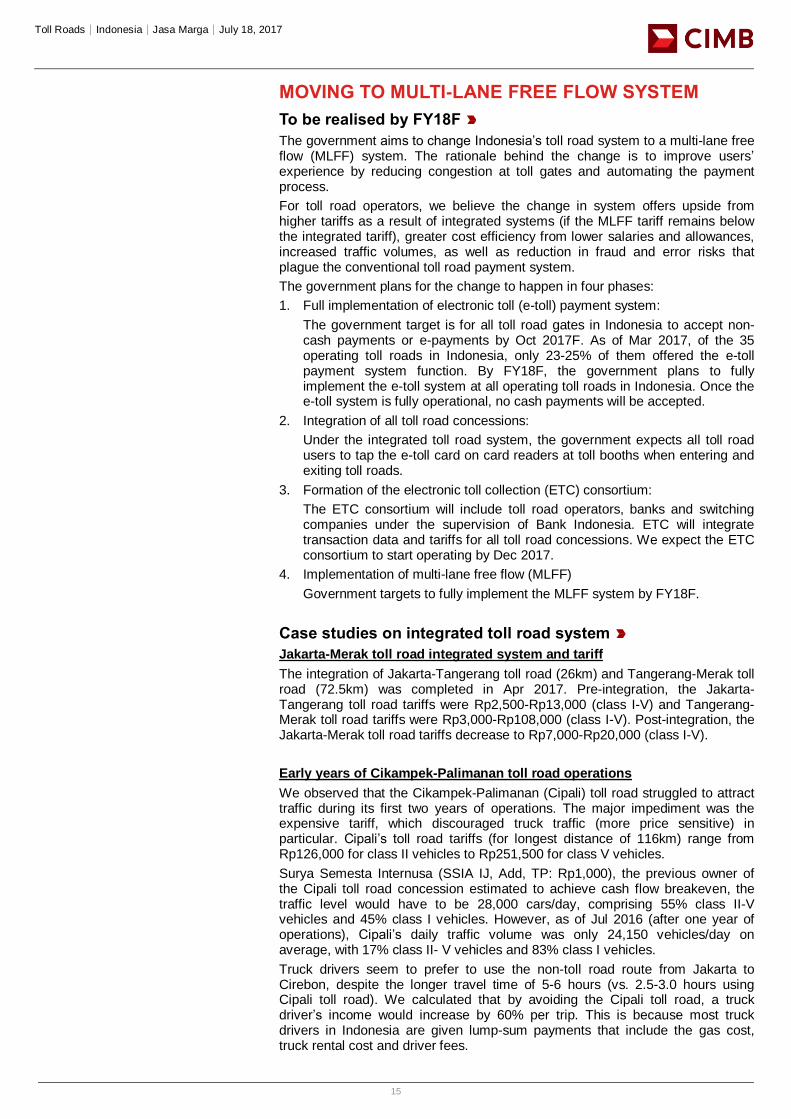
JSMR’s cost structure
In FY09-16, the largest components of JSMR’s operating cost (cost of revenue and G&A expenses) were salaries and allowances (31-38% of total operating cost), and depreciation & amortisation expenses (24%-33% of total operating cost).
Length (km) Estimated investment value (Rp tr)
Probolinggo-Banyuwangi 172.00 20.70
Semarang-Demak 25.00 7.71
Jakarta-Cikampek (South) 64.00 13.38
Akses Patimban 49.00 5.70
North Bandung 27.20 6.31
Demak-Tuban-Gresik 236.00 63.60
Tebing Tinggi-Parapat-Kuala Tanjung 143.30 13.45
Cileunyi-Tasikmalaya-Cilacap 183.00 58.00
Cawang-Bandara (Elevated) 45.00 21.30
Kertosono-Kediri-Tulungagung 63.40 11.70
Padalarang-Sukabumi 60.60 9.82
Surabaya Eastern Ring Road (SERR) 23.00 9.32
Gedebage-Majalaya 11.80 1.92
Semanan-Balaraja 31.00 6.28
Total 1,134.30 249.19
Title:
Source:
Please fill in the values above to have them entered in your report
0
200
400
600
800
1000
1200
1400
0
1,000
2,000
3,000
4,000
5,000
6,000
7,000
8,000
Diesel price(Rp/litre), LHS Car sales ('000 vehicles), RHS
Title:
Source:
Please fill in the values above to have them entered in your report
0
200
400
600
800
1000
1200
1400
0
200
400
600
800
1,000
1,200
1,400
Car sales ('000 vehicles), LHS JSMR's toll-roads traffics (m vehicles), RHS
Toll Roads│Indonesia│Jasa Marga│July 18, 2017
14
Figure 26: JSMR's cost structure Figure 27: JSMR’s operating cost as % of revenue
SOURCE: CIMB RESEARCH, COMPANY SOURCE: CIMB RESEARCH, COMPANY
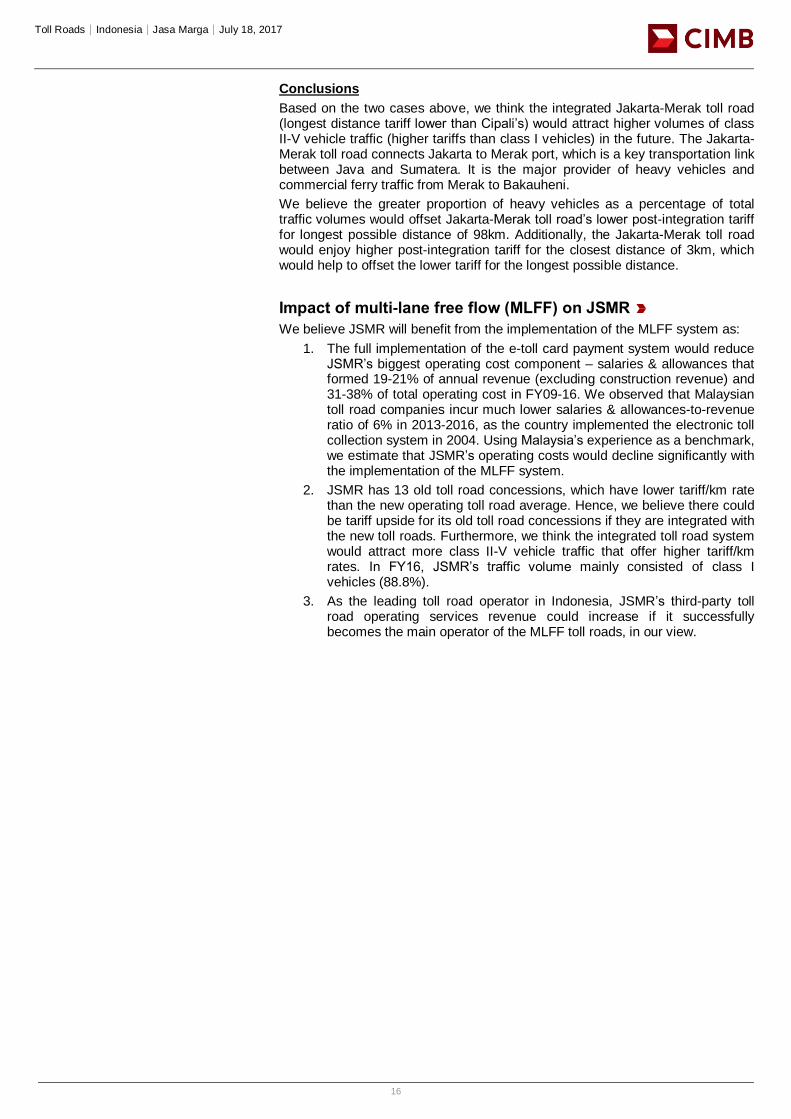
JSMR is more efficient than CMNP
Our analysis showed that JSMR’s EBIT margin of 32-46% in FY11-16 was lower than Citra Marga Nusaphala Persada’s (CMNP IJ, Not Rated) 43-52%. This was mainly due to JSMR’s profit-sharing agreements under two joint operation schemes- one with Bangun Tjipta Sarana (Unlisted) for toll road widening and one with Suryacipta Swadaya (subsidiary of SSIA [SSIA IJ, Add, TP: Rp1,000]) for construction modification of three toll road sections. Hence, JSMR incurred a total of Rp1.8tr in joint operation expenses in FY11-16, which accounted for 2-6% p.a. of total revenue (excluding construction revenue). As the joint operation agreements ended in FY15/16, we do not expect JSMR to incur any joint operation expenses in FY17F and beyond.
On top of that, JSMR’s salaries & allowances and amortisation & depreciation expenses as a percentage of revenue were slightly higher than CMNP’s, as JSMR’s operating toll road length increased by 1-3% p.a. in FY11-16, while CMNP did not extend toll road length in FY11-16.
Despite the above, we estimate that JSMR was more efficient than CMNP as JSMR’s total operating cost/operating km and cost/employee were much lower than CMNP’s (see Figures 28-29).
Figure 28: Cost/employee comparison (Rp bn) Figure 29: Total toll road operating cost/km (Rp bn)
SOURCES: CIMB, COMPANY REPORTS SOURCES: CIMB, COMPANY REPORTS
Title:
Source:
Please fill in the values above to have them entered in your report
36% 38% 37% 37%31% 34% 35% 35%
24% 24% 28% 29%33% 29% 25% 28%
7% 6%6% 6% 5% 3% 4% 4%
9% 9% 8% 8% 15% 16% 16%17%
5% 5% 5% 5%5% 3% 5%
7%6% 6% 5% 6% 5% 7% 8%6%12% 11% 11% 9% 7% 7% 7% 3%
2009 2010 2011 2012 2013 2014 2015 2016
Salaries and allowances Depreciation and amortisation
Adminisitrations Fuel, electricity, water, and maintenance
Others Taxes
Joint operation expenses
Title:
Source:
Please fill in the values above to have them entered in your report
21% 21% 21% 20% 21% 20% 20% 19%
14% 13% 16% 16%22%
17% 14% 15%
4% 4%3% 3%
4%
2%2% 2%
5% 5%5% 4%
10%
10%9% 10%
3%3%
3% 3%
3%
2%3% 4%4%
3%3% 3%
3%
4% 4% 3%7%6%
6% 5%
5%
4% 4% 2%
2009 2010 2011 2012 2013 2014 2015 2016
Salaries and allowances Depreciation and amortisation
Adminisitrations Fuel, electricity, water, and maintenance
Others Taxes
Joint operation expenses
Title:
Source:
Please fill in the values above to have them entered in your report
-
0.05
0.10
0.15
0.20
0.25
0.30
0.35
0.40
0.45
0.50
2011 2012 2013 2014 2015 2016
JSMR CMNP
Title:
Source:
Please fill in the values above to have them entered in your report
-
2.00
4.00
6.00
8.00
10.00
12.00
14.00
16.00
2011 2012 2013 2014 2015 2016
JSMR CMNP
Toll Roads│Indonesia│Jasa Marga│July 18, 2017
15
MOVING TO MULTI-LANE FREE FLOW SYSTEM
To be realised by FY18F
The government aims to change Indonesia’s toll road system to a multi-lane free flow (MLFF) system. The rationale behind the change is to improve users’ experience by reducing congestion at toll gates and automating the payment process.
For toll road operators, we believe the change in system offers upside from higher tariffs as a result of integrated systems (if the MLFF tariff remains below the integrated tariff), greater cost efficiency from lower salaries and allowances, increased traffic volumes, as well as reduction in fraud and error risks that plague the conventional toll road payment system.
The government plans for the change to happen in four phases:
1. Full implementation of electronic toll (e-toll) payment system:
The government target is for all toll road gates in Indonesia to accept non-cash payments or e-payments by Oct 2017F. As of Mar 2017, of the 35 operating toll roads in Indonesia, only 23-25% of them offered the e-toll payment system function. By FY18F, the government plans to fully implement the e-toll system at all operating toll roads in Indonesia. Once the e-toll system is fully operational, no cash payments will be accepted.
2. Integration of all toll road concessions:
Under the integrated toll road system, the government expects all toll road users to tap the e-toll card on card readers at toll booths when entering and exiting toll roads.
3. Formation of the electronic toll collection (ETC) consortium:
The ETC consortium will include toll road operators, banks and switching companies under the supervision of Bank Indonesia. ETC will integrate transaction data and tariffs for all toll road concessions. We expect the ETC consortium to start operating by Dec 2017.
4. Implementation of multi-lane free flow (MLFF)
Government targets to fully implement the MLFF system by FY18F.
Case studies on integrated toll road system
Jakarta-Merak toll road integrated system and tariff
The integration of Jakarta-Tangerang toll road (26km) and Tangerang-Merak toll road (72.5km) was completed in Apr 2017. Pre-integration, the Jakarta-Tangerang toll road tariffs were Rp2,500-Rp13,000 (class I-V) and Tangerang-Merak toll road tariffs were Rp3,000-Rp108,000 (class I-V). Post-integration, the Jakarta-Merak toll road tariffs decrease to Rp7,000-Rp20,000 (class I-V).
Early years of Cikampek-Palimanan toll road operations
We observed that the Cikampek-Palimanan (Cipali) toll road struggled to attract traffic during its first two years of operations. The major impediment was the expensive tariff, which discouraged truck traffic (more price sensitive) in particular. Cipali’s toll road tariffs (for longest distance of 116km) range from Rp126,000 for class II vehicles to Rp251,500 for class V vehicles.
Surya Semesta Internusa (SSIA IJ, Add, TP: Rp1,000), the previous owner of the Cipali toll road concession estimated to achieve cash flow breakeven, the traffic level would have to be 28,000 cars/day, comprising 55% class II-V vehicles and 45% class I vehicles. However, as of Jul 2016 (after one year of operations), Cipali’s daily traffic volume was only 24,150 vehicles/day on average, with 17% class II- V vehicles and 83% class I vehicles.
Truck drivers seem to prefer to use the non-toll road route from Jakarta to Cirebon, despite the longer travel time of 5-6 hours (vs. 2.5-3.0 hours using Cipali toll road). We calculated that by avoiding the Cipali toll road, a truck driver’s income would increase by 60% per trip. This is because most truck drivers in Indonesia are given lump-sum payments that include the gas cost, truck rental cost and driver fees.
Toll Roads│Indonesia│Jasa Marga│July 18, 2017
16
Conclusions
Based on the two cases above, we think the integrated Jakarta-Merak toll road (longest distance tariff lower than Cipali’s) would attract higher volumes of class II-V vehicle traffic (higher tariffs than class I vehicles) in the future. The Jakarta-Merak toll road connects Jakarta to Merak port, which is a key transportation link between Java and Sumatera. It is the major provider of heavy vehicles and commercial ferry traffic from Merak to Bakauheni.
We believe the greater proportion of heavy vehicles as a percentage of total traffic volumes would offset Jakarta-Merak toll road’s lower post-integration tariff for longest possible distance of 98km. Additionally, the Jakarta-Merak toll road would enjoy higher post-integration tariff for the closest distance of 3km, which would help to offset the lower tariff for the longest possible distance.
Impact of multi-lane free flow (MLFF) on JSMR
We believe JSMR will benefit from the implementation of the MLFF system as:
1. The full implementation of the e-toll card payment system would reduce JSMR’s biggest operating cost component – salaries & allowances that formed 19-21% of annual revenue (excluding construction revenue) and 31-38% of total operating cost in FY09-16. We observed that Malaysian toll road companies incur much lower salaries & allowances-to-revenue ratio of 6% in 2013-2016, as the country implemented the electronic toll collection system in 2004. Using Malaysia’s experience as a benchmark, we estimate that JSMR’s operating costs would decline significantly with the implementation of the MLFF system.
2. JSMR has 13 old toll road concessions, which have lower tariff/km rate than the new operating toll road average. Hence, we believe there could be tariff upside for its old toll road concessions if they are integrated with the new toll roads. Furthermore, we think the integrated toll road system would attract more class II-V vehicle traffic that offer higher tariff/km rates. In FY16, JSMR’s traffic volume mainly consisted of class I vehicles (88.8%).
3. As the leading toll road operator in Indonesia, JSMR’s third-party toll road operating services revenue could increase if it successfully becomes the main operator of the MLFF toll roads, in our view.
Toll Roads│Indonesia│Jasa Marga│July 18, 2017
17
ROBUST INVESTMENT RETURNS
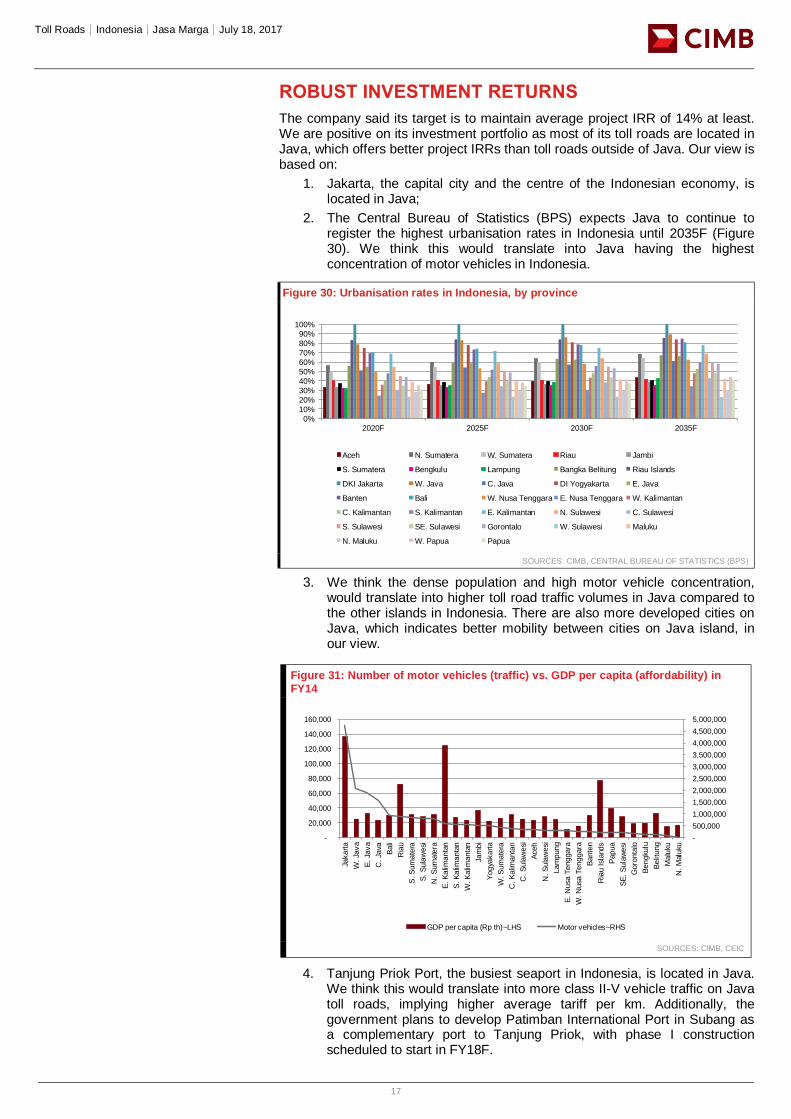
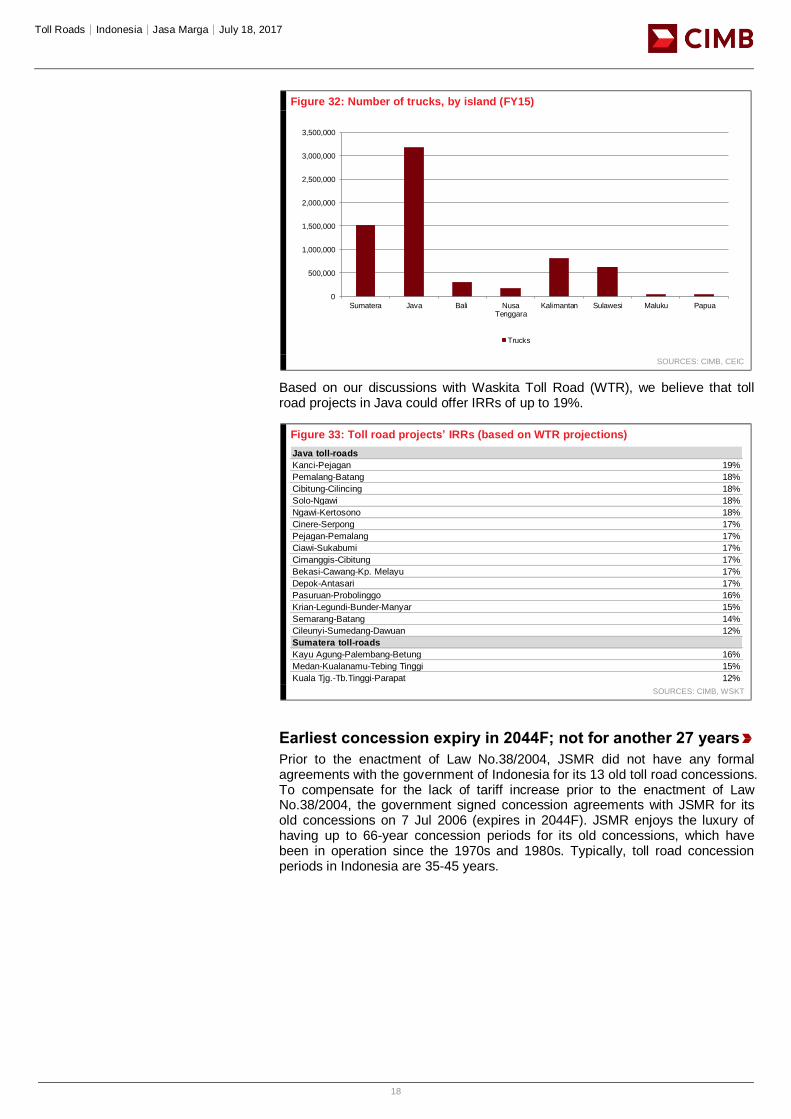
The company said its target is to maintain average project IRR of 14% at least. We are positive on its investment portfolio as most of its toll roads are located in Java, which offers better project IRRs than toll roads outside of Java. Our view is based on:
1. Jakarta, the capital city and the centre of the Indonesian economy, is located in Java;
2. The Central Bureau of Statistics (BPS) expects Java to continue to register the highest urbanisation rates in Indonesia until 2035F (Figure 30). We think this would translate into Java having the highest concentration of motor vehicles in Indonesia.
Figure 30: Urbanisation rates in Indonesia, by province
SOURCES: CIMB, CENTRAL BUREAU OF STATISTICS (BPS)
3. We think the dense population and high motor vehicle concentration, would translate into higher toll road traffic volumes in Java compared to the other islands in Indonesia. There are also more developed cities on Java, which indicates better mobility between cities on Java island, in our view.
Figure 31: Number of motor vehicles (traffic) vs. GDP per capita (affordability) in
FY14
SOURCES: CIMB, CEIC
4. Tanjung Priok Port, the busiest seaport in Indonesia, is located in Java. We think this would translate into more class II-V vehicle traffic on Java toll roads, implying higher average tariff per km. Additionally, the government plans to develop Patimban International Port in Subang as a complementary port to Tanjung Priok, with phase I construction scheduled to start in FY18F.
Title:
Source:
Please fill in the values above to have them entered in your report
0%
10%
20%
30%
40%
50%
60%
70%
80%
90%
100%
2020F 2025F 2030F 2035F
Aceh N. Sumatera W. Sumatera Riau Jambi
S. Sumatera Bengkulu Lampung Bangka Belitung Riau Islands
DKI Jakarta W. Java C. Java DI Yogyakarta E. Java
Banten Bali W. Nusa Tenggara E. Nusa Tenggara W. Kalimantan
C. Kalimantan S. Kalimantan E. Kalimantan N. Sulawesi C. Sulawesi
S. Sulawesi SE. Sulawesi Gorontalo W. Sulawesi Maluku
N. Maluku W. Papua Papua
Title:
Source:
Please fill in the values above to have them entered in your report
-
500,000
1,000,000
1,500,000
2,000,000
2,500,000
3,000,000
3,500,000
4,000,000
4,500,000
5,000,000
-
20,000
40,000
60,000
80,000
100,000
120,000
140,000
160,000
Jakarta
W. Ja
va
E. Ja
va
C. Ja
va
Bali
Ria
u
S. S
um
ate
ra
S. S
ula
wesi
N. S
um
ate
ra
E. K
alim
anta
n
S. K
alim
anta
n
W. K
alim
anta
n
Jam
bi
Yogya
karta
W. S
um
ate
ra
C. K
alim
anta
n
C. S
ula
wesi
Ace
h
N. S
ula
wesi
Lam
pung
E. N
usa
Tenggara
W. N
usa
Tenggara
Bante
n
Ria
u Isl
and
s
Papua
SE
. S
ula
wesi
Goro
nta
lo
Bengku
lu
Belit
ung
Malu
ku
N. M
aluku
GDP per capita (Rp th)~LHS Motor vehicles~RHS
Toll Roads│Indonesia│Jasa Marga│July 18, 2017
18
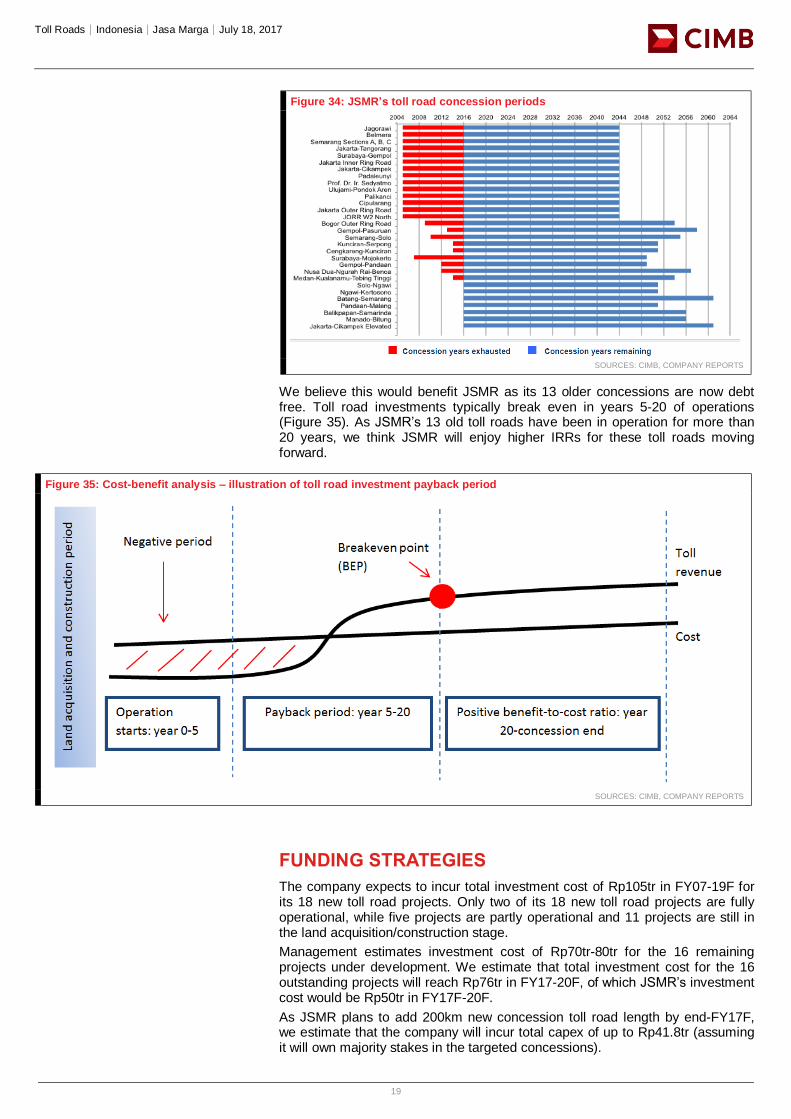
Figure 32: Number of trucks, by island (FY15)
SOURCES: CIMB, CEIC
Based on our discussions with Waskita Toll Road (WTR), we believe that toll road projects in Java could offer IRRs of up to 19%.
Figure 33: Toll road projects’ IRRs (based on WTR projections)
SOURCES: CIMB, WSKT
Earliest concession expiry in 2044F; not for another 27 years
Prior to the enactment of Law No.38/2004, JSMR did not have any formal agreements with the government of Indonesia for its 13 old toll road concessions. To compensate for the lack of tariff increase prior to the enactment of Law No.38/2004, the government signed concession agreements with JSMR for its old concessions on 7 Jul 2006 (expires in 2044F). JSMR enjoys the luxury of having up to 66-year concession periods for its old concessions, which have been in operation since the 1970s and 1980s. Typically, toll road concession periods in Indonesia are 35-45 years.
Title:
Source:
Please fill in the values above to have them entered in your report
0
500,000
1,000,000
1,500,000
2,000,000
2,500,000
3,000,000
3,500,000
Sumatera Java Bali NusaTenggara
Kalimantan Sulawesi Maluku Papua
Trucks
Java toll-roads
Kanci-Pejagan 19%
Pemalang-Batang 18%
Cibitung-Cilincing 18%
Solo-Ngawi 18%
Ngawi-Kertosono 18%
Cinere-Serpong 17%
Pejagan-Pemalang 17%
Ciawi-Sukabumi 17%
Cimanggis-Cibitung 17%
Bekasi-Cawang-Kp. Melayu 17%
Depok-Antasari 17%
Pasuruan-Probolinggo 16%
Krian-Legundi-Bunder-Manyar 15%
Semarang-Batang 14%
Cileunyi-Sumedang-Dawuan 12%
Sumatera toll-roads
Kayu Agung-Palembang-Betung 16%
Medan-Kualanamu-Tebing Tinggi 15%
Kuala Tjg.-Tb.Tinggi-Parapat 12%
Toll Roads│Indonesia│Jasa Marga│July 18, 2017
19
Figure 34: JSMR’s toll road concession periods
SOURCES: CIMB, COMPANY REPORTS
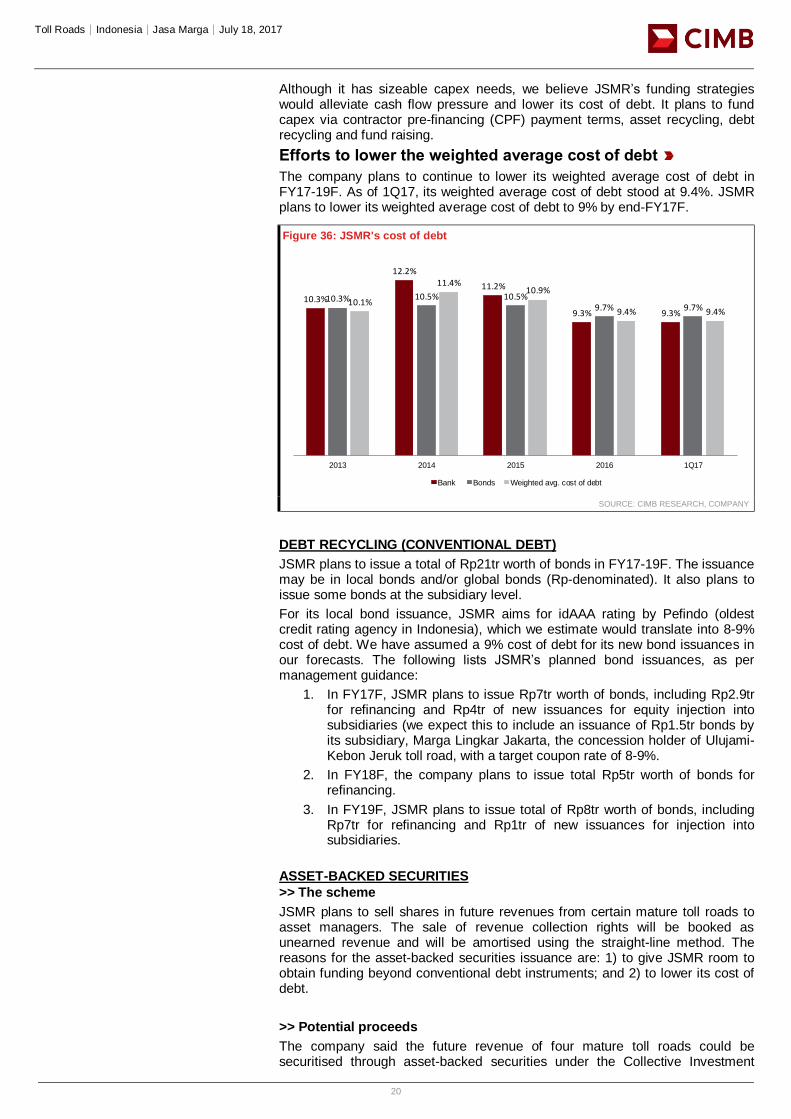
We believe this would benefit JSMR as its 13 older concessions are now debt free. Toll road investments typically break even in years 5-20 of operations (Figure 35). As JSMR’s 13 old toll roads have been in operation for more than 20 years, we think JSMR will enjoy higher IRRs for these toll roads moving forward.
Figure 35: Cost-benefit analysis – illustration of toll road investment payback period
SOURCES: CIMB, COMPANY REPORTS
FUNDING STRATEGIES
The company expects to incur total investment cost of Rp105tr in FY07-19F for its 18 new toll road projects. Only two of its 18 new toll road projects are fully operational, while five projects are partly operational and 11 projects are still in the land acquisition/construction stage.
Management estimates investment cost of Rp70tr-80tr for the 16 remaining projects under development. We estimate that total investment cost for the 16 outstanding projects will reach Rp76tr in FY17-20F, of which JSMR’s investment cost would be Rp50tr in FY17F-20F.
As JSMR plans to add 200km new concession toll road length by end-FY17F, we estimate that the company will incur total capex of up to Rp41.8tr (assuming it will own majority stakes in the targeted concessions).
Toll Roads│Indonesia│Jasa Marga│July 18, 2017
20
Although it has sizeable capex needs, we believe JSMR’s funding strategies would alleviate cash flow pressure and lower its cost of debt. It plans to fund capex via contractor pre-financing (CPF) payment terms, asset recycling, debt recycling and fund raising.
Efforts to lower the weighted average cost of debt
The company plans to continue to lower its weighted average cost of debt in FY17-19F. As of 1Q17, its weighted average cost of debt stood at 9.4%. JSMR plans to lower its weighted average cost of debt to 9% by end-FY17F.
Figure 36: JSMR's cost of debt
SOURCE: CIMB RESEARCH, COMPANY
DEBT RECYCLING (CONVENTIONAL DEBT)
JSMR plans to issue a total of Rp21tr worth of bonds in FY17-19F. The issuance may be in local bonds and/or global bonds (Rp-denominated). It also plans to issue some bonds at the subsidiary level.
For its local bond issuance, JSMR aims for idAAA rating by Pefindo (oldest credit rating agency in Indonesia), which we estimate would translate into 8-9% cost of debt. We have assumed a 9% cost of debt for its new bond issuances in our forecasts. The following lists JSMR’s planned bond issuances, as per management guidance:
1. In FY17F, JSMR plans to issue Rp7tr worth of bonds, including Rp2.9tr for refinancing and Rp4tr of new issuances for equity injection into subsidiaries (we expect this to include an issuance of Rp1.5tr bonds by its subsidiary, Marga Lingkar Jakarta, the concession holder of Ulujami-Kebon Jeruk toll road, with a target coupon rate of 8-9%.
2. In FY18F, the company plans to issue total Rp5tr worth of bonds for refinancing.
3. In FY19F, JSMR plans to issue total of Rp8tr worth of bonds, including Rp7tr for refinancing and Rp1tr of new issuances for injection into subsidiaries.
ASSET-BACKED SECURITIES
>> The scheme
JSMR plans to sell shares in future revenues from certain mature toll roads to asset managers. The sale of revenue collection rights will be booked as unearned revenue and will be amortised using the straight-line method. The reasons for the asset-backed securities issuance are: 1) to give JSMR room to obtain funding beyond conventional debt instruments; and 2) to lower its cost of debt.
>> Potential proceeds
The company said the future revenue of four mature toll roads could be securitised through asset-backed securities under the Collective Investment
Title:
Source:
Please fill in the values above to have them entered in your report10.3%
12.2%
11.2%
9.3% 9.3%
10.3% 10.5% 10.5%9.7% 9.7%
10.1%
11.4%10.9%
9.4% 9.4%
2013 2014 2015 2016 1Q17
Bank Bonds Weighted avg. cost of debt
Toll Roads│Indonesia│Jasa Marga│July 18, 2017
21
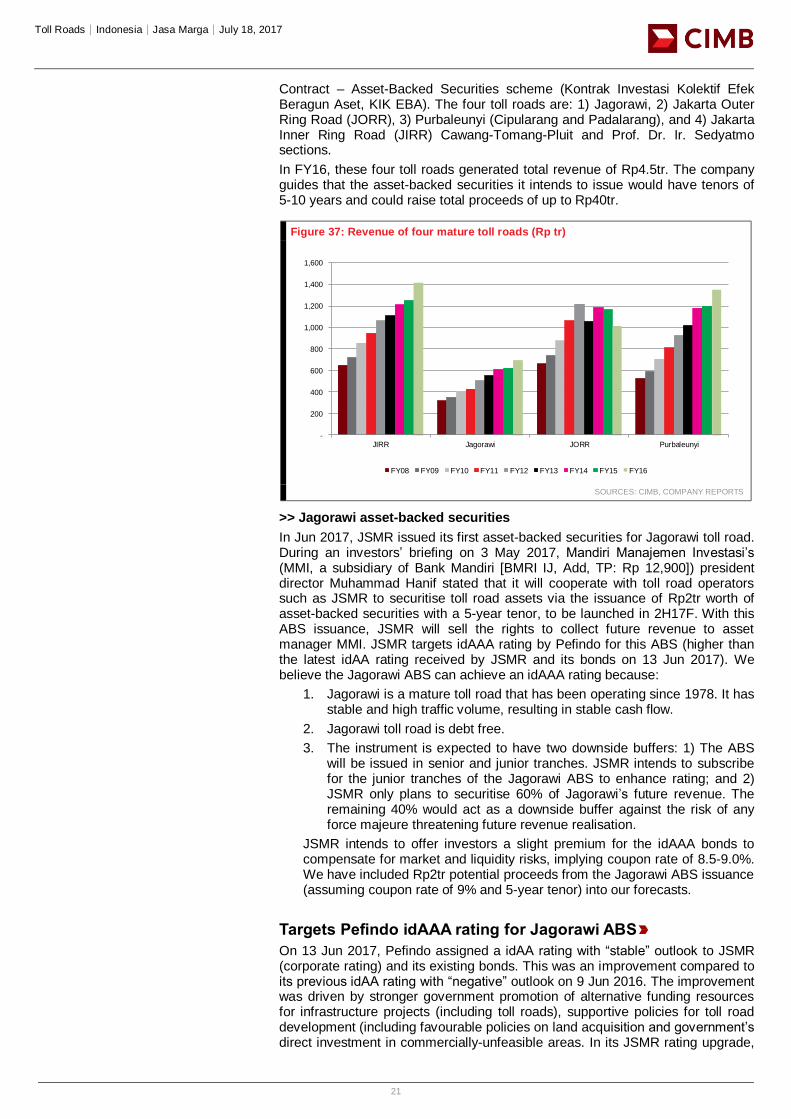
Contract – Asset-Backed Securities scheme (Kontrak Investasi Kolektif Efek Beragun Aset, KIK EBA). The four toll roads are: 1) Jagorawi, 2) Jakarta Outer Ring Road (JORR), 3) Purbaleunyi (Cipularang and Padalarang), and 4) Jakarta Inner Ring Road (JIRR) Cawang-Tomang-Pluit and Prof. Dr. Ir. Sedyatmo sections.
In FY16, these four toll roads generated total revenue of Rp4.5tr. The company guides that the asset-backed securities it intends to issue would have tenors of 5-10 years and could raise total proceeds of up to Rp40tr.
Figure 37: Revenue of four mature toll roads (Rp tr)
SOURCES: CIMB, COMPANY REPORTS
>> Jagorawi asset-backed securities
In Jun 2017, JSMR issued its first asset-backed securities for Jagorawi toll road. During an investors’ briefing on 3 May 2017, Mandiri Manajemen Investasi’s (MMI, a subsidiary of Bank Mandiri [BMRI IJ, Add, TP: Rp 12,900]) president director Muhammad Hanif stated that it will cooperate with toll road operators such as JSMR to securitise toll road assets via the issuance of Rp2tr worth of asset-backed securities with a 5-year tenor, to be launched in 2H17F. With this ABS issuance, JSMR will sell the rights to collect future revenue to asset manager MMI. JSMR targets idAAA rating by Pefindo for this ABS (higher than the latest idAA rating received by JSMR and its bonds on 13 Jun 2017). We believe the Jagorawi ABS can achieve an idAAA rating because:
1. Jagorawi is a mature toll road that has been operating since 1978. It has stable and high traffic volume, resulting in stable cash flow.
2. Jagorawi toll road is debt free.
3. The instrument is expected to have two downside buffers: 1) The ABS will be issued in senior and junior tranches. JSMR intends to subscribe for the junior tranches of the Jagorawi ABS to enhance rating; and 2) JSMR only plans to securitise 60% of Jagorawi’s future revenue. The remaining 40% would act as a downside buffer against the risk of any force majeure threatening future revenue realisation.
JSMR intends to offer investors a slight premium for the idAAA bonds to compensate for market and liquidity risks, implying coupon rate of 8.5-9.0%. We have included Rp2tr potential proceeds from the Jagorawi ABS issuance (assuming coupon rate of 9% and 5-year tenor) into our forecasts.
Targets Pefindo idAAA rating for Jagorawi ABS
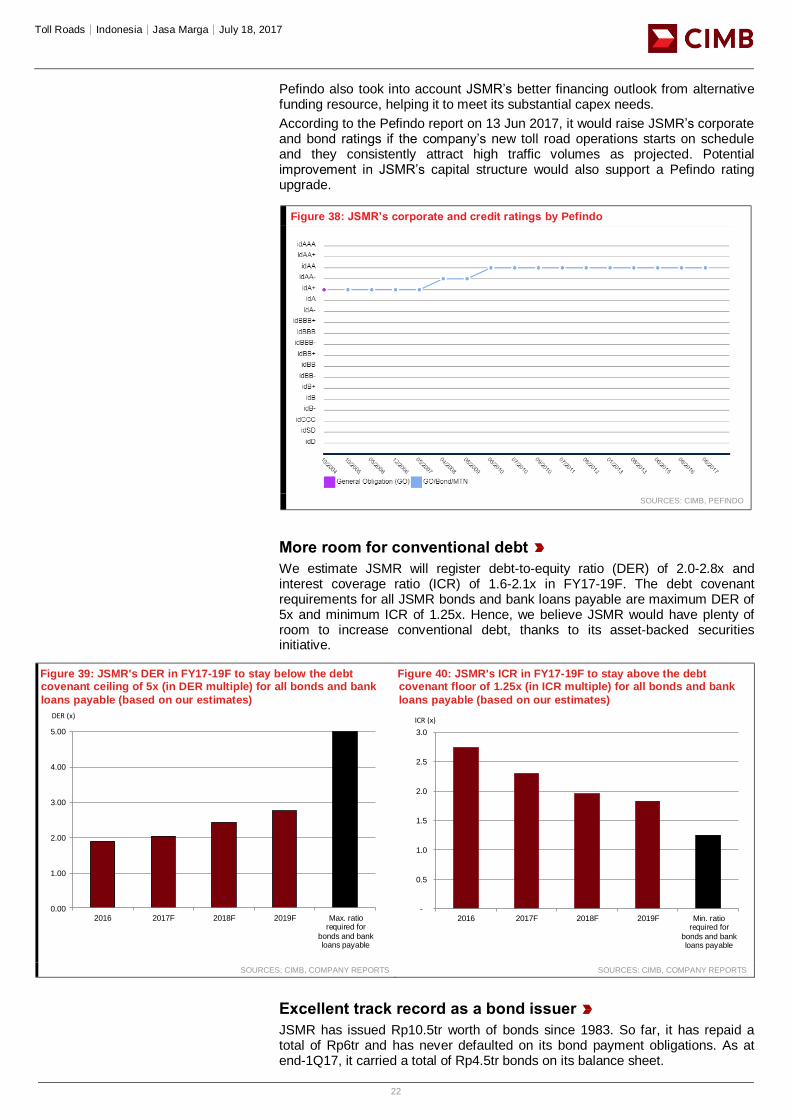
On 13 Jun 2017, Pefindo assigned a idAA rating with “stable” outlook to JSMR (corporate rating) and its existing bonds. This was an improvement compared to its previous idAA rating with “negative” outlook on 9 Jun 2016. The improvement was driven by stronger government promotion of alternative funding resources for infrastructure projects (including toll roads), supportive policies for toll road development (including favourable policies on land acquisition and government’s direct investment in commercially-unfeasible areas. In its JSMR rating upgrade,
Title:
Source:
Please fill in the values above to have them entered in your report
-
200
400
600
800
1,000
1,200
1,400
1,600
JIRR Jagorawi JORR Purbaleunyi
FY08 FY09 FY10 FY11 FY12 FY13 FY14 FY15 FY16
Toll Roads│Indonesia│Jasa Marga│July 18, 2017
22
Pefindo also took into account JSMR’s better financing outlook from alternative funding resource, helping it to meet its substantial capex needs.
According to the Pefindo report on 13 Jun 2017, it would raise JSMR’s corporate and bond ratings if the company’s new toll road operations starts on schedule and they consistently attract high traffic volumes as projected. Potential improvement in JSMR’s capital structure would also support a Pefindo rating upgrade.
Figure 38: JSMR’s corporate and credit ratings by Pefindo
SOURCES: CIMB, PEFINDO
More room for conventional debt
We estimate JSMR will register debt-to-equity ratio (DER) of 2.0-2.8x and interest coverage ratio (ICR) of 1.6-2.1x in FY17-19F. The debt covenant requirements for all JSMR bonds and bank loans payable are maximum DER of 5x and minimum ICR of 1.25x. Hence, we believe JSMR would have plenty of room to increase conventional debt, thanks to its asset-backed securities initiative.
Figure 39: JSMR's DER in FY17-19F to stay below the debt covenant ceiling of 5x (in DER multiple) for all bonds and bank
loans payable (based on our estimates)
Figure 40: JSMR's ICR in FY17-19F to stay above the debt covenant floor of 1.25x (in ICR multiple) for all bonds and bank
loans payable (based on our estimates)
SOURCES: CIMB, COMPANY REPORTS SOURCES: CIMB, COMPANY REPORTS
Excellent track record as a bond issuer
JSMR has issued Rp10.5tr worth of bonds since 1983. So far, it has repaid a total of Rp6tr and has never defaulted on its bond payment obligations. As at end-1Q17, it carried a total of Rp4.5tr bonds on its balance sheet.
Title:
Source:
Please fill in the values above to have them entered in your report
0.00
1.00
2.00
3.00
4.00
5.00
2016 2017F 2018F 2019F Max. ratiorequired for
bonds and bankloans payable
Title:
Source:
Please fill in the values above to have them entered in your report
-
0.5
1.0
1.5
2.0
2.5
3.0
2016 2017F 2018F 2019F Min. ratiorequired for
bonds and bankloans payable
DER (x) ICR (x)
Toll Roads│Indonesia│Jasa Marga│July 18, 2017
23
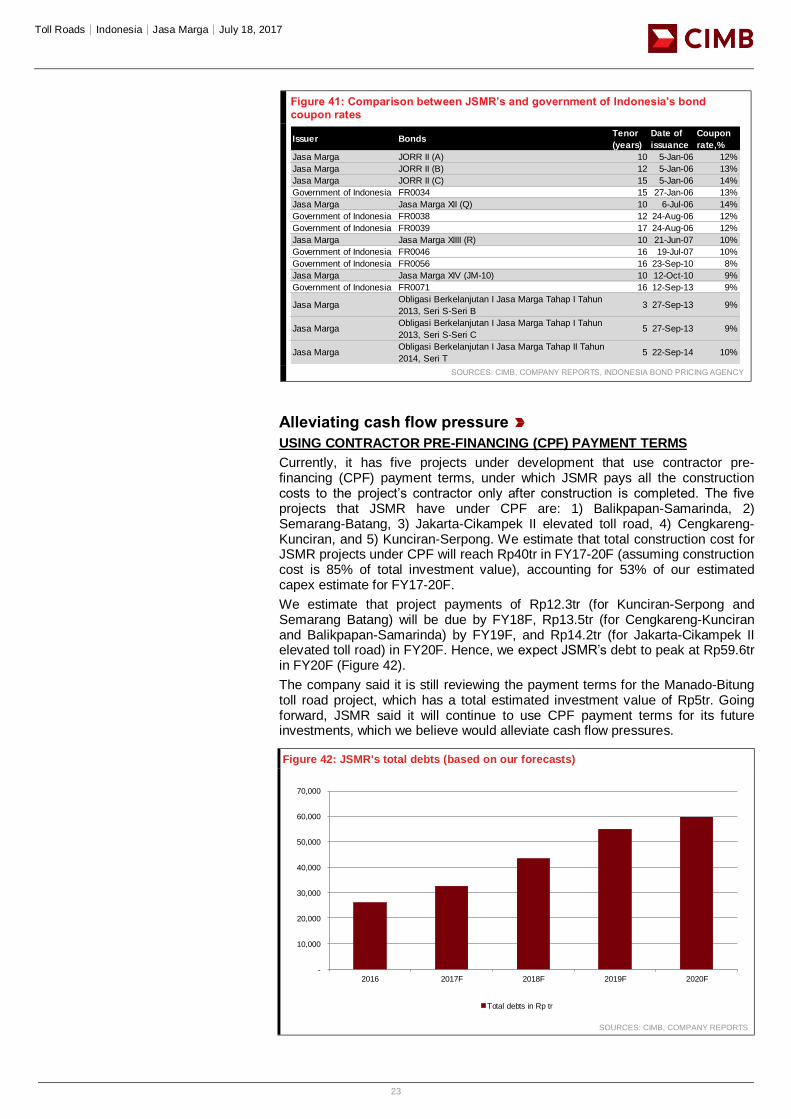
Figure 41: Comparison between JSMR’s and government of Indonesia's bond coupon rates
SOURCES: CIMB, COMPANY REPORTS, INDONESIA BOND PRICING AGENCY
Alleviating cash flow pressure
USING CONTRACTOR PRE-FINANCING (CPF) PAYMENT TERMS
Currently, it has five projects under development that use contractor pre-financing (CPF) payment terms, under which JSMR pays all the construction costs to the project’s contractor only after construction is completed. The five projects that JSMR have under CPF are: 1) Balikpapan-Samarinda, 2) Semarang-Batang, 3) Jakarta-Cikampek II elevated toll road, 4) Cengkareng-Kunciran, and 5) Kunciran-Serpong. We estimate that total construction cost for JSMR projects under CPF will reach Rp40tr in FY17-20F (assuming construction cost is 85% of total investment value), accounting for 53% of our estimated capex estimate for FY17-20F.
We estimate that project payments of Rp12.3tr (for Kunciran-Serpong and Semarang Batang) will be due by FY18F, Rp13.5tr (for Cengkareng-Kunciran and Balikpapan-Samarinda) by FY19F, and Rp14.2tr (for Jakarta-Cikampek II elevated toll road) in FY20F. Hence, we expect JSMR’s debt to peak at Rp59.6tr in FY20F (Figure 42).
The company said it is still reviewing the payment terms for the Manado-Bitung toll road project, which has a total estimated investment value of Rp5tr. Going forward, JSMR said it will continue to use CPF payment terms for its future investments, which we believe would alleviate cash flow pressures.
Figure 42: JSMR's total debts (based on our forecasts)
SOURCES: CIMB, COMPANY REPORTS
Issuer BondsTenor
(years)
Date of
issuance
Coupon
rate,%
Jasa Marga JORR II (A) 10 5-Jan-06 12%
Jasa Marga JORR II (B) 12 5-Jan-06 13%
Jasa Marga JORR II (C) 15 5-Jan-06 14%
Government of Indonesia FR0034 15 27-Jan-06 13%
Jasa Marga Jasa Marga XII (Q) 10 6-Jul-06 14%
Government of Indonesia FR0038 12 24-Aug-06 12%
Government of Indonesia FR0039 17 24-Aug-06 12%
Jasa Marga Jasa Marga XIIII (R) 10 21-Jun-07 10%
Government of Indonesia FR0046 16 19-Jul-07 10%
Government of Indonesia FR0056 16 23-Sep-10 8%
Jasa Marga Jasa Marga XIV (JM-10) 10 12-Oct-10 9%
Government of Indonesia FR0071 16 12-Sep-13 9%
Jasa MargaObligasi Berkelanjutan I Jasa Marga Tahap I Tahun
2013, Seri S-Seri B3 27-Sep-13 9%
Jasa MargaObligasi Berkelanjutan I Jasa Marga Tahap I Tahun
2013, Seri S-Seri C5 27-Sep-13 9%
Jasa MargaObligasi Berkelanjutan I Jasa Marga Tahap II Tahun
2014, Seri T5 22-Sep-14 10%
Title:
Source:
Please fill in the values above to have them entered in your report
-
10,000
20,000
30,000
40,000
50,000
60,000
70,000
2016 2017F 2018F 2019F 2020F
Total debts in Rp tr
Toll Roads│Indonesia│Jasa Marga│July 18, 2017
24
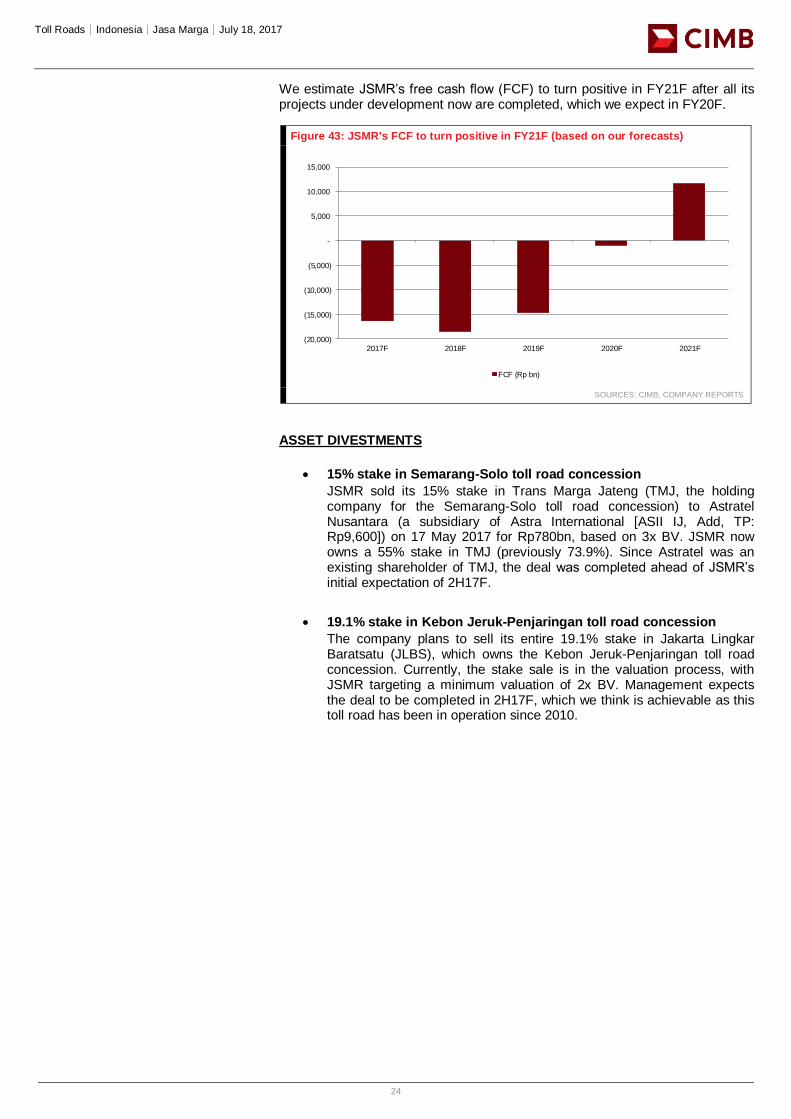
We estimate JSMR’s free cash flow (FCF) to turn positive in FY21F after all its projects under development now are completed, which we expect in FY20F.
Figure 43: JSMR's FCF to turn positive in FY21F (based on our forecasts)
SOURCES: CIMB, COMPANY REPORTS
ASSET DIVESTMENTS
15% stake in Semarang-Solo toll road concession
JSMR sold its 15% stake in Trans Marga Jateng (TMJ, the holding company for the Semarang-Solo toll road concession) to Astratel Nusantara (a subsidiary of Astra International [ASII IJ, Add, TP: Rp9,600]) on 17 May 2017 for Rp780bn, based on 3x BV. JSMR now owns a 55% stake in TMJ (previously 73.9%). Since Astratel was an existing shareholder of TMJ, the deal was completed ahead of JSMR’s initial expectation of 2H17F.
19.1% stake in Kebon Jeruk-Penjaringan toll road concession
The company plans to sell its entire 19.1% stake in Jakarta Lingkar Baratsatu (JLBS), which owns the Kebon Jeruk-Penjaringan toll road concession. Currently, the stake sale is in the valuation process, with JSMR targeting a minimum valuation of 2x BV. Management expects the deal to be completed in 2H17F, which we think is achievable as this toll road has been in operation since 2010.
Title:
Source:
Please fill in the values above to have them entered in your report
(20,000)
(15,000)
(10,000)
(5,000)
-
5,000
10,000
15,000
2017F 2018F 2019F 2020F 2021F
FCF (Rp bn)
Toll Roads│Indonesia│Jasa Marga│July 18, 2017
25
Equity fund-raising plans
TRANS-JAVA SUB-HOLDING COMPANY
>> The plan
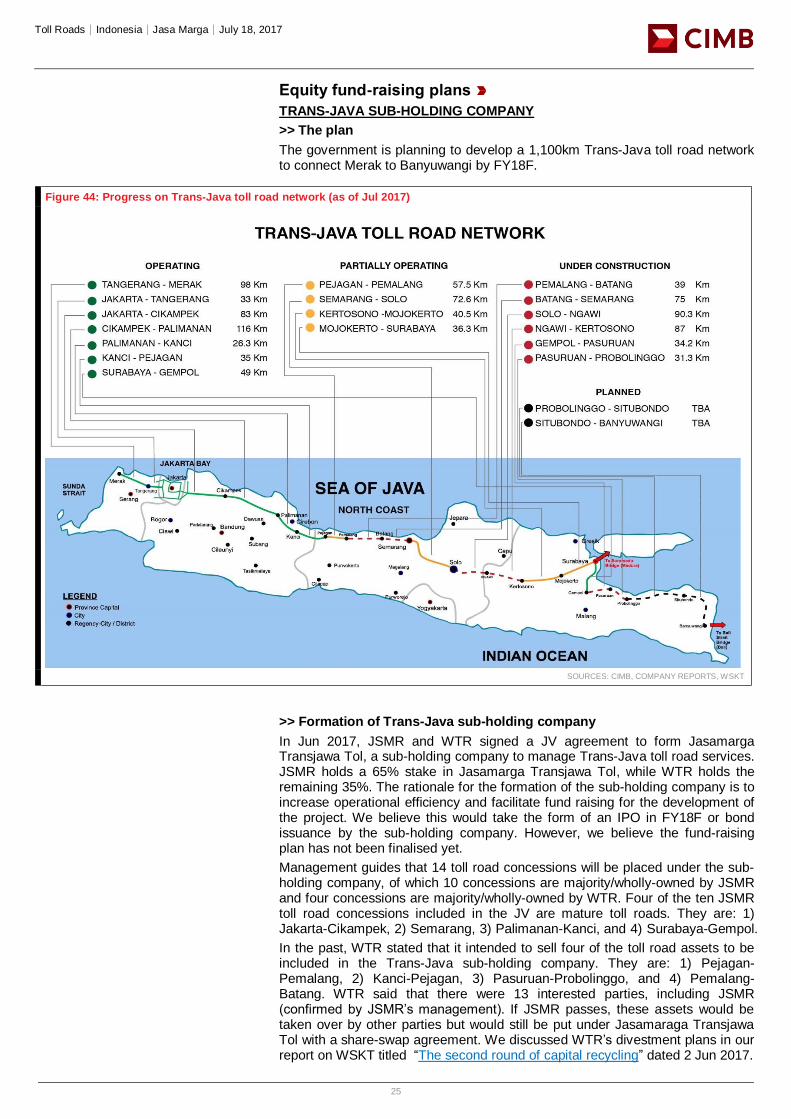
The government is planning to develop a 1,100km Trans-Java toll road network to connect Merak to Banyuwangi by FY18F.
Figure 44: Progress on Trans-Java toll road network (as of Jul 2017)
SOURCES: CIMB, COMPANY REPORTS, WSKT
>> Formation of Trans-Java sub-holding company
In Jun 2017, JSMR and WTR signed a JV agreement to form Jasamarga Transjawa Tol, a sub-holding company to manage Trans-Java toll road services. JSMR holds a 65% stake in Jasamarga Transjawa Tol, while WTR holds the remaining 35%. The rationale for the formation of the sub-holding company is to increase operational efficiency and facilitate fund raising for the development of the project. We believe this would take the form of an IPO in FY18F or bond issuance by the sub-holding company. However, we believe the fund-raising plan has not been finalised yet.
Management guides that 14 toll road concessions will be placed under the sub-holding company, of which 10 concessions are majority/wholly-owned by JSMR and four concessions are majority/wholly-owned by WTR. Four of the ten JSMR toll road concessions included in the JV are mature toll roads. They are: 1) Jakarta-Cikampek, 2) Semarang, 3) Palimanan-Kanci, and 4) Surabaya-Gempol.
In the past, WTR stated that it intended to sell four of the toll road assets to be included in the Trans-Java sub-holding company. They are: 1) Pejagan-Pemalang, 2) Kanci-Pejagan, 3) Pasuruan-Probolinggo, and 4) Pemalang-Batang. WTR said that there were 13 interested parties, including JSMR (confirmed by JSMR’s management). If JSMR passes, these assets would be taken over by other parties but would still be put under Jasamaraga Transjawa Tol with a share-swap agreement. We discussed WTR’s divestment plans in our report on WSKT titled “The second round of capital recycling” dated 2 Jun 2017.
Toll Roads│Indonesia│Jasa Marga│July 18, 2017
26
Figure 45: List of toll roads to be included in Jasamarga Transjawa Tol
SOURCES: CIMB, COMPANY REPORTS
>> Potential upside from complementary toll roads
We expect Trans-Java toll road traffic volumes in the future to increase due to linkages to complementary Trans-Java toll roads.
GREATER JAKARTA SUB-HOLDING COMPANY NEXT, POSSIBLY
Management guided that JSMR may form a Greater Jakarta sub-holding company in the future. We think this sub-holding company would hold the Jakarta Outer Ring Road (JORR) 1, JORR 2, Bogor Outer Ring road (BORR) and Jakarta Inner Ring Road (JIRR).
EARNINGS OUTLOOK
Toll road revenue
Revenue contributors
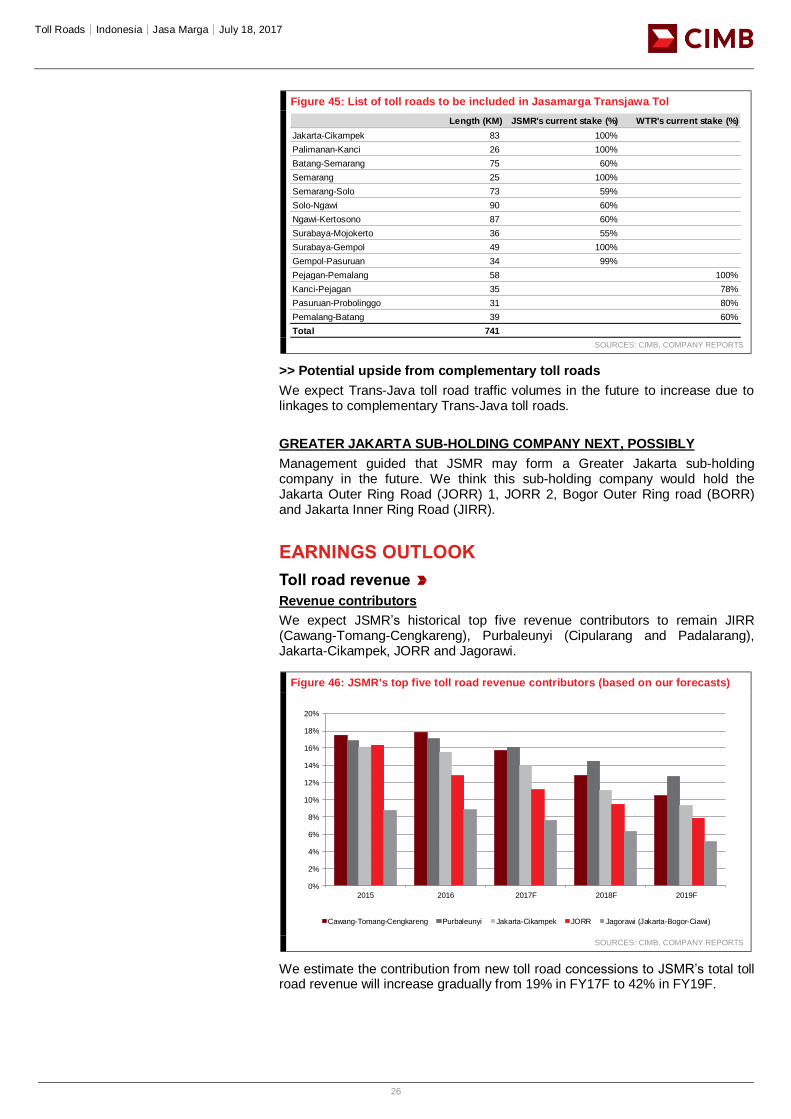
We expect JSMR’s historical top five revenue contributors to remain JIRR (Cawang-Tomang-Cengkareng), Purbaleunyi (Cipularang and Padalarang), Jakarta-Cikampek, JORR and Jagorawi.
Figure 46: JSMR's top five toll road revenue contributors (based on our forecasts)
SOURCES: CIMB, COMPANY REPORTS
We estimate the contribution from new toll road concessions to JSMR’s total toll road revenue will increase gradually from 19% in FY17F to 42% in FY19F.
Length (KM) JSMR's current stake (%) WTR's current stake (%)
Jakarta-Cikampek 83 100%
Palimanan-Kanci 26 100%
Batang-Semarang 75 60%
Semarang 25 100%
Semarang-Solo 73 59%
Solo-Ngawi 90 60%
Ngawi-Kertosono 87 60%
Surabaya-Mojokerto 36 55%
Surabaya-Gempol 49 100%
Gempol-Pasuruan 34 99%
Pejagan-Pemalang 58 100%
Kanci-Pejagan 35 78%
Pasuruan-Probolinggo 31 80%
Pemalang-Batang 39 60%
Total 741
Title:
Source:
Please fill in the values above to have them entered in your report
0%
2%
4%
6%
8%
10%
12%
14%
16%
18%
20%
2015 2016 2017F 2018F 2019F
Cawang-Tomang-Cengkareng Purbaleunyi Jakarta-Cikampek JORR Jagorawi (Jakarta-Bogor-Ciawi)
Toll Roads│Indonesia│Jasa Marga│July 18, 2017
27
Figure 47: Toll road revenue breakdown (based on our forecasts)
SOURCES: CIMB, COMPANY REPORTS
Revenue assumptions
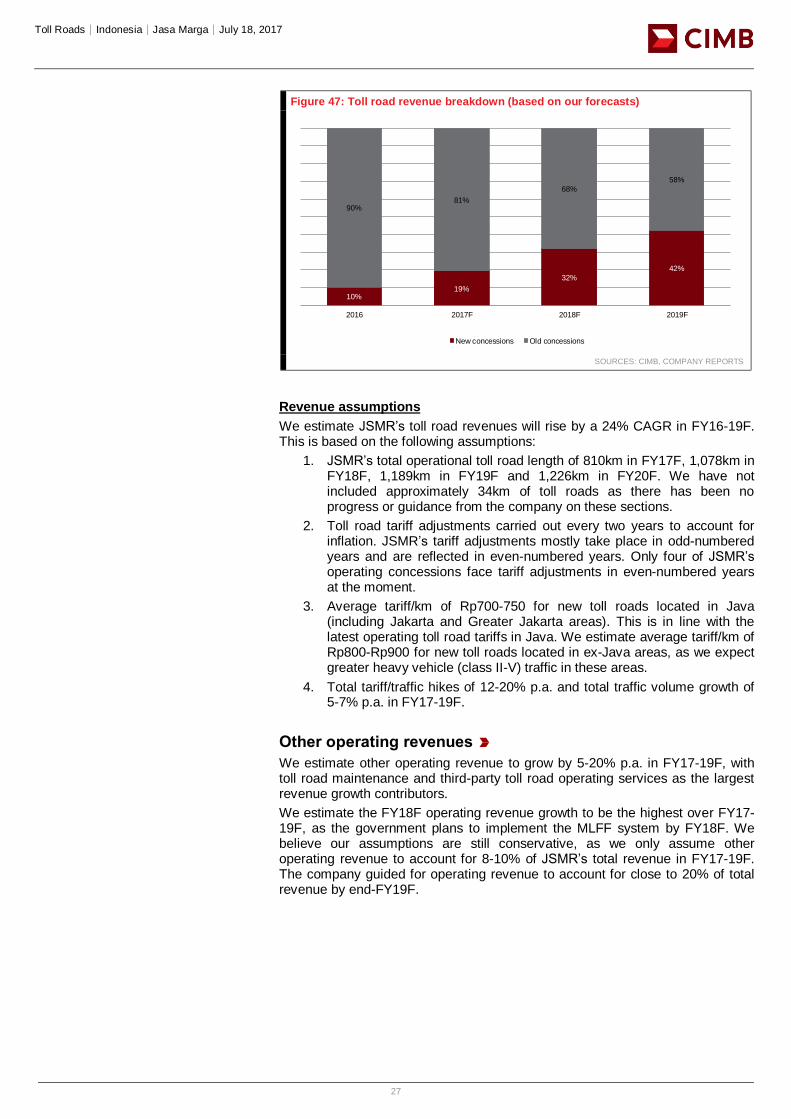
We estimate JSMR’s toll road revenues will rise by a 24% CAGR in FY16-19F. This is based on the following assumptions:
1. JSMR’s total operational toll road length of 810km in FY17F, 1,078km in FY18F, 1,189km in FY19F and 1,226km in FY20F. We have not included approximately 34km of toll roads as there has been no progress or guidance from the company on these sections.
2. Toll road tariff adjustments carried out every two years to account for inflation. JSMR’s tariff adjustments mostly take place in odd-numbered years and are reflected in even-numbered years. Only four of JSMR’s operating concessions face tariff adjustments in even-numbered years at the moment.
3. Average tariff/km of Rp700-750 for new toll roads located in Java (including Jakarta and Greater Jakarta areas). This is in line with the latest operating toll road tariffs in Java. We estimate average tariff/km of Rp800-Rp900 for new toll roads located in ex-Java areas, as we expect greater heavy vehicle (class II-V) traffic in these areas.
4. Total tariff/traffic hikes of 12-20% p.a. and total traffic volume growth of 5-7% p.a. in FY17-19F.
Other operating revenues
We estimate other operating revenue to grow by 5-20% p.a. in FY17-19F, with toll road maintenance and third-party toll road operating services as the largest revenue growth contributors.
We estimate the FY18F operating revenue growth to be the highest over FY17-19F, as the government plans to implement the MLFF system by FY18F. We believe our assumptions are still conservative, as we only assume other operating revenue to account for 8-10% of JSMR’s total revenue in FY17-19F. The company guided for operating revenue to account for close to 20% of total revenue by end-FY19F.
Title:
Source:
Please fill in the values above to have them entered in your report
10%19%
32%
42%
90%81%
68%
58%
2016 2017F 2018F 2019F
New concessions Old concessions
Toll Roads│Indonesia│Jasa Marga│July 18, 2017
28
Figure 48: JSMR's other operating revenue (excluding construction) in FY17-19F (Rp bn), based on our forecasts
SOURCES: CIMB, COMPANY REPORTS
EBITDA outlook
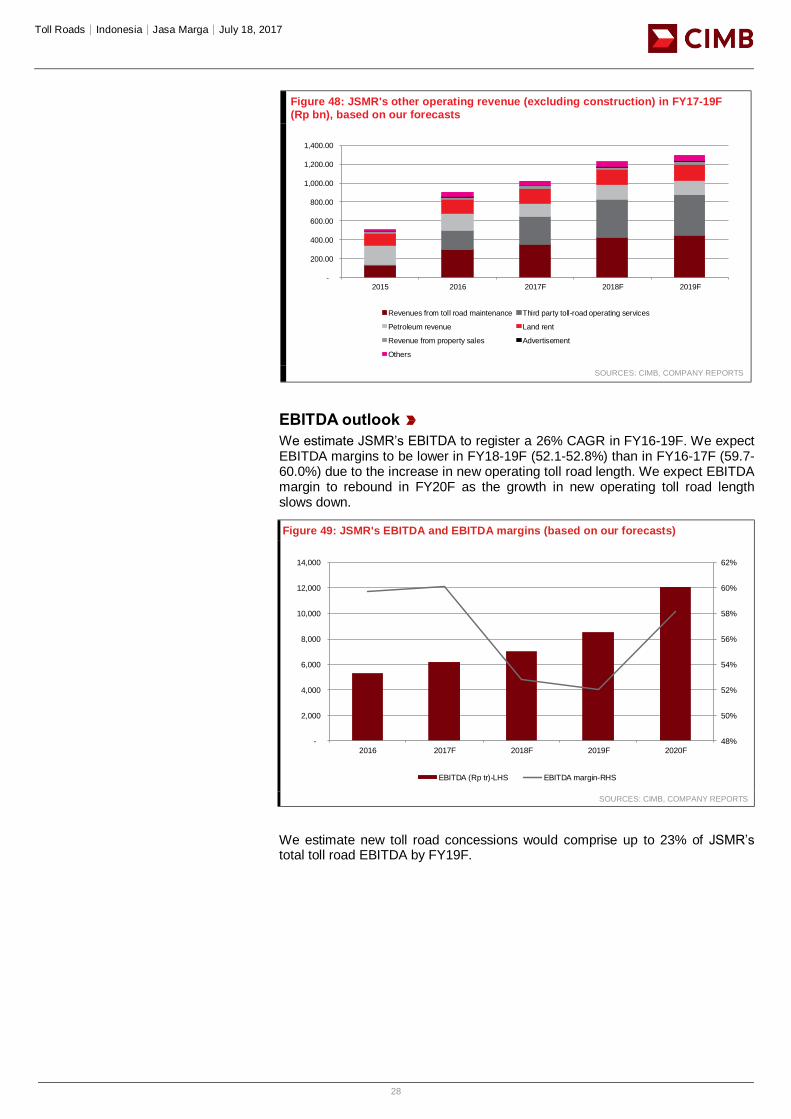
We estimate JSMR’s EBITDA to register a 26% CAGR in FY16-19F. We expect EBITDA margins to be lower in FY18-19F (52.1-52.8%) than in FY16-17F (59.7-60.0%) due to the increase in new operating toll road length. We expect EBITDA margin to rebound in FY20F as the growth in new operating toll road length slows down.
Figure 49: JSMR's EBITDA and EBITDA margins (based on our forecasts)
SOURCES: CIMB, COMPANY REPORTS
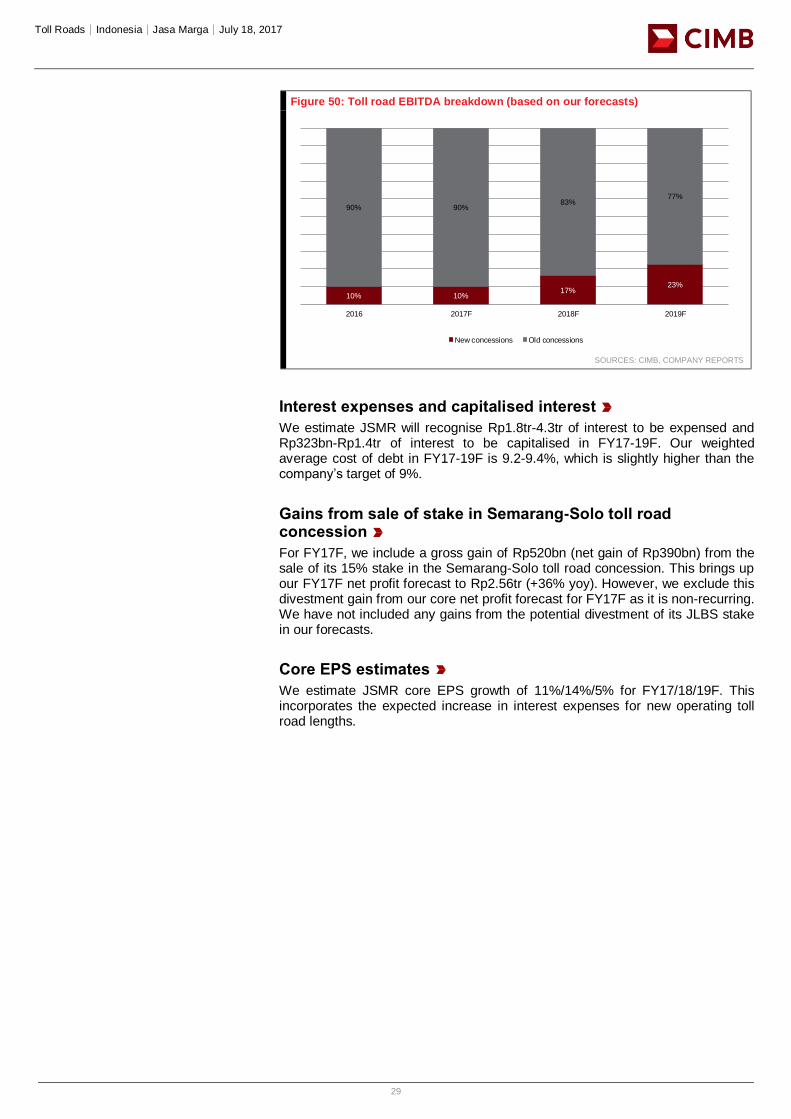
We estimate new toll road concessions would comprise up to 23% of JSMR’s total toll road EBITDA by FY19F.
Title:
Source:
Please fill in the values above to have them entered in your report
-
200.00
400.00
600.00
800.00
1,000.00
1,200.00
1,400.00
2015 2016 2017F 2018F 2019F
Revenues from toll road maintenance Third party toll-road operating services
Petroleum revenue Land rent
Revenue from property sales Advertisement
Others
Title:
Source:
Please fill in the values above to have them entered in your report
48%
50%
52%
54%
56%
58%
60%
62%
-
2,000
4,000
6,000
8,000
10,000
12,000
14,000
2016 2017F 2018F 2019F 2020F
EBITDA (Rp tr)-LHS EBITDA margin-RHS
Toll Roads│Indonesia│Jasa Marga│July 18, 2017
29
Figure 50: Toll road EBITDA breakdown (based on our forecasts)
SOURCES: CIMB, COMPANY REPORTS
Interest expenses and capitalised interest
We estimate JSMR will recognise Rp1.8tr-4.3tr of interest to be expensed and Rp323bn-Rp1.4tr of interest to be capitalised in FY17-19F. Our weighted average cost of debt in FY17-19F is 9.2-9.4%, which is slightly higher than the company’s target of 9%.
Gains from sale of stake in Semarang-Solo toll road concession
For FY17F, we include a gross gain of Rp520bn (net gain of Rp390bn) from the sale of its 15% stake in the Semarang-Solo toll road concession. This brings up our FY17F net profit forecast to Rp2.56tr (+36% yoy). However, we exclude this divestment gain from our core net profit forecast for FY17F as it is non-recurring. We have not included any gains from the potential divestment of its JLBS stake in our forecasts.
Core EPS estimates
We estimate JSMR core EPS growth of 11%/14%/5% for FY17/18/19F. This incorporates the expected increase in interest expenses for new operating toll road lengths.
Title:
Source:
Please fill in the values above to have them entered in your report
10% 10%17%
23%
90% 90%83%
77%
2016 2017F 2018F 2019F
New concessions Old concessions
Toll Roads│Indonesia│Jasa Marga│July 18, 2017
30
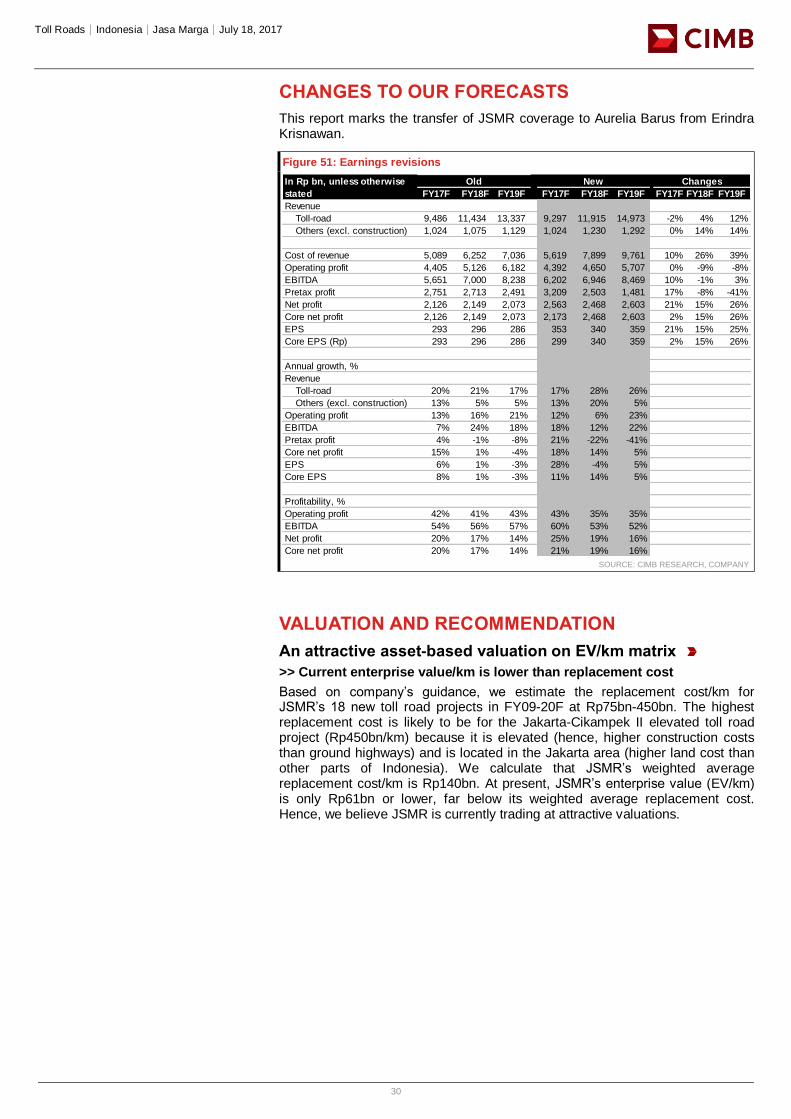
CHANGES TO OUR FORECASTS
This report marks the transfer of JSMR coverage to Aurelia Barus from Erindra Krisnawan.
Figure 51: Earnings revisions
SOURCE: CIMB RESEARCH, COMPANY
VALUATION AND RECOMMENDATION
An attractive asset-based valuation on EV/km matrix
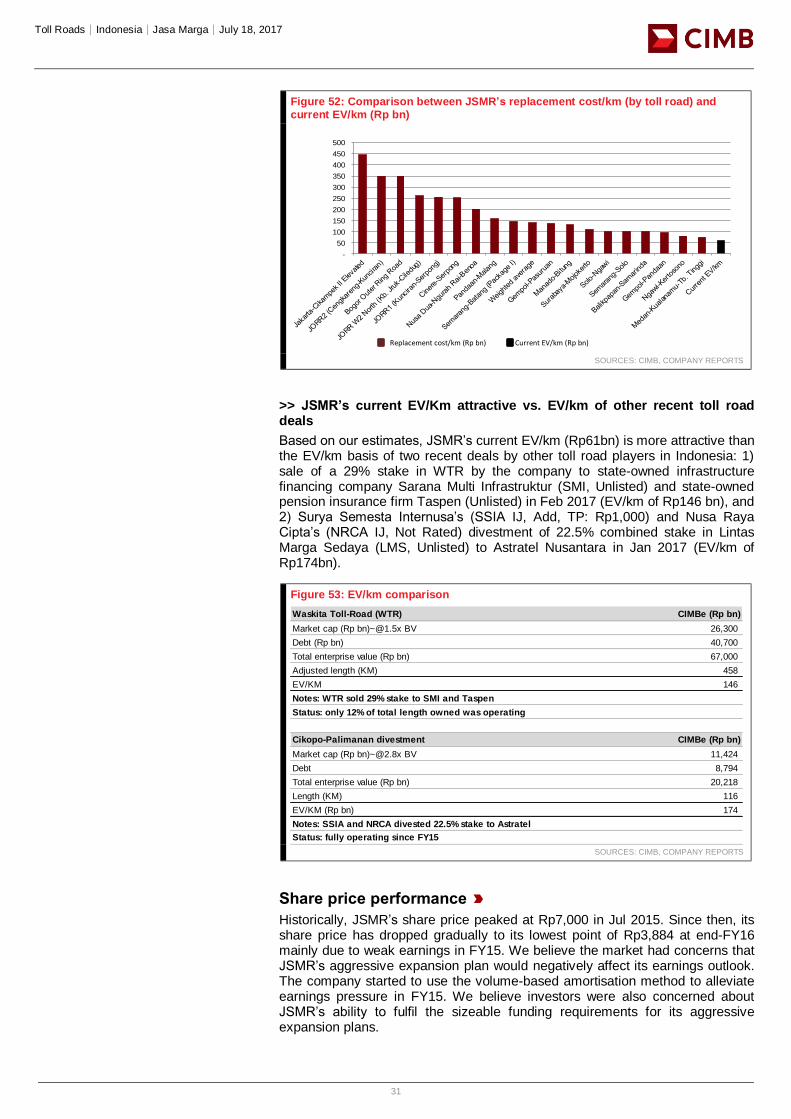
>> Current enterprise value/km is lower than replacement cost
Based on company’s guidance, we estimate the replacement cost/km for JSMR’s 18 new toll road projects in FY09-20F at Rp75bn-450bn. The highest replacement cost is likely to be for the Jakarta-Cikampek II elevated toll road project (Rp450bn/km) because it is elevated (hence, higher construction costs than ground highways) and is located in the Jakarta area (higher land cost than other parts of Indonesia). We calculate that JSMR’s weighted average replacement cost/km is Rp140bn. At present, JSMR’s enterprise value (EV/km) is only Rp61bn or lower, far below its weighted average replacement cost. Hence, we believe JSMR is currently trading at attractive valuations.
FY17F FY18F FY19F FY17F FY18F FY19F FY17F FY18F FY19F
Revenue
Toll-road 9,486 11,434 13,337 9,297 11,915 14,973 -2% 4% 12%
Others (excl. construction) 1,024 1,075 1,129 1,024 1,230 1,292 0% 14% 14%
Cost of revenue 5,089 6,252 7,036 5,619 7,899 9,761 10% 26% 39%
Operating profit 4,405 5,126 6,182 4,392 4,650 5,707 0% -9% -8%
EBITDA 5,651 7,000 8,238 6,202 6,946 8,469 10% -1% 3%
Pretax profit 2,751 2,713 2,491 3,209 2,503 1,481 17% -8% -41%
Net profit 2,126 2,149 2,073 2,563 2,468 2,603 21% 15% 26%
Core net profit 2,126 2,149 2,073 2,173 2,468 2,603 2% 15% 26%
EPS 293 296 286 353 340 359 21% 15% 25%
Core EPS (Rp) 293 296 286 299 340 359 2% 15% 26%
Annual growth, %
Revenue
Toll-road 20% 21% 17% 17% 28% 26%
Others (excl. construction) 13% 5% 5% 13% 20% 5%
Operating profit 13% 16% 21% 12% 6% 23%
EBITDA 7% 24% 18% 18% 12% 22%
Pretax profit 4% -1% -8% 21% -22% -41%
Core net profit 15% 1% -4% 18% 14% 5%
EPS 6% 1% -3% 28% -4% 5%
Core EPS 8% 1% -3% 11% 14% 5%
Profitability, %
Operating profit 42% 41% 43% 43% 35% 35%
EBITDA 54% 56% 57% 60% 53% 52%
Net profit 20% 17% 14% 25% 19% 16%
Core net profit 20% 17% 14% 21% 19% 16%
In Rp bn, unless otherwise
stated
Old New Changes
Toll Roads│Indonesia│Jasa Marga│July 18, 2017
31
Figure 52: Comparison between JSMR’s replacement cost/km (by toll road) and current EV/km (Rp bn)
SOURCES: CIMB, COMPANY REPORTS
>> JSMR’s current EV/Km attractive vs. EV/km of other recent toll road deals
Based on our estimates, JSMR’s current EV/km (Rp61bn) is more attractive than the EV/km basis of two recent deals by other toll road players in Indonesia: 1) sale of a 29% stake in WTR by the company to state-owned infrastructure financing company Sarana Multi Infrastruktur (SMI, Unlisted) and state-owned pension insurance firm Taspen (Unlisted) in Feb 2017 (EV/km of Rp146 bn), and 2) Surya Semesta Internusa’s (SSIA IJ, Add, TP: Rp1,000) and Nusa Raya Cipta’s (NRCA IJ, Not Rated) divestment of 22.5% combined stake in Lintas Marga Sedaya (LMS, Unlisted) to Astratel Nusantara in Jan 2017 (EV/km of Rp174bn).
Figure 53: EV/km comparison
SOURCES: CIMB, COMPANY REPORTS
Share price performance
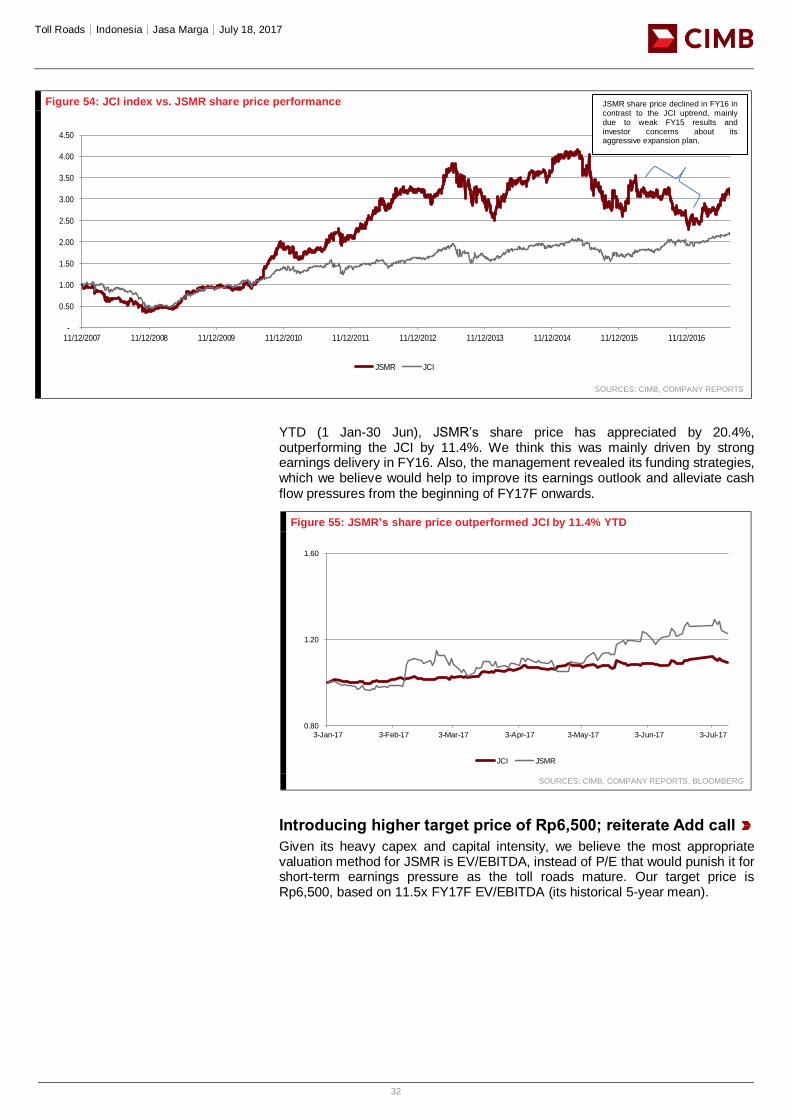
Historically, JSMR’s share price peaked at Rp7,000 in Jul 2015. Since then, its share price has dropped gradually to its lowest point of Rp3,884 at end-FY16 mainly due to weak earnings in FY15. We believe the market had concerns that JSMR’s aggressive expansion plan would negatively affect its earnings outlook. The company started to use the volume-based amortisation method to alleviate earnings pressure in FY15. We believe investors were also concerned about JSMR’s ability to fulfil the sizeable funding requirements for its aggressive expansion plans.
Title:
Source:
Please fill in the values above to have them entered in your report
-
50
100
150
200
250
300
350
400
450
500
Waskita Toll-Road (WTR) CIMBe (Rp bn)
Market cap (Rp bn)[email protected] BV 26,300
Debt (Rp bn) 40,700
Total enterprise value (Rp bn) 67,000
Adjusted length (KM) 458
EV/KM 146
Cikopo-Palimanan divestment CIMBe (Rp bn)
Market cap (Rp bn)[email protected] BV 11,424
Debt 8,794
Total enterprise value (Rp bn) 20,218
Length (KM) 116
EV/KM (Rp bn) 174
Status: fully operating since FY15
Notes: WTR sold 29% stake to SMI and Taspen
Status: only 12% of total length owned was operating
Notes: SSIA and NRCA divested 22.5% stake to Astratel
Replacement cost/km (Rp bn) Current EV/km (Rp bn)
Toll Roads│Indonesia│Jasa Marga│July 18, 2017
32
Figure 54: JCI index vs. JSMR share price performance
SOURCES: CIMB, COMPANY REPORTS
YTD (1 Jan-30 Jun), JSMR’s share price has appreciated by 20.4%, outperforming the JCI by 11.4%. We think this was mainly driven by strong earnings delivery in FY16. Also, the management revealed its funding strategies, which we believe would help to improve its earnings outlook and alleviate cash flow pressures from the beginning of FY17F onwards.
Figure 55: JSMR’s share price outperformed JCI by 11.4% YTD
SOURCES: CIMB, COMPANY REPORTS, BLOOMBERG
Introducing higher target price of Rp6,500; reiterate Add call
Given its heavy capex and capital intensity, we believe the most appropriate valuation method for JSMR is EV/EBITDA, instead of P/E that would punish it for short-term earnings pressure as the toll roads mature. Our target price is Rp6,500, based on 11.5x FY17F EV/EBITDA (its historical 5-year mean).
Title:
Source:
Please fill in the values above to have them entered in your report
-
0.50
1.00
1.50
2.00
2.50
3.00
3.50
4.00
4.50
11/12/2007 11/12/2008 11/12/2009 11/12/2010 11/12/2011 11/12/2012 11/12/2013 11/12/2014 11/12/2015 11/12/2016
JSMR JCI
Title:
Source:
Please fill in the values above to have them entered in your report
0.80
1.20
1.60
3-Jan-17 3-Feb-17 3-Mar-17 3-Apr-17 3-May-17 3-Jun-17 3-Jul-17
JCI JSMR
JSMR share price declined in FY16 in contrast to the JCI uptrend, mainly due to weak FY15 results and investor concerns about its aggressive expansion plan.
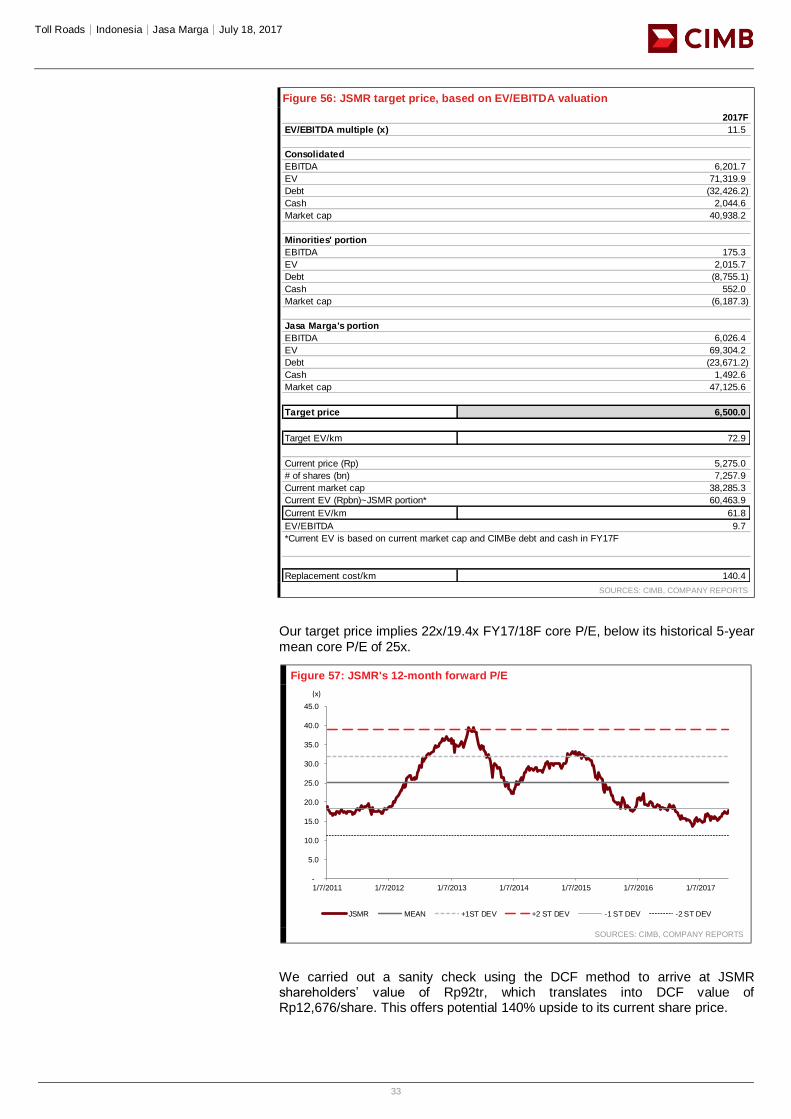
Toll Roads│Indonesia│Jasa Marga│July 18, 2017
33
Figure 56: JSMR target price, based on EV/EBITDA valuation
SOURCES: CIMB, COMPANY REPORTS
Our target price implies 22x/19.4x FY17/18F core P/E, below its historical 5-year mean core P/E of 25x.
Figure 57: JSMR's 12-month forward P/E
SOURCES: CIMB, COMPANY REPORTS
We carried out a sanity check using the DCF method to arrive at JSMR shareholders’ value of Rp92tr, which translates into DCF value of Rp12,676/share. This offers potential 140% upside to its current share price.
2017F
EV/EBITDA multiple (x) 11.5
Consolidated
EBITDA 6,201.7
EV 71,319.9
Debt (32,426.2)
Cash 2,044.6
Market cap 40,938.2
Minorities' portion
EBITDA 175.3
EV 2,015.7
Debt (8,755.1)
Cash 552.0
Market cap (6,187.3)
Jasa Marga's portion
EBITDA 6,026.4
EV 69,304.2
Debt (23,671.2)
Cash 1,492.6
Market cap 47,125.6
Target price 6,500.0
Target EV/km 72.9
Current price (Rp) 5,275.0
# of shares (bn) 7,257.9
Current market cap 38,285.3
Current EV (Rpbn)~JSMR portion* 60,463.9
Current EV/km 61.8
EV/EBITDA 9.7
*Current EV is based on current market cap and CIMBe debt and cash in FY17F
Replacement cost/km 140.4
Title:
Source:
Please fill in the values above to have them entered in your report
-
5.0
10.0
15.0
20.0
25.0
30.0
35.0
40.0
45.0
1/7/2011 1/7/2012 1/7/2013 1/7/2014 1/7/2015 1/7/2016 1/7/2017
JSMR MEAN +1ST DEV +2 ST DEV -1 ST DEV -2 ST DEV
(x)
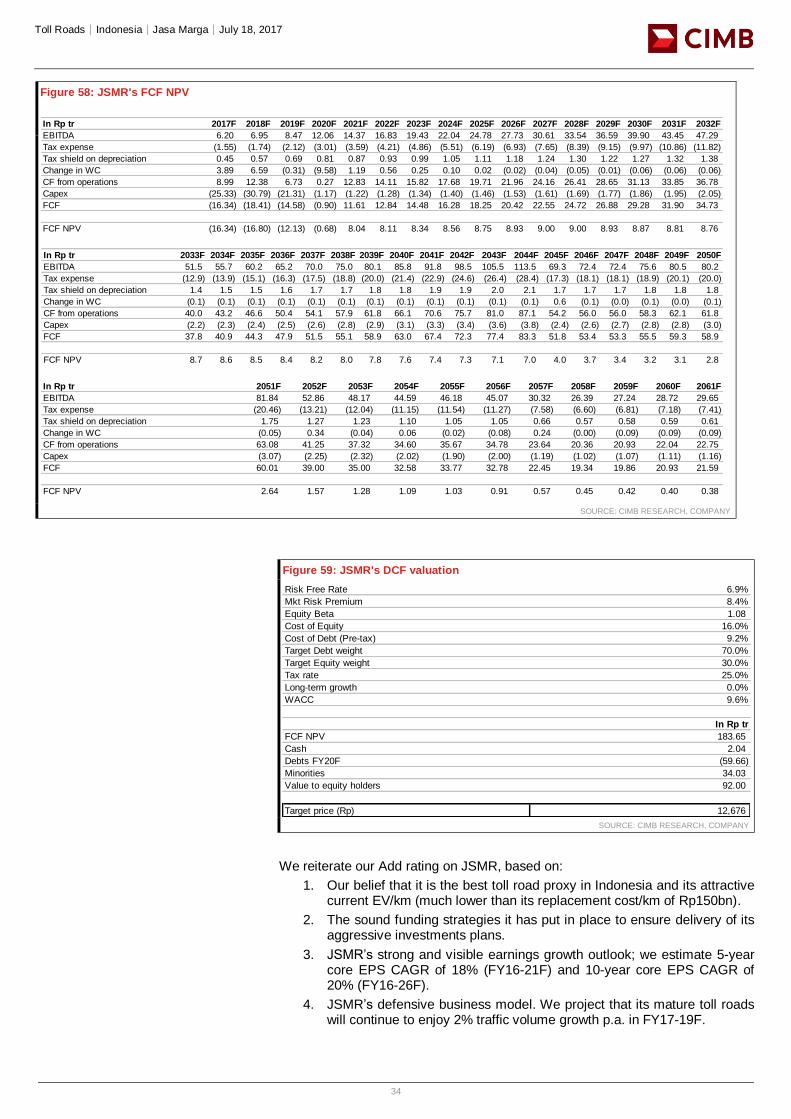
Toll Roads│Indonesia│Jasa Marga│July 18, 2017
34
Figure 58: JSMR's FCF NPV
SOURCE: CIMB RESEARCH, COMPANY
Figure 59: JSMR's DCF valuation
SOURCE: CIMB RESEARCH, COMPANY
We reiterate our Add rating on JSMR, based on:
1. Our belief that it is the best toll road proxy in Indonesia and its attractive current EV/km (much lower than its replacement cost/km of Rp150bn).
2. The sound funding strategies it has put in place to ensure delivery of its aggressive investments plans.
3. JSMR’s strong and visible earnings growth outlook; we estimate 5-year core EPS CAGR of 18% (FY16-21F) and 10-year core EPS CAGR of 20% (FY16-26F).
4. JSMR’s defensive business model. We project that its mature toll roads will continue to enjoy 2% traffic volume growth p.a. in FY17-19F.
Risk Free Rate 6.9%
Mkt Risk Premium 8.4%
Equity Beta 1.08
Cost of Equity 16.0%
Cost of Debt (Pre-tax) 9.2%
Target Debt weight 70.0%
Target Equity weight 30.0%
Tax rate 25.0%
Long-term growth 0.0%
WACC 9.6%
In Rp tr
FCF NPV 183.65
Cash 2.04
Debts FY20F (59.66)
Minorities 34.03
Value to equity holders 92.00
Target price (Rp) 12,676
In Rp tr 2017F 2018F 2019F 2020F 2021F 2022F 2023F 2024F 2025F 2026F 2027F 2028F 2029F 2030F 2031F 2032F
EBITDA 6.20 6.95 8.47 12.06 14.37 16.83 19.43 22.04 24.78 27.73 30.61 33.54 36.59 39.90 43.45 47.29
Tax expense (1.55) (1.74) (2.12) (3.01) (3.59) (4.21) (4.86) (5.51) (6.19) (6.93) (7.65) (8.39) (9.15) (9.97) (10.86) (11.82)
Tax shield on depreciation 0.45 0.57 0.69 0.81 0.87 0.93 0.99 1.05 1.11 1.18 1.24 1.30 1.22 1.27 1.32 1.38
Change in WC 3.89 6.59 (0.31) (9.58) 1.19 0.56 0.25 0.10 0.02 (0.02) (0.04) (0.05) (0.01) (0.06) (0.06) (0.06)
CF from operations 8.99 12.38 6.73 0.27 12.83 14.11 15.82 17.68 19.71 21.96 24.16 26.41 28.65 31.13 33.85 36.78
Capex (25.33) (30.79) (21.31) (1.17) (1.22) (1.28) (1.34) (1.40) (1.46) (1.53) (1.61) (1.69) (1.77) (1.86) (1.95) (2.05)
FCF (16.34) (18.41) (14.58) (0.90) 11.61 12.84 14.48 16.28 18.25 20.42 22.55 24.72 26.88 29.28 31.90 34.73
FCF NPV (16.34) (16.80) (12.13) (0.68) 8.04 8.11 8.34 8.56 8.75 8.93 9.00 9.00 8.93 8.87 8.81 8.76
In Rp tr 2033F 2034F 2035F 2036F 2037F 2038F 2039F 2040F 2041F 2042F 2043F 2044F 2045F 2046F 2047F 2048F 2049F 2050F
EBITDA 51.5 55.7 60.2 65.2 70.0 75.0 80.1 85.8 91.8 98.5 105.5 113.5 69.3 72.4 72.4 75.6 80.5 80.2
Tax expense (12.9) (13.9) (15.1) (16.3) (17.5) (18.8) (20.0) (21.4) (22.9) (24.6) (26.4) (28.4) (17.3) (18.1) (18.1) (18.9) (20.1) (20.0)
Tax shield on depreciation 1.4 1.5 1.5 1.6 1.7 1.7 1.8 1.8 1.9 1.9 2.0 2.1 1.7 1.7 1.7 1.8 1.8 1.8
Change in WC (0.1) (0.1) (0.1) (0.1) (0.1) (0.1) (0.1) (0.1) (0.1) (0.1) (0.1) (0.1) 0.6 (0.1) (0.0) (0.1) (0.0) (0.1)
CF from operations 40.0 43.2 46.6 50.4 54.1 57.9 61.8 66.1 70.6 75.7 81.0 87.1 54.2 56.0 56.0 58.3 62.1 61.8
Capex (2.2) (2.3) (2.4) (2.5) (2.6) (2.8) (2.9) (3.1) (3.3) (3.4) (3.6) (3.8) (2.4) (2.6) (2.7) (2.8) (2.8) (3.0)
FCF 37.8 40.9 44.3 47.9 51.5 55.1 58.9 63.0 67.4 72.3 77.4 83.3 51.8 53.4 53.3 55.5 59.3 58.9
FCF NPV 8.7 8.6 8.5 8.4 8.2 8.0 7.8 7.6 7.4 7.3 7.1 7.0 4.0 3.7 3.4 3.2 3.1 2.8
In Rp tr 2051F 2052F 2053F 2054F 2055F 2056F 2057F 2058F 2059F 2060F 2061F
EBITDA 81.84 52.86 48.17 44.59 46.18 45.07 30.32 26.39 27.24 28.72 29.65
Tax expense (20.46) (13.21) (12.04) (11.15) (11.54) (11.27) (7.58) (6.60) (6.81) (7.18) (7.41)
Tax shield on depreciation 1.75 1.27 1.23 1.10 1.05 1.05 0.66 0.57 0.58 0.59 0.61
Change in WC (0.05) 0.34 (0.04) 0.06 (0.02) (0.08) 0.24 (0.00) (0.09) (0.09) (0.09)
CF from operations 63.08 41.25 37.32 34.60 35.67 34.78 23.64 20.36 20.93 22.04 22.75
Capex (3.07) (2.25) (2.32) (2.02) (1.90) (2.00) (1.19) (1.02) (1.07) (1.11) (1.16)
FCF 60.01 39.00 35.00 32.58 33.77 32.78 22.45 19.34 19.86 20.93 21.59
FCF NPV 2.64 1.57 1.28 1.09 1.03 0.91 0.57 0.45 0.42 0.40 0.38
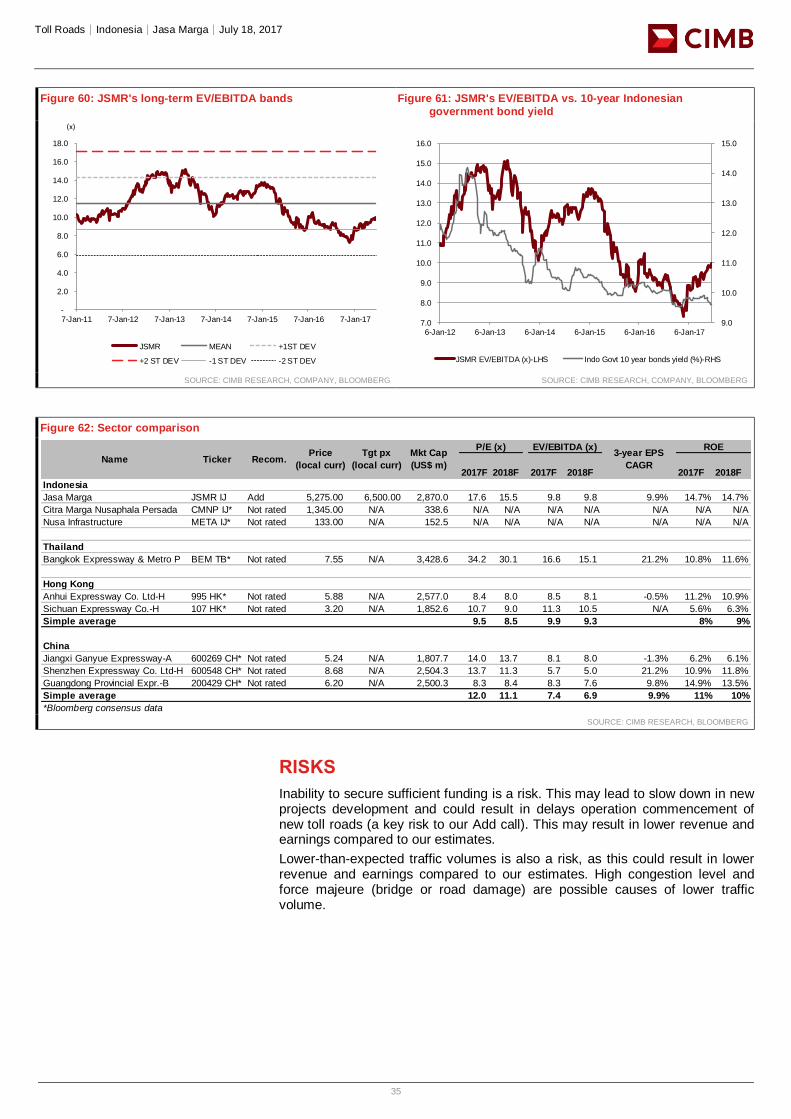
Toll Roads│Indonesia│Jasa Marga│July 18, 2017
35
Figure 60: JSMR's long-term EV/EBITDA bands Figure 61: JSMR's EV/EBITDA vs. 10-year Indonesian government bond yield
SOURCE: CIMB RESEARCH, COMPANY, BLOOMBERG SOURCE: CIMB RESEARCH, COMPANY, BLOOMBERG
Figure 62: Sector comparison
SOURCE: CIMB RESEARCH, BLOOMBERG
RISKS
Inability to secure sufficient funding is a risk. This may lead to slow down in new projects development and could result in delays operation commencement of new toll roads (a key risk to our Add call). This may result in lower revenue and earnings compared to our estimates.
Lower-than-expected traffic volumes is also a risk, as this could result in lower revenue and earnings compared to our estimates. High congestion level and force majeure (bridge or road damage) are possible causes of lower traffic volume.
Title:
Source:
Please fill in the values above to have them entered in your report
-
2.0
4.0
6.0
8.0
10.0
12.0
14.0
16.0
18.0
7-Jan-11 7-Jan-12 7-Jan-13 7-Jan-14 7-Jan-15 7-Jan-16 7-Jan-17
JSMR MEAN +1ST DEV
+2 ST DEV -1 ST DEV -2 ST DEV
Title:
Source:
Please fill in the values above to have them entered in your report
9.0
10.0
11.0
12.0
13.0
14.0
15.0
7.0
8.0
9.0
10.0
11.0
12.0
13.0
14.0
15.0
16.0
6-Jan-12 6-Jan-13 6-Jan-14 6-Jan-15 6-Jan-16 6-Jan-17
JSMR EV/EBITDA (x)-LHS Indo Govt 10 year bonds yield (%)-RHS
2017F 2018F 2017F 2018F 2017F 2018F
Indonesia
Jasa Marga JSMR IJ Add 5,275.00 6,500.00 2,870.0 17.6 15.5 9.8 9.8 9.9% 14.7% 14.7%
Citra Marga Nusaphala Persada CMNP IJ* Not rated 1,345.00 N/A 338.6 N/A N/A N/A N/A N/A N/A N/A
Nusa Infrastructure META IJ* Not rated 133.00 N/A 152.5 N/A N/A N/A N/A N/A N/A N/A
Thailand
Bangkok Expressway & Metro P BEM TB* Not rated 7.55 N/A 3,428.6 34.2 30.1 16.6 15.1 21.2% 10.8% 11.6%
Hong Kong
Anhui Expressway Co. Ltd-H 995 HK* Not rated 5.88 N/A 2,577.0 8.4 8.0 8.5 8.1 -0.5% 11.2% 10.9%
Sichuan Expressway Co.-H 107 HK* Not rated 3.20 N/A 1,852.6 10.7 9.0 11.3 10.5 N/A 5.6% 6.3%
Simple average 9.5 8.5 9.9 9.3 8% 9%
China
Jiangxi Ganyue Expressway-A 600269 CH* Not rated 5.24 N/A 1,807.7 14.0 13.7 8.1 8.0 -1.3% 6.2% 6.1%
Shenzhen Expressway Co. Ltd-H 600548 CH* Not rated 8.68 N/A 2,504.3 13.7 11.3 5.7 5.0 21.2% 10.9% 11.8%
Guangdong Provincial Expr.-B 200429 CH* Not rated 6.20 N/A 2,500.3 8.3 8.4 8.3 7.6 9.8% 14.9% 13.5%
Simple average 12.0 11.1 7.4 6.9 9.9% 11% 10%
*Bloomberg consensus data
P/E (x) EV/EBITDA (x) ROE
TickerName Recom. Price
(local curr)
Tgt px
(local curr)
Mkt Cap
(US$ m)
3-year EPS
CAGR
(x)
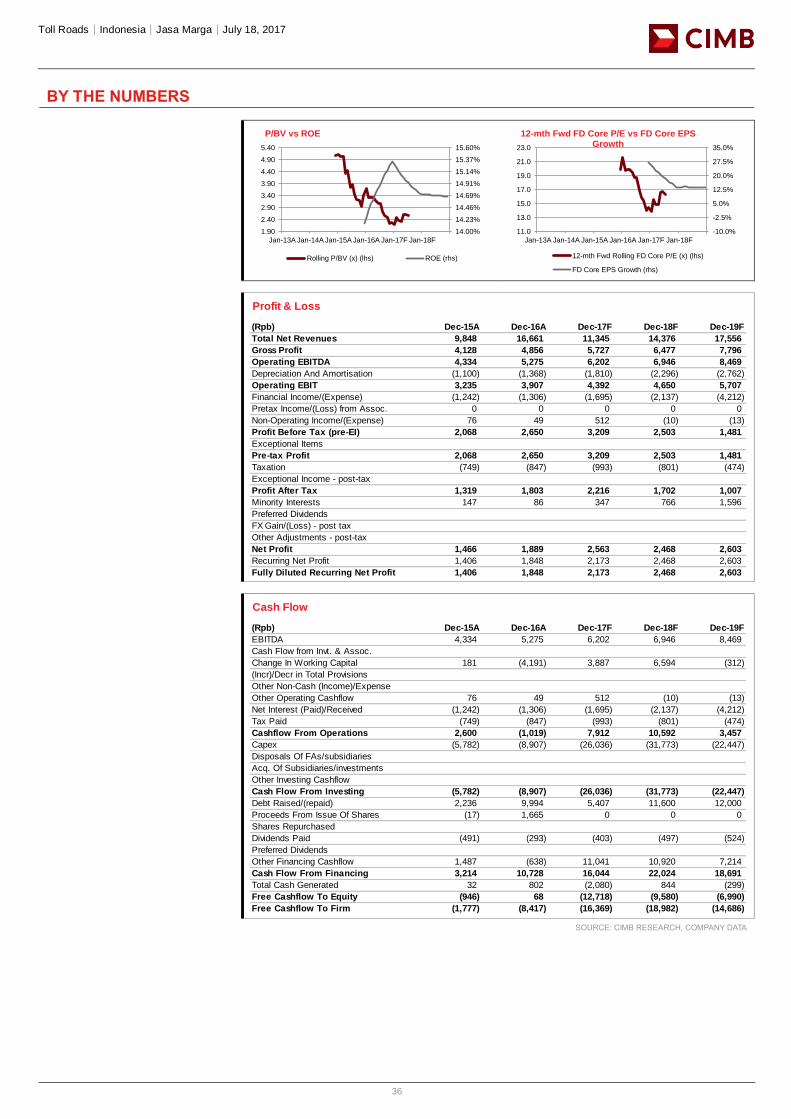
Toll Roads│Indonesia│Jasa Marga│July 18, 2017
36
BY THE NUMBERS
SOURCE: CIMB RESEARCH, COMPANY DATA
14.00%
14.23%
14.46%
14.69%
14.91%
15.14%
15.37%
15.60%
1.90
2.40
2.90
3.40
3.90
4.40
4.90
5.40
Jan-13A Jan-14A Jan-15A Jan-16A Jan-17F Jan-18F
P/BV vs ROE
Rolling P/BV (x) (lhs) ROE (rhs)
-10.0%
-2.5%
5.0%
12.5%
20.0%
27.5%
35.0%
11.0
13.0
15.0
17.0
19.0
21.0
23.0
Jan-13A Jan-14A Jan-15A Jan-16A Jan-17F Jan-18F
12-mth Fwd FD Core P/E vs FD Core EPS Growth
12-mth Fwd Rolling FD Core P/E (x) (lhs)
FD Core EPS Growth (rhs)
Profit & Loss
(Rpb) Dec-15A Dec-16A Dec-17F Dec-18F Dec-19F
Total Net Revenues 9,848 16,661 11,345 14,376 17,556
Gross Profit 4,128 4,856 5,727 6,477 7,796
Operating EBITDA 4,334 5,275 6,202 6,946 8,469
Depreciation And Amortisation (1,100) (1,368) (1,810) (2,296) (2,762)
Operating EBIT 3,235 3,907 4,392 4,650 5,707
Financial Income/(Expense) (1,242) (1,306) (1,695) (2,137) (4,212)
Pretax Income/(Loss) from Assoc. 0 0 0 0 0
Non-Operating Income/(Expense) 76 49 512 (10) (13)
Profit Before Tax (pre-EI) 2,068 2,650 3,209 2,503 1,481
Exceptional Items
Pre-tax Profit 2,068 2,650 3,209 2,503 1,481
Taxation (749) (847) (993) (801) (474)
Exceptional Income - post-tax
Profit After Tax 1,319 1,803 2,216 1,702 1,007
Minority Interests 147 86 347 766 1,596
Preferred Dividends
FX Gain/(Loss) - post tax
Other Adjustments - post-tax
Net Profit 1,466 1,889 2,563 2,468 2,603
Recurring Net Profit 1,406 1,848 2,173 2,468 2,603
Fully Diluted Recurring Net Profit 1,406 1,848 2,173 2,468 2,603
Cash Flow
(Rpb) Dec-15A Dec-16A Dec-17F Dec-18F Dec-19F
EBITDA 4,334 5,275 6,202 6,946 8,469
Cash Flow from Invt. & Assoc.
Change In Working Capital 181 (4,191) 3,887 6,594 (312)
(Incr)/Decr in Total Provisions
Other Non-Cash (Income)/Expense
Other Operating Cashflow 76 49 512 (10) (13)
Net Interest (Paid)/Received (1,242) (1,306) (1,695) (2,137) (4,212)
Tax Paid (749) (847) (993) (801) (474)
Cashflow From Operations 2,600 (1,019) 7,912 10,592 3,457
Capex (5,782) (8,907) (26,036) (31,773) (22,447)
Disposals Of FAs/subsidiaries
Acq. Of Subsidiaries/investments
Other Investing Cashflow
Cash Flow From Investing (5,782) (8,907) (26,036) (31,773) (22,447)
Debt Raised/(repaid) 2,236 9,994 5,407 11,600 12,000
Proceeds From Issue Of Shares (17) 1,665 0 0 0
Shares Repurchased
Dividends Paid (491) (293) (403) (497) (524)
Preferred Dividends
Other Financing Cashflow 1,487 (638) 11,041 10,920 7,214
Cash Flow From Financing 3,214 10,728 16,044 22,024 18,691
Total Cash Generated 32 802 (2,080) 844 (299)
Free Cashflow To Equity (946) 68 (12,718) (9,580) (6,990)
Free Cashflow To Firm (1,777) (8,417) (16,369) (18,982) (14,686)
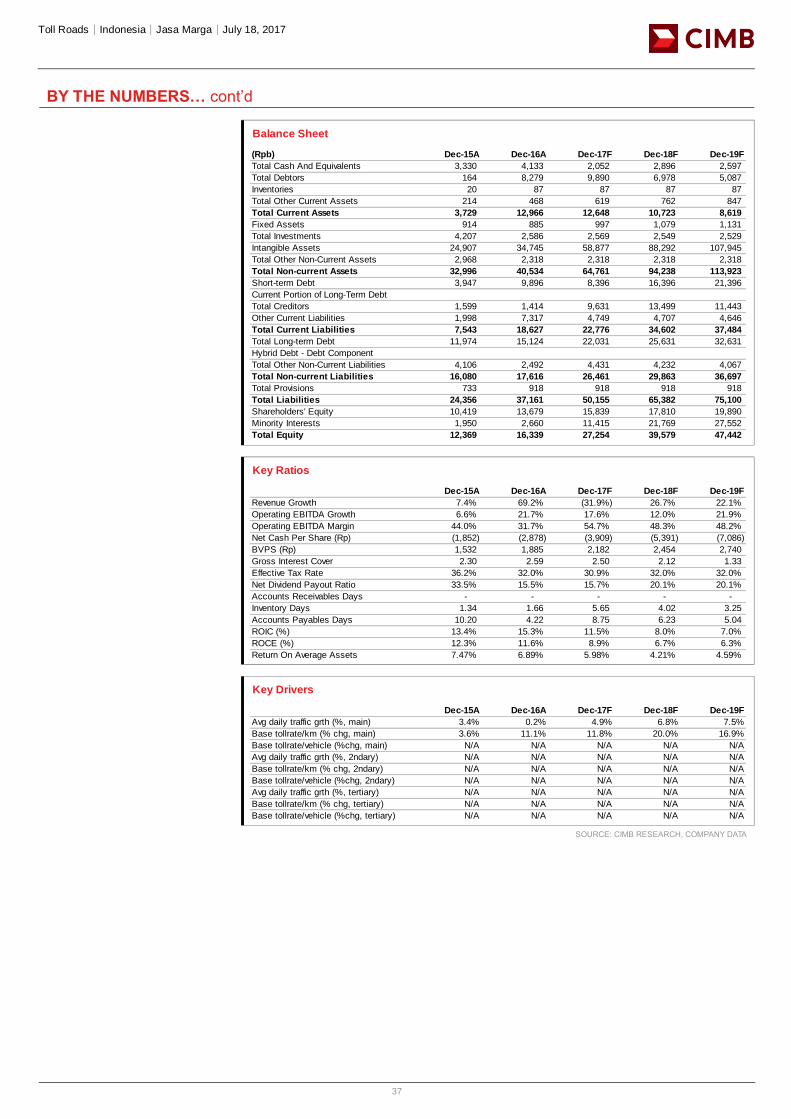
Toll Roads│Indonesia│Jasa Marga│July 18, 2017
37
BY THE NUMBERS… cont’d
SOURCE: CIMB RESEARCH, COMPANY DATA
Balance Sheet
(Rpb) Dec-15A Dec-16A Dec-17F Dec-18F Dec-19F
Total Cash And Equivalents 3,330 4,133 2,052 2,896 2,597
Total Debtors 164 8,279 9,890 6,978 5,087
Inventories 20 87 87 87 87
Total Other Current Assets 214 468 619 762 847
Total Current Assets 3,729 12,966 12,648 10,723 8,619
Fixed Assets 914 885 997 1,079 1,131
Total Investments 4,207 2,586 2,569 2,549 2,529
Intangible Assets 24,907 34,745 58,877 88,292 107,945
Total Other Non-Current Assets 2,968 2,318 2,318 2,318 2,318
Total Non-current Assets 32,996 40,534 64,761 94,238 113,923
Short-term Debt 3,947 9,896 8,396 16,396 21,396
Current Portion of Long-Term Debt
Total Creditors 1,599 1,414 9,631 13,499 11,443
Other Current Liabilities 1,998 7,317 4,749 4,707 4,646
Total Current Liabilities 7,543 18,627 22,776 34,602 37,484
Total Long-term Debt 11,974 15,124 22,031 25,631 32,631
Hybrid Debt - Debt Component
Total Other Non-Current Liabilities 4,106 2,492 4,431 4,232 4,067
Total Non-current Liabilities 16,080 17,616 26,461 29,863 36,697
Total Provisions 733 918 918 918 918
Total Liabilities 24,356 37,161 50,155 65,382 75,100
Shareholders' Equity 10,419 13,679 15,839 17,810 19,890
Minority Interests 1,950 2,660 11,415 21,769 27,552
Total Equity 12,369 16,339 27,254 39,579 47,442
Key Ratios
Dec-15A Dec-16A Dec-17F Dec-18F Dec-19F
Revenue Growth 7.4% 69.2% (31.9%) 26.7% 22.1%
Operating EBITDA Growth 6.6% 21.7% 17.6% 12.0% 21.9%
Operating EBITDA Margin 44.0% 31.7% 54.7% 48.3% 48.2%
Net Cash Per Share (Rp) (1,852) (2,878) (3,909) (5,391) (7,086)
BVPS (Rp) 1,532 1,885 2,182 2,454 2,740
Gross Interest Cover 2.30 2.59 2.50 2.12 1.33
Effective Tax Rate 36.2% 32.0% 30.9% 32.0% 32.0%
Net Dividend Payout Ratio 33.5% 15.5% 15.7% 20.1% 20.1%
Accounts Receivables Days - - - - -
Inventory Days 1.34 1.66 5.65 4.02 3.25
Accounts Payables Days 10.20 4.22 8.75 6.23 5.04
ROIC (%) 13.4% 15.3% 11.5% 8.0% 7.0%
ROCE (%) 12.3% 11.6% 8.9% 6.7% 6.3%
Return On Average Assets 7.47% 6.89% 5.98% 4.21% 4.59%
Key Drivers
Dec-15A Dec-16A Dec-17F Dec-18F Dec-19F
Avg daily traffic grth (%, main) 3.4% 0.2% 4.9% 6.8% 7.5%
Base tollrate/km (% chg, main) 3.6% 11.1% 11.8% 20.0% 16.9%
Base tollrate/vehicle (%chg, main) N/A N/A N/A N/A N/A
Avg daily traffic grth (%, 2ndary) N/A N/A N/A N/A N/A
Base tollrate/km (% chg, 2ndary) N/A N/A N/A N/A N/A
Base tollrate/vehicle (%chg, 2ndary) N/A N/A N/A N/A N/A
Avg daily traffic grth (%, tertiary) N/A N/A N/A N/A N/A
Base tollrate/km (% chg, tertiary) N/A N/A N/A N/A N/A
Base tollrate/vehicle (%chg, tertiary) N/A N/A N/A N/A N/A
Toll Roads│Indonesia│Jasa Marga│July 18, 2017
38
DISCLAIMER #01
The content of this report (including the views and opinions expressed therein, and the information comprised therein) has been prepared by and belongs to CIMB and is distributed by CIMB.
This report is not directed to, or intended for distribution to or use by, any person or entity who is a citizen or resident of or located in any locality, state, country or other jurisdiction where such distribution, publication, availability or use would be contrary to law or regulation.
By accepting this report, the recipient hereof represents and warrants that he is entitled to receive such report in accordance with the restrictions set forth below and agrees to be bound by the limitations contained herein (including the “Restrictions on Distributions” set out below). Any failure to comply with these limitations may constitute a violation of law. This publication is being supplied to you strictly on the basis that it will remain confidential. No part of this report may be (i) copied, photocopied, duplicated, stored or reproduced in any form by any means or (ii) redistributed or passed on, directly or indirectly, to any other person in whole or in part, for any purpose without the prior written consent of CIMB.
The information contained in this research report is prepared from data believed to be correct and reliable at the time of issue of this report. CIMB may or may not issue regular reports on the subject matter of this report at any frequency and may cease to do so or change the periodicity of reports at any time. CIMB is under no obligation to update this report in the event of a material change to the information contained in this report. CIMB has no, and will not accept any, obligation to (i) check or ensure that the contents of this report remain current, reliable or relevant, (ii) ensure that the content of this report constitutes all the information a prospective investor may require, (iii) ensure the adequacy, accuracy, completeness, reliability or fairness of any views, opinions and information, and accordingly, CIMB, or any of their respective affiliates, or its related persons (and their respective directors, associates, connected persons and/or employees) shall not be liable in any manner whatsoever for any consequences (including but not limited to any direct, indirect or consequential losses, loss of profits and damages) of any reliance thereon or usage thereof. In particular, CIMB disclaims all responsibility and liability for the views and opinions set out in this report.
Unless otherwise specified, this report is based upon sources which CIMB considers to be reasonable. Such sources will, unless otherwise specified, for market data, be market data and prices available from the main stock exchange or market where the relevant security is listed, or, where appropriate, any other market. Information on the accounts and business of company(ies) will generally be based on publ ished statements of the company(ies), information disseminated by regulatory information services, other publicly available information and information resulting from our research.
Whilst every effort is made to ensure that statements of facts made in this report are accurate, all estimates, projections, forecasts, expressions of opinion and other subjective judgments contained in this report are based on assumptions considered to be reasonable as of the date of the document in which they are contained and must not be construed as a representation that the matters referred to therein will occur. Past performance is not a reliable indicator of future performance. The value of investments may go down as well as up and those investing may, depending on the investments in question, lose more than the initial investment. No report shall constitute an offer or an invitation by or on behalf of CIMB or its affiliates to any person to buy or sell any investments.
CIMB, its affiliates and related companies, their directors, associates, connected parties and/or employees may own or have positions in securities of the company(ies) covered in this research report or any securities related thereto and may from time to time add to or dispose of, or may be materially interested in, any such securities. Further, CIMB, its affiliates and its related companies do and seek to do business with the company(ies) covered in this research report and may from time to time act as market maker or have assumed an underwriting commitment in securities of such company(ies), may sell them to or buy them from customers on a principal basis and may also perform or seek to perform significant investment banking, advisory, underwriting or placement services for or relating to such company(ies) as well as solicit such investment, advisory or other services from any entity mentioned in this report.
CIMB or its affiliates may enter into an agreement with the company(ies) covered in this report relating to the production of research reports. CIMB may disclose the contents of this report to the company(ies) covered by it and may have amended the contents of this report following such disclosure.
The analyst responsible for the production of this report hereby certifies that the views expressed herein accurately and exclusively reflect his or her personal views and opinions about any and all of the issuers or securities analysed in this report and were prepared independently and autonomously. No part of the compensation of the analyst(s) was, is, or will be directly or indirectly related to the inclusion of specific recommendations(s) or view(s) in this report. CIMB prohibits the analyst(s) who prepared this research report from receiving any compensation, incentive or bonus based on specific investment banking transactions or for providing a specific recommendation for, or view of, a particular company. Information barriers and other arrangements may be established where necessary to prevent conflicts of interests arising. However, the analyst(s) may receive compensation that is based on his/their coverage of company(ies) in the performance of his/their duties or the performance of his/their recommendations and the research personnel involved in the preparation of this report may also participate in the solicitation of the businesses as described above. In reviewing this research report, an investor should be aware that any or all of the foregoing, among other things, may give rise to real or potential conflicts of interest. Additional information is, subject to the duties of confidentiality, available on request.
Reports relating to a specific geographical area are produced by the corresponding CIMB entity as listed in the table below. The term “CIMB” shall denote, where appropriate, the relevant entity distributing or disseminating the report in the particular jurisdiction referenced below, or, in every other case, CIMB Group Holdings Berhad ("CIMBGH") and its affiliates, subsidiaries and related companies.
Country CIMB Entity Regulated by
Hong Kong CIMB Securities Limited Securities and Futures Commission Hong Kong India CIMB Securities (India) Private Limited Securities and Exchange Board of India (SEBI) Indonesia PT CIMB Securities Indonesia Financial Services Authority of Indonesia Malaysia CIMB Investment Bank Berhad Securities Commission Malaysia Singapore CIMB Research Pte. Ltd. Monetary Authority of Singapore South Korea CIMB Securities Limited, Korea Branch Financial Services Commission and Financial Supervisory Service Taiwan CIMB Securities Limited, Taiwan Branch Financial Supervisory Commission Thailand CIMB Securities (Thailand) Co. Ltd. Securities and Exchange Commission Thailand
Toll Roads│Indonesia│Jasa Marga│July 18, 2017
39
(i) As of July 17, 2017 CIMB has a proprietary position in the securities (which may include but not limited to shares, warrants, call warrants and/or any other derivatives) in the following company or companies covered or recommended in this report:
(a) -
(ii) As of July 18, 2017, the analyst(s) who prepared this report, and the associate(s), has / have an interest in the securities (which may include but not limited to shares, warrants, call warrants and/or any other derivatives) in the following company or companies covered or recommended in this report:
(a) -
This report does not purport to contain all the information that a prospective investor may require. CIMB or any of its affiliates does not make any guarantee, representation or warranty, express or implied, as to the adequacy, accuracy, completeness, reliability or fairness of any such information and opinion contained in this report. Neither CIMB nor any of its affiliates nor its related persons shall be liable in any manner whatsoever for any consequences (including but not limited to any direct, indirect or consequential losses, loss of profits and damages) of any reliance thereon or usage thereof.
This report is general in nature and has been prepared for information purposes only. It is intended for circulation amongst CIMB and its affiliates’ clients generally and does not have regard to the specific investment objectives, financial situation and the particular needs of any specific person who may receive this report. The information and opinions in this report are not and should not be construed or considered as an offer, recommendation or solicitation to buy or sell the subject securities, related investments or other financial instruments or any derivative instrument, or any rights pertaining thereto.
Investors are advised to make their own independent evaluation of the information contained in this research report, consider their own individual investment objectives, financial situation and particular needs and consult their own professional and financial advisers as to the legal, business, financial, tax and other aspects before participating in any transaction in respect of the securities of company(ies) covered in this research report.
The securities of such company(ies) may not be eligible for sale in all jurisdictions or to all categories of investors.
Australia: Despite anything in this report to the contrary, this research is provided in Australia by CIMB Securities (Singapore) Pte. Ltd. and CIMB Securities Limited. This research is only available in Australia to persons who are “wholesale clients” (within the meaning of the Corporations Act 2001 (Cth) and is supplied solely for the use of such wholesale clients and shall not be distributed or passed on to any other person. You represent and warrant that if you are in Australia, you are a “wholesale client”. This research is of a general nature only and has been prepared without taking into account the objectives, financial situation or needs of the individual recipient. CIMB Securities (Singapore) Pte. Ltd. and CIMB Securities Limited do not hold, and are not required to hold an Australian financial services licence. CIMB Securities (Singapore) Pte. Ltd. and CIMB Securities Limited rely on “passporting” exemptions for entities appropriately licensed by the Monetary Authority of Singapore (under ASIC Class Order 03/1102) and the Securities and Futures Commission in Hong Kong (under ASIC Class Order 03/1103).
Canada: This research report has not been prepared in accordance with the disclosure requirements of Dealer Member Rule 3400 – Research Restrictions and Disclosure Requirements of the Investment Industry Regulatory Organization of Canada. For any research report distributed by CIBC, further disclosures related to CIBC conflicts of interest can be found at https://researchcentral.cibcwm.com .
China: For the purpose of this report, the People’s Republic of China (“PRC”) does not include the Hong Kong Special Administrative Region, the Macau Special Administrative Region or Taiwan. The distributor of this report has not been approved or licensed by the China Securities Regulatory Commission or any other relevant regulatory authority or governmental agency in the PRC. This report contains only marketing information. The distribution of this report is not an offer to buy or sell to any person within or outside PRC or a solicitation to any person within or outside of PRC to buy or sell any instruments described herein. This report is being issued outside the PRC to a limited number of institutional investors and may not be provided to any person other than the original recipient and may not be reproduced or used for any other purpose.
France: Only qualified investors within the meaning of French law shall have access to this report. This report shall not be considered as an offer to subscribe to, or used in connection with, any offer for subscription or sale or marketing or direct or indirect distribution of financial instruments and it is not intended as a solicitation for the purchase of any financial instrument.
Germany: This report is only directed at persons who are professional investors as defined in sec 31a(2) of the German Securities Trading Act (WpHG). This publication constitutes research of a non-binding nature on the market situation and the investment instruments cited here at the time of the publication of the information.
The current prices/yields in this issue are based upon closing prices from Bloomberg as of the day preceding publication. Please note that neither the German Federal Financial Supervisory Agency (BaFin), nor any other supervisory authority exercises any control over the content of this report.
Hong Kong: This report is issued and distributed in Hong Kong by CIMB Securities Limited (“CHK”) which is licensed in Hong Kong by the Securities and Futures Commission for Type 1 (dealing in securities), Type 4 (advising on securities) and Type 6 (advising on corporate finance) activities. Any investors wishing to purchase or otherwise deal in the securities covered in this report should contact the Head of Sales at CIMB Securities Limited. The views and opinions in this research report are our own as of the date hereof and are subject to change. If the Financial Services and Markets Act of the United Kingdom or the rules of the Financial Conduct Authority apply to a recipient, our obligations owed to such recipient therein are unaffected. CHK has no obligation to update its opinion or the information in this research report.
This publication is strictly confidential and is for private circulation only to clients of CHK.
CIMB Securities Limited does not make a market on other securities mentioned in the report.
India: This report is issued and distributed in India by CIMB Securities (India) Private Limited (“CIMB India”) which is registered with the National Stock Exchange of India Limited and BSE Limited as a trading and clearing member under the Securities and Exchange Board of India (Stock Brokers and Sub-Brokers) Regulations, 1992. In accordance with the provisions of Regulation 4(g) of the Securities and Exchange Board of India (Investment Advisers) Regulations, 2013, CIMB India is not required to seek registration with the Securities and Exchange Board of India (“SEBI”) as an Investment Adviser. CIMB India is registered with SEBI as a Research Analyst pursuant to the SEBI (Research Analysts) Regulations, 2014 ("Regulations").
This report does not take into account the particular investment objectives, financial situations, or needs of the recipients. It is not intended for
Toll Roads│Indonesia│Jasa Marga│July 18, 2017
40
and does not deal with prohibitions on investment due to law/jurisdiction issues etc. which may exist for certain persons/ent ities. Recipients should rely on their own investigations and take their own professional advice before investment.
The report is not a “prospectus” as defined under Indian Law, including the Companies Act, 2013, and is not, and shall not be, approved by, or filed or registered with, any Indian regulator, including any Registrar of Companies in India, SEBI, any Indian stock exchange, or the Reserve Bank of India. No offer, or invitation to offer, or solicitation of subscription with respect to any such securities listed or proposed to be listed in India is being made, or intended to be made, to the public, or to any member or section of the public in India, through or pursuant to this report.
The research analysts, strategists or economists principally responsible for the preparation of this research report are segregated from the other activities of CIMB India and they have received compensation based upon various factors, including quality, accuracy and value of research, firm profitability or revenues, client feedback and competitive factors. Research analysts', strategists' or economists' compensation is not linked to investment banking or capital markets transactions performed or proposed to be performed by CIMB India or its affiliates.
CIMB Securities (India) Pte Ltd has not received any investment banking related compensation from the companies mentioned in the report in the past 12 months.
CIMB Securities (India) Pte Ltd has not received any compensation from the companies mentioned in the report in the past 12 months.
Indonesia: This report is issued and distributed by PT CIMB Securities Indonesia (“CIMBI”). The views and opinions in this research report are our own as of the date hereof and are subject to change. If the Financial Services and Markets Act of the United Kingdom or the rules of the Financial Conduct Authority apply to a recipient, our obligations owed to such recipient therein are unaffected. CIMBI has no obligation to update its opinion or the information in this research report. Neither this report nor any copy hereof may be distributed in Indonesia or to any Indonesian citizens wherever they are domiciled or to Indonesian residents except in compliance with applicable Indonesian capital market laws and regulations.
This research report is not an offer of securities in Indonesia. The securities referred to in this research report have not been registered with the Financial Services Authority (Otoritas Jasa Keuangan) pursuant to relevant capital market laws and regulations, and may not be offered or sold within the territory of the Republic of Indonesia or to Indonesian citizens through a public offering or in circumstances which constitute an offer within the meaning of the Indonesian capital market law and regulations.
Ireland: CIMB is not an investment firm authorised in the Republic of Ireland and no part of this document should be construed as CIMB acting as, or otherwise claiming or representing to be, an investment firm authorised in the Republic of Ireland.
Malaysia: This report is issued and distributed by CIMB Investment Bank Berhad (“CIMB”) solely for the benefit of and for the exclusive use of our clients. If the Financial Services and Markets Act of the United Kingdom or the rules of the Financial Conduct Authority apply to a recipient, our obligations owed to such recipient therein are unaffected. CIMB has no obligation to update, revise or reaffirm its opinion or the information in this research reports after the date of this report.
New Zealand: In New Zealand, this report is for distribution only to persons who are wholesale clients pursuant to section 5C of the Financial Advisers Act 2008.
Singapore: This report is issued and distributed by CIMB Research Pte Ltd (“CIMBR”). CIMBR is a financial adviser licensed under the Financial Advisers Act, Cap 110 (“FAA”) for advising on investment products, by issuing or promulgating research analyses or research reports, whether in electronic, print or other form. Accordingly CIMBR is a subject to the applicable rules under the FAA unless it is able to avail itself to any prescribed exemptions.
Recipients of this report are to contact CIMB Research Pte Ltd, 50 Raffles Place, #19-00 Singapore Land Tower, Singapore in respect of any matters arising from, or in connection with this report. CIMBR has no obligation to update its opinion or the information in this research report. This publication is strictly confidential and is for private circulation only. If you have not been sent this report by CIMBR directly, you may not rely, use or disclose to anyone else this report or its contents.
If the recipient of this research report is not an accredited investor, expert investor or institutional investor, CIMBR accepts legal responsibility for the contents of the report without any disclaimer limiting or otherwise curtailing such legal responsibility. If the recipient is an accredited investor, expert investor or institutional investor, the recipient is deemed to acknowledge that CIMBR is exempt from certain requirements under the FAA and its attendant regulations, and as such, is exempt from complying with the following : (a) Section 25 of the FAA (obligation to disclose product information); (b) Section 27 (duty not to make recommendation with respect to any investment product without having a reasonable basis where you may be reasonably expected to rely on the recommendation) of the FAA; (c) MAS Notice on Information to Clients and Product Information Disclosure [Notice No. FAA-N03]; (d) MAS Notice on Recommendation on Investment Products [Notice No. FAA-N16]; (e) Section 36 (obligation on disclosure of interest in securities), and (f) any other laws, regulations, notices, directive, guidelines, circulars and practice notes which are relates to the above, to the extent permitted by applicable laws, as may be amended from time to time, and any other laws, regulations, notices, directive, guidelines, circulars, and practice notes as we may notify you from time to time. In addition, the recipient who is an accredited investor, expert investor or institutional investor acknowledges that a CIMBR is exempt from Section 27 of the FAA, the recipient will also not be able to file a civil claim against CIMBR for any loss or damage arising from the recipient’s reliance on any recommendation made by CIMBR which would otherwise be a right that is available to the recipient under Section 27 of the FAA, the recipient will also not be able to file a civil claim against CIMBR for any loss or damage arising from the recipient’s reliance on any recommendation made by CIMBR which would otherwise be a right that is available to the recipient under Section 27 of the FAA.
CIMB Research Pte Ltd ("CIMBR"), its affiliates and related companies, their directors, associates, connected parties and/or employees may own or have positions in securities of the company(ies) covered in this research report or any securities related thereto and may from time to time add to or dispose of, or may be materially interested in, any such securities. Further, CIMBR, its affiliates and its related companies do and seek to do business with the company(ies) covered in this research report and may from time to time act as market maker or have assumed an underwriting commitment in securities of such company(ies), may sell them to or buy them from customers on a principal basis and may also perform or seek to perform significant investment banking, advisory, underwriting or placement services for or relating to such company(ies) as well as solicit such
Toll Roads│Indonesia│Jasa Marga│July 18, 2017
41
investment, advisory or other services from any entity mentioned in this report.
As of July 17, 2017, CIMBR does not have a proprietary position in the recommended securities in this report.
CIMB Research Pte Ltd does not make a market on the securities mentioned in the report.
CIMB Securities Singapore Pte Ltd does not make a market on the securities mentioned in the report.
CIMB Bank Berhad, Singapore branch does not make a market on the securities mentioned in the report.
South Korea: This report is issued and distributed in South Korea by CIMB Securities Limited, Korea Branch (“CIMB Korea”) which is licensed as a cash equity broker, and regulated by the Financial Services Commission and Financial Supervisory Service of Korea. In South Korea, this report is for distribution only to professional investors under Article 9(5) of the Financial Investment Services and Capital Market Act of Korea (“FSCMA”).
Spain: This document is a research report and it is addressed to institutional investors only. The research report is of a general nature and not personalised and does not constitute investment advice so, as the case may be, the recipient must seek proper advice before adopting any investment decision. This document does not constitute a public offering of securities.
CIMB is not registered with the Spanish Comision Nacional del Mercado de Valores to provide investment services.
Sweden: This report contains only marketing information and has not been approved by the Swedish Financial Supervisory Authority. The distribution of this report is not an offer to sell to any person in Sweden or a solicitation to any person in Sweden to buy any instruments described herein and may not be forwarded to the public in Sweden.
Switzerland: This report has not been prepared in accordance with the recognized self-regulatory minimal standards for research reports of banks issued by the Swiss Bankers’ Association (Directives on the Independence of Financial Research).
Taiwan: This research report is not an offer or marketing of foreign securities in Taiwan. The securities as referred to in this research report have not been and will not be registered with the Financial Supervisory Commission of the Republic of China pursuant to relevant securities laws and regulations and may not be offered or sold within the Republic of China through a public offering or in circumstances which constitutes an offer or a placement within the meaning of the Securities and Exchange Law of the Republic of China that requires a registration or approval of the Financial Supervisory Commission of the Republic of China.
Thailand: This report is issued and distributed by CIMB Securities (Thailand) Company Limited (“CIMBS”) based upon sources believed to be reliable (but their accuracy, completeness or correctness is not guaranteed). The statements or expressions of opinion herein were arrived at after due and careful consideration for use as information for investment. Such opinions are subject to change without notice and CIMBS has no obligation to update its opinion or the information in this research report.
If the Financial Services and Markets Act of the United Kingdom or the rules of the Financial Conduct Authority apply to a recipient, our obligations owed to such recipient are unaffected.
CIMB Securities (Thailand) Co., Ltd. may act or acts as Market Maker, and issuer and offerer of Derivative Warrants and Structured Note which may have the following securities as its underlying securities. Investors should carefully read and study the details of the derivative warrants in the prospectus before making investment decisions.
AAV, ADVANC, AMATA, ANAN, AOT, AP, BA, BANPU, BBL, BCH, BCP, BCPG, BDMS, BEAUTY, BEC, BEM, BJC, BH, BIG, BLA, BLAND, BPP, BTS, CBG, CENTEL, CHG, CK, CKP, COM7, CPALL, CPF, CPN, DELTA, DTAC, EA, EGCO, EPG, GFPT, GLOBAL, GLOW, GPSC, GUNKUL, HMPRO, INTUCH, IRPC, ITD, IVL, KBANK, KCE, KKP, KTB, KTC, LH, LHBANK, LPN, MAJOR, MALEE, MEGA, MINT, MONO, MTLS, PLANB, PSH, PTL, PTG, PTT, PTTEP, PTTGC, QH, RATCH, ROBINS, S, SAWAD, SCB, SCC, SCCC, SIRI, SPALI, SPRC, STEC, STPI, SUPER, TASCO, TCAP, THAI, THANI, THCOM, TISCO, TKN, TMB, TOP, TPIPL, TRUE, TTA, TU, TVO, UNIQ, VGI, WHA, WORK.
Corporate Governance Report:
The disclosure of the survey result of the Thai Institute of Directors Association (“IOD”) regarding corporate governance is made pursuant to the policy of the Office of the Securities and Exchange Commission. The survey of the IOD is based on the information of a company listed on the Stock Exchange of Thailand and the Market for Alternative Investment disclosed to the public and able to be accessed by a general public investor. The result, therefore, is from the perspective of a third party. It is not an evaluation of operation and is not based on inside information.
The survey result is as of the date appearing in the Corporate Governance Report of Thai Listed Companies. As a result, the survey result may be changed after that date. CIMBS does not confirm nor certify the accuracy of such survey result.
Score Range: 90 - 100 80 - 89 70 - 79 Below 70 or No Survey Result
Description: Excellent Very Good Good N/A
United Arab Emirates: The distributor of this report has not been approved or licensed by the UAE Central Bank or any other relevant licensing authorities or governmental agencies in the United Arab Emirates. This report is strictly private and confidential and has not been reviewed by, deposited or registered with UAE Central Bank or any other licensing authority or governmental agencies in the United Arab Emirates. This report is being issued outside the United Arab Emirates to a limited number of institutional investors and must not be provided to any person other than the original recipient and may not be reproduced or used for any other purpose. Further, the information contained in this report is not intended to lead to the sale of investments under any subscription agreement or the conclusion of any other contract of whatsoever nature within the territory of the United Arab Emirates.
United Kingdom: In the United Kingdom and European Economic Area, this report is being disseminated by CIMB Securities (UK) Limited (“CIMB UK”). CIMB UK is authorized and regulated by the Financial Conduct Authority and its registered office is at 27 Knightsbridge, London, SW1X7YB. Unless specified to the contrary, this report has been issued and approved for distribution in the U.K. and the EEA by CIMB UK. Investment research issued by CIMB UK has been prepared in accordance with CIMB Group’s policies for managing conflicts of interest arising as a result of publication and distribution of investment research. This report is for distribution only to, and is solely directed at, selected persons on the basis that those persons: (a) are eligible counterparties and professional clients of CIMB UK; (b) have professional experience in matters relating to investments falling within Article 19(5) of the Financial Services and Markets Act 2000 (Financial Promotion) Order 2005 (as amended, the “Order”), (c) fall within Article 49(2)(a) to (d) (“high net worth companies, unincorporated associations etc”) of the Order; (d) are outside the United Kingdom subject to relevant regulation in each jurisdiction, or (e) are persons to whom an invitation or inducement to engage in
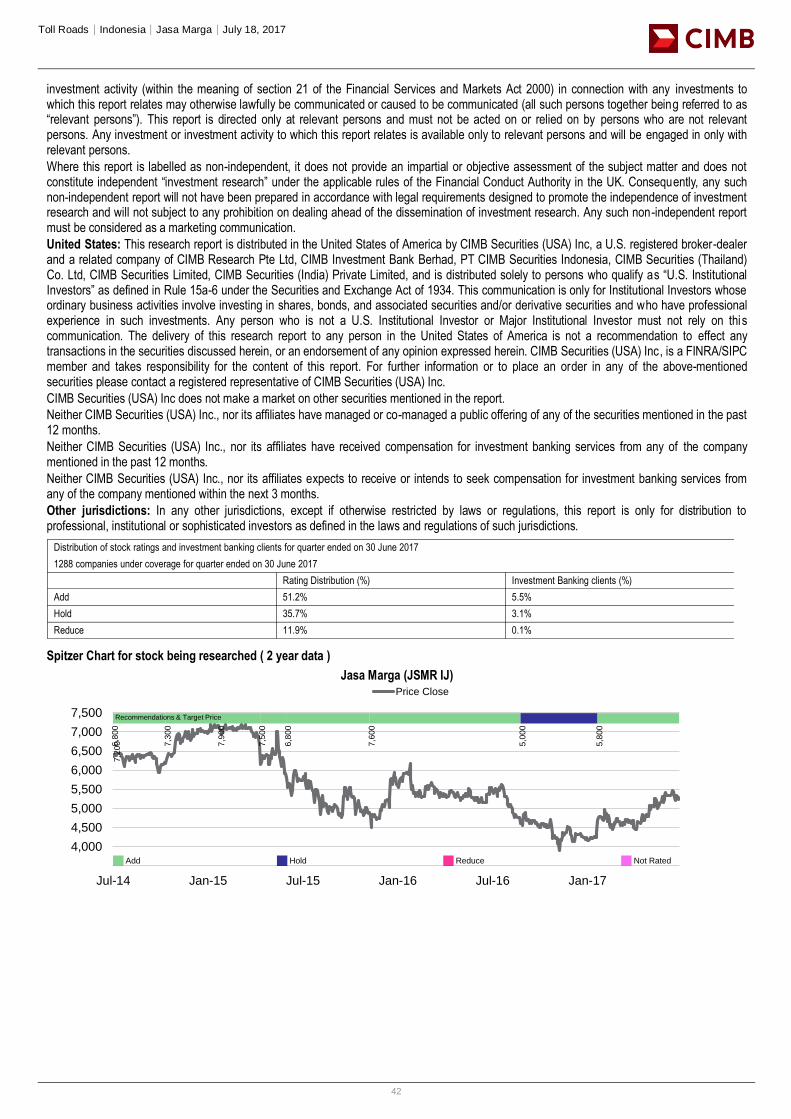
Toll Roads│Indonesia│Jasa Marga│July 18, 2017
42
investment activity (within the meaning of section 21 of the Financial Services and Markets Act 2000) in connection with any investments to which this report relates may otherwise lawfully be communicated or caused to be communicated (all such persons together being referred to as “relevant persons”). This report is directed only at relevant persons and must not be acted on or relied on by persons who are not relevant persons. Any investment or investment activity to which this report relates is available only to relevant persons and will be engaged in only with relevant persons.
Where this report is labelled as non-independent, it does not provide an impartial or objective assessment of the subject matter and does not constitute independent “investment research” under the applicable rules of the Financial Conduct Authority in the UK. Consequently, any such non-independent report will not have been prepared in accordance with legal requirements designed to promote the independence of investment research and will not subject to any prohibition on dealing ahead of the dissemination of investment research. Any such non-independent report must be considered as a marketing communication.
United States: This research report is distributed in the United States of America by CIMB Securities (USA) Inc, a U.S. registered broker-dealer and a related company of CIMB Research Pte Ltd, CIMB Investment Bank Berhad, PT CIMB Securities Indonesia, CIMB Securities (Thailand) Co. Ltd, CIMB Securities Limited, CIMB Securities (India) Private Limited, and is distributed solely to persons who qualify as “U.S. Institutional Investors” as defined in Rule 15a-6 under the Securities and Exchange Act of 1934. This communication is only for Institutional Investors whose ordinary business activities involve investing in shares, bonds, and associated securities and/or derivative securities and who have professional experience in such investments. Any person who is not a U.S. Institutional Investor or Major Institutional Investor must not rely on this communication. The delivery of this research report to any person in the United States of America is not a recommendation to effect any transactions in the securities discussed herein, or an endorsement of any opinion expressed herein. CIMB Securities (USA) Inc, is a FINRA/SIPC member and takes responsibility for the content of this report. For further information or to place an order in any of the above-mentioned securities please contact a registered representative of CIMB Securities (USA) Inc.
CIMB Securities (USA) Inc does not make a market on other securities mentioned in the report.
Neither CIMB Securities (USA) Inc., nor its affiliates have managed or co-managed a public offering of any of the securities mentioned in the past 12 months.
Neither CIMB Securities (USA) Inc., nor its affiliates have received compensation for investment banking services from any of the company mentioned in the past 12 months.
Neither CIMB Securities (USA) Inc., nor its affiliates expects to receive or intends to seek compensation for investment banking services from any of the company mentioned within the next 3 months.
Other jurisdictions: In any other jurisdictions, except if otherwise restricted by laws or regulations, this report is only for distribution to professional, institutional or sophisticated investors as defined in the laws and regulations of such jurisdictions.
Spitzer Chart for stock being researched ( 2 year data )
Jasa Marga (JSMR IJ)
Rating Distribution (%) Investment Banking clients (%)
Add 51.2% 5.5%
Hold 35.7% 3.1%
Reduce 11.9% 0.1%
Distribution of stock ratings and investment banking clients for quarter ended on 30 June 2017
1288 companies under coverage for quarter ended on 30 June 2017
3,500
4,000
4,500
5,000
5,500
6,000
6,500
7,000
7,500
Jul-14 Jan-15 Jul-15 Jan-16 Jul-16 Jan-17
Price Close
6,8
00
7,2
00
7,3
00
7,9
00
7,5
00
6,8
00
7,6
00
5,0
00
5,8
00
Recommendations & Target Price
Add Hold Reduce Not Rated
Toll Roads│Indonesia│Jasa Marga│July 18, 2017
43
Corporate Governance Report of Thai Listed Companies (CGR). CG Rating by the Thai Institute of Directors Association (Thai IOD) in 2016, Anti-Corruption 2016
AAV – Very Good, n/a, ADVANC – Very Good, Certified, AEONTS – Good, n/a, AMATA – Excellent, Declared, ANAN – Very Good, Declared, AOT – Excellent, Declared, AP – Very Good, Declared, ASK – Very Good, Declared, ASP – Very Good, Certified, BANPU – Very Good, Certified, BAY – Excellent, Certified, BBL – Very Good, Certified, BCH – not available, Declared, BCP - Excellent, Certified, BEM – Very Good, n/a, BDMS – Very Good, n/a, BEAUTY – Good, Declared, BEC - Good, n/a, BH - Good, Declared, BIGC - Excellent, Declared, BJC – Good, n/a, BJCHI – Good, Declared, BLA – Very Good, Certified, BPP – not available, n/a, BR - Good, n/a, BTS - Excellent, Certified, CBG – Good, n/a, CCET – not available, n/a, CENTEL – Very Good, Certified, CHG – Very Good, n/a, CK – Excellent, n/a, COL – Very Good, Declared, CPALL – not available, Declared, CPF – Excellent, Declared, CPN - Excellent, Certified, DELTA - Excellent, Declared, DEMCO – Excellent, Certified, DIF – not available, n/a, DTAC – Excellent, Certified, EA – Very Good, Declared, ECL – Good, Certified, EGCO - Excellent, Certified, EPG – Good, n/a, GFPT - Excellent, Declared, GLOBAL – Very Good, Declared, GLOW – Very Good, Certified, GPSC – Excellent, Declared, GRAMMY - Excellent, n/a, GUNKUL – Very Good, Declared, HANA - Excellent, Certified, HMPRO - Excellent, Declared, ICHI – Very Good, Declared, INTUCH - Excellent, Certified, ITD – Good, n/a, IVL - Excellent, Certified, JAS – not available, Declared, JASIF – not available, n/a, JUBILE – Good, Declared, KAMART – not available, n/a, KBANK - Excellent, Certified, KCE - Excellent, Certified, KGI – Good, Certified, KKP – Excellent, Certified, KSL – Very Good, Declared, KTB - Excellent, Certified, KTC – Excellent, Certified, LH - Very Good, n/a, LPN – Excellent, Declared, M – Very Good, Declared, MAJOR - Good, n/a, MAKRO – Good, Declared, MALEE – Very Good, Declared, MBKET – Very Good, Certified, MC – Very Good, Declared, MCOT – Excellent, Declared, MEGA – Very Good, Declared, MINT - Excellent, Certified, MTLS – Very Good, Declared, NYT – Excellent, n/a, OISHI – Very Good, n/a, PLANB – Very Good, Declared, PLAT – Good, Declared, PSH – not available, n/a, PSL - Excellent, Certified, PTT - Excellent, Certified, PTTEP - Excellent, Certified, PTTGC - Excellent, Certified, QH – Excellent, Declared, RATCH – Excellent, Certified, ROBINS – Very Good, Declared, RS – Very Good, n/a, SAMART - Excellent, n/a, SAPPE - Good, n/a, SAT – Excellent, Certified, SAWAD – Good, n/a, SC – Excellent, Declared, SCB - Excellent, Certified, SCBLIF – not available, n/a, SCC – Excellent, Certified, SCN – Good, Declared, SCCC - Excellent, Declared, SIM - Excellent, n/a, SIRI - Good, n/a, SPA - Good, n/a, SPALI - Excellent, Declared, SPRC – Very Good, Declared, STA – Very Good, Declared, STEC – Excellent, n/a, SVI – Excellent, Certified, TASCO – Very Good, Declared, TCAP – Excellent, Certified, THAI – Very Good, Declared, THANI – Very Good, Certified, THCOM – Excellent, Certified, THRE – Very Good, Certified, THREL – Very Good, Certified, TICON – Very Good, Declared, TIPCO – Very Good, Certified, TISCO - Excellent, Certified, TK – Very Good, n/a, TKN – Good, n/a, TMB - Excellent, Certified, TNR – not available, n/a, TOP - Excellent, Certified, TPCH – Good, n/a, TPIPP – not available, n/a, TRUE – Very Good, Declared, TTW – Very Good, Declared, TU – Excellent, Declared, TVO – Very Good, Declared UNIQ – not available, Declared, VGI – Excellent, Declared, WHA – not available, Declared, WHART – not available, n/a, WORK – not available, n/a.
Companies participating in Thailand’s Private Sector Collective Action Coalition Against Corruption programme (Thai CAC) under Thai Institute of Directors (as of October 28, 2016) are categorized into:
- Companies that have declared their intention to join CAC, and
- Companies certified by CAC
CIMB Recommendation Framework
Stock Ratings Definition:
Add The stock’s total return is expected to exceed 10% over the next 12 months.
Hold The stock’s total return is expected to be between 0% and positive 10% over the next 12 months.
Reduce The stock’s total return is expected to fall below 0% or more over the next 12 months.
The total expected return of a stock is defined as the sum of the: (i) percentage difference between the target price and the current price and (ii) the forward net dividend yields of the stock. Stock price targets have an investment horizon of 12 months.
Sector Ratings Definition:
Overweight An Overweight rating means stocks in the sector have, on a market cap-weighted basis, a positive absolute recommendation.
Neutral A Neutral rating means stocks in the sector have, on a market cap-weighted basis, a neutral absolute recommendation.
Underweight An Underweight rating means stocks in the sector have, on a market cap-weighted basis, a negative absolute recommendation.
Country Ratings Definition:
Overweight An Overweight rating means investors should be positioned with an above-market weight in this country relative to benchmark.
Neutral A Neutral rating means investors should be positioned with a neutral weight in this country relative to benchmark.
Underweight An Underweight rating means investors should be positioned with a below-market weight in this country relative to benchmark.