Embed Size (px)
Citation preview
Chemicals - Others│Indonesia│April 12, 2017
Company Note
IMPORTANT DISCLOSURES, INCLUDING ANY REQUIRED RESEARCH CERTIFICATIONS, ARE PROVIDED AT THE END OF THIS REPORT. IF THIS REPORT IS DISTRIBUTED IN THE UNITED STATES IT IS DISTRIBUTED BY CIMB SECURITIES (USA), INC. AND IS CONSIDERED THIRD-PARTY AFFILIATED RESEARCH.
Powered by the
EFA Platform
AKR Corporindo Fuelled by strong growth prospects
Despite likely soft 1Q17 industrial fuel sales volume due to low seasonality and loss ■of sales to Freeport, we believe AKRA is still poised for earnings recovery in FY17F.
Retail market offers earnings upside in FY18F onwards. ■ Progress on Java Integrated Industrial and Port Estate (JIIPE) would translate into ■better visibility for land sales.
We lower FY17-18F EPS by 6-9% and hence, our SOP-based TP falls to Rs7,200. ■ Maintain Add for attractive earnings recovery outlook and potential upside from retail ■market.
Positives for fuel: industrial demand recovery,upside from retail JV We reiterate our expectation for AKRA fuel volume recovery in FY17F, driven by 15-20% yoy growth in demand from the coal industry (c.30% of sales volume in FY17F) due to higher overburden and coal production. Given that AKRA’s retail JV plan is in the preliminary stage, we have not imputed any retail market volume into our forecasts. Management estimates the retail segment will account for potential 600kl volume in FY19F, which translates into c.10% upside to our volume forecast for FY19F.
Better visibility for Java Integrated Industrial and Port Estate In 4Q16, AKRA presold 20ha of land on the JIIPE project, resulting in backlog of 24ha at end-Dec 2016. The company revealed that c.300ha of land is ready for sale in 2017F and it aims to complete the 23MW power plant by 3Q17F. Given these positive developments, we think our FY17F sales target of 40ha is attainable. The positive land sales momentum would enable AKRA to secure critical mass and funding for the next phase of utilities development, in our view.
Positive feedback from our UK/EU non-deal roadshow on 3-6 Apr AKRA received positive feedback from investors on the structural growth potential of its retail fuel market and sensible strategy of partnership with BP (a credible player), which coincides with the shift in consumption to non-subsidised fuel products. Investors were also positive on management’s assertion that the JIIPE project would not require equity funding. That said, the execution of these two major projects is a key risk.
1Q17F preview: Expect soft volume and steady margins We expect 1Q17F fuel sales volume to be at the lower end of our expected range (at 540-550k kl) due to soft fuel sales volume (due to seasonally-low offtake by coal mine clients and loss of sales to Freeport). However, we expect gross margin to improve qoq in line with the anticipated rebound in Pertamina’s spread and shift in sales mix in favour of smaller clients (lower bulk volume).
Lower FY17-18F EPS due to more conservative volume estimates We revise down FY17-18F EPS by 6-9% for more conservative sales volume forecasts due to loss of sales volume to Freeport. That said, positive development on the Freeport contract negotiation could translate into rapid resumption of operations and hence, recovery in sales volume in 2Q-4Q17F.
On track for earnings recovery; plenty of potential catalysts Despite our downward EPS revisions, we continue to forecast earnings recovery in FY17-18F. Delivery of the JV retail station in 2018F offers potential upside to our earnings projection. Risks are shortfall in margin and volume. Apart from earnings recovery, the successful sale of AKRA’s port and plant in China is a potential re-rating catalyst. The stock now trades at 18.2x forward P/E, below its historical 5-year mean. We maintain our Add rating but with slightly lower SOP-based target price of Rp7,200.
[Add FP Header] [Add FP BodyText]
SOURCE: COMPANY DATA, CIMB FORECASTS
Indonesia
ADD (no change) Consensus ratings*: Buy 13 Hold 1 Sell 1
Current price: Rp6,375
Target price: Rp7,200
Previous target: Rp7,300
Up/downside: 12.9%
CIMB / Consensus: 0.2%
Reuters: AKRA.JK
Bloomberg: AKRA IJ
Market cap: US$1,920m
Rp25,500,350m
Average daily turnover: US$2.53m
Rp33,683m
Current shares o/s: 3,822m
Free float: 40.3% *Source: Bloomberg
Key changes in this note
FY17F EPS decreased 5.9%.
FY18F EPS decreased by 8.9%.
Source: Bloomberg
Price performance 1M 3M 12M
Absolute (%) 4.1 2 -3.4
Relative (%) -0.3 -4.2 -21
Major shareholders % held Arthakencana Rayatama 59.7
Public 40.3
Analyst(s)
Erindra KRISNAWAN, CFA
T (62) 21 3006 1732
Felica TRENSENO T (62) 21 3006 1722 E [email protected]
Financial Summary Dec-15A Dec-16A Dec-17F Dec-18F Dec-19F
Revenue (Rpb) 19,765 15,213 19,192 22,232 25,088
Operating EBITDA (Rpb) 1,798 1,535 1,840 2,175 2,726
Net Profit (Rpb) 1,059 1,049 1,157 1,390 1,863
Core EPS (Rp) 284.1 257.6 303.3 363.7 487.5
Core EPS Growth 36.2% (9.3%) 17.7% 19.9% 34.1%
FD Core P/E (x) 22.44 24.75 21.02 17.53 13.08
DPS (Rp) 134.0 94.0 91.9 105.1 126.3
Dividend Yield 2.10% 1.47% 1.44% 1.65% 1.98%
EV/EBITDA (x) 15.64 18.43 15.20 12.45 9.45
P/FCFE (x) 84.69 67.90 60.96 19.47 13.80
Net Gearing 35.2% 33.0% 27.4% 15.8% 2.2%
P/BV (x) 4.00 3.57 3.28 2.89 2.48
ROE 18.9% 15.3% 16.3% 17.5% 20.4%
% Change In Core EPS Estimates (5.92%) (8.88%)
CIMB/consensus EPS (x) 0.96 1.02 1.25
74.0
82.8
91.5
100.3
109.0
5,300
5,800
6,300
6,800
7,300
Price Close Relative to JCI (RHS)
5
10
15
20
Apr-16 Jul-16 Oct-16 Jan-17
Vo
l m
Chemicals - Others│Indonesia│AKR Corporindo│April 12, 2017
2
Fuelled by strong growth prospects
Positive prospects for fuel business
Industrial volume on track to recovery in 2017F
We reiterate our expectation for AKRA fuel sales volume recovery in FY17F, driven by 15-20% yoy growth in demand from the coal industry (c.30% of sales volume in FY17F) due to higher overburden and coal production. Management indicated that offtake in 1Q17F was slow, which we think reflects seasonality (above-average rainfall during the quarter hampered mining operations and deliveries of new equipment).
In 1Q17F, AKRA suffered loss of sales to Freeport (8% of sales volume in FY16) due to ongoing contract of work (CoW) negotiations with the government of Indonesia. The negotiations have not been finalised but we are positive on the latest news that Freeport has agreed to convert its CoW to the special mining licence (IUPK) required by the government.
We expect sales volumes to the power sector (7% of volume in FY16) to be stable or up slightly in FY17F. Sales volume to the power sector dropped in FY16 as AKRA reduced its participation in tenders to state-owned electricity company Perusahaan Listrik Negara (PLN) because of the aggressive low-priced bids submitted by a competitor. However, management indicated that this trend is subsiding in 2017F.
Taking into consideration the loss of Freeport sales volume in 1Q17F, we see downside to our FY17F volume forecast of 2.4m kl. Management’s latest volume guidance for FY17F is a more conservative 2.3m kl (vs. 2.48m kl previously), or ~10% yoy growth, as we think it fully excludes any sales volume to Freeport for the year. Any positive developments on the Freeport contract negotiation could translate into rapid resumption of operations in the coming quarters.
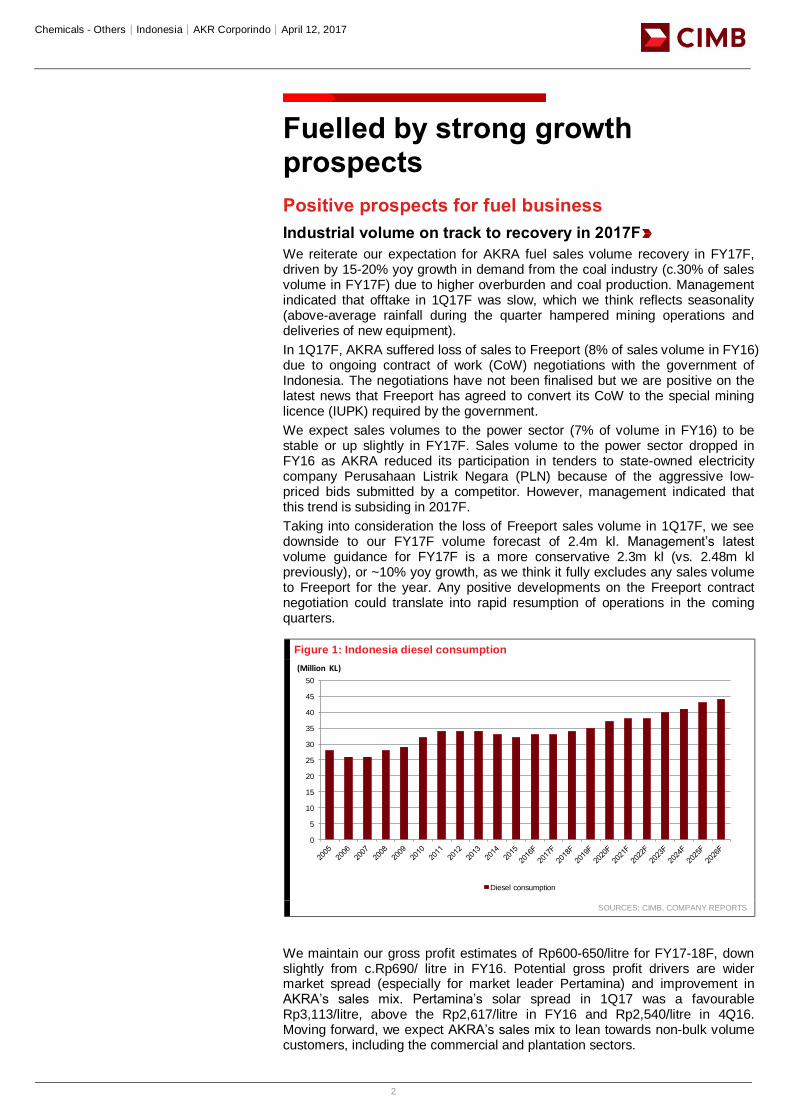
Figure 1: Indonesia diesel consumption
SOURCES: CIMB, COMPANY REPORTS
We maintain our gross profit estimates of Rp600-650/litre for FY17-18F, down slightly from c.Rp690/ litre in FY16. Potential gross profit drivers are wider market spread (especially for market leader Pertamina) and improvement in AKRA’s sales mix. Pertamina’s solar spread in 1Q17 was a favourable Rp3,113/litre, above the Rp2,617/litre in FY16 and Rp2,540/litre in 4Q16. Moving forward, we expect AKRA’s sales mix to lean towards non-bulk volume customers, including the commercial and plantation sectors.
Title:
Source:
Please fill in the values above to have them entered in your report
0
5
10
15
20
25
30
35
40
45
50
(Million KL)
Diesel consumption
Chemicals - Others│Indonesia│AKR Corporindo│April 12, 2017
3
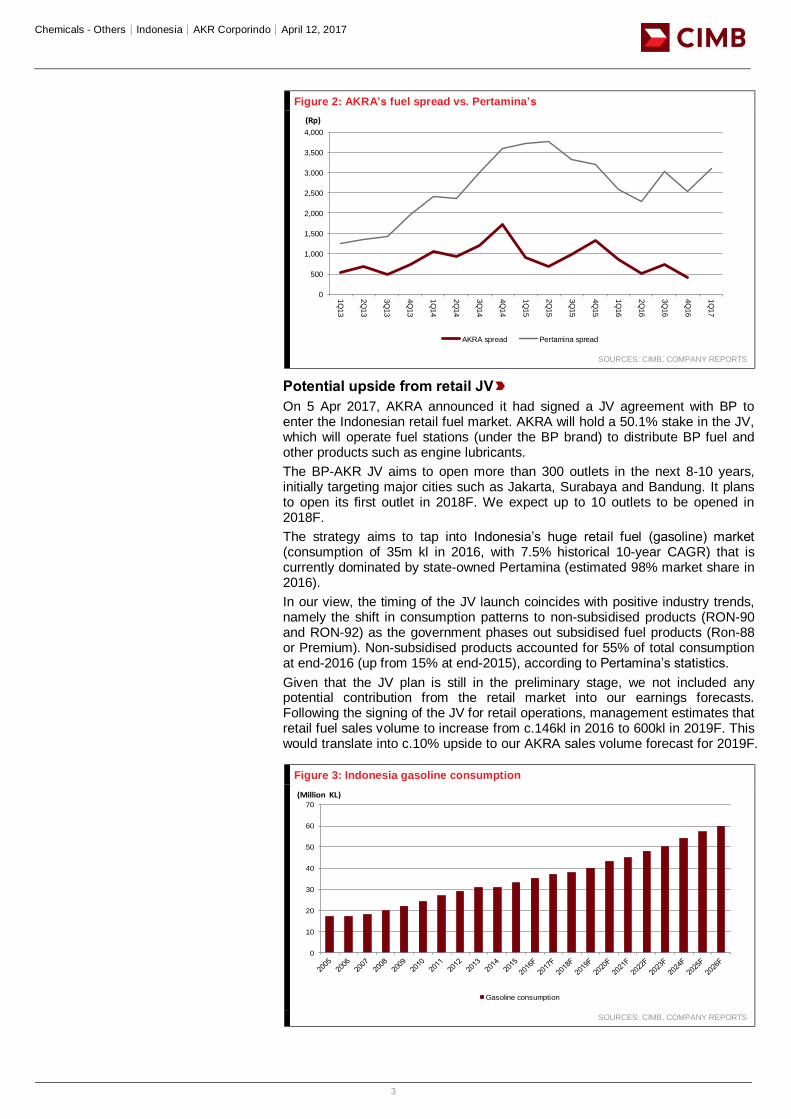
Figure 2: AKRA’s fuel spread vs. Pertamina’s
SOURCES: CIMB, COMPANY REPORTS
Potential upside from retail JV
On 5 Apr 2017, AKRA announced it had signed a JV agreement with BP to enter the Indonesian retail fuel market. AKRA will hold a 50.1% stake in the JV, which will operate fuel stations (under the BP brand) to distribute BP fuel and other products such as engine lubricants.
The BP-AKR JV aims to open more than 300 outlets in the next 8-10 years, initially targeting major cities such as Jakarta, Surabaya and Bandung. It plans to open its first outlet in 2018F. We expect up to 10 outlets to be opened in 2018F.
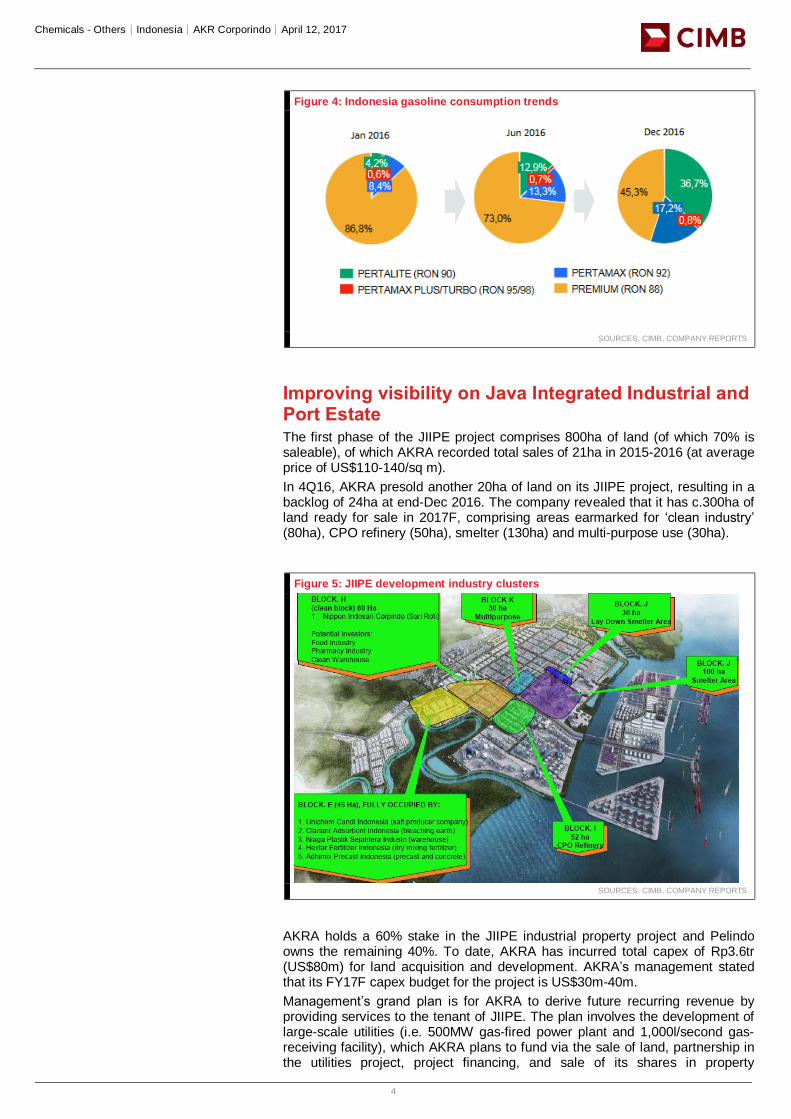
The strategy aims to tap into Indonesia’s huge retail fuel (gasoline) market (consumption of 35m kl in 2016, with 7.5% historical 10-year CAGR) that is currently dominated by state-owned Pertamina (estimated 98% market share in 2016).
In our view, the timing of the JV launch coincides with positive industry trends, namely the shift in consumption patterns to non-subsidised products (RON-90 and RON-92) as the government phases out subsidised fuel products (Ron-88 or Premium). Non-subsidised products accounted for 55% of total consumption at end-2016 (up from 15% at end-2015), according to Pertamina’s statistics.
Given that the JV plan is still in the preliminary stage, we not included any potential contribution from the retail market into our earnings forecasts. Following the signing of the JV for retail operations, management estimates that retail fuel sales volume to increase from c.146kl in 2016 to 600kl in 2019F. This would translate into c.10% upside to our AKRA sales volume forecast for 2019F.
Figure 3: Indonesia gasoline consumption
SOURCES: CIMB, COMPANY REPORTS
Title:
Source:
Please fill in the values above to have them entered in your report
0
500
1,000
1,500
2,000
2,500
3,000
3,500
4,000
1Q
13
2Q
13
3Q
13
4Q
13
1Q
14
2Q
14
3Q
14
4Q
14
1Q
15
2Q
15
3Q
15
4Q
15
1Q
16
2Q
16
3Q
16
4Q
16
1Q
17
(Rp)
AKRA spread Pertamina spread
Title:
Source:
Please fill in the values above to have them entered in your report
0
10
20
30
40
50
60
70
(Million KL)
Gasoline consumption
Chemicals - Others│Indonesia│AKR Corporindo│April 12, 2017
4
Figure 4: Indonesia gasoline consumption trends
SOURCES: CIMB, COMPANY REPORTS
Improving visibility on Java Integrated Industrial and Port Estate
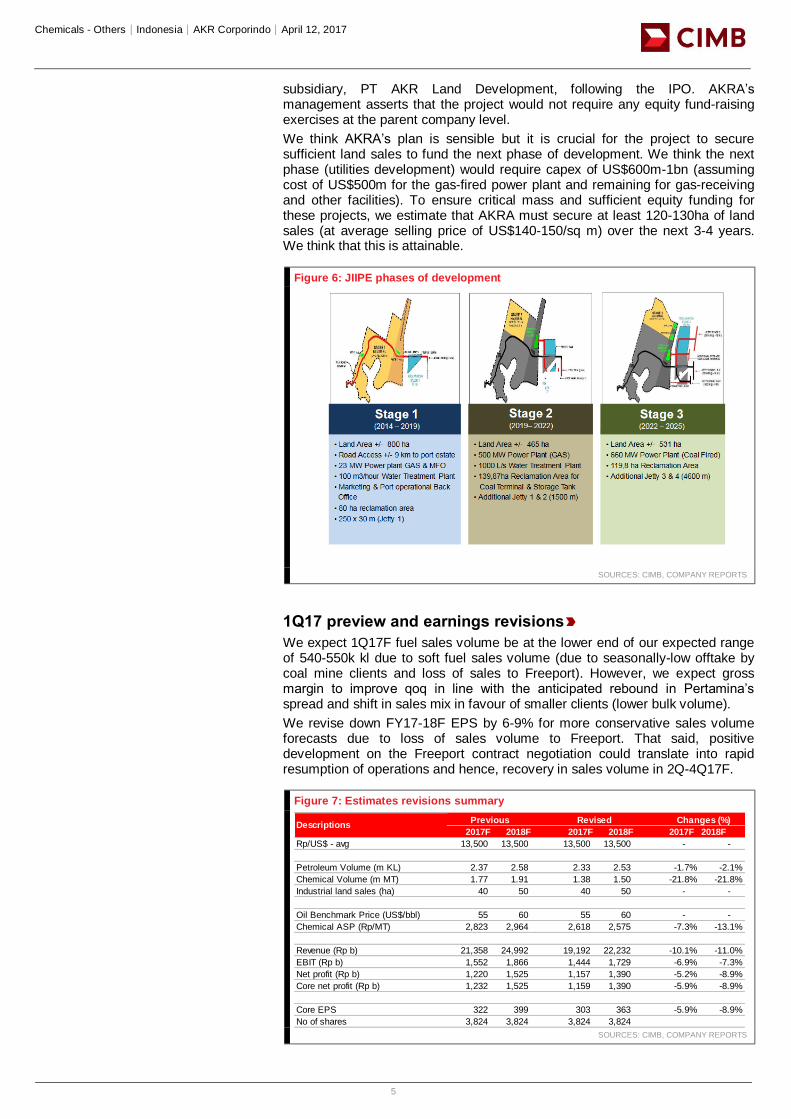
The first phase of the JIIPE project comprises 800ha of land (of which 70% is saleable), of which AKRA recorded total sales of 21ha in 2015-2016 (at average price of US$110-140/sq m).
In 4Q16, AKRA presold another 20ha of land on its JIIPE project, resulting in a backlog of 24ha at end-Dec 2016. The company revealed that it has c.300ha of land ready for sale in 2017F, comprising areas earmarked for ‘clean industry’ (80ha), CPO refinery (50ha), smelter (130ha) and multi-purpose use (30ha).
Figure 5: JIIPE development industry clusters
SOURCES: CIMB, COMPANY REPORTS
AKRA holds a 60% stake in the JIIPE industrial property project and Pelindo owns the remaining 40%. To date, AKRA has incurred total capex of Rp3.6tr (US$80m) for land acquisition and development. AKRA’s management stated that its FY17F capex budget for the project is US$30m-40m.
Management’s grand plan is for AKRA to derive future recurring revenue by providing services to the tenant of JIIPE. The plan involves the development of large-scale utilities (i.e. 500MW gas-fired power plant and 1,000l/second gas-receiving facility), which AKRA plans to fund via the sale of land, partnership in the utilities project, project financing, and sale of its shares in property
Chemicals - Others│Indonesia│AKR Corporindo│April 12, 2017
5
subsidiary, PT AKR Land Development, following the IPO. AKRA’s management asserts that the project would not require any equity fund-raising exercises at the parent company level.
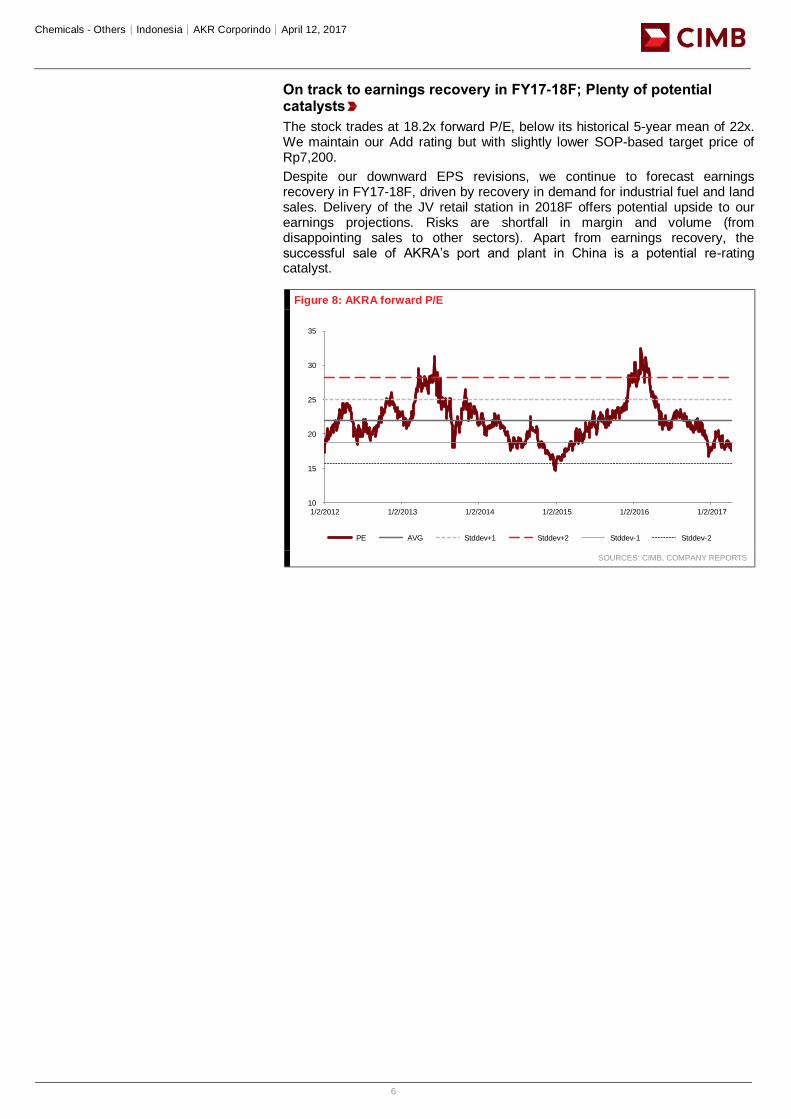
We think AKRA’s plan is sensible but it is crucial for the project to secure sufficient land sales to fund the next phase of development. We think the next phase (utilities development) would require capex of US$600m-1bn (assuming cost of US$500m for the gas-fired power plant and remaining for gas-receiving and other facilities). To ensure critical mass and sufficient equity funding for these projects, we estimate that AKRA must secure at least 120-130ha of land sales (at average selling price of US$140-150/sq m) over the next 3-4 years. We think that this is attainable.
Figure 6: JIIPE phases of development
SOURCES: CIMB, COMPANY REPORTS
1Q17 preview and earnings revisions
We expect 1Q17F fuel sales volume be at the lower end of our expected range of 540-550k kl due to soft fuel sales volume (due to seasonally-low offtake by coal mine clients and loss of sales to Freeport). However, we expect gross margin to improve qoq in line with the anticipated rebound in Pertamina’s spread and shift in sales mix in favour of smaller clients (lower bulk volume).
We revise down FY17-18F EPS by 6-9% for more conservative sales volume forecasts due to loss of sales volume to Freeport. That said, positive development on the Freeport contract negotiation could translate into rapid resumption of operations and hence, recovery in sales volume in 2Q-4Q17F.
Figure 7: Estimates revisions summary
SOURCES: CIMB, COMPANY REPORTS
2017F 2018F 2017F 2018F 2017F 2018F
Rp/US$ - avg 13,500 13,500 13,500 13,500 - -
Petroleum Volume (m KL) 2.37 2.58 2.33 2.53 -1.7% -2.1%
Chemical Volume (m MT) 1.77 1.91 1.38 1.50 -21.8% -21.8%
Industrial land sales (ha) 40 50 40 50 - -
Oil Benchmark Price (US$/bbl) 55 60 55 60 - -
Chemical ASP (Rp/MT) 2,823 2,964 2,618 2,575 -7.3% -13.1%
Revenue (Rp b) 21,358 24,992 19,192 22,232 -10.1% -11.0%
EBIT (Rp b) 1,552 1,866 1,444 1,729 -6.9% -7.3%
Net profit (Rp b) 1,220 1,525 1,157 1,390 -5.2% -8.9%
Core net profit (Rp b) 1,232 1,525 1,159 1,390 -5.9% -8.9%
Core EPS 322 399 303 363 -5.9% -8.9%
No of shares 3,824 3,824 3,824 3,824
Previous Revised Changes (%)Descriptions
Chemicals - Others│Indonesia│AKR Corporindo│April 12, 2017
6
On track to earnings recovery in FY17-18F; Plenty of potential catalysts
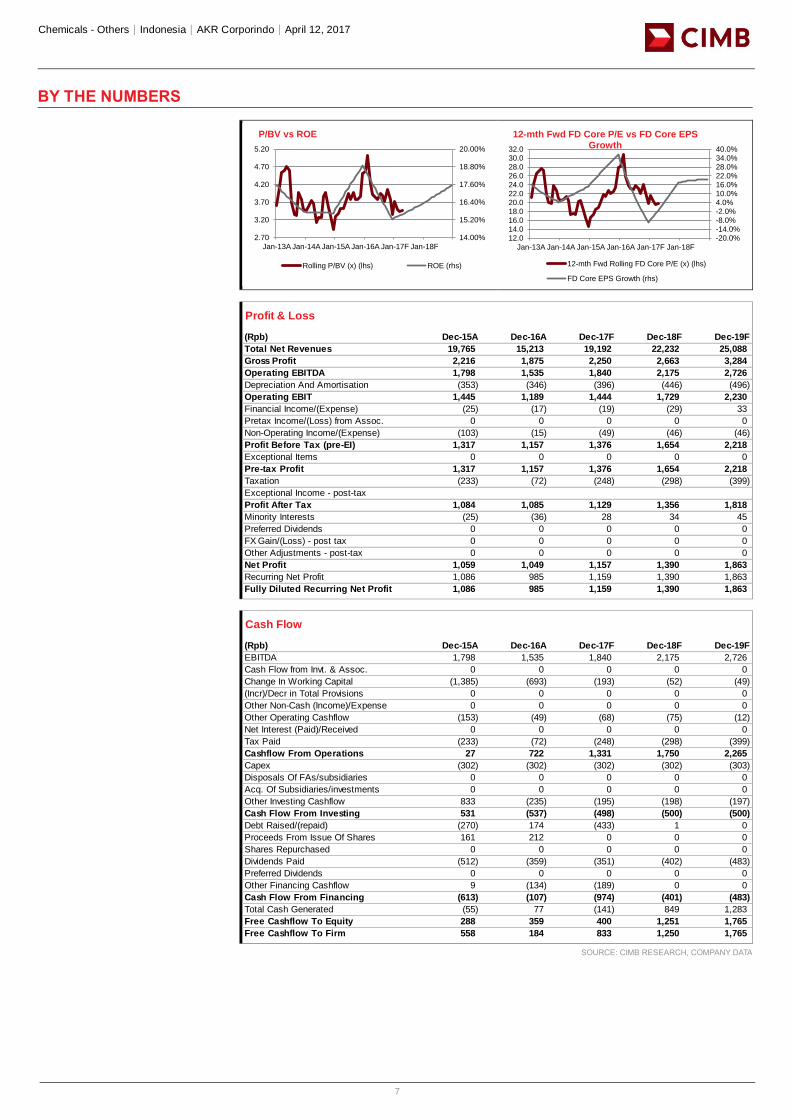
The stock trades at 18.2x forward P/E, below its historical 5-year mean of 22x. We maintain our Add rating but with slightly lower SOP-based target price of Rp7,200.
Despite our downward EPS revisions, we continue to forecast earnings recovery in FY17-18F, driven by recovery in demand for industrial fuel and land sales. Delivery of the JV retail station in 2018F offers potential upside to our earnings projections. Risks are shortfall in margin and volume (from disappointing sales to other sectors). Apart from earnings recovery, the successful sale of AKRA’s port and plant in China is a potential re-rating catalyst.
Figure 8: AKRA forward P/E
SOURCES: CIMB, COMPANY REPORTS
Title:
Source:
Please fill in the values above to have them entered in your report
10
15
20
25
30
35
1/2/2012 1/2/2013 1/2/2014 1/2/2015 1/2/2016 1/2/2017
PE AVG Stddev+1 Stddev+2 Stddev-1 Stddev-2
Chemicals - Others│Indonesia│AKR Corporindo│April 12, 2017
7
BY THE NUMBERS
SOURCE: CIMB RESEARCH, COMPANY DATA
14.00%
15.20%
16.40%
17.60%
18.80%
20.00%
2.70
3.20
3.70
4.20
4.70
5.20
Jan-13A Jan-14A Jan-15A Jan-16A Jan-17F Jan-18F
P/BV vs ROE
Rolling P/BV (x) (lhs) ROE (rhs)
-20.0%-14.0%-8.0%-2.0%4.0%10.0%16.0%22.0%28.0%34.0%40.0%
12.014.016.018.020.022.024.026.028.030.032.0
Jan-13A Jan-14A Jan-15A Jan-16A Jan-17F Jan-18F
12-mth Fwd FD Core P/E vs FD Core EPS Growth
12-mth Fwd Rolling FD Core P/E (x) (lhs)
FD Core EPS Growth (rhs)
Profit & Loss
(Rpb) Dec-15A Dec-16A Dec-17F Dec-18F Dec-19F
Total Net Revenues 19,765 15,213 19,192 22,232 25,088
Gross Profit 2,216 1,875 2,250 2,663 3,284
Operating EBITDA 1,798 1,535 1,840 2,175 2,726
Depreciation And Amortisation (353) (346) (396) (446) (496)
Operating EBIT 1,445 1,189 1,444 1,729 2,230
Financial Income/(Expense) (25) (17) (19) (29) 33
Pretax Income/(Loss) from Assoc. 0 0 0 0 0
Non-Operating Income/(Expense) (103) (15) (49) (46) (46)
Profit Before Tax (pre-EI) 1,317 1,157 1,376 1,654 2,218
Exceptional Items 0 0 0 0 0
Pre-tax Profit 1,317 1,157 1,376 1,654 2,218
Taxation (233) (72) (248) (298) (399)
Exceptional Income - post-tax
Profit After Tax 1,084 1,085 1,129 1,356 1,818
Minority Interests (25) (36) 28 34 45
Preferred Dividends 0 0 0 0 0
FX Gain/(Loss) - post tax 0 0 0 0 0
Other Adjustments - post-tax 0 0 0 0 0
Net Profit 1,059 1,049 1,157 1,390 1,863
Recurring Net Profit 1,086 985 1,159 1,390 1,863
Fully Diluted Recurring Net Profit 1,086 985 1,159 1,390 1,863
Cash Flow
(Rpb) Dec-15A Dec-16A Dec-17F Dec-18F Dec-19F
EBITDA 1,798 1,535 1,840 2,175 2,726
Cash Flow from Invt. & Assoc. 0 0 0 0 0
Change In Working Capital (1,385) (693) (193) (52) (49)
(Incr)/Decr in Total Provisions 0 0 0 0 0
Other Non-Cash (Income)/Expense 0 0 0 0 0
Other Operating Cashflow (153) (49) (68) (75) (12)
Net Interest (Paid)/Received 0 0 0 0 0
Tax Paid (233) (72) (248) (298) (399)
Cashflow From Operations 27 722 1,331 1,750 2,265
Capex (302) (302) (302) (302) (303)
Disposals Of FAs/subsidiaries 0 0 0 0 0
Acq. Of Subsidiaries/investments 0 0 0 0 0
Other Investing Cashflow 833 (235) (195) (198) (197)
Cash Flow From Investing 531 (537) (498) (500) (500)
Debt Raised/(repaid) (270) 174 (433) 1 0
Proceeds From Issue Of Shares 161 212 0 0 0
Shares Repurchased 0 0 0 0 0
Dividends Paid (512) (359) (351) (402) (483)
Preferred Dividends 0 0 0 0 0
Other Financing Cashflow 9 (134) (189) 0 0
Cash Flow From Financing (613) (107) (974) (401) (483)
Total Cash Generated (55) 77 (141) 849 1,283
Free Cashflow To Equity 288 359 400 1,251 1,765
Free Cashflow To Firm 558 184 833 1,250 1,765
Chemicals - Others│Indonesia│AKR Corporindo│April 12, 2017
8
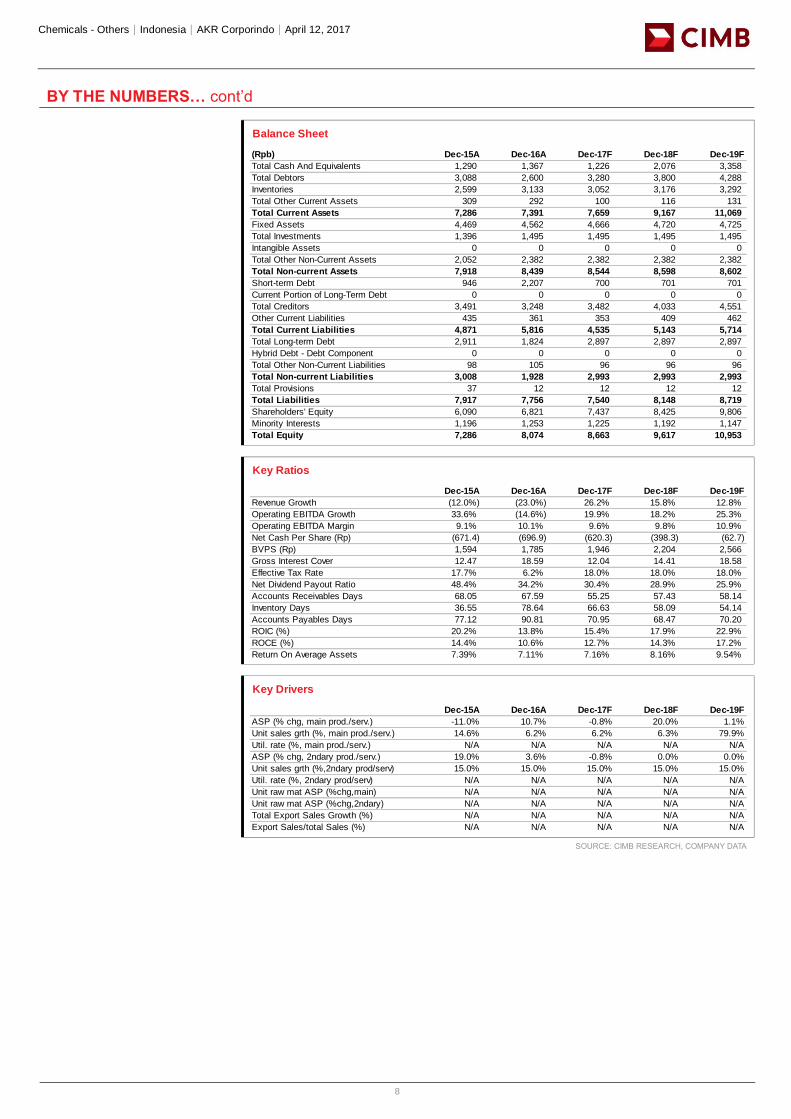
BY THE NUMBERS… cont’d
SOURCE: CIMB RESEARCH, COMPANY DATA
Balance Sheet
(Rpb) Dec-15A Dec-16A Dec-17F Dec-18F Dec-19F
Total Cash And Equivalents 1,290 1,367 1,226 2,076 3,358
Total Debtors 3,088 2,600 3,280 3,800 4,288
Inventories 2,599 3,133 3,052 3,176 3,292
Total Other Current Assets 309 292 100 116 131
Total Current Assets 7,286 7,391 7,659 9,167 11,069
Fixed Assets 4,469 4,562 4,666 4,720 4,725
Total Investments 1,396 1,495 1,495 1,495 1,495
Intangible Assets 0 0 0 0 0
Total Other Non-Current Assets 2,052 2,382 2,382 2,382 2,382
Total Non-current Assets 7,918 8,439 8,544 8,598 8,602
Short-term Debt 946 2,207 700 701 701
Current Portion of Long-Term Debt 0 0 0 0 0
Total Creditors 3,491 3,248 3,482 4,033 4,551
Other Current Liabilities 435 361 353 409 462
Total Current Liabilities 4,871 5,816 4,535 5,143 5,714
Total Long-term Debt 2,911 1,824 2,897 2,897 2,897
Hybrid Debt - Debt Component 0 0 0 0 0
Total Other Non-Current Liabilities 98 105 96 96 96
Total Non-current Liabilities 3,008 1,928 2,993 2,993 2,993
Total Provisions 37 12 12 12 12
Total Liabilities 7,917 7,756 7,540 8,148 8,719
Shareholders' Equity 6,090 6,821 7,437 8,425 9,806
Minority Interests 1,196 1,253 1,225 1,192 1,147
Total Equity 7,286 8,074 8,663 9,617 10,953
Key Ratios
Dec-15A Dec-16A Dec-17F Dec-18F Dec-19F
Revenue Growth (12.0%) (23.0%) 26.2% 15.8% 12.8%
Operating EBITDA Growth 33.6% (14.6%) 19.9% 18.2% 25.3%
Operating EBITDA Margin 9.1% 10.1% 9.6% 9.8% 10.9%
Net Cash Per Share (Rp) (671.4) (696.9) (620.3) (398.3) (62.7)
BVPS (Rp) 1,594 1,785 1,946 2,204 2,566
Gross Interest Cover 12.47 18.59 12.04 14.41 18.58
Effective Tax Rate 17.7% 6.2% 18.0% 18.0% 18.0%
Net Dividend Payout Ratio 48.4% 34.2% 30.4% 28.9% 25.9%
Accounts Receivables Days 68.05 67.59 55.25 57.43 58.14
Inventory Days 36.55 78.64 66.63 58.09 54.14
Accounts Payables Days 77.12 90.81 70.95 68.47 70.20
ROIC (%) 20.2% 13.8% 15.4% 17.9% 22.9%
ROCE (%) 14.4% 10.6% 12.7% 14.3% 17.2%
Return On Average Assets 7.39% 7.11% 7.16% 8.16% 9.54%
Key Drivers
Dec-15A Dec-16A Dec-17F Dec-18F Dec-19F
ASP (% chg, main prod./serv.) -11.0% 10.7% -0.8% 20.0% 1.1%
Unit sales grth (%, main prod./serv.) 14.6% 6.2% 6.2% 6.3% 79.9%
Util. rate (%, main prod./serv.) N/A N/A N/A N/A N/A
ASP (% chg, 2ndary prod./serv.) 19.0% 3.6% -0.8% 0.0% 0.0%
Unit sales grth (%,2ndary prod/serv) 15.0% 15.0% 15.0% 15.0% 15.0%
Util. rate (%, 2ndary prod/serv) N/A N/A N/A N/A N/A
Unit raw mat ASP (%chg,main) N/A N/A N/A N/A N/A
Unit raw mat ASP (%chg,2ndary) N/A N/A N/A N/A N/A
Total Export Sales Growth (%) N/A N/A N/A N/A N/A
Export Sales/total Sales (%) N/A N/A N/A N/A N/A
Chemicals - Others│Indonesia│AKR Corporindo│April 12, 2017
9
DISCLAIMER #01
The content of this report (including the views and opinions expressed therein, and the information comprised therein) has been prepared by and belongs to CIMB and is distributed by CIMB.
This report is not directed to, or intended for distribution to or use by, any person or entity who is a citizen or resident of or located in any locality, state, country or other jurisdiction where such distribution, publication, availability or use would be contrary to law or regulation.
By accepting this report, the recipient hereof represents and warrants that he is entitled to receive such report in accordance with the restrictions set forth below and agrees to be bound by the limitations contained herein (including the “Restrictions on Distributions” set out below). Any failure to comply with these limitations may constitute a violation of law. This publication is being supplied to you strictly on the basis that it will remain confidential. No part of this report may be (i) copied, photocopied, duplicated, stored or reproduced in any form by any means or (ii) redistributed or passed on, directly or indirectly, to any other person in whole or in part, for any purpose without the prior written consent of CIMB.
The information contained in this research report is prepared from data believed to be correct and reliable at the time of issue of this report. CIMB may or may not issue regular reports on the subject matter of this report at any frequency and may cease to do so or change the periodicity of reports at any time. CIMB is under no obligation to update this report in the event of a material change to the information contained in this report. CIMB has no, and will not accept any, obligation to (i) check or ensure that the contents of this report remain current, reliable or relevant, (ii) ensure that the content of this report constitutes all the information a prospective investor may require, (iii) ensure the adequacy, accuracy, completeness, reliability or fairness of any views, opinions and information, and accordingly, CIMB, or any of their respective affiliates, or its related persons (and their respective directors, associates, connected persons and/or employees) shall not be liable in any manner whatsoever for any consequences (including but not limited to any direct, indirect or consequential losses, loss of profits and damages) of any reliance thereon or usage thereof. In particular, CIMB disclaims all responsibility and liability for the views and opinions set out in this report.
Unless otherwise specified, this report is based upon sources which CIMB considers to be reasonable. Such sources will, unless otherwise specified, for market data, be market data and prices available from the main stock exchange or market where the relevant security is listed, or, where appropriate, any other market. Information on the accounts and business of company(ies) will generally be based on publ ished statements of the company(ies), information disseminated by regulatory information services, other publicly available information and information resulting from our research.
Whilst every effort is made to ensure that statements of facts made in this report are accurate, all estimates, projections, forecasts, expressions of opinion and other subjective judgments contained in this report are based on assumptions considered to be reasonable as of the date of the document in which they are contained and must not be construed as a representation that the matters referred to therein will occur. Past performance is not a reliable indicator of future performance. The value of investments may go down as well as up and those investing may, depending on the investments in question, lose more than the initial investment. No report shall constitute an offer or an invitation by or on behalf of CIMB or its affiliates to any person to buy or sell any investments.
CIMB, its affiliates and related companies, their directors, associates, connected parties and/or employees may own or have positions in securities of the company(ies) covered in this research report or any securities related thereto and may from time to time add to or dispose of, or may be materially interested in, any such securities. Further, CIMB, its affiliates and its related companies do and seek to do business with the company(ies) covered in this research report and may from time to time act as market maker or have assumed an underwriting commitment in securities of such company(ies), may sell them to or buy them from customers on a principal basis and may also perform or seek to perform significant investment banking, advisory, underwriting or placement services for or relating to such company(ies) as well as solicit such investment, advisory or other services from any entity mentioned in this report.
CIMB or its affiliates may enter into an agreement with the company(ies) covered in this report relating to the production of research reports. CIMB may disclose the contents of this report to the company(ies) covered by it and may have amended the contents of this report following such disclosure.
The analyst responsible for the production of this report hereby certifies that the views expressed herein accurately and exclusively reflect his or her personal views and opinions about any and all of the issuers or securities analysed in this report and were prepared independently and autonomously. No part of the compensation of the analyst(s) was, is, or will be directly or indirectly related to the inclusion of specific recommendations(s) or view(s) in this report. CIMB prohibits the analyst(s) who prepared this research report from receiving any compensation, incentive or bonus based on specific investment banking transactions or for providing a specific recommendation for, or view of, a particular company. Information barriers and other arrangements may be established where necessary to prevent conflicts of interests arising. However, the analyst(s) may receive compensation that is based on his/their coverage of company(ies) in the performance of his/their duties or the performance of his/their recommendations and the research personnel involved in the preparation of this report may also participate in the solicitation of the businesses as described above. In reviewing this research report, an investor should be aware that any or all of the foregoing, among other things, may give rise to real or potential conflicts of interest. Additional information is, subject to the duties of confidentiality, available on request.
Reports relating to a specific geographical area are produced by the corresponding CIMB entity as listed in the table below. The term “CIMB” shall denote, where appropriate, the relevant entity distributing or disseminating the report in the particular jurisdiction referenced below, or, in every other case, CIMB Group Holdings Berhad ("CIMBGH") and its affiliates, subsidiaries and related companies.
Country CIMB Entity Regulated by
Hong Kong CIMB Securities Limited Securities and Futures Commission Hong Kong India CIMB Securities (India) Private Limited Securities and Exchange Board of India (SEBI) Indonesia PT CIMB Securities Indonesia Financial Services Authority of Indonesia Malaysia CIMB Investment Bank Berhad Securities Commission Malaysia Singapore CIMB Research Pte. Ltd. Monetary Authority of Singapore South Korea CIMB Securities Limited, Korea Branch Financial Services Commission and Financial Supervisory Service Taiwan CIMB Securities Limited, Taiwan Branch Financial Supervisory Commission Thailand CIMB Securities (Thailand) Co. Ltd. Securities and Exchange Commission Thailand
Chemicals - Others│Indonesia│AKR Corporindo│April 12, 2017
10
(i) As of April 11, 2017 CIMB has a proprietary position in the securities (which may include but not limited to shares, warrants, call warrants and/or any other derivatives) in the following company or companies covered or recommended in this report:
(a) -
(ii) As of April 12, 2017, the analyst(s) who prepared this report, and the associate(s), has / have an interest in the securities (which may include but not limited to shares, warrants, call warrants and/or any other derivatives) in the following company or companies covered or recommended in this report:
(a) -
This report does not purport to contain all the information that a prospective investor may require. CIMB or any of its affiliates does not make any guarantee, representation or warranty, express or implied, as to the adequacy, accuracy, completeness, reliability or fairness of any such information and opinion contained in this report. Neither CIMB nor any of its affiliates nor its related persons shall be liable in any manner whatsoever for any consequences (including but not limited to any direct, indirect or consequential losses, loss of profits and damages) of any reliance thereon or usage thereof.
This report is general in nature and has been prepared for information purposes only. It is intended for circulation amongst CIMB and its affiliates’ clients generally and does not have regard to the specific investment objectives, financial situation and the particular needs of any specific person who may receive this report. The information and opinions in this report are not and should not be construed or considered as an offer, recommendation or solicitation to buy or sell the subject securities, related investments or other financial instruments or any derivative instrument, or any rights pertaining thereto.
Investors are advised to make their own independent evaluation of the information contained in this research report, consider their own individual investment objectives, financial situation and particular needs and consult their own professional and financial advisers as to the legal, business, financial, tax and other aspects before participating in any transaction in respect of the securities of company(ies) covered in this research report.
The securities of such company(ies) may not be eligible for sale in all jurisdictions or to all categories of investors.
Australia: Despite anything in this report to the contrary, this research is provided in Australia by CIMB Securities (Singapore) Pte. Ltd. and CIMB Securities Limited. This research is only available in Australia to persons who are “wholesale clients” (within the meaning of the Corporations Act 2001 (Cth) and is supplied solely for the use of such wholesale clients and shall not be distributed or passed on to any other person. You represent and warrant that if you are in Australia, you are a “wholesale client”. This research is of a general nature only and has been prepared without taking into account the objectives, financial situation or needs of the individual recipient. CIMB Securities (Singapore) Pte. Ltd. and CIMB Securities Limited do not hold, and are not required to hold an Australian financial services licence. CIMB Securities (Singapore) Pte. Ltd. and CIMB Securities Limited rely on “passporting” exemptions for entities appropriately licensed by the Monetary Authority of Singapore (under ASIC Class Order 03/1102) and the Securities and Futures Commission in Hong Kong (under ASIC Class Order 03/1103).
Canada: This research report has not been prepared in accordance with the disclosure requirements of Dealer Member Rule 3400 – Research Restrictions and Disclosure Requirements of the Investment Industry Regulatory Organization of Canada. For any research report distributed by CIBC, further disclosures related to CIBC conflicts of interest can be found at https://researchcentral.cibcwm.com .
China: For the purpose of this report, the People’s Republic of China (“PRC”) does not include the Hong Kong Special Administrative Region, the Macau Special Administrative Region or Taiwan. The distributor of this report has not been approved or licensed by the China Securities Regulatory Commission or any other relevant regulatory authority or governmental agency in the PRC. This report contains only marketing information. The distribution of this report is not an offer to buy or sell to any person within or outside PRC or a solicitation to any person within or outside of PRC to buy or sell any instruments described herein. This report is being issued outside the PRC to a limited number of institutional investors and may not be provided to any person other than the original recipient and may not be reproduced or used for any other purpose.
France: Only qualified investors within the meaning of French law shall have access to this report. This report shall not be considered as an offer to subscribe to, or used in connection with, any offer for subscription or sale or marketing or direct or indirect distribution of financial instruments and it is not intended as a solicitation for the purchase of any financial instrument.
Germany: This report is only directed at persons who are professional investors as defined in sec 31a(2) of the German Securities Trading Act (WpHG). This publication constitutes research of a non-binding nature on the market situation and the investment instruments cited here at the time of the publication of the information.
The current prices/yields in this issue are based upon closing prices from Bloomberg as of the day preceding publication. Please note that neither the German Federal Financial Supervisory Agency (BaFin), nor any other supervisory authority exercises any control over the content of this report.
Hong Kong: This report is issued and distributed in Hong Kong by CIMB Securities Limited (“CHK”) which is licensed in Hong Kong by the Securities and Futures Commission for Type 1 (dealing in securities), Type 4 (advising on securities) and Type 6 (advising on corporate finance) activities. Any investors wishing to purchase or otherwise deal in the securities covered in this report should contact the Head of Sales at CIMB Securities Limited. The views and opinions in this research report are our own as of the date hereof and are subject to change. If the Financial Services and Markets Act of the United Kingdom or the rules of the Financial Conduct Authority apply to a recipient, our obligations owed to such recipient therein are unaffected. CHK has no obligation to update its opinion or the information in this research report.
This publication is strictly confidential and is for private circulation only to clients of CHK.
CIMB Securities Limited does not make a market on other securities mentioned in the report.
India: This report is issued and distributed in India by CIMB Securities (India) Private Limited (“CIMB India”) which is registered with the National Stock Exchange of India Limited and BSE Limited as a trading and clearing member under the Securities and Exchange Board of India (Stock Brokers and Sub-Brokers) Regulations, 1992. In accordance with the provisions of Regulation 4(g) of the Securities and Exchange Board of India (Investment Advisers) Regulations, 2013, CIMB India is not required to seek registration with the Securities and Exchange Board of India (“SEBI”) as an Investment Adviser. CIMB India is registered with SEBI as a Research Analyst pursuant to the SEBI (Research Analysts) Regulations, 2014 ("Regulations").
This report does not take into account the particular investment objectives, financial situations, or needs of the recipients. It is not intended for

Chemicals - Others│Indonesia│AKR Corporindo│April 12, 2017
11
and does not deal with prohibitions on investment due to law/jurisdiction issues etc. which may exist for certain persons/ent ities. Recipients should rely on their own investigations and take their own professional advice before investment.
The report is not a “prospectus” as defined under Indian Law, including the Companies Act, 2013, and is not, and shall not be, approved by, or filed or registered with, any Indian regulator, including any Registrar of Companies in India, SEBI, any Indian stock exchange, or the Reserve Bank of India. No offer, or invitation to offer, or solicitation of subscription with respect to any such securities listed or proposed to be listed in India is being made, or intended to be made, to the public, or to any member or section of the public in India, through or pursuant to this report.
The research analysts, strategists or economists principally responsible for the preparation of this research report are segregated from the other activities of CIMB India and they have received compensation based upon various factors, including quality, accuracy and value of research, firm profitability or revenues, client feedback and competitive factors. Research analysts', strategists' or economists' compensation is not linked to investment banking or capital markets transactions performed or proposed to be performed by CIMB India or its affiliates.
CIMB Securities (India) Pte Ltd has not received any investment banking related compensation from the companies mentioned in the report in the past 12 months.
CIMB Securities (India) Pte Ltd has not received any compensation from the companies mentioned in the report in the past 12 months.
Indonesia: This report is issued and distributed by PT CIMB Securities Indonesia (“CIMBI”). The views and opinions in this research report are our own as of the date hereof and are subject to change. If the Financial Services and Markets Act of the United Kingdom or the rules of the Financial Conduct Authority apply to a recipient, our obligations owed to such recipient therein are unaffected. CIMBI has no obligation to update its opinion or the information in this research report. Neither this report nor any copy hereof may be distributed in Indonesia or to any Indonesian citizens wherever they are domiciled or to Indonesian residents except in compliance with applicable Indonesian capital market laws and regulations.
This research report is not an offer of securities in Indonesia. The securities referred to in this research report have not been registered with the Financial Services Authority (Otoritas Jasa Keuangan) pursuant to relevant capital market laws and regulations, and may not be offered or sold within the territory of the Republic of Indonesia or to Indonesian citizens through a public offering or in circumstances which constitute an offer within the meaning of the Indonesian capital market law and regulations.
Ireland: CIMB is not an investment firm authorised in the Republic of Ireland and no part of this document should be construed as CIMB acting as, or otherwise claiming or representing to be, an investment firm authorised in the Republic of Ireland.
Malaysia: This report is issued and distributed by CIMB Investment Bank Berhad (“CIMB”) solely for the benefit of and for the exclusive use of our clients. If the Financial Services and Markets Act of the United Kingdom or the rules of the Financial Conduct Authority apply to a recipient, our obligations owed to such recipient therein are unaffected. CIMB has no obligation to update, revise or reaffirm its opinion or the information in this research reports after the date of this report.
New Zealand: In New Zealand, this report is for distribution only to persons who are wholesale clients pursuant to section 5C of the Financial Advisers Act 2008.
Singapore: This report is issued and distributed by CIMB Research Pte Ltd (“CIMBR”). CIMBR is a financial adviser licensed under the Financial Advisers Act, Cap 110 (“FAA”) for advising on investment products, by issuing or promulgating research analyses or research reports, whether in electronic, print or other form. Accordingly CIMBR is a subject to the applicable rules under the FAA unless it is able to avail itself to any prescribed exemptions.
Recipients of this report are to contact CIMB Research Pte Ltd, 50 Raffles Place, #19-00 Singapore Land Tower, Singapore in respect of any matters arising from, or in connection with this report. CIMBR has no obligation to update its opinion or the information in this research report. This publication is strictly confidential and is for private circulation only. If you have not been sent this report by CIMBR directly, you may not rely, use or disclose to anyone else this report or its contents.
If the recipient of this research report is not an accredited investor, expert investor or institutional investor, CIMBR accepts legal responsibility for the contents of the report without any disclaimer limiting or otherwise curtailing such legal responsibility. If the recipient is an accredited investor, expert investor or institutional investor, the recipient is deemed to acknowledge that CIMBR is exempt from certain requirements under the FAA and its attendant regulations, and as such, is exempt from complying with the following : (a) Section 25 of the FAA (obligation to disclose product information); (b) Section 27 (duty not to make recommendation with respect to any investment product without having a reasonable basis where you may be reasonably expected to rely on the recommendation) of the FAA; (c) MAS Notice on Information to Clients and Product Information Disclosure [Notice No. FAA-N03]; (d) MAS Notice on Recommendation on Investment Products [Notice No. FAA-N16]; (e) Section 36 (obligation on disclosure of interest in securities), and (f) any other laws, regulations, notices, directive, guidelines, circulars and practice notes which are relates to the above, to the extent permitted by applicable laws, as may be amended from time to time, and any other laws, regulations, notices, directive, guidelines, circulars, and practice notes as we may notify you from time to time. In addition, the recipient who is an accredited investor, expert investor or institutional investor acknowledges that a CIMBR is exempt from Section 27 of the FAA, the recipient will also not be able to file a civil claim against CIMBR for any loss or damage arising from the recipient’s reliance on any recommendation made by CIMBR which would otherwise be a right that is available to the recipient under Section 27 of the FAA, the recipient will also not be able to file a civil claim against CIMBR for any loss or damage arising from the recipient’s reliance on any recommendation made by CIMBR which would otherwise be a right that is available to the recipient under Section 27 of the FAA.
CIMB Research Pte Ltd ("CIMBR"), its affiliates and related companies, their directors, associates, connected parties and/or employees may own or have positions in securities of the company(ies) covered in this research report or any securities related thereto and may from time to time add to or dispose of, or may be materially interested in, any such securities. Further, CIMBR, its affiliates and its related companies do and seek to do business with the company(ies) covered in this research report and may from time to time act as market maker or have assumed an underwriting commitment in securities of such company(ies), may sell them to or buy them from customers on a principal basis and may also perform or seek to perform significant investment banking, advisory, underwriting or placement services for or relating to such company(ies) as well as solicit such
Chemicals - Others│Indonesia│AKR Corporindo│April 12, 2017
12
investment, advisory or other services from any entity mentioned in this report.
As of April 11, 2017, CIMBR does not have a proprietary position in the recommended securities in this report.
CIMB Research Pte Ltd does not make a market on the securities mentioned in the report.
CIMB Securities Singapore Pte Ltd does not make a market on the securities mentioned in the report.
CIMB Bank Berhad, Singapore branch does not make a market on the securities mentioned in the report.
South Korea: This report is issued and distributed in South Korea by CIMB Securities Limited, Korea Branch (“CIMB Korea”) which is licensed as a cash equity broker, and regulated by the Financial Services Commission and Financial Supervisory Service of Korea. In South Korea, this report is for distribution only to professional investors under Article 9(5) of the Financial Investment Services and Capital Market Act of Korea (“FSCMA”).
Spain: This document is a research report and it is addressed to institutional investors only. The research report is of a general nature and not personalised and does not constitute investment advice so, as the case may be, the recipient must seek proper advice before adopting any investment decision. This document does not constitute a public offering of securities.
CIMB is not registered with the Spanish Comision Nacional del Mercado de Valores to provide investment services.
Sweden: This report contains only marketing information and has not been approved by the Swedish Financial Supervisory Authority. The distribution of this report is not an offer to sell to any person in Sweden or a solicitation to any person in Sweden to buy any instruments described herein and may not be forwarded to the public in Sweden.
Switzerland: This report has not been prepared in accordance with the recognized self-regulatory minimal standards for research reports of banks issued by the Swiss Bankers’ Association (Directives on the Independence of Financial Research).
Taiwan: This research report is not an offer or marketing of foreign securities in Taiwan. The securities as referred to in this research report have not been and will not be registered with the Financial Supervisory Commission of the Republic of China pursuant to relevant securities laws and regulations and may not be offered or sold within the Republic of China through a public offering or in circumstances which constitutes an offer or a placement within the meaning of the Securities and Exchange Law of the Republic of China that requires a registration or approval of the Financial Supervisory Commission of the Republic of China.
Thailand: This report is issued and distributed by CIMB Securities (Thailand) Company Limited (“CIMBS”) based upon sources believed to be reliable (but their accuracy, completeness or correctness is not guaranteed). The statements or expressions of opinion herein were arrived at after due and careful consideration for use as information for investment. Such opinions are subject to change without notice and CIMBS has no obligation to update its opinion or the information in this research report.
If the Financial Services and Markets Act of the United Kingdom or the rules of the Financial Conduct Authority apply to a recipient, our obligations owed to such recipient are unaffected.
CIMB Securities (Thailand) Co., Ltd. may act or acts as Market Maker, and issuer and offerer of Derivative Warrants and Structured Note which may have the following securities as its underlying securities. Investors should carefully read and study the details of the derivative warrants in the prospectus before making investment decisions.
AAV, ADVANC, AMATA, AOT, AP, BA, BANPU, BBL, BCH, BCP, BDMS, BEAUTY, BEC, BEM, BH, BIG, BLA, BLAND, BTS, CBG, CENTEL, CHG, CK, CKP, COM7, CPALL, CPF, CPN, DELTA, DTAC, EGCO, EPG, GLOBAL, GLOW, GPSC, GUNKUL, HANA, HMPRO, ICHI, IFEC, INTUCH, IRPC, ITD, IVL, KAMART, KBANK, KCE, KKP, KTB, KTC, LH, LHBANK, LPN, MAJOR, MINT, MTLS, PLANB, PSH, PTG, PTT, PTTEP, PTTGC, QH, ROBINS, RS, S, SAMART, SAWAD, SCB, SCC, SCN, SGP, SIRI, SPALI, SPCG, SPRC, STEC, STPI, SUPER, TASCO, TCAP, THAI, THANI, THCOM, TISCO, TKN, TMB, TOP, TPIPL, TRUE, TTA, TTCL, TTW, TU, TVO, UNIQ, VGI, VIBHA, VNG, WHA.
Corporate Governance Report:
The disclosure of the survey result of the Thai Institute of Directors Association (“IOD”) regarding corporate governance is made pursuant to the policy of the Office of the Securities and Exchange Commission. The survey of the IOD is based on the information of a company listed on the Stock Exchange of Thailand and the Market for Alternative Investment disclosed to the public and able to be accessed by a general public investor. The result, therefore, is from the perspective of a third party. It is not an evaluation of operation and is not based on inside information.
The survey result is as of the date appearing in the Corporate Governance Report of Thai Listed Companies. As a result, the survey result may be changed after that date. CIMBS does not confirm nor certify the accuracy of such survey result.
Score Range: 90 - 100 80 - 89 70 - 79 Below 70 or No Survey Result
Description: Excellent Very Good Good N/A
United Arab Emirates: The distributor of this report has not been approved or licensed by the UAE Central Bank or any other relevant licensing authorities or governmental agencies in the United Arab Emirates. This report is strictly private and confidential and has not been reviewed by, deposited or registered with UAE Central Bank or any other licensing authority or governmental agencies in the United Arab Emirates. This report is being issued outside the United Arab Emirates to a limited number of institutional investors and must not be provided to any person other than the original recipient and may not be reproduced or used for any other purpose. Further, the information contained in this report is not intended to lead to the sale of investments under any subscription agreement or the conclusion of any other contract of whatsoever nature within the territory of the United Arab Emirates.
United Kingdom: In the United Kingdom and European Economic Area, this report is being disseminated by CIMB Securities (UK) Limited (“CIMB UK”). CIMB UK is authorized and regulated by the Financial Conduct Authority and its registered office is at 27 Knightsbridge, London, SW1X7YB. Unless specified to the contrary, this report has been issued and approved for distribution in the U.K. and the EEA by CIMB UK. Investment research issued by CIMB UK has been prepared in accordance with CIMB Group’s policies for managing conflicts of interest arising as a result of publication and distribution of investment research. This report is for distribution only to, and is solely directed at, selected persons on the basis that those persons: (a) are eligible counterparties and professional clients of CIMB UK; (b) have professional experience in matters relating to investments falling within Article 19(5) of the Financial Services and Markets Act 2000 (Financial Promotion) Order 2005 (as amended, the “Order”), (c) fall within Article 49(2)(a) to (d) (“high net worth companies, unincorporated associations etc”) of the Order; (d) are outside the United Kingdom subject to relevant regulation in each jurisdiction, or (e) are persons to whom an invitation or inducement to engage in
Chemicals - Others│Indonesia│AKR Corporindo│April 12, 2017
13
investment activity (within the meaning of section 21 of the Financial Services and Markets Act 2000) in connection with any investments to which this report relates may otherwise lawfully be communicated or caused to be communicated (all such persons together being referred to as “relevant persons”). This report is directed only at relevant persons and must not be acted on or relied on by persons who are not relevant persons. Any investment or investment activity to which this report relates is available only to relevant persons and will be engaged in only with relevant persons.
Where this report is labelled as non-independent, it does not provide an impartial or objective assessment of the subject matter and does not constitute independent “investment research” under the applicable rules of the Financial Conduct Authority in the UK. Consequently, any such non-independent report will not have been prepared in accordance with legal requirements designed to promote the independence of investment research and will not subject to any prohibition on dealing ahead of the dissemination of investment research. Any such non-independent report must be considered as a marketing communication.
United States: This research report is distributed in the United States of America by CIMB Securities (USA) Inc, a U.S. registered broker-dealer and a related company of CIMB Research Pte Ltd, CIMB Investment Bank Berhad, PT CIMB Securities Indonesia, CIMB Securities (Thailand) Co. Ltd, CIMB Securities Limited, CIMB Securities (India) Private Limited, and is distributed solely to persons who qualify as “U.S. Institutional Investors” as defined in Rule 15a-6 under the Securities and Exchange Act of 1934. This communication is only for Institutional Investors whose ordinary business activities involve investing in shares, bonds, and associated securities and/or derivative securities and who have professional experience in such investments. Any person who is not a U.S. Institutional Investor or Major Institutional Investor must not rely on this communication. The delivery of this research report to any person in the United States of America is not a recommendation to effect any transactions in the securities discussed herein, or an endorsement of any opinion expressed herein. CIMB Securities (USA) Inc, is a FINRA/SIPC member and takes responsibility for the content of this report. For further information or to place an order in any of the above-mentioned securities please contact a registered representative of CIMB Securities (USA) Inc.
CIMB Securities (USA) Inc does not make a market on other securities mentioned in the report.
Neither CIMB Securities (USA) Inc., nor its affiliates have managed or co-managed a public offering of any of the securities mentioned in the past 12 months.
Neither CIMB Securities (USA) Inc., nor its affiliates have received compensation for investment banking services from any of the company mentioned in the past 12 months.
Neither CIMB Securities (USA) Inc., nor its affiliates expects to receive or intends to seek compensation for investment banking services from any of the company mentioned within the next 3 months.
Other jurisdictions: In any other jurisdictions, except if otherwise restricted by laws or regulations, this report is only for distribution to professional, institutional or sophisticated investors as defined in the laws and regulations of such jurisdictions.
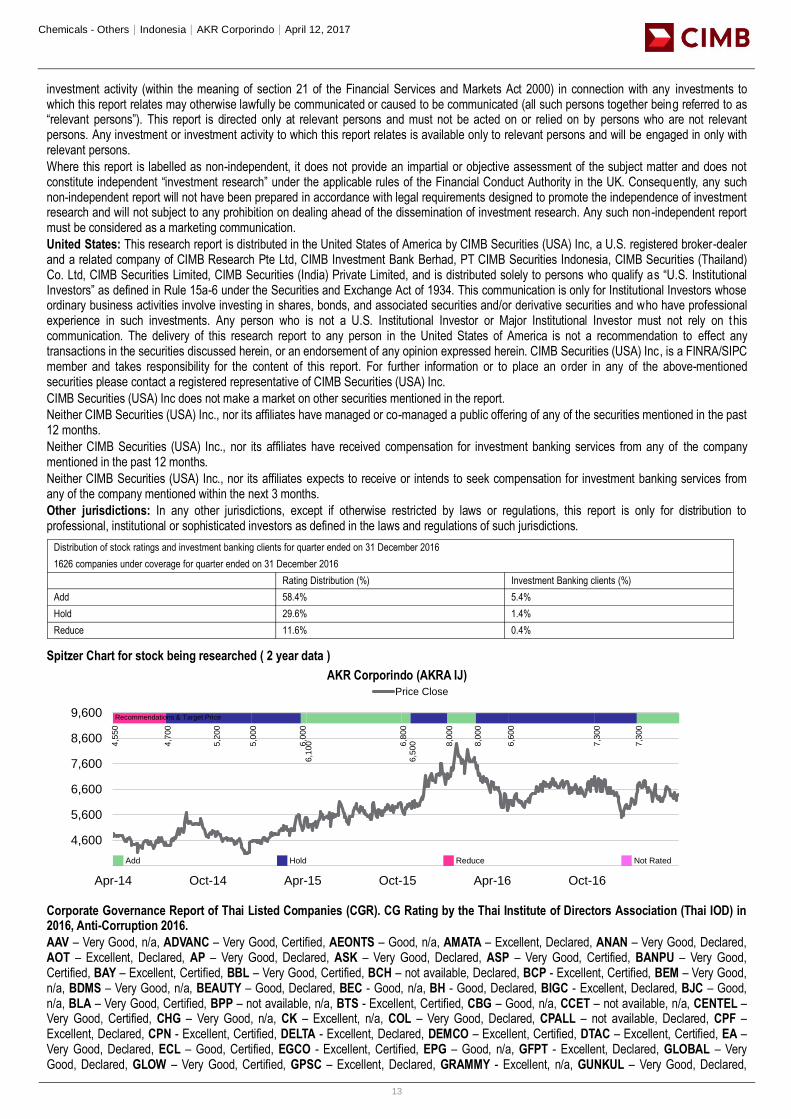
Spitzer Chart for stock being researched ( 2 year data )
AKR Corporindo (AKRA IJ)
Corporate Governance Report of Thai Listed Companies (CGR). CG Rating by the Thai Institute of Directors Association (Thai IOD) in 2016, Anti-Corruption 2016.
AAV – Very Good, n/a, ADVANC – Very Good, Certified, AEONTS – Good, n/a, AMATA – Excellent, Declared, ANAN – Very Good, Declared, AOT – Excellent, Declared, AP – Very Good, Declared, ASK – Very Good, Declared, ASP – Very Good, Certified, BANPU – Very Good, Certified, BAY – Excellent, Certified, BBL – Very Good, Certified, BCH – not available, Declared, BCP - Excellent, Certified, BEM – Very Good, n/a, BDMS – Very Good, n/a, BEAUTY – Good, Declared, BEC - Good, n/a, BH - Good, Declared, BIGC - Excellent, Declared, BJC – Good, n/a, BLA – Very Good, Certified, BPP – not available, n/a, BTS - Excellent, Certified, CBG – Good, n/a, CCET – not available, n/a, CENTEL – Very Good, Certified, CHG – Very Good, n/a, CK – Excellent, n/a, COL – Very Good, Declared, CPALL – not available, Declared, CPF – Excellent, Declared, CPN - Excellent, Certified, DELTA - Excellent, Declared, DEMCO – Excellent, Certified, DTAC – Excellent, Certified, EA – Very Good, Declared, ECL – Good, Certified, EGCO - Excellent, Certified, EPG – Good, n/a, GFPT - Excellent, Declared, GLOBAL – Very Good, Declared, GLOW – Very Good, Certified, GPSC – Excellent, Declared, GRAMMY - Excellent, n/a, GUNKUL – Very Good, Declared,
Rating Distribution (%) Investment Banking clients (%)
Add 58.4% 5.4%
Hold 29.6% 1.4%
Reduce 11.6% 0.4%
Distribution of stock ratings and investment banking clients for quarter ended on 31 December 2016
1626 companies under coverage for quarter ended on 31 December 2016
3,600
4,600
5,600
6,600
7,600
8,600
9,600
Apr-14 Oct-14 Apr-15 Oct-15 Apr-16 Oct-16
Price Close
4,5
50
4,7
00
5,2
00
5,0
00
6,0
00
6,1
00
6,8
00
6,5
00
8,0
00
8,0
00
6,6
00
7,3
00
7,3
00
Recommendations & Target Price
Add Hold Reduce Not Rated
Chemicals - Others│Indonesia│AKR Corporindo│April 12, 2017
14
HANA - Excellent, Certified, HMPRO - Excellent, Declared, ICHI – Very Good, Declared, INTUCH - Excellent, Certified, ITD – Good, n/a, IVL - Excellent, Certified, JAS – not available, Declared, JASIF – not available, n/a, JUBILE – Good, Declared, KAMART – not available, n/a, KBANK - Excellent, Certified, KCE - Excellent, Certified, KGI – Good, Certified, KKP – Excellent, Certified, KSL – Very Good, Declared, KTB - Excellent, Certified, KTC – Excellent, Certified, LH - Very Good, n/a, LPN – Excellent, Declared, M – Very Good, Declared, MAJOR - Good, n/a, MAKRO – Good, Declared, MALEE – Very Good, Declared, MBKET – Very Good, Certified, MC – Very Good, Declared, MCOT – Excellent, Declared, MEGA – Very Good, Declared, MINT - Excellent, Certified, MTLS – Very Good, Declared, NYT – Excellent, n/a, OISHI – Very Good, n/a, PLANB – Very Good, Declared, PSH – not available, n/a, PSL - Excellent, Certified, PTT - Excellent, Certified, PTTEP - Excellent, Certified, PTTGC - Excellent, Certified, QH – Excellent, Declared, RATCH – Excellent, Certified, ROBINS – Very Good, Declared, RS – Very Good, n/a, SAMART - Excellent, n/a, SAPPE - Good, n/a, SAT – Excellent, Certified, SAWAD – Good, n/a, SC – Excellent, Declared, SCB - Excellent, Certified, SCBLIF – not available, n/a, SCC – Excellent, Certified, SCN – Good, Declared, SCCC - Excellent, Declared, SIM - Excellent, n/a, SIRI - Good, n/a, SPALI - Excellent, Declared, SPRC – Very Good, Declared, STA – Very Good, Declared, STEC – Excellent, n/a, SVI – Excellent, Certified, TASCO – Very Good, Declared, TCAP – Excellent, Certified, THAI – Very Good, Declared, THANI – Very Good, Certified, THCOM – Excellent, Certified, THRE – Very Good, Certified, THREL – Very Good, Certified, TICON – Very Good, Declared, TISCO - Excellent, Certified, TK – Very Good, n/a, TKN – Good, n/a, TMB - Excellent, Certified, TOP - Excellent, Certified, TPCH – Good, n/a, TPIPP – not available, n/a, TRUE – Very Good, Declared, TTW – Very Good, Declared, TU – Excellent, Declared, UNIQ – not available, Declared, VGI – Excellent, Declared, WHA – not available, Declared, WHART – not available, n/a, WORK – not available, n/a.
Companies participating in Thailand’s Private Sector Collective Action Coalition Against Corruption programme (Thai CAC) under Thai Institute of Directors (as of October 28, 2016) are categorized into: - Companies that have declared their intention to join CAC, and - Companies certified by CAC
CIMB Recommendation Framework
Stock Ratings Definition:
Add The stock’s total return is expected to exceed 10% over the next 12 months.
Hold The stock’s total return is expected to be between 0% and positive 10% over the next 12 months.
Reduce The stock’s total return is expected to fall below 0% or more over the next 12 months.
The total expected return of a stock is defined as the sum of the: (i) percentage difference between the target price and the current price and (ii) the forward net dividend yields of the stock. Stock price targets have an investment horizon of 12 months.
Sector Ratings Definition:
Overweight An Overweight rating means stocks in the sector have, on a market cap-weighted basis, a positive absolute recommendation.
Neutral A Neutral rating means stocks in the sector have, on a market cap-weighted basis, a neutral absolute recommendation.
Underweight An Underweight rating means stocks in the sector have, on a market cap-weighted basis, a negative absolute recommendation.
Country Ratings Definition:
Overweight An Overweight rating means investors should be positioned with an above-market weight in this country relative to benchmark.
Neutral A Neutral rating means investors should be positioned with a neutral weight in this country relative to benchmark.
Underweight An Underweight rating means investors should be positioned with a below-market weight in this country relative to benchmark.