Embed Size (px)
Citation preview

The Ecological and Economic Challenges of Managing Forested Landscapes in a Global Context - Focus: Asia
Comparison of basal area estimated with Angle Count Method and Fixed Area Plots
(A case study in tropical peat swamp forest)
Yanti Sarodja
Georg-August University Göttingen
Faculty of Forest Science and Forest Ecology Chair of Forest Inventory and Remote Sensing
DAAD Workshop
DAAD Workshop - Bogor, Indonesia 16 - 22 March 2014 - DFG KL 894/17 1
Project KL 894 / 17
Project title:
Development of an integrated forest carbon monitoring system with field sampling and remote sensing
Counterparts:
Department II of the Biology Faculty, University of Munich, Germany
Centre for International Co-Operation in Sustainable Management of
Tropical Peatland (CIMTROP) - University of Palangka Raya, Indonesia
Project Team Members from Goettingen: Prof. Christoph Kleinn, Lutz Fehrman, Cesar Perez, Paul Magdon, Yanti Sarodja, Edwine Purnama, Mats Mahnken
Project objective
DAAD Workshop - Bogor, Indonesia 16 - 22 March 2014 - DFG KL 894/17 2
General objective: Methodological improvement of the Above Ground Carbon monitoring of tropical peat swamp forests with sample based field observations and Remote Sensing data
Key issue: Carbon Monitoring with emphasis on the precision of the estimation and accuracy of carbon regionalization
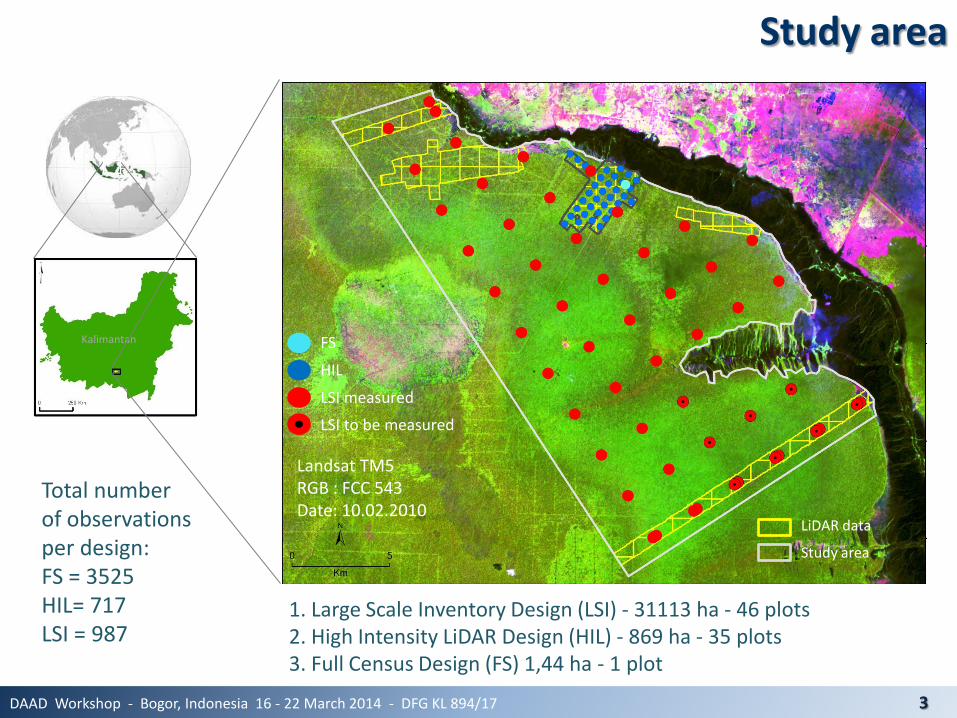
Study area
DAAD Workshop - Bogor, Indonesia 16 - 22 March 2014 - DFG KL 894/17 3
Kalimantan
LiDAR data
Study area
1. Large Scale Inventory Design (LSI) - 31113 ha - 46 plots 2. High Intensity LiDAR Design (HIL) - 869 ha - 35 plots 3. Full Census Design (FS) 1,44 ha - 1 plot
FS
HIL
LSI measured
LSI to be measured
Total number of observations per design: FS = 3525 HIL= 717 LSI = 987
Landsat TM5 RGB : FCC 543 Date: 10.02.2010
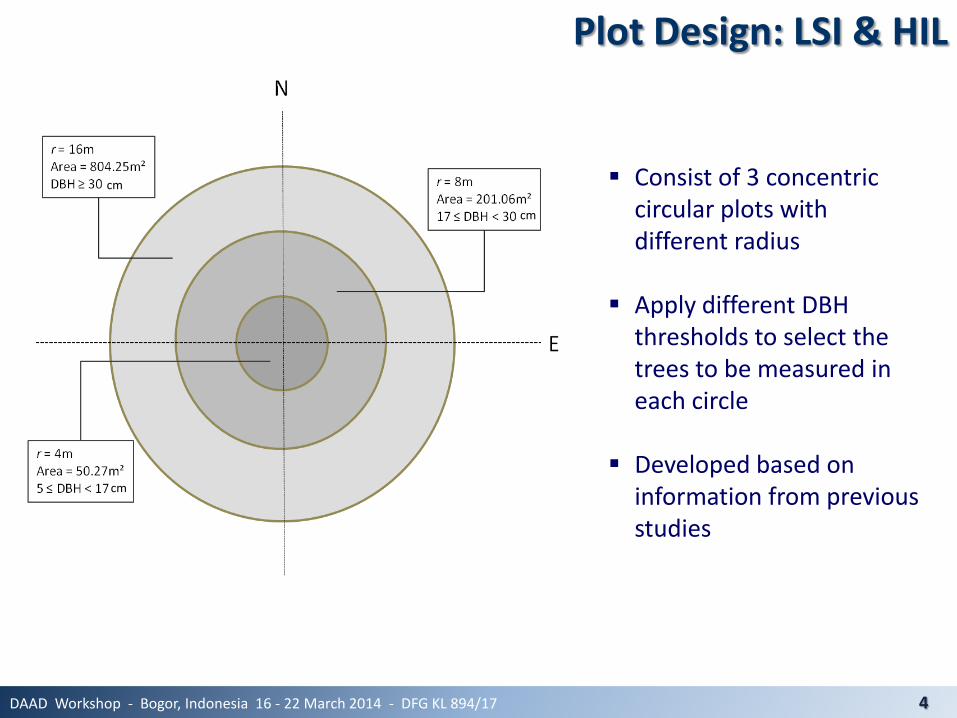
Plot Design: LSI & HIL
DAAD Workshop - Bogor, Indonesia 16 - 22 March 2014 - DFG KL 894/17 4
Consist of 3 concentric circular plots with different radius
Apply different DBH thresholds to select the trees to be measured in each circle
Developed based on information from previous studies
cm
cm
cm
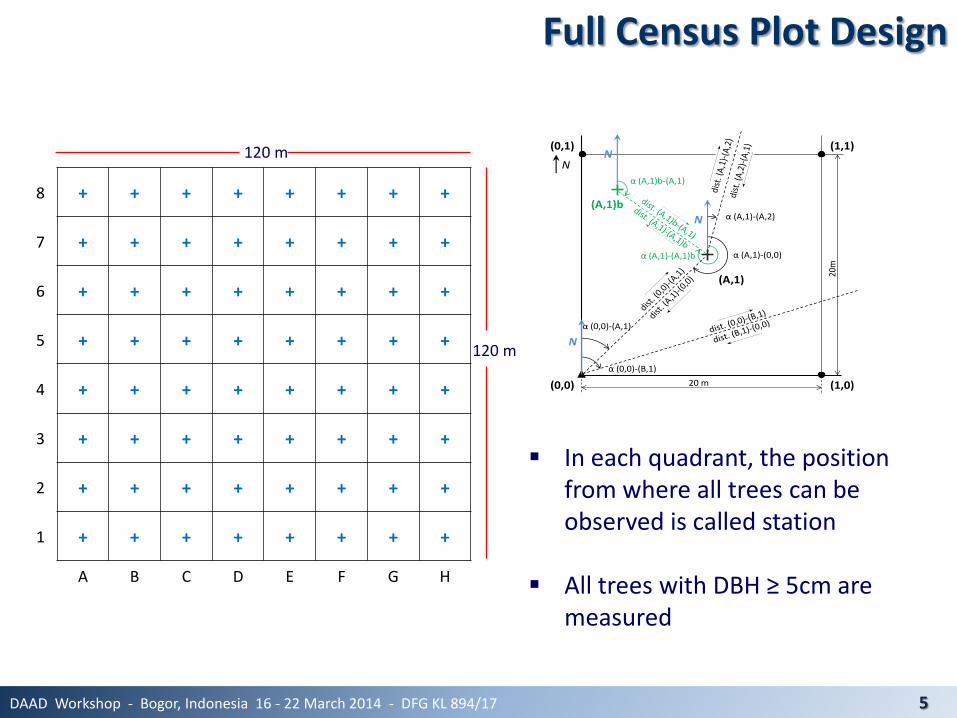
Full Census Plot Design
DAAD Workshop - Bogor, Indonesia 16 - 22 March 2014 - DFG KL 894/17 5
Systematic sampling design Grid size 500 x 500 meter 35 observation plots
120 m
120 m
8 + + + + + + + +
7 + + + + + + + +
6 + + + + + + + +
5 + + + + + + + +
4 + + + + + + + +
3 + + + + + + + +
2 + + + + + + + +
1 + + + + + + + +
A B C D E F G H
20 m
20m
N
N
α (0,0)-(A,1)
α (A,1)-(0,0)
α (0,0)-(B,1)
α (A,1)-(A,2)
(0,0)
(A,1)
N
α (A,1)-(A,1)b
N
α (A,1)b-(A,1)
(A,1)b
(0,1) (1,1)
(1,0)
In each quadrant, the position from where all trees can be observed is called station
All trees with DBH ≥ 5cm are measured
0,0
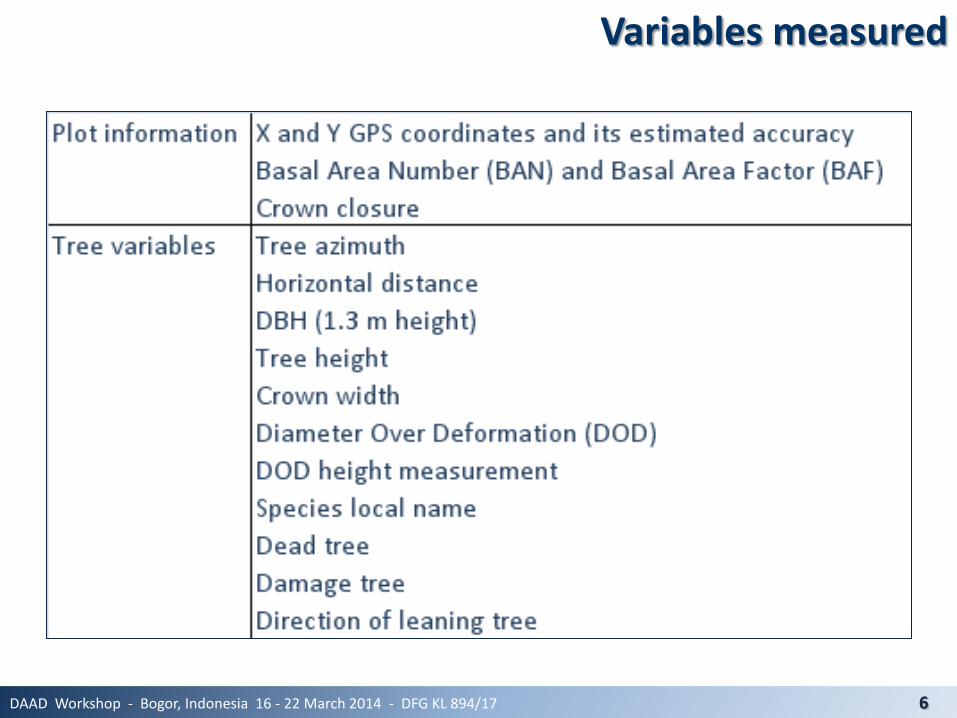
Variables measured
DAAD Workshop - Bogor, Indonesia 16 - 22 March 2014 - DFG KL 894/17 6
The Ecological and Economic Challenges of Managing Forested Landscapes in a Global Context - Focus: Asia
Comparison of basal area estimated with Angle Count Method and Fixed Area Plots
(A case study in tropical peat swamp forest)
Yanti Sarodja
Georg-August University Göttingen
Faculty of Forest Science and Forest Ecology Chair of Forest Inventory and Remote Sensing
DAAD Workshop
DAAD Workshop - Bogor, Indonesia 16 - 22 March 2014 - DFG KL 894/17 1
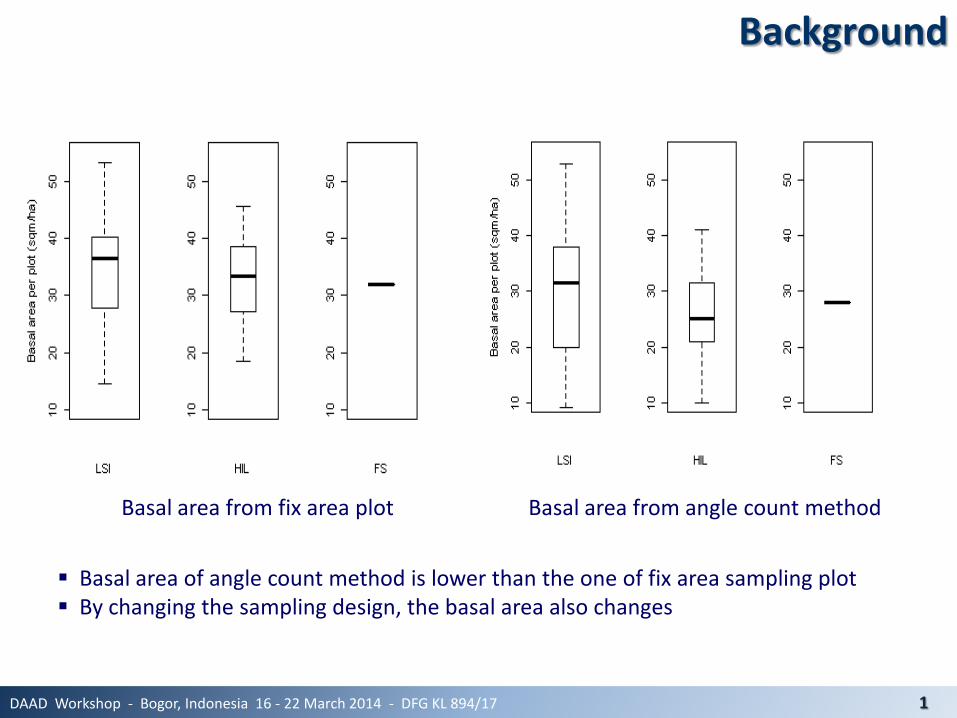
Background
Basal area of angle count method is lower than the one of fix area sampling plot By changing the sampling design, the basal area also changes
Basal area from fix area plot Basal area from angle count method
Background
DAAD Workshop - Bogor, Indonesia 16 - 22 March 2014 - DFG KL 894/17 2
Fixed area plot is sampling proportional to area and it observe a
complete sample of all trees inside the plot (Eastaugh, 2014)
The angle count method is sampling proportional to basal area. This method is efficient and easy to implement
Angle count method assumes total visibility of objects; overlooking objects leads to a non-detection bias (Bitterlich, 1984)
DAAD Workshop - Bogor, Indonesia 16 - 22 March 2014 - DFG KL 894/17 3
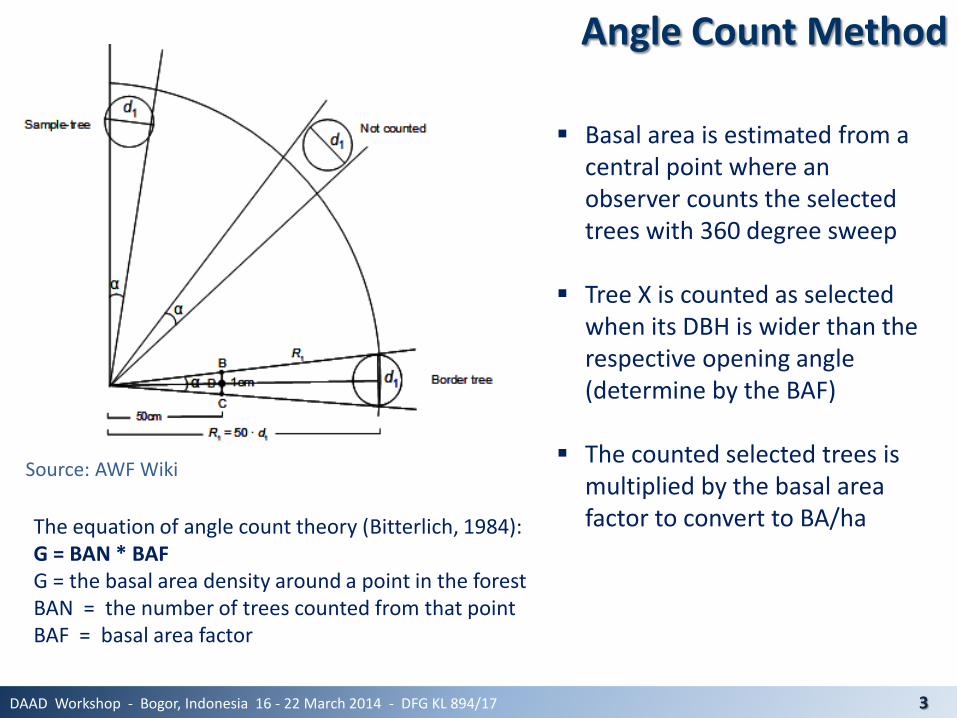
Source: AWF Wiki
Basal area is estimated from a central point where an observer counts the selected trees with 360 degree sweep
Tree X is counted as selected when its DBH is wider than the respective opening angle (determine by the BAF)
The counted selected trees is multiplied by the basal area factor to convert to BA/ha
Angle Count Method
The equation of angle count theory (Bitterlich, 1984): G = BAN * BAF G = the basal area density around a point in the forest BAN = the number of trees counted from that point BAF = basal area factor
Objective & Research question
DAAD Workshop - Bogor, Indonesia 16 - 22 March 2014 - DFG KL 894/17 4
Objective To investigate the suitable basal area factor for the forest type of the study area: - Based on the visibility of trees within the forest - Based on a simulation - Based on the desired number of trees per plot
Research question What is the suitable basal area factor for the forest type of the study area?
Methods
DAAD Workshop - Bogor, Indonesia 16 - 22 March 2014 - DFG KL 894/17 5
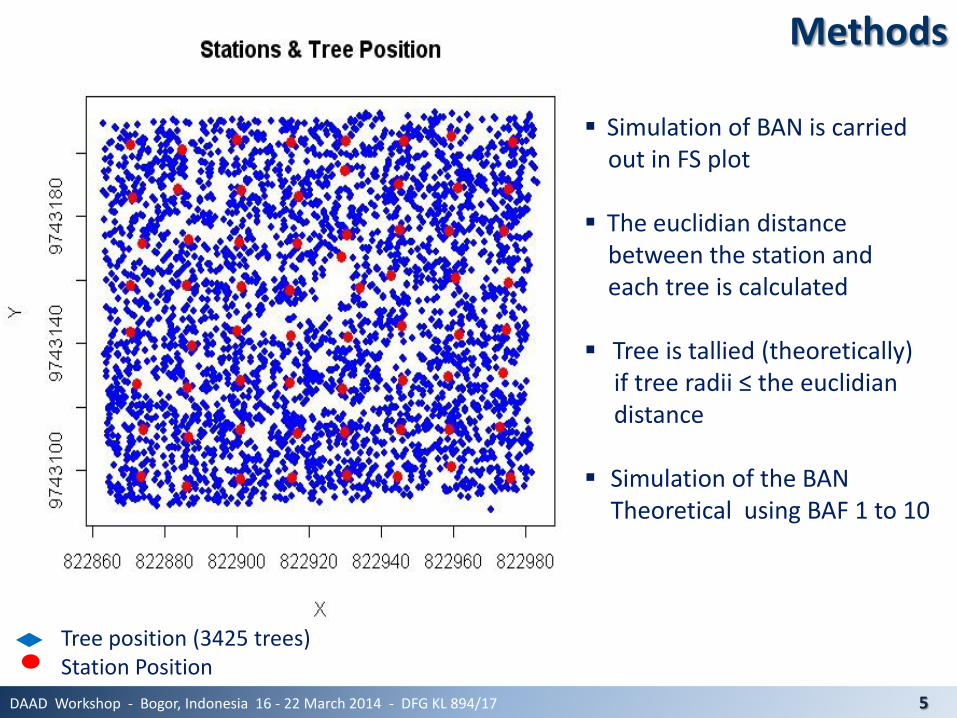
Simulation of BAN is carried out in FS plot The euclidian distance between the station and each tree is calculated Tree is tallied (theoretically) if tree radii ≤ the euclidian distance Simulation of the BAN
Theoretical using BAF 1 to 10
Tree position (3425 trees) Station Position
Methods
DAAD Workshop - Bogor, Indonesia 16 - 22 March 2014 - DFG KL 894/17 6
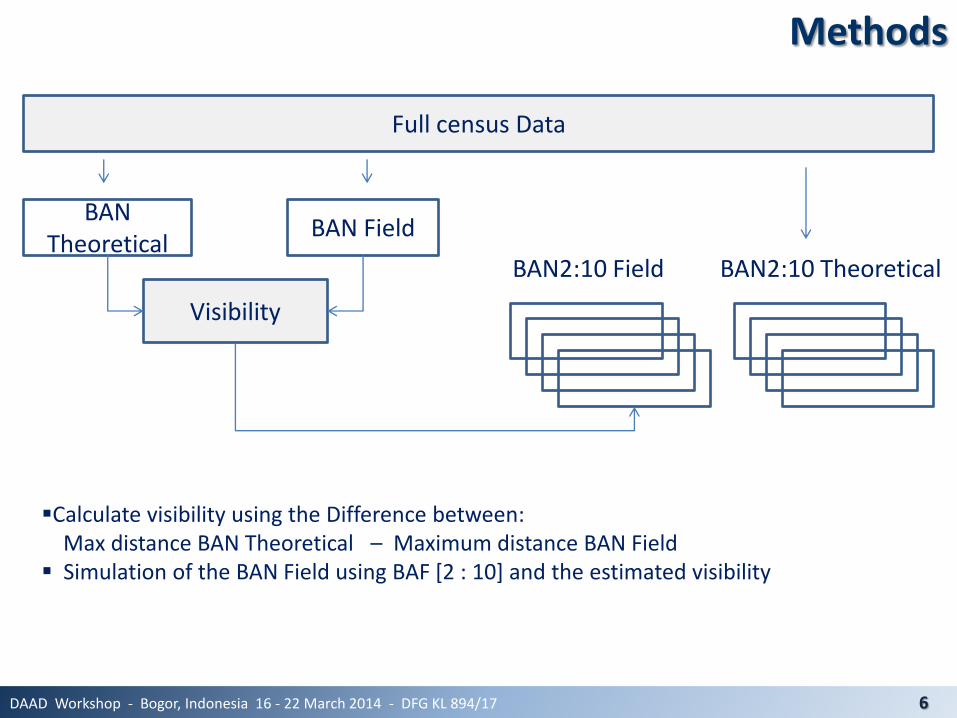
Full census Data
BAN Theoretical
BAN Field
Visibility
BAN2:10 Field BAN2:10 Theoretical
Calculate visibility using the Difference between: Max distance BAN Theoretical – Maximum distance BAN Field Simulation of the BAN Field using BAF [2 : 10] and the estimated visibility
Results
DAAD Workshop - Bogor, Indonesia 16 - 22 March 2014 - DFG KL 894/17 7
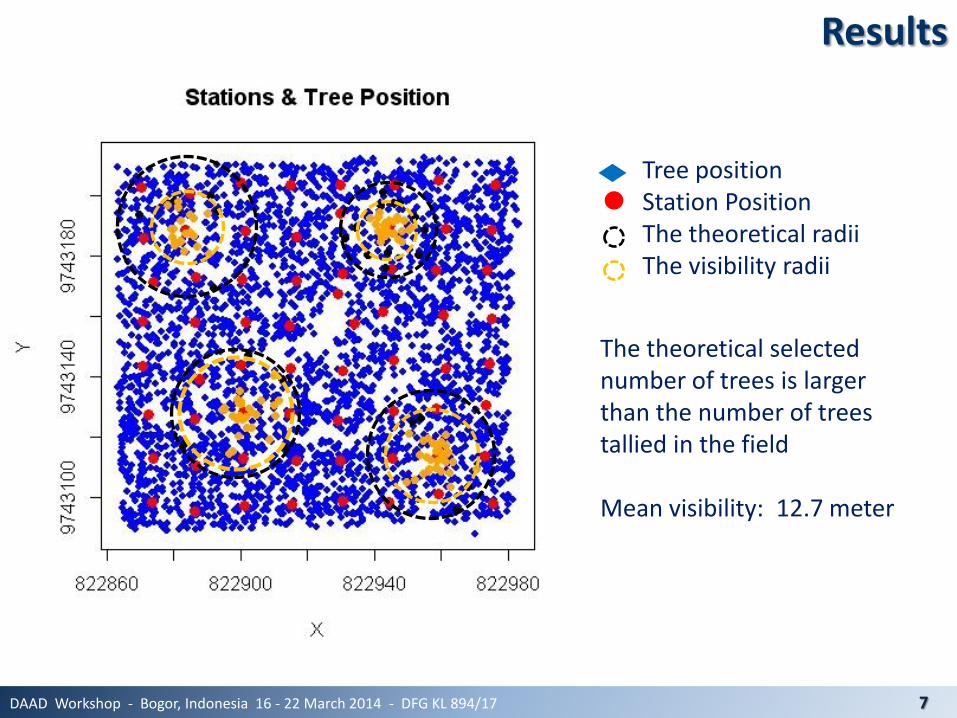
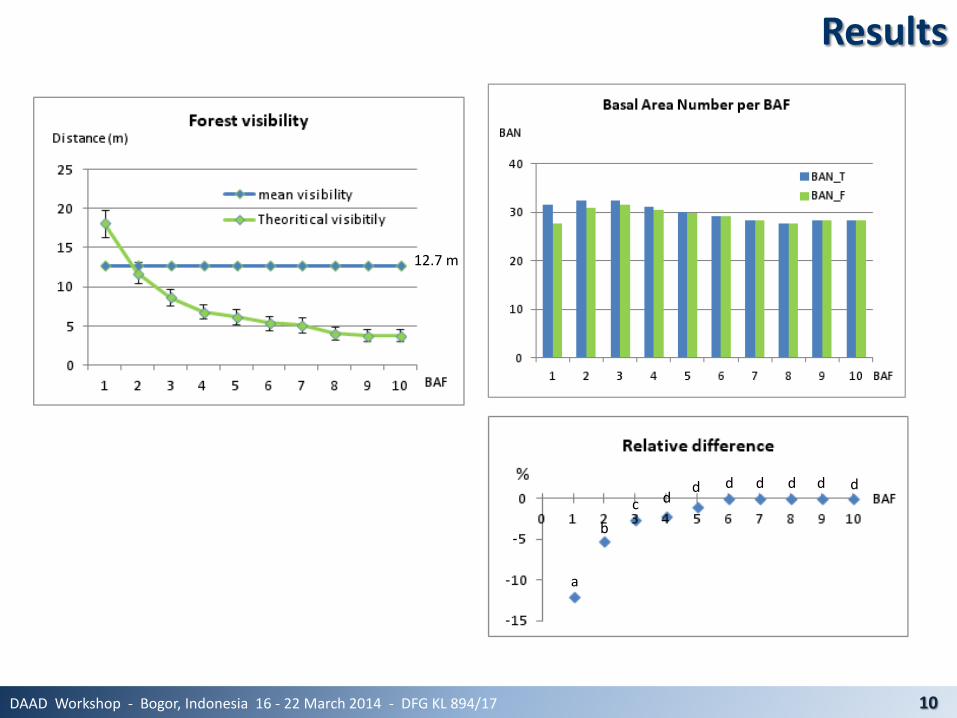
The theoretical selected number of trees is larger than the number of trees tallied in the field Mean visibility: 12.7 meter
Tree position Station Position The theoretical radii The visibility radii
Results
DAAD Workshop - Bogor, Indonesia 16 - 22 March 2014 - DFG KL 894/17 8
Results
DAAD Workshop - Bogor, Indonesia 16 - 22 March 2014 - DFG KL 894/17 9
BAF
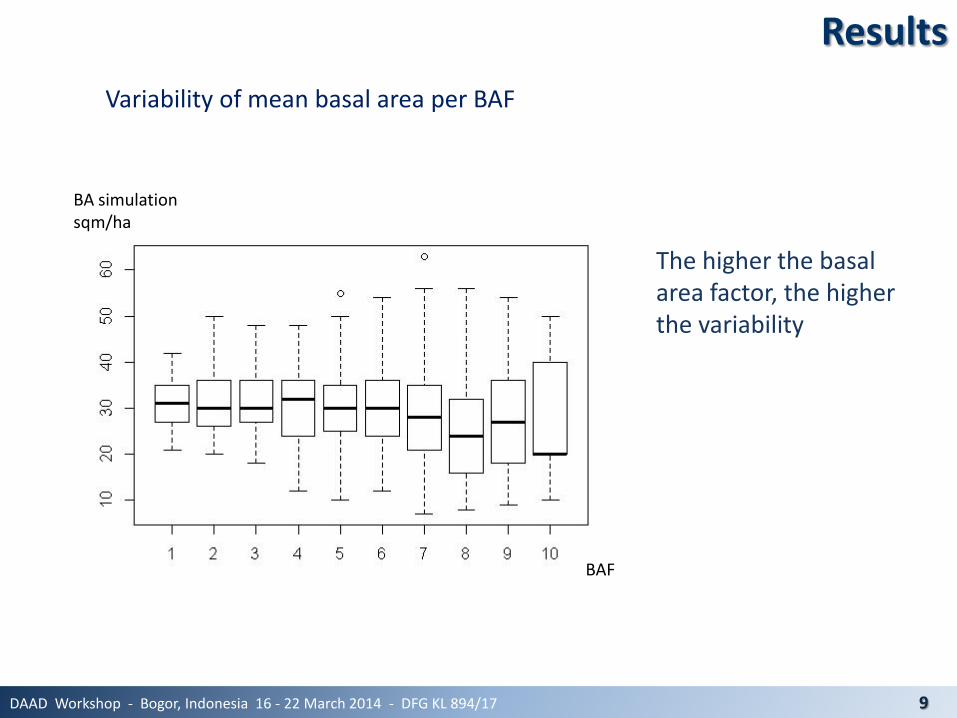
BA simulation sqm/ha
Variability of mean basal area per BAF
The higher the basal area factor, the higher the variability
Results
DAAD Workshop - Bogor, Indonesia 16 - 22 March 2014 - DFG KL 894/17 10
12.7 m
a
b
c d d d d d d d
Results
DAAD Workshop - Bogor, Indonesia 16 - 22 March 2014 - DFG KL 894/17 10
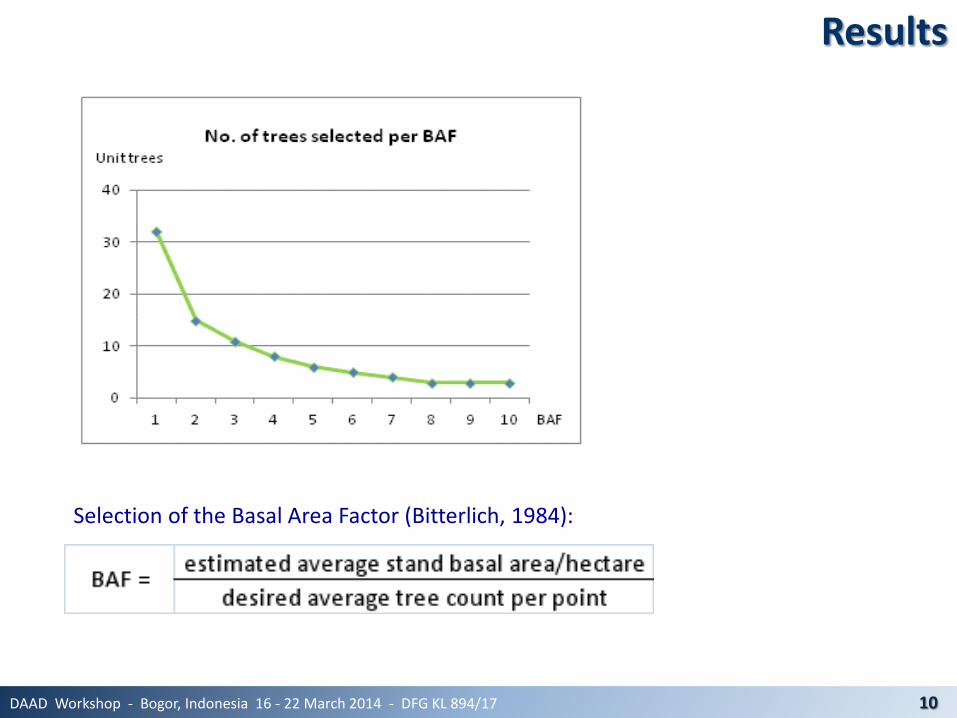
Selection of the Basal Area Factor (Bitterlich, 1984):
Conclusions
DAAD Workshop - Bogor, Indonesia 16 - 22 March 2014 - DFG KL 894/17 11
The difference between fixed area plot and angle count method is due to the visibility
Different criteria to determine the suitable basal area factor were evaluated: Unbiasness BAF > 3 Error/Variability BAF 1 – 3 Rule of thumb BAF 1 – 3
Theoretically, the suitable BAF to be used in Sabangau forest is BAF 2
or larger
But regarding the desired number of tree count per point, the suitable BAF for the study area is between BAF 2 and 3
Angle count method is an efficient technique to measure basal area but not under all condition
DAAD Workshop - Bogor, Indonesia 16 - 22 March 2014 - DFG KL 894/17
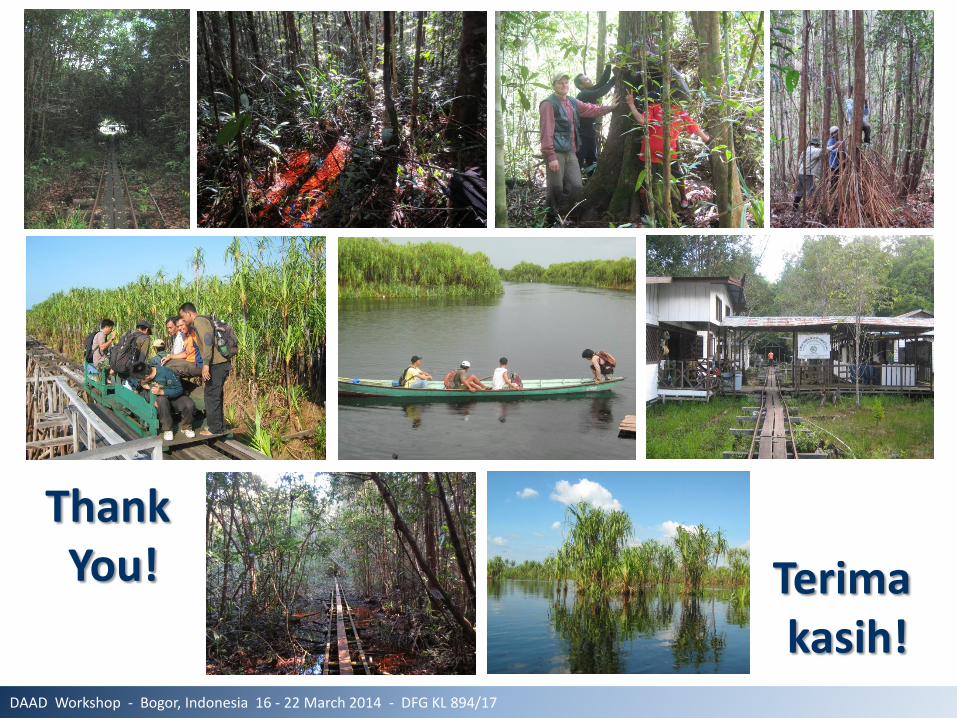
Terima kasih!
Thank You!