Embed Size (px)
Citation preview
1
Comparison of Naphthalene Measurements between Laboratory Methods and an Ultra-Fast Field Gas Chromatograph Andrew P. Rezendes Alpha Woods Hole Laboratories, Eight Walkup Drive, Westborough, MA 01581 Michael A. Marando GEI Consultants, Inc., 400 Unicorn Park, Woburn, MA 01801 Raymond Siegener GEI Consultants, Inc., 400 Unicorn Park, Woburn, MA 01801 Patrick P. King. GEI Consultants, Inc., 400 Unicorn Park, Woburn, MA 01801 Roy D. Desrochers GEI Consultants, Inc., 400 Unicorn Park, Woburn, MA 01801 ABSTRACT Naphthalene, especially as it relates to odors, can be a significant issue during the remediation of former Manufactured Gas Plant (MGP) sites. The zNose® Model 4200 Ultra-Fast Gas Chromatograph has been used at several sites to monitor airborne naphthalene concentrations in real-time during remedial activities. This paper presents the results of a side-by-side comparison of field and conventional laboratory analysis techniques for measuring naphthalene. Test results for samples analyzed using the zNose® are compared with test results for samples collected with evacuated fused-silica lined canisters and analyzed using US EPA TO-15, and samples collected on a PUF/XAD resin cartridge and analyzed using US EPA TO-13.
INTRODUCTION Odors from remediation activities, particularly from former Manufactured Gas Plant (MGP) sites, have typically been difficult to quantify. Currently there are methods such as the ASTM (American Society for Testing Materials) E544-99 for Referencing Suprathreshold Odor Intensity1 that use airborne n-butanol concentrations as a reference standard for comparison to ambient emissions. Instruments such as the Scentometer2 also can be used to give a quantifiable measure of odor based on the dilution to threshold ratio. Initial work by the Gas Research Institute3 indicated that a suspected principal odorant in coal tar at former MGP sites was naphthalene. There has been an increasing awareness and interest in measuring odors from remediation sites to prevent community complaints that could force remedial activities to stop. More recently, a reevaluation of the toxicity of naphthalene by the US EPA has lead to increased interest in measuring naphthalene in real-time. EPRI conducted an evaluation of field emission measurement techniques in 2002.4 During the evaluation, an open-path Fourier transform infra-red (OP-FTIR) spectrometer and the zNose® Model 4100 Ultra-Fast Gas Chromatograph (Electronic Sensor Technologies, Newbury Park, CA) showed the capability to measure naphthalene concentrations in real-time during remedial
2
activities. Since 2004, GEI Consultants, Inc. (GEI) has used the zNose to monitor odor intensity as a function of naphthalene concentration.5,6
The current Environmental Protection Agency (EPA) methodology lists TO-137 as the primary method for measuring naphthalene in ambient air. Although TO-15 is often used for the analysis of naphthalene, it does not classify as a VOC as defined in the method. Per method TO-15, “VOCs are defined here as organic compounds having a vapor pressure greater than 10-1 Torr at 25 oC and 760 mm Hg”8. Recent advances in canister passivation, however, have demonstrated acceptable recovery for naphthalene by method TO-15.
Fused silica lined (FSL) canisters and SUMMA canisters are both used for TO-15 analysis. Both are passivation techniques applied to the interior surface of the canisters, the FSL being an inert coating that is applied to the stainless steel surface while the SUMMA is a patented electropolishing technique that deactivates the stainless steel surface. This study presents a side-by-side comparison of analytical results generated using fixed-lab analytical methods and the zNose Ultra-Fast Gas Chromatograph. The study also compares collection and storage of naphthalene using FSL canisters and SUMMA canisters. The advantages and disadvantages of all three methodologies (field GC, canisters, and cartridges) are also discussed.
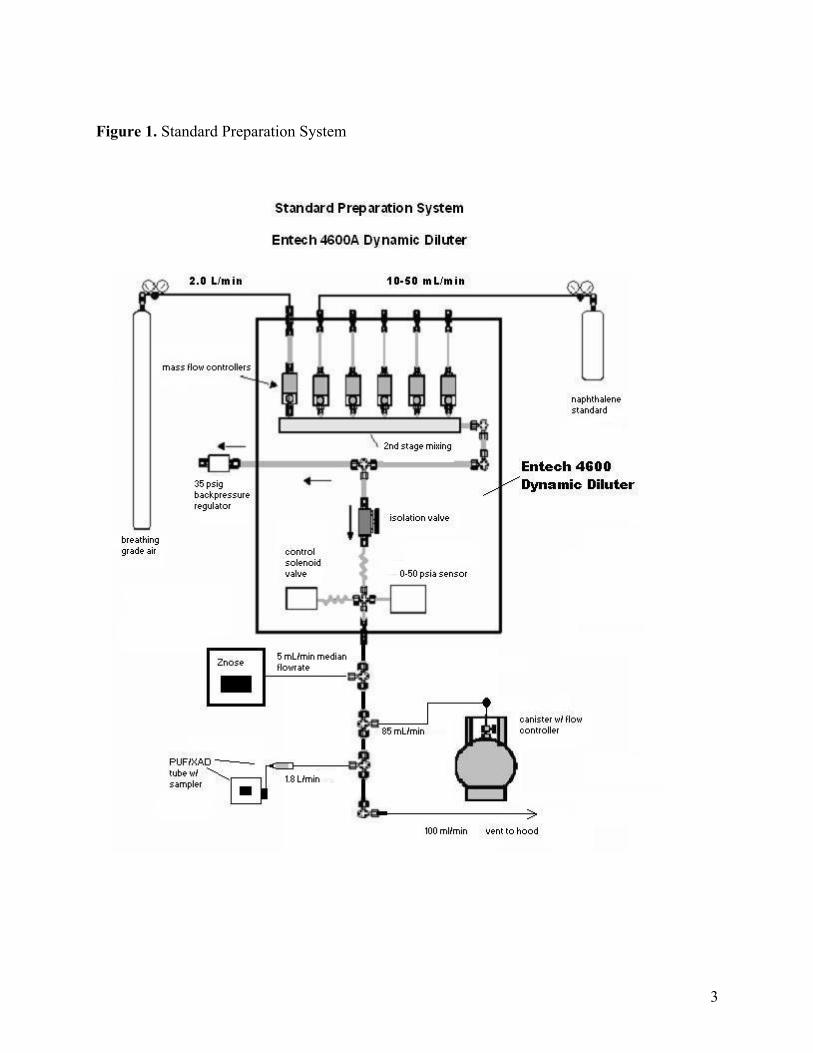
Experimental Methods An Entech 4600 Dynamic Diluter was used to prepare a sampling stream containing low part-per-billion by volume (ppbV) concentrations of naphthalene. A diagram of this is shown in Fig. 1. A photograph of the setup is shown in Fig. 2.
3
Figure 1. Standard Preparation System
4
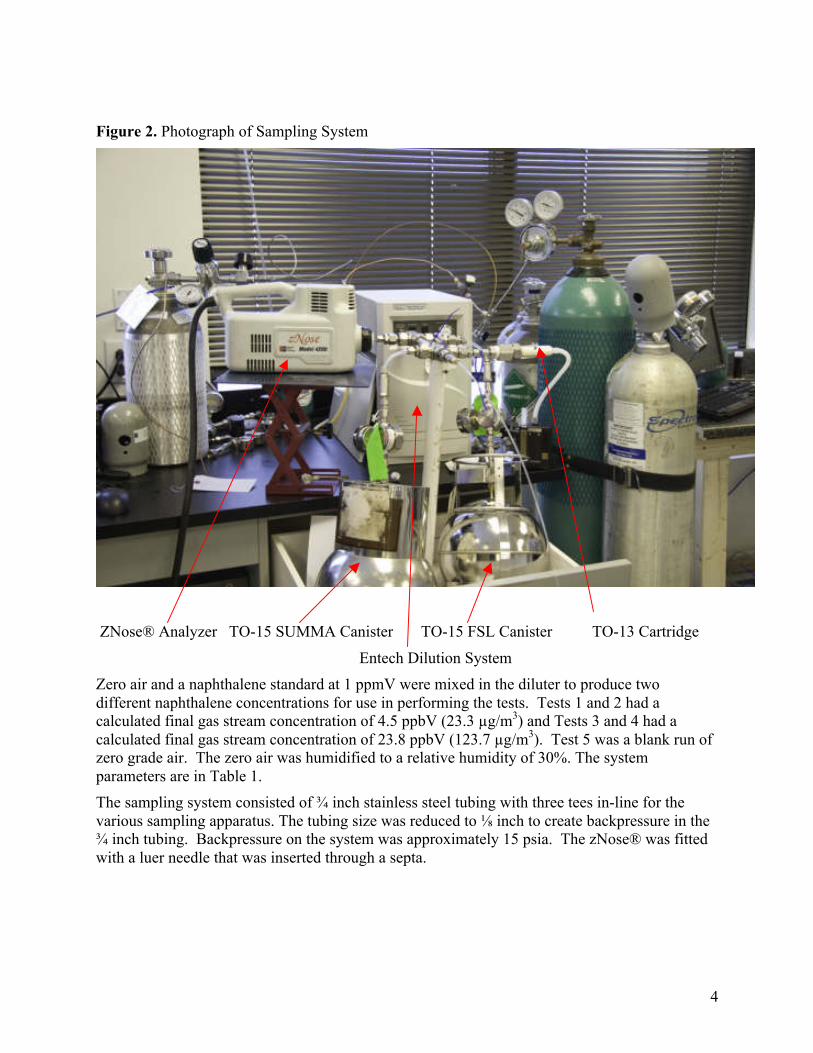
Figure 2. Photograph of Sampling System
ZNose® Analyzer TO-15 SUMMA Canister TO-15 FSL Canister TO-13 Cartridge
Entech Dilution System Zero air and a naphthalene standard at 1 ppmV were mixed in the diluter to produce two different naphthalene concentrations for use in performing the tests. Tests 1 and 2 had a calculated final gas stream concentration of 4.5 ppbV (23.3 µg/m3) and Tests 3 and 4 had a calculated final gas stream concentration of 23.8 ppbV (123.7 µg/m3). Test 5 was a blank run of zero grade air. The zero air was humidified to a relative humidity of 30%. The system parameters are in Table 1. The sampling system consisted of ¾ inch stainless steel tubing with three tees in-line for the various sampling apparatus. The tubing size was reduced to ⅛ inch to create backpressure in the ¾ inch tubing. Backpressure on the system was approximately 15 psia. The zNose® was fitted with a luer needle that was inserted through a septa.
5
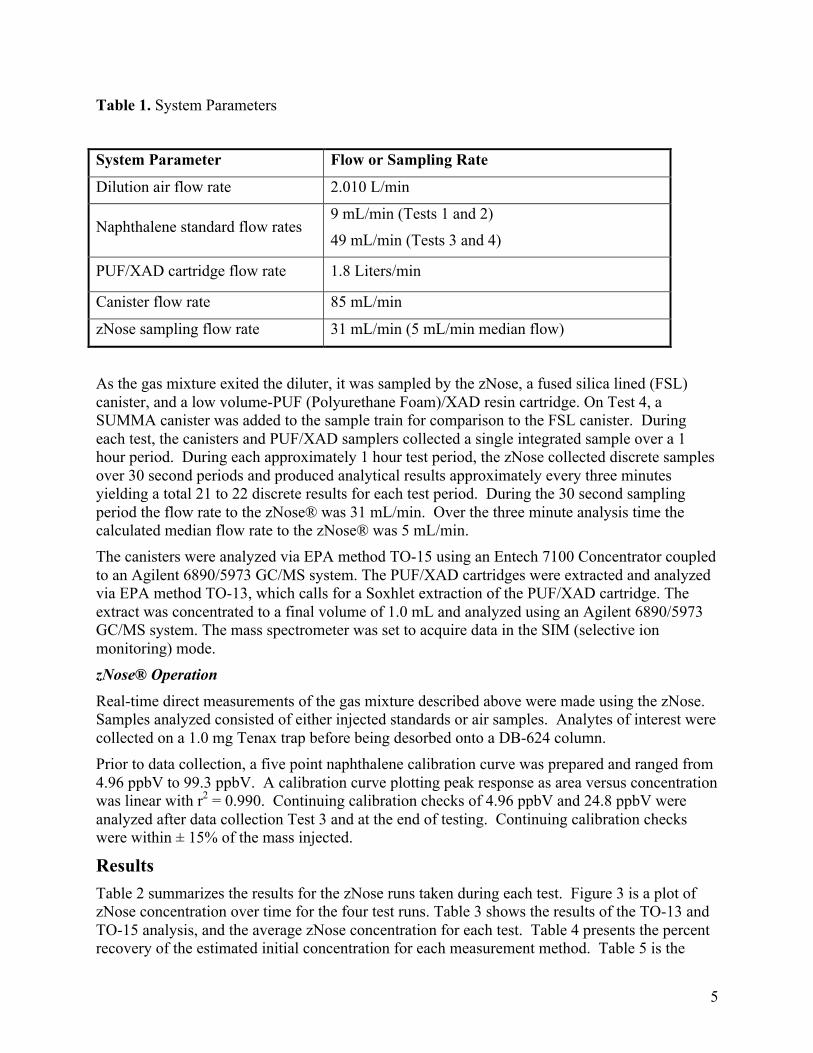
Table 1. System Parameters
System Parameter Flow or Sampling Rate
Dilution air flow rate 2.010 L/min
Naphthalene standard flow rates 9 mL/min (Tests 1 and 2)
49 mL/min (Tests 3 and 4)
PUF/XAD cartridge flow rate 1.8 Liters/min
Canister flow rate 85 mL/min
zNose sampling flow rate 31 mL/min (5 mL/min median flow)
As the gas mixture exited the diluter, it was sampled by the zNose, a fused silica lined (FSL) canister, and a low volume-PUF (Polyurethane Foam)/XAD resin cartridge. On Test 4, a SUMMA canister was added to the sample train for comparison to the FSL canister. During each test, the canisters and PUF/XAD samplers collected a single integrated sample over a 1 hour period. During each approximately 1 hour test period, the zNose collected discrete samples over 30 second periods and produced analytical results approximately every three minutes yielding a total 21 to 22 discrete results for each test period. During the 30 second sampling period the flow rate to the zNose® was 31 mL/min. Over the three minute analysis time the calculated median flow rate to the zNose® was 5 mL/min. The canisters were analyzed via EPA method TO-15 using an Entech 7100 Concentrator coupled to an Agilent 6890/5973 GC/MS system. The PUF/XAD cartridges were extracted and analyzed via EPA method TO-13, which calls for a Soxhlet extraction of the PUF/XAD cartridge. The extract was concentrated to a final volume of 1.0 mL and analyzed using an Agilent 6890/5973 GC/MS system. The mass spectrometer was set to acquire data in the SIM (selective ion monitoring) mode. zNose® Operation Real-time direct measurements of the gas mixture described above were made using the zNose. Samples analyzed consisted of either injected standards or air samples. Analytes of interest were collected on a 1.0 mg Tenax trap before being desorbed onto a DB-624 column. Prior to data collection, a five point naphthalene calibration curve was prepared and ranged from 4.96 ppbV to 99.3 ppbV. A calibration curve plotting peak response as area versus concentration was linear with r2 = 0.990. Continuing calibration checks of 4.96 ppbV and 24.8 ppbV were analyzed after data collection Test 3 and at the end of testing. Continuing calibration checks were within ± 15% of the mass injected.
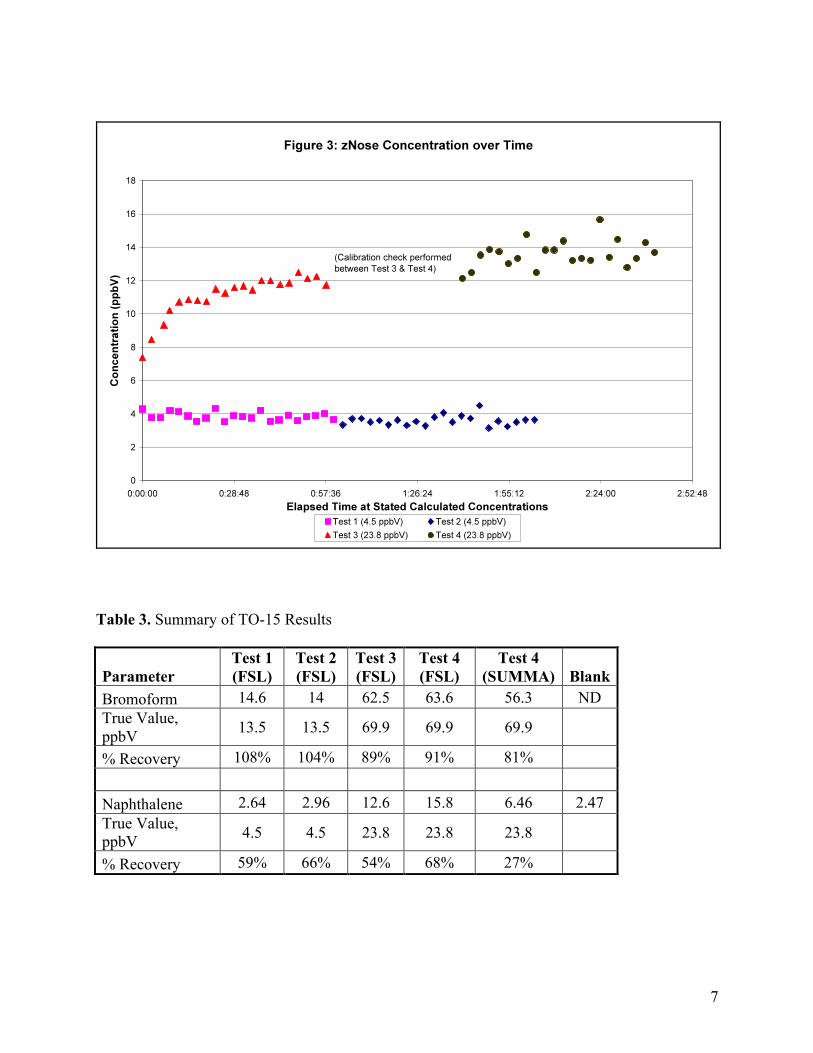
Results Table 2 summarizes the results for the zNose runs taken during each test. Figure 3 is a plot of zNose concentration over time for the four test runs. Table 3 shows the results of the TO-13 and TO-15 analysis, and the average zNose concentration for each test. Table 4 presents the percent recovery of the estimated initial concentration for each measurement method. Table 5 is the
6
percent difference comparison of the average zNose concentrations and the TO-15 results to the TO-13 concentrations.
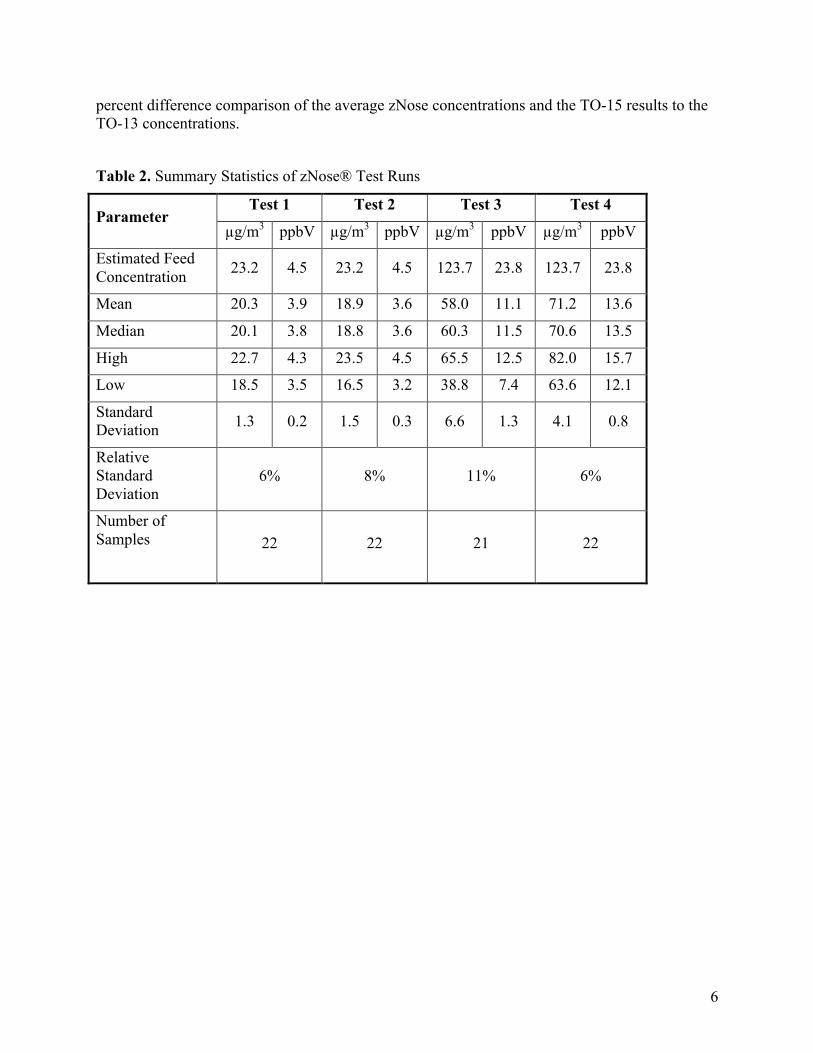
Table 2. Summary Statistics of zNose® Test Runs
Test 1 Test 2 Test 3 Test 4 Parameter
µg/m3 ppbV µg/m3 ppbV µg/m3 ppbV µg/m3 ppbV
Estimated Feed Concentration 23.2 4.5 23.2 4.5 123.7 23.8 123.7 23.8
Mean 20.3 3.9 18.9 3.6 58.0 11.1 71.2 13.6
Median 20.1 3.8 18.8 3.6 60.3 11.5 70.6 13.5
High 22.7 4.3 23.5 4.5 65.5 12.5 82.0 15.7
Low 18.5 3.5 16.5 3.2 38.8 7.4 63.6 12.1
Standard Deviation 1.3 0.2 1.5 0.3 6.6 1.3 4.1 0.8
Relative Standard Deviation
6% 8% 11% 6%
Number of Samples
22 22 21 22
7
Table 3. Summary of TO-15 Results
Parameter Test 1 (FSL)
Test 2 (FSL)
Test 3 (FSL)
Test 4 (FSL)
Test 4 (SUMMA) Blank
Bromoform 14.6 14 62.5 63.6 56.3 ND True Value, ppbV 13.5 13.5 69.9 69.9 69.9
% Recovery 108% 104% 89% 91% 81% Naphthalene 2.64 2.96 12.6 15.8 6.46 2.47 True Value, ppbV 4.5 4.5 23.8 23.8 23.8
% Recovery 59% 66% 54% 68% 27%
8
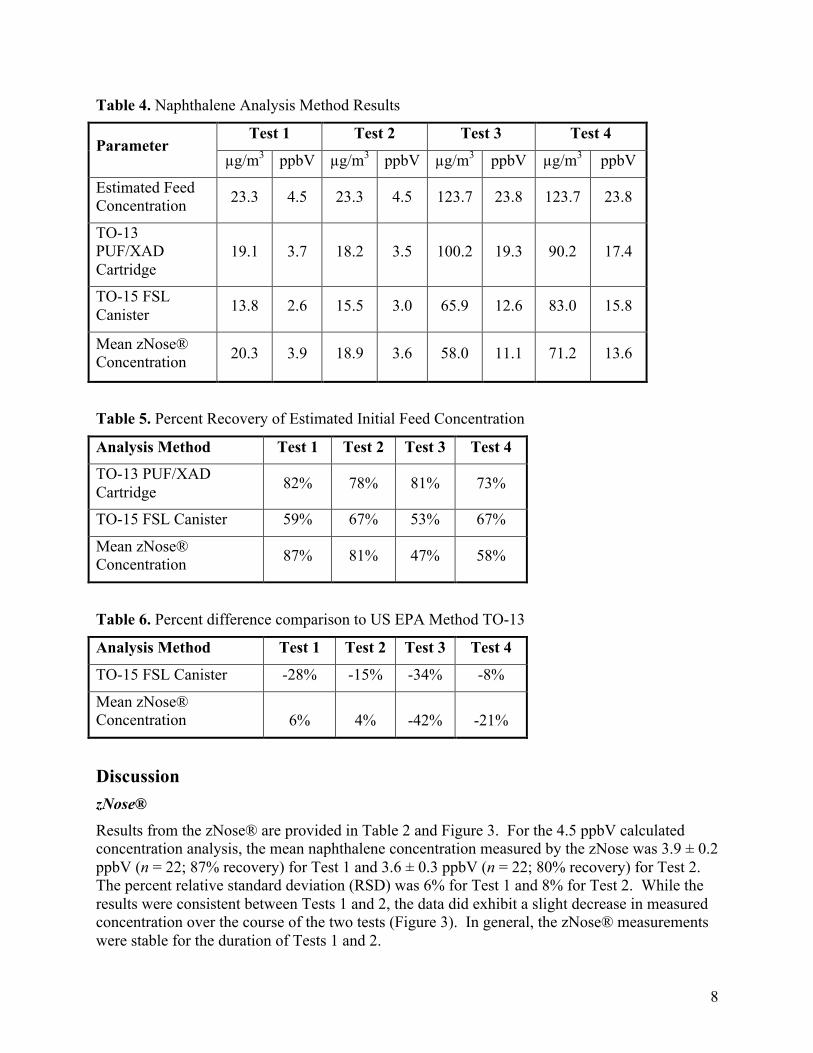
Table 4. Naphthalene Analysis Method Results
Test 1 Test 2 Test 3 Test 4 Parameter
µg/m3 ppbV µg/m3 ppbV µg/m3 ppbV µg/m3 ppbV
Estimated Feed Concentration 23.3 4.5 23.3 4.5 123.7 23.8 123.7 23.8
TO-13 PUF/XAD Cartridge
19.1 3.7 18.2 3.5 100.2 19.3 90.2 17.4
TO-15 FSL Canister 13.8 2.6 15.5 3.0 65.9 12.6 83.0 15.8
Mean zNose® Concentration 20.3 3.9 18.9 3.6 58.0 11.1 71.2 13.6
Table 5. Percent Recovery of Estimated Initial Feed Concentration
Analysis Method Test 1 Test 2 Test 3 Test 4
TO-13 PUF/XAD Cartridge 82% 78% 81% 73%
TO-15 FSL Canister 59% 67% 53% 67%
Mean zNose® Concentration 87% 81% 47% 58%
Table 6. Percent difference comparison to US EPA Method TO-13
Analysis Method Test 1 Test 2 Test 3 Test 4
TO-15 FSL Canister -28% -15% -34% -8%
Mean zNose® Concentration 6% 4% -42% -21%
Discussion zNose® Results from the zNose® are provided in Table 2 and Figure 3. For the 4.5 ppbV calculated concentration analysis, the mean naphthalene concentration measured by the zNose was 3.9 ± 0.2 ppbV (n = 22; 87% recovery) for Test 1 and 3.6 ± 0.3 ppbV (n = 22; 80% recovery) for Test 2. The percent relative standard deviation (RSD) was 6% for Test 1 and 8% for Test 2. While the results were consistent between Tests 1 and 2, the data did exhibit a slight decrease in measured concentration over the course of the two tests (Figure 3). In general, the zNose® measurements were stable for the duration of Tests 1 and 2.
9
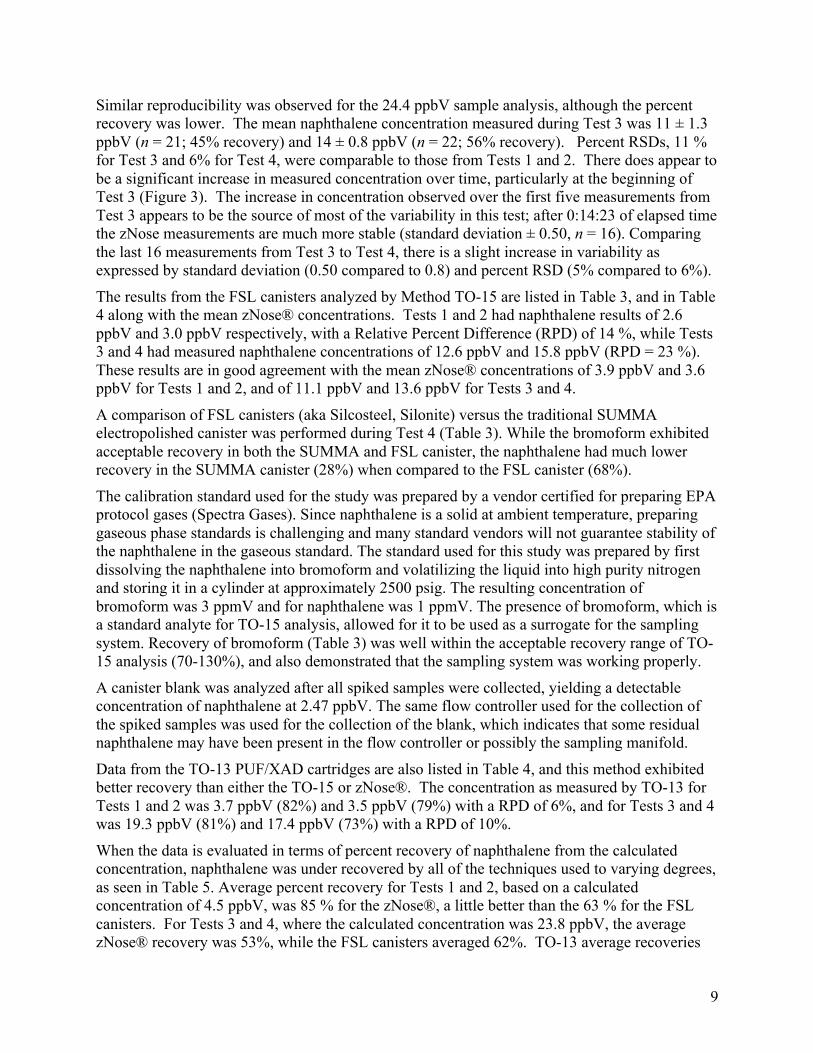
Similar reproducibility was observed for the 24.4 ppbV sample analysis, although the percent recovery was lower. The mean naphthalene concentration measured during Test 3 was 11 ± 1.3 ppbV (n = 21; 45% recovery) and 14 ± 0.8 ppbV (n = 22; 56% recovery). Percent RSDs, 11 % for Test 3 and 6% for Test 4, were comparable to those from Tests 1 and 2. There does appear to be a significant increase in measured concentration over time, particularly at the beginning of Test 3 (Figure 3). The increase in concentration observed over the first five measurements from Test 3 appears to be the source of most of the variability in this test; after 0:14:23 of elapsed time the zNose measurements are much more stable (standard deviation ± 0.50, n = 16). Comparing the last 16 measurements from Test 3 to Test 4, there is a slight increase in variability as expressed by standard deviation (0.50 compared to 0.8) and percent RSD (5% compared to 6%).
The results from the FSL canisters analyzed by Method TO-15 are listed in Table 3, and in Table 4 along with the mean zNose® concentrations. Tests 1 and 2 had naphthalene results of 2.6 ppbV and 3.0 ppbV respectively, with a Relative Percent Difference (RPD) of 14 %, while Tests 3 and 4 had measured naphthalene concentrations of 12.6 ppbV and 15.8 ppbV (RPD = 23 %). These results are in good agreement with the mean zNose® concentrations of 3.9 ppbV and 3.6 ppbV for Tests 1 and 2, and of 11.1 ppbV and 13.6 ppbV for Tests 3 and 4.
A comparison of FSL canisters (aka Silcosteel, Silonite) versus the traditional SUMMA electropolished canister was performed during Test 4 (Table 3). While the bromoform exhibited acceptable recovery in both the SUMMA and FSL canister, the naphthalene had much lower recovery in the SUMMA canister (28%) when compared to the FSL canister (68%).
The calibration standard used for the study was prepared by a vendor certified for preparing EPA protocol gases (Spectra Gases). Since naphthalene is a solid at ambient temperature, preparing gaseous phase standards is challenging and many standard vendors will not guarantee stability of the naphthalene in the gaseous standard. The standard used for this study was prepared by first dissolving the naphthalene into bromoform and volatilizing the liquid into high purity nitrogen and storing it in a cylinder at approximately 2500 psig. The resulting concentration of bromoform was 3 ppmV and for naphthalene was 1 ppmV. The presence of bromoform, which is a standard analyte for TO-15 analysis, allowed for it to be used as a surrogate for the sampling system. Recovery of bromoform (Table 3) was well within the acceptable recovery range of TO-15 analysis (70-130%), and also demonstrated that the sampling system was working properly.
A canister blank was analyzed after all spiked samples were collected, yielding a detectable concentration of naphthalene at 2.47 ppbV. The same flow controller used for the collection of the spiked samples was used for the collection of the blank, which indicates that some residual naphthalene may have been present in the flow controller or possibly the sampling manifold.
Data from the TO-13 PUF/XAD cartridges are also listed in Table 4, and this method exhibited better recovery than either the TO-15 or zNose®. The concentration as measured by TO-13 for Tests 1 and 2 was 3.7 ppbV (82%) and 3.5 ppbV (79%) with a RPD of 6%, and for Tests 3 and 4 was 19.3 ppbV (81%) and 17.4 ppbV (73%) with a RPD of 10%.
When the data is evaluated in terms of percent recovery of naphthalene from the calculated concentration, naphthalene was under recovered by all of the techniques used to varying degrees, as seen in Table 5. Average percent recovery for Tests 1 and 2, based on a calculated concentration of 4.5 ppbV, was 85 % for the zNose®, a little better than the 63 % for the FSL canisters. For Tests 3 and 4, where the calculated concentration was 23.8 ppbV, the average zNose® recovery was 53%, while the FSL canisters averaged 62%. TO-13 average recoveries
10
were 81% for Tests 1 and 2, and 77% for Tests 3 and 4. Both the zNose® and TO-15 compared favorably with method TO-13 (Table 6).
The lower naphthalene recoveries observed using TO-15 and the zNose® may be associated with the nature of naphthalene. This compound is known to be “sticky”, and therefore may have adsorbed onto the stainless steel tubing used to construct the sample delivery system manifold depicted in Figures 1 and 2. Adsorption of naphthalene onto portions of the sample delivery system is also indicated by the steep portion of the plot of zNose® concentration over elapsed time as illustrated by Figure 3; as the manifold system becomes coated with naphthalene, the plot of concentration over time begins to level off. Recoveries using the TO-13 method are increased, possibly due to the concentrating effect of the cartridges. In this method, all the naphthalene that enters the system is available for analysis as it is concentrated by the cartridge, resulting in an increased load. In the zNose® and TO-15, some concentration does take place but not to the same extent as in TO-13.
CONCLUSIONS
Naphthalene is regularly measured in air samples to monitor the health and safety of workers at a job site and the people living in the surrounding community. Currently, both EPA Method TO-13 and TO-15 (utilizing either SUMMA canisters or FSL canisters) are used to measure airborne naphthalene concentrations, with the turnaround time (TAT) for these methods being on the order of 5 – 10 days. There is often a need for “real time” information to manage the risk of exposure to both workers and the community. The zNose can provide a large data set of reliable screening information in the field, and these data can be used to optimize TO-13/TO-15 sampling locations and the analytical budget. The advantages and disadvantages of the methods compared in this study are listed in Table 7. This study has demonstrated that the zNose® is capable of delivering “real time” data, in less than three minutes, that is comparable to data obtained using Methods TO-15 and TO-13, and is ideal for field screening air samples to identify locations where collecting samples for more comprehensive TO-15 or TO-13 analysis will provide the most benefit. Additionally, this study has demonstrated that naphthalene can be accurately measured using the TO-15 method, thereby supporting the use of method TO-15, TO-13, or both, to measure naphthalene concentrations with the final selection being dependant on the other compounds of interest and the goals of the project. Finally, based on the single comparison performed in this study, it appears that FSL canisters are better suited for the collection of air samples with potential naphthalene contamination than standard un-lined SUMMA canisters.
11
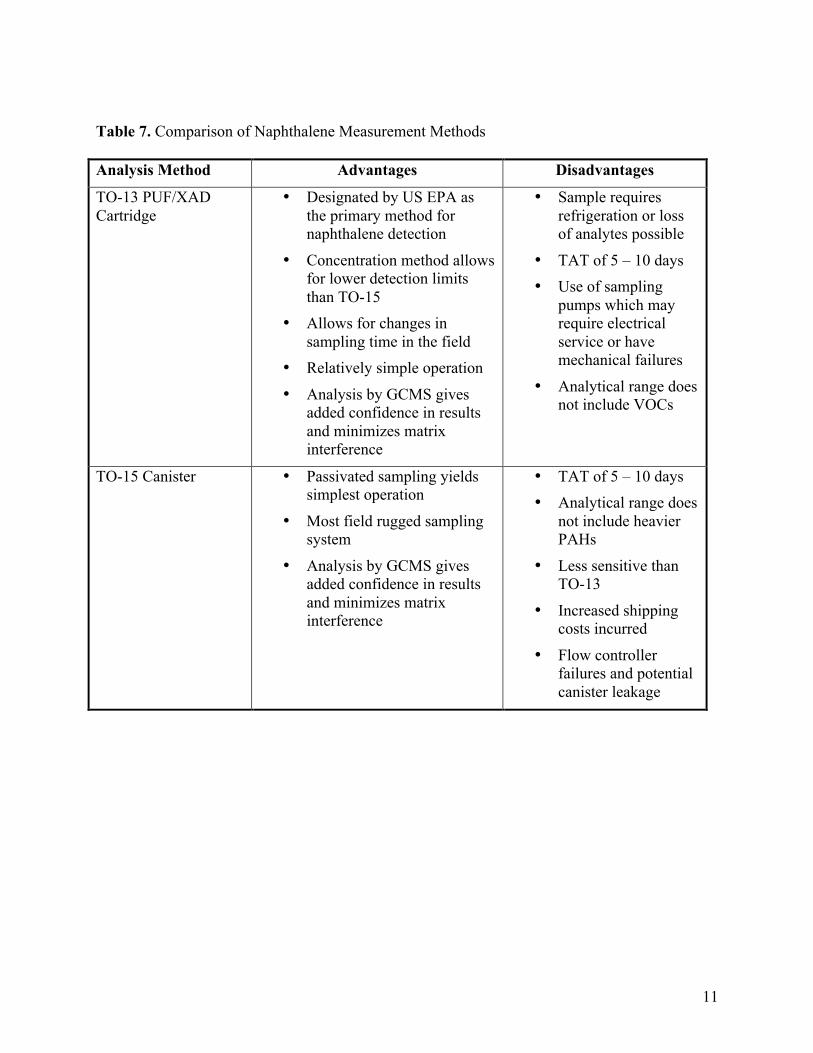
Table 7. Comparison of Naphthalene Measurement Methods Analysis Method Advantages Disadvantages
TO-13 PUF/XAD Cartridge
• Designated by US EPA as the primary method for naphthalene detection
• Concentration method allows for lower detection limits than TO-15
• Allows for changes in sampling time in the field
• Relatively simple operation
• Analysis by GCMS gives added confidence in results and minimizes matrix interference
• Sample requires refrigeration or loss of analytes possible
• TAT of 5 – 10 days • Use of sampling
pumps which may require electrical service or have mechanical failures
• Analytical range does not include VOCs
TO-15 Canister • Passivated sampling yields simplest operation
• Most field rugged sampling system
• Analysis by GCMS gives added confidence in results and minimizes matrix interference
• TAT of 5 – 10 days • Analytical range does
not include heavier PAHs
• Less sensitive than TO-13
• Increased shipping costs incurred
• Flow controller failures and potential canister leakage
12
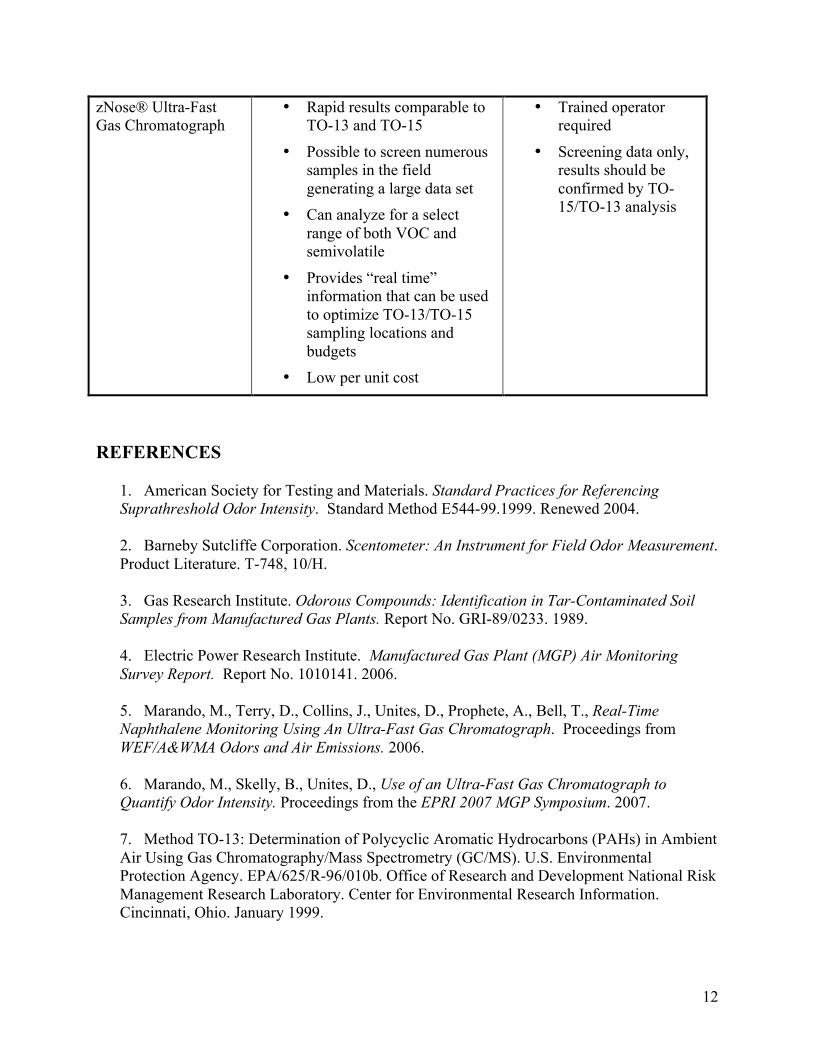
zNose® Ultra-Fast Gas Chromatograph
• Rapid results comparable to TO-13 and TO-15
• Possible to screen numerous samples in the field generating a large data set
• Can analyze for a select range of both VOC and semivolatile
• Provides “real time” information that can be used to optimize TO-13/TO-15 sampling locations and budgets
• Low per unit cost
• Trained operator required
• Screening data only, results should be confirmed by TO-15/TO-13 analysis
REFERENCES
1. American Society for Testing and Materials. Standard Practices for Referencing Suprathreshold Odor Intensity. Standard Method E544-99.1999. Renewed 2004. 2. Barneby Sutcliffe Corporation. Scentometer: An Instrument for Field Odor Measurement. Product Literature. T-748, 10/H.
3. Gas Research Institute. Odorous Compounds: Identification in Tar-Contaminated Soil Samples from Manufactured Gas Plants. Report No. GRI-89/0233. 1989.
4. Electric Power Research Institute. Manufactured Gas Plant (MGP) Air Monitoring Survey Report. Report No. 1010141. 2006.
5. Marando, M., Terry, D., Collins, J., Unites, D., Prophete, A., Bell, T., Real-Time Naphthalene Monitoring Using An Ultra-Fast Gas Chromatograph. Proceedings from WEF/A&WMA Odors and Air Emissions. 2006.
6. Marando, M., Skelly, B., Unites, D., Use of an Ultra-Fast Gas Chromatograph to Quantify Odor Intensity. Proceedings from the EPRI 2007 MGP Symposium. 2007. 7. Method TO-13: Determination of Polycyclic Aromatic Hydrocarbons (PAHs) in Ambient Air Using Gas Chromatography/Mass Spectrometry (GC/MS). U.S. Environmental Protection Agency. EPA/625/R-96/010b. Office of Research and Development National Risk Management Research Laboratory. Center for Environmental Research Information. Cincinnati, Ohio. January 1999.
13
8. Method TO-15: Determination of Volatile Organic Compounds (VOCs) In Air Collected In Specially-Prepared Canisters And Analyzed By Gas Chromatography Mass Spectrometry (GC/MS). U.S. Environmental Protection Agency. EPA/625/R-96/010b. Office of Research and Development National Risk Management Research Laboratory. Center for Environmental Research Information. Cincinnati, Ohio. January 1999.
KEY WORDS Naphthalene zNose® Air Monitoring US EPA TO-15 US EPA TO-13 Manufactured Gas Plant (MGP) Sites Odors