Embed Size (px)
Citation preview
Coordinate Systems
• Global Coordinate System – Latitude, Longitude and elevation
• UTM – eastings and northings, reference points are the equator and the central meridians (60 of them for 60 zones) Extends from 84° N to 80 °S
• State Plane – State specific, northings and eastings NAD 27 is based on feet, NAD 83 is based on meters.
• There are many many more.
Reference Ellipsoids and Datums
• Clark 1866 spheroid – NAD 27(Sometimes Clark 1880?)
• GRS 80 spheroid – NAD 83
• WGS 84 spheriod – NAD 83
• Sphere – for world projections
• Many many more.
Types of Projections with examples
• Planar (Azimuthal) - North Polar Stereographic
• Conic – Lambert Conformal Conic, Albers Equal Area, Polyconic
• Cylindrical – Mercator and Transverse Mercator
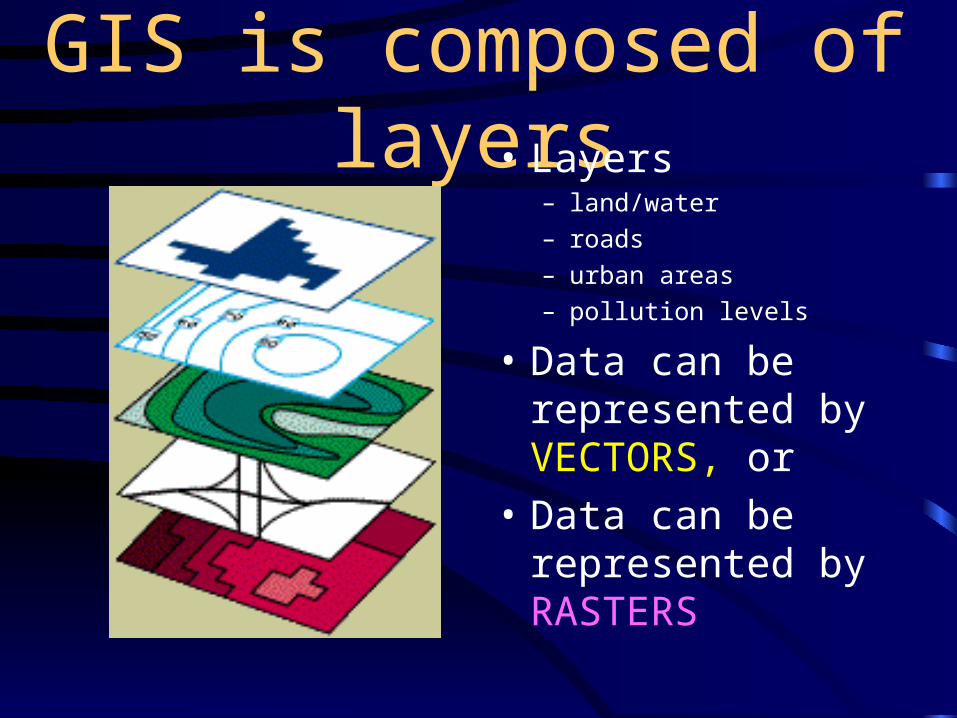
GIS is composed of layers• Layers
– land/water
– roads
– urban areas
– pollution levels
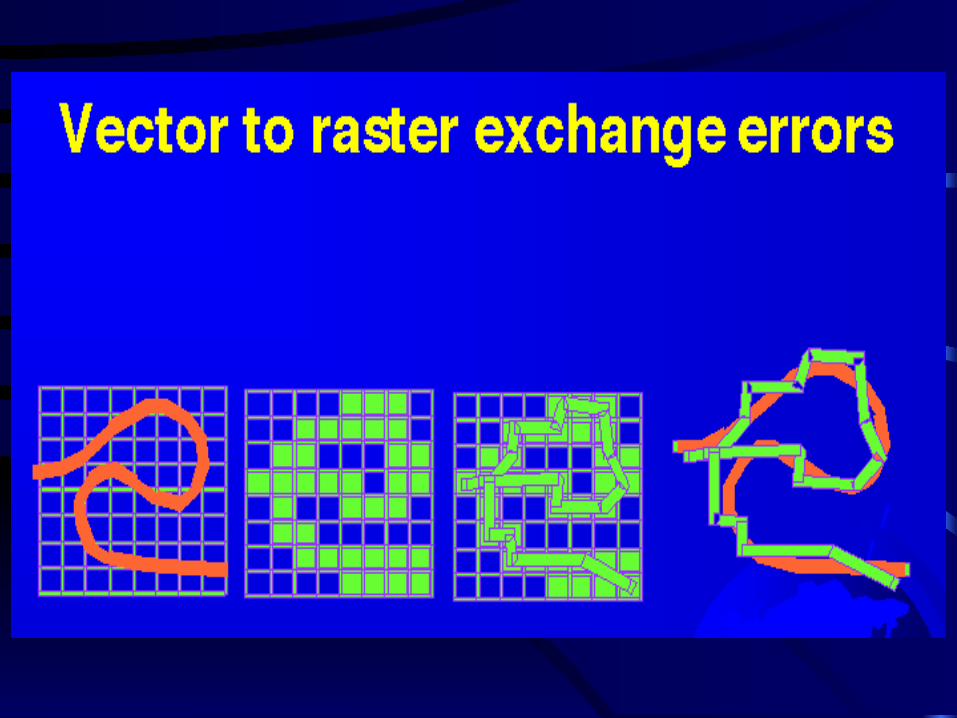
• Data can be represented by VECTORS, or
• Data can be represented by RASTERS
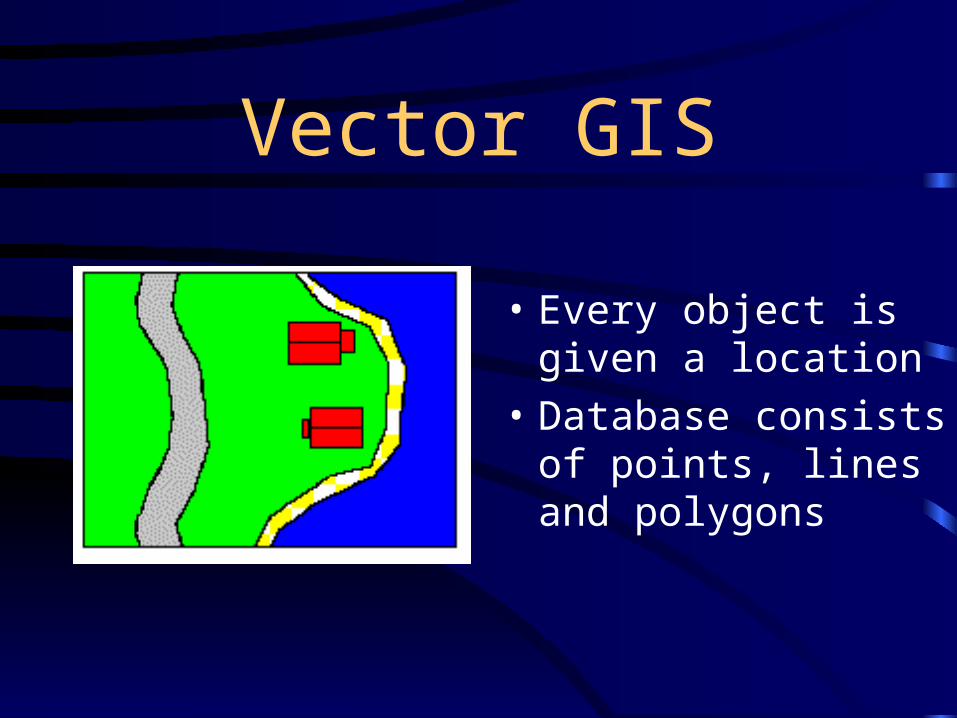
Vector GIS
• Every object is given a location
• Database consists of points, lines and polygons
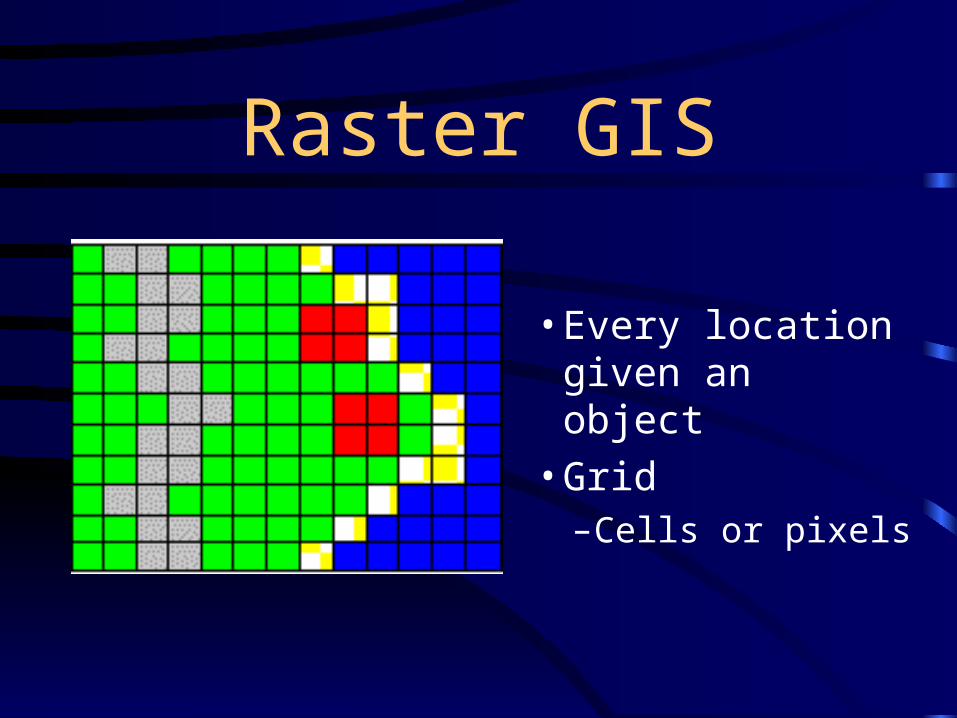
Raster GIS
• Every location given an object
• Grid– Cells or pixels
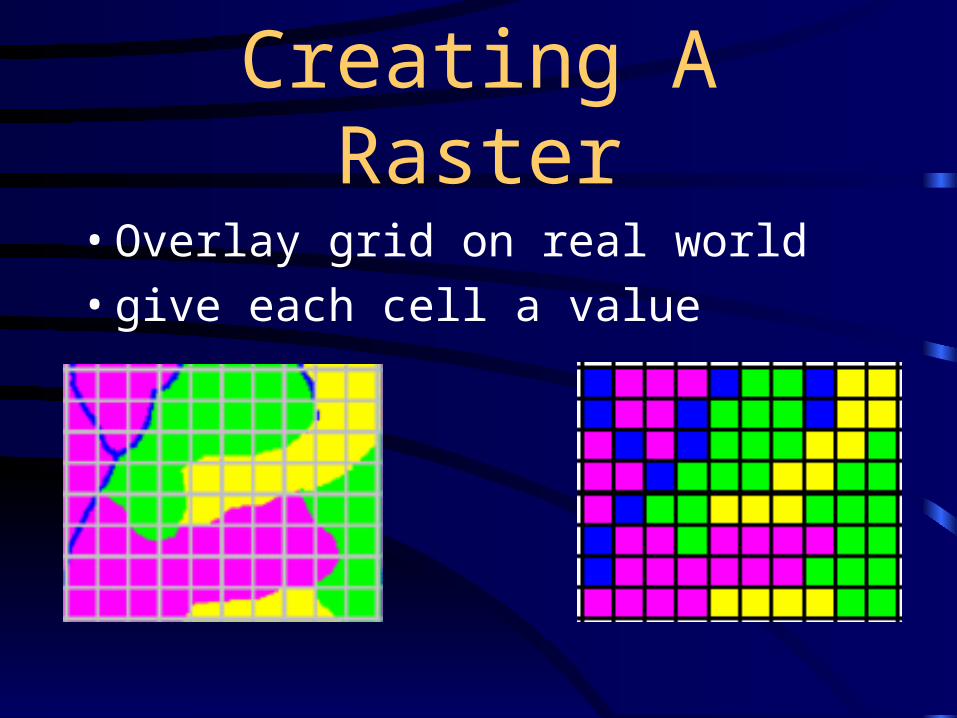
Creating A Raster
• Overlay grid on real world• give each cell a value
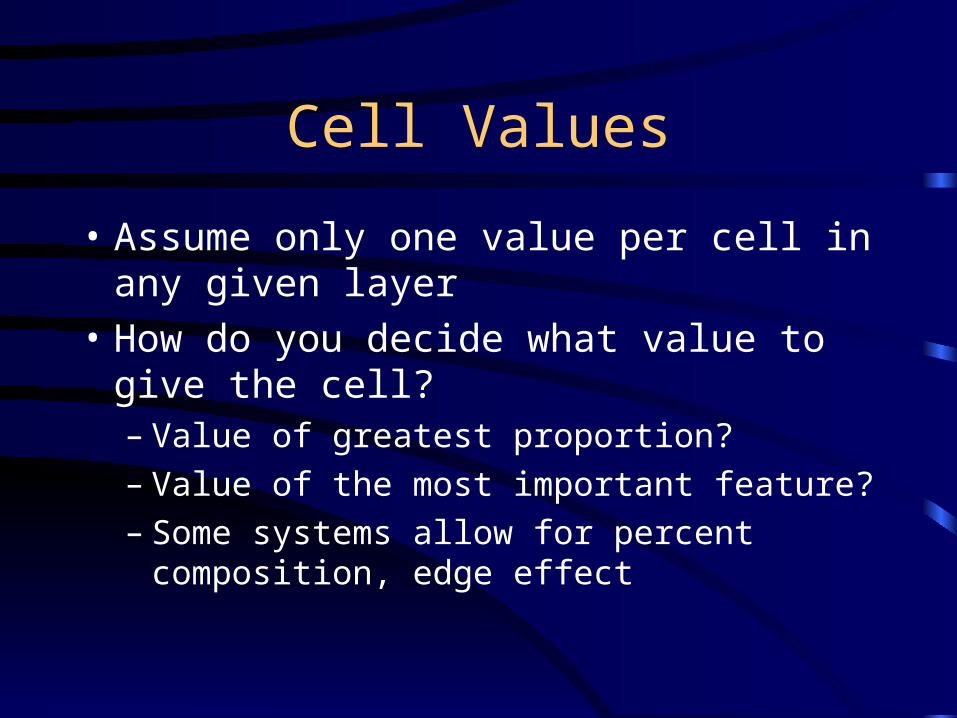
Cell Values
• Assume only one value per cell in any given layer
• How do you decide what value to give the cell?– Value of greatest proportion?– Value of the most important feature?– Some systems allow for percent composition,
edge effect
Cell Values
• Integer
• Real Numbers
• Alphabetic
• Interpret using legend
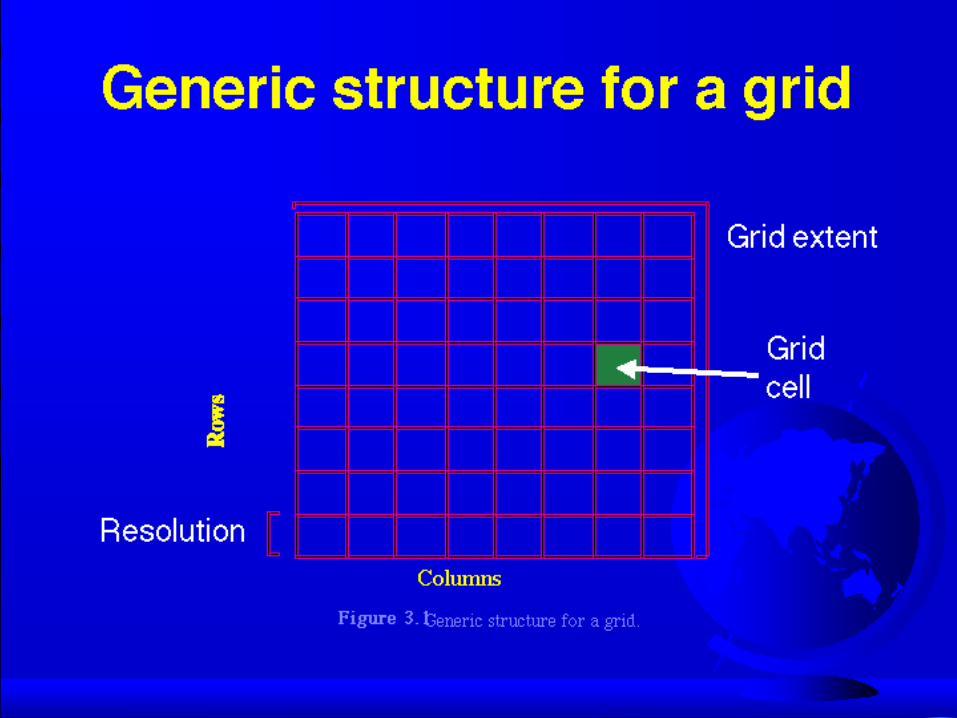
Characteristics of a Raster
• Resolution– smallest unit discernible– often grid size, but not always
• Orientation– angle that grid makes with true north
• Value– information stored in cell
Characteristics of a Raster
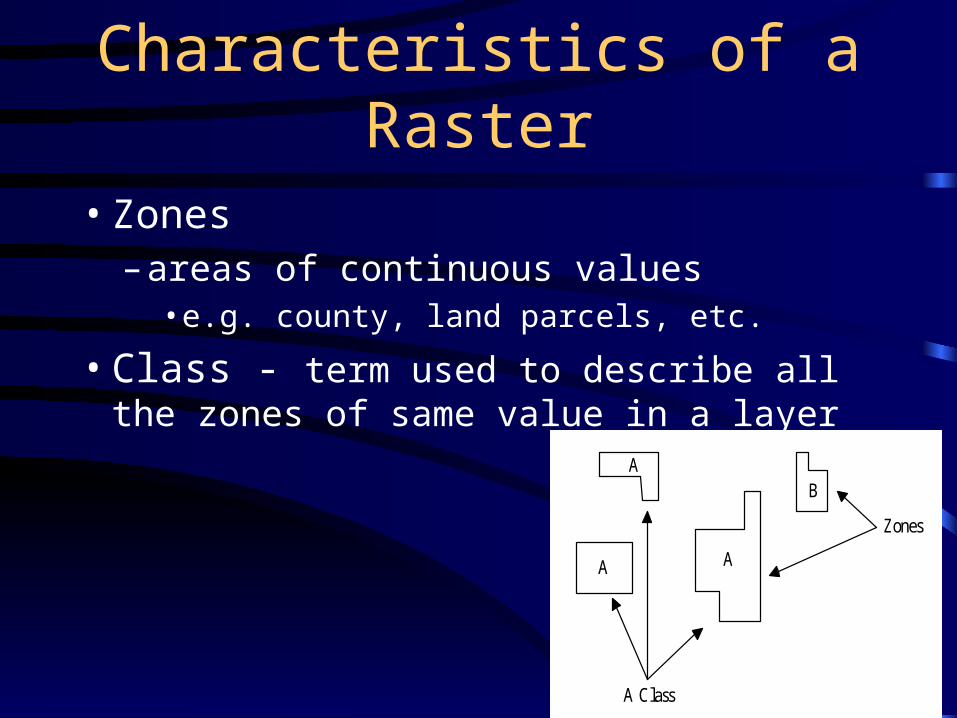
• Zones– areas of continuous values
• e.g. county, land parcels, etc.
• Class - term used to describe all the zones of same value in a layer
A
A
A
B
Zones
A Class
Characteristics of a Raster
• Location–each cell has a unique location
• often defined by bottom left corner
• X, Y coordinate
Storing the Information
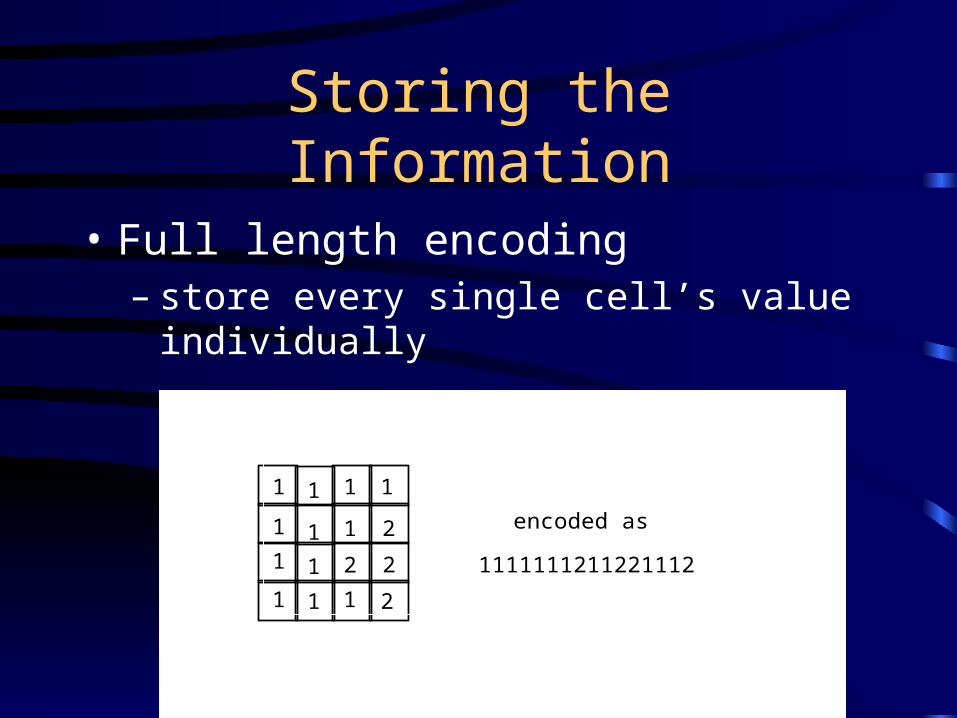
• Full length encoding– store every single cell’s value individually
1 1 1 1
1 1 1 2
1 1 2 2
1 1 1 2
1111111211221112
encoded as
Storing the Information
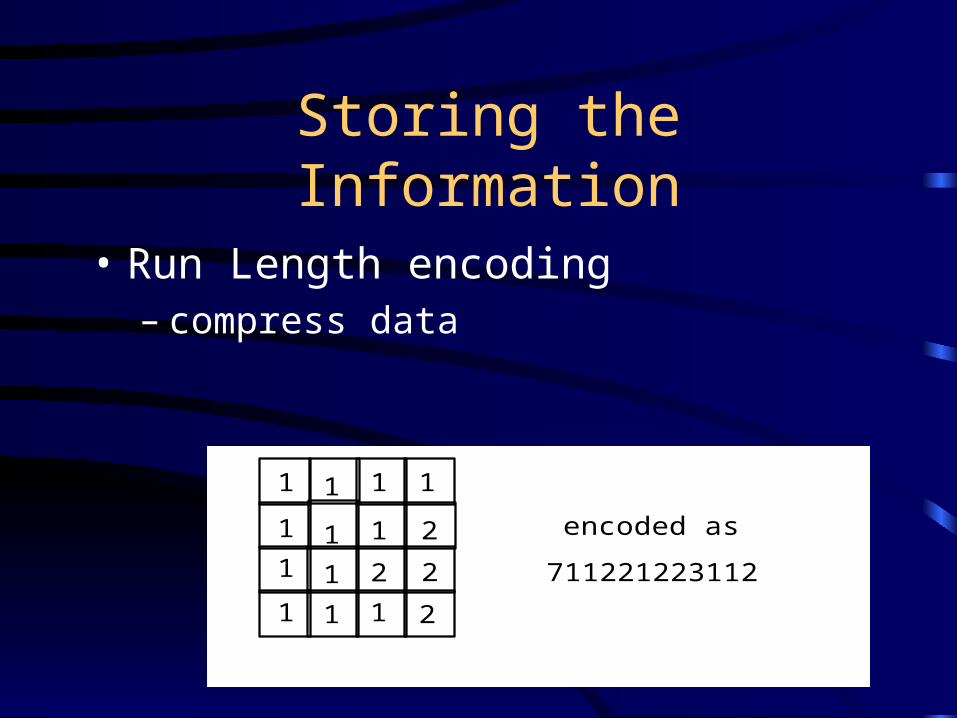
• Run Length encoding– compress data
1 1 1 1
1 1 1 2
1 1 2 2
1 1 1 2
711221223112
encoded as
Storing the Information
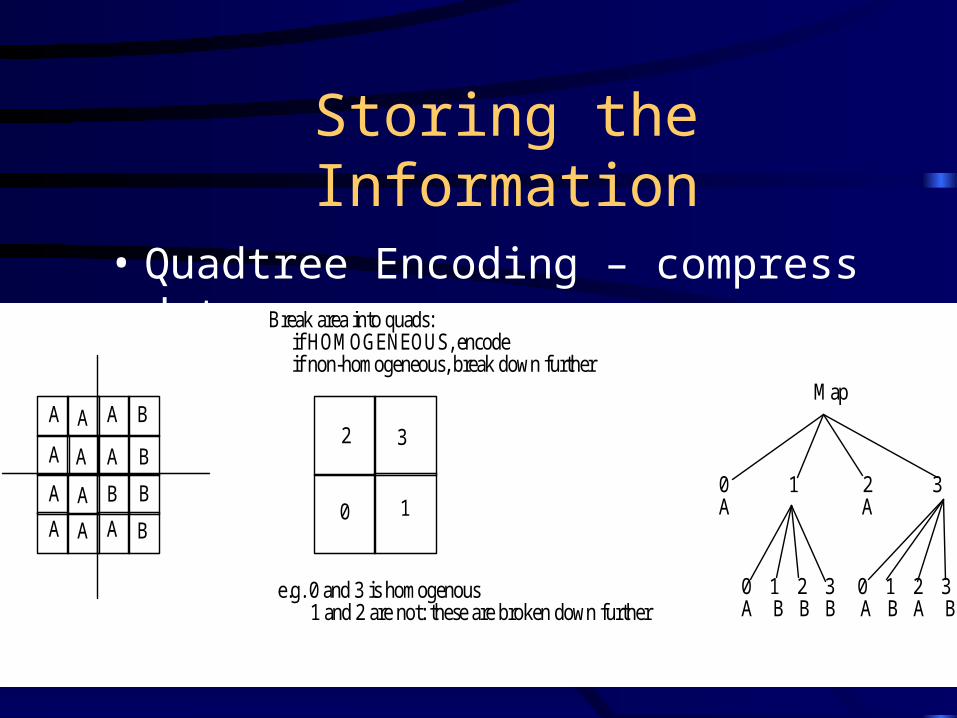
• Quadtree Encoding – compress data
A A A B
A A A B
A A B B
A A A B0 1
2 3
Break area into quads: if HOMOGENEOUS, encode if non-homogeneous, break down further
e.g. 0 and 3 is homogenous 1 and 2 are not: these are broken down further
Map
0 1 2 3A A
0 1 2 3 0 1 2 3A B B B A B A B
Sources of Raster Data
• Scanned Images– Aerial photographs– maps
• Satellite images
• Many packages work on RECTIFYING these images– photograph’s scale is not constant across image

Vector GIS
• Every object is given a location
• Database consists of points, lines and polygons
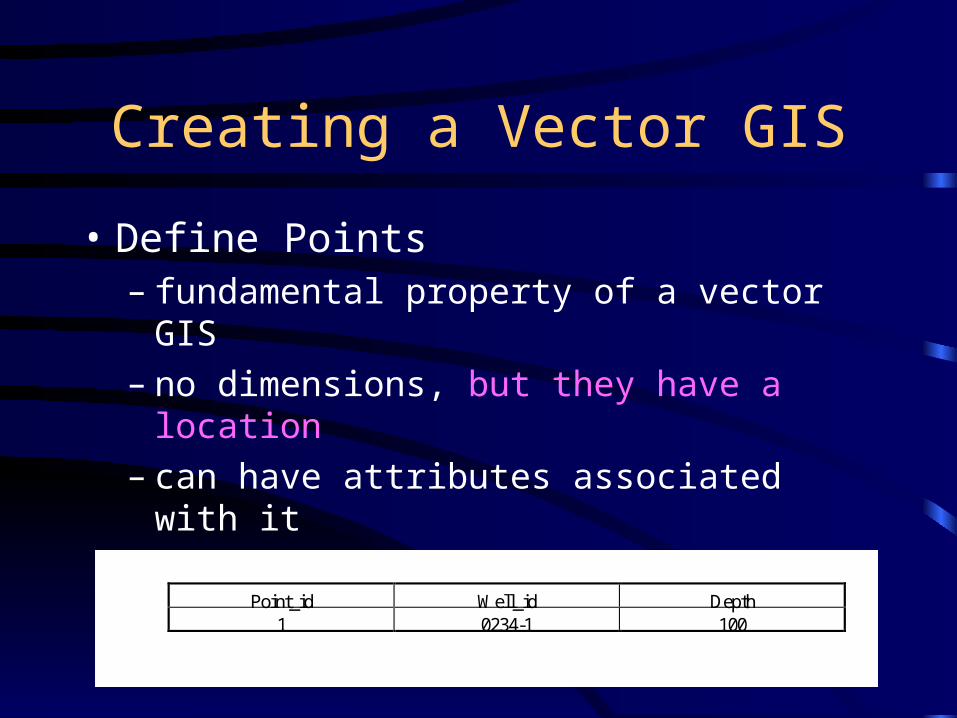
Creating a Vector GIS
• Define Points– fundamental property of a vector GIS– no dimensions, but they have a location– can have attributes associated with it– used for utility poles, sampling points, wells
etc.
Point_id Well_id Depth1 0234-1 100
Creating a Vector GIS
• Define Arcs (lines)– line that joins points– also called chains and edges– has length and direction– attributes can include what is on right and left
side– used to represent road, utility lines, rivers, etc.
Creating a Vector GIS
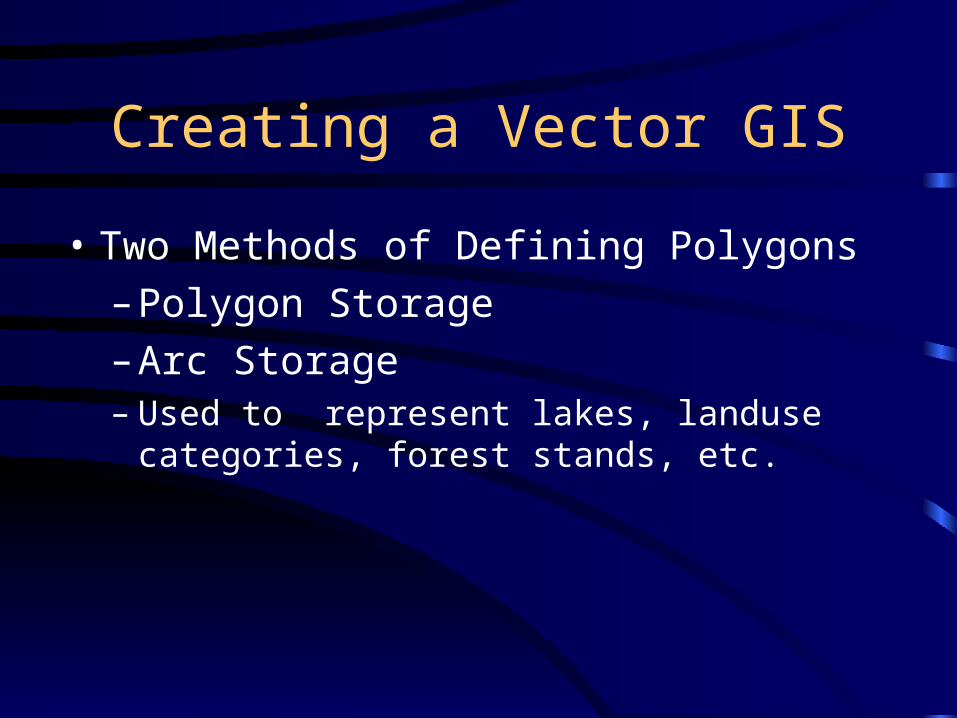
• Two Methods of Defining Polygons
– Polygon Storage
– Arc Storage– Used to represent lakes, landuse categories,
forest stands, etc.
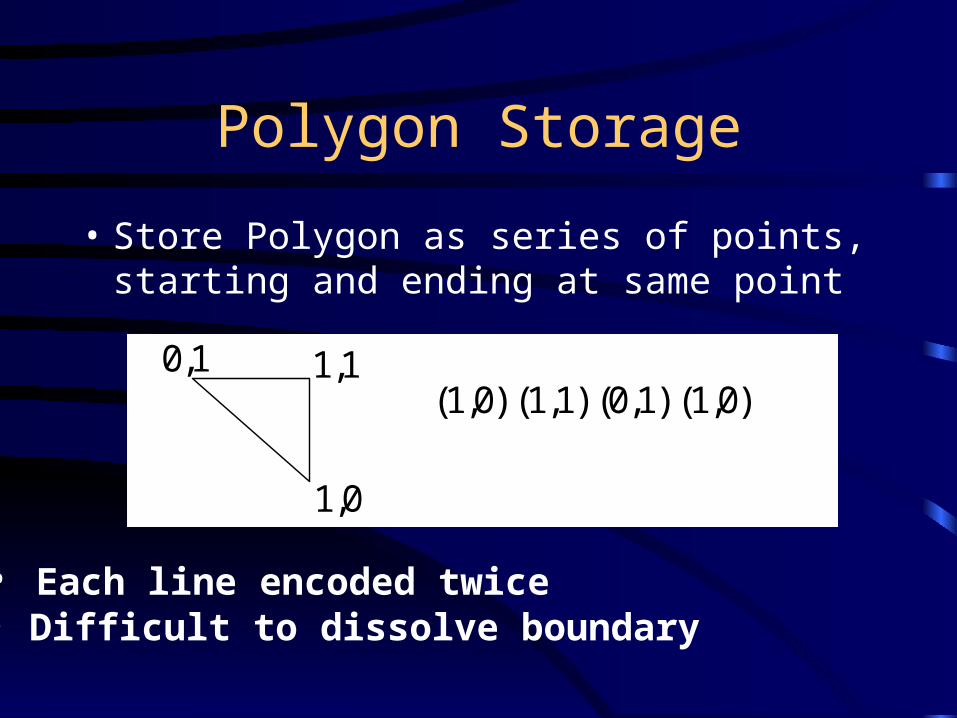
Polygon Storage
• Store Polygon as series of points, starting and ending at same point
0,1 1,1
1,0
(1,0) (1,1) (0,1) (1,0)
• Each line encoded twice• Difficult to dissolve boundary
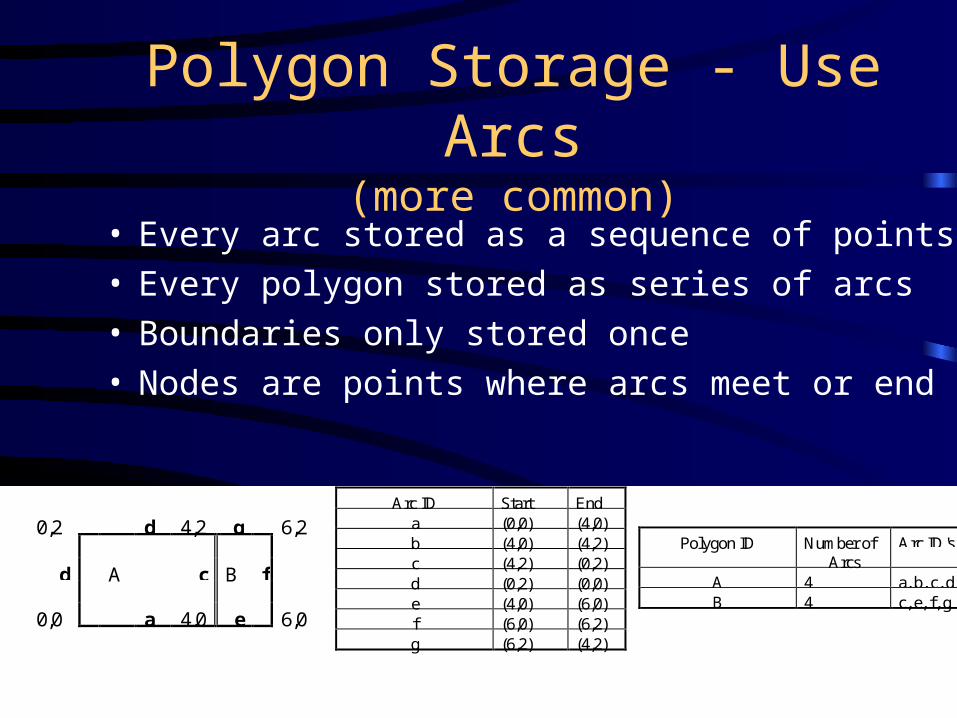
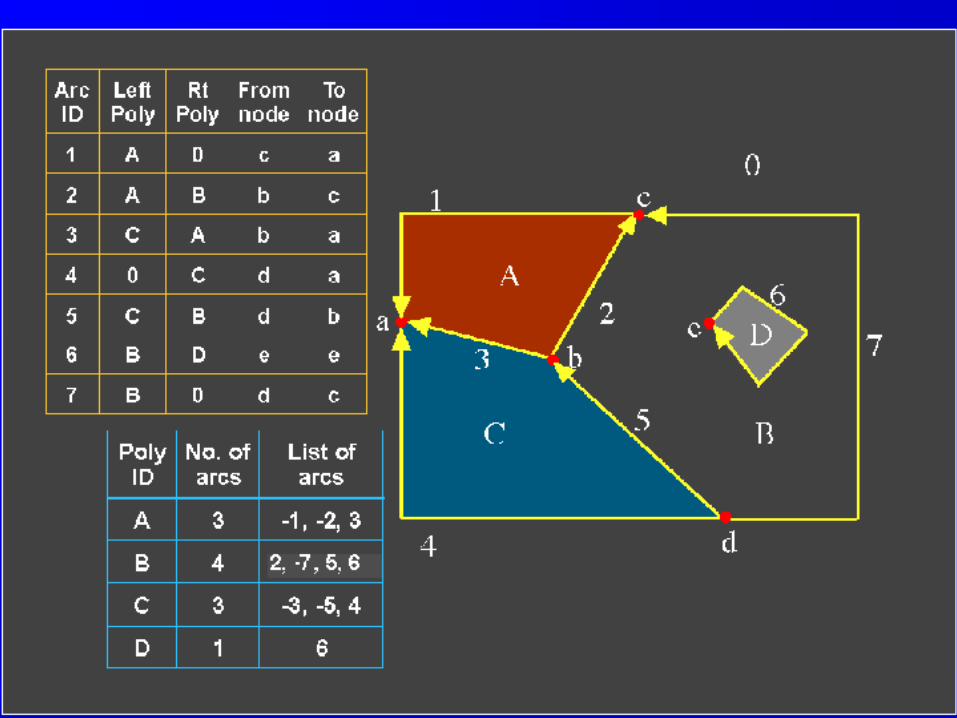
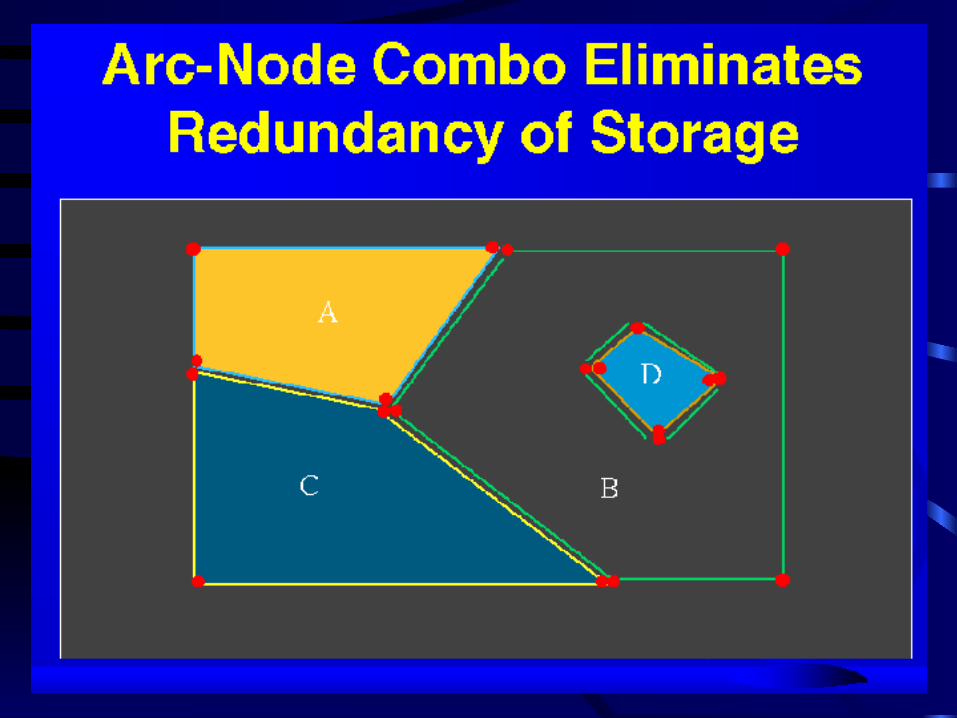
Polygon Storage - Use Arcs(more common)
• Every arc stored as a sequence of points • Every polygon stored as series of arcs • Boundaries only stored once• Nodes are points where arcs meet or end
Polygon ID Number ofArcs
Arc ID's
A 4 a, b, c, dB 4 c, e, f, g
Arc ID Start Enda (0,0) (4,0)b (4,0) (4,2)c (4,2) (0,2)d (0,2) (0,0)e (4,0) (6,0)f (6,0) (6,2)g (6,2) (4,2)
0,2 d 4,2 g 6,2
d A c B f
0,0 a 4,0 e 6,0
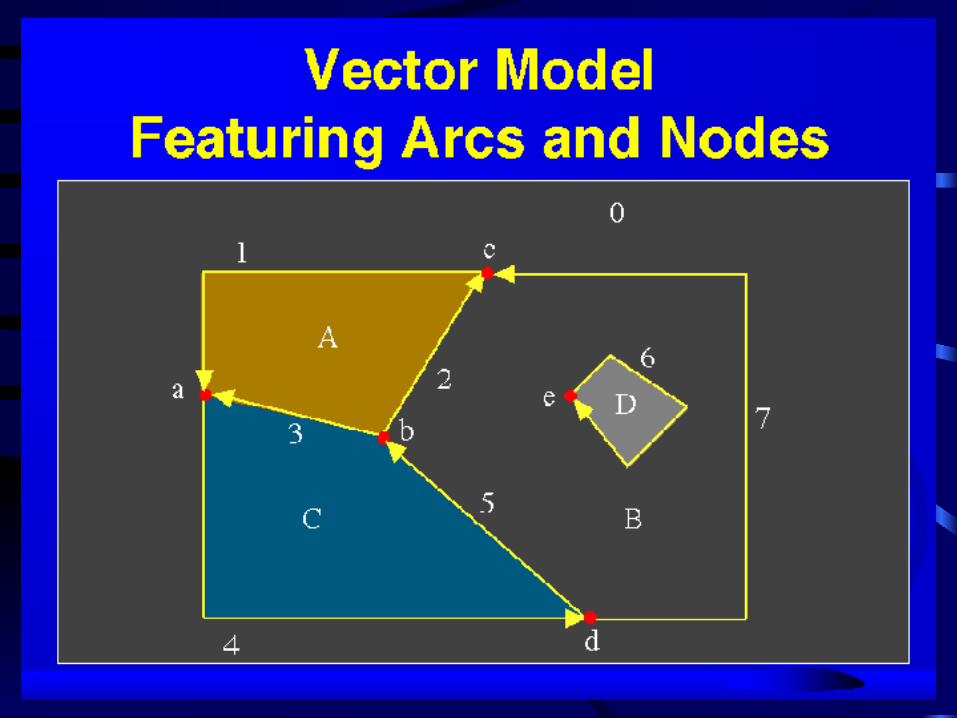
Topology
• The geometric relationship between objects located in space.
– Adjacency– Containment– Connectivity
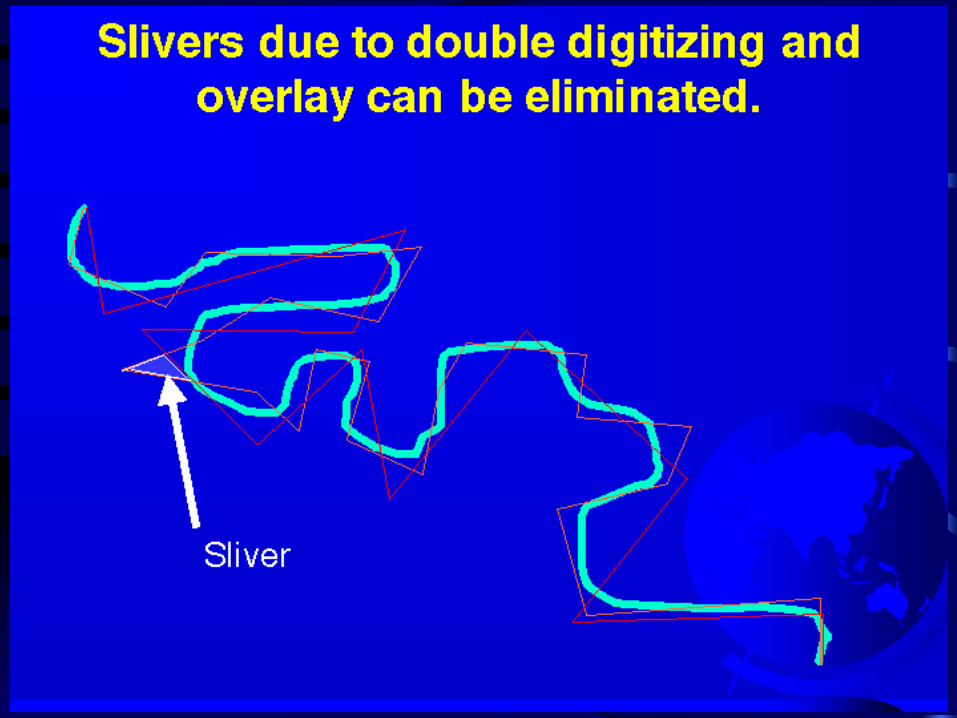
Raster and Vector Summary
• Vectors have advantage of accuracy but not good with continuous fields
• Vectors were used first - digitizing• Earliest include ASCII (x,y coordinates but
got too large) then binary took over.• Raster not good with lines or points but good
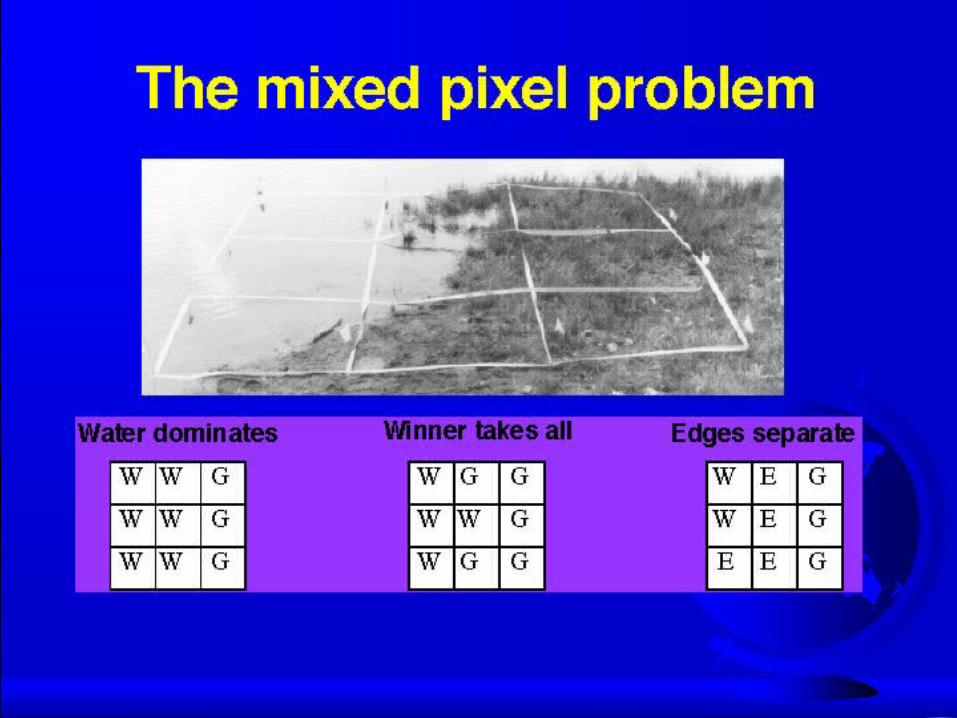
with continuous coverage areas.• Raster has the mixed pixel problem.
Raster Advantages:
• Simple data structure • Compatible with remotely sensed or scanned data • Simple spatial analysis procedures
Raster Disadvantages:
• Requires greater storage space on computer • Depending on pixel size, graphical output may be less pleasing • Projection transformations are more difficult • More difficult to represent topological relationships
Vector Advantages• Requires less disk storage space • Topological relationships are readily maintained • Graphical output more closely resembles hand-drawn maps
Vector Disadvantages• More complex data structure • Not as compatible with remotely sensed data • Software and hardware are often more expensive • Some spatial analysis procedures may be more difficult • Overlaying multiple vector maps is often time consuming
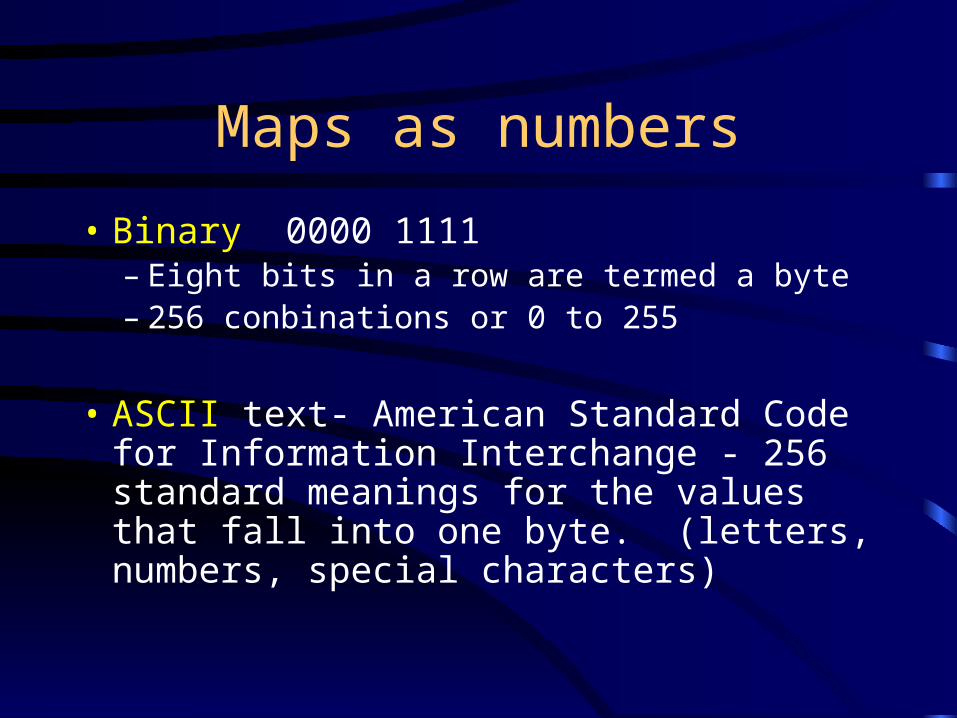
Maps as numbers
• Binary 0000 1111– Eight bits in a row are termed a byte– 256 conbinations or 0 to 255
• ASCII text- American Standard Code for Information Interchange - 256 standard meanings for the values that fall into one byte. (letters, numbers, special characters)
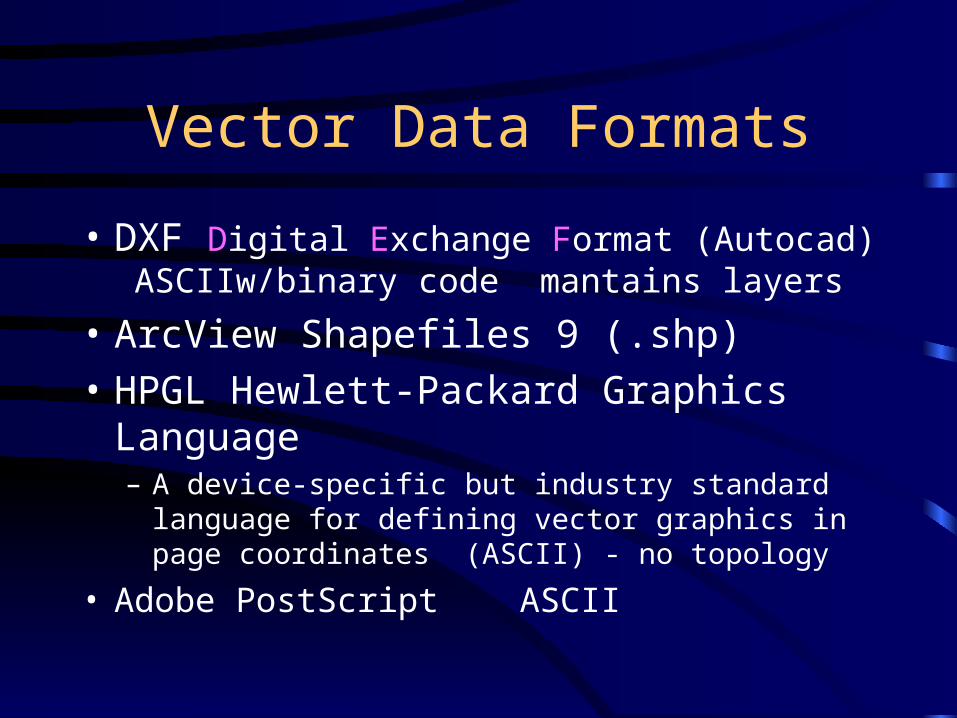
Vector Data Formats
• DXF Digital Exchange Format (Autocad) ASCIIw/binary code mantains layers
• ArcView Shapefiles 9 (.shp)
• HPGL Hewlett-Packard Graphics Language– A device-specific but industry standard language for
defining vector graphics in page coordinates (ASCII) - no topology
• Adobe PostScript ASCII
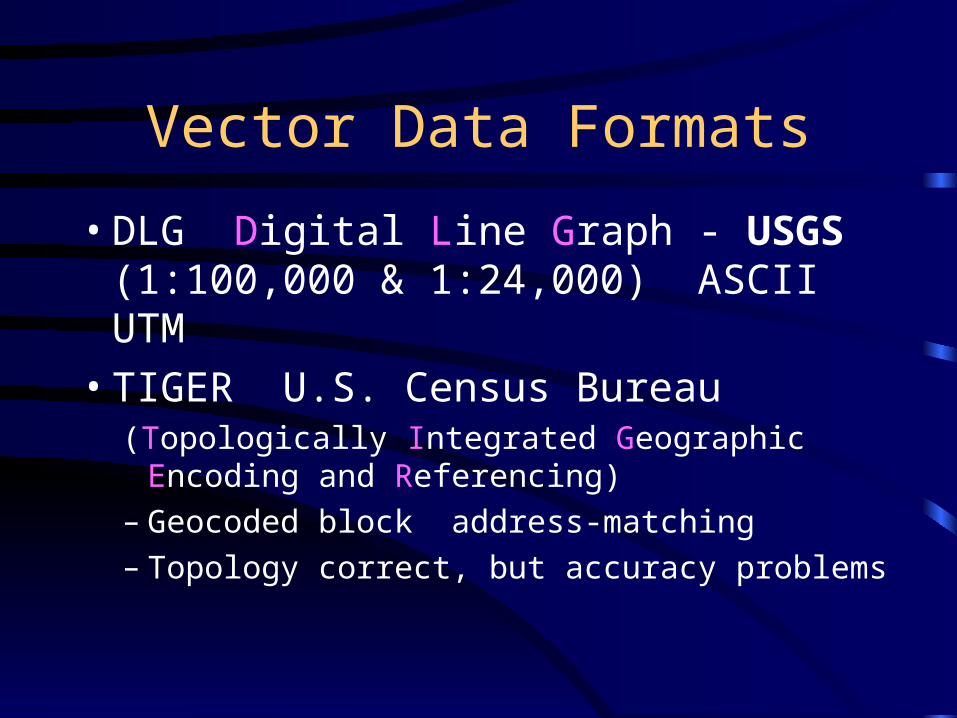
Vector Data Formats
• DLG Digital Line Graph - USGS (1:100,000 & 1:24,000) ASCII UTM
• TIGER U.S. Census Bureau(Topologically Integrated Geographic Encoding
and Referencing)– Geocoded block address-matching– Topology correct, but accuracy problems
Raster Data Formats
• DRG Digital Raster Graph
• TIF Tagged Interchange Format
• GIF Graphics Interchange Format
• JPEG Joint Photographic Experts Group
• GeoTiff – Geographical referenced TIF Files