Embed Size (px)
Citation preview
1
Corporate Presentation May 2014
2
Disclaimer
The information contained in this presentation may include statements which constitute forward-looking statements, within the meaning of Section 27A of the U.S. Securities Act of 1933, as amended, and Section 21E of the U.S. Securities Exchange Act of 1934, as amended. Such forward-looking statements involve a certain degree of risk and uncertainty with respect to business, financial, trend, strategy and other forecasts, and are based on assumptions, data or methods that, although considered reasonable by the company at the time, may turn out to be incorrect or imprecise, or may not be possible to realize. The company gives no assurance that expectations disclosed in this presentation will be confirmed. Prospective investors are cautioned that any such forward-looking statements are not guarantees of future performance and involve risks and uncertainties, and that actual results may differ materially from those in the forward-looking statements, due to a variety of factors, including, but not limited to, the risks of international business and other risks referred to in the company’s filings with the CVM and SEC. The company does not undertake, and specifically disclaims any obligation to update any forward-looking statements, which speak only for the date on which they are made.
3
The Company
4
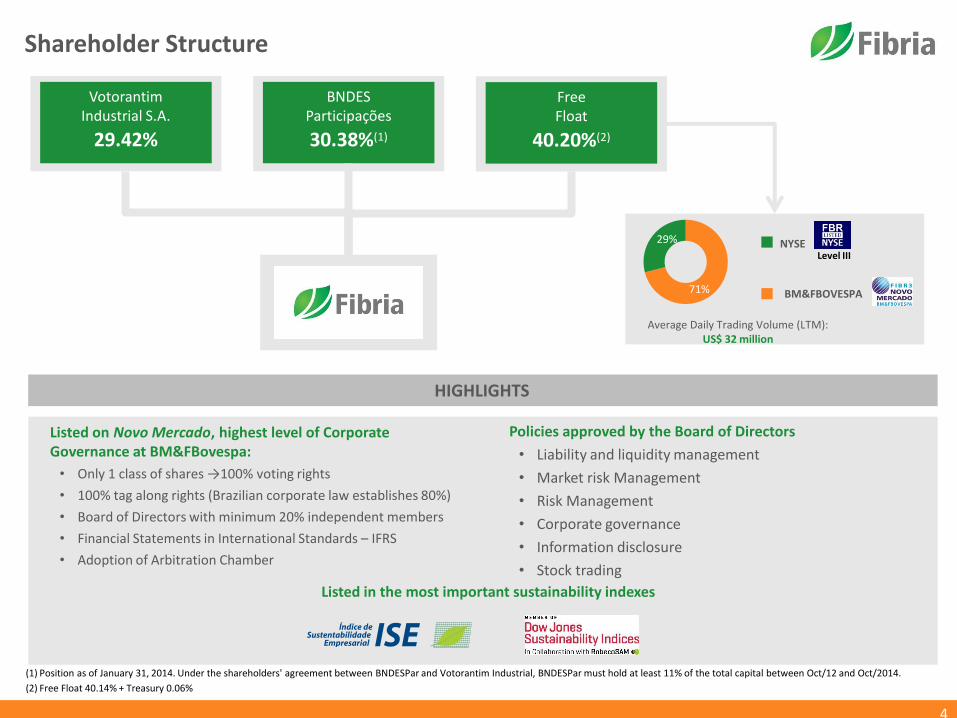
Shareholder Structure
(1) Position as of January 31, 2014. Under the shareholders' agreement between BNDESPar and Votorantim Industrial, BNDESPar must hold at least 11% of the total capital between Oct/12 and Oct/2014.
Votorantim Industrial S.A.
29.42%
BNDES Participações
30.38%(1)
Free Float
40.20%(2)
29%
71%
NYSE
Average Daily Trading Volume (LTM): US$ 32 million
BM&FBOVESPA
HIGHLIGHTS
Listed on Novo Mercado, highest level of Corporate Governance at BM&FBovespa:
• Only 1 class of shares →100% voting rights
• 100% tag along rights (Brazilian corporate law establishes 80%)
• Board of Directors with minimum 20% independent members
• Financial Statements in International Standards – IFRS
• Adoption of Arbitration Chamber
Policies approved by the Board of Directors
• Liability and liquidity management
• Market risk Management
• Risk Management
• Corporate governance
• Information disclosure
• Stock trading
Listed in the most important sustainability indexes
Level III
(2) Free Float 40.14% + Treasury 0.06%
5
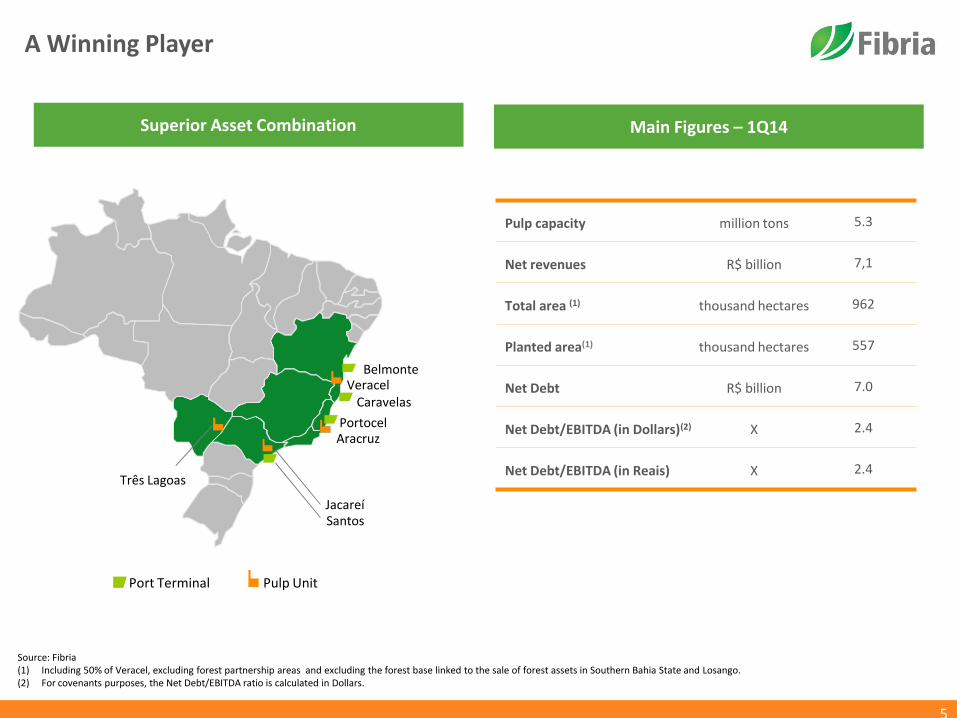
A Winning Player
Pulp capacity million tons 5.3
Net revenues R$ billion 7,1
Total area (1) thousand hectares 962
Planted area(1) thousand hectares 557
Net Debt R$ billion 7.0
Net Debt/EBITDA (in Dollars)(2) X 2.4
Net Debt/EBITDA (in Reais) X 2.4
Source: Fibria (1) Including 50% of Veracel, excluding forest partnership areas and excluding the forest base linked to the sale of forest assets in Southern Bahia State and Losango. (2) For covenants purposes, the Net Debt/EBITDA ratio is calculated in Dollars.
Port Terminal Pulp Unit
Três Lagoas
Santos
Aracruz Portocel
Caravelas
Belmonte Veracel
Jacareí
Superior Asset Combination Main Figures – 1Q14
6
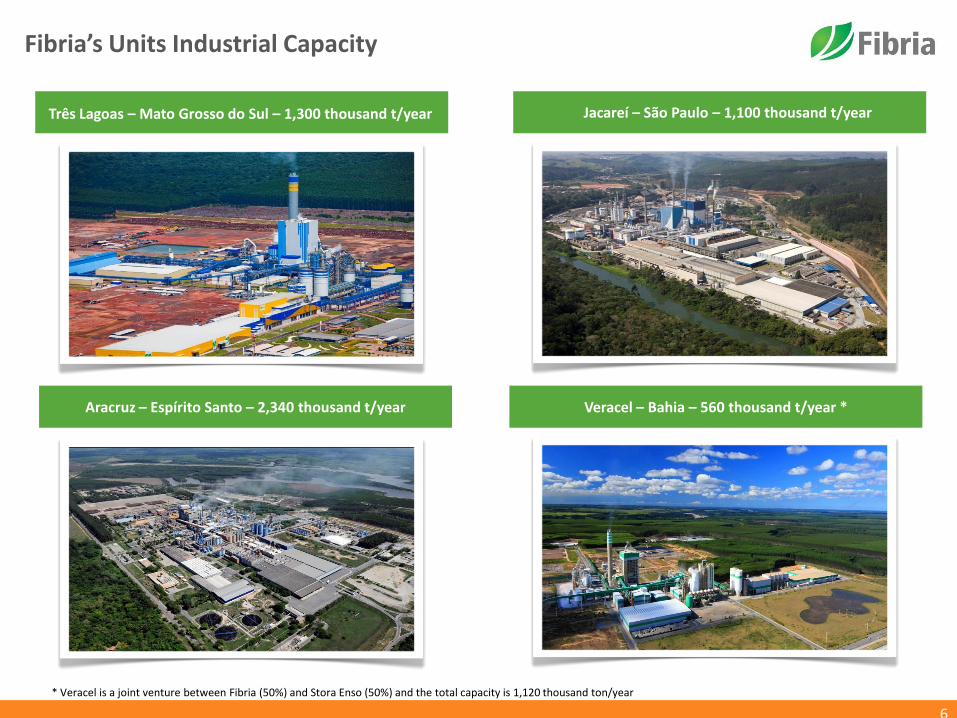
Fibria’s Units Industrial Capacity
Três Lagoas – Mato Grosso do Sul – 1,300 thousand t/year
Jacareí – São Paulo – 1,100 thousand t/year
Aracruz – Espírito Santo – 2,340 thousand t/year Veracel – Bahia – 560 thousand t/year *
* Veracel is a joint venture between Fibria (50%) and Stora Enso (50%) and the total capacity is 1,120 thousand ton/year

7
Fibria’s Strategy
8
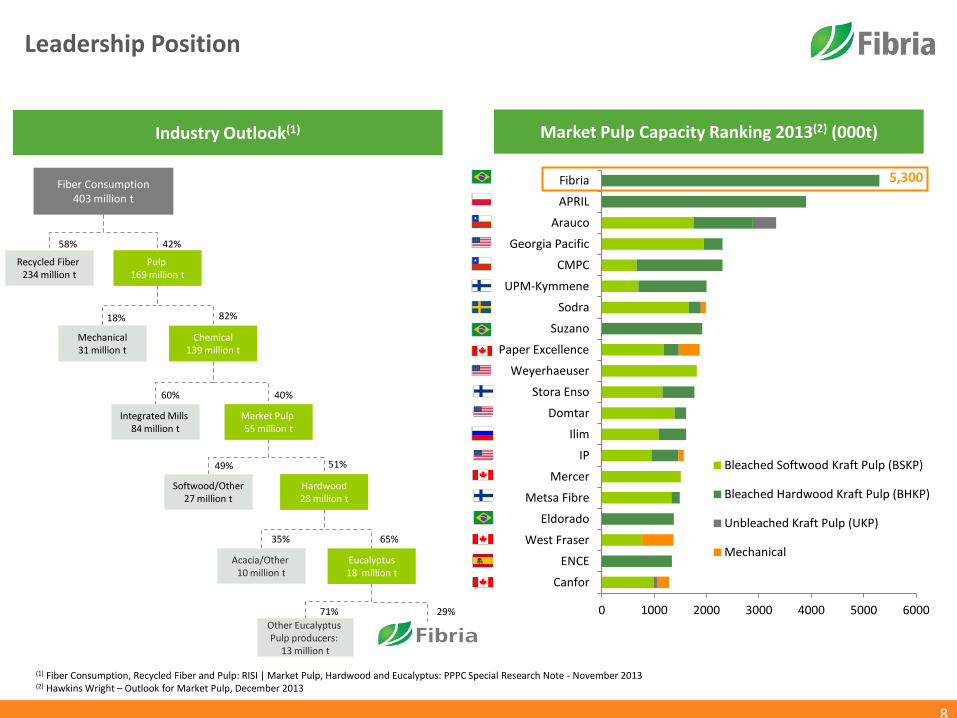
Leadership Position
(1) Fiber Consumption, Recycled Fiber and Pulp: RISI | Market Pulp, Hardwood and Eucalyptus: PPPC Special Research Note - November 2013 (2) Hawkins Wright – Outlook for Market Pulp, December 2013
Market Pulp Capacity Ranking 2013(2) (000t)
0 1000 2000 3000 4000 5000 6000
Canfor
ENCE
West Fraser
Eldorado
Metsa Fibre
Mercer
IP
Ilim
Domtar
Stora Enso
Weyerhaeuser
Paper Excellence
Suzano
Sodra
UPM-Kymmene
CMPC
Georgia Pacific
Arauco
APRIL
Fibria
Bleached Softwood Kraft Pulp (BSKP)
Bleached Hardwood Kraft Pulp (BHKP)
Unbleached Kraft Pulp (UKP)
Mechanical
5,300
Recycled Fiber 234 million t
49% 51%
60%
18% 82%
58% 42%
40%
35% 65%
29% 71%
Fiber Consumption 403 million t
Pulp 169 million t
Chemical 139 million t
Mechanical 31 million t
Integrated Mills 84 million t
Market Pulp 55 million t
Hardwood 28 million t
Other Eucalyptus Pulp producers:
13 million t
Softwood/Other 27 million t
Acacia/Other 10 million t
Eucalyptus 18 million t
Industry Outlook(1)
9
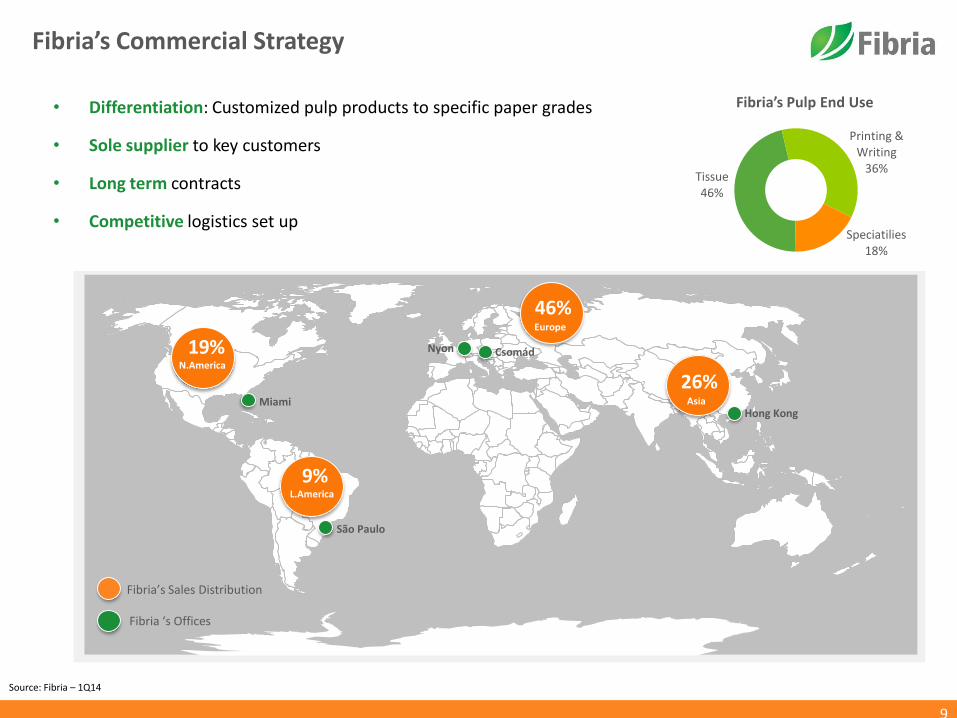
Fibria’s Commercial Strategy
Source: Fibria – 1Q14
• Differentiation: Customized pulp products to specific paper grades
• Sole supplier to key customers
• Long term contracts
• Competitive logistics set up
Miami
Nyon Csomád
Hong Kong
São Paulo
Fibria’s Sales Distribution
Fibria ‘s Offices
N.America
19%
L.America
9%
Europe
46%
Asia
26%
Fibria’s Pulp End Use
Tissue 46%
Printing & Writing
36%
Speciatilies 18%
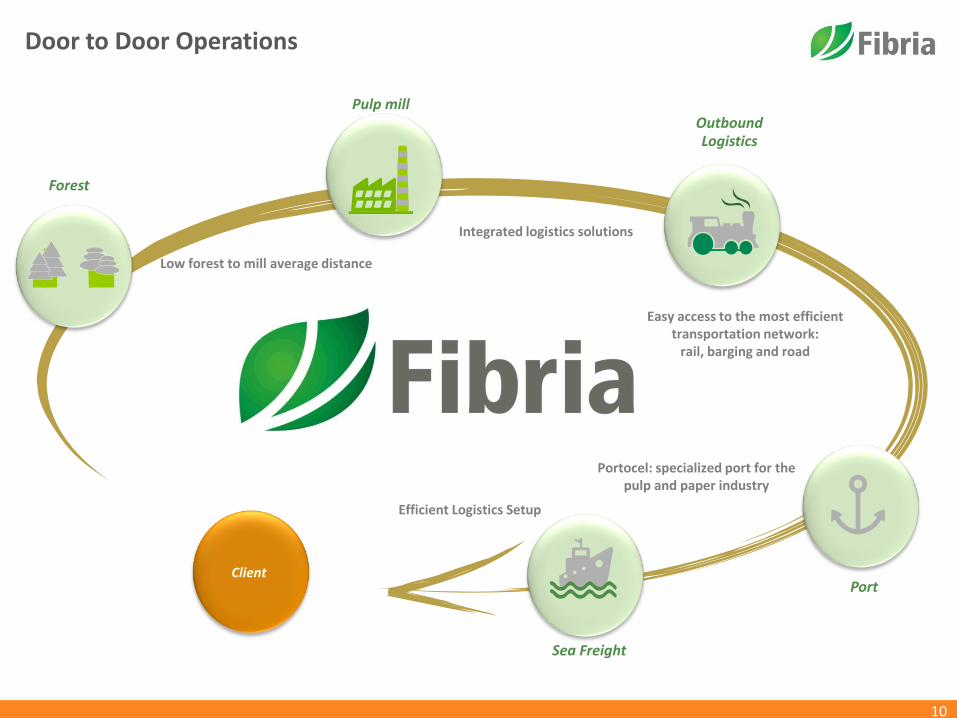
Forest
Outbound Logistics
Pulp mill
Port Client
Low forest to mill average distance
Easy access to the most efficient transportation network:
rail, barging and road
Portocel: specialized port for the pulp and paper industry
Integrated logistics solutions
Efficient Logistics Setup
Sea Freight
Door to Door Operations
10

11
Pulp and Paper Market
12
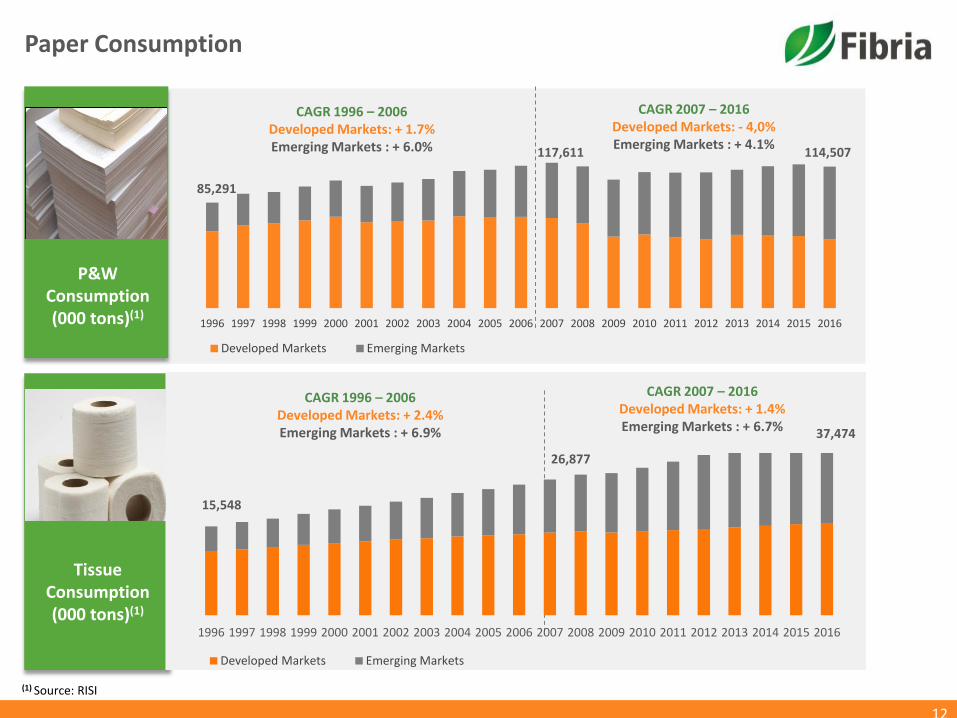
Paper Consumption
(1) Source: RISI
1996 1997 1998 1999 2000 2001 2002 2003 2004 2005 2006 2007 2008 2009 2010 2011 2012 2013 2014 2015 2016
Developed Markets Emerging Markets
CAGR 1996 – 2006 Developed Markets: + 1.7% Emerging Markets : + 6.0%
85,291
117,611
15,548
37,474
P&W Consumption (000 tons)(1)
Tissue Consumption (000 tons)(1)
114,507
CAGR 2007 – 2016 Developed Markets: - 4,0% Emerging Markets : + 4.1%
CAGR 1996 – 2006 Developed Markets: + 2.4% Emerging Markets : + 6.9%
CAGR 2007 – 2016 Developed Markets: + 1.4% Emerging Markets : + 6.7%
26,877
1996 1997 1998 1999 2000 2001 2002 2003 2004 2005 2006 2007 2008 2009 2010 2011 2012 2013 2014 2015 2016
Developed Markets Emerging Markets
13
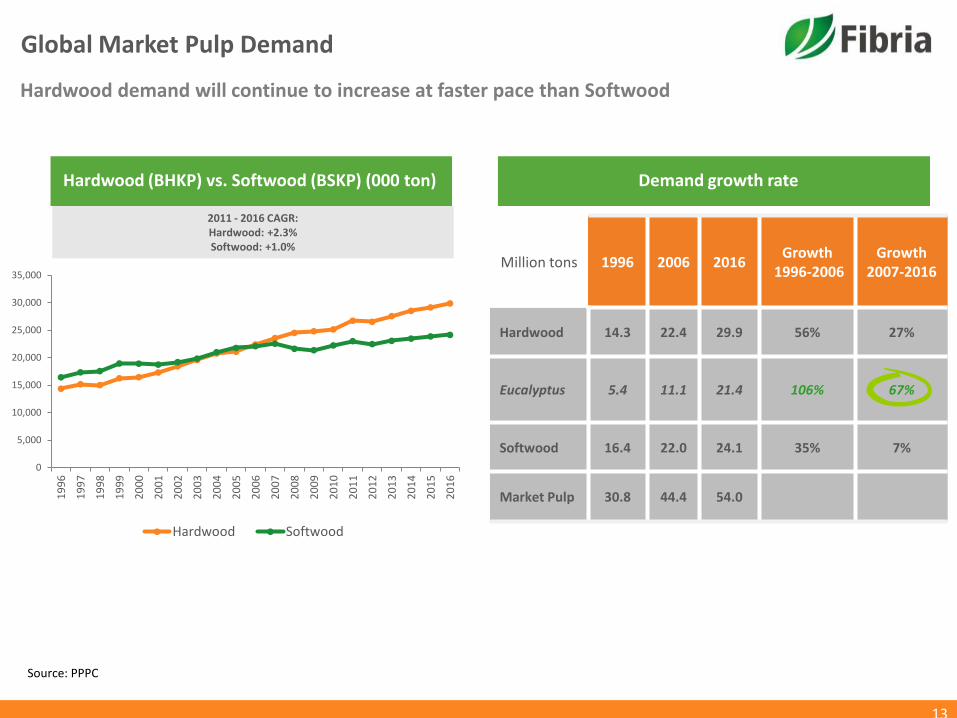
Million tons 1996 2006 2016 Growth
1996-2006 Growth
2007-2016
Hardwood 14.3 22.4 29.9 56% 27%
Eucalyptus 5.4 11.1 21.4 106% 67%
Softwood 16.4 22.0 24.1 35% 7%
Market Pulp 30.8 44.4 54.0
Source: PPPC
Global Market Pulp Demand
0
5,000
10,000
15,000
20,000
25,000
30,000
35,000
19
96
19
97
19
98
19
99
20
00
20
01
20
02
20
03
20
04
20
05
20
06
20
07
20
08
20
09
20
10
20
11
20
12
20
13
20
14
20
15
20
16
Hardwood Softwood
2011 - 2016 CAGR: Hardwood: +2.3% Softwood: +1.0%
Hardwood demand will continue to increase at faster pace than Softwood
Hardwood (BHKP) vs. Softwood (BSKP) (000 ton) Demand growth rate
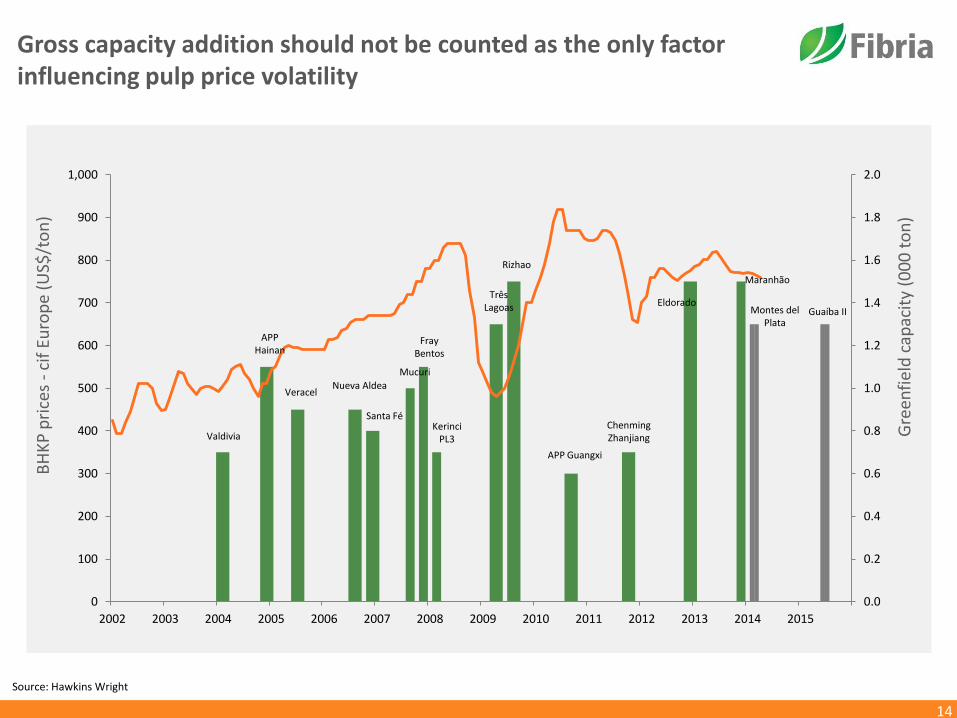
Gross capacity addition should not be counted as the only factor influencing pulp price volatility
Source: Hawkins Wright
14
BH
KP
pri
ces
- ci
f Eu
rop
e (U
S$/t
on
)
0.0
0.2
0.4
0.6
0.8
1.0
1.2
1.4
1.6
1.8
2.0
0
100
200
300
400
500
600
700
800
900
1,000
2002 2003 2004 2005 2006 2007 2008 2009 2010 2011 2012 2013 2014 2015
Valdivia
APP Hainan
Veracel Nueva Aldea
Santa Fé
Mucuri
Fray Bentos
Kerinci PL3
Três Lagoas
Rizhao
APP Guangxi
Chenming Zhanjiang
Eldorado Montes del
Plata
Maranhão
Guaíba II
Gre
enfi
eld
cap
acit
y (0
00
to
n)
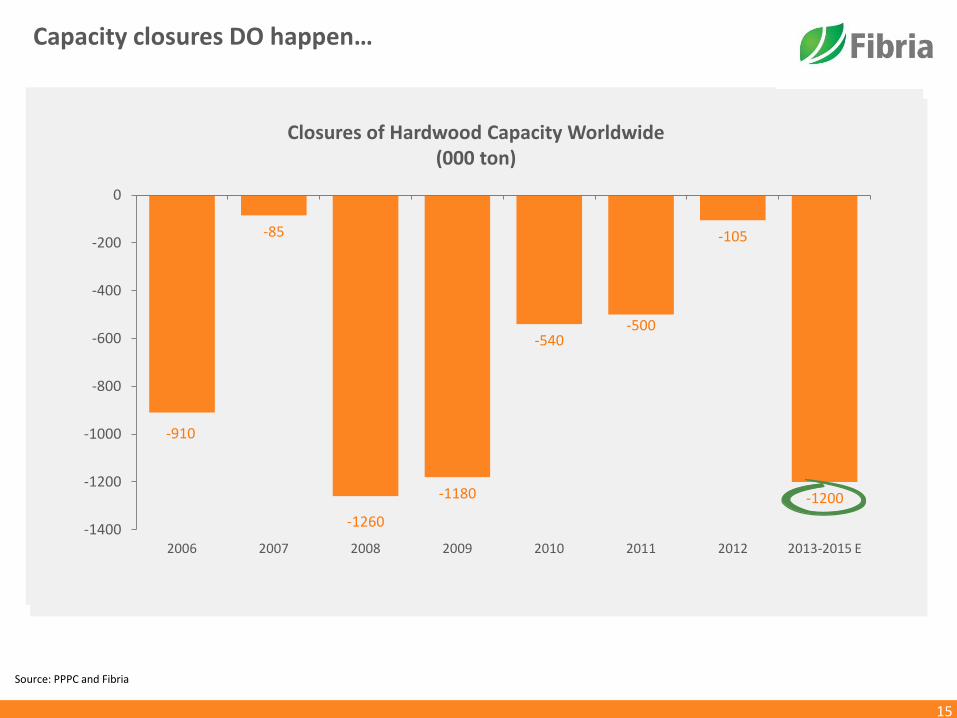
Capacity closures DO happen…
Source: PPPC and Fibria
15
-910
-85
-1260
-1180
-540 -500
-105
-1200
-1400
-1200
-1000
-800
-600
-400
-200
0
2006 2007 2008 2009 2010 2011 2012 2013-2015 E
Closures of Hardwood Capacity Worldwide (000 ton)
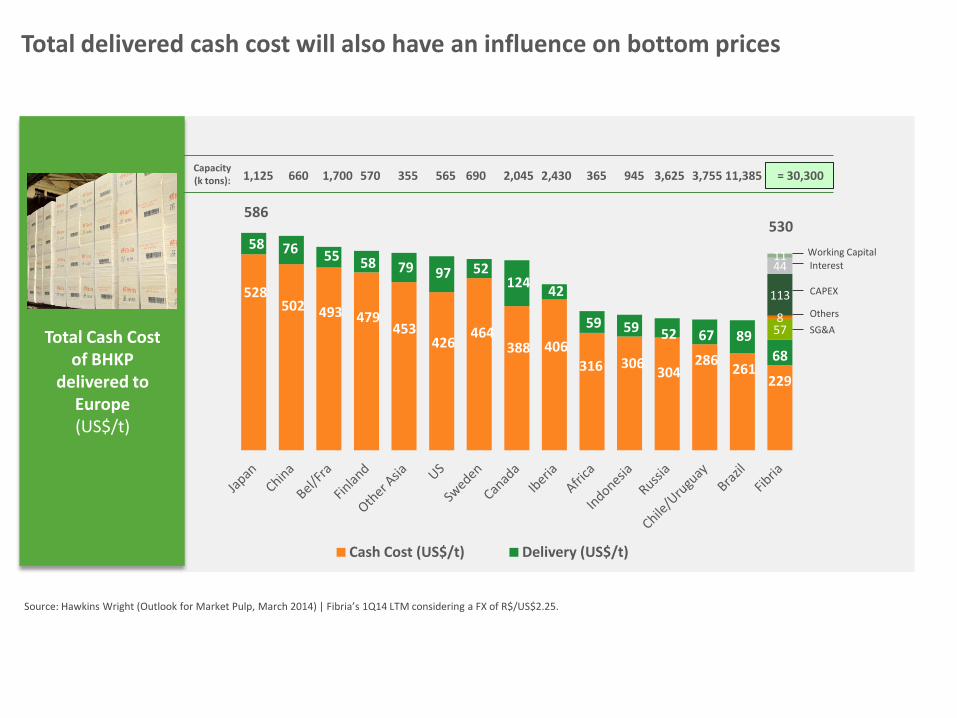
Total delivered cash cost will also have an influence on bottom prices
16
Total Cash Cost of BHKP
delivered to Europe
(US$/t)
Source: Hawkins Wright (Outlook for Market Pulp, March 2014) | Fibria’s 1Q14 LTM considering a FX of R$/US$2.25.
528 502 493 479
453 426
464 388 406
316 306 304
286 261
229
58 76 55 58 79 97 52 124
42
59 59 52 67 89
68
57 8
113
44 11
Cash Cost (US$/t) Delivery (US$/t)
586 530
SG&A
Others
CAPEX
Interest Working Capital
Capacity (k tons): 1,125 660 1,700 570 355 565 690 2,045 2,430 3,625 11,385 = 30,300 365 945 3,755
17
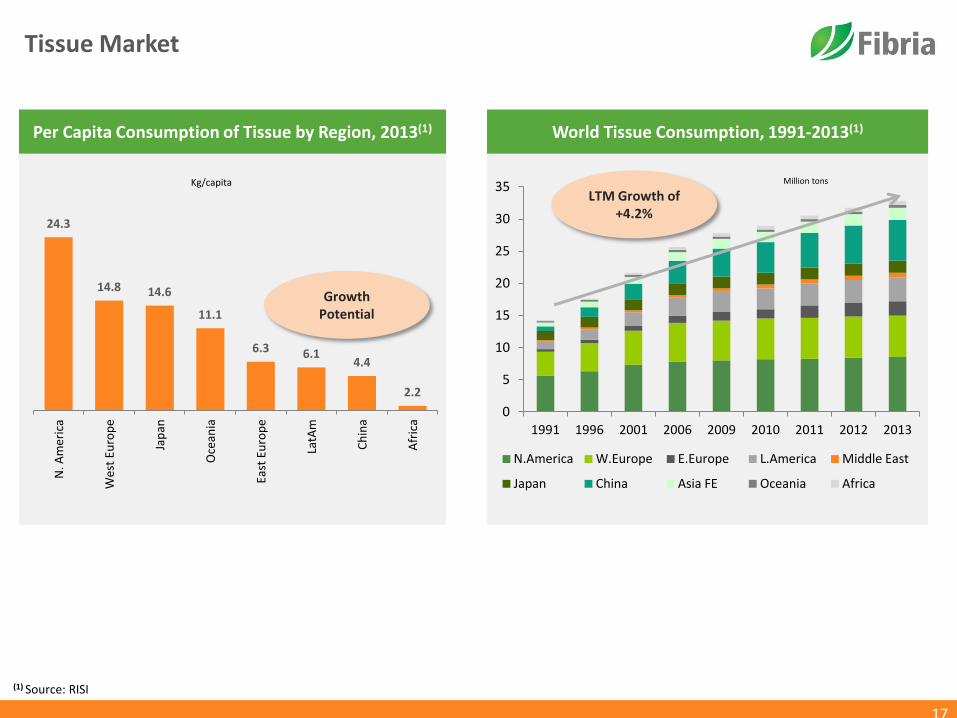
Tissue Market
(1) Source: RISI
Kg/capita
Per Capita Consumption of Tissue by Region, 2013(1)
Growth Potential
24.3
14.8 14.6
11.1
6.3 6.1 4.4
2.2
N. A
mer
ica
Wes
t Eu
rop
e
Jap
an
Oce
ania
East
Eu
rop
e
LatA
m
Ch
ina
Afr
ica
0
5
10
15
20
25
30
35
1991 1996 2001 2006 2009 2010 2011 2012 2013
N.America W.Europe E.Europe L.America Middle East
Japan China Asia FE Oceania Africa
LTM Growth of +4.2%
Million tons
World Tissue Consumption, 1991-2013(1)
18
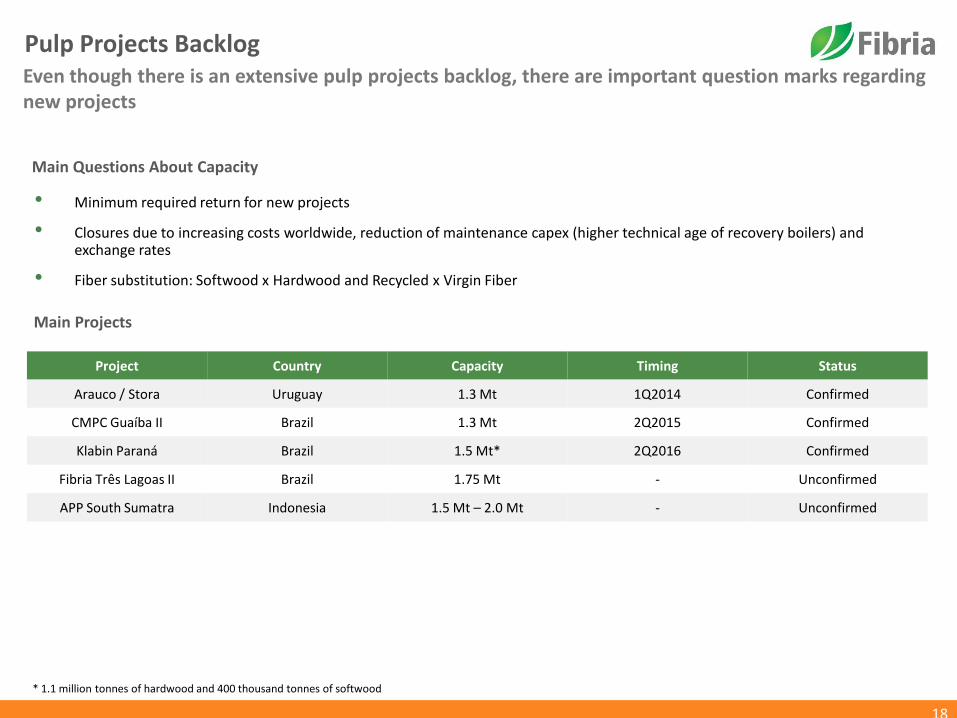
Pulp Projects Backlog
Main Projects
Project Country Capacity Timing Status
Arauco / Stora Uruguay 1.3 Mt 1Q2014 Confirmed
CMPC Guaíba II Brazil 1.3 Mt 2Q2015 Confirmed
Klabin Paraná Brazil 1.5 Mt* 2Q2016 Confirmed
Fibria Três Lagoas II Brazil 1.75 Mt - Unconfirmed
APP South Sumatra Indonesia 1.5 Mt – 2.0 Mt - Unconfirmed
• Minimum required return for new projects
• Closures due to increasing costs worldwide, reduction of maintenance capex (higher technical age of recovery boilers) and exchange rates
• Fiber substitution: Softwood x Hardwood and Recycled x Virgin Fiber
Main Questions About Capacity
Even though there is an extensive pulp projects backlog, there are important question marks regarding new projects
* 1.1 million tonnes of hardwood and 400 thousand tonnes of softwood

19
Financial Highlights
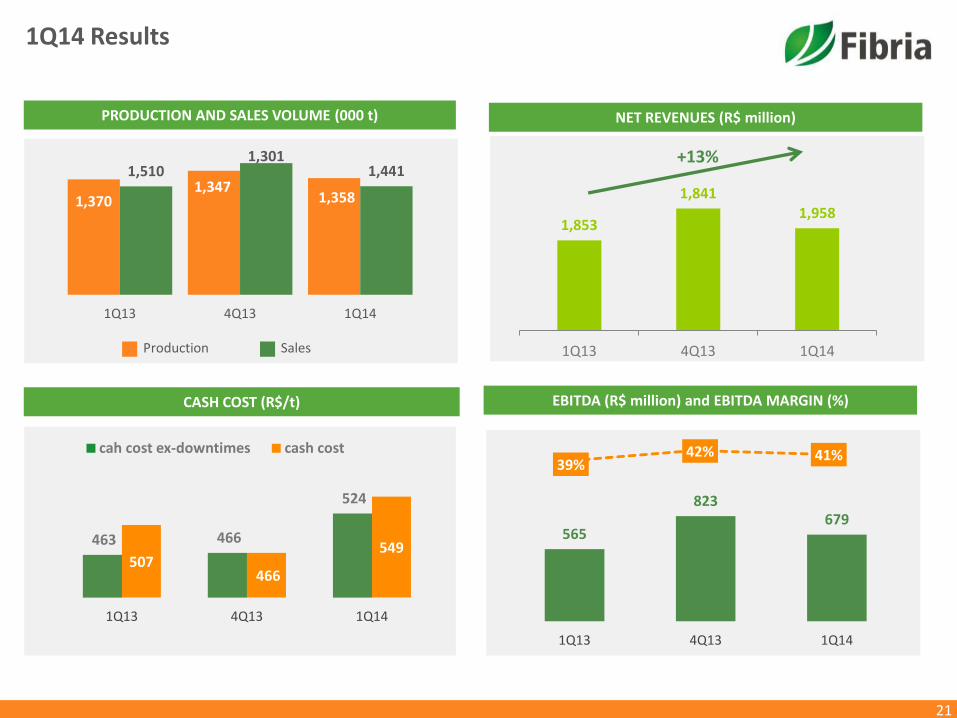
39% 42% 41%
1,853
1,841 1,958
1Q13 4Q13 1Q14
565
823 679
1Q13 4Q13 1Q14
1Q14 Results
21
1,370 1,347
1,358
1,510 1,301
1,441
1Q13 4Q13 1Q14
EBITDA (R$ million) and EBITDA MARGIN (%)
Production Sales
PRODUCTION AND SALES VOLUME (000 t) NET REVENUES (R$ million)
+13%
463 466
524
507 466
549
1Q13 4Q13 1Q14
cah cost ex-downtimes cash cost
CASH COST (R$/t)
21
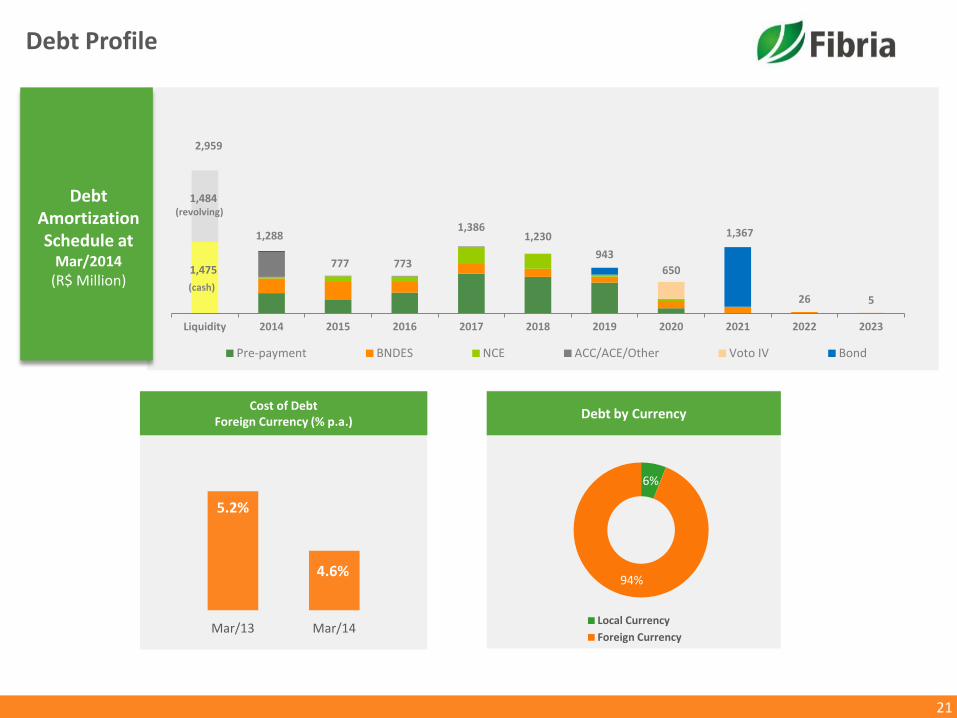
Debt Amortization Schedule at
Mar/2014
(R$ Million)
Cost of Debt Foreign Currency (% p.a.)
Debt by Currency
6%
94%
Local Currency
Foreign Currency
Debt Profile
5.2%
4.6%
Mar/13 Mar/14
1,475
1,484
2,959
1,288
777 773
1,386 1,230
943
650
1,367
26 5
Liquidity 2014 2015 2016 2017 2018 2019 2020 2021 2022 2023
Pre-payment BNDES NCE ACC/ACE/Other Voto IV Bond
(cash)
(revolving)
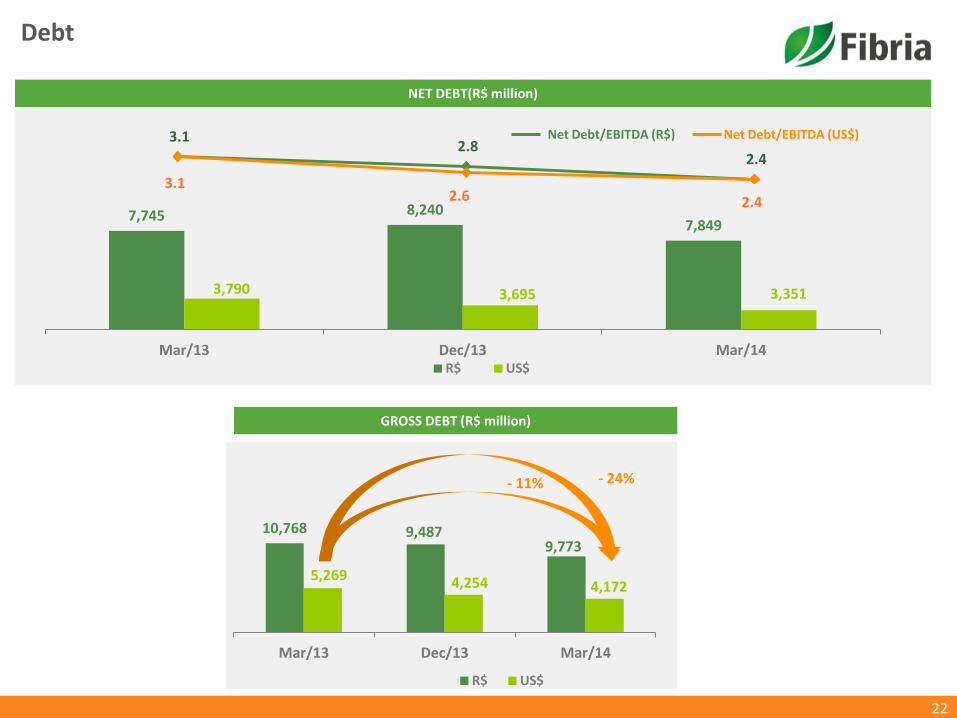
7,745 8,240
7,849
3,790 3,695 3,351
Mar/13 Dec/13 Mar/14 R$ US$
Debt
22
NET DEBT(R$ million)
GROSS DEBT (R$ million)
Net Debt/EBITDA (US$) Net Debt/EBITDA (R$) 3.1 2.8
2.4
3.1 2.6 2.4
10,768 9,487 9,773
5,269 4,254 4,172
Mar/13 Dec/13 Mar/14
R$ US$
- 11% - 24%
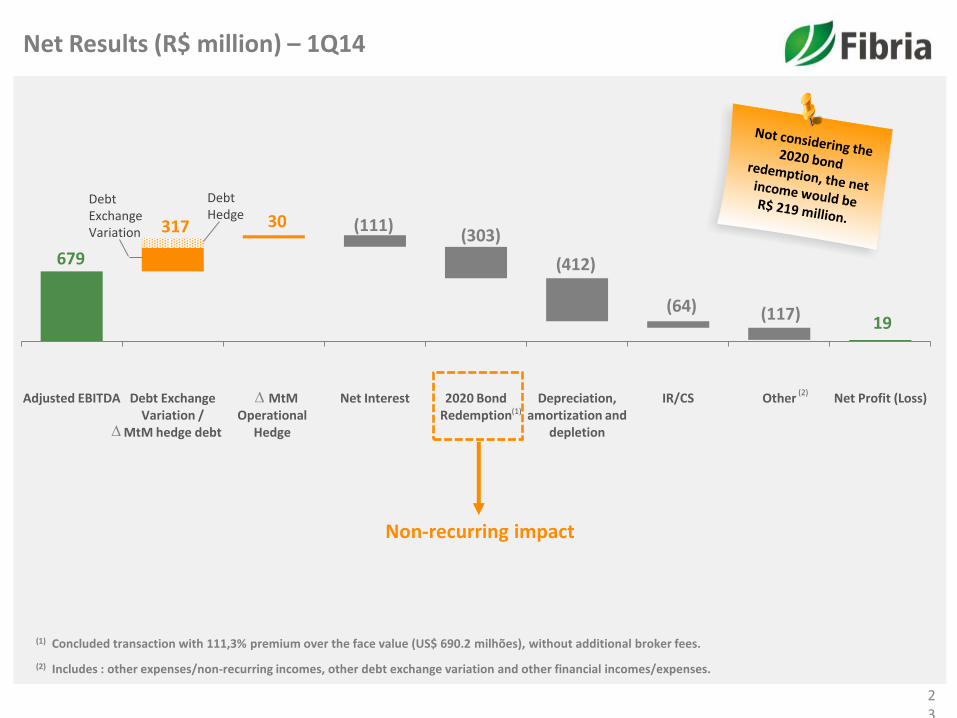
679
19
30 (111) (303)
(412)
(64) (117)
317
Adjusted EBITDA Debt Exchange Variation /
MtM hedge debt
MtM Operational
Hedge
Net Interest 2020 Bond Redemption
Depreciation, amortization and
depletion
IR/CS Other Net Profit (Loss)
Net Results (R$ million) – 1Q14
23
Non-recurring impact
(1) Concluded transaction with 111,3% premium over the face value (US$ 690.2 milhões), without additional broker fees.
(2)
∆
∆
Debt Hedge
Debt Exchange Variation
(1)
(2) Includes : other expenses/non-recurring incomes, other debt exchange variation and other financial incomes/expenses.

Investor Relations
E-mail: [email protected]
Phone: +55 11 2138-4565
Website: www.fibria.com.br/ir
24