Embed Size (px)
Citation preview

Strictly Private & Confidential
FINANCIAL YEAR 2014-15
D E C E M B E R 2 0 1 4
Strictly Private & Confidential2
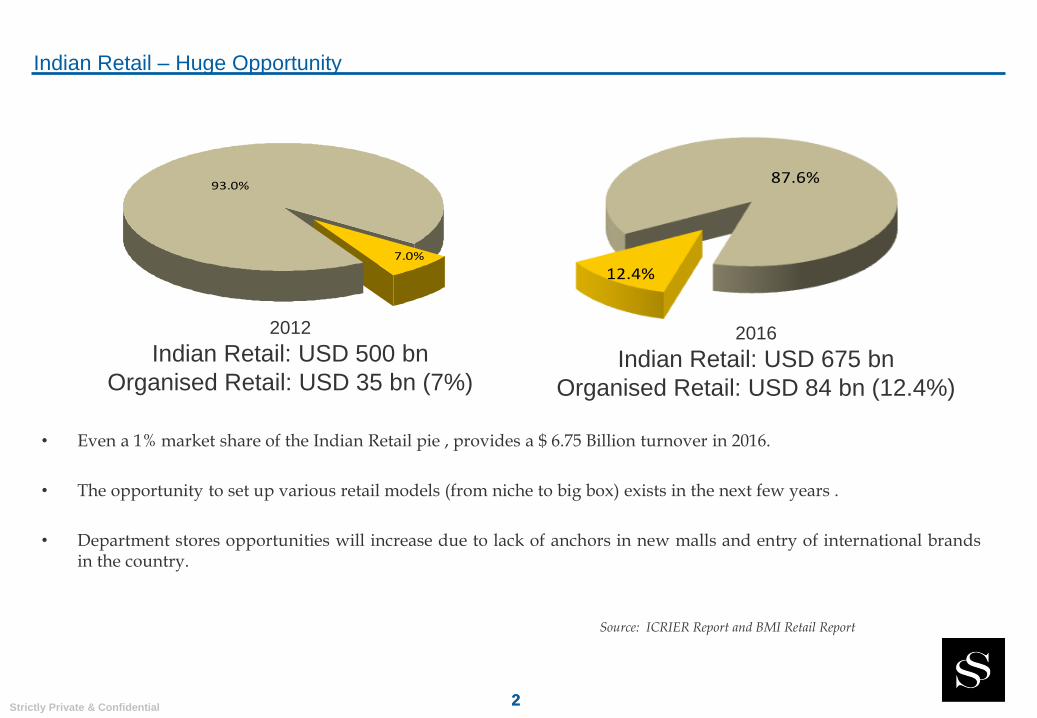
87.6%
12.4%
Indian Retail – Huge Opportunity
2
Source: ICRIER Report and BMI Retail Report
• Even a 1% market share of the Indian Retail pie , provides a $ 6.75 Billion turnover in 2016.
• The opportunity to set up various retail models (from niche to big box) exists in the next few years .
• Department stores opportunities will increase due to lack of anchors in new malls and entry of international brandsin the country.
2012
Indian Retail: USD 500 bn
Organised Retail: USD 35 bn (7%)
2016
Indian Retail: USD 675 bn
Organised Retail: USD 84 bn (12.4%)
93.0%
7.0%
Strictly Private & Confidential3
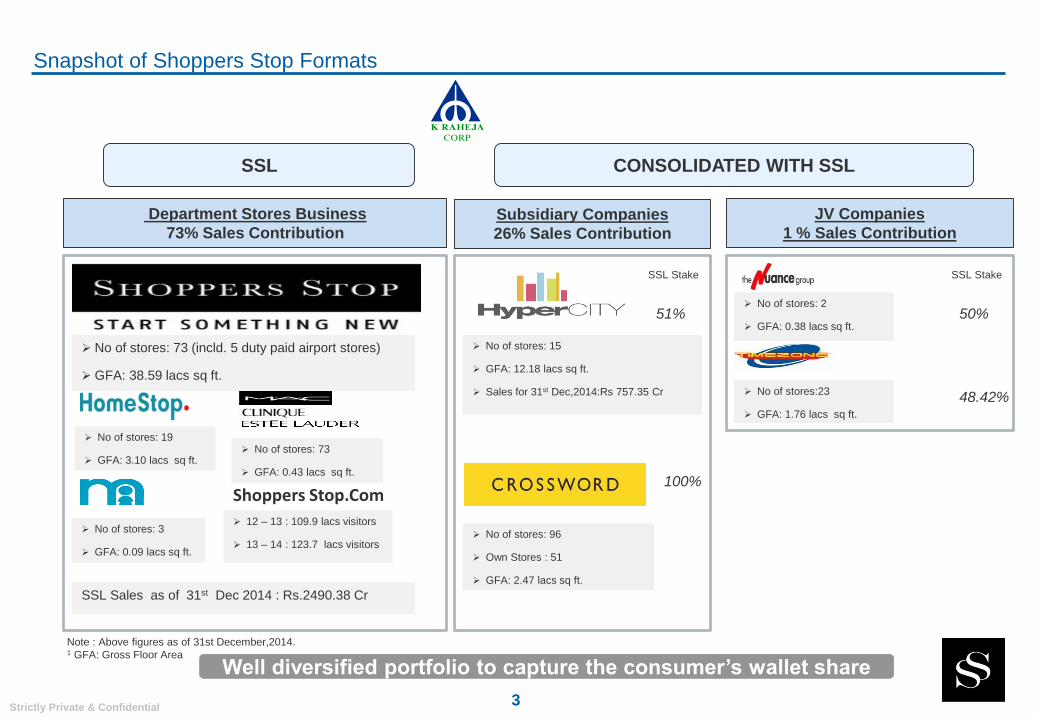
Snapshot of Shoppers Stop Formats
SSL
No of stores: 73 (incld. 5 duty paid airport stores)
GFA: 38.59 lacs sq ft.
No of stores: 3
GFA: 0.09 lacs sq ft.
No of stores: 73
GFA: 0.43 lacs sq ft.
No of stores: 19
GFA: 3.10 lacs sq ft.
Department Stores Business
73% Sales Contribution
12 – 13 : 109.9 lacs visitors
13 – 14 : 123.7 lacs visitors
Shoppers Stop.Com
No of stores: 15
GFA: 12.18 lacs sq ft.
Sales for 31st Dec,2014:Rs 757.35 Cr
No of stores: 2
GFA: 0.38 lacs sq ft.
No of stores:23
GFA: 1.76 lacs sq ft.
No of stores: 96
Own Stores : 51
GFA: 2.47 lacs sq ft.
Subsidiary Companies
26% Sales Contribution
50%
48.42%
Well diversified portfolio to capture the consumer’s wallet share
Note : Above figures as of 31st December,2014.1 GFA: Gross Floor Area
JV Companies
1 % Sales Contribution
SSL Stake
51%
100%
SSL Stake
CONSOLIDATED WITH SSL
SSL Sales as of 31st Dec 2014 : Rs.2490.38 Cr
Strictly Private & Confidential4
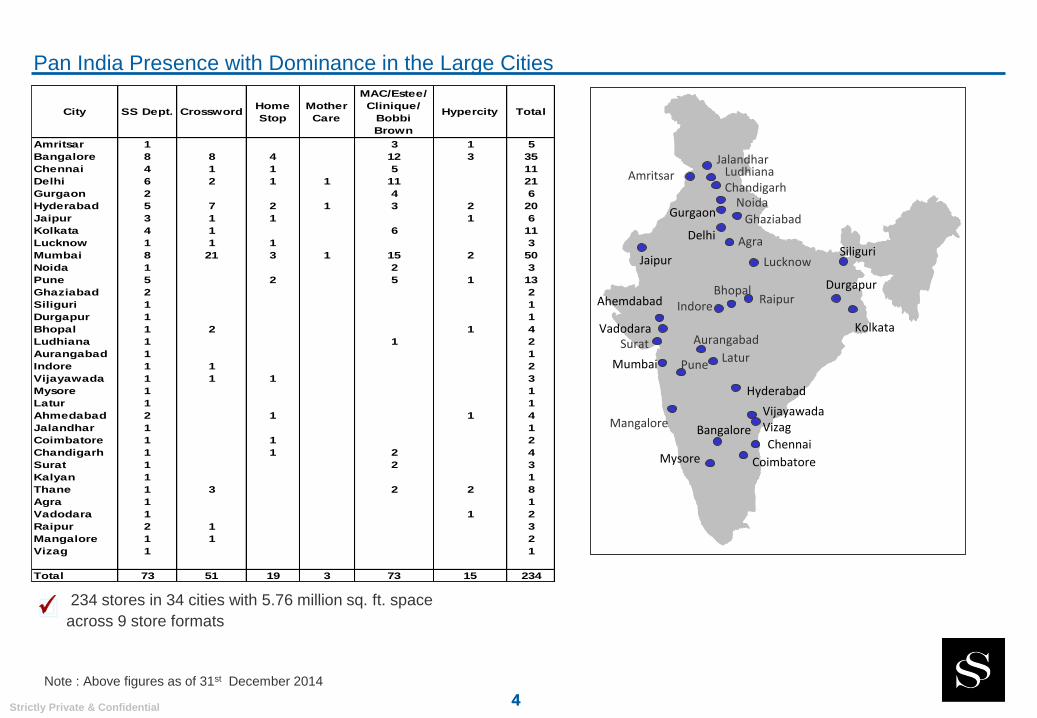
Pan India Presence with Dominance in the Large Cities
4
Note : Above figures as of 31st December 2014
234 stores in 34 cities with 5.76 million sq. ft. space
across 9 store formats
City SS Dept. CrosswordHome
Stop
Mother
Care
MAC/Estee/
Clinique/
Bobbi
Brown
Hypercity Total
Amritsar 1 3 1 5
Bangalore 8 8 4 12 3 35
Chennai 4 1 1 5 11
Delhi 6 2 1 1 11 21
Gurgaon 2 4 6
Hyderabad 5 7 2 1 3 2 20
Jaipur 3 1 1 1 6
Kolkata 4 1 6 11
Lucknow 1 1 1 3
Mumbai 8 21 3 1 15 2 50
Noida 1 2 3
Pune 5 2 5 1 13
Ghaziabad 2 2
Siliguri 1 1
Durgapur 1 1
Bhopal 1 2 1 4
Ludhiana 1 1 2
Aurangabad 1 1
Indore 1 1 2
Vijayawada 1 1 1 3
Mysore 1 1
Latur 1 1
Ahmedabad 2 1 1 4
Jalandhar 1 1
Coimbatore 1 1 2
Chandigarh 1 1 2 4
Surat 1 2 3
Kalyan 1 1
Thane 1 3 2 2 8
Agra 1 1
Vadodara 1 1 2
Raipur 2 1 3
Mangalore 1 1 2
Vizag 1 1
Total 73 51 19 3 73 15 234
Kolkata
Delhi
Jaipur
Mumbai
Hyderabad
BangaloreChennai
GurgaonGhaziabad
Pune
Noida
Amritsar
Bhopal
Aurangabad
Siliguri
Durgapur
Lucknow
LudhianaChandigarh
Indore
VijayawadaVizag
Ahemdabad
Mysore
Latur
Jalandhar
Coimbatore
SuratVadodara
Agra
Raipur
Mangalore
Strictly Private & Confidential
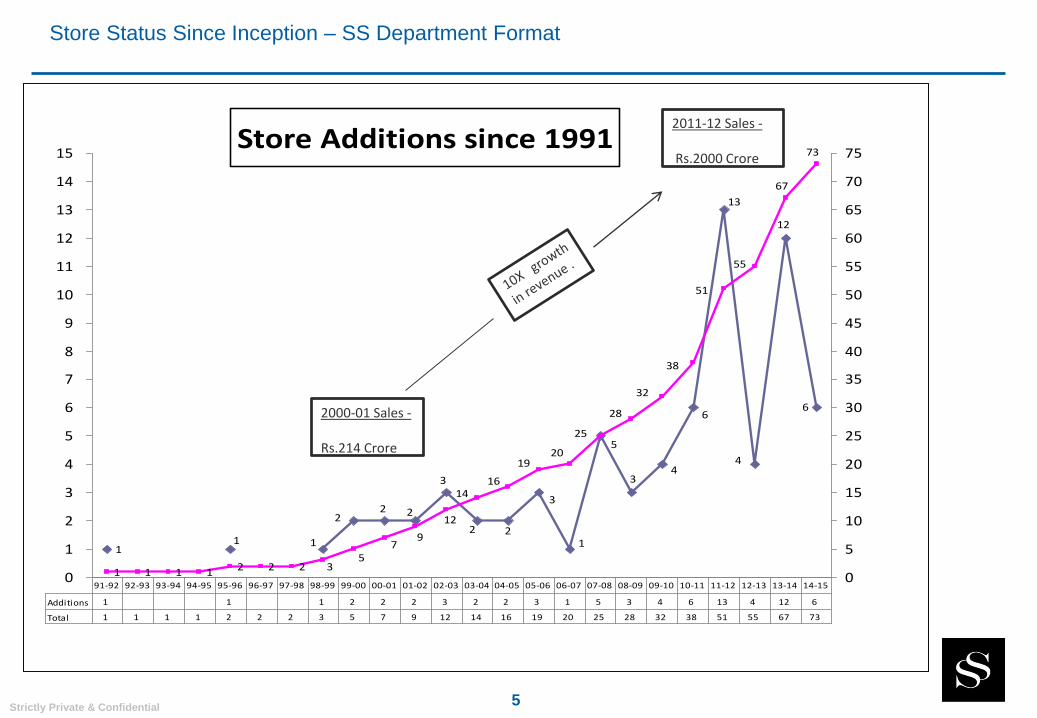
Store Additions since 1991
11 1
22 2
3
2 2
3
1
5
34
6
13
4
12
6
1 1 1 1 2 2 2 35
79
12
1416
1920
25
28
32
38
51
55
67
73
0
1
2
3
4
5
6
7
8
9
10
11
12
13
14
15
0
5
10
15
20
25
30
35
40
45
50
55
60
65
70
75
Additions 1 1 1 2 2 2 3 2 2 3 1 5 3 4 6 13 4 12 6
Total 1 1 1 1 2 2 2 3 5 7 9 12 14 16 19 20 25 28 32 38 51 55 67 73
91-92 92-93 93-94 94-95 95-96 96-97 97-98 98-99 99-00 00-01 01-02 02-03 03-04 04-05 05-06 06-07 07-08 08-09 09-10 10-11 11-12 12-13 13-14 14-15
5
Store Status Since Inception – SS Department Format
2000-01 Sales -
Rs.214 Crore
2011-12 Sales -
Rs.2000 Crore
Strictly Private & Confidential6
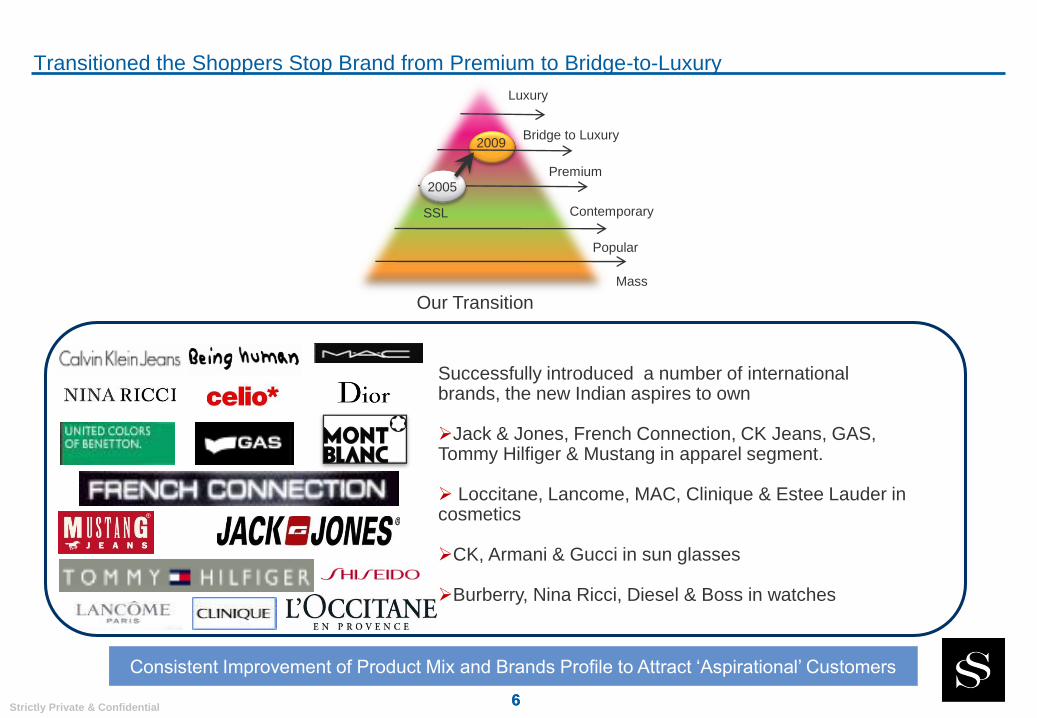
Transitioned the Shoppers Stop Brand from Premium to Bridge-to-Luxury
6
Successfully introduced a number of international brands, the new Indian aspires to own
Jack & Jones, French Connection, CK Jeans, GAS, Tommy Hilfiger & Mustang in apparel segment.
Loccitane, Lancome, MAC, Clinique & Estee Lauder in cosmetics
CK, Armani & Gucci in sun glasses
Burberry, Nina Ricci, Diesel & Boss in watches
Luxury
Bridge to Luxury
Contemporary
Popular
Mass
Premium
2009
SSL
2005
Our Transition
Consistent Improvement of Product Mix and Brands Profile to Attract ‘Aspirational’ Customers
Strictly Private & Confidential7
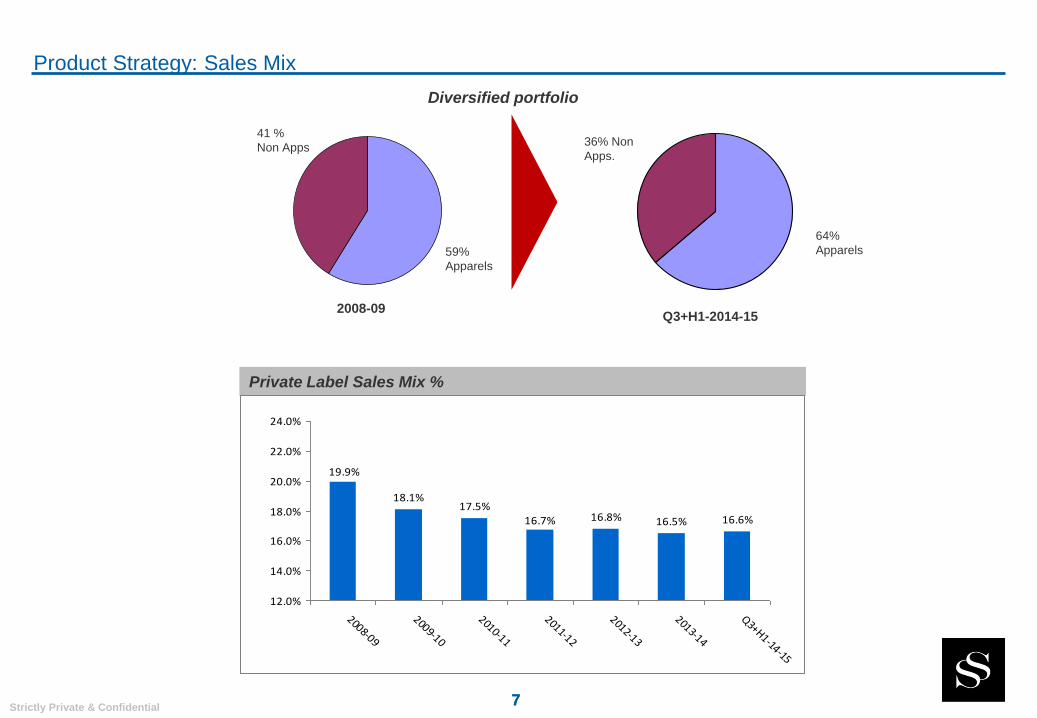
Product Strategy: Sales Mix
7
Q3+H1-2014-152008-09
41 %
Non Apps36% Non
Apps.
64%
Apparels59%
Apparels
Diversified portfolio
Private Label Sales Mix %
18.1%17.5%
16.8% 16.5% 16.6%
19.9%
16.7%
12.0%
14.0%
16.0%
18.0%
20.0%
22.0%
24.0%
2008-09
2009-10
2010-11
2011-12
2012-13
2013-14
Q3+H1-14-15
Strictly Private & Confidential8
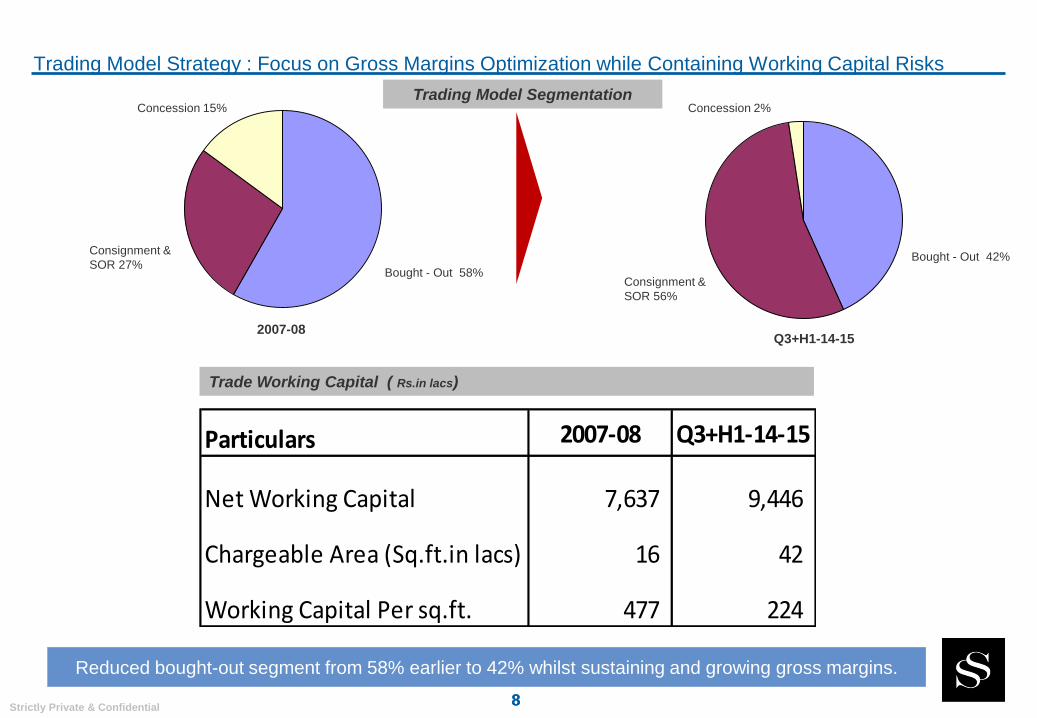
Trading Model Strategy : Focus on Gross Margins Optimization while Containing Working Capital Risks
8
Trading Model SegmentationConcession 15%
Consignment &
SOR 27%Bought - Out 58%
Concession 2%
Consignment &
SOR 56%
Bought - Out 42%
2007-08Q3+H1-14-15
Reduced bought-out segment from 58% earlier to 42% whilst sustaining and growing gross margins.
Trade Working Capital ( Rs.in lacs)
Particulars 2007-08 Q3+H1-14-15
Net Working Capital 7,637 9,446
Chargeable Area (Sq.ft.in lacs) 16 42
Working Capital Per sq.ft. 477 224
Strictly Private & Confidential9
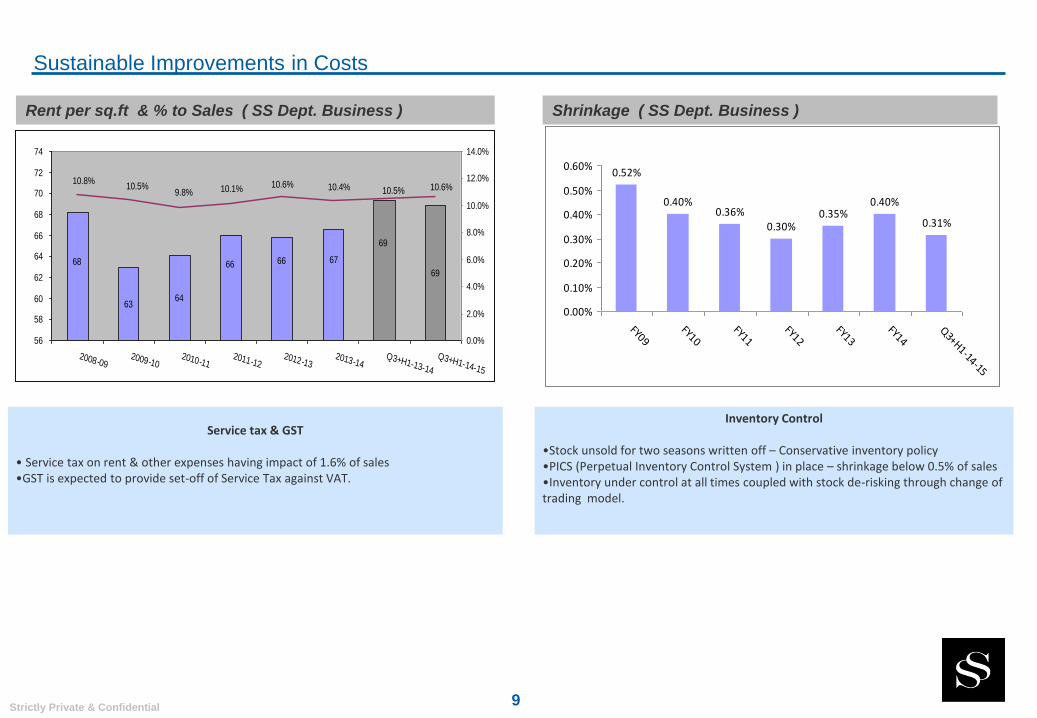
Sustainable Improvements in Costs
Rent per sq.ft & % to Sales ( SS Dept. Business )
Service tax & GST
• Service tax on rent & other expenses having impact of 1.6% of sales•GST is expected to provide set-off of Service Tax against VAT.
Inventory Control
•Stock unsold for two seasons written off – Conservative inventory policy•PICS (Perpetual Inventory Control System ) in place – shrinkage below 0.5% of sales•Inventory under control at all times coupled with stock de-risking through change of trading model.
Shrinkage ( SS Dept. Business )
63
69
68
64
66 66 67
69
10.8%10.5%
9.8% 10.1% 10.6% 10.4% 10.5% 10.6%
56
58
60
62
64
66
68
70
72
74
2008-092009-10
2010-112011-12
2012-132013-14
Q3+H1-13-14
Q3+H1-14-15
0.0%
2.0%
4.0%
6.0%
8.0%
10.0%
12.0%
14.0%
0.52%
0.40%0.36%
0.30%0.35%
0.40%
0.31%
0.00%
0.10%
0.20%
0.30%
0.40%
0.50%
0.60%
FY09FY10
FY11FY12
FY13FY14
Q3+H1-14-15
Strictly Private & Confidential10
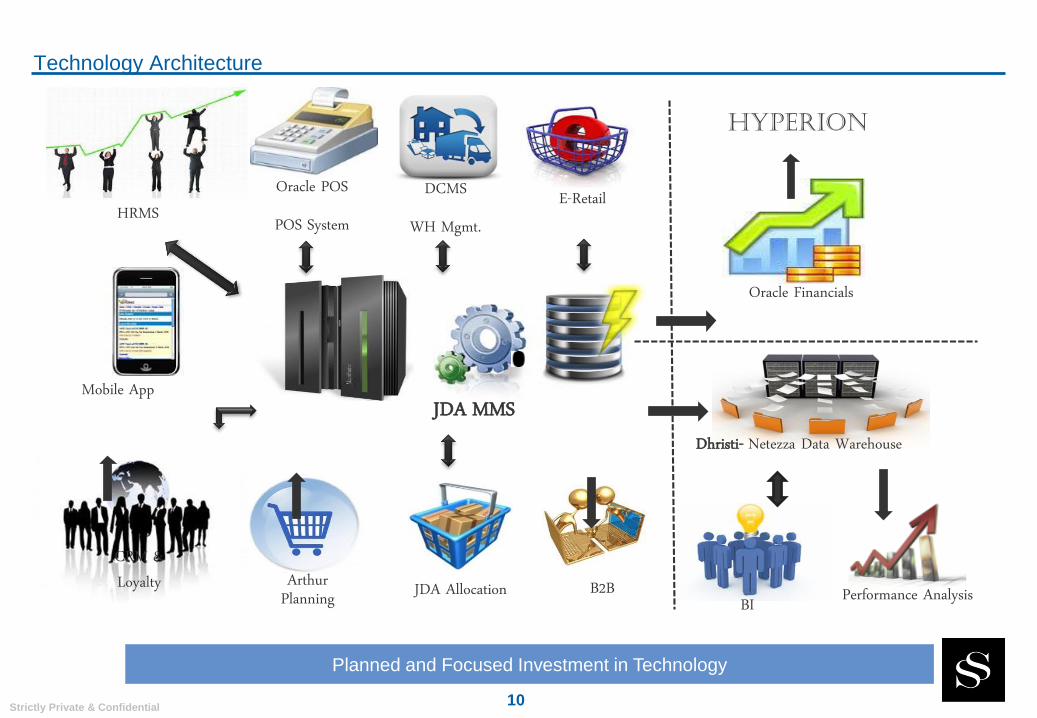
Performance Analysis
Oracle Financials
E-Retail
BIJDA Allocation
Mobile App
HRMSDCMS
WH Mgmt.
Oracle POS
POS System
Arthur Planning B2B
JDA MMS
CRM & Loyalty
Technology Architecture
Dhristi- Netezza Data Warehouse
Planned and Focused Investment in Technology
Hyperion
Strictly Private & Confidential11
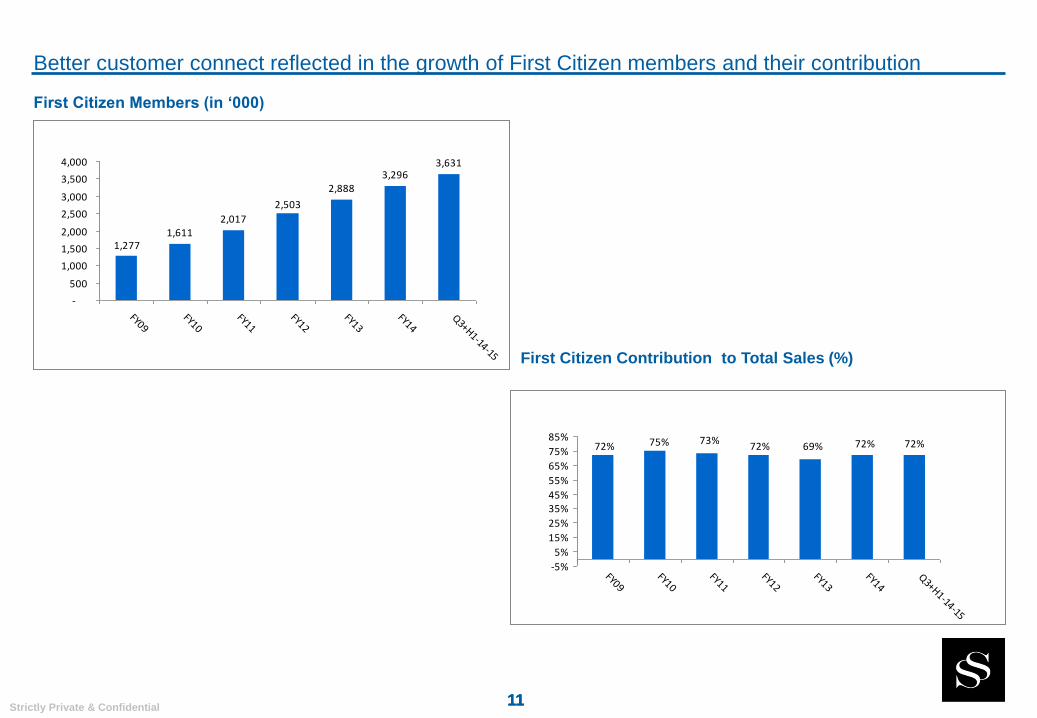
Better customer connect reflected in the growth of First Citizen members and their contribution
11
First Citizen Members (in ‘000)
First Citizen Contribution to Total Sales (%)
11
1,6112,017
2,8883,296
3,631
1,277
2,503
-
500
1,000
1,500
2,000
2,500
3,000
3,500
4,000
FY09FY10
FY11FY12
FY13FY14
Q3+H1-14-15
72%72% 75% 73%72% 69% 72%
-5%
5%
15%
25%
35%45%
55%
65%
75%
85%
FY09FY10
FY11FY12
FY13FY14
Q3+H1-14-15
Strictly Private & Confidential
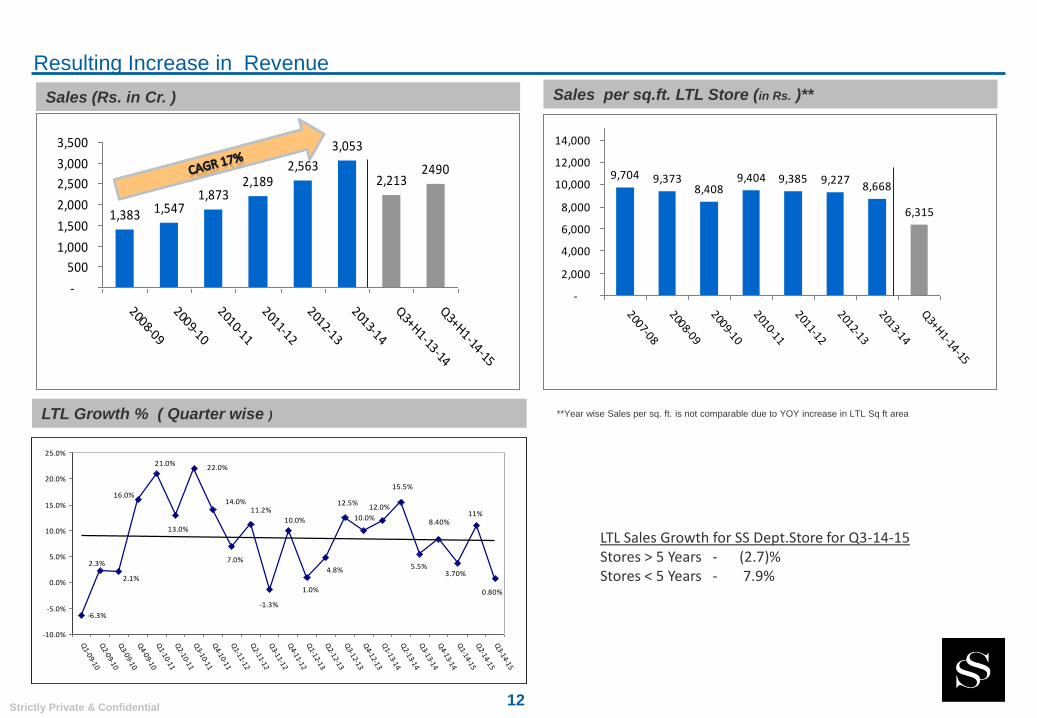
9,704 9,3738,408
9,404 9,385 9,2278,668
6,315
-
2,000
4,000
6,000
8,000
10,000
12,000
14,000
2007-08
2008-09
2009-10
2010-11
2011-12
2012-13
2013-14
Q3+H1-14-15
1,383 1,5471,873
2,1892,563
3,053
2,2132490
-
500
1,000
1,500
2,000
2,500
3,000
3,500
2008-09
2009-10
2010-11
2011-12
2012-13
2013-14
Q3+H1-13-14
Q3+H1-14-15
12
Resulting Increase in Revenue
Sales (Rs. in Cr. )
LTL Growth % ( Quarter wise )
LTL Sales Growth for SS Dept.Store for Q3-14-15Stores > 5 Years - (2.7)%Stores < 5 Years - 7.9%
Sales per sq.ft. LTL Store (in Rs. )**
**Year wise Sales per sq. ft. is not comparable due to YOY increase in LTL Sq ft area
-6.3%
0.80%
11%
2.3%
2.1%
16.0%
21.0%
13.0%
22.0%
14.0%
7.0%
11.2%
-1.3%
10.0%
1.0%
4.8%
12.5%
10.0%
12.0%
15.5%
5.5%
8.40%
3.70%
-10.0%
-5.0%
0.0%
5.0%
10.0%
15.0%
20.0%
25.0%
Q1-09-10
Q2-09-10
Q3-09-10
Q4-09-10
Q1-10-11
Q2-10-11
Q3-10-11
Q4-10-11
Q1-11-12
Q2-11-12
Q3-11-12
Q4-11-12
Q1-12-13
Q2-12-13
Q3-12-13
Q4-12-13
Q1-13-14
Q2-13-14
Q3-13-14
Q4-13-14
Q1-14-15
Q2-14-15
Q3-14-15
Strictly Private & Confidential
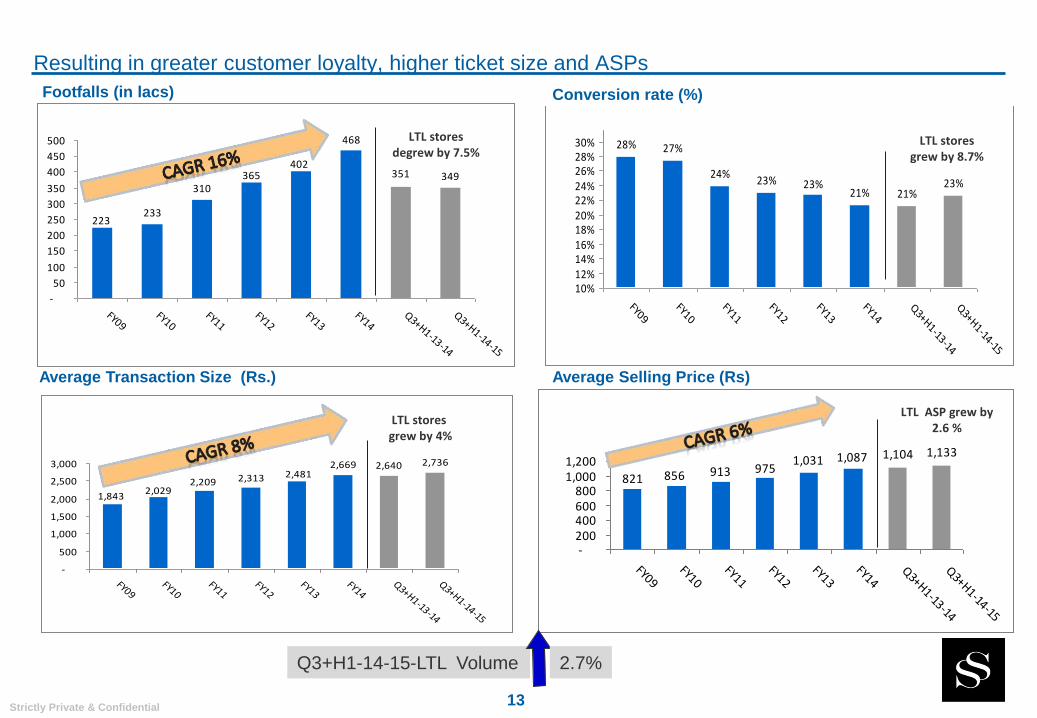
1,104 1,133
821 856 913 9751,031 1,087
-200400600800
1,0001,200
FY09FY10
FY11FY12
FY13FY14
Q3+H1-13-14
Q3+H1-14-15
2,669 2,640 2,736
1,8432,029
2,209 2,313 2,481
-
500
1,000
1,500
2,000
2,500
3,000
FY09FY10
FY11FY12
FY13FY14
Q3+H1-13-14
Q3+H1-14-15
28% 27%
24%23%
21% 21%23%23%
10%12%14%16%18%20%22%24%26%28%30%
FY09FY10
FY11FY12
FY13FY14
Q3+H1-13-14
Q3+H1-14-15
233
310349
223
365402
468
351
-
50
100
150
200
250
300
350
400
450
500
FY09FY10
FY11FY12
FY13FY14
Q3+H1-13-14
Q3+H1-14-15
13
Resulting in greater customer loyalty, higher ticket size and ASPs
Footfalls (in lacs) Conversion rate (%)
Average Selling Price (Rs)Average Transaction Size (Rs.)
Q3+H1-14-15-LTL Volume 2.7%
LTL storesdegrew by 7.5%
LTL storesgrew by 8.7%
LTL storesgrew by 4%
LTL ASP grew by 2.6 %
Strictly Private & Confidential14
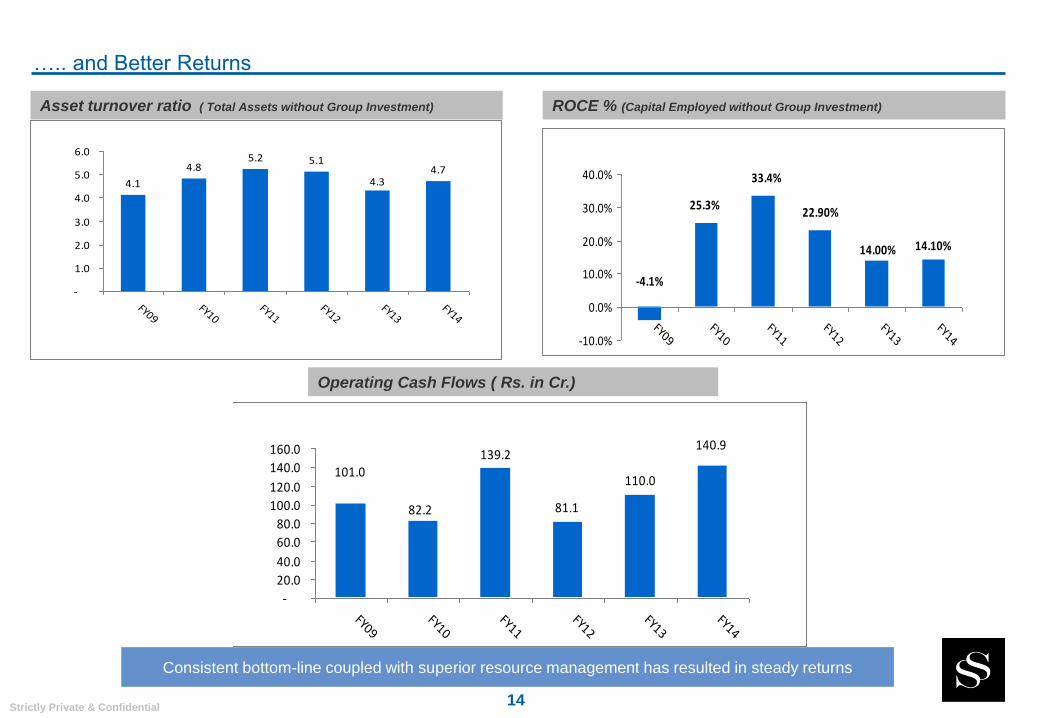
….. and Better Returns
Asset turnover ratio ( Total Assets without Group Investment)
Operating Cash Flows ( Rs. in Cr.)
ROCE % (Capital Employed without Group Investment)
Consistent bottom-line coupled with superior resource management has resulted in steady returns
4.1
4.85.2
4.75.1
4.3
-
1.0
2.0
3.0
4.0
5.0
6.0
FY09FY10
FY11FY12
FY13FY14
14.10%
-4.1%
25.3%
33.4%
22.90%
14.00%
-10.0%
0.0%
10.0%
20.0%
30.0%
40.0%
FY09FY10
FY11FY12
FY13FY14
81.1
110.0101.0
82.2
139.2140.9
-
20.0
40.0
60.0
80.0
100.0
120.0
140.0
160.0
FY09FY10
FY11FY12
FY13FY14
Strictly Private & Confidential15
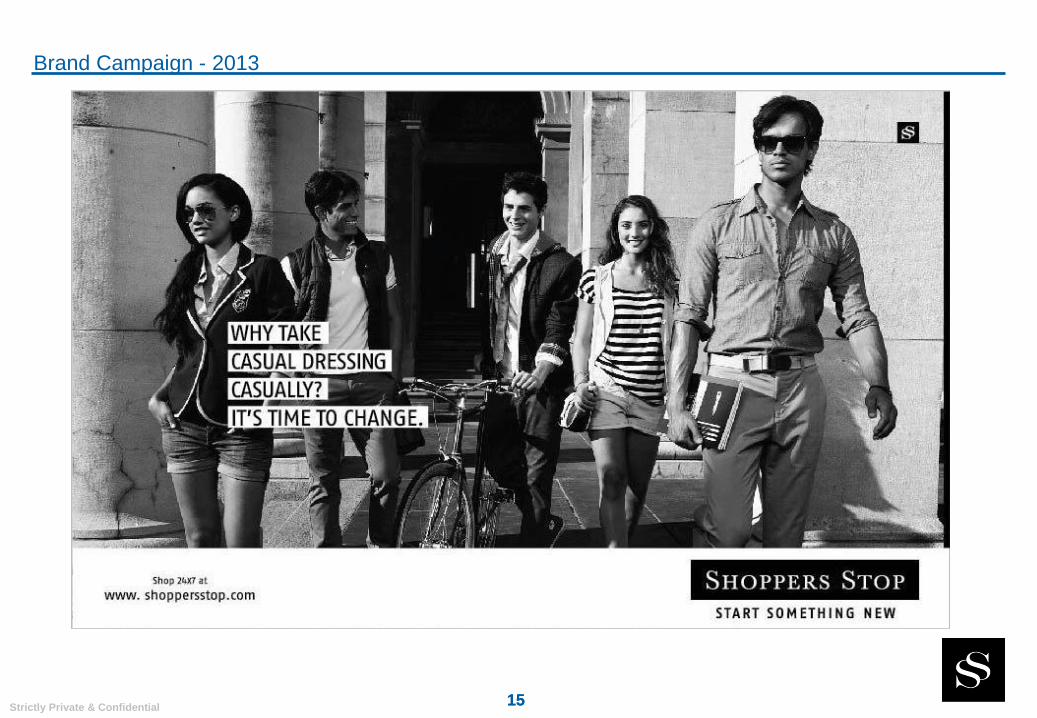
Brand Campaign - 2013
15
Strictly Private & Confidential16
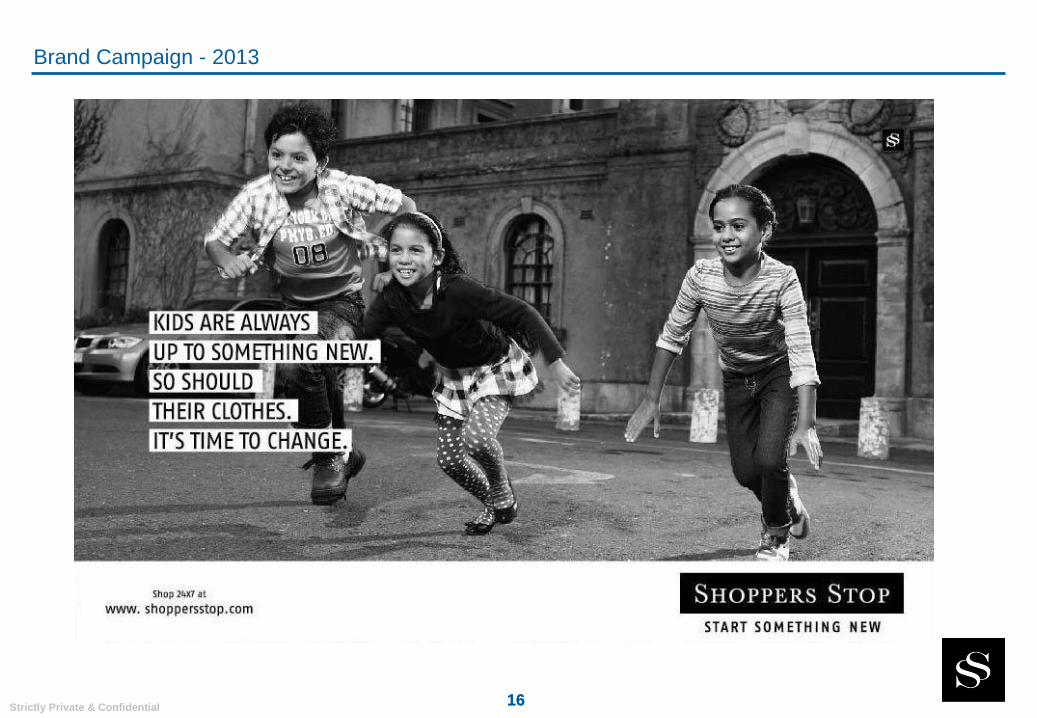
Brand Campaign - 2013
16

Strictly Private & Confidential17
Exclusive Label Campaign - 2013

Strictly Private & Confidential18
Exclusive Label Campaign - 2013
Strictly Private & Confidential19
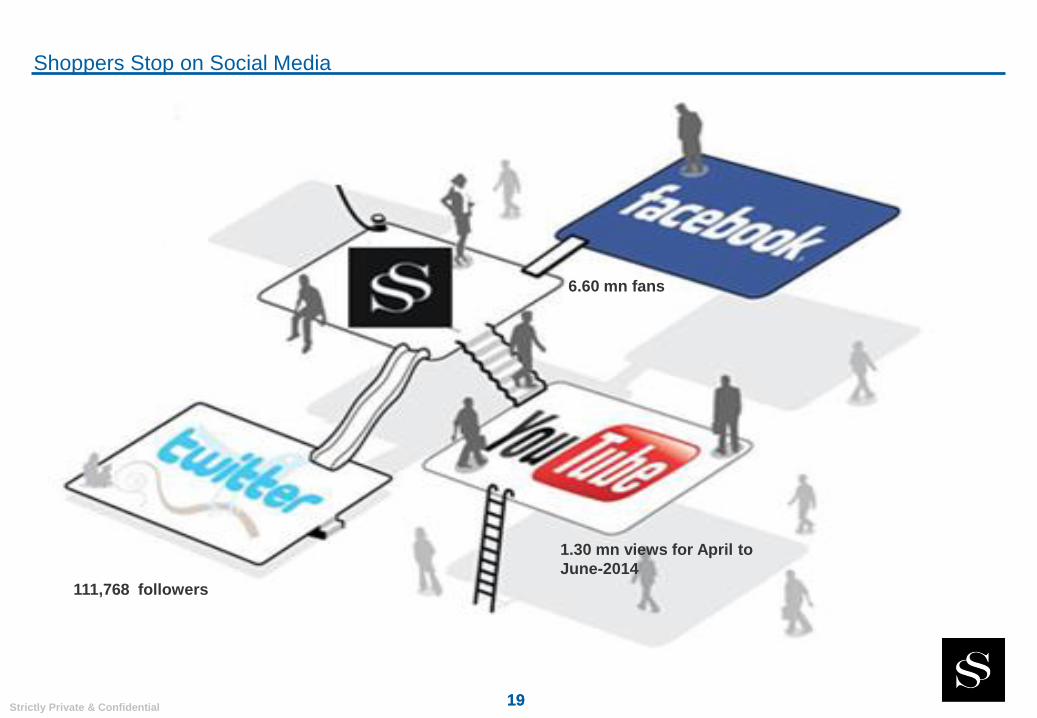
Shoppers Stop on Social Media
19
6.60 mn fans
1.30 mn views for April to
June-2014
111,768 followers
Strictly Private & Confidential20
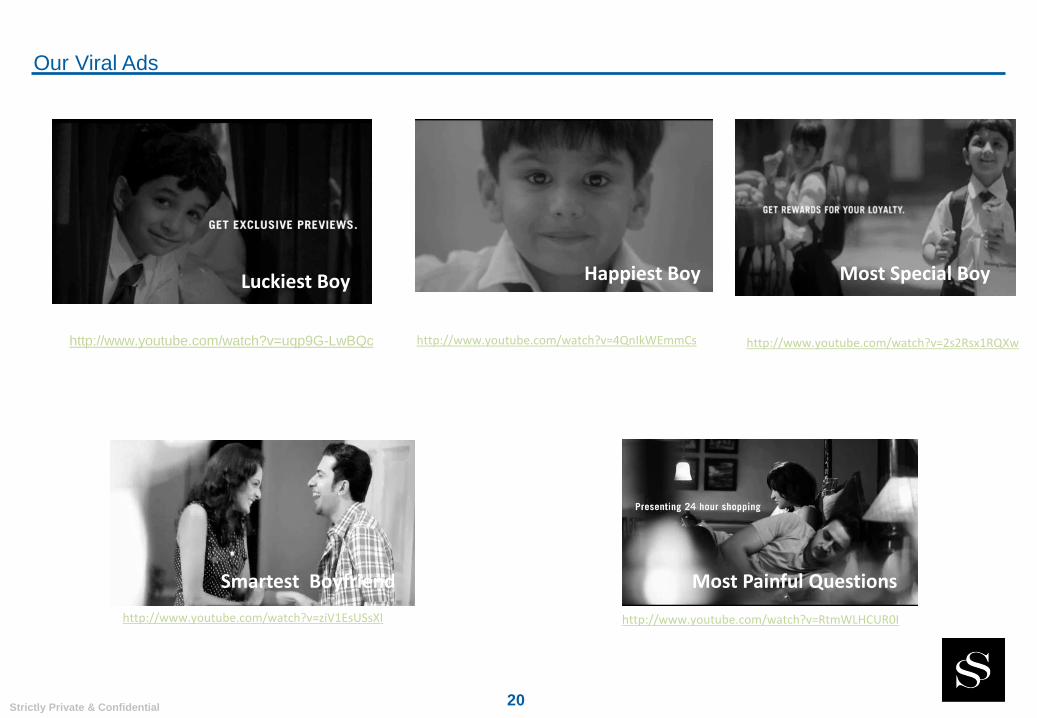
Luckiest Boy Happiest Boy Most Special Boy
Smartest Boyfriend Most Painful Questions
http://www.youtube.com/watch?v=RtmWLHCUR0Ihttp://www.youtube.com/watch?v=ziV1EsUSsXI
http://www.youtube.com/watch?v=uqp9G-LwBQc http://www.youtube.com/watch?v=4QnIkWEmmCs http://www.youtube.com/watch?v=2s2Rsx1RQXw
Our Viral Ads
Strictly Private & Confidential2121
Customer Satisfaction Index (CSI) Associate Satisfaction Index (ASI) (on scale of 5)
Partner Satisfaction Index (PSI) (on scale of 5)
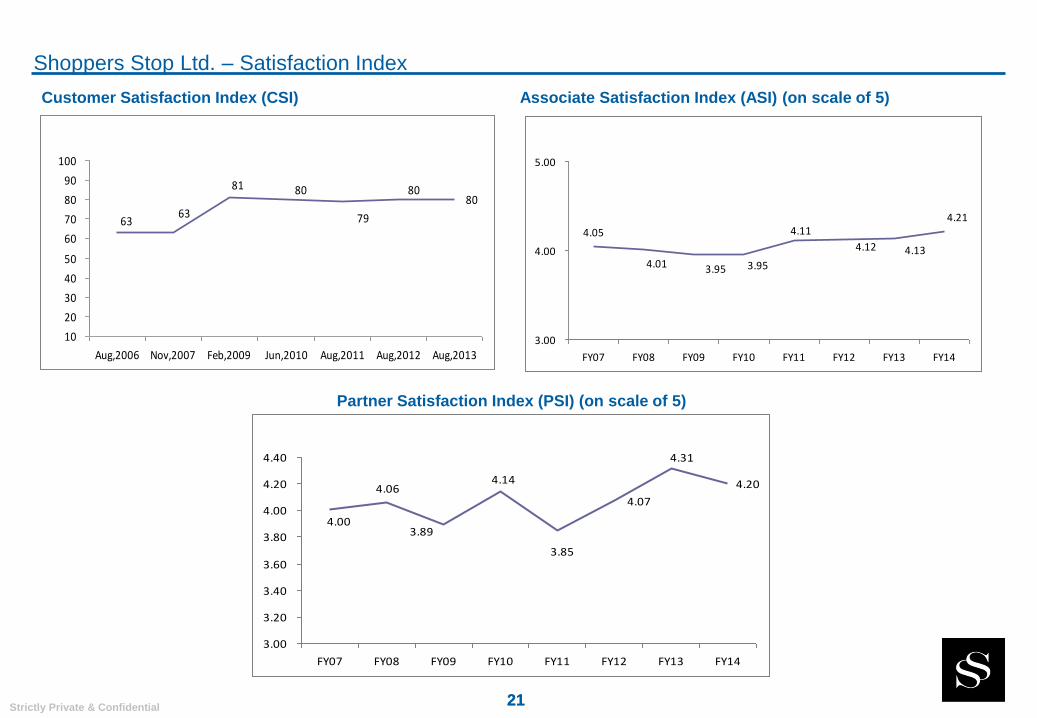
Shoppers Stop Ltd. – Satisfaction Index
80
6363
81 80
79
80
10
20
30
40
50
60
70
80
90
100
Aug,2006 Nov,2007 Feb,2009 Jun,2010 Aug,2011 Aug,2012 Aug,2013
4.21
4.13
4.05
4.01 3.95 3.95
4.11
4.12
3.00
4.00
5.00
FY07 FY08 FY09 FY10 FY11 FY12 FY13 FY14
4.07
4.20
4.31
4.00
4.06
3.89
4.14
3.85
3.00
3.20
3.40
3.60
3.80
4.00
4.20
4.40
FY07 FY08 FY09 FY10 FY11 FY12 FY13 FY14
Strictly Private & Confidential22
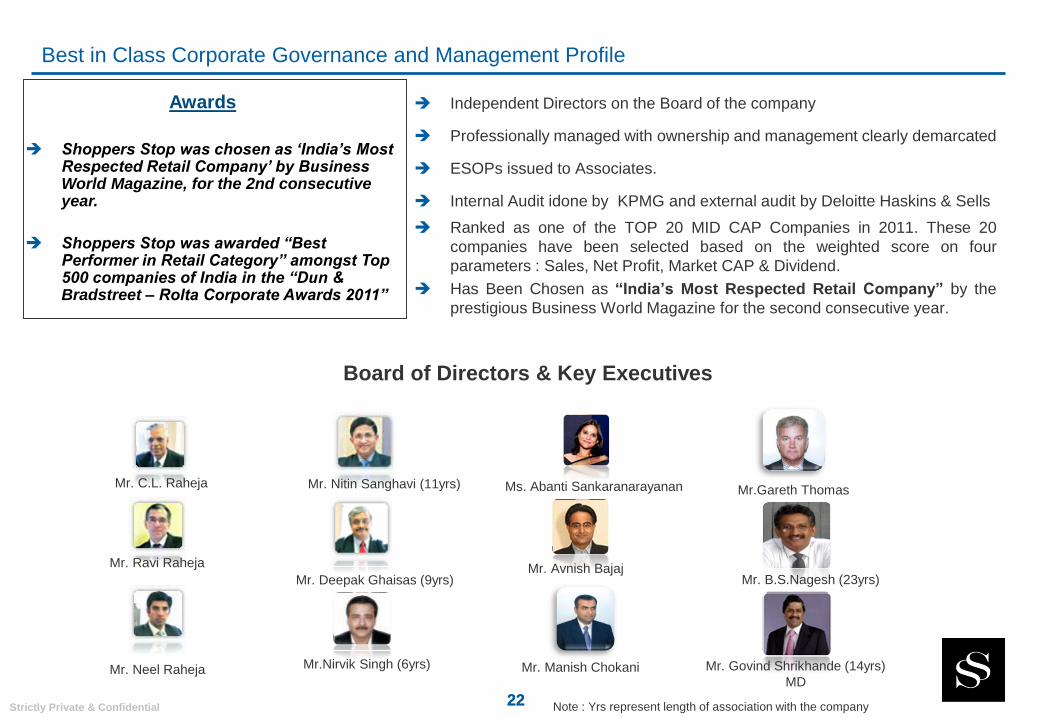
Best in Class Corporate Governance and Management Profile
22
Independent Directors on the Board of the company
Professionally managed with ownership and management clearly demarcated
ESOPs issued to Associates.
Internal Audit idone by KPMG and external audit by Deloitte Haskins & Sells
Ranked as one of the TOP 20 MID CAP Companies in 2011. These 20
companies have been selected based on the weighted score on four
parameters : Sales, Net Profit, Market CAP & Dividend.
Has Been Chosen as “India’s Most Respected Retail Company” by the
prestigious Business World Magazine for the second consecutive year.
Board of Directors & Key Executives
Mr. Deepak Ghaisas (9yrs)
Mr. Nitin Sanghavi (11yrs)
Mr.Nirvik Singh (6yrs)
Mr. C.L. Raheja
Mr. Neel Raheja
Mr. Ravi Raheja
Mr. B.S.Nagesh (23yrs)
Mr. Govind Shrikhande (14yrs)
MD
Note : Yrs represent length of association with the company
Mr. Avnish Bajaj
Awards
Shoppers Stop was chosen as ‘India’s Most Respected Retail Company’ by Business World Magazine, for the 2nd consecutive year.
Shoppers Stop was awarded “Best Performer in Retail Category” amongst Top 500 companies of India in the “Dun & Bradstreet – Rolta Corporate Awards 2011”
Ms. Abanti Sankaranarayanan
Mr. Manish Chokani
Mr.Gareth Thomas
Strictly Private & Confidential23
Corporate Social Responsibility
23
Giving Back to Society
‘Shoppers Stop’ , over the years , has contributed in its own way to make the Planet a
better place .
In our continuing endeavor to contribute to society , one of the novel practices that we have
adapted across all stores, is to celebrate the ‘ Store Birthday ‘ with the ‘Underprivileged ‘
within the store catchment .
Birthday celebrations earlier was all about fun time at the stores . Now the celebration has
moved outside the store : at Old Age homes, at Homes for the abandoned Girl Child, Home
for Destitute’ s & so on .
The Store team does its own bit by spending the day with this cross-section: touching
their lives, celebrating with them & being a part of their life .
This engagement continues & is not a one day affair : the team is in continuous touch with
these institutes & keep contributing in its own way.
A glimpse into some of the initiatives .
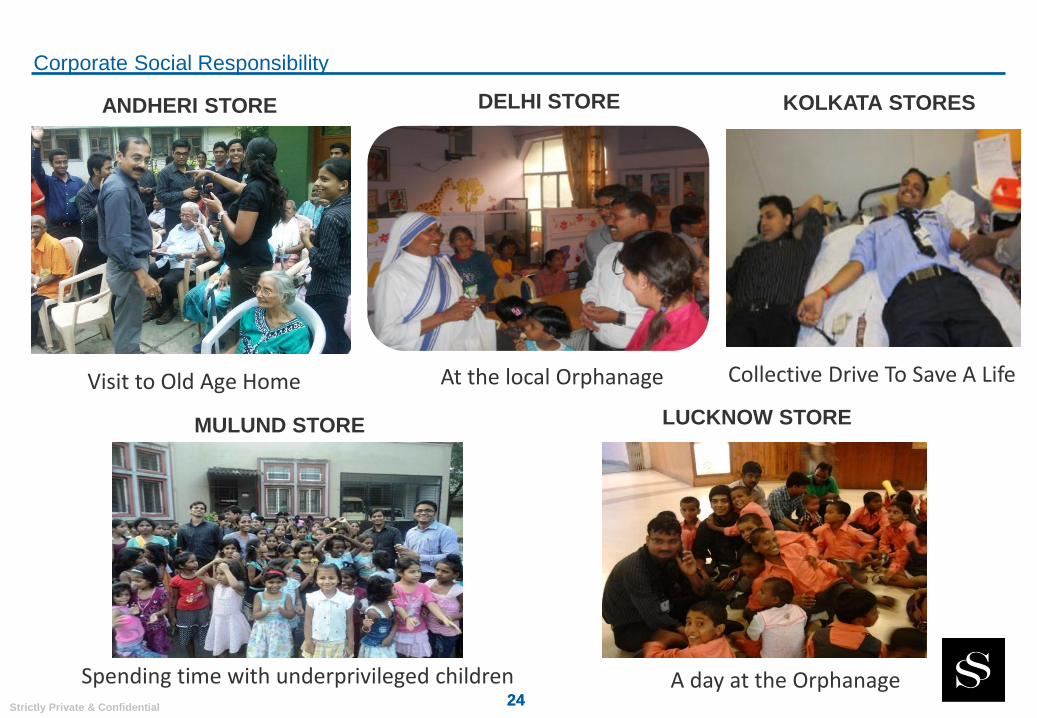
Strictly Private & Confidential24
Corporate Social Responsibility
24
ANDHERI STORE
Collective Drive To Save A Life
KOLKATA STORES
Visit to Old Age Home At the local Orphanage
DELHI STORE
Spending time with underprivileged children
MULUND STORE LUCKNOW STORE
A day at the Orphanage
Strictly Private & Confidential25
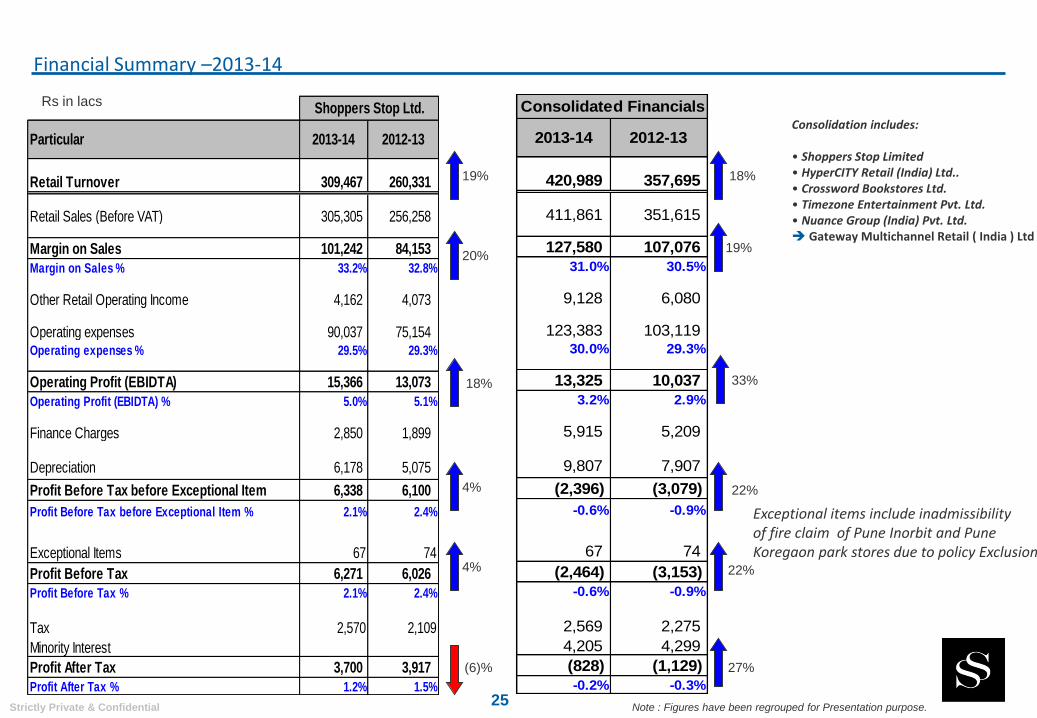
Financial Summary –2013-14
19%
Rs in lacs
Consolidation includes:
• Shoppers Stop Limited• HyperCITY Retail (India) Ltd..• Crossword Bookstores Ltd.• Timezone Entertainment Pvt. Ltd.• Nuance Group (India) Pvt. Ltd. Gateway Multichannel Retail ( India ) Ltd
Note : Figures have been regrouped for Presentation purpose.
20%
18%
4%
4%
(6)%
18%
19%
33%
22%
22%
27%
Particular 2013-14 2012-13
Retail Turnover 309,467 260,331
Retail Sales (Before VAT) 305,305 256,258
Margin on Sales 101,242 84,153
Margin on Sales % 33.2% 32.8%
Other Retail Operating Income 4,162 4,073
Operating expenses 90,037 75,154 Operating expenses % 29.5% 29.3%
Operating Profit (EBIDTA) 15,366 13,073
Operating Profit (EBIDTA) % 5.0% 5.1%
Finance Charges 2,850 1,899
Depreciation 6,178 5,075
Profit Before Tax before Exceptional Item 6,338 6,100
Profit Before Tax before Exceptional Item % 2.1% 2.4%
Exceptional Items 67 74
Profit Before Tax 6,271 6,026
Profit Before Tax % 2.1% 2.4%
Tax 2,570 2,109
Minority Interest
Profit After Tax 3,700 3,917
Profit After Tax % 1.2% 1.5%
Shoppers Stop Ltd.
2013-14 2012-13
420,989 357,695
411,861 351,615
127,580 107,076
31.0% 30.5%
9,128 6,080
123,383 103,119 30.0% 29.3%
13,325 10,037
3.2% 2.9%
5,915 5,209
9,807 7,907
(2,396) (3,079)
-0.6% -0.9%
67 74
(2,464) (3,153)
-0.6% -0.9%
2,569 2,275
4,205 4,299
(828) (1,129)
-0.2% -0.3%
Consolidated Financials
Exceptional items include inadmissibility of fire claim of Pune Inorbit and PuneKoregaon park stores due to policy Exclusion
Strictly Private & Confidential26
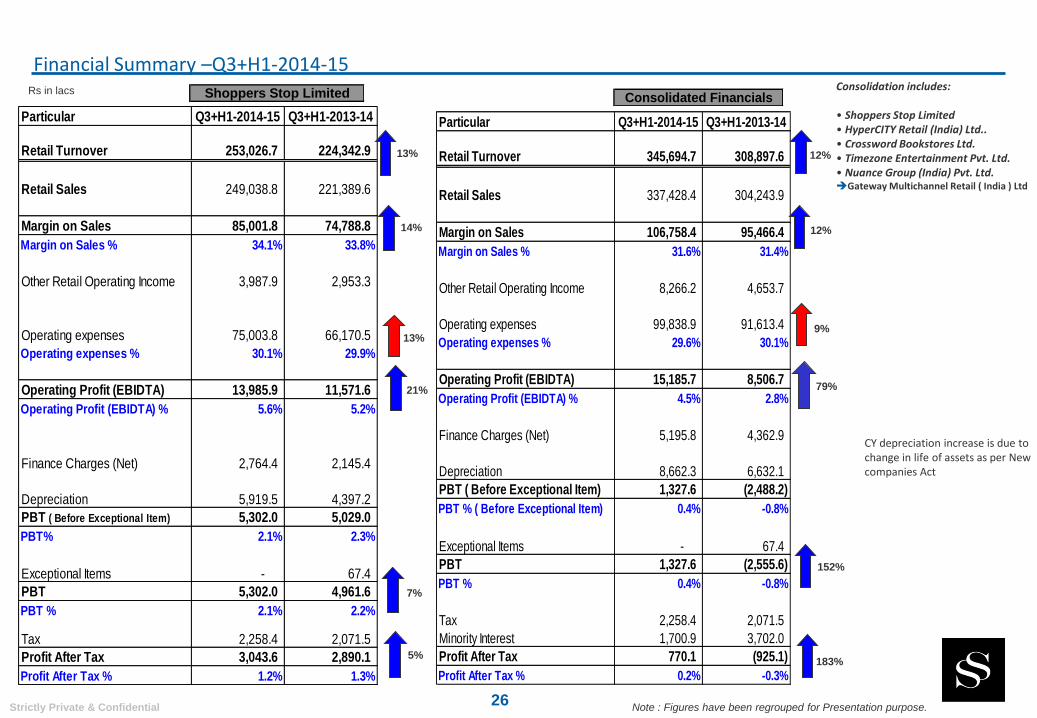
Financial Summary –Q3+H1-2014-15Rs in lacs Consolidation includes:
• Shoppers Stop Limited• HyperCITY Retail (India) Ltd..• Crossword Bookstores Ltd.• Timezone Entertainment Pvt. Ltd.• Nuance Group (India) Pvt. Ltd.Gateway Multichannel Retail ( India ) Ltd
Note : Figures have been regrouped for Presentation purpose.
CY depreciation increase is due to change in life of assets as per New companies Act
Shoppers Stop Limited Consolidated Financials
Particular Q3+H1-2014-15 Q3+H1-2013-14
Retail Turnover 253,026.7 224,342.9
Retail Sales 249,038.8 221,389.6
Margin on Sales 85,001.8 74,788.8
Margin on Sales % 34.1% 33.8%
Other Retail Operating Income 3,987.9 2,953.3
Operating expenses 75,003.8 66,170.5
Operating expenses % 30.1% 29.9%
Operating Profit (EBIDTA) 13,985.9 11,571.6
Operating Profit (EBIDTA) % 5.6% 5.2%
Finance Charges (Net) 2,764.4 2,145.4
Depreciation 5,919.5 4,397.2
PBT ( Before Exceptional Item) 5,302.0 5,029.0
PBT% 2.1% 2.3%
Exceptional Items - 67.4
PBT 5,302.0 4,961.6
PBT % 2.1% 2.2%
Tax 2,258.4 2,071.5
Profit After Tax 3,043.6 2,890.1
Profit After Tax % 1.2% 1.3%
13%
14%
7%
5%
13%
21%
Particular Q3+H1-2014-15 Q3+H1-2013-14
Retail Turnover 345,694.7 308,897.6
Retail Sales 337,428.4 304,243.9
Margin on Sales 106,758.4 95,466.4
Margin on Sales % 31.6% 31.4%
Other Retail Operating Income 8,266.2 4,653.7
Operating expenses 99,838.9 91,613.4
Operating expenses % 29.6% 30.1%
Operating Profit (EBIDTA) 15,185.7 8,506.7
Operating Profit (EBIDTA) % 4.5% 2.8%
Finance Charges (Net) 5,195.8 4,362.9
Depreciation 8,662.3 6,632.1
PBT ( Before Exceptional Item) 1,327.6 (2,488.2)
PBT % ( Before Exceptional Item) 0.4% -0.8%
Exceptional Items - 67.4
PBT 1,327.6 (2,555.6)
PBT % 0.4% -0.8%
Tax 2,258.4 2,071.5
Minority Interest 1,700.9 3,702.0
Profit After Tax 770.1 (925.1)
Profit After Tax % 0.2% -0.3%
12%
79%
12%
9%
183%
152%
Strictly Private & Confidential27
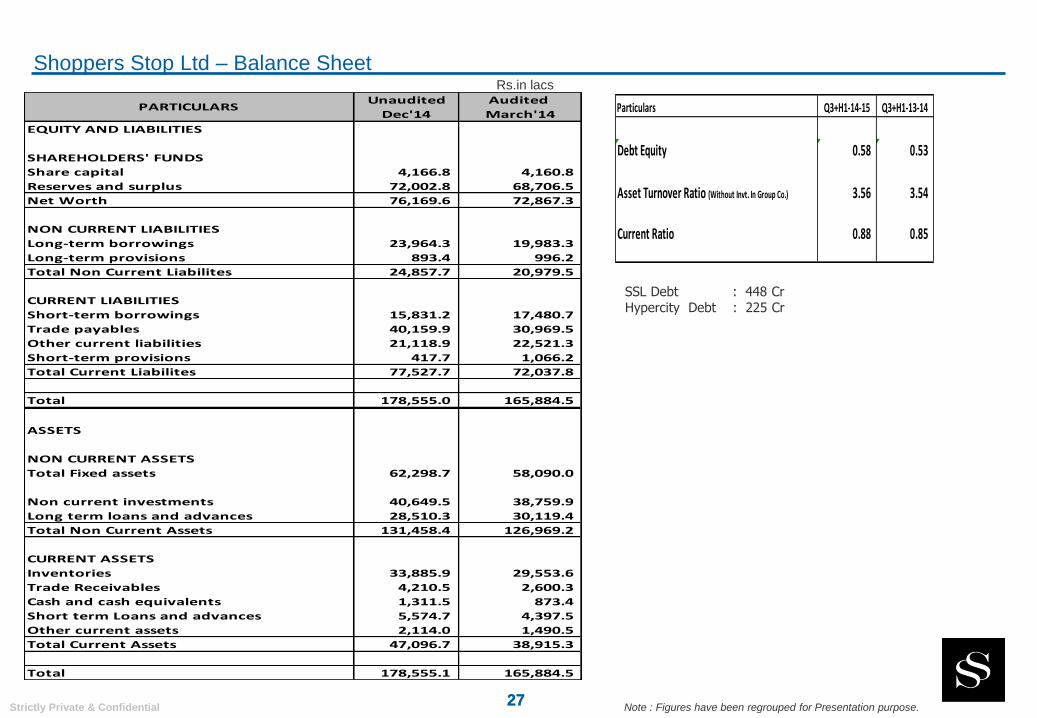
Shoppers Stop Ltd – Balance Sheet
27
Rs.in lacs
Note : Figures have been regrouped for Presentation purpose.
Unaudited Audited
Dec'14 March'14
EQUITY AND LIABILITIES
SHAREHOLDERS' FUNDS
Share capital 4,166.8 4,160.8
Reserves and surplus 72,002.8 68,706.5
Net Worth 76,169.6 72,867.3
NON CURRENT LIABILITIES
Long-term borrowings 23,964.3 19,983.3
Long-term provisions 893.4 996.2
Total Non Current Liabilites 24,857.7 20,979.5
CURRENT LIABILITIES
Short-term borrowings 15,831.2 17,480.7
Trade payables 40,159.9 30,969.5
Other current liabilities 21,118.9 22,521.3
Short-term provisions 417.7 1,066.2
Total Current Liabilites 77,527.7 72,037.8
Total 178,555.0 165,884.5
ASSETS
NON CURRENT ASSETS
Total Fixed assets 62,298.7 58,090.0
Non current investments 40,649.5 38,759.9
Long term loans and advances 28,510.3 30,119.4
Total Non Current Assets 131,458.4 126,969.2
CURRENT ASSETS
Inventories 33,885.9 29,553.6
Trade Receivables 4,210.5 2,600.3
Cash and cash equivalents 1,311.5 873.4
Short term Loans and advances 5,574.7 4,397.5
Other current assets 2,114.0 1,490.5
Total Current Assets 47,096.7 38,915.3
Total 178,555.1 165,884.5
PARTICULARS Particulars Q3+H1-14-15 Q3+H1-13-14
Debt Equity 0.58 0.53
Asset Turnover Ratio (Without Invt. In Group Co.) 3.56 3.54
Current Ratio 0.88 0.85
SSL Debt : 448 CrHypercity Debt : 225 Cr
Strictly Private & Confidential
60
73 7282
70
9197
130140
146
0
20
40
60
80
100
120
140
160
1,1711,602
1,8222,047
2,287
3,0943,394
3,9184,353
4,593
-
5001,000
1,5002,000
2,500
3,0003,500
4,0004,500
5,000
FY07FY08
FY09FY10
FY11FY12
FY13FY14
FY15 - Forecast
FY16 - Forecast
28
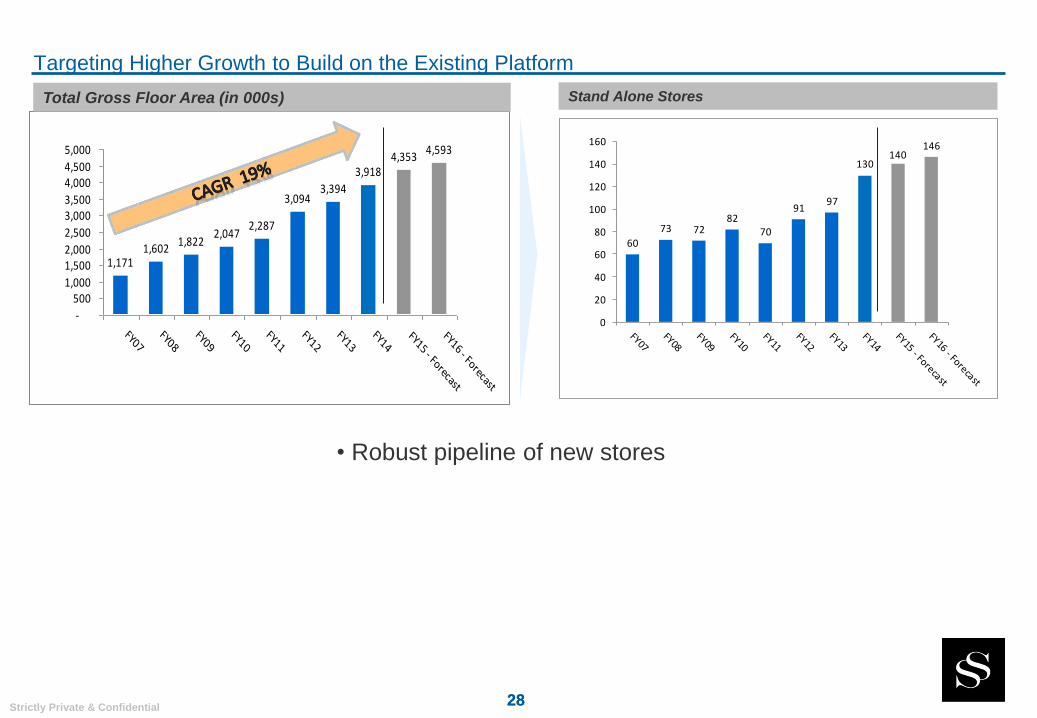
Targeting Higher Growth to Build on the Existing Platform
28
Total Gross Floor Area (in 000s) Stand Alone Stores
• Robust pipeline of new stores
Strictly Private & Confidential29
Strictly Private & Confidential
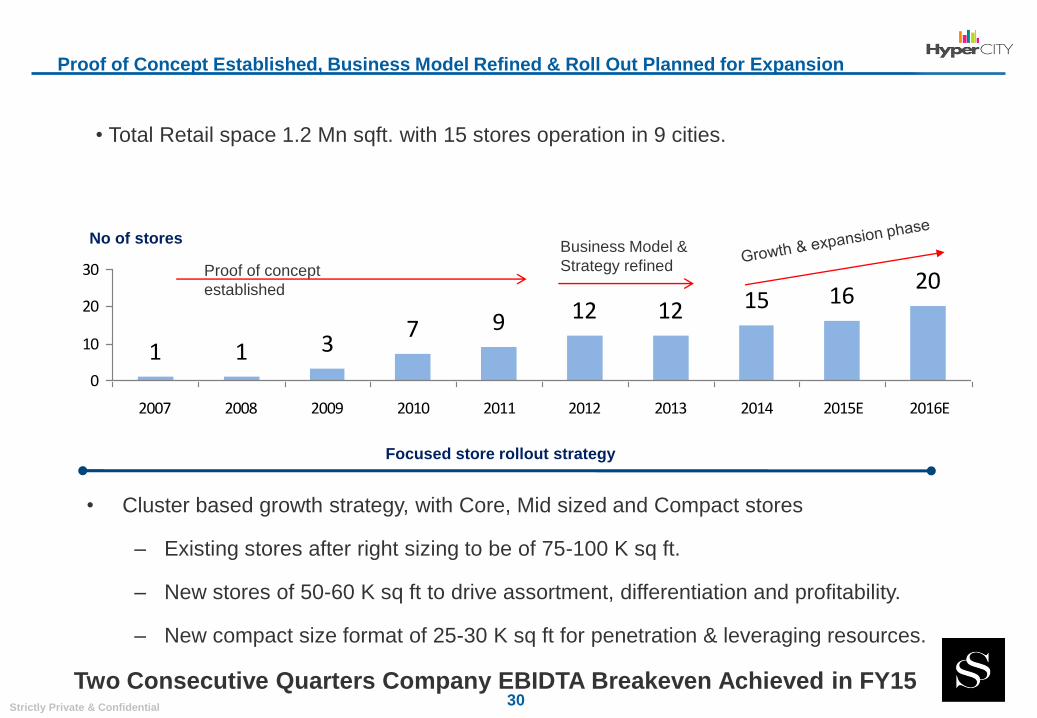
Proof of Concept Established, Business Model Refined & Roll Out Planned for Expansion
Focused store rollout strategy
• Total Retail space 1.2 Mn sqft. with 15 stores operation in 9 cities.
1 1 37 9 12 12 15 16
20
0
10
20
30
2007 2008 2009 2010 2011 2012 2013 2014 2015E 2016E
No of stores
Proof of concept
established
Two Consecutive Quarters Company EBIDTA Breakeven Achieved in FY15
Business Model &
Strategy refined
• Cluster based growth strategy, with Core, Mid sized and Compact stores
– Existing stores after right sizing to be of 75-100 K sq ft.
– New stores of 50-60 K sq ft to drive assortment, differentiation and profitability.
– New compact size format of 25-30 K sq ft for penetration & leveraging resources.
30
Strictly Private & Confidential
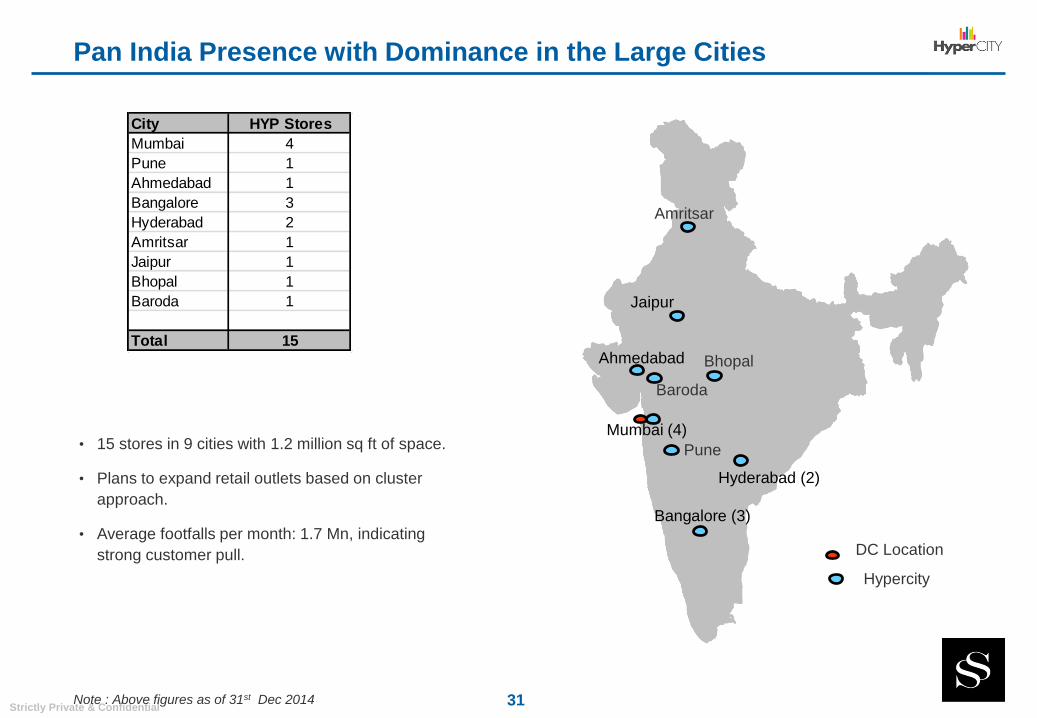
Pan India Presence with Dominance in the Large Cities
• 15 stores in 9 cities with 1.2 million sq ft of space.
• Plans to expand retail outlets based on cluster
approach.
• Average footfalls per month: 1.7 Mn, indicating
strong customer pull.
Jaipur
Mumbai (4)
Hyderabad (2)
Bangalore (3)
Pune
Ahmedabad
Amritsar
Hypercity
Bhopal
DC Location
Note : Above figures as of 31st Dec 2014
City HYP Stores
Mumbai 4
Pune 1
Ahmedabad 1
Bangalore 3
Hyderabad 2
Amritsar 1
Jaipur 1
Bhopal 1
Baroda 1
Total 15
Baroda
31
Strictly Private & Confidential
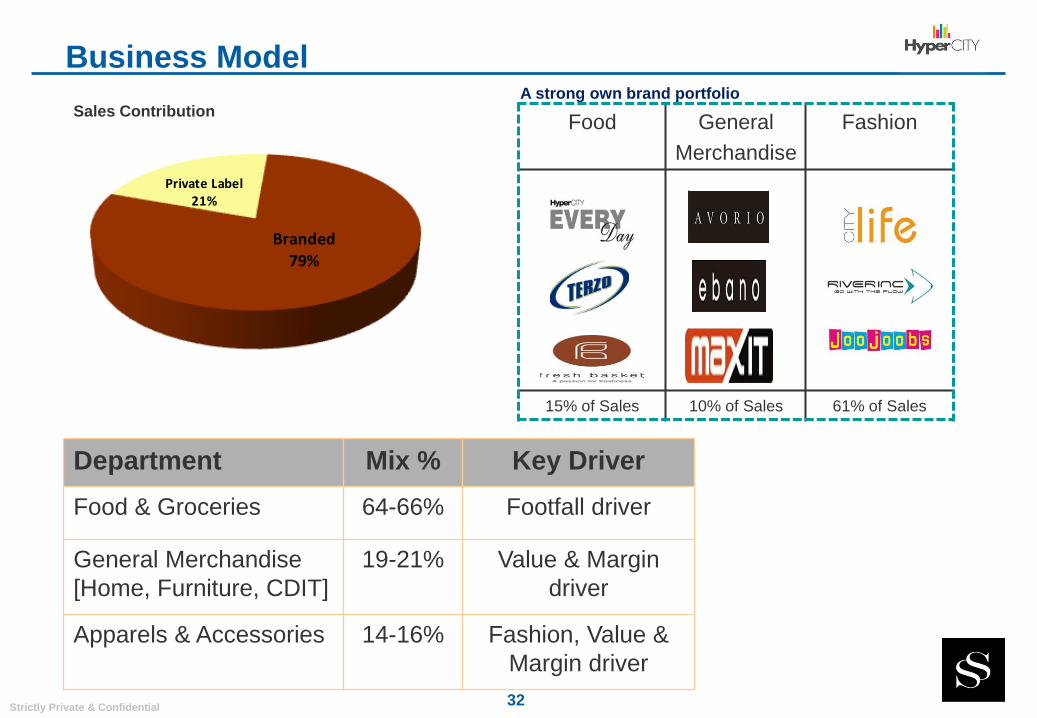
Branded 79%
Private Label 21%
Business Model
Department Mix % Key Driver
Food & Groceries 64-66% Footfall driver
General Merchandise
[Home, Furniture, CDIT]
19-21% Value & Margin
driver
Apparels & Accessories 14-16% Fashion, Value &
Margin driver
A strong own brand portfolio
Food General
Merchandise
Fashion
15% of Sales 10% of Sales 61% of Sales
Sales Contribution
32
Strictly Private & Confidential
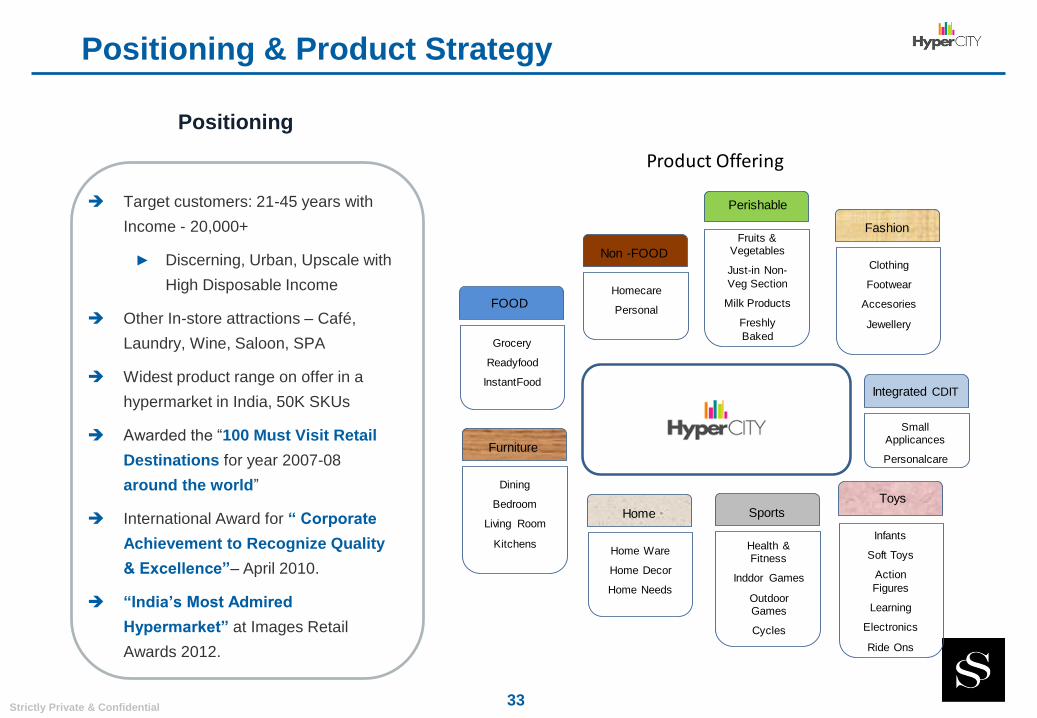
Positioning & Product Strategy
Target customers: 21-45 years with
Income - 20,000+
► Discerning, Urban, Upscale with
High Disposable Income
Other In-store attractions – Café,
Laundry, Wine, Saloon, SPA
Widest product range on offer in a
hypermarket in India, 50K SKUs
Awarded the “100 Must Visit Retail
Destinations for year 2007-08
around the world”
International Award for “ Corporate
Achievement to Recognize Quality
& Excellence”– April 2010.
“India’s Most Admired
Hypermarket” at Images Retail
Awards 2012.
Positioning
Product Offering
FOOD
Grocery
Readyfood
InstantFood
Non -FOOD
Homecare
Personal
Perishable
Fruits & Vegetables
Just-in Non-
Veg Section
Milk Products
Freshly
Baked
Integrated CDIT
SmallApplicances
Personalcare
Home
Home Ware
Home Decor
Home Needs
Furniture
Dining
Bedroom
Living Room
Kitchens
Sports
Health & Fitness
Inddor Games
Outdoor Games
Cycles
Toys
Infants
Soft Toys
Action
Figures
Learning
Electronics
Ride Ons
Fashion
Clothing
Footwear
Accesories
Jewellery
33
Strictly Private & Confidential
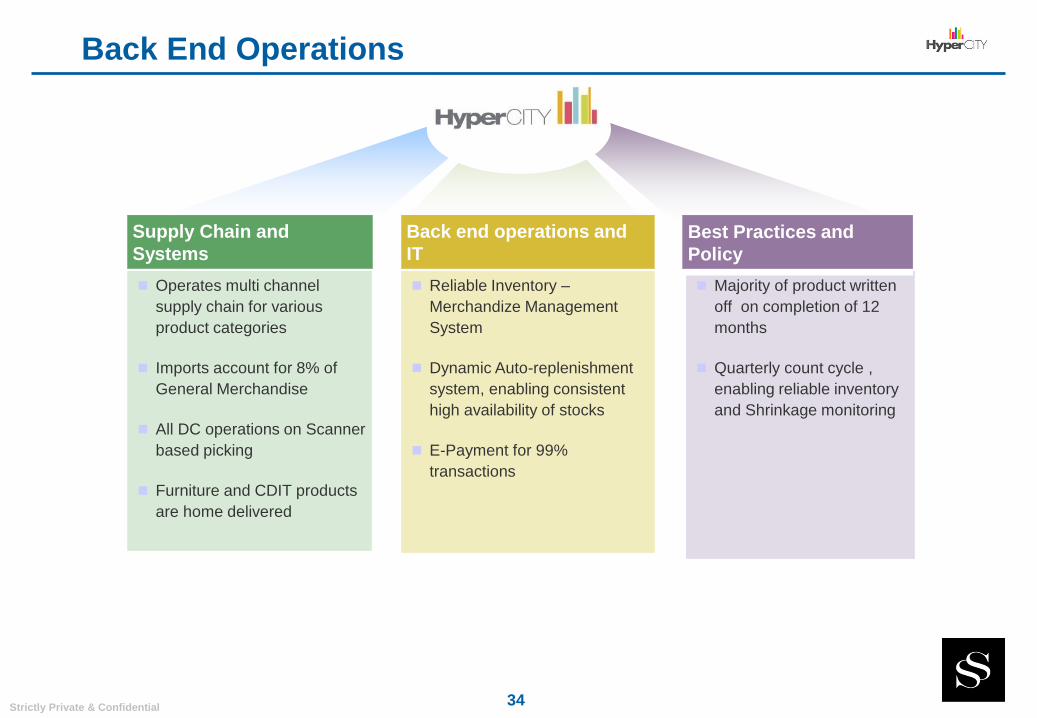
Back End Operations
Majority of product written
off on completion of 12
months
Quarterly count cycle ,
enabling reliable inventory
and Shrinkage monitoring
Supply Chain and
Systems
Back end operations and
IT
Best Practices and
Policy
Operates multi channel
supply chain for various
product categories
Imports account for 8% of
General Merchandise
All DC operations on Scanner
based picking
Furniture and CDIT products
are home delivered
Reliable Inventory –
Merchandize Management
System
Dynamic Auto-replenishment
system, enabling consistent
high availability of stocks
E-Payment for 99%
transactions
34
Strictly Private & Confidential
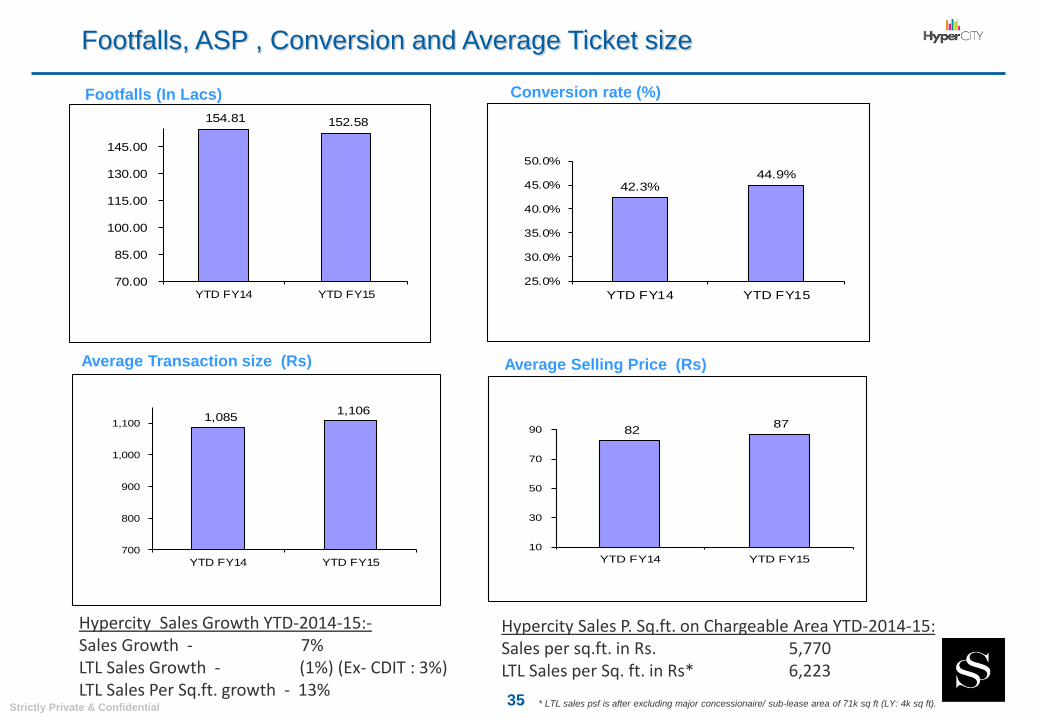
Footfalls, ASP , Conversion and Average Ticket size
Footfalls (In Lacs)
Average Selling Price (Rs)Average Transaction size (Rs)
Conversion rate (%)
Hypercity Sales Growth YTD-2014-15:-Sales Growth - 7% LTL Sales Growth - (1%) (Ex- CDIT : 3%)LTL Sales Per Sq.ft. growth - 13%
Hypercity Sales P. Sq.ft. on Chargeable Area YTD-2014-15:Sales per sq.ft. in Rs. 5,770LTL Sales per Sq. ft. in Rs* 6,223
• * LTL sales psf is after excluding major concessionaire/ sub-lease area of 71k sq ft (LY: 4k sq ft).
154.81 152.58
70.00
85.00
100.00
115.00
130.00
145.00
YTD FY14 YTD FY15
82 87
10
30
50
70
90
YTD FY14 YTD FY15
42.3%44.9%
25.0%
30.0%
35.0%
40.0%
45.0%
50.0%
YTD FY14 YTD FY15
1,085 1,106
700
800
900
1,000
1,100
YTD FY14 YTD FY15
35
Strictly Private & Confidential
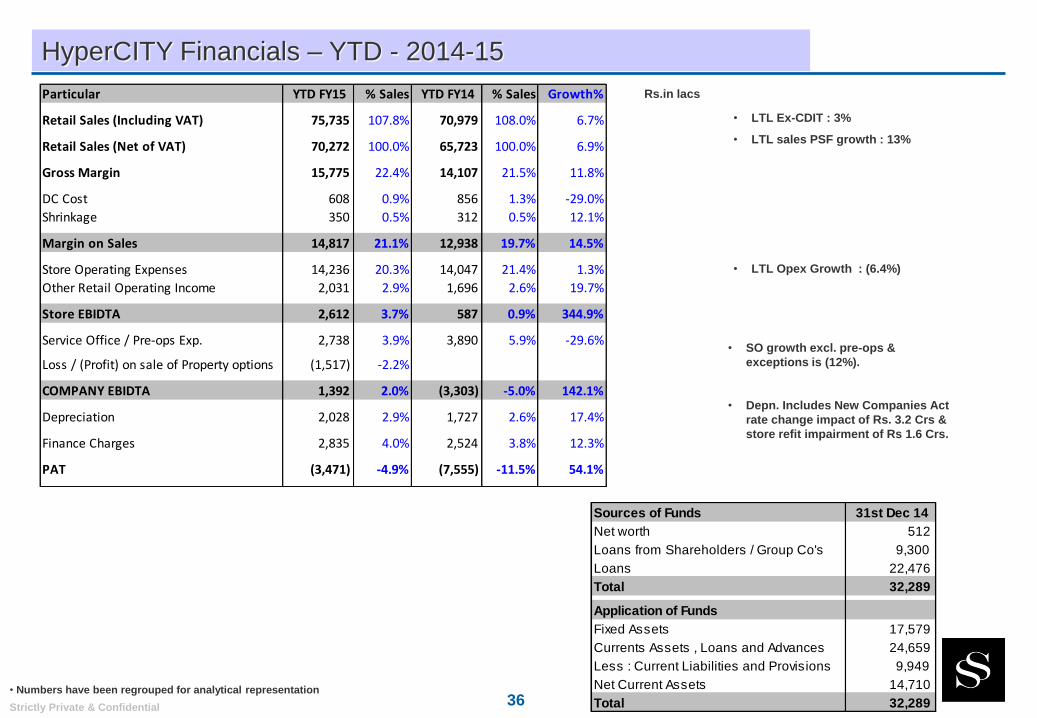
HyperCITY Financials – YTD - 2014-15
Rs.in lacs
• Numbers have been regrouped for analytical representation
Particular YTD FY15 % Sales YTD FY14 % Sales Growth%
Retail Sales (Including VAT) 75,735 107.8% 70,979 108.0% 6.7%
Retail Sales (Net of VAT) 70,272 100.0% 65,723 100.0% 6.9%
Gross Margin 15,775 22.4% 14,107 21.5% 11.8%
DC Cost 608 0.9% 856 1.3% -29.0%
Shrinkage 350 0.5% 312 0.5% 12.1%
Margin on Sales 14,817 21.1% 12,938 19.7% 14.5%
Store Operating Expenses 14,236 20.3% 14,047 21.4% 1.3%
Other Retail Operating Income 2,031 2.9% 1,696 2.6% 19.7%
Store EBIDTA 2,612 3.7% 587 0.9% 344.9%
Service Office / Pre-ops Exp. 2,738 3.9% 3,890 5.9% -29.6%
Loss / (Profit) on sale of Property options (1,517) -2.2%
COMPANY EBIDTA 1,392 2.0% (3,303) -5.0% 142.1%
Depreciation 2,028 2.9% 1,727 2.6% 17.4%
Finance Charges 2,835 4.0% 2,524 3.8% 12.3%
PAT (3,471) -4.9% (7,555) -11.5% 54.1%
Sources of Funds 31st Dec 14
Net worth 512
Loans from Shareholders / Group Co's 9,300
Loans 22,476
Total 32,289
Application of Funds
Fixed Assets 17,579
Currents Assets , Loans and Advances 24,659
Less : Current Liabilities and Provisions 9,949
Net Current Assets 14,710
Total 32,289
• LTL Ex-CDIT : 3%
• LTL sales PSF growth : 13%
• LTL Opex Growth : (6.4%)
• SO growth excl. pre-ops &
exceptions is (12%).
• Depn. Includes New Companies Act
rate change impact of Rs. 3.2 Crs &
store refit impairment of Rs 1.6 Crs.
36
Strictly Private & Confidential37
Our Stores
3737
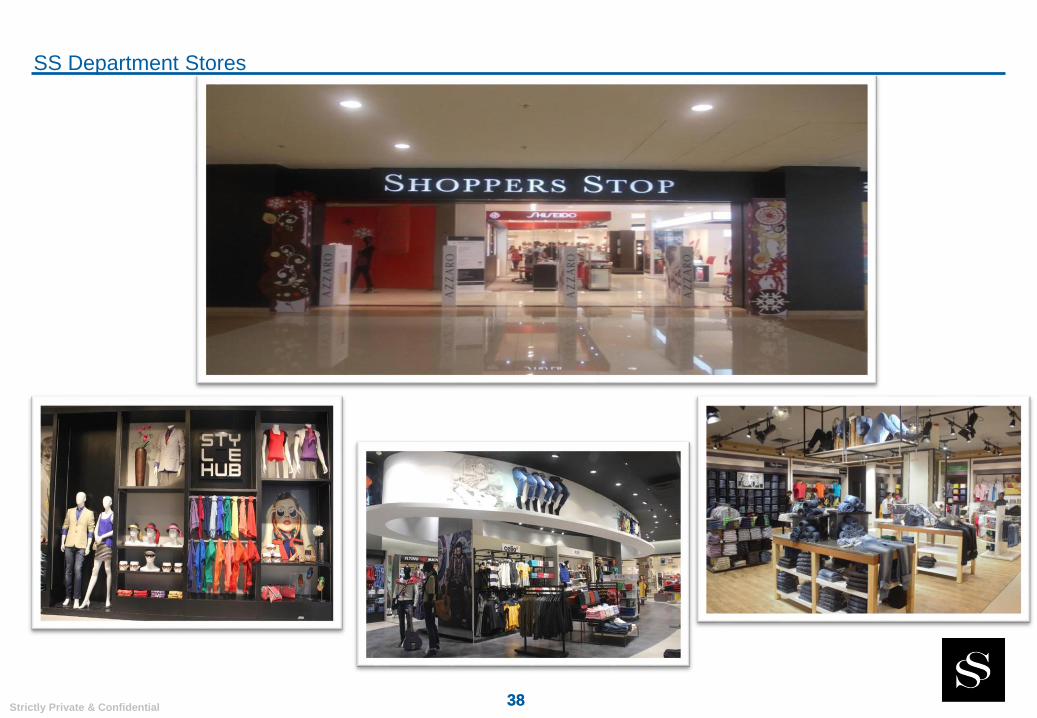
Strictly Private & Confidential38
SS Department Stores
38
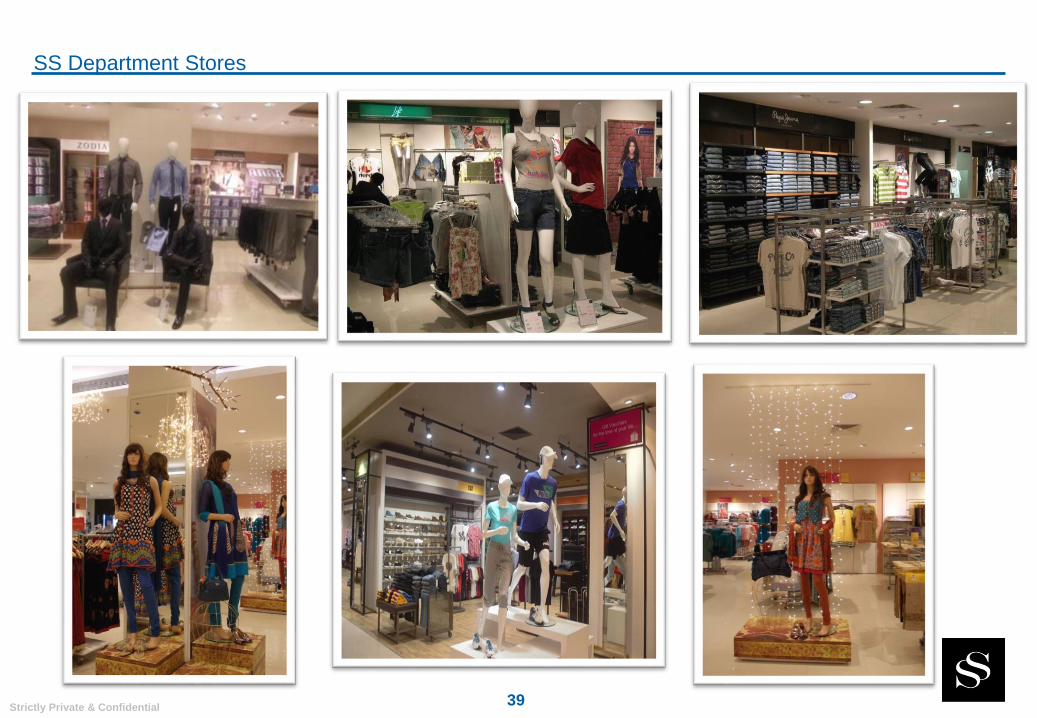
Strictly Private & Confidential39
SS Department Stores
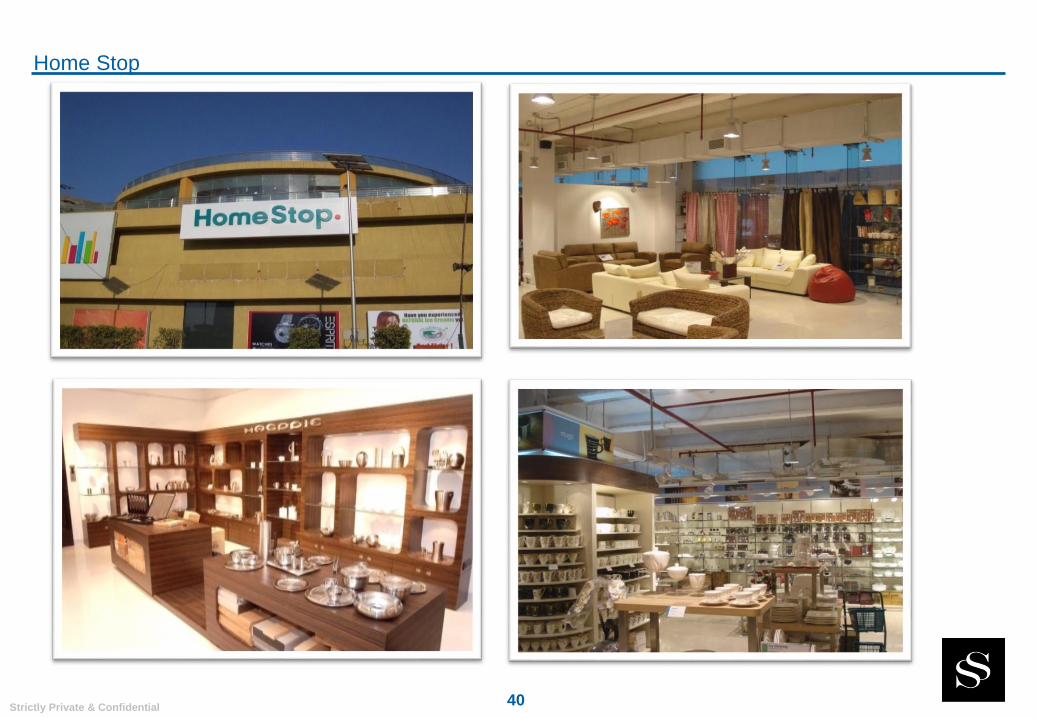
Strictly Private & Confidential40
Home Stop
Strictly Private & Confidential41
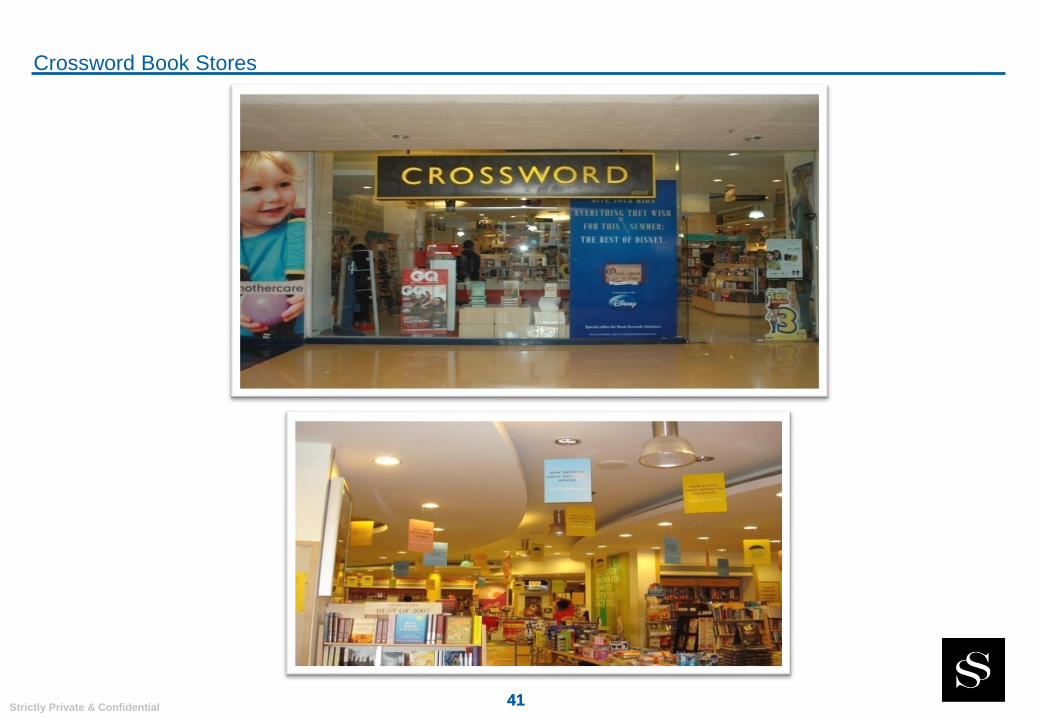
Crossword Book Stores
41
Strictly Private & Confidential42
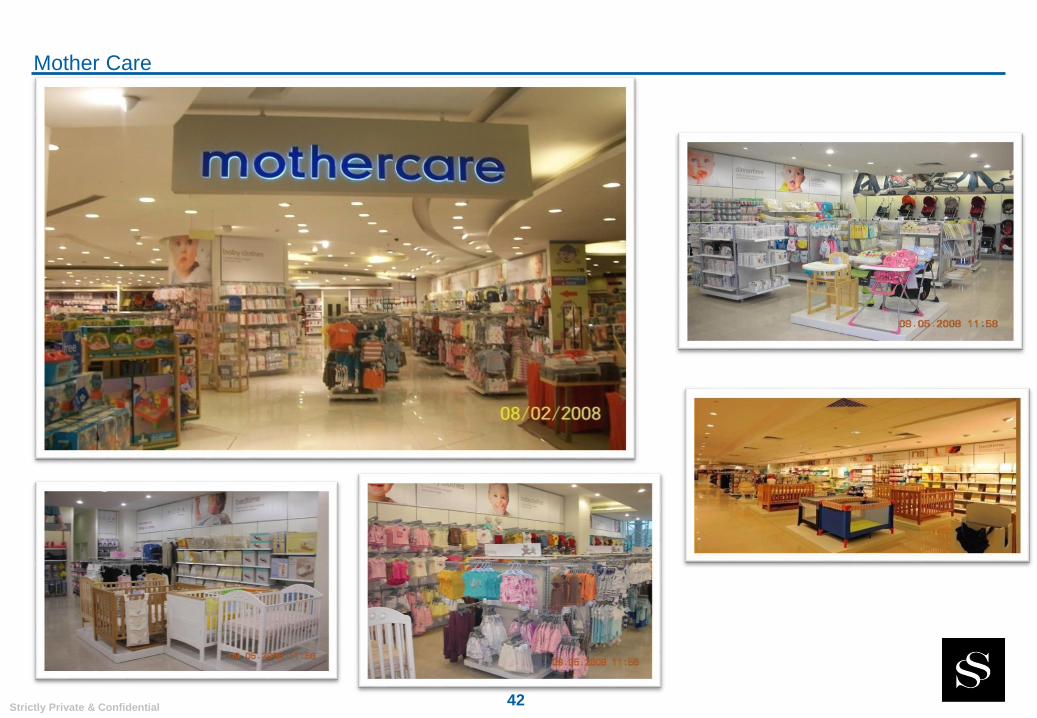
Mother Care
Strictly Private & Confidential43
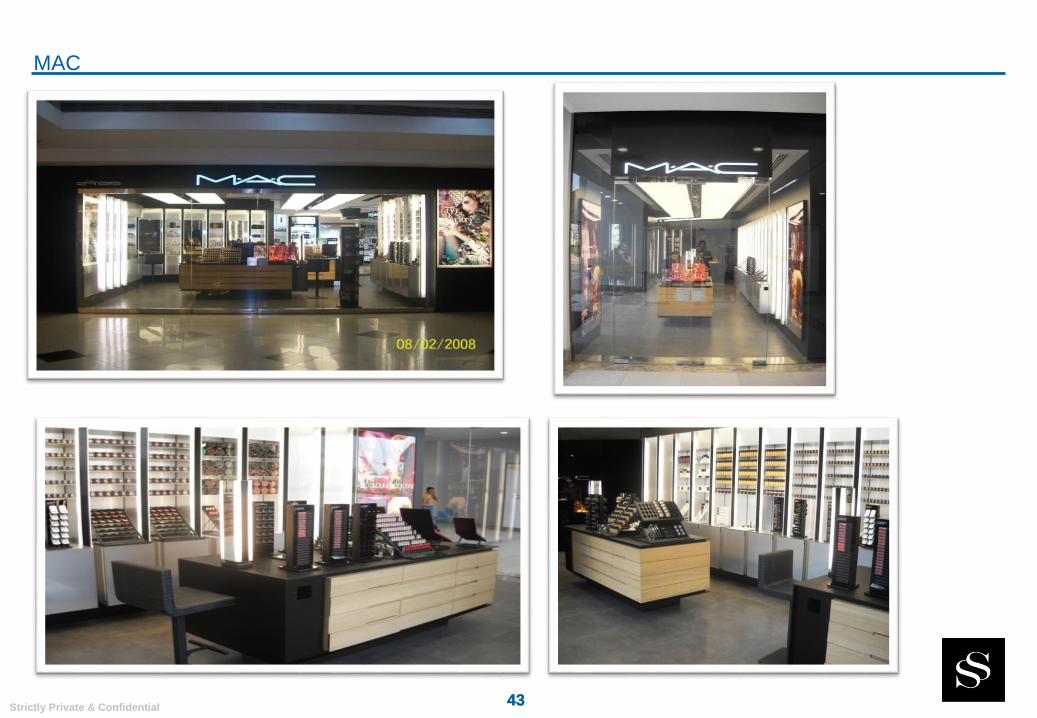
MAC
43
Strictly Private & Confidential44
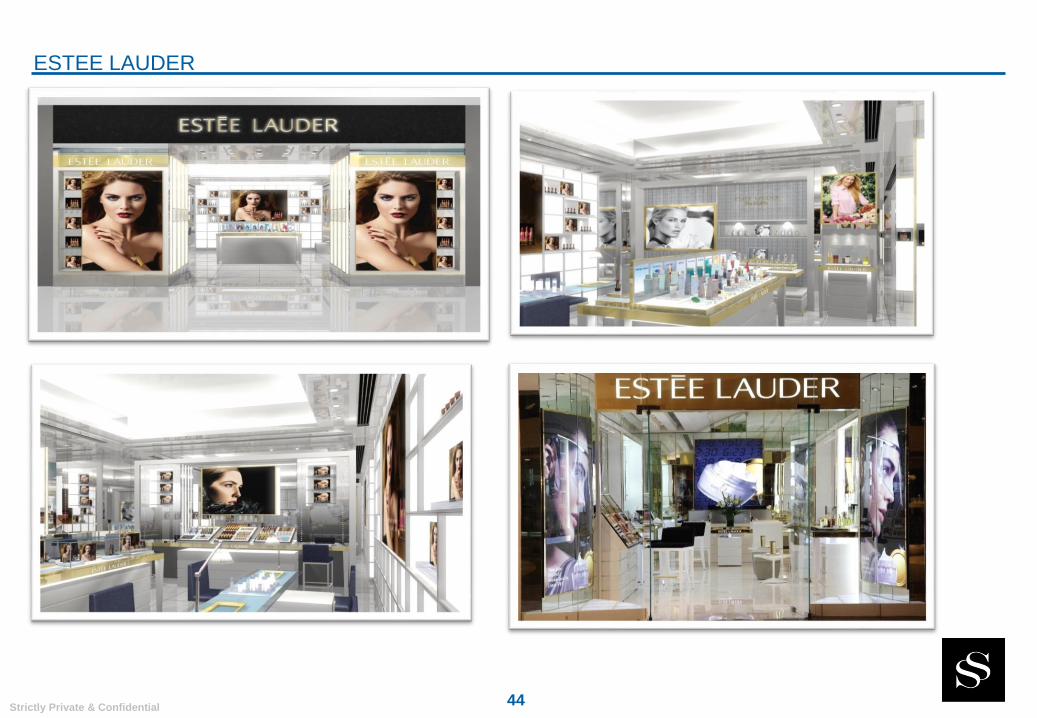
ESTEE LAUDER
Strictly Private & Confidential45
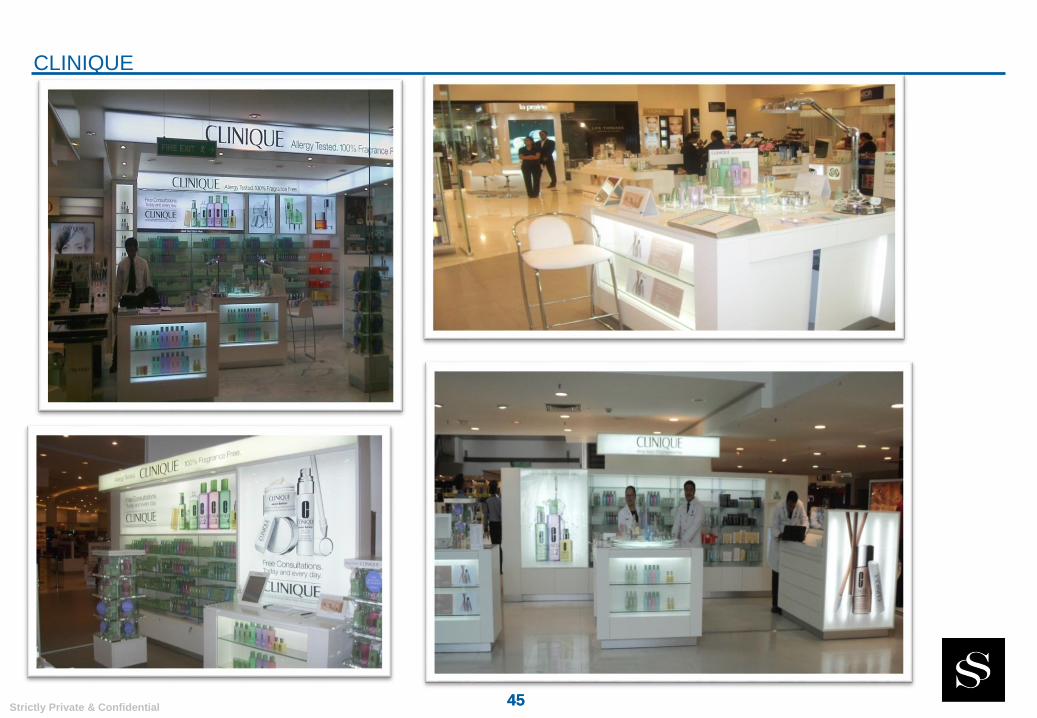
CLINIQUE
45
Strictly Private & Confidential46
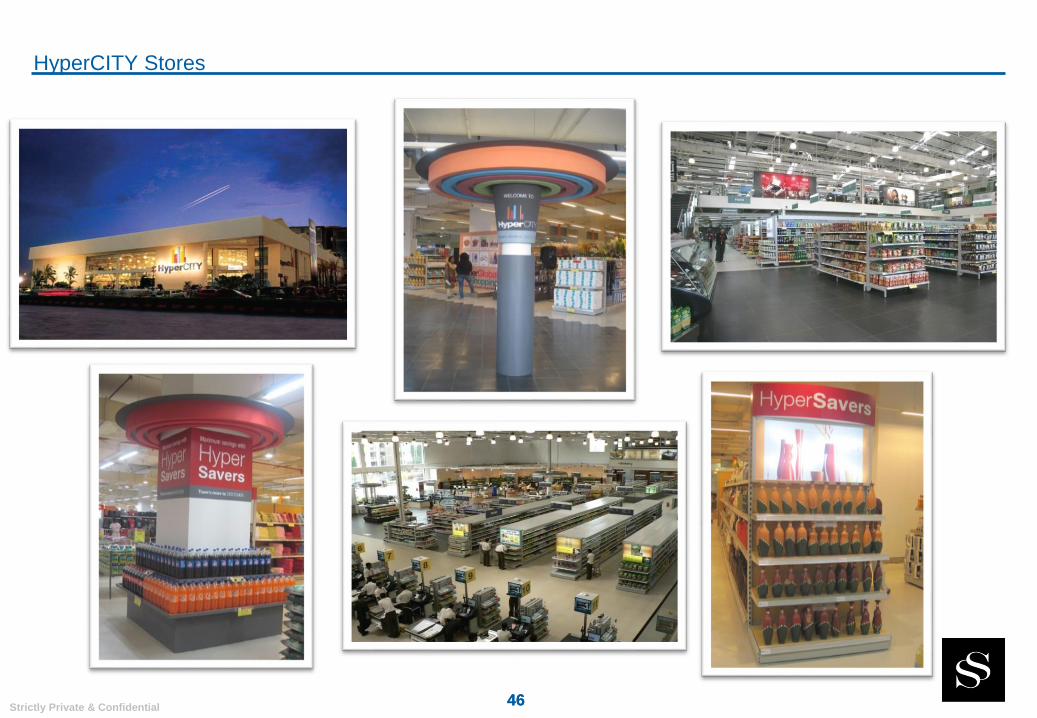
HyperCITY Stores
46
Strictly Private & Confidential47
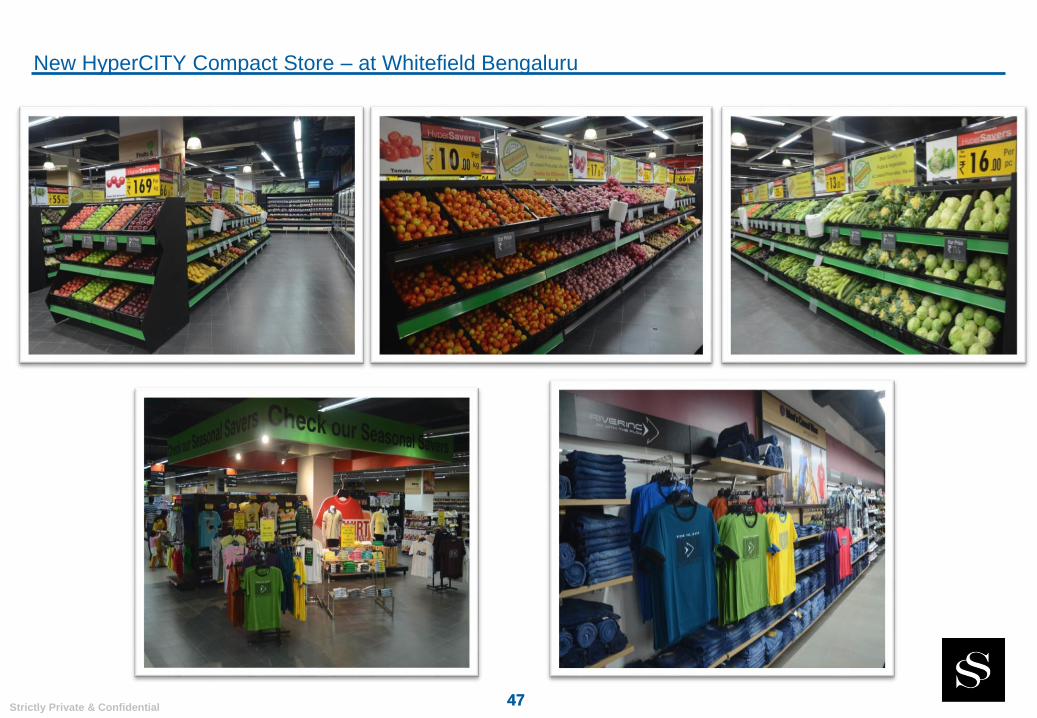
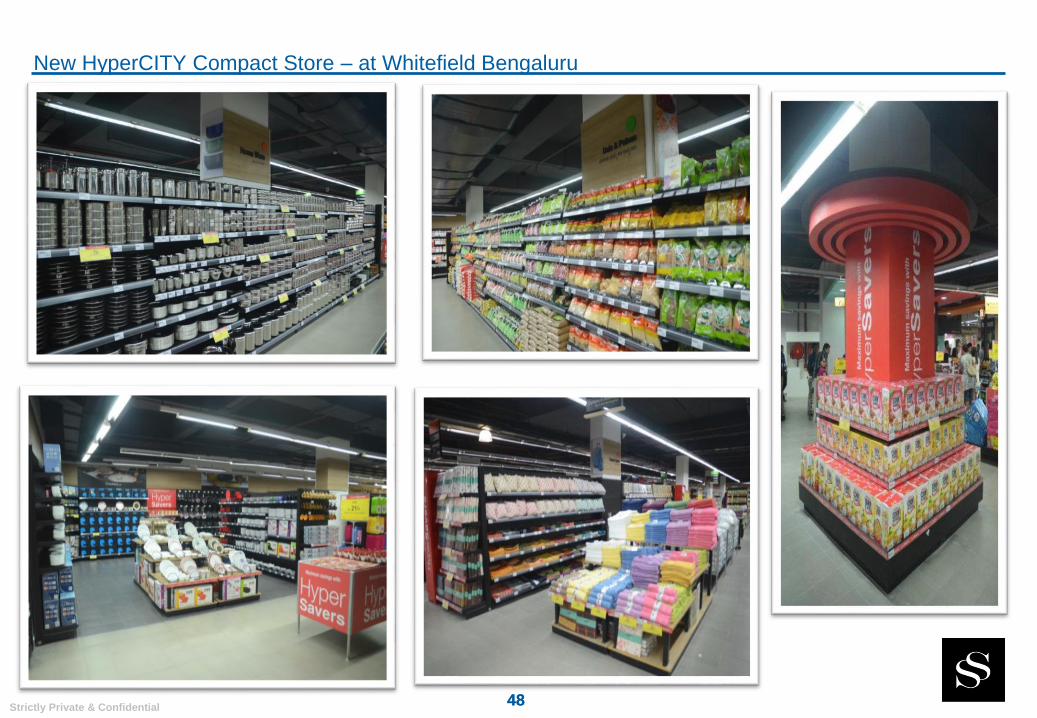
New HyperCITY Compact Store – at Whitefield Bengaluru
47
Strictly Private & Confidential48
New HyperCITY Compact Store – at Whitefield Bengaluru
48
Strictly Private & Confidential
T H A N K Y O U
DISCLAIMER : Certain statements in this release concerning our future growth prospects are forward-looking statements within the meaning of
applicable securities laws and regulations , and which involve a number of risks and uncertainties, beyond the control of the Company, that could
cause actual results to differ materially from those in such forward-looking statements. The risks and uncertainties relating to these statements
include, but are not limited to, risks and uncertainties regarding fluctuations in earnings, our ability to manage growth, intense competition including
those factors which may affect our cost advantage, wage increases, our ability to attract and retain highly skilled professionals, political instability,
legal restrictions on raising capital or acquiring companies outside India, and unauthorized use of our intellectual property and general economic
conditions affecting our industry. Shopper’s Stop Ltd. may, from time to time, make additional written and oral forward looking statements, including
our reports to shareholders. The Company does not undertake to update any forward-looking statement that may be made from time to time by or on
behalf of the company. The Company also expects the media to have access to all or parts of this release and the management’s commentaries and
opinions thereon, based on which the media may wish to comment and/or report on the same. Such comments and/or reporting maybe made only
after taking due clearance and approval from the Company’s authorized personnel. The Company does not take any responsibility for any
interpretations/ views/commentaries/reports which may be published or expressed by any media agency, without the prior authorization of the
Company’s authorized personnel.
49