Embed Size (px)
Citation preview
© 2006 The Author DOI: 10.1111/j.1466-822x.2006.00263.xJournal compilation © 2006 Blackwell Publishing Ltd www.blackwellpublishing.com/geb
1
Global Ecology and Biogeography, (Global Ecol. Biogeogr.)
(2007)
16
, 1–13
RESEARCHPAPER
Blackwell Publishing Ltd
Could temperature and water availability drive elevational species richness patterns? A global case study for bats
Christy M. McCain
ABSTRACT
Aim
A global meta-analysis was used to elucidate a mechanistic understanding ofelevational species richness patterns of bats by examining both regional and localclimatic factors, spatial constraints, sampling and interpolation. Based on these results,I propose the first climatic model for elevational gradients in species richness,and test it using preliminary bat data for two previously unexamined mountains.
Location
Global data set of bat species richness along elevational gradients fromOld and New World mountains spanning 12.5
°
S to 38
°
N latitude.
Methods
Bat elevational studies were found through an extensive literature search.Use was made only of studies sampling
≥
70% of the elevational gradient withoutsignificant sampling biases or strong anthropogenic disturbance. Undersamplingand interpolation were explicitly examined with three levels of error analyses.The influence of spatial constraints was tested with a Monte Carlo simulationprogram, Mid-Domain Null. Preliminary bat species richness data sets for two testmountains were compiled from specimen records from 12 US museum collections.
Results
Equal support was found for decreasing species richness with elevationand mid-elevation peaks. Patterns were robust to substantial amounts of error, anddid not appear to be a consequence of spatial constraints. Bat elevational richnesspatterns were related to local climatic gradients. Species richness was highest whereboth temperature and water availability were high, and declined as temperature andwater availability decreased. Mid-elevational peaks occurred on mountains with dry,arid bases, and decreasing species richness occurred on mountains with wet, warmbases. A preliminary analysis of bat richness patterns on elevational gradients inwestern Peru (dry base) and the Olympic Mountains, WA (wet base), supported thepredictions of the climate model.
Main conclusions
The relationship between species richness and combinedtemperature and water availability may be due to both direct (thermoregulatoryconstraints) and indirect (food resources) factors. Abundance was positively correlatedwith species richness, suggesting that bat species richness may also be related to pro-ductivity. The climatic model may be applicable to other taxonomic groups withsimilar ecological constraints, for instance certain bird, insect and amphibian clades.
Keywords
Bats, climate, diversity, elevational gradient, mammals, mid-domain effect, species
richness, temperature, water availability.
Correspondence: Christy M. McCain, National Center for Ecological Analysis and Synthesis, 735 State Street, Suite 300, Santa Barbara, CA 93101, USA. E-mail: [email protected]
National Center for Ecological Analysis and
Synthesis, University of California, Santa
Barbara, 735 State Street, Suite 300, Santa
Barbara, CA 93101, USA
INTRODUCTION
One fundamental goal of ecology and conservation is to deter-
mine what factors drive global biodiversity. The latitudinal
increase in species richness towards the equator has been used
repeatedly in attempts to uncover important mechanisms
(e.g. Pianka, 1966; Rohde, 1992; Hawkins
et al
., 2003). Studies
along elevational gradients can also be insightful (Brown, 2001;
C. M. McCain
© 2006 The Author
2
Global Ecology and Biogeography
,
16
, 1–13, Journal compilation © 2006 Blackwell Publishing Ltd
Lomolino, 2001), particularly because they occur across smaller
spatial scales making field studies more feasible, and because
there are more mountains for independent replication than
there are latitudinal gradients. A decade ago species richness
was thought to show a single elevational pattern: richness
decreasing with increasing elevation (Brown, 1988; Rahbek, 1995;
Brown & Lomolino, 1998). Since then it has become increasingly
clear that many, if not most, elevation patterns show highest
species richness at mid-elevations (Rahbek, 1995, 2005).
We now know that species richness can decrease with elevation,
peak at mid-elevation, or in a few cases increase with elevation
(Rahbek, 1995, 2005). This variation may be informative.
Certain richness patterns may be a consequence of a particular
climatic regime or historical contingency, or certain patterns may
be represented only by particular taxonomic groups driven by
their ecological constraints. If such predictable patterns exist
within taxa and among climates they will pinpoint driving factors
in species richness (Brown, 2001; Lomolino, 2001; McCain, 2005).
Such meta-analyses of elevational richness studies are needed
for each taxonomic group from a global perspective. Only one
exists to date. Small mammals (non-flying) consistently show
mid-elevational peaks along montane gradients regardless
of regional climate, latitude or scale of analysis (McCain, 2005).
Available evidence suggests a climatic mechanism involving a
complex interplay between rainfall, temperature and cloud cover.
Many potential mechanisms for elevational patterns in species
richness have been proposed spanning aspects of climate, area,
history, sampling and spatial constraints (Heaney, 2001;
Lomolino, 2001). Climatic mechanisms include temperature,
precipitation, humidity, cloud cover and productivity, which
parallel these hypotheses along latitudinal gradients (e.g. Pianka,
1966; Rohde, 1992; Hawkins
et al
., 2003). Unfortunately, most
support for climatic mechanisms rests on correlative gener-
alizations from a single season of climatic measurements at a
few elevational sites on a single elevational gradient. The lack of
quality, long-term data on climate factors like rainfall, humidity,
cloud cover and productivity on the small-scaled elevational
gradients have hampered the development of a quantitative
theory. No climatic models have been proposed yet due to these
limitations.
A quantitative null model exists to examine the influence of
spatial constraints on elevational gradients in species richness:
the mid-domain effect (MDE). The MDE predicts mid-elevational
peaks in species richness based on spatial constraints of range
placement between the hard boundaries of the sea and mountain
summits (Colwell & Hurtt, 1994; Colwell & Lees, 2000; McCain,
2003, 2004; Colwell
et al
., 2004). Landmass boundaries limit
species ranges and species with large and intermediate-sized
ranges necessarily overlap at the centre of the gradient. This leads
to a peak in species richness at the mid-point of the elevational
gradient. Thus, the MDE predicts highest richness at mid-elevations
with a monotonic decline towards the base and top of the moun-
tain, regardless of ecological gradients. Although theoretically
controversial (Colwell
et al
., 2004, 2005; Hawkins
et al
., 2005;
Zapata
et al
., 2005), empirical support for the MDE on elevational
gradients exists in varying degrees for small mammals (McCain,
2004, 2005), ants (Sanders, 2002; Sanders
et al
., 2003) and plants
(Grytnes & Vetaas, 2002; Grytnes, 2003).
Sampling may also have important consequences for species
richness patterns along elevational gradients (Terborgh, 1977;
Colwell & Hurtt, 1994; Grytnes & Vetaas, 2002; Rahbek, 2005).
All studies suffer from some degree of undersampling, although
proper sampling design attempts to minimize biases. Elevational
richness patterns are estimated from either point samples or
by interpolation, which assumes that a species occurs at all
elevations between the highest and lowest documented record.
Grytnes & Vetaas (2002) found that interpolation may create an
artificially strong decrease in species richness towards the ends of
the gradient. Thus, interpolation may bias species richness
patterns towards mid-elevational peaks.
The aim of this article is to elucidate a mechanistic under-
standing of elevational gradients in species richness by examin-
ing not only climatic factors (both regional and local), but
also influences of spatial constraints, undersampling and inter-
polation. With the current paucity of small-scale climatic data,
global meta-analyses offer a natural experimental setting to
test the generality of potential drivers. I use a global data set of
elevational patterns for bat species richness from Old and New
World mountains spanning 12.5
°
S to 38
°
N latitude. Bats are
ideal study organisms for such a global analysis because they are
a species-rich taxon occurring across a broad range of latitudes
and they have clear ecological constraints due to their adapta-
tions to flight. I examine whether the trends are upheld for major
trophic groups (e.g. insectivores, frugivores) and the two main
families of bats: the Vespertilionidae, which dominate temperate
bat communities, and the Phyllostomidae, which dominate
tropical bat communities (see Stevens, 2004). Lastly, I propose
the first climatic model for elevational gradients in species
richness and test the predictions with preliminary bat data for
two previously unexamined mountains.
MATERIALS AND METHODS
I found papers on bat species richness along elevational
gradients, searching BIOSIS and Web of Science using various
combinations of keywords: bat, Chiroptera, diversity, species
richness, elevation(-al), altitude(-inal). For grey literature, I
searched the US Forest Service publication website, the EPA/
DOE GrayLit site and National Park Service websites with the
keywords listed above. I compiled and reanalysed these data
using the methods of a similar analysis on nonvolant small mam-
mals (McCain, 2005). For all papers, species richness patterns
were assigned to three categories: decreasing, lower plateau and
mid-elevation peak (more patterns were possible but only three
were necessary with these data). Decreasing richness patterns are
those in which species numbers decline with increasing eleva-
tion. Lower plateaus have several 100-m bands at the mountain
base with similarly high species richness and declining species
richness at upper elevations. Mid-elevational peaks have 25% or
more species than at the base and top of the mountain.
Data sets were grouped by climate (tropical, temperate or
transitional between tropical and temperate), landmass (island
Global analysis of bat elevational species richness
© 2006 The Author
Global Ecology and Biogeography
,
16
, 1–13, Journal compilation © 2006 Blackwell Publishing Ltd
3
or continent) and alpha (local) or gamma (regional) species
richness. Alpha richness refers to local samples taken from field
transects along single elevational gradients. Gamma data sets
are species richness patterns compiled from trapping records,
specimen records and field notes for an entire mountain or
mountainous region regardless of slope, area or standardized
trapping effort across elevations. Gamma richness may be highly
influenced by area (Rahbek, 1997, 2005; Brown, 2001; Lomolino,
2001; Willig
et al
., 2003; McCain, 2005), and may have significant
sampling biases (Rickart, 2001). As the scales of the data in alpha
and gamma patterns are qualitatively and quantitatively differ-
ent, the factors producing these patterns will not necessarily
coincide (Rahbek, 2005). Such a dichotomy was seen in local and
regional elevational gradients in small mammals (McCain,
2005).
Data sets were selected based on several sampling criteria,
since sampling is of utmost importance in detecting unbiased
patterns in comparative analyses (McCain, 2005; Rahbek, 2005;
see Appendix S1 in Supplementary Material). First, data sets were
included in the quantitative analyses only if sampling covered
at least 70% of the elevational gradient. Secondly, I classified
sampling effort as low, medium or high based on the number
of months or years and intensity (e.g. number of mist nets per
night) of study along the transect, quantity of sampling methods
used (i.e. misting netting, bat detectors, etc.), and the scope of
the museum specimens and systematic literature assessed. This
was necessarily qualitative due to the highly variable nature of the
explanations of sampling in the text of the studies. Thirdly,
assessments were made (or noted if discussed by authors) of
elevational correlations in sampling intensity with species rich-
ness, since few studies had standardized sampling effort among
elevations. Finally, I considered whether study sites were subject
to wide-scale disturbance (e.g. the Philippine Islands). The com-
parison of trends among bat families and trophic groups was
limited to the New World since only one Old World data set,
from New Guinea, was sufficiently sampled.
All of the regional studies are based on interpolating a species
elevational range between the highest and lowest records. To
facilitate comparisons of species richness patterns between point
samples in the local scale analyses with regional analyses, local
samples were interpolated. Interpolation aids in overcoming
some limitations of undersampling, but may also inflate species
richness estimates at mid-elevations (Grytnes & Vetaas, 2002).
I explicitly examined the influence of undersampling and inter-
polation with an error analysis by range augmentation for each
gradient. Interpolation allows ranges to increase between
sampling points but not beyond them; thus, adding range
segments simulates interpolation beyond the current sampling
sites. I increased range sizes using three different procedures:
(1) uniform augmentation for all ranges, (2) uniform range
augmentation by size categories and (3) probability simulations
with randomized range augmentation for each range size class.
All range augmentations are percentages of the total length of the
montane gradient with half of the error added to the lower range
limit and half to the upper range limit until the base or top of the
mountain was reached
(e.g. gradient = 2000 m; 10% range
augmentation would add 100 m to the upper and lower range
ends for a total of 200 m). The augmentations by size category
assume that smaller ranges are more likely to be undersampled;
therefore they have larger amounts of error. The range size
categories are (1) small,
<
26% of gradient, (2) medium, 26%
to
<
51% of gradient, and (3) large,
≥
51% of gradient. The
probability simulations add an additional element of realism
by assuming that not all species ranges are undersampled but
varying those that are randomly. Four levels of uniform range
augmentation were applied to all ranges, [10, 30, 50, 70%]. Four
levels of size-specific, uniform range augmentation were applied
with augmentation decreasing from small to medium to large
ranges: [20, 10, 0%], [30, 20, 10%], [50, 25, 10%], [70, 50, 30%].
The simulations are similar but with decreasing probabilities of
error with range size: [30, 20, 10%], [50, 30, 10%], [70, 50, 20%],
[100, 60, 40%] and decreasing percentages of augmentation with
size: [20, 10, 0%], [40, 30, 10%], [50, 40, 20%], [70, 50, 30%].
For each probability and percentage error combination I used
1000 simulations to calculate 95% confidence intervals.
To test the influence of geographical boundaries, species
richness patterns were compared to null model predictions
with a Monte Carlo simulation procedure (Mid-Domain Null;
McCain, 2004). This procedure simulates species richness curves
using empirical range sizes within a bounded domain, based
on analytical-stochastic models (Colwell & Hurtt, 1994; Colwell
et al
., 2004; see McCain, 2003, 2004, 2005). Simulation
boundaries were mountain summit and lowest elevation for the
mountain range. Species richness data were then examined in
100-m increments. For each data set, 95% prediction curves
based on 50,000 simulations sampled without replacement from
empirical range sizes were used to assess the impact of spatial
constraints on the elevational richness gradients. Regressions of
the empirical values on predicted values, based on the average of
the 50,000 simulations, gave
r
2
estimates of the fit of the null
model. Consistent deviations from null model predictions
suggest that climatic, historical or other factors are important in
determining species richness.
To test the proposed climate model, two preliminary species
richness data sets, for western Peru and the Olympic Mountains,
WA, were compiled from bat specimen records from 12 US
museum collections in the MaNIS Database (http://elib.cs.
berkeley.edu/manis/). The elevation of each specimen was based
on the data base information or was estimated from the collect-
ing locality through maps, digital elevation models and/or
gazetteers. For western Peru, all data from western departments
were included except Tumbes, which contains lowland tropical
forest unlike the lowlands of other departments that are mostly
desert or desert scrub. For the Olympic Mountains, bat speci-
mens were included from the four counties that encompass the
mountain range and surrounding coastal counties. The bat
classifications were based on those of Wilson and Reeder (1993).
RESULTS
Twenty-seven elevational gradients in bat species richness were
found in 24 published studies (see Appendix S1 in Supplementary
C. M. McCain
© 2006 The Author
4
Global Ecology and Biogeography
,
16
, 1–13, Journal compilation © 2006 Blackwell Publishing Ltd
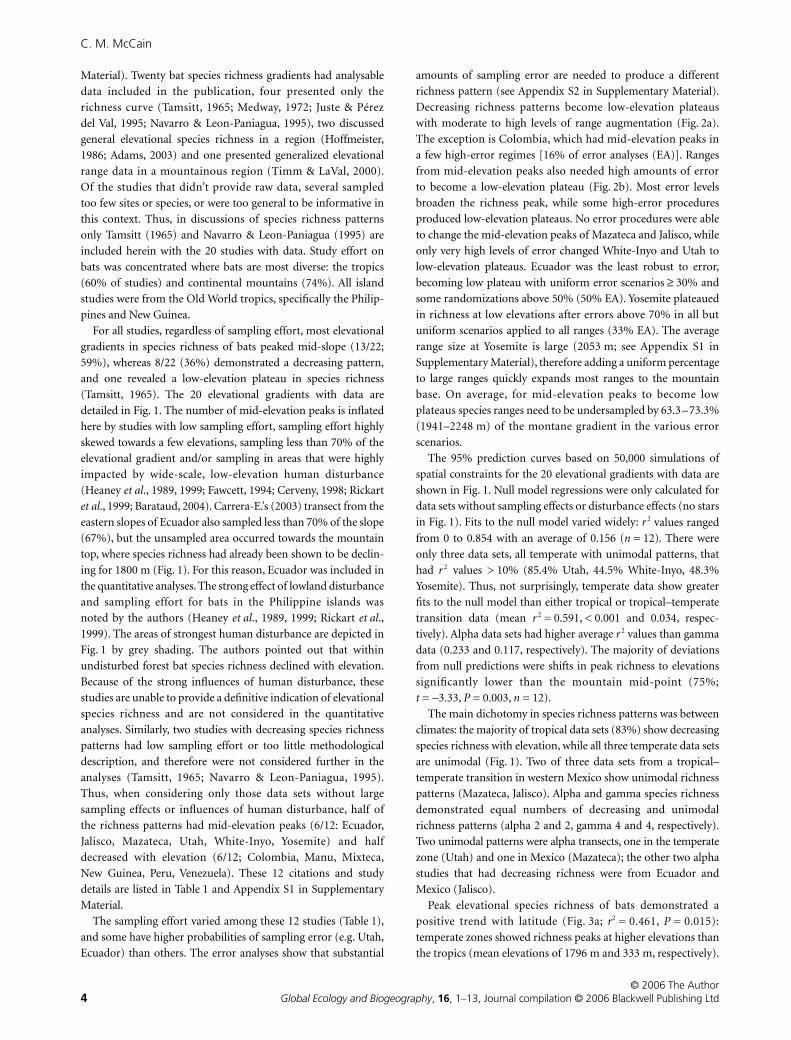
Material). Twenty bat species richness gradients had analysable
data included in the publication, four presented only the
richness curve (Tamsitt, 1965; Medway, 1972; Juste & Pérez
del Val, 1995; Navarro & Leon-Paniagua, 1995), two discussed
general elevational species richness in a region (Hoffmeister,
1986; Adams, 2003) and one presented generalized elevational
range data in a mountainous region (Timm & LaVal, 2000).
Of the studies that didn’t provide raw data, several sampled
too few sites or species, or were too general to be informative in
this context. Thus, in discussions of species richness patterns
only Tamsitt (1965) and Navarro & Leon-Paniagua (1995) are
included herein with the 20 studies with data. Study effort on
bats was concentrated where bats are most diverse: the tropics
(60% of studies) and continental mountains (74%). All island
studies were from the Old World tropics, specifically the Philip-
pines and New Guinea.
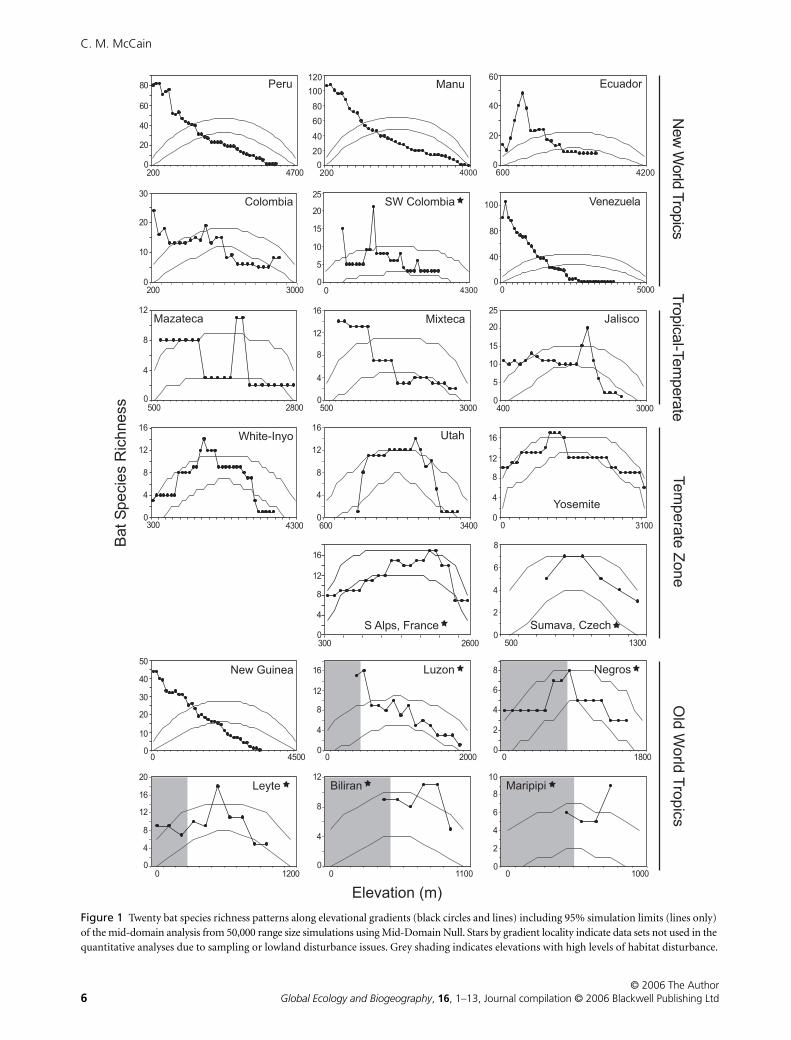
For all studies, regardless of sampling effort, most elevational
gradients in species richness of bats peaked mid-slope (13/22;
59%), whereas 8/22 (36%) demonstrated a decreasing pattern,
and one revealed a low-elevation plateau in species richness
(Tamsitt, 1965). The 20 elevational gradients with data are
detailed in Fig. 1. The number of mid-elevation peaks is inflated
here by studies with low sampling effort, sampling effort highly
skewed towards a few elevations, sampling less than 70% of the
elevational gradient and/or sampling in areas that were highly
impacted by wide-scale, low-elevation human disturbance
(Heaney
et al
., 1989, 1999; Fawcett, 1994; Cerveny, 1998; Rickart
et al
., 1999; Barataud, 2004). Carrera-E.’s (2003) transect from the
eastern slopes of Ecuador also sampled less than 70% of the slope
(67%), but the unsampled area occurred towards the mountain
top, where species richness had already been shown to be declin-
ing for 1800 m (Fig. 1). For this reason, Ecuador was included in
the quantitative analyses. The strong effect of lowland disturbance
and sampling effort for bats in the Philippine islands was
noted by the authors (Heaney
et al
., 1989, 1999; Rickart
et al
.,
1999). The areas of strongest human disturbance are depicted in
Fig. 1 by grey shading. The authors pointed out that within
undisturbed forest bat species richness declined with elevation.
Because of the strong influences of human disturbance, these
studies are unable to provide a definitive indication of elevational
species richness and are not considered in the quantitative
analyses. Similarly, two studies with decreasing species richness
patterns had low sampling effort or too little methodological
description, and therefore were not considered further in the
analyses (Tamsitt, 1965; Navarro & Leon-Paniagua, 1995).
Thus, when considering only those data sets without large
sampling effects or influences of human disturbance, half of
the richness patterns had mid-elevation peaks (6/12: Ecuador,
Jalisco, Mazateca, Utah, White-Inyo, Yosemite) and half
decreased with elevation (6/12; Colombia, Manu, Mixteca,
New Guinea, Peru, Venezuela). These 12 citations and study
details are listed in Table 1 and Appendix S1 in Supplementary
Material.
The sampling effort varied among these 12 studies (Table 1),
and some have higher probabilities of sampling error (e.g. Utah,
Ecuador) than others. The error analyses show that substantial
amounts of sampling error are needed to produce a different
richness pattern (see Appendix S2 in Supplementary Material).
Decreasing richness patterns become low-elevation plateaus
with moderate to high levels of range augmentation (Fig. 2a).
The exception is Colombia, which had mid-elevation peaks in
a few high-error regimes [16% of error analyses (EA)]. Ranges
from mid-elevation peaks also needed high amounts of error
to become a low-elevation plateau (Fig. 2b). Most error levels
broaden the richness peak, while some high-error procedures
produced low-elevation plateaus. No error procedures were able
to change the mid-elevation peaks of Mazateca and Jalisco, while
only very high levels of error changed White-Inyo and Utah to
low-elevation plateaus. Ecuador was the least robust to error,
becoming low plateau with uniform error scenarios
≥
30% and
some randomizations above 50% (50% EA). Yosemite plateaued
in richness at low elevations after errors above 70% in all but
uniform scenarios applied to all ranges (33% EA). The average
range size at Yosemite is large (2053 m; see Appendix S1 in
Supplementary Material), therefore adding a uniform percentage
to large ranges quickly expands most ranges to the mountain
base. On average, for mid-elevation peaks to become low
plateaus species ranges need to be undersampled by 63.3–73.3%
(1941–2248 m) of the montane gradient in the various error
scenarios.
The 95% prediction curves based on 50,000 simulations of
spatial constraints for the 20 elevational gradients with data are
shown in Fig. 1. Null model regressions were only calculated for
data sets without sampling effects or disturbance effects (no stars
in Fig. 1). Fits to the null model varied widely:
r
2
values ranged
from 0 to 0.854 with an average of 0.156 (
n
= 12). There were
only three data sets, all temperate with unimodal patterns, that
had
r
2
values > 10% (85.4% Utah, 44.5% White-Inyo, 48.3%
Yosemite). Thus, not surprisingly, temperate data show greater
fits to the null model than either tropical or tropical–temperate
transition data (mean
r
2
= 0.591, < 0.001 and 0.034, respec-
tively). Alpha data sets had higher average
r
2
values than gamma
data (0.233 and 0.117, respectively). The majority of deviations
from null predictions were shifts in peak richness to elevations
significantly lower than the mountain mid-point (75%;
t
=
−
3.33,
P
= 0.003,
n
= 12).
The main dichotomy in species richness patterns was between
climates: the majority of tropical data sets (83%) show decreasing
species richness with elevation, while all three temperate data sets
are unimodal (Fig. 1). Two of three data sets from a tropical–
temperate transition in western Mexico show unimodal richness
patterns (Mazateca, Jalisco). Alpha and gamma species richness
demonstrated equal numbers of decreasing and unimodal
richness patterns (alpha 2 and 2, gamma 4 and 4, respectively).
Two unimodal patterns were alpha transects, one in the temperate
zone (Utah) and one in Mexico (Mazateca); the other two alpha
studies that had decreasing richness were from Ecuador and
Mexico (Jalisco).
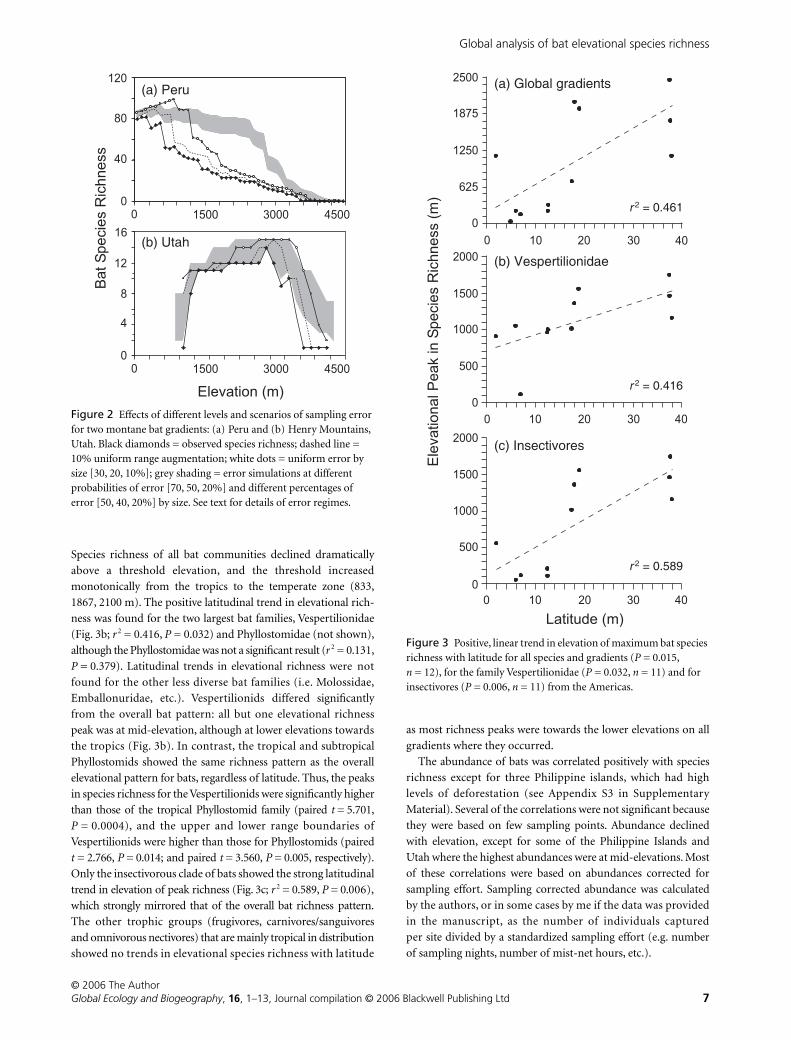
Peak elevational species richness of bats demonstrated a
positive trend with latitude (Fig. 3a;
r
2
= 0.461,
P
= 0.015):
temperate zones showed richness peaks at higher elevations than
the tropics (mean elevations of 1796 m and 333 m, respectively).
Global analysis of bat elevational species richness
© 2006 The A
uthor
Global Ecology and Biogeography
,
16
, 1–13, Journal compilation ©
2006 Blackwell Publishing Ltd
5
Table 1
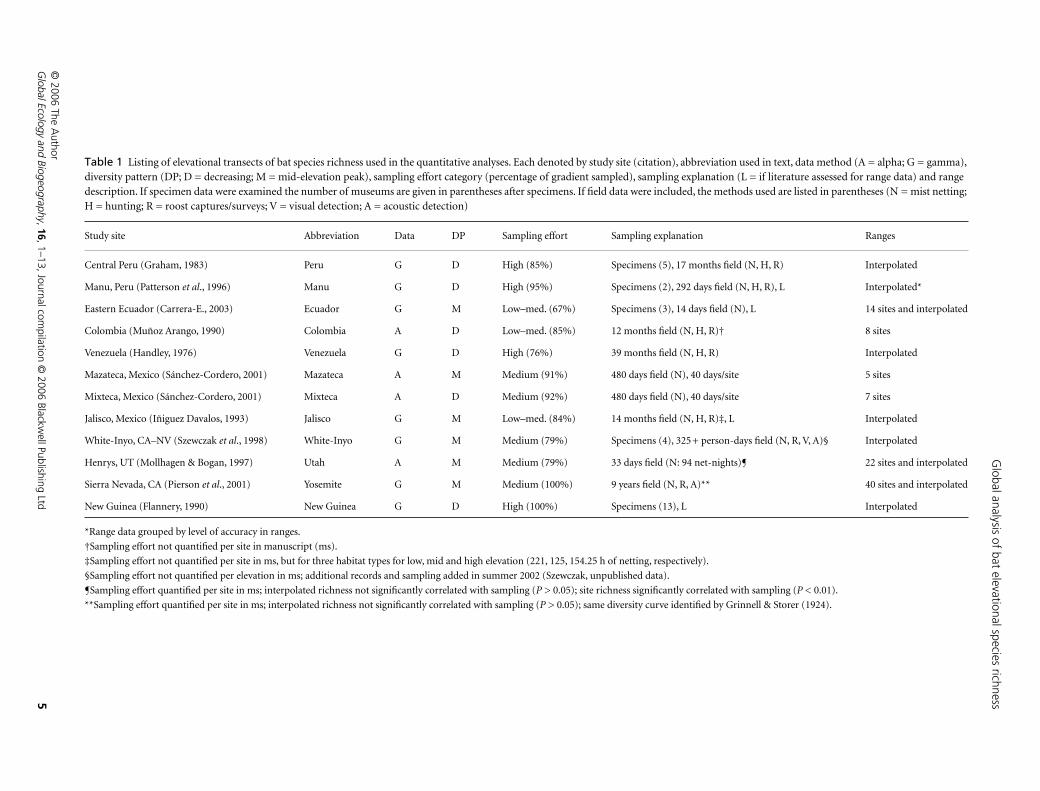
Listing of elevational transects of bat species richness used in the quantitative analyses. Each denoted by study site (citation), abbreviation used in text, data method (A = alpha; G = gamma), diversity pattern (DP; D = decreasing; M = mid-elevation peak), sampling effort category (percentage of gradient sampled), sampling explanation (L = if literature assessed for range data) and range description. If specimen data were examined the number of museums are given in parentheses after specimens. If field data were included, the methods used are listed in parentheses (N = mist netting; H = hunting; R = roost captures/surveys; V = visual detection; A = acoustic detection)
Study site Abbreviation Data DP Sampling effort Sampling explanation Ranges
Central Peru (Graham, 1983) Peru G D High (85%) Specimens (5), 17 months field (N, H, R) Interpolated
Manu, Peru (Patterson
et al
., 1996) Manu G D High (95%) Specimens (2), 292 days field (N, H, R), L Interpolated*
Eastern Ecuador (Carrera-E., 2003) Ecuador G M Low–med. (67%) Specimens (3), 14 days field (N), L 14 sites and interpolated
Colombia (Muñoz Arango, 1990) Colombia A D Low–med. (85%) 12 months field (N, H, R)† 8 sites
Venezuela (Handley, 1976) Venezuela G D High (76%) 39 months field (N, H, R) Interpolated
Mazateca, Mexico (Sánchez-Cordero, 2001) Mazateca A M Medium (91%) 480 days field (N), 40 days/site 5 sites
Mixteca, Mexico (Sánchez-Cordero, 2001) Mixteca A D Medium (92%) 480 days field (N), 40 days/site 7 sites
Jalisco, Mexico (Iñiguez Davalos, 1993) Jalisco G M Low–med. (84%) 14 months field (N, H, R)‡, L Interpolated
White-Inyo, CA–NV (Szewczak
et al
., 1998) White-Inyo G M Medium (79%) Specimens (4), 325+ person-days field (N, R, V, A)§ Interpolated
Henrys, UT (Mollhagen & Bogan, 1997) Utah A M Medium (79%) 33 days field (N: 94 net-nights)¶ 22 sites and interpolated
Sierra Nevada, CA (Pierson
et al
., 2001) Yosemite G M Medium (100%) 9 years field (N, R, A)** 40 sites and interpolated
New Guinea (Flannery, 1990) New Guinea G D High (100%) Specimens (13), L Interpolated
*Range data grouped by level of accuracy in ranges.
†Sampling effort not quantified per site in manuscript (ms).
‡Sampling effort not quantified per site in ms, but for three habitat types for low, mid and high elevation (221, 125, 154.25 h of netting, respectively).
§Sampling effort not quantified per elevation in ms; additional records and sampling added in summer 2002 (Szewczak, unpublished data).
¶Sampling effort quantified per site in ms; interpolated richness not significantly correlated with sampling (
P
> 0.05); site richness significantly correlated with sampling (
P
< 0.01).
**Sampling effort quantified per site in ms; interpolated richness not significantly correlated with sampling (
P
> 0.05); same diversity curve identified by Grinnell & Storer (1924).
C. M. McCain
© 2006 The Author
6
Global Ecology and Biogeography
,
16
, 1–13, Journal compilation © 2006 Blackwell Publishing Ltd
Figure 1 Twenty bat species richness patterns along elevational gradients (black circles and lines) including 95% simulation limits (lines only) of the mid-domain analysis from 50,000 range size simulations using Mid-Domain Null. Stars by gradient locality indicate data sets not used in the quantitative analyses due to sampling or lowland disturbance issues. Grey shading indicates elevations with high levels of habitat disturbance.
Global analysis of bat elevational species richness
© 2006 The Author
Global Ecology and Biogeography
,
16
, 1–13, Journal compilation © 2006 Blackwell Publishing Ltd
7
Species richness of all bat communities declined dramatically
above a threshold elevation, and the threshold increased
monotonically from the tropics to the temperate zone (833,
1867, 2100 m). The positive latitudinal trend in elevational rich-
ness was found for the two largest bat families, Vespertilionidae
(Fig. 3b;
r
2
= 0.416,
P
= 0.032) and Phyllostomidae (not shown),
although the Phyllostomidae was not a significant result (
r
2
= 0.131,
P
= 0.379). Latitudinal trends in elevational richness were not
found for the other less diverse bat families (i.e. Molossidae,
Emballonuridae, etc.). Vespertilionids differed significantly
from the overall bat pattern: all but one elevational richness
peak was at mid-elevation, although at lower elevations towards
the tropics (Fig. 3b). In contrast, the tropical and subtropical
Phyllostomids showed the same richness pattern as the overall
elevational pattern for bats, regardless of latitude. Thus, the peaks
in species richness for the Vespertilionids were significantly higher
than those of the tropical Phyllostomid family (paired
t
= 5.701,
P
= 0.0004), and the upper and lower range boundaries of
Vespertilionids were higher than those for Phyllostomids (paired
t
= 2.766,
P
= 0.014; and paired
t
= 3.560,
P
= 0.005, respectively).
Only the insectivorous clade of bats showed the strong latitudinal
trend in elevation of peak richness (Fig. 3c;
r
2
= 0.589,
P
= 0.006),
which strongly mirrored that of the overall bat richness pattern.
The other trophic groups (frugivores, carnivores/sanguivores
and omnivorous nectivores) that are mainly tropical in distribution
showed no trends in elevational species richness with latitude
as most richness peaks were towards the lower elevations on all
gradients where they occurred.
The abundance of bats was correlated positively with species
richness except for three Philippine islands, which had high
levels of deforestation (see Appendix S3 in Supplementary
Material). Several of the correlations were not significant because
they were based on few sampling points. Abundance declined
with elevation, except for some of the Philippine Islands and
Utah where the highest abundances were at mid-elevations. Most
of these correlations were based on abundances corrected for
sampling effort. Sampling corrected abundance was calculated
by the authors, or in some cases by me if the data was provided
in the manuscript, as the number of individuals captured
per site divided by a standardized sampling effort (e.g. number
of sampling nights, number of mist-net hours, etc.).
Figure 2 Effects of different levels and scenarios of sampling error for two montane bat gradients: (a) Peru and (b) Henry Mountains, Utah. Black diamonds = observed species richness; dashed line = 10% uniform range augmentation; white dots = uniform error by size [30, 20, 10%]; grey shading = error simulations at different probabilities of error [70, 50, 20%] and different percentages of error [50, 40, 20%] by size. See text for details of error regimes.
Figure 3 Positive, linear trend in elevation of maximum bat species richness with latitude for all species and gradients (P = 0.015, n = 12), for the family Vespertilionidae (P = 0.032, n = 11) and for insectivores (P = 0.006, n = 11) from the Americas.
C. M. McCain
© 2006 The Author
8
Global Ecology and Biogeography
,
16
, 1–13, Journal compilation © 2006 Blackwell Publishing Ltd
Climate model
All studies found that temperature decreased linearly with
increasing elevation, although at varying rates (0.38–0.68
°
C for
every 100 m), which could be due to differences in duration
and number of sites sampled. Based on the data or citations,
temperature decreased with each 100-m increase in elevation by
0.56
°
C in Peru, 0.38
°
C in Ecuador, 0.68
°
C in Colombia and
0.51
°
C in Mexico. These were in accordance with data for the
Old World tropical mountains (0.5–0.55
°
C for every 100 m;
Md. Nor, 2001) and the average environmental lapse rate of
0.6
°
C for every 100 m (Barry, 1992). Precipitation trends with
elevation were highly variable: the highest precipitation was at
the lowest elevations with a secondary peak at upper elevations
in Ecuador, whereas Colombia, Jalisco, Mixteca and Peru had
mid-elevation peaks in precipitation. Mazateca, Utah and White-
Inyo noted increasing precipitation with elevation. Studies from
other regions have also found the highest precipitation at
mid-elevations (i.e. Costa Rica, Borneo), although all studies on
precipitation suffer from sampling of only few sites, over rela-
tively short time-scales (Barry, 1992), and do not always account
for horizontal precipitation from low-lying clouds. All of the
tropical mountains occurred on wet slopes (e.g. eastern versant
of the Andes), thus rainfall was high at low to mid-elevations,
even if slightly higher rainfall was noted at mid-slope. In con-
trast, all of the temperate and two of the Mexican mountains
(Jalisco, Mazateca) had arid or seasonal drought conditions at
the mountain base. On these mountains, rainfall was highest
at upper elevations, and rainfall was very low at the base
(i.e. < 10 cm year
−
1
at the base of White-Inyo, 5 cm at the base of
Utah (Henrys) and 15 cm at the base of Mazateca) with high
rates of evapotranspiration.
Bat elevational species richness was strongly correlated with
temperature for the wet, tropical mountains (average
r
= 0.887,
SE = 0.0392), less correlated on the subtropical, Mexican
mountains (average
r
= 0.7580, SE = 0.0870) and not signific-
antly correlated on temperate mountains (average
r
= 0.2483,
SE = 0.0007). The threshold temperature for bat activity was
documented to be 2–10
°
C (Cerveny, 1998; Pierson
et al
., 2001;
references therein). Such a strong temperature constraint was
noted at the coldest temperatures, as no bats were found above
some limit between 2600 and 4100 m on the various mountains.
The temperate data sets and two elevational gradients from
Mexico, which all had dry, arid conditions at the mountain base,
demonstrated highest bat richness at mid-slope. This trend
appears to be correlated with water availability. The highest water
availability on these temperate or subtropical mountains is at
mid-slope, where higher rainfall is paired with runoff from steep
slopes, and shallow soils at the highest elevations, where most
precipitation is in the form of ice and snow. On these mountains
most streams are seasonal and intermittent at the lowest
elevations (Mollhagen & Bogan, 1997).
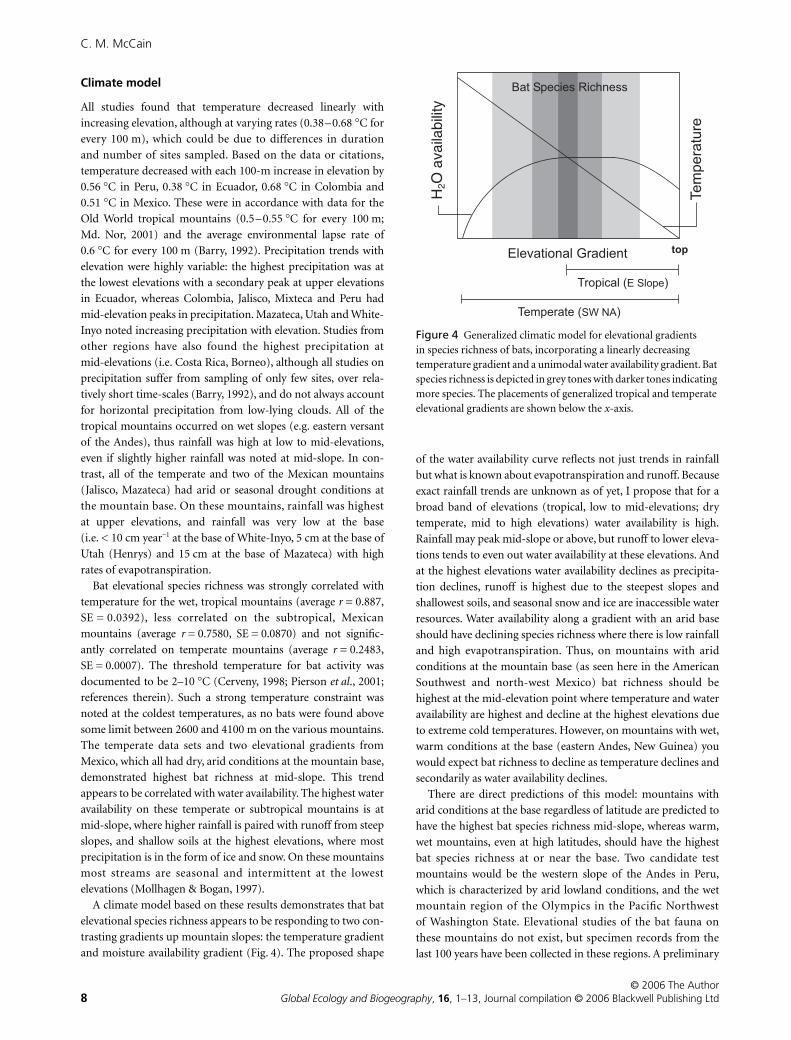
A climate model based on these results demonstrates that bat
elevational species richness appears to be responding to two con-
trasting gradients up mountain slopes: the temperature gradient
and moisture availability gradient (Fig. 4). The proposed shape
of the water availability curve reflects not just trends in rainfall
but what is known about evapotranspiration and runoff. Because
exact rainfall trends are unknown as of yet, I propose that for a
broad band of elevations (tropical, low to mid-elevations; dry
temperate, mid to high elevations) water availability is high.
Rainfall may peak mid-slope or above, but runoff to lower eleva-
tions tends to even out water availability at these elevations. And
at the highest elevations water availability declines as precipita-
tion declines, runoff is highest due to the steepest slopes and
shallowest soils, and seasonal snow and ice are inaccessible water
resources. Water availability along a gradient with an arid base
should have declining species richness where there is low rainfall
and high evapotranspiration. Thus, on mountains with arid
conditions at the mountain base (as seen here in the American
Southwest and north-west Mexico) bat richness should be
highest at the mid-elevation point where temperature and water
availability are highest and decline at the highest elevations due
to extreme cold temperatures. However, on mountains with wet,
warm conditions at the base (eastern Andes, New Guinea) you
would expect bat richness to decline as temperature declines and
secondarily as water availability declines.
There are direct predictions of this model: mountains with
arid conditions at the base regardless of latitude are predicted to
have the highest bat species richness mid-slope, whereas warm,
wet mountains, even at high latitudes, should have the highest
bat species richness at or near the base. Two candidate test
mountains would be the western slope of the Andes in Peru,
which is characterized by arid lowland conditions, and the wet
mountain region of the Olympics in the Pacific Northwest
of Washington State. Elevational studies of the bat fauna on
these mountains do not exist, but specimen records from the
last 100 years have been collected in these regions. A preliminary
Figure 4 Generalized climatic model for elevational gradients in species richness of bats, incorporating a linearly decreasing temperature gradient and a unimodal water availability gradient. Bat species richness is depicted in grey tones with darker tones indicating more species. The placements of generalized tropical and temperate elevational gradients are shown below the x-axis.
Global analysis of bat elevational species richness
© 2006 The Author
Global Ecology and Biogeography
,
16
, 1–13, Journal compilation © 2006 Blackwell Publishing Ltd
9
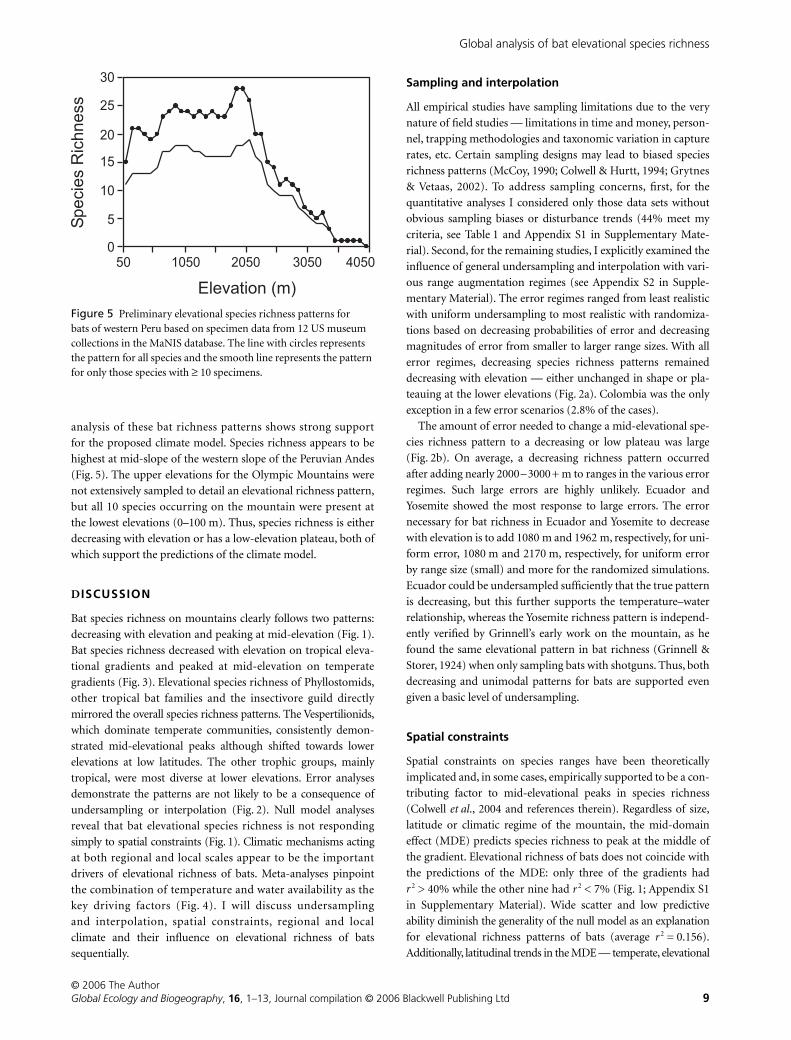
analysis of these bat richness patterns shows strong support
for the proposed climate model. Species richness appears to be
highest at mid-slope of the western slope of the Peruvian Andes
(Fig. 5). The upper elevations for the Olympic Mountains were
not extensively sampled to detail an elevational richness pattern,
but all 10 species occurring on the mountain were present at
the lowest elevations (0–100 m). Thus, species richness is either
decreasing with elevation or has a low-elevation plateau, both of
which support the predictions of the climate model.
D
ISCUSSION
Bat species richness on mountains clearly follows two patterns:
decreasing with elevation and peaking at mid-elevation (Fig. 1).
Bat species richness decreased with elevation on tropical eleva-
tional gradients and peaked at mid-elevation on temperate
gradients (Fig. 3). Elevational species richness of Phyllostomids,
other tropical bat families and the insectivore guild directly
mirrored the overall species richness patterns. The Vespertilionids,
which dominate temperate communities, consistently demon-
strated mid-elevational peaks although shifted towards lower
elevations at low latitudes. The other trophic groups, mainly
tropical, were most diverse at lower elevations. Error analyses
demonstrate the patterns are not likely to be a consequence of
undersampling or interpolation (Fig. 2). Null model analyses
reveal that bat elevational species richness is not responding
simply to spatial constraints (Fig. 1). Climatic mechanisms acting
at both regional and local scales appear to be the important
drivers of elevational richness of bats. Meta-analyses pinpoint
the combination of temperature and water availability as the
key driving factors (Fig. 4). I will discuss undersampling
and interpolation, spatial constraints, regional and local
climate and their influence on elevational richness of bats
sequentially.
Sampling and interpolation
All empirical studies have sampling limitations due to the very
nature of field studies — limitations in time and money, person-
nel, trapping methodologies and taxonomic variation in capture
rates, etc. Certain sampling designs may lead to biased species
richness patterns (McCoy, 1990; Colwell & Hurtt, 1994; Grytnes
& Vetaas, 2002). To address sampling concerns, first, for the
quantitative analyses I considered only those data sets without
obvious sampling biases or disturbance trends (44% meet my
criteria, see Table 1 and Appendix S1 in Supplementary Mate-
rial). Second, for the remaining studies, I explicitly examined the
influence of general undersampling and interpolation with vari-
ous range augmentation regimes (see Appendix S2 in Supple-
mentary Material). The error regimes ranged from least realistic
with uniform undersampling to most realistic with randomiza-
tions based on decreasing probabilities of error and decreasing
magnitudes of error from smaller to larger range sizes. With all
error regimes, decreasing species richness patterns remained
decreasing with elevation — either unchanged in shape or pla-
teauing at the lower elevations (Fig. 2a). Colombia was the only
exception in a few error scenarios (2.8% of the cases).
The amount of error needed to change a mid-elevational spe-
cies richness pattern to a decreasing or low plateau was large
(Fig. 2b). On average, a decreasing richness pattern occurred
after adding nearly 2000–3000+ m to ranges in the various error
regimes. Such large errors are highly unlikely. Ecuador and
Yosemite showed the most response to large errors. The error
necessary for bat richness in Ecuador and Yosemite to decrease
with elevation is to add 1080 m and 1962 m, respectively, for uni-
form error, 1080 m and 2170 m, respectively, for uniform error
by range size (small) and more for the randomized simulations.
Ecuador could be undersampled sufficiently that the true pattern
is decreasing, but this further supports the temperature–water
relationship, whereas the Yosemite richness pattern is independ-
ently verified by Grinnell’s early work on the mountain, as he
found the same elevational pattern in bat richness (Grinnell &
Storer, 1924) when only sampling bats with shotguns. Thus, both
decreasing and unimodal patterns for bats are supported even
given a basic level of undersampling.
Spatial constraints
Spatial constraints on species ranges have been theoretically
implicated and, in some cases, empirically supported to be a con-
tributing factor to mid-elevational peaks in species richness
(Colwell
et al
., 2004 and references therein). Regardless of size,
latitude or climatic regime of the mountain, the mid-domain
effect (MDE) predicts species richness to peak at the middle of
the gradient. Elevational richness of bats does not coincide with
the predictions of the MDE: only three of the gradients had
r
2
> 40% while the other nine had
r 2 < 7% (Fig. 1; Appendix S1
in Supplementary Material). Wide scatter and low predictive
ability diminish the generality of the null model as an explanation
for elevational richness patterns of bats (average r 2 = 0.156).
Additionally, latitudinal trends in the MDE — temperate, elevational
Figure 5 Preliminary elevational species richness patterns for bats of western Peru based on specimen data from 12 US museum collections in the MaNIS database. The line with circles represents the pattern for all species and the smooth line represents the pattern for only those species with ≥ 10 specimens.
C. M. McCain
© 2006 The Author10 Global Ecology and Biogeography, 16, 1–13, Journal compilation © 2006 Blackwell Publishing Ltd
richness fit MDE predictions more than tropical — expose the fact
that richness patterns do change in relation to latitude and climate
so that the simple assumption of the MDE cannot be upheld.
The average MDE fit is lower than that found for non-volant
small mammals on elevational gradients globally (r 2 = 0.238;
McCain, 2005). Thus, for the two most speciose groups of
mammals, elevational patterns are not directly consistent with
the MDE. Species richness peaks were shifted consistently
towards lower elevations with only three higher than the moun-
tain mid-point. There was a slight effect of sampling scale, as
alpha data fit null model predictions slightly better than did
gamma data. This was in contrast to small mammals which
demonstrated higher fits to null models in gamma rather than
alpha data. Overall, the consistent deviations from null model
predictions and latitudinal richness trends patterns suggest
underlying climatic drivers.
Climatic drivers
The elevation of highest species richness was positively related to
latitude (Fig. 3): highest richness was at low elevations in the
tropics, but at mid-slope in the temperate zone. Intermediate
latitudes in Mexico, which show an overlap of temperate and
tropical habitats and species, demonstrate both richness patterns
on mountainsides. This suggests that regional climate deter-
mines the elevational species richness pattern of bats. But this
strong latitudinal trend is misleading, because of differences in
the local climatic regime of mountains sampled in each latitu-
dinal zone. In the temperate zone, only mountains with dry or
arid conditions at the bases were surveyed, whereas in the tropics
only warm, wet mountains were surveyed.
On all mountains temperature decreased with elevation.
Water availability was highest at mid-elevation on arid moun-
tains and high across a broad zone of low to mid-elevations on
mountains in warm, wet climates. Highest bat species richness
occurred in the elevational zone where water and temperature
are simultaneously maximized (Fig. 4). This is illustrated by the
three Mexican mountains: the two with more arid conditions at
the base (Sierra Mazateca, Oaxaca and Sierra Manantlán, Jalisco)
had mid-elevational peaks in richness, while the wetter-based
mountain (Sierra Mixteca, Oaxaca) had a decreasing richness
pattern. Bat elevational studies also indicate a correlation between
species richness and abundance (Appendix S3 in Supplementary
Material). The most productive environments are predicted to
harbour both the highest abundance and the highest species
richness (Terborgh, 1977). Thus, the optimal combination of
temperature and water availability gradients may also indicate
that these are the most productive sites elevationally for bats.
Unfortunately, neither primary productivity nor an index of
productivity was measured in these studies.
To test the locally driven climate model further, I examined bat
faunas on an arid montane gradient at low latitude, western
Peru, and a warm, wet mountain at high latitude, the Olympics,
WA. The preliminary data for western Peru (Fig. 5) demonstrate
a mid-elevational peak as predicted. Bats on the Olympic
Mountains, WA, demonstrate the highest species richness at low
elevations, as predicted. Both inference from the meta-analyses
and support from test mountains identify local climate condi-
tions of temperature and water availability as the main drivers of
bat elevational species richness.
O’Brien (1993) demonstrated that species richness of woody
plants across southern Africa is a positive function of water and
a parabolic function of energy, and a variety of water–energy
models have since been shown to have explanatory power across
multiple large-scale geographical studies for plants and animals
(Hawkins et al., 2003; references therein). Additionally, water
and energy/temperature are correlated with elevational species
richness of epiphytes (Andes; Krömer et al. 2005) and ferns
(Himalayas; Bhattarai et al., 2004). Brown and Lomolino (1998)
also noted that highest species richness of most organisms in the
American Southwest was found at intermediate elevations, and
this may be due to the lack of water in arid environments at
the base. Clearly, water and energy regimes are essential to the
physiology of plants and directly influence distribution and
species richness (O’Brien, 1993; Hawkins et al., 2003; Bhattarai
et al., 2004; Krömer et al., 2005); but for animal richness pat-
terns, the question of interest becomes the relative importance of
direct (physiological) and indirect (resource) effects of water and
temperature on species richness patterns (Hawkins et al., 2003).
Bats are thought to be directly limited by the physiological/
thermoregulatory constraints of mammalian adaptations to flight
at cold temperatures (McNab, 1982; Graham, 1983; Patterson
et al., 1996; and references therein). Such studies stress that these
energetic constraints act as a ‘filter barrier’ to upward elevational
range expansion, and result in the hard limits of bat distributions
on mountain tops (Graham, 1983). Bat abundance, capture rates
and detection rates decrease with elevation and colder tempera-
tures (Appendix S3 in Supplementary Material; Terborgh, 1977;
Graham, 1983; Cerveny, 1998). Similarly, males are more
abundant than females at higher elevations, presumably because
females have greater energetic needs for gestation, lactation
and rearing of young (Grindal et al., 1999; Cryan et al., 2000).
Temperature could also influence bat species richness indirectly
through food resources and availability (Graham, 1983;
Szewczak et al., 1998). Insect abundance, fruit and nectar
production and abundances of many small vertebrates are all
predicted to be low under cold temperature regimes (e.g. Janzen,
1973; Janzen et al., 1976; Fauth et al., 1989; Loiselle & Blake,
1991; Navas, 2003).
Successful exploitation of desert ecosystems necessitates the
evolution of adaptations to extreme temperatures for water con-
servation and salt balance. These adaptations can be behavioural,
such as occupation of cool, subterranean caves, fluctuation in
activity levels or physiological adaptations for waste and water
regulation in the excretory system (McNab, 1982); but the arid
environment may have strong ecological constraints on the
abundance of food resources. Most arid plants occur in low
abundances and limit fruit, nectar and seed output due to water
limitations (e.g. Noy-Meir, 1973; MacMahon, 1997). Similarly,
insect abundances must be limited by water availability and
therefore are likely to be much more patchily distributed in arid
environments (e.g. Janzen, 1973; MacMahon, 1997; Perrin &
Global analysis of bat elevational species richness
© 2006 The AuthorGlobal Ecology and Biogeography, 16, 1–13, Journal compilation © 2006 Blackwell Publishing Ltd 11
Boyer, 2000). Thus, it appears that the optimal conditions for bat
species richness — warm and wet — may be the most optimal
conditions for their food resources.
General conclusions
From the data sets on bat species richness along elevational gra-
dients collected so far, two different patterns are supported:
decreasing richness with increasing elevation, and richness peaks
at mid-elevation. Null model analyses indicate that climatic fac-
tors, not spatial constraints, are most consistent with elevational
richness trends. Two factors, temperature and water availability,
explain a large amount of variation in bat species richness. A gen-
eralized model of these overlapping climatic gradients (Fig. 4)
leads to testable predictions for unexamined mountain slopes
and other taxonomic groups. Preliminary results for bats on two
new mountains strongly support the predictions of the proposed
climatic model. Shapes of the temperature and particularly
moisture functions can be modified to allow for variation seen in
different regions and climates. For example, plateaus in water
availability at warm temperatures would predict corresponding
plateaus in bat species richness. For those taxa that may respond
similarly to these climatic factors, similar elevational richness
patterns would be expected. Some candidate taxa are birds,
particularly small-bodied clades tied to insect, fruit or nectar
food resources, some insect clades, for instance moths, and
possibly certain amphibian clades. Other taxonomic groups may
need additional environmental factor(s) included in the model.
The trends found herein present opportunities for tests on
empirical gradients in the future that applied in a systematic
fashion should lead to a deeper understanding of how elevational
gradients in species richness are structured.
ACKNOWLEDGEMENTS
I am indebted to the researchers whose work is reanalysed herein.
Thank you to all who suggested researchers with potential work
on elevational richness of bats. Bill Langford graciously acted as
a sounding board for the ideas and trends noted herein. I thank
Thor Holmes, Bill Langford, Michael Patten, Norm Slade,
Richard Stevens, Bob Timm and two anonymous referees for
their rigorous editorial and scientific suggestions. This work was
conducted while I was a postdoctoral associate at the National
Center for Ecological Analysis and Synthesis, a Center funded by
NSF (Grant no. DEB-0072909), the University of California, and
the Santa Barbara campus.
REFERENCES
Adams, R.A. (2003) Bats of the Rocky Mountain West: natural
history, ecology, and conservation. University Press of Colorado,
Boulder.
Barataud, M. (2004) Frèquentation des paysages sud-alpins par
des chiroptères en activité de chasse. Le Rhinolophe, 17, 11–22.
Barry, R.G. (1992) Mountain weather and climate. Routledge,
London.
Bhattarai, K.R., Vetaas, O.R. & Grytnes, J.A. (2004) Fern species
richness along a central Himalayan elevational gradient,
Nepal. Journal of Biogeography, 31, 389–400.
Brown, J.H. (1988) Species diversity. Analytical biogeography
(ed. by A. Myers and R.S. Giller), pp. 57–89. Chapman & Hall,
Chicago.
Brown, J.H. (2001) Mammals on mountainsides: elevational
patterns of diversity. Global Ecology and Biogeography, 10,
101–109.
Brown, J.H. & Lomolino, M.V. (1998) Biogeography, 2nd edn.
Sinauer Associates, Sunderland, MA.
Carrera-E., J.P. (2003) Distribución de murciélagos (Chiroptera)
a través de un gradiente altitudinal en las estribaciones orientales
de los Andes ecuatorianos. Unpublished dissertation, Depar-
tamento de Ciencas Biológicas, Pontificia Universidad Catolica
del Ecuador.
Cerveny, J. (1998) Bat communities of mountain peat bogs in the
Sumava Mts. (southwestern Bohemia, Czech Republic). Lynx
(Prague), 29, 11–21.
Colwell, R.K. & Hurtt, G.C. (1994) Nonbiological gradients in
species richness and a spurious Rapoport effect. The American
Naturalist, 144, 570–595.
Colwell, R.K. & Lees, D.C. (2000) The mid-domain effect:
geometric constraints on the geography of species richness.
Trends in Ecology & Evolution, 15, 70–76.
Colwell, R.K., Rahbek, C. & Gotelli, N.J. (2004) The mid-domain
effect and species richness patterns: what have we learned so
far? The American Naturalist, 163, E1–E23.
Colwell, R.K., Rahbek, C. & Gotelli, N.J. (2005) The mid-domain
effect: There’s a baby in the bathwater. The American Naturalist,
166, E149–E154.
Cryan, P.M., Bogan, M.A. & Altenbach, J.S. (2000) Effect of
elevation on the distribution of female bats in the Black Hills,
South Dakota. Journal of Mammalogy, 81, 719–725.
Fauth, J.E., Crother, B.I. & Slowinski, J.B. (1989) Elevational
patterns of species richness, evenness, and abundance of
the Costa Rican leaf-litter herpetofauna. Biotropica, 21,
178–185.
Fawcett, D. (1994) Bats. Surveys and conservation of biodiver-
sity in the Chocó, south-west Colombia (ed. by P. Salaman),
pp. 60–67. Birdlife International Study Report no. 69, Birdlife
International, Cambridge.
Flannery, T. (1990) Mammals of New Guinea, 2nd edn. Cornell
University Press, Ithaca.
Graham, G.L. (1983) Changes in bat diversity along an eleva-
tional gradient up the Peruvian Andes. Journal of Mammalogy,
64, 559–571.
Grinnell, J. & Storer, T.I. (1924) Animal life in the Yosemite.
University of California Press, Berkeley.
Grindal, S.D., Morissette, J.L. & Brigham, R.M. (1999)
Concentration of bat activity in riparian habitats over an
elevational gradient. Canadian Journal of Zoology, 77, 972–
977.
Grytnes, J.A. (2003) Species-richness patterns of vascular plants
along seven altitudinal transects in Norway. Ecography, 26,
291–300.
C. M. McCain
© 2006 The Author12 Global Ecology and Biogeography, 16, 1–13, Journal compilation © 2006 Blackwell Publishing Ltd
Grytnes, J.A. & Vetaas, O.R. (2002) Species richness and altitude:
a comparison between null models and interpolated plant
species richness along the Himalayan altitudinal gradient,
Nepal. The American Naturalist, 159, 294–304.
Handley, C.O. Jr (1976) Mammals of the Smithsonian Venezuelan
project. Brigham Young University Science Bulletin, Biological
Series, 20, 1–91.
Hawkins, B.A., Field, R., Cornell, H.V., Currie, D.J., Guégan,
J.-F., Kaufman, D.M., Kerr, J.T., Mittelbach, G.G., Oberdorff,
T., O’Brien, E., Porter, E.E. & Turner, J.R.G. (2003) Energy,
water, and broad-scale geographic patterns of species richness.
Ecology, 84, 3105–3117.
Hawkins, B.A., Diniz-Filho, J.A.F. & Weis, A.E. (2005) The
mid-domain effect and diversity gradients: is there anything to
learn? The American Naturalist, 166, E140–E143.
Heaney, L.R. (2001) Small mammal diversity along elevational
gradients in the Philippines: an assessment of patterns and
hypotheses. Global Ecology and Biogeography, 10, 15–39.
Heaney, L.R., Heideman, P.D., Rickart, E.A., Utzurrum, R.C.B. &
Klompen, J.S.H. (1989) Elevational zonation of mammals in
the central Philippines. Journal of Tropical Ecology, 5, 259–280.
Heaney, L.R., Balete, D.S., Rickart, E.A., Utzurrum, R.C.B. &
Gonzales, P.C. (1999) Mammalian diversity on Mount Isarog,
a threatened center of endemism on southern Luzon Island,
Philippines. Fieldiana: Zoology (New Series), 95, 1–62.
Hoffmeister, D.F. (1986) Mammals of Arizona. The University of
Arizona Press, Tucson.
Iñiguez Davalos, L.I. (1993) Patrones ecologicos en la comuni-
dad de murcielagos de La Sierra de Manantlan. Avances en el
estudio de los mamíferos de Mexico (ed. by R.A. Medellin and
G. Ceballos), pp. 355–370. Publicaciones Especiales, Vol. 1,
Associación Mexicana de Mastozoologia, A. C. Districto
Federal, Mexico.
Janzen, D.H. (1973) Sweep samples of tropical foliage insects:
effects of seasons, vegetation types, elevation, time of day, and
insularity. Ecology, 54, 687–708.
Janzen, D.H., Ataroff, M., Farinas, M., Reyes, S., Rincon, N.,
Soler, A., Soriano, P. & Vera, M. (1976) Changes in the arthropod
community along an elevational transect in the Venezuelan
Andes. Biotropica, 8, 193–203.
Juste, B.J. & Pérez del Val, J. (1995) Altitudinal variation in the
subcanopy fruit bat guild in Bioko Island, Equatorial Guinea,
Central Africa. Journal of Tropical Ecology, 11, 141–146.
Krömer, T., Kessler, M., Gradstein, S.R. & Acebey, A. (2005)
Diversity patterns of vascular epiphytes along an elevational
gradient in the Andes. Journal of Biogeography, 32, 1779–1809.
Loiselle, B.A. & Blake, J.G. (1991) Temporal variation in birds
and fruits along an elevational gradient in Costa Rica. Ecology,
72, 180–193.
Lomolino, M.V. (2001) Elevation gradients of species-density:
historical and prospective views. Global Ecology and Biogeography,
10, 3–13.
MacMahon, J.A. (1997) Deserts. Chanticleer Press, Inc., New York.
McCain, C.M. (2003) North American desert rodents: a test of the
mid-domain effect in species richness. Journal of Mammalogy,
84, 967–980.
McCain, C.M. (2004) The mid-domain effect applied to eleva-
tional gradients: species richness of small mammals in Costa
Rica. Journal of Biogeography, 31, 19–31.
McCain, C.M. (2005) Elevational gradients in diversity of small
mammals. Ecology, 86, 366–372.
McCoy, E.D. (1990) The distribution of insects along elevational
gradients. Oikos, 58, 313–322.
McNab, B.K. (1982) The physiological ecology of South American
mammals. Mammalian biology in South America (ed. by M.A.
Mares and H.H. Genoways), pp. 187–207. Special Publications
Series, Pymatuning Laboratory of Ecology, University of Pitts-
burg, Linesville, PA.
Md. Nor, S. (2001) Elevational diversity patterns of small
mammals on Mount Kinabalu, Malaysia. Global Ecology and
Biogeography, 10, 41–62.
Medway, L. (1972) The distribution and altitudinal zonation of
birds and mammals on Gunong Benom. Bulletin of the British
Museum (Natural History), 23, 103–154.
Mollhagen, T.R. & Bogan, M.A. (1997) Bats of the Henry Moun-
tains region of southeastern Utah. Occasional Papers, Museum
of Texas Tech University, 170, 1–13.
Muñoz Arango, J. (1990) Diversidad y hábitos alimenticios de
murciélagos en transectos altitudinales a través de la Cordillera
Central de los Andes en Colombia. Studies on Neotropical
Fauna and Environment, 25, 1–17.
Navarro, L.D. & Leon-Paniagua, L. (1995) Community structure
of bats along an altitudinal gradient in tropical eastern Mexico.
Revista Mexicana de Mastozoología, 1, 9–21.
Navas, C.A. (2003) Herpetological diversity along Andean
elevational gradients: links with physiological ecology and
evolutionary physiology. Comparative Biochemistry and
Physiology Part A, 133, 469–485.
Noy-Meir, I. (1973) Desert ecosystems: environment and
producers. Annual Review of Ecology and Systematics, 4, 25–
51.
O’Brien, E.M. (1993) Climatic gradients in woody plant species
richness: towards an explanation based on an analysis of
southern Africa’s woody flora. Journal of Biogeography, 20,
181–198.
Patterson, B.D., Pacheco, V. & Solari, S. (1996) Distributions of
bats along an elevational gradient in the Andes of south-
eastern Peru. Journal of Zoology (London), 240, 637–658.
Perrin, M.R. & Boyer, D.C. (2000) Seasonal changes in the popu-
lation dynamics of hairy-footed gerbils in the Namib Desert.
South African Journal of Wildlife Research, 30, 73–84.
Pianka, E.R. (1966) Latitudinal gradients in species diversity: a
review of concepts. The American Naturalist, 100, 33–46.
Pierson, E.D., Rainey, W.E. & Corben, C. (2001) Seasonal patterns
of bat distribution along an altitudinal gradient in the Sierra
Nevada. Report to California State University at Sacramento
Foundation, Yosemite Association, and Yosemite Fund, CA.
Rahbek, C. (1995) The elevational gradient of species richness: a
uniform pattern? Ecography, 18, 200–205.
Rahbek, C. (1997) The relationship among area, elevation, and
regional species richness in Neotropical birds. The American
Naturalist, 149, 875–902.
Global analysis of bat elevational species richness
© 2006 The AuthorGlobal Ecology and Biogeography, 16, 1–13, Journal compilation © 2006 Blackwell Publishing Ltd 13
Rahbek, C. (2005) The role of spatial scale and the perception of
large-scale species-richness patterns. Ecology Letters, 8, 224–
239.
Rickart, E.A. (2001) Elevational diversity gradients, biogeography
and the structure of montane mammal communities in the
intermountain region of North America. Global Ecology and
Biogeography, 10, 77–100.
Rickart, E.A., Heaney, L.R., Heideman, P.D. & Utzurrum, R.C.B.
(1999) The distribution and ecology of mammals on Leyte,
Biliran, Maripipi Islands. Fieldiana: Zoology, 72, 1–62.
Rohde, K. (1992) Latitudinal gradients in species diversity: the
search for the primary cause. Oikos, 65, 514–527.
Sánchez-Cordero, V. (2001) Elevation gradients of diversity
for rodents and bats in Oaxaca, Mexico. Global Ecology and
Biogeography, 10, 63–76.
Sanders, N.J. (2002) Elevational gradients in ant species richness:
area, geometry, and Rapoport’s rule. Ecography, 25, 25–32.
Sanders, N.J., Moss, J. & Wagner, D. (2003) Patterns of ant
species richness along elevational gradients in an arid eco-
system. Global Ecology and Biogeography, 12, 93–102.
Stevens, R.D. (2004) Untangling latitudinal richness gradients at
higher taxonomic levels: familial perspectives on the diversity
of New World bat communities. Journal of Biogeography, 31,
665–674.
Szewczak, J.M., Szewczak, S.M., Morrison, M.L. & Hall, L.S.
(1998) Bats of the White-Inyo Mountains of California-Nevada.
Great Basin Naturalist, 58, 66–75.
Tamsitt, J.R. (1965) Aspects of altitudinal distribution of Chirop-
terans in the Eastern Cordillera of Colombia. American
Zoologist, 5, 733–734.
Terborgh, J. (1977) Bird species diversity on an Andean eleva-
tional gradient. Ecology, 58, 1007–1019.
Timm, R.M. & LaVal, R.K. (2000) Mammals. Monteverde: ecology
and conservation of a tropical cloud forest (ed. by N.M. Nadkarni
and N.T. Wheelwright), pp. 223–244, 408–409, 553–560.
Oxford University Press. Oxford.
Willig, M.R., Patterson, B.D. & Stevens, R.D. (2003) Patterns of
range size, richness, and body size. Bat ecology (ed. by T.H. Kunz
and M. Brock Fenton), pp. 580–621. University of Chicago
Press, Chicago.
Wilson, D.E. & Reeder, D.M. (1993) Mammal species of the world:
a taxonomic and geographic reference. Smithsonian Institution
Press, Washington, DC.
Zapata, F.A., Gaston, K.J. & Chown, S.L. (2005) The mid-
domain effect revisited. The American Naturalist, 166,
E144–E148.
Editor: David Currie
SUPPLEMENTARY MATERIAL
The following material is available online at
www.blackwell-synergy.com/loi/geb
Appendix S1 Listing of all elevational transects of bat species
richness.
Appendix S2 Species richness error simulations using uniform
and randomized probabilities of range augmentation.
Appendix S3 Correlation statistics of abundance and species
richness estimates, and linear regression statistics for abundance
with elevation along elevational gradients of bats.
BIOSKETCH
Christy McCain is an ecologist focusing on large-scale
ecological patterns with particular emphasis on species
richness, abundance, and distribution patterns along
ecological gradients. She is also interested in null models,
ecological modelling of species ranges, montane
biogeography, and theoretical and empirical aspects
of the causes and maintenance of species diversity.
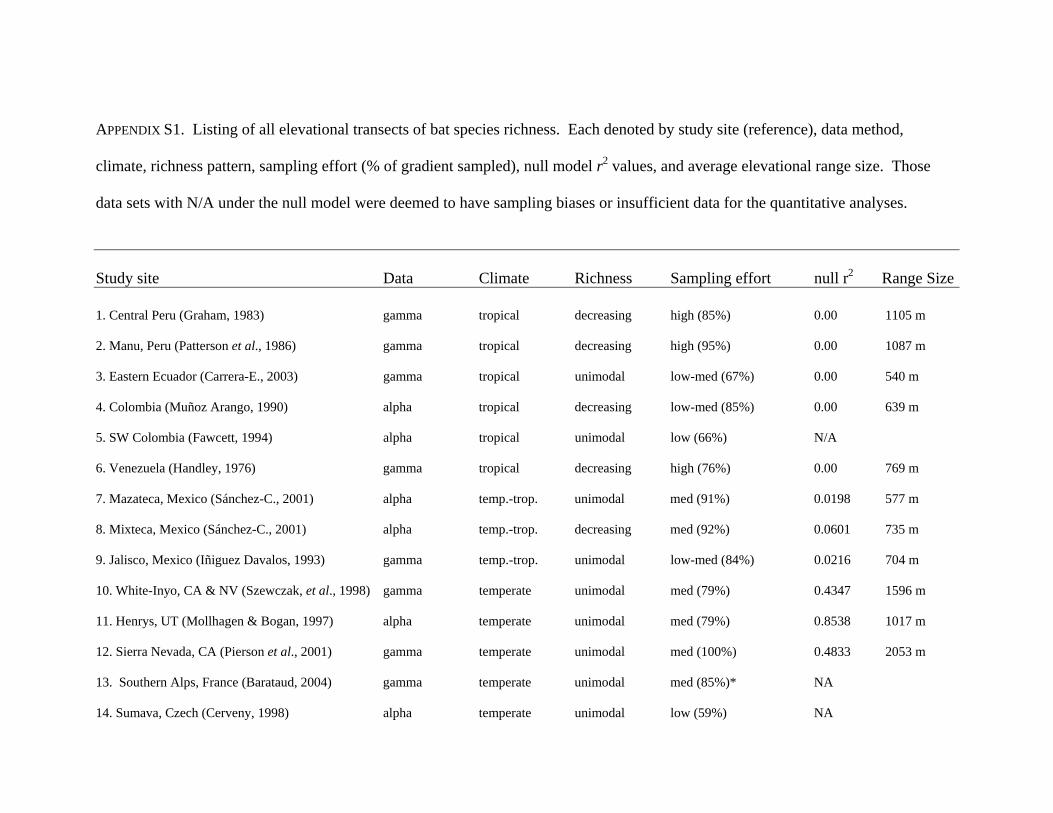
APPENDIX S1. Listing of all elevational transects of bat species richness. Each denoted by study site (reference), data method,
climate, richness pattern, sampling effort (% of gradient sampled), null model r2 values, and average elevational range size. Those
data sets with N/A under the null model were deemed to have sampling biases or insufficient data for the quantitative analyses.
Study site Data Climate Richness Sampling effort null r2 Range Size 1. Central Peru (Graham, 1983) gamma tropical decreasing high (85%) 0.00 1105 m 2. Manu, Peru (Patterson et al., 1986) gamma tropical decreasing high (95%) 0.00 1087 m 3. Eastern Ecuador (Carrera-E., 2003) gamma tropical unimodal low-med (67%) 0.00 540 m 4. Colombia (Muñoz Arango, 1990) alpha tropical decreasing low-med (85%) 0.00 639 m 5. SW Colombia (Fawcett, 1994) alpha tropical unimodal low (66%) N/A 6. Venezuela (Handley, 1976) gamma tropical decreasing high (76%) 0.00 769 m 7. Mazateca, Mexico (Sánchez-C., 2001) alpha temp.-trop. unimodal med (91%) 0.0198 577 m 8. Mixteca, Mexico (Sánchez-C., 2001) alpha temp.-trop. decreasing med (92%) 0.0601 735 m 9. Jalisco, Mexico (Iñiguez Davalos, 1993) gamma temp.-trop. unimodal low-med (84%) 0.0216 704 m 10. White-Inyo, CA & NV (Szewczak, et al., 1998) gamma temperate unimodal med (79%) 0.4347 1596 m 11. Henrys, UT (Mollhagen & Bogan, 1997) alpha temperate unimodal med (79%) 0.8538 1017 m 12. Sierra Nevada, CA (Pierson et al., 2001) gamma temperate unimodal med (100%) 0.4833 2053 m 13. Southern Alps, France (Barataud, 2004) gamma temperate unimodal med (85%)* NA 14. Sumava, Czech (Cerveny, 1998) alpha temperate unimodal low (59%) NA
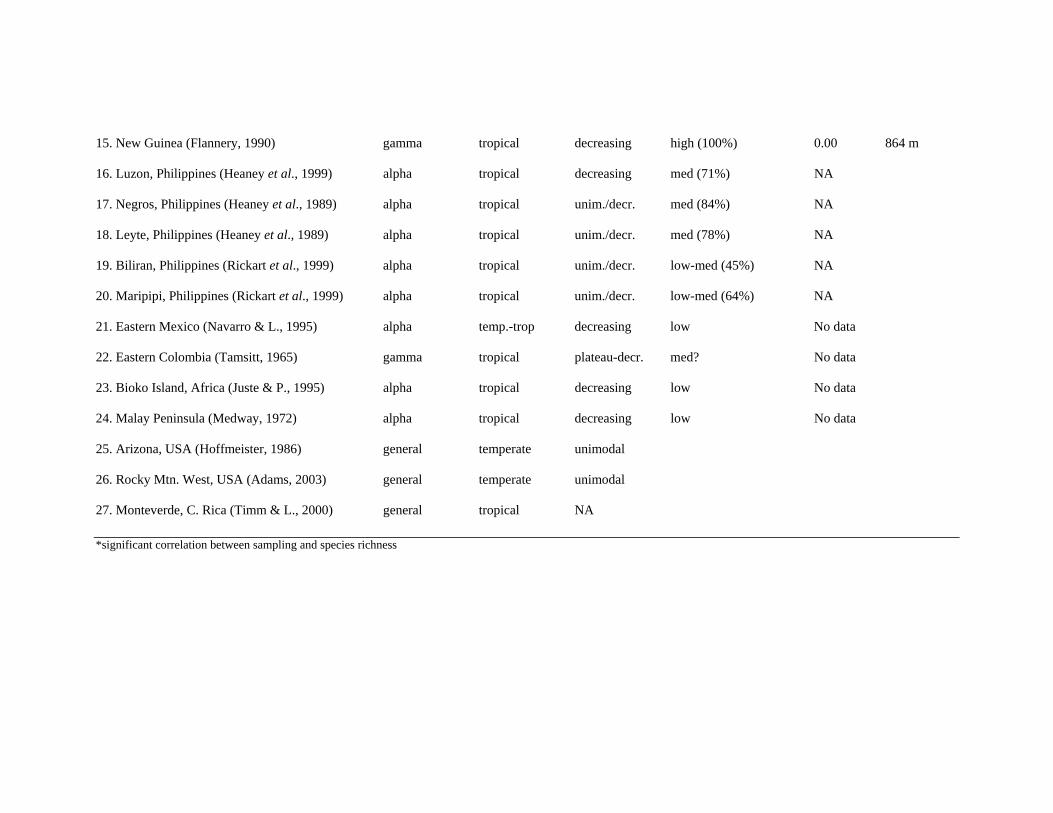
15. New Guinea (Flannery, 1990) gamma tropical decreasing high (100%) 0.00 864 m 16. Luzon, Philippines (Heaney et al., 1999) alpha tropical decreasing med (71%) NA 17. Negros, Philippines (Heaney et al., 1989) alpha tropical unim./decr. med (84%) NA 18. Leyte, Philippines (Heaney et al., 1989) alpha tropical unim./decr. med (78%) NA 19. Biliran, Philippines (Rickart et al., 1999) alpha tropical unim./decr. low-med (45%) NA 20. Maripipi, Philippines (Rickart et al., 1999) alpha tropical unim./decr. low-med (64%) NA 21. Eastern Mexico (Navarro & L., 1995) alpha temp.-trop decreasing low No data 22. Eastern Colombia (Tamsitt, 1965) gamma tropical plateau-decr. med? No data 23. Bioko Island, Africa (Juste & P., 1995) alpha tropical decreasing low No data 24. Malay Peninsula (Medway, 1972) alpha tropical decreasing low No data 25. Arizona, USA (Hoffmeister, 1986) general temperate unimodal 26. Rocky Mtn. West, USA (Adams, 2003) general temperate unimodal 27. Monteverde, C. Rica (Timm & L., 2000) general tropical NA *significant correlation between sampling and species richness
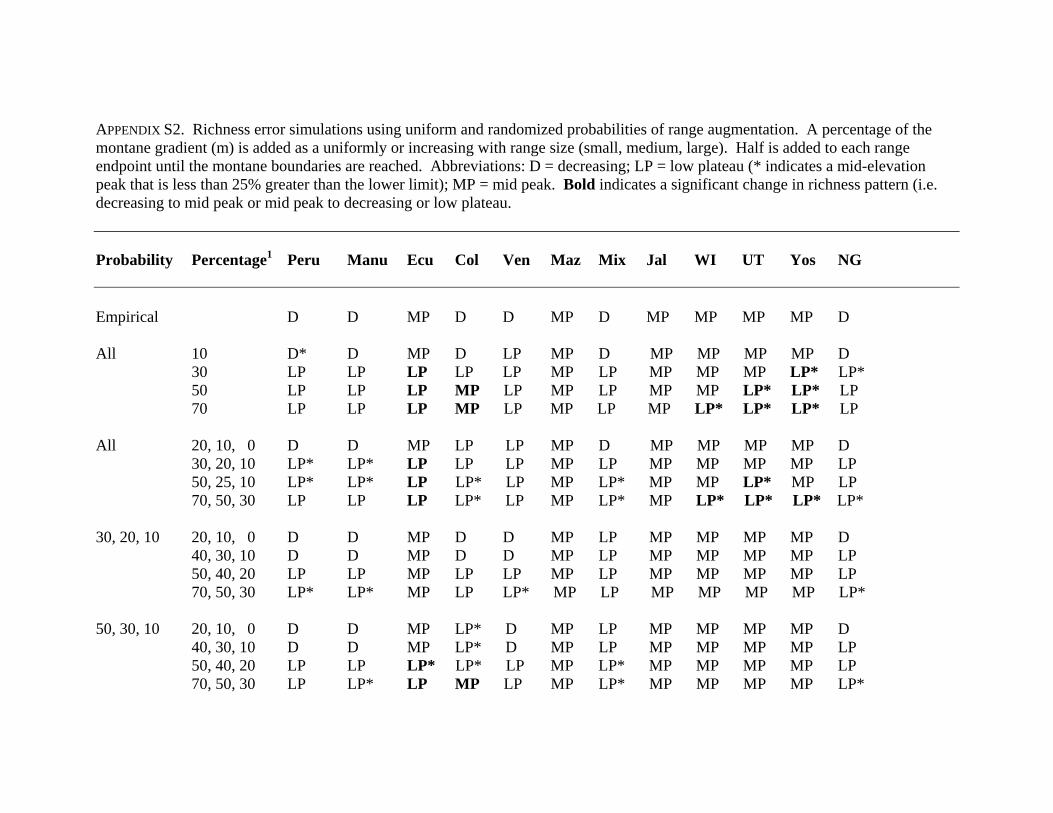
APPENDIX S2. Richness error simulations using uniform and randomized probabilities of range augmentation. A percentage of the montane gradient (m) is added as a uniformly or increasing with range size (small, medium, large). Half is added to each range endpoint until the montane boundaries are reached. Abbreviations: D = decreasing; LP = low plateau (* indicates a mid-elevation peak that is less than 25% greater than the lower limit); MP = mid peak. Bold indicates a significant change in richness pattern (i.e. decreasing to mid peak or mid peak to decreasing or low plateau. Probability Percentage1 Peru Manu Ecu Col Ven Maz Mix Jal WI UT Yos NG Empirical D D MP D D MP D MP MP MP MP D All 10 D* D MP D LP MP D MP MP MP MP D 30 LP LP LP LP LP MP LP MP MP MP LP* LP* 50 LP LP LP MP LP MP LP MP MP LP* LP* LP 70 LP LP LP MP LP MP LP MP LP* LP* LP* LP All 20, 10, 0 D D MP LP LP MP D MP MP MP MP D 30, 20, 10 LP* LP* LP LP LP MP LP MP MP MP MP LP 50, 25, 10 LP* LP* LP LP* LP MP LP* MP MP LP* MP LP 70, 50, 30 LP LP LP LP* LP MP LP* MP LP* LP* LP* LP* 30, 20, 10 20, 10, 0 D D MP D D MP LP MP MP MP MP D 40, 30, 10 D D MP D D MP LP MP MP MP MP LP 50, 40, 20 LP LP MP LP LP MP LP MP MP MP MP LP 70, 50, 30 LP* LP* MP LP LP* MP LP MP MP MP MP LP* 50, 30, 10 20, 10, 0 D D MP LP* D MP LP MP MP MP MP D 40, 30, 10 D D MP LP* D MP LP MP MP MP MP LP 50, 40, 20 LP LP LP* LP* LP MP LP* MP MP MP MP LP 70, 50, 30 LP LP* LP MP LP MP LP* MP MP MP MP LP*
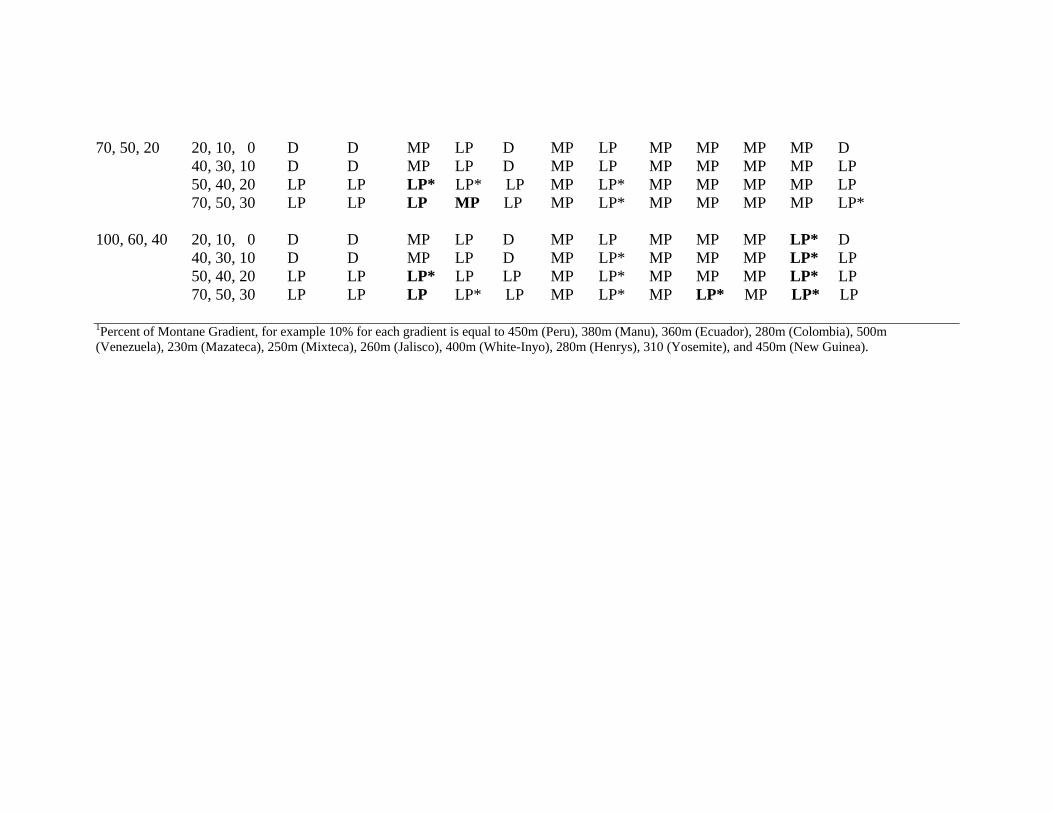
70, 50, 20 20, 10, 0 D D MP LP D MP LP MP MP MP MP D 40, 30, 10 D D MP LP D MP LP MP MP MP MP LP 50, 40, 20 LP LP LP* LP* LP MP LP* MP MP MP MP LP 70, 50, 30 LP LP LP MP LP MP LP* MP MP MP MP LP* 100, 60, 40 20, 10, 0 D D MP LP D MP LP MP MP MP LP* D 40, 30, 10 D D MP LP D MP LP* MP MP MP LP* LP 50, 40, 20 LP LP LP* LP LP MP LP* MP MP MP LP* LP 70, 50, 30 LP LP LP LP* LP MP LP* MP LP* MP LP* LP 1Percent of Montane Gradient, for example 10% for each gradient is equal to 450m (Peru), 380m (Manu), 360m (Ecuador), 280m (Colombia), 500m (Venezuela), 230m (Mazateca), 250m (Mixteca), 260m (Jalisco), 400m (White-Inyo), 280m (Henrys), 310 (Yosemite), and 450m (New Guinea).
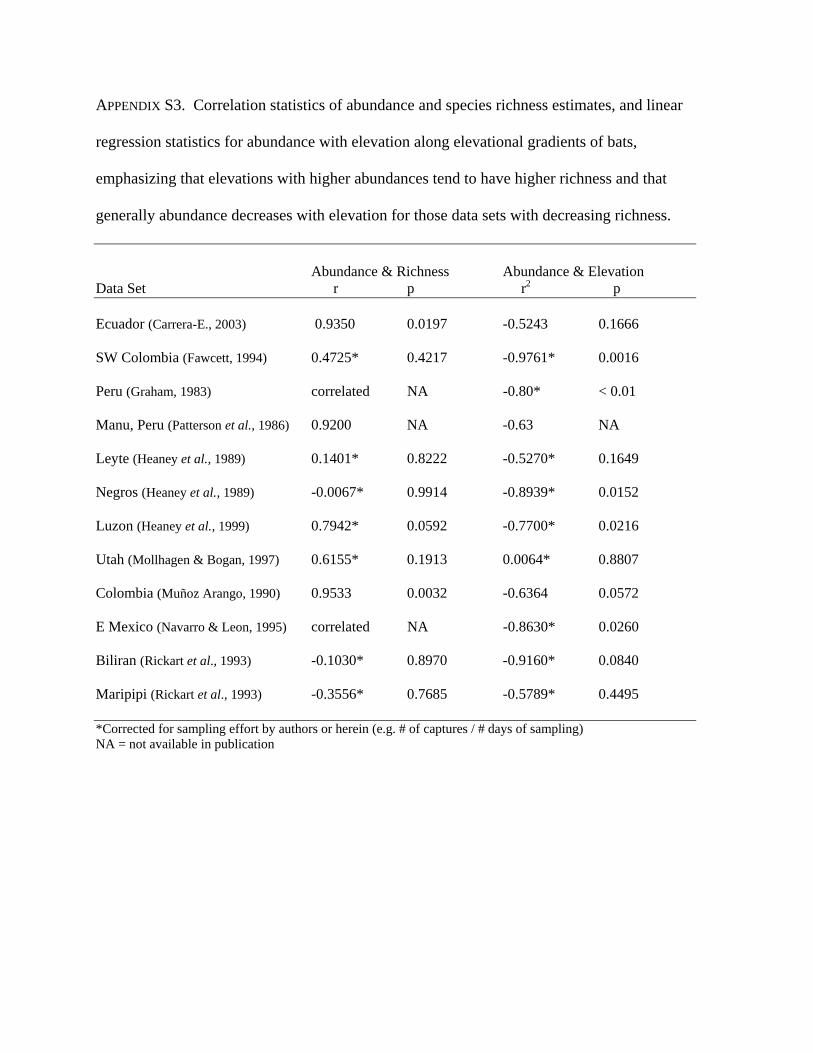
APPENDIX S3. Correlation statistics of abundance and species richness estimates, and linear
regression statistics for abundance with elevation along elevational gradients of bats,
emphasizing that elevations with higher abundances tend to have higher richness and that
generally abundance decreases with elevation for those data sets with decreasing richness.
Abundance & Richness Abundance & Elevation Data Set r p r2 p Ecuador (Carrera-E., 2003) 0.9350 0.0197 -0.5243 0.1666
SW Colombia (Fawcett, 1994) 0.4725* 0.4217 -0.9761* 0.0016
Peru (Graham, 1983) correlated NA -0.80* < 0.01
Manu, Peru (Patterson et al., 1986) 0.9200 NA -0.63 NA
Leyte (Heaney et al., 1989) 0.1401* 0.8222 -0.5270* 0.1649
Negros (Heaney et al., 1989) -0.0067* 0.9914 -0.8939* 0.0152
Luzon (Heaney et al., 1999) 0.7942* 0.0592 -0.7700* 0.0216
Utah (Mollhagen & Bogan, 1997) 0.6155* 0.1913 0.0064* 0.8807
Colombia (Muñoz Arango, 1990) 0.9533 0.0032 -0.6364 0.0572
E Mexico (Navarro & Leon, 1995) correlated NA -0.8630* 0.0260
Biliran (Rickart et al., 1993) -0.1030* 0.8970 -0.9160* 0.0840
Maripipi (Rickart et al., 1993) -0.3556* 0.7685 -0.5789* 0.4495
*Corrected for sampling effort by authors or herein (e.g. # of captures / # days of sampling) NA = not available in publication