Embed Size (px)
Citation preview

Deliverable D2.2.2 Part B v3.2 Dissemination Level (PU) Copyright SAFESPOT
Contract N. IST-4-026963-IP
D2.2.2 Part B Technology Review and Survey v3.3.doc Page 1 of 121 Subproject INFRASENS
SAFESPOT INTEGRATED PROJECT - IST-4-026963-IP
DELIVERABLE
SP2 – INFRASENSE – Infrastructure Platform
Deliverable No. D2.2.2
SubProject No. SP2 SubProject Title Infrasens
Workpackage No. WP2 Workpackage Title Needs and Requirements
Task No. Tasks 2.2 Task Title Technology Analysis
Main Authors Yannis Pavlis, Georgia Aifadopoulou CERTH
Status (F: final; D: draft; RD: revised draft): RD
Version No: V3.2
File Name: SF_D2 2 2_Part B_Tech_Review_v3 3
Issue Date: 26/10/2006
Project start date and duration 01 February 2006, 48 Months
D2.2.2 Part B Technology Review and Survey
Deliverable D2.2.2 Part B v3.2 Dissemination Level (PU) Copyright SAFESPOT
Contract N. IST-4-026963-IP
D2.2.2 Part B Technology Review and Survey v3.3.doc Page 2 of 121 Subproject INFRASENS
Revision Log Version Date Reason Name and Company
V1.0 23-05-06 Technology Analysis: methodology
Yannis Pavlis CERTH Georgia Aifadopoulou CERTH
V2.0 May/June 2006
Contributions of completed templates for state-of-the-art technology survey
Yannis Pavlis CERTH Matti Kutila VTT Javier Burgoa CIDAUT Tobias Schendzielorz TUM Nicolas Hautière LCPC Domenico Zagari MIZAR Arpi Barsi BME Kay Furstenberg IBEO
V3.0 10-10-06 Reorganisation and revision of material from Main Report and Annex 1 of D2.2.1
Yannis Pavlis CERTH
V3.1 20-10-06 Editing Javier Burgoa
V3.2 26-10-06 Addition of section on Galileo and EGNOS Joel Receveur SODIT
V3.3 02-11-06 Some corrections and minor reorganisation of Chapters 3 and 4
Seppo Rantala VTT
Deliverable D2.2.2 Part B v3.2 Dissemination Level (PU) Copyright SAFESPOT
Contract N. IST-4-026963-IP
D2.2.2 Part B Technology Review and Survey v3.3.doc Page 3 of 121 Subproject INFRASENS
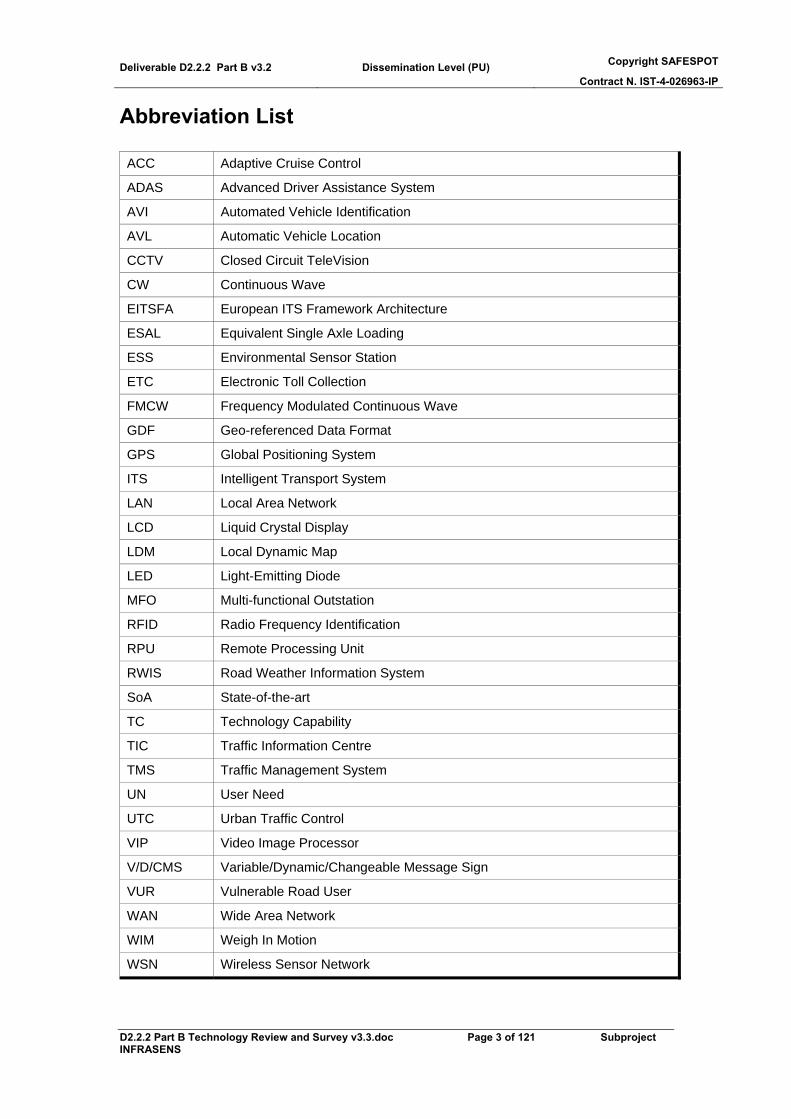
Abbreviation List ACC Adaptive Cruise Control
ADAS Advanced Driver Assistance System
AVI Automated Vehicle Identification
AVL Automatic Vehicle Location
CCTV Closed Circuit TeleVision
CW Continuous Wave
EITSFA European ITS Framework Architecture
ESAL Equivalent Single Axle Loading
ESS Environmental Sensor Station
ETC Electronic Toll Collection
FMCW Frequency Modulated Continuous Wave
GDF Geo-referenced Data Format
GPS Global Positioning System
ITS Intelligent Transport System
LAN Local Area Network
LCD Liquid Crystal Display
LDM Local Dynamic Map
LED Light-Emitting Diode
MFO Multi-functional Outstation
RFID Radio Frequency Identification
RPU Remote Processing Unit
RWIS Road Weather Information System
SoA State-of-the-art
TC Technology Capability
TIC Traffic Information Centre
TMS Traffic Management System
UN User Need
UTC Urban Traffic Control
VIP Video Image Processor
V/D/CMS Variable/Dynamic/Changeable Message Sign
VUR Vulnerable Road User
WAN Wide Area Network
WIM Weigh In Motion
WSN Wireless Sensor Network
Deliverable D2.2.2 Part B v3.2 Dissemination Level (PU) Copyright SAFESPOT
Contract N. IST-4-026963-IP
D2.2.2 Part B Technology Review and Survey v3.3.doc Page 4 of 121 Subproject INFRASENS
Table of contents Revision Log ............................................................................................................................................2 Abbreviation List......................................................................................................................................3 Table of contents ......................................................................................................................................4 List of Figures ..........................................................................................................................................5 List of Tables............................................................................................................................................5 EXECUTIVE SUMMARY ......................................................................................................................6 1. Introduction ......................................................................................................................................6
1.1. Innovation and Contribution to the SAFESPOT Objectives .................................................6 1.2. Methodology .........................................................................................................................6 1.3. Deliverable structure .............................................................................................................6
2. Approach to the Technology Review and Survey ............................................................................6 3. Overview of Technologies for Sensor, Dynamic Positioning and Alert Systems ............................6
3.1. Traffic Flow Sensors .............................................................................................................6 3.1.1. Inductive Loop Detectors .................................................................................................6 3.1.2. Pneumatic Road Tube.......................................................................................................6 3.1.3. Magnetic Sensors..............................................................................................................6 3.1.4. Microwave Radar .............................................................................................................6 3.1.5. Video Image Processing (Optical or Infrared)..................................................................6 3.1.6. Passive Infrared Sensors ...................................................................................................6 3.1.7. Active Infrared Sensor (or Laser Radar Sensors) .............................................................6 3.1.8. Ultrasonic Sensors ............................................................................................................6 3.1.9. Passive Acoustic Array Sensors .......................................................................................6 3.1.10. Networks of Sensors (Combined Detector Technologies)................................................6 3.1.11. Wireless Sensor Networks................................................................................................6 3.1.12. Video Surveillance ...........................................................................................................6
3.2. Vehicle Status Sensors ..........................................................................................................6 3.2.1. Weight-In-Motion (WIM) ................................................................................................6 3.2.2. Vehicle Profile Identifiers.................................................................................................6
3.3. Environmental Sensors..........................................................................................................6 3.4. Obstacle Ranging Sensors .....................................................................................................6 3.5. Dynamic Positioning Systems...............................................................................................6 3.6. Alert Systems ........................................................................................................................6
4. State-of-the-art Survey of Sensing Technologies .............................................................................6 5. References ........................................................................................................................................6
Deliverable D2.2.2 Part B v3.2 Dissemination Level (PU) Copyright SAFESPOT
Contract N. IST-4-026963-IP
D2.2.2 Part B Technology Review and Survey v3.3.doc Page 5 of 121 Subproject INFRASENS
List of Figures N/A
List of Tables Table 1: Vocabulary for Sensor, Mapping and Technology Use Case Development...............................6 Table 2: Field definitions of the sensor state-of-the-art survey template..................................................6 Table 3: Formalization of Sensor State-of-the-Art Survey Template.......................................................6 Table 4: Inductive Loop Sensor State-of-the-Art Template Example ......................................................6 Table 5: Laser Scanner - BME .................................................................................................................6 Table 6: Inductive Loop Detector - CERTH ............................................................................................6 Table 7; Magneto Resistive Sensor CERTH ............................................................................................6 Table 8: Pneumatic Tube - CIDAUT........................................................................................................6 Table 9: Piezoelectric Sensor - CIDAUT .................................................................................................6 Table 10: Doppler Radar Microwave Sensor - CIDAUT .........................................................................6 Table 15: Infrared Sensor - CIDAUT.......................................................................................................6 Table 12: Sensor Node - CRF...................................................................................................................6 Table 13: Temperature and Humidity Sensor - CRF................................................................................6 Table 14: Laserscanner – IBEO................................................................................................................6 Table 15: Visibility Sensor - LCPC..........................................................................................................6 Table 16: RFID Device - LCPC ...............................................................................................................6 Table 17: Magnets - LCPC.......................................................................................................................6 Table 18: Microphone - MIZAR ..............................................................................................................6 Table 23: Magneto Resistive Sensor - MIZAR ........................................................................................6 Table 20: Triple technology detection (radar/ultrasound/infrared) - MIZAR ..........................................6 Table 21: Mapping Systems - TA.............................................................................................................6 Table 22: Overhead and Sideways Passive Infrared Detector - TUM......................................................6 Table 23: Overhead Mixed Detector using a combination of Doppler Radar, Ultrasound and Passive
Infrared (ASIM TT Series Triple technology) - TUM.....................................................................6 Table 24: Camera with Obstacle Detection Capability - VTT..................................................................6 Table 25: NIR Camera - VTT...................................................................................................................6 Table 30: Infrared Imaging (NIR / FIR) - VTT........................................................................................6 Table 27: Far Infrared (FIR) Camera - VTT ............................................................................................6 Table 28 - Camera with Polarizer - VTT..................................................................................................6
Deliverable D2.2.2 Part B v3.2 Dissemination Level (PU) Copyright SAFESPOT
Contract N. IST-4-026963-IP
D2.2.2 Part B Technology Review and Survey v3.3.doc Page 6 of 121 Subproject INFRASENS
EXECUTIVE SUMMARY This document has been written to provide a summary of the activities carried out as part of the SAFESPOT project by the subproject INFRASENS. This deliverable is part of the Deliverable D.2.2.2. While Part A gives a summary of al the activities undertaken as part of the definition of the Needs and Requirements of the Infrastructure Platform, this document (Part B) focuses on the Technology Survey and Analysis. It reports the current State-of-the-Art of the sensing technologies and alert systems for road-based sensing. It covers a wide range of technologies already available on market and also still in development. For each of them, the advantages and disadvantages are assessed and the possible applications for co-operative safety suggested. This work was considered necessary as the first step to develop other innovative sensors and applications. Information on the performance of the sensing techniques was obtained through a survey carried out by experts among the INFRASENS partners. To ensure compatibility with other subprojects, a common approach in the definition of the different sensing techniques was agreed. The methodology used, allows a clear identification of existing technologies and their possibilities for developing applications related to co-operative safety systems from infrastructure point of view.
Deliverable D2.2.2 Part B v3.2 Dissemination Level (PU) Copyright SAFESPOT
Contract N. IST-4-026963-IP
D2.2.2 Part B Technology Review and Survey v3.3.doc Page 7 of 121 Subproject INFRASENS
1. Introduction
1.1. Innovation and Contribution to the SAFESPOT Objectives
The major contribution of the activities reported in this part of the deliverable is the detailed review and assessment made of a full set of technologies for infrastructure based sensing, which are being considered for the use in the INFRASENS Platform for co-operative safety.
1.2. Methodology The methodology for the technological analysis of infrastructure based sensor systems follows the outline:
WHAT – INTERACT – PURPOSE – SAFETY CRITICALITIES Specifically: By WHAT we mean such elements of the transportation system as: 1) the sensor systems and the dynamic positioning (and mapping) systems that allow the measurement/estimation/prediction of the safety state of the process in the transportation system, and 2) the alert system that enables the application of control/recommendation actions for the prevention of safety critical conditions and events. By INTERACT we mean the specific technology on which the three aforementioned systems are based on. By PURPOSE we mean the particular attributes of the transportation process that can be detected/monitored as well as the ways that safety prevention decisions can be applied. By SAFETY CRITICALITIES we mean the safety critical conditions and events or, in other words, the static and dynamic black spots that lead to any type of accidents/incidents that will be identified by SP5. In words, our methodology will review the state-of-the-art and state-of-the-practice and investigate emerging options for infrastructure-based sensor, locating, and alert systems, examine the corresponding technologies and analyze their advantages and disadvantages, analyze the corresponding detection, locating and display capabilities, and, finally, determine how these technical capabilities can be used towards the detection of safety critical conditions and events and in the application of corresponding prevention actions.
Deliverable D2.2.2 Part B v3.2 Dissemination Level (PU) Copyright SAFESPOT
Contract N. IST-4-026963-IP
D2.2.2 Part B Technology Review and Survey v3.3.doc Page 8 of 121 Subproject INFRASENS
1.3. Deliverable structure The deliverable is divided in three main sections: - Approach to the Technology Review and Survey: This section describes the methodology adopted for structuring the technology survey. A common vocabulary has been defined and a set of templates drawn up to facilitate the collection of the information. - Overview of Technologies: This part provides a full list of technologies for roadside sensing, dynamic positioning and roadside alert systems. It provides a brief description of the working principles of each of them, identifies their main strengths and weaknesses and also emerging trends. - Sensing Technology Survey: This consists of a set of templates which present the information gathered as part of the state-of-the-art survey of the roadside sensing technologies. It provides detailed information on their typical costs, features, operational performance, installation and maintenance needs, energy requirements, etc.
Deliverable D2.2.2 Part B v3.2 Dissemination Level (PU) Copyright SAFESPOT
Contract N. IST-4-026963-IP
D2.2.2 Part B Technology Review and Survey v3.3.doc Page 9 of 121 Subproject INFRASENS
2. Approach to the Technology Review and Survey Our analysis starts with a formal definition of the infrastructure-based sensor systems. In order to be in conformity with the European ITS Framework Architecture (EITSFA) we define the road-based sensor system as a separate Terminator. According to the EITSFA, a Terminator is defined as the link between the Framework Architecture and the outside world. It provides a definition of what the functionality in the Architecture expects the outside world to do, the data it is expected to provide and the data to be provided to it. A Terminator may be a human entity, a system or a physical entity from which such data can be obtained as e.g., the atmospheric conditions or the road surface status. Both human entities and systems may be part of Organizations or Public Authorities that contribute in some way to the provision of ITS related services. Specifically, for infrastructure-based sensor systems, a Terminator is a technical system external to an implementation of an ITS that enables the detection and surveillance for the management of the transportation system. It is installed in the vicinity of a road stretch and its major components are: 1) data/measurement acquisition device, 2) data collection and processing device, 3) communication (sub-) system between the sensor and local and/or central data processing units, 4) power supply. Typically, the information is refreshed at fixed periods and is available on request. It can be used for mobility purposes (e.g., determination of travel times, delays at signalized intersections, etc.) or for safety prevention (e.g., detection of safety critical conditions and events, accidents/incidents, etc.) on the part of the road network managed by the specific ITS implementation. Understandably, an infrastructure-based sensor is defined as the previously described four-component system. The different types of sensing system include: - Traffic Flow Systems. They provide information regarding aggregate and
disaggregate characteristics of traffic flow on any type of road (urban, freeways, suburban) such as e.g., presence data, traffic flow measurements, etc.
- Vehicle Status Systems. They provide information regarding the operational status of individual vehicles, such as broken down vehicle, etc.
- Environmental systems. They provide information regarding the road surface status and the weather conditions, such as e.g., ice on road indications, fog intensity data, etc.
- Obstacle Ranging Systems. They provide information on alive creatures or other physical objects that block the road.
Deliverable D2.2.2 Part B v3.2 Dissemination Level (PU) Copyright SAFESPOT
Contract N. IST-4-026963-IP
D2.2.2 Part B Technology Review and Survey v3.3.doc Page 10 of 121 Subproject INFRASENS
The alert system is also identified as a separate Terminator which we define as the technical system external to an implementation of an ITS that allows the transfer and appropriate display of information at the road network managed by the specific implementation. The information is in the form of messages, signs, and signals, and shall be provided on request. The alert system is installed in the vicinity of a road stretch and consists of 1) a display device, 2) communication (sub-) system from local units and/or the traffic management center to the display device, and 3) power supply. Finally, the dynamic positioning and mapping systems are already defined in the context of the EITSFA as the “Location Data Source” Terminator, and defined as the external entities that provide position information to an implementation of the EITSFA. Typically this information shall be provided continuously without any request. The information shall be used in the determination of the position of vehicles and travellers within the road network managed by the System. Positional information is useful when e.g., the location of a Public Transport vehicle is needed to determine the need for and timing of priority at junctions controlled by the System. In order to eliminate confusion, misconception, and misunderstanding among the partners on the triplet WHAT-INTERACTS-PURPOSE, a list of sensor systems (commercial or under research and development) available for the detection purposes listed above, as well as the dynamic positioning and mapping systems, the corresponding detection, and positioning/mapping technology(ies), and the specific types of data measurements that such systems provide. The list was circulated among partners and was extended by taking into account their comments and corrections. The resulting list serves not only as a platform of common understanding but also as a vocabulary that “standardizes” the related terminology, which increases the efficiency of the sensor survey analysis. The vocabulary is shown in Table 1 below. In the first column the Terminator/Actors for sensor and positioning systems are shown, in the second column the corresponding technologies are listed, and in the third column the corresponding types of data measurements that can be provided are shown. This practice was not followed for the alert systems due to the restrictive number of alternatives.

Deliverable D2.2.2 Part B v3.2 Dissemination Level (PU) Copyright SAFESPOT
Contract N. IST-4-026963-IP
D2.2.2 Part B Technology Review and Survey v3.3.doc Page 11 of 121 Subproject INFRASENS
Table 1: Vocabulary for Sensor, Mapping and Technology Use Case Development
A. Functionality Area B. Specific Technology C. Application/Measurements (Terminator/Actor) (Interaction) (Purpose)
1. Traffic Flow Sensors.
1. Vehicle Presence 2. Occupancy 3. Density 4. Volume (Flow rate) 5. Speed 6. Vehicle Headway 7. Incident Detection 8. Incident Surveillance/Clearance 9. Congestion/Queue Detection 10. Queue Length 11. Vehicle Re-identification 12. Vehicle Trajectory (e.g., for lane
changing, road departure, wrong way direction)
13. Link Travel Time 14. Visibility in the Vicinity of
Blocking-view Objects Note: Measurements 1-11 above could be provided for multiple lanes, or multiple zones (e.g., a single sensor covers both directions of traffic).
2. Vehicle Status Sensors
1. Vehicle Length 2. Vehicle Height 3. Vehicle Width 4. Vehicle Weight 5. Number of Axles 6. Multi-Lane 7. Vehicle Emissions 8. Vehicle Classification 9. Vehicle Operational Status
Note: Vehicle Class (Type) is inferred by items 1-5 above.
3. Environmental Sensors
1. Electromagnetic 2. Electrical 3. Magnetic 4. TV Camera 5. Video Image Processing 6. Doppler Radar 7. Microwave Radar 8. Laser 9. Ultrasonic 10. Infrared 11. Optical 12. Ultraviolet 13. Sound 14. MEMS 15. Atmospheric/Chemical
1. Temperature 2. Humidity 3. Precipitation 4. Wind 5. Pollution 6. Visibility Range 7. Fog 8. Lighting 9. Road Surface-Dry 10. Road Surface-Wet 11. Road Surface-Ice 12. Road Surface-Snow 13. Road Surface-Residual
Chemical Factor 14. Road Surface-Gravel/Sand 15. Road Surface-Temperature

Deliverable D2.2.2 Part B v3.2 Dissemination Level (PU) Copyright SAFESPOT
Contract N. IST-4-026963-IP
D2.2.2 Part B Technology Review and Survey v3.3.doc Page 12 of 121 Subproject INFRASENS
4. Obstacle Ranging 1. Stopped Vehicles 2. Debris (Rocks, Trees, etc.) 3. People/Animals
5. Dynamic Positioning Systems
1. 2D-Vehicle Position 2. 3D-Vehicle Position 3. Fixed Route Vehicle Position 4. Emergency Vehicle Position 5. Vehicle Velocity (i.e., Speed,
Direction) 6. Vehicle Time Offset 7. Landmarks (e.g., traffic signals,
signs, buildings, etc.) Note: Positioning measurements 1-4 above could be provided for multiple lanes or multiple zones (e.g., a single sensor covers both directions of traffic).
7. Mapping Systems
1. GPS 2. DGPS 3. GNSS 4. A-GNSS 5. GIS 6. RFID/Radio Signals 7. GSM/Wireless
Technologies 8. Inertial Sensors (e.g.,
Distance, Gyro) 9. Triangulation Methods 10. Dead Reckoning/Map
Matching 11. Location Referencing
(AGORA-C) 12. Signpost 13. Incremental Updates
(ActMap) 14. Digital Map
1. Road elements/Junctions 2. Type of Road
Elements/Junctions (e.g., highway, on-ramp, roundabout, etc.)
3. Class of Functionality of Road Elements (e.g., Major, Minor, etc.)
4. Number of Lanes 5. Traffic Restrictions (e.g., Access,
Driving, Vehicle Type, etc.) 6. Effectiveness Period of
Restrictions 7. Speed Limit 8. Direction of Traffic 9. Road Pavement Conditions (e.g.,
paved road)
The specific safety application purpose(s) that the sensor systems (positioning, or alert systems) serve reflect a User Need: in our case this is the researchers that are interested in the specific capabilities of sensor (positioning, or alert) systems so as to design and implement an ITS (SAFESPOT) that prevents safety critical conditions and events. Clearly, in the development context of SAFESPOT these are not the only users. The senor (positioning, or alert) system analysis should reflect the Needs of other relevant Users as the infrastructure managers, the authorities, the industry, and the service providers. Thus, besides the application purpose(s) other Users Needs that should be included in the analysis are: the accuracy of data, the sensitivity and reliability of the system, the sensor system average life cycle, possible operational restrictions of the system, the installation location, the purchase cost, the installation cost, the annual maintenance frequency and the corresponding cost, the annual repair cost, the annual life cycle cost, whether it is commercially available, and the strengths/weaknesses of the system.
Deliverable D2.2.2 Part B v3.2 Dissemination Level (PU) Copyright SAFESPOT
Contract N. IST-4-026963-IP
D2.2.2 Part B Technology Review and Survey v3.3.doc Page 13 of 121 Subproject INFRASENS
The last part of the analysis is associated with the SAFETY CRITICALITIES. Thus, our analysis will also investigate the Use Cases of sensor (positioning, or alert) systems; in other words, we examine safety application examples, or, Cases these systems shall be Used for the detection and prevention of safety critical conditions and events (that will be identified by SP5). As described in the definition of sensor and alert systems, there are additionally a couple of components that needs to be discussed: 1) the communication (sub-) system between the sensor (or alert) system and local data collecting and processing units and/or the Traffic Management Centre, and 2) the power supply (sub-) system. Specifically, regarding the communication system for sensor or alert systems aspects that need to be examined are: the communication medium and its unit cost, the type of data measurements, any possible intermediate devices, the data bandwidth, and possible remote monitoring capabilities. On the other hand, aspects that should be taken into account for the power supply are: the energy requirements, and the capability of autonomous operation. For dynamic positioning (and mapping) systems it is necessary to additionally consider the conditions under which specific attributes are available. The aforementioned aspects for the analysis of sensor, alert, or positioning systems are summarized in Table 2., which, additionally are defined in detail. The Table consists of three distinct parts: one that is characterized as “Sensor System Analysis” and follows the outline WHAT-INTERACT-PURPOSE-SAFETY CRITICALITIES, another which deals with the communication aspects, and a final which examines the power issues. To formalize the treatment, the fields of Table 2 have been formalized to harmonize the partners’ responses and increase the efficiency of the review process, and the new template for the State-of-the-Art analysis of sensor (positioning, or alert) systems is shown in Table 3. We include for a better understanding of this template, an example that is shown in Table 4 where we analyze the most widely used sensor system worldwide that is the inductive loop detectors. The results will be used as a reference for comparing the sensor alternatives that will appear after completion of the review process.
Deliverable D2.2.2 Part B v3.2 Dissemination Level (PU) Copyright SAFESPOT
Contract N. IST-4-026963-IP
D2.2.2 Part B Technology Review and Survey v3.3.doc Page 14 of 121 Subproject INFRASENS
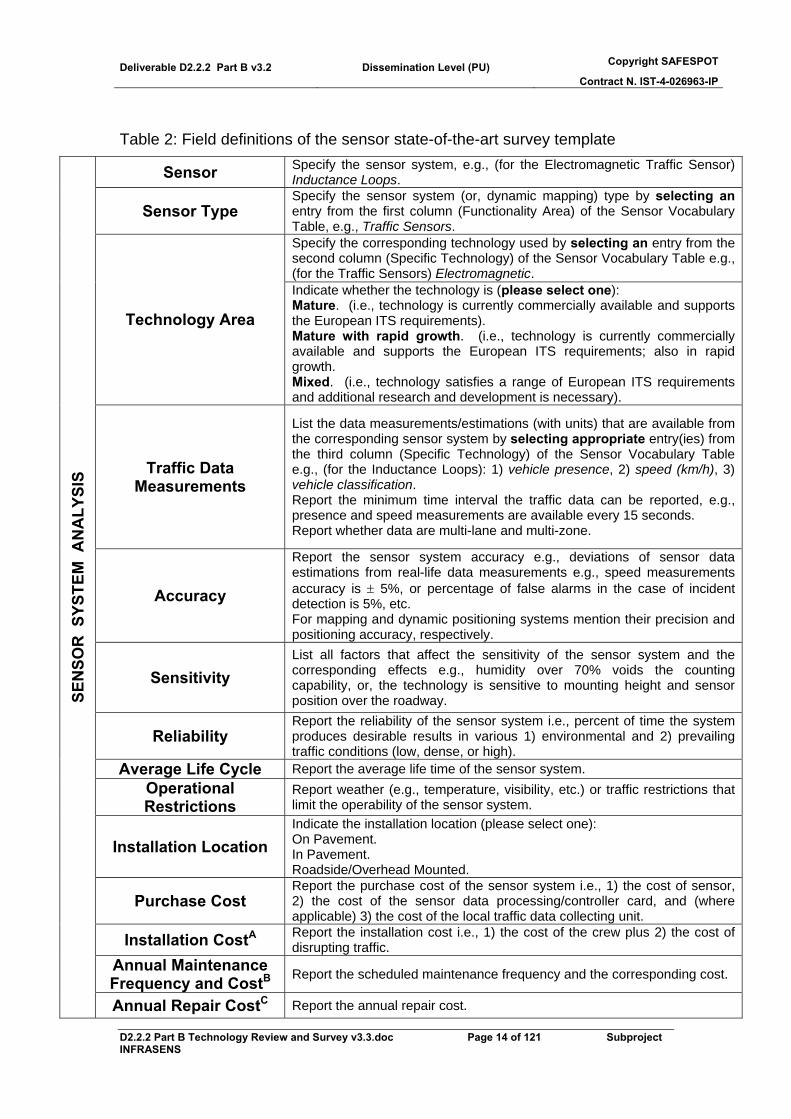
Table 2: Field definitions of the sensor state-of-the-art survey template
Sensor Specify the sensor system, e.g., (for the Electromagnetic Traffic Sensor) Inductance Loops.
Sensor Type Specify the sensor system (or, dynamic mapping) type by selecting an entry from the first column (Functionality Area) of the Sensor Vocabulary Table, e.g., Traffic Sensors. Specify the corresponding technology used by selecting an entry from the second column (Specific Technology) of the Sensor Vocabulary Table e.g., (for the Traffic Sensors) Electromagnetic.
Technology Area
Indicate whether the technology is (please select one): Mature. (i.e., technology is currently commercially available and supports the European ITS requirements). Mature with rapid growth. (i.e., technology is currently commercially available and supports the European ITS requirements; also in rapid growth. Mixed. (i.e., technology satisfies a range of European ITS requirements and additional research and development is necessary).
Traffic Data Measurements
List the data measurements/estimations (with units) that are available from the corresponding sensor system by selecting appropriate entry(ies) from the third column (Specific Technology) of the Sensor Vocabulary Table e.g., (for the Inductance Loops): 1) vehicle presence, 2) speed (km/h), 3) vehicle classification. Report the minimum time interval the traffic data can be reported, e.g., presence and speed measurements are available every 15 seconds. Report whether data are multi-lane and multi-zone.
Accuracy
Report the sensor system accuracy e.g., deviations of sensor data estimations from real-life data measurements e.g., speed measurements accuracy is ± 5%, or percentage of false alarms in the case of incident detection is 5%, etc. For mapping and dynamic positioning systems mention their precision and positioning accuracy, respectively.
Sensitivity List all factors that affect the sensitivity of the sensor system and the corresponding effects e.g., humidity over 70% voids the counting capability, or, the technology is sensitive to mounting height and sensor position over the roadway.
Reliability Report the reliability of the sensor system i.e., percent of time the system produces desirable results in various 1) environmental and 2) prevailing traffic conditions (low, dense, or high).
Average Life Cycle Report the average life time of the sensor system. Operational Restrictions
Report weather (e.g., temperature, visibility, etc.) or traffic restrictions that limit the operability of the sensor system.
Installation Location Indicate the installation location (please select one): On Pavement. In Pavement. Roadside/Overhead Mounted.
Purchase Cost Report the purchase cost of the sensor system i.e., 1) the cost of sensor, 2) the cost of the sensor data processing/controller card, and (where applicable) 3) the cost of the local traffic data collecting unit.
Installation CostA Report the installation cost i.e., 1) the cost of the crew plus 2) the cost of disrupting traffic.
Annual Maintenance Frequency and CostB Report the scheduled maintenance frequency and the corresponding cost.
SEN
SOR
SYS
TEM
AN
ALY
SIS
Annual Repair CostC Report the annual repair cost.
Deliverable D2.2.2 Part B v3.2 Dissemination Level (PU) Copyright SAFESPOT
Contract N. IST-4-026963-IP
D2.2.2 Part B Technology Review and Survey v3.3.doc Page 15 of 121 Subproject INFRASENS
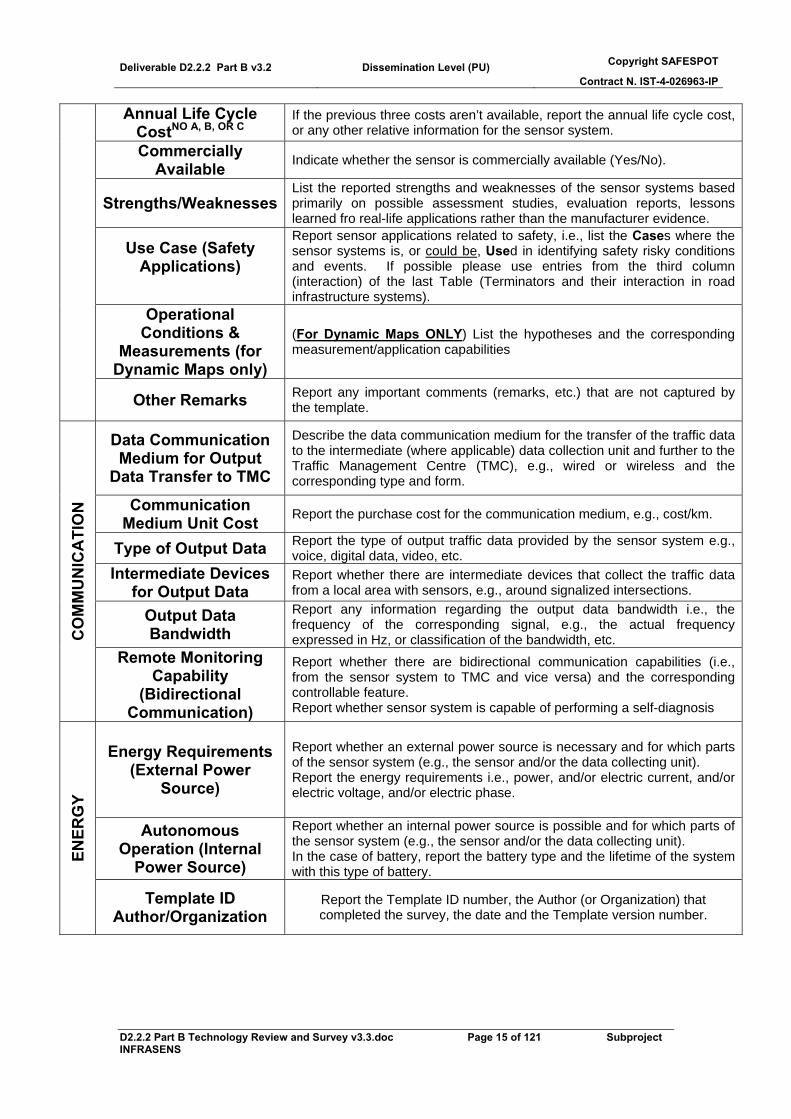
Annual Life Cycle CostNO A, B, OR C
If the previous three costs aren’t available, report the annual life cycle cost, or any other relative information for the sensor system.
Commercially Available Indicate whether the sensor is commercially available (Yes/No).
Strengths/Weaknesses List the reported strengths and weaknesses of the sensor systems based primarily on possible assessment studies, evaluation reports, lessons learned fro real-life applications rather than the manufacturer evidence.
Use Case (Safety Applications)
Report sensor applications related to safety, i.e., list the Cases where the sensor systems is, or could be, Used in identifying safety risky conditions and events. If possible please use entries from the third column (interaction) of the last Table (Terminators and their interaction in road infrastructure systems).
Operational Conditions &
Measurements (for Dynamic Maps only)
(For Dynamic Maps ONLY) List the hypotheses and the corresponding measurement/application capabilities
Other Remarks Report any important comments (remarks, etc.) that are not captured by the template.
Data Communication Medium for Output
Data Transfer to TMC
Describe the data communication medium for the transfer of the traffic data to the intermediate (where applicable) data collection unit and further to the Traffic Management Centre (TMC), e.g., wired or wireless and the corresponding type and form.
Communication Medium Unit Cost Report the purchase cost for the communication medium, e.g., cost/km.
Type of Output Data Report the type of output traffic data provided by the sensor system e.g., voice, digital data, video, etc.
Intermediate Devices for Output Data
Report whether there are intermediate devices that collect the traffic data from a local area with sensors, e.g., around signalized intersections.
Output Data Bandwidth
Report any information regarding the output data bandwidth i.e., the frequency of the corresponding signal, e.g., the actual frequency expressed in Hz, or classification of the bandwidth, etc. C
OM
MU
NIC
ATI
ON
Remote Monitoring Capability
(Bidirectional Communication)
Report whether there are bidirectional communication capabilities (i.e., from the sensor system to TMC and vice versa) and the corresponding controllable feature. Report whether sensor system is capable of performing a self-diagnosis
Energy Requirements (External Power
Source)
Report whether an external power source is necessary and for which parts of the sensor system (e.g., the sensor and/or the data collecting unit). Report the energy requirements i.e., power, and/or electric current, and/or electric voltage, and/or electric phase.
Autonomous Operation (Internal
Power Source)
Report whether an internal power source is possible and for which parts of the sensor system (e.g., the sensor and/or the data collecting unit). In the case of battery, report the battery type and the lifetime of the system with this type of battery.
ENER
GY
Template ID Author/Organization
Report the Template ID number, the Author (or Organization) that completed the survey, the date and the Template version number.

Deliverable D2.2.2 Part B v3.2 Dissemination Level (PU) Copyright SAFESPOT
Contract N. IST-4-026963-IP
D2.2.2 Part B Technology Review and Survey v3.3.doc Page 16 of 121 Subproject INFRASENS
Table 3: Formalization of Sensor State-of-the-Art Survey Template
Sensor
Sensor Type
Please check one: Mature. Mature with rapid growth. Mixed.
Measurement Min
Report Interval
Multi-lane Y/N
Multi-(detection) zone Y/N
1 2 3 4
Data Measurements
5 Measurement Accuracy 1 2 3 4
Accuracy
5 Factor Effect 1 2 3 4
Sensitivity
5 Reliability
Average Life Cycle
1 2 Operational
Restrictions 3
Installation Location
Please check one: In Pavement (embedded). On Pavement (non-intrusive). Roadside/Overhead Mounted (non-intrusive).
Purchase Cost Installation CostA
Annual Maintenance Frequency and CostB
SEN
SOR
SYS
TEM
AN
ALY
SIS
Annual Repair CostC

Deliverable D2.2.2 Part B v3.2 Dissemination Level (PU) Copyright SAFESPOT
Contract N. IST-4-026963-IP
D2.2.2 Part B Technology Review and Survey v3.3.doc Page 17 of 121 Subproject INFRASENS
Annual Life Cycle CostNO A, B, OR C
Commercially Available
Strengths Weaknesses 1 2 3
Strengths/Weaknesses
4
Example Cases Sensor Used for Detecting Safety-Risky Conditions and Events
1 2 3 4
Safety Applications (Use Case)
5 Condition Measurement 1 2 3 4
Operational Conditions &
Measurements (for Dynamic Maps only)
5
Other Remarks
Wire Type Wireless Form Mixed Data Communication Medium for Output
Data Transfer to TMC
Communication Medium Unit Cost
Type of Output Data Intermediate Devices
for Output Data
Output Data Bandwidth
Bidirectional (Y/N) Features Self-diagnosis (Y/N)
CO
MM
UN
ICA
TIO
N
Remote Monitoring Capability
(Bidirectional Communication)
Energy Requirements (External Power
Source)
Source Type Battery Type and System Lifetime EN
ERG
Y
Autonomous Operation (Internal
Power Source) Author/Organization Date Version Template ID
v 1.0
Deliverable D2.2.2 Part B v3.2 Dissemination Level (PU) Copyright SAFESPOT
Contract N. IST-4-026963-IP
D2.2.2 Part B Technology Review and Survey v3.3.doc Page 18 of 121 Subproject INFRASENS
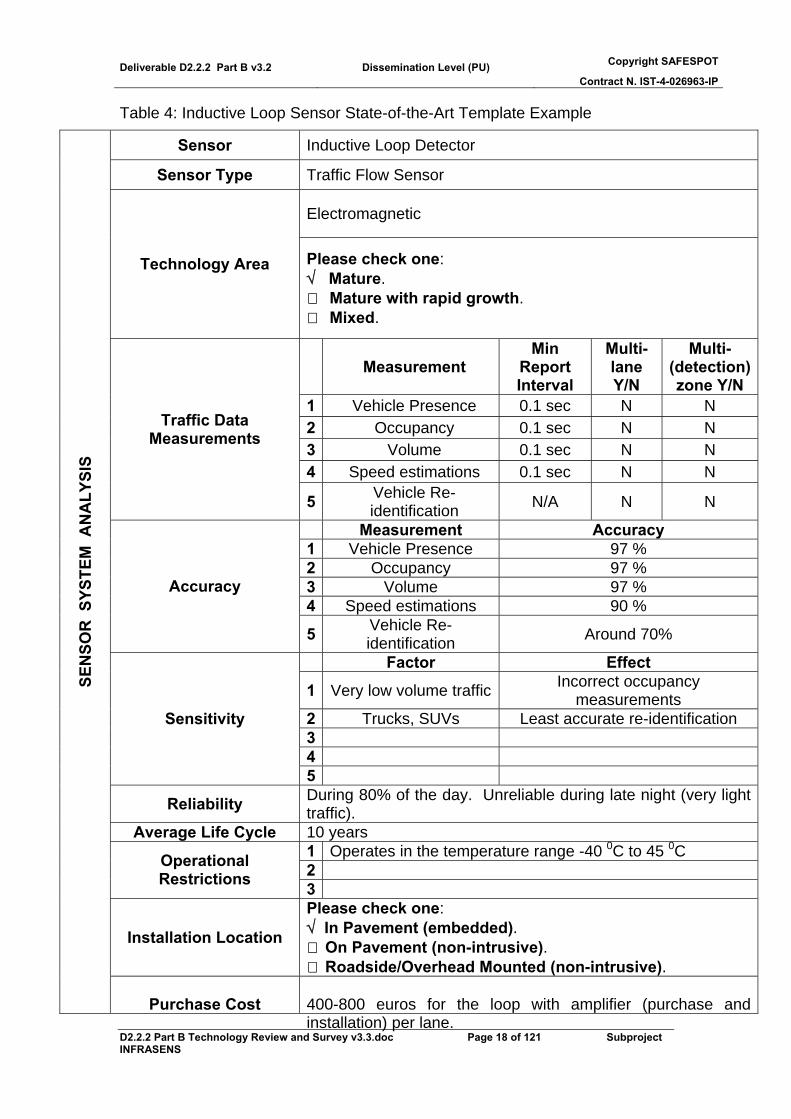
Table 4: Inductive Loop Sensor State-of-the-Art Template Example
Sensor Inductive Loop Detector
Sensor Type Traffic Flow Sensor
Electromagnetic
Technology Area Please check one: √ Mature.
Mature with rapid growth. Mixed.
Measurement Min
Report Interval
Multi-lane Y/N
Multi-(detection) zone Y/N
1 Vehicle Presence 0.1 sec N N 2 Occupancy 0.1 sec N N 3 Volume 0.1 sec N N 4 Speed estimations 0.1 sec N N
Traffic Data Measurements
5 Vehicle Re-identification N/A N N
Measurement Accuracy 1 Vehicle Presence 97 % 2 Occupancy 97 % 3 Volume 97 % 4 Speed estimations 90 %
Accuracy
5 Vehicle Re-identification Around 70%
Factor Effect
1 Very low volume traffic Incorrect occupancy measurements
2 Trucks, SUVs Least accurate re-identification 3 4
Sensitivity
5
Reliability During 80% of the day. Unreliable during late night (very light traffic).
Average Life Cycle 10 years 1 Operates in the temperature range -40 0C to 45 0C 2 Operational
Restrictions 3
Installation Location
Please check one: √ In Pavement (embedded).
On Pavement (non-intrusive). Roadside/Overhead Mounted (non-intrusive).
SEN
SOR
SYS
TEM
AN
ALY
SIS
Purchase Cost 400-800 euros for the loop with amplifier (purchase and installation) per lane.
Deliverable D2.2.2 Part B v3.2 Dissemination Level (PU) Copyright SAFESPOT
Contract N. IST-4-026963-IP
D2.2.2 Part B Technology Review and Survey v3.3.doc Page 19 of 121 Subproject INFRASENS
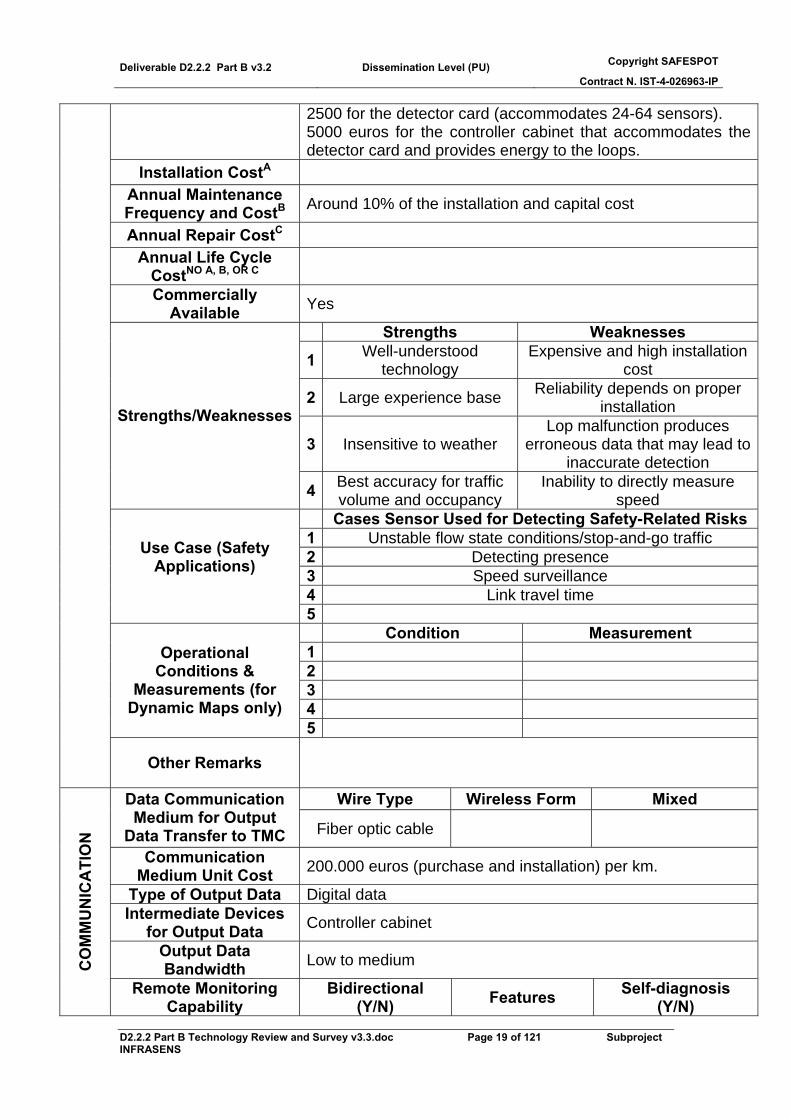
2500 for the detector card (accommodates 24-64 sensors). 5000 euros for the controller cabinet that accommodates the detector card and provides energy to the loops.
Installation CostA Annual Maintenance Frequency and CostB Around 10% of the installation and capital cost
Annual Repair CostC Annual Life Cycle
CostNO A, B, OR C
Commercially Available Yes
Strengths Weaknesses
1 Well-understood technology
Expensive and high installation cost
2 Large experience base Reliability depends on proper installation
3 Insensitive to weather Lop malfunction produces
erroneous data that may lead to inaccurate detection
Strengths/Weaknesses
4 Best accuracy for traffic volume and occupancy
Inability to directly measure speed
Cases Sensor Used for Detecting Safety-Related Risks 1 Unstable flow state conditions/stop-and-go traffic 2 Detecting presence 3 Speed surveillance 4 Link travel time
Use Case (Safety Applications)
5 Condition Measurement
1 2 3 4
Operational Conditions &
Measurements (for Dynamic Maps only)
5
Other Remarks
Wire Type Wireless Form Mixed Data Communication Medium for Output
Data Transfer to TMC Fiber optic cable
Communication Medium Unit Cost 200.000 euros (purchase and installation) per km.
Type of Output Data Digital data Intermediate Devices
for Output Data Controller cabinet
Output Data Bandwidth Low to medium C
OM
MU
NIC
ATI
ON
Remote Monitoring Capability
Bidirectional (Y/N) Features Self-diagnosis
(Y/N)

Deliverable D2.2.2 Part B v3.2 Dissemination Level (PU) Copyright SAFESPOT
Contract N. IST-4-026963-IP
D2.2.2 Part B Technology Review and Survey v3.3.doc Page 20 of 121 Subproject INFRASENS
(Bidirectional Communication) No No
Energy Requirements (External Power
Source)
A controller cabinet is powered by 50 Amp, 120/240 Volt, single phase service. A 170 controller units (detection card) accommodates 24 loop detectors.
Source Type Battery Type and System LifetimeAutonomous Operation (Internal
Power Source) No
Author/Organization Date Version 30/05/2006 v 1.0
ENER
GY
Template ID CERTH
Deliverable D2.2.2 Part B v3.2 Dissemination Level (PU) Copyright SAFESPOT
Contract N. IST-4-026963-IP
D2.2.2 Part B Technology Review and Survey v3.3.doc Page 21 of 121 Subproject INFRASENS
3. Overview of Technologies for Roadside Sensing, Dynamic Positioning and Alert Systems
The benefits of the systems for preventive safety cannot be realized unless the road users (drivers) are aware of the real-time conditions that prevail on the road network. The required information varies depending on the service being provided, which will determine the data collection frequency, the data accuracy, etc. While for a Traveller Information System, the user may only need to know whether there is a queue some miles ahead, users of a safety system need to far more detailed and accurate information. The many different technologies used for collecting detection and surveillance information range from sophisticated automated systems such as in-roadway or over-roadway sensors, closed circuit television (CCTV) system for viewing real-time video images of the roadway, road weather information systems for monitoring pavement and weather conditions, to simple and manual such as e.g., gathering traffic information from drivers via mobile phones. This section provides a brief overview of the current technologies available for detection and surveillance and summarizes the strengths and weaknesses of the corresponding commercially available sensors with a view to safety. A brief overview is also presented for one dynamic positioning and one alert systems. The types of data measurements that are provided by the sensor or positioning systems and shown in the third column of Table 4.2.1 are self-explanatory. For the sake of completeness, we provide the definitions of the three fundamental characteristics of (the aggregated) traffic flow: Occupancy: It is defined as the percent of time a given roadway stretch is occupied by a vehicle and can be used as a surrogate of traffic density. Occupancy is measured for each lane, with values ranging from 0% indicating that no vehicles passing over the stretch to 100% indicating that vehicles are stopped over the stretch. Volume: It is used to measure the quantity of traffic. It is defined as the number of vehicles observed to pass over a given point of a roadway stretch for a given period of time. It is typically used to predict the future prevailing of congestion on roadway stretches. Speed: This measurement determines the quality of traffic operations since it is easy to explain and understand. Measured speeds can be compared to nominal speed values for safety purposes, so if the measured (or estimated, or predicted) speed is below a target value it triggers an alarm for an incident detection system. Speed measurements are typically recorded for individual vehicles, then aggregated to characterize the traffic flux.
Deliverable D2.2.2 Part B v3.2 Dissemination Level (PU) Copyright SAFESPOT
Contract N. IST-4-026963-IP
D2.2.2 Part B Technology Review and Survey v3.3.doc Page 22 of 121 Subproject INFRASENS
Although occupancy, volume, and speed are the traditional types of data collected by sensors, today’s systems provide other types of data for traffic management purposes. Such data include e.g., vehicle travel times, vehicle location, queue length, pavement condition, atmospheric conditions, etc., see Table 1 for an overview. Based on whether their installation requires the disruption of traffic, sensors are categorized into embedded (or, in pavement systems) and non-embedded (which are further divided in pavement and roadside/overhead mounted) classes that are defined as follows: An embedded sensor is one that is embedded in the pavement of roadway, or in the subgrade of the roadway, or taped or otherwise attached on the surface of the roadway. A non-embedded sensor is one that is mounted above the surface of the roadway either above the roadway itself of alongside the roadway. However, our analysis will follow the categorization discussed above that depends on the particular role of the sensor in the detection and surveillance for traffic management purposes (and, in our case, for safety purposes). According to this criterion, sensors are categorized into: 1) traffic flow sensors, 2) vehicle status sensors, 3) environmental sensors, and 4) obstacle ranging sensors.
3.1. Traffic Flow Sensors A traffic flow sensor is a device that indicates the presence or passage of vehicles and provides data or information that can support traffic safety applications. Traditional types of data collected by a traffic flow sensor include vehicle presence, vehicle speed, volume and occupancy at a specific location in a roadway stretch. Other types of data for traffic management purposes include the vehicle travel time and queue length in a roadway stretch, vehicle classification, etc. For an overview of typical data measurements that can be obtained from such sensor systems see Table 1 This sensor category includes the most widely used sensor system worldwide that is the inductive loop detector. Due to its extensive adoption as the major mode of detection and surveillance for traffic management purposes it used as a comparison reference for the evaluation of other sensor systems. However, other promising sensors within this sensor category such as magnetometers, microwave radars, passive and active infrared sensors, acoustic sensors, etc. have found their way in the development of traffic management and in particular safety strategies that require vehicle detection and surveillance. A brief analysis of traffic flow sensors follows.
Deliverable D2.2.2 Part B v3.2 Dissemination Level (PU) Copyright SAFESPOT
Contract N. IST-4-026963-IP
D2.2.2 Part B Technology Review and Survey v3.3.doc Page 23 of 121 Subproject INFRASENS
3.1.1. Inductive Loop Detectors An inductive loop detector senses the presence of a conductive metal object by inducing currents in the object which reduce the loop inductance. They are installed in the surface of a roadway. Typically, they consist of four parts: 1) a wire loop of one or more turns of wire embedded in the roadway pavement, 2) a wire connecting the wire loop to a pull box at the roadside, 3) a cable connecting the wire in the pull box to a controller cabinet at the roadside, and 4) a data collecting and processing electronics unit housed in the cabinet. Typically, the electronics unit provides diagnostics information (via an LCD monitor) to correctly set the detector sensitivity. The diagnostics information includes loop inductance, operating frequency, and timing information. When a vehicle passes or stays over the electromagnetic field generated by the loop it reduces the loop inductance and subsequently unbalances the tuned circuit of which the loop is part of, which increases the oscillatory frequency. This is detected by the electronics unit and interpreted as a detected vehicle. Three types of Loop Detectors exist: 1) saw-cut that are installed by cutting the loop shape in the pavement with a concrete saw, 2) trenched-in that are installed below the pavement and 3) preformed that are installed on the pavement of a roadway (the loop wires are encased in a PVC pipe, or in a loop mat). The size, shape and configuration of the loop vary depending on the specific application, ranging from the common 1.8m by 1.8 m square loops to 1.8m by 21m long rectangular loops. Typical data measurements per lane that are provided include the vehicle presence, traffic volume, traffic speed, occupancy, vehicle classification, vehicle re-identification, etc. They have an average life cycle of 10 years, and a relatively high failure rate.
3.1.2. Pneumatic Road Tube This type of sensor was invented in the 1920s, however due to its simplicity and low cost they are still in use. Pneumatic road tubes are typically used as a short-term automated traffic recorder. They sense vehicle pressure and send a burst of air pressure along a rubber tube when a vehicle’s tires pass over them. The pulse of air pressure closes and air switch and sends an electric signal that marks the passage of a vehicle axle. This data can be processed into many forms including volume, speed, gap, following distance, and classification by axle.
3.1.3. Magnetic Sensors Magnetic sensors are passive devices that detect the presence of a ferrous metal object through the perturbation they cause in the Earth’s magnetic field. Two primary types of magnetic sensors are used for the measurement of traffic flow parameters. The first type is the two-axis fluxgate magnetometer and detects changes in the vertical and horizontal components in the Earth’s magnetic filed produced by the vehicle. It has the capability of detecting both
Deliverable D2.2.2 Part B v3.2 Dissemination Level (PU) Copyright SAFESPOT
Contract N. IST-4-026963-IP
D2.2.2 Part B Technology Review and Survey v3.3.doc Page 24 of 121 Subproject INFRASENS
stopped and moving vehicles. They have cylindrical shape and are inserted into holes drilled into the roadbed (from the top of the road surface). They can provide presence, volume, speed, and occupancy data. Currently, there exist self-powered dual-axis magnetometers with a self contained battery that reduce installation time, cost and impact on traffic flow. The second type is the magnetic detector, more properly referred as induction or search coil magnetometer. It detects a moving vehicle by measuring the distortion in the magnetic flux lines induced by the change in the Earth’s magnetic filed produced by the vehicle. They are installed horizontally below the roadway surface. Since they provide only passage data and not occupancy or presence data their use is limited. Both detectors require a minimum speed of 3 to 5 mph. Their configuration may be single, double, or multiple per lane depending on the monitoring requirements. Another device similar to the magnetic detector is the microloop probe (a type of point detector). As a vehicle passes over the microloop, the change in inductance is sensed by a conventional inductive loop detector electronics unit. The installation requires a hole in the pavement typically 2.5 cm in diameter and 50 cm deep. Their installation is considered less expensive than that of inductance loops, and they have an increased life cycle. However, they can detect vehicles with speeds 10 mph or higher.
3.1.4. Microwave Radar Microwave radar was first used to detect objects during World War II. The microwave frequency ranges from 1 GHz to 30 GHz, but most commercial microwave detectors use a frequency of 10.525 GHz. Typically, the system is installed over the roadway. Usually the microwave radar unit and an antenna are mounted on a bridge, overpass, pole, or mast arm, and it is connected with power and data cables to a roadside controller cabinet. The system operates as follows. A radar transmits low-energy microwave radiation at a detection zone a portion of which is scattered by the vehicle back toward the sensor where it is detected and converted into vehicle and traffic flow information by the sensor, either alone or in conjunction with a roadside electronics unit. Two types of microwave radar sensors are used in roadside applications. Those that transmit continues wave (CW) Doppler waveforms and those that transmit frequency modulated continues waves (FMCW). The Doppler sensor is also referred to in the literature as a microwave or microwave Doppler sensor. The constant frequency signal allows the measurement of vehicle speed using the Doppler principle. Vehicle passage is detected by the frequency shift in the received signal since when a vehicle moves away from the radar the frequency of the received signal is decreased, and increased when a vehicle is moving toward the radar. Vehicle presence cannot be detected with the constant frequency waveform as only moving vehicles are detected. On the other hand, the FMCW microwave radar sensor (also called true-presence microwave detectors) varies the transmitted frequency with respect to time in a prescribed manner, so they can detect vehicle passage and vehicle presence. Therefore, they can detect stopped vehicles and

Deliverable D2.2.2 Part B v3.2 Dissemination Level (PU) Copyright SAFESPOT
Contract N. IST-4-026963-IP
D2.2.2 Part B Technology Review and Survey v3.3.doc Page 25 of 121 Subproject INFRASENS
provide data measurements such as occupancy, vehicle speed, vehicle count, and vehicle length classified into several length bins. This information can be provided from up to 70 meters away and a single system can provide data for up to eight detection zones (lanes). Moreover, today’s systems work in all weather and traffic conditions. They are fully programmable to support, among other modes, traffic monitoring and work zone safety systems. Typically, no routine maintenance is required.
3.1.5. Video Image Processing (Optical or Infrared) Originally, video cameras provided surveillance for traffic management systems by transmitting close-circuit television imaginary to a human operator at a Traffic Management Center. Today’s traffic managers rely on video image processing to automatically analyze a scene of interest and obtain information for traffic surveillance and management purposes. A video image processor (VIP) system typically consists of one or more video cameras, a microprocessor based computer for digitizing and analyzing the image, and appropriate software for interpreting the images and obtaining traffic flow data. It is installed in a configuration similar to that for microwave radars. Typically, VIP systems measure changes between successive video image frames. Passing vehicles cause variations in the grey levels of the black-and-white pixel groups, and the system analyzes those variations to determine the vehicle passage. Variations that are caused by such non-vehicle factors as weather and shadows are excluded. Three types of VIP systems are commercially available: tripline, closed-loop tracking, and data association tacking. A single VIP system can replace several inductive loop detectors, providing detection of vehicles across several lanes. Some VIP systems are capable of analyzing the images and process data from an array of video cameras expanding, thus, the area from which data are collected. VIP systems can classify vehicles by their length (usually three length classification ranges are available), and report vehicle presence, volume, occupancy, and speed for each class and lane. Other VIP systems are capable of vehicle tracking having, thus, the capability of registering turning movements and lane changes, queue length and vehicle headway. Finally, such information as traffic density, link travel times, and Origin-Destination pairs can be provided for an installation configuration that consists of a series of VIP systems along a roadway. Usually, environmental factors such as light (sunlight or vehicle headlight), light transition, shadow and snow affect the quality of the image and deteriorate the accuracy of data measurements. Efforts are focused on the development of sophisticated image processing software that recognizes the light transition time, rainy, and snowy conditions so as to maintain the data accuracy level even under non-ideal conditions. Moreover, engineers are also examining cost-effective methods to use colour cameras. The presence of colour in video images enables the differentiation of objects with identical grey scale. This feature
Deliverable D2.2.2 Part B v3.2 Dissemination Level (PU) Copyright SAFESPOT
Contract N. IST-4-026963-IP
D2.2.2 Part B Technology Review and Survey v3.3.doc Page 26 of 121 Subproject INFRASENS
also increases the detection accuracy in areas of detection with stopped vehicles, and enables the rejection of static and moving shadows, and of headlight reflections. Moreover, it improves the system reliability under changing lighting and adverse weather conditions.
3.1.6. Passive Infrared Sensors Active and passive infrared sensors are used for traffic flow monitoring applications. Passive infrared sensors transmit no energy on their own, but they detect energy from two sources: Energy emitted from vehicles, road surface and other objects in their field of view (any object that is not at absolute zero emits thermal radiation in the far infrared part of the electromagnetic spectrum). Energy emitted by the atmosphere and reflected by vehicles, road surface or other object in the view vicinity of the sensor. Passive infrared sensors are mounted overhead to view approaching or departing traffic. They can provide such data measurements as presence, occupancy, volume, speed, and vehicle classification by length; they can also detect (and count) pedestrians in crosswalks and bicycles. Two types of detectors exist: non-imaging and imaging. The non-imaging detectors use one or more energy sensitive elements to collect infrared energy and cannot divide objects into pixels within the detection zone. Imaging detectors use two dimensional arrays of energy sensitive elements and they are capably of displaying pixel resolution details.
3.1.7. Active Infrared Sensor (or Laser Radar Sensors) Laser radar sensors are active devices that transmit and receive infrared energy. They illuminate detection zones with low power energy transmitted by light emitting diodes, or high power energy transmitted by laser diodes. A portion of the transmitted energy is reflected or scattered by vehicles back to the sensor. They are mounted overhead of the roadway like the passive infrared sensors. Laser radars provide vehicle presence, volume speed, length assessment, queue measurement and classification within multiple detection zones. Modern laser sensors provide two- and three-dimensional images of vehicles suitable for vehicle classification. Their ability to classify some 11 different types of vehicles has found application on toll roads.
3.1.8. Ultrasonic Sensors Ultrasonic sensors transmit pressure waves of sound energy at a frequency between 20 and 300 kHz that are above the human audible range. They
Deliverable D2.2.2 Part B v3.2 Dissemination Level (PU) Copyright SAFESPOT
Contract N. IST-4-026963-IP
D2.2.2 Part B Technology Review and Survey v3.3.doc Page 27 of 121 Subproject INFRASENS
sense the acoustic waves reflected by objects in the detection zone. There are two kinds of ultrasonic sensors: pulse and constant wave ultrasonic sensors. Pulse ultrasonic sensors transmit a series of ultrasonic pulses. The detector differentiates between sound waves reflected from the road surface and waves reflected from the vehicles to detect vehicle presence. Speed is estimated by recording the time a vehicle crosses two closely spaced pulsed energy transmitted beams that are a known distance apart (this method is also used for speed estimation for microwave or laser radar sensors). Two mounting configurations are possible: overhead and horizontal (at the roadside). On the other hand, constant ultrasonic sensors transmit a continuous wave of ultrasonic energy. The detector analyzes the acoustic sound reflected back from the detection zone based on the Doppler principle. Most ultrasonic sensors provide vehicle count, presence, occupancy, and classification information. Some can also provide bicycle, pedestrian and transit vehicle information.
3.1.9. Passive Acoustic Array Sensors Acoustic sensors measure multi-lane vehicle presence, count, occupancy, and speed by detecting acoustic energy or audible sounds produced by vehicular traffic from a variety of sources within each vehicle and from the interaction of a vehicle’s tyres with the pavement. They can also detect when a crash has occurred. When a vehicle passes through the detection zone an increase in sound energy is recognized by the signal processing algorithm and a signal of vehicle presence is generated. When the vehicle leaves the detection zone the sound energy level drops below the detection threshold and the signal of vehicle presence is terminated. Sounds from locations outside the detection zones are attenuated. Single lane and multiple lane commercial models of acoustic sensors exist. Both detect the sounds produced by approaching vehicles with a two dimensional array of microphones that are mounted at the road side or over the roadway. Each detector can replace up to five dual loop detectors when installed at the roadside. There exist devices with wireless and solar options.
3.1.10. Sensor Networks (Combined Detector Technologies) A new trend in detector systems to overcome the shortcomings of a single technology is the combination of two or more of the aforementioned technologies in a unified network of sensors. Such networks could also be designed so as to integrate data (e.g., traffic, vehicle status, etc.) from road-side sensors as well as from probe vehicles. For example, there are commercially available detectors that combine passive infrared presence detection with ultrasonic radar that provide highly accurate data measurements for presence, queue detection, vehicle counting, as well as height and distance discrimination. Other commercially available detectors combine infrared with CW Doppler microwave radar technology, and provides such data as presence, speed, vehicle counting, queue detection, and length
Deliverable D2.2.2 Part B v3.2 Dissemination Level (PU) Copyright SAFESPOT
Contract N. IST-4-026963-IP
D2.2.2 Part B Technology Review and Survey v3.3.doc Page 28 of 121 Subproject INFRASENS
classification. The system relies on the radar to measure high to medium vehicle speeds, and the passive infrared to measure vehicle count and presence. Typically, such networks are characterized by the fact that sensors act solely as data collectors. Specifically, road-side detectors (and probe vehicles) provide such data as presence, class, speed, status, etc. which are subsequently transferred via roadside beacons to a roadside processing unit or a central location e.g., the TMC. The safety decisions are made by an Automated Incident Detection system which collects all the data in real-time, processes the data to extract the necessary information for determining the current traffic status and the future conditions, and generates accident preventive commands for the alert system.
3.1.11. Wireless Sensor Networks Grounded in the belief that sensors, processors and wireless radios are becoming extremely small and inexpensive, the research community foresees a world where many physical environments are enriched by computational power and “intelligence”. Wireless Sensor Networks (WSN) is an instance of a networked embedded sensing system that can perceive and control many aspects of a real world process, and which may interact with humans. Originally, United States based research for military applications established a de facto definition of a WSN as a large-scale, ad-hoc, multi-hop, unpartitioned network of largely homogeneous, tiny, energy autonomous, resource constrained, mostly immobile sensor nodes that could be randomly deployed in the area of interest. More recently, many civilian application domains of WSN have been considered, such as environmental and species monitoring, agriculture, traffic monitoring, etc. that led to the extension of the definition above: networks may consist of heterogeneous and mobile sensor nodes, the network topology may be as simple as a star topology, and networks may make use of existing infrastructures. A sensor node (sometimes also called a mote) in a WSN combines the abilities to sense, process, store, and communicate. Most recently, another capability is possible: that of controlling an actuator (that is part of the sensor node). Such systems are most often called Wireless Sensor and Actor Networks (WSAN). As compared to Networks of Sensors, WSN consist of sensor nodes that have not only sensing capabilities (data collectors) but also those of processing (i.e., “intelligence”), controlling, and communicating. Typical features of a WSN are summarized below: Self-organization. Given the number of nodes and their location, a WSN should be able to self-organize; a manual configuration and/or calibration may not always be feasible. Moreover, nodes may fail or new nodes may join the network. For these reasons, the WSN must be able to periodically reconfigure (set-up and maintenance) and readjust itself so that it remains operable.
Deliverable D2.2.2 Part B v3.2 Dissemination Level (PU) Copyright SAFESPOT
Contract N. IST-4-026963-IP
D2.2.2 Part B Technology Review and Survey v3.3.doc Page 29 of 121 Subproject INFRASENS
Deployment. Sensor nodes may be deployed randomly or at a pre-specified pattern. Network deployment has an impact on the node density and the expected degree of the network dynamics. Mobility. Sensor nodes may possess automotive capabilities. Mobility may be an incidental side effect (e.g., water sensor nodes) or a desired property of the system (e.g., probe vehicles on sensor equipped roadway). Either all nodes or only a subset may be mobile in WSN. Mobility has an impact on the network communication protocol, and the cooperative processing (explained below). Also, the speed of movement may have an impact on the network dynamics, e.g., on the amount of time during which nodes stay within the communication range of each other. Cooperative Processing. Compared to networked macro sensors, an advantage of the WSNs is the possibility to develop cooperative algorithms for the management of data, i.e., data pre-processing, fusion, and aggregation algorithms. As compared to a Network of Sensors, this attribute significantly reduces the massive amount of data that have to be processed in order to extract the information necessary for safety prevention purposes. Cost, Size, Resources, and Energy. Depending on the application, the size of a node may vary from that of a shoe box (weather station) to that of a nearly invisible particle (military application). The cost of a node may vary from hundreds of Euros (for sparsely dense networks) to a few cents (for densely large-scale network). Varying size and cost restrictions result in a varying amount of the energy available for the autonomous operation of a node. The available energy in turn restricts the processing, storage, and communication resources. Finally, power may be either stored (e.g., in batteries) or scavenged from the environment (e.g., by solar cells). Heterogeneity. Nodes may differ in the size and type of attached sensors. Often some computationally more powerful nodes (sometimes also called as sink nodes) may collect, process, and route data from other nodes of limiting capabilities within their communication area. In other cases, the nodes may be equipped with special hardware, e.g., a GPS receiver, to act as beacons for other nodes so as to infer their location. Finally, some nodes could act as gateways to long-range communication networks. The degree of heterogeneity has an impact on the operational system of the WSN. Communication Modality. For wireless communication among sensor nodes (or for communication with humans) such communication modes as radio, diffuse light, laser, inductive and capacitive coupling, or even sound are possible alternatives. The communication modality has an impact on the medium access and communication protocols. Infrastructure. The various communication modes can be used in different ways for constructing a communication network. Two common types of communication networks are the so-called infrastructure-based networks and the ad hoc networks. In infrastructure-based networks, the nodes can only communicate via a so-called base station device. In ad hoc networks nodes

Deliverable D2.2.2 Part B v3.2 Dissemination Level (PU) Copyright SAFESPOT
Contract N. IST-4-026963-IP
D2.2.2 Part B Technology Review and Survey v3.3.doc Page 30 of 121 Subproject INFRASENS
can directly communicate with each other without needing an infrastructure. Thus, nodes could act as routers, forwarding messages over multiple hops on behalf of other nodes. Combinations of ad hoc and infrastructure (e.g., a GSM network) could also be used, where clusters of sensor nodes are interconnected by a wide-area infrastructure-based network. Network Topology. Another important property of a WSN is its diameter, i.e., the maximum number of hops between any two nodes in the network. In its simplest form, a WSN forms what is called a single hop network, where every node is able to communicate with every other node in the network. The topology has an impact on such network characteristics as the latency, robustness and capacity. The complexity of data processing and routing also depends on the topology. Coverage. The effective range of a sensor attached to a sensor node defines the coverage area of a sensor node. Network coverage on the other hand, measures the degree of coverage of the area of interest by the WSN. With sparse coverage only parts of the area of interest are covered by the WSN. With dense coverage the area of interest is completely covered. With redundant coverage multiple nodes cover the same location. Coverage may vary across the network. The degree of coverage has an impact on the algorithms for data management. High coverage is a key to robust systems, and it could also be used to prolong the WSN lifetime by switching redundant nodes to power saving sleep mode. Connectivity. A network is said to be connected if there is always connection between (possibly over multiple hops) between any two nodes. If, on the other hand, the nodes communicate with other nodes occasionally we say that the communication is sporadic. Connectivity has an impact on the design of communication protocols and the methods of data gathering. Network Size. The network size may vary from a few nodes to thousands of nodes. The network size determines the scalability requirements regarding the communication protocols and the data management algorithms. Lifetime. The lifetime of a sensor network may range from a few hours to several years. The necessary lifetime (depending on the application) has an impact on the required energy efficiency and the robustness of the network. Other Quality-of-Service Aspects. A WSN should posses certain Quality-of-Service aspects. Specifically, a WSN should operate in real-time, i.e., a physical event must be reported within a certain timeframe, be robust, i.e., the network should remain operational despite a node failure, be tamper-resistant, i.e., the network should remain operational despite deliberate attacks, and, finally, be eavesdropping-resistant, i.e., external entities cannot eavesdrop on data traffic. The basic goals of a WSN depend in general on the specific application. However, the two task categories described below are common to most networks.
Deliverable D2.2.2 Part B v3.2 Dissemination Level (PU) Copyright SAFESPOT
Contract N. IST-4-026963-IP
D2.2.2 Part B Technology Review and Survey v3.3.doc Page 31 of 121 Subproject INFRASENS
High-Level Tasks. In order to perform complex high-level sensing tasks the sensor nodes have to coordinate and split specific actions among them, taking into account their individual characteristics (e.g., attached type of sensors, location, residual energy). Then, the readings of the individual nodes have to be merged in order to obtain a high-level sensing result. For example, a high-level task could be that of “report size, speed, and direction of vehicles over 40 tons moving through a certain area.” Low-Level Tasks. These tasks are accomplished by individual nodes that usually have very simple functionality. They are further distinguished into the following four categories.
— Determine the value of some parameter at a given location. Such a task example is “detect the vehicle speed at an on-ramp merging area.”
— Detect the occurrence of events of interest and estimate appropriate parameters. Such a task example is “detect a vehicle moving through an intersection and estimate its direction and speed.”
— Classify a detected object. Such a task example is “is the detected vehicle a passenger car, a mini-van, or a bus?”
— Track an object. Such a task example is “track a specific passenger car e.g., identified by its license place, as it moves through a freeway.
3.1.12. Video Surveillance This type of technology cannot be used for any detection purposes but it is mentioned for the sake of completeness. Closed circuit television (CCTV) systems have been used for many years for visual surveillance of a roadway network. TMCs typically use CCTV systems for the following purposes: - Detecting and verifying incidents. - Monitoring traffic conditions - Monitoring incident clearance. - Verifying message displays on changeable message signs. - Monitoring environmental conditions (e.g., visibility distance, wet
pavement). For fixed location CCTV systems (there are also portable CCTV systems), video cameras are permanently mounted either on existing structures along the freeway or on specially installed camera poles. This type of system typically consists of the following components: 1) video camera unit, 2) mounting structure (existing or newly installed), 3) controller cabinet housing the camera monitoring and control equipment, 4) communication system connecting camera to control center, 5) video monitors and camera controls located in the control centre.

Deliverable D2.2.2 Part B v3.2 Dissemination Level (PU) Copyright SAFESPOT
Contract N. IST-4-026963-IP
D2.2.2 Part B Technology Review and Survey v3.3.doc Page 32 of 121 Subproject INFRASENS
CCTV systems allow control room personnel to visually monitor sections of roadway and to react directly to the actual conditions on the roadway. Since operators can lose interest if required to constantly view CCTV monitors, and may fail to notice incidents immediately after they occur, current systems are being designed to automatically position cameras at suspected incident locations (as signalled by incident detection algorithms) and to alert the operator. Current CCTV technology allows viewing of 0.4 to 0.8 km in each direction if the camera mounting, topography, road configuration, and weather are ideal. The location for CCTV cameras is dependent on the terrain, number of horizontal and vertical curves, desire to monitor weaving areas, identification of high-incident locations, and the need to view ramps and arterial streets. Two key measures of CCTV camera operation are light sensitivity and camera resolution. Sensitivity describes the amount of light needed to make a useful image, while resolution is the number of lines reproduced from the camera signal in making a video image on a monitor useful. The amount of available light is one of the most important factors affecting CCTV camera performance in traffic applications. For this, cameras must be sufficiently sensitive to view traffic conditions during morning and evening peak periods, even in winter when illumination may be very low during morning and evening rush hours. Light levels at intersections and interchanges typically range from 2 to 3 foot-candles (FC), while light levels can be less than 0.1 FC at roadway sections between intersections or interchanges. Cameras should also provide good horizontal resolution since this parameter helps determine image quality and ability to discern details. This is particularly important for viewing at a distance.
3.2. Vehicle Status Sensors Vehicle status sensors determine individual characteristics of passing vehicles. For example, there are technologies that determine the vehicle length, height, number of axles, lane positions and vehicle speed. Moreover, there are emerging technologies for enforcement applications that monitor emissions, passenger counts, and operational status for individual vehicles. A brief overview of vehicle status sensors follows.
3.2.1. Weight-In-Motion (WIM) WIM is a sensor system installed on the road pavement that measures gross vehicle weight, weight proportions carried by each wheel assembly (half-axle with one or more tyres), by axle, or by axle group. In addition, they provide such traffic data as traffic volume, speed, the equivalent single axle loading (ESAL) that heavy vehicles place on pavement and bridges, and vehicle classification based on the number of axles, or the spacing of axles. WIM systems detect vehicle weight more accurately than static weight systems. The four primary WIM technologies are the: bending plate, piezoelectric, load cell, and capacitance. All four have a similar way of operation that is described below.
Deliverable D2.2.2 Part B v3.2 Dissemination Level (PU) Copyright SAFESPOT
Contract N. IST-4-026963-IP
D2.2.2 Part B Technology Review and Survey v3.3.doc Page 33 of 121 Subproject INFRASENS
Piezoelectric: The piezoelectric sensor is a specially manufactured material that converts kinetic energy to electrical energy. When a vehicle passes over the detector, the piezoelectric material generates a voltage that is proportional to the weight of the vehicle. The piezoelectric material generates a voltage only when the forces are changing. This means that the initial voltage will decay if the force remains constant. Piezoelectric sensors can detect traffic volume, speed, and vehicle weight. They also classify vehicles by axle count or axle spacing. The most advanced piezoelectric material is composed by crystals (e.g., quartz), which are insensitive to any range of temperatures, measure any vehicle speed, are sensitive only to vertical forces making thus more accurate measurements, and have low maintenance cost. Bending Plate: The bending plate WIM system typically uses a steel plate over a rubber plate with strain gauges attached to the steel’s plate underside. The gauge generates a signal proportional to the deflection of the plate when a vehicle passes over it. Then, the system records the strain and calculates the dynamic load. The static load is determined from the dynamic load and appropriate calibration parameters. Load Cell: Load cell WIM systems typically consist of two weighting platforms per lane with one or more load cells per platform. Like bending plates, strain gauge load cells record the strain and calculate the dynamic load. Some load cells have two in-line scales, one detects the axle and the other weights the right and left side of the axle. Capacitance Mat: A capacitance mat WIM system typically consists of two or more conductors (metallic plates). The conductors carry equal but opposite charges like a capacitor. When a vehicle passes over the sensor, the distance between the plates decreases and as a result the capacitance increases. The voltage change is proportional to vehicle weight.
3.2.2. Vehicle Profile Identifiers Vehicle profile identifiers may include a variety of mounting configurations and technologies. Most applications are either mounted overhead or side-fire and utilize such reflective beam technologies as infrared, optical, ultrasonic, or microwave/radar (that are analyzed above). A beam of energy is continuously monitored by the detection device, which essentially measures the physical dimensions of even the physical 3-dimensional profile of a vehicle as it passes through the detection zone. Profile identifiers may be used as (over)height detectors at low overpasses. Note, also, that as discussed above there exists a number of sensor technologies that classifies vehicles by length.
Deliverable D2.2.2 Part B v3.2 Dissemination Level (PU) Copyright SAFESPOT
Contract N. IST-4-026963-IP
D2.2.2 Part B Technology Review and Survey v3.3.doc Page 34 of 121 Subproject INFRASENS
3.3. Environmental Sensors Observation and prediction of weather events and their corresponding roadway impacts are critical in the development and implementation of safety strategies and response plans. The type of weather event that is occurring will influence the safety prevention decisions. For example, weather events can range from relatively localized phenomena (e.g., thunderstorms, for, etc.), to major events that may require the evacuation of a wide area (e.g., flooding). For an effective safety strategy it is necessary to gather and process information on the location, characteristics, and duration of weather events as well as to be able to predict their roadway impacts, specifically: Severity: Measurements that characterize the severity of a weather event are the precipitation type and amount, temperature, visibility, and wind speed. Area of impact: The size and the particular characteristics of the geographic area impacted by the weather event will have a major influence on the decision process. Time of day: The operational strategies implemented will be based on the time of day. For example, weather events that occur during peak hours require more complex plans than those required during periods of light traffic. Also, events that occur during morning peak will require different treatment than those that occurring during evening peak. Lead time: The lead time prior to the evolution of a weather event also influences the planning of the response, so accurate forecasts are necessary. Event duration: The anticipated duration of a weather event as well as the corresponding start and stop times also influence the safety strategies. The environmental sensor technologies that monitor the local climate and road surface status are described below. Road Weather and Information System (RWIS): A road weather information system (RWIS) is a combination of technologies that collects, transmits, and disseminates local weather and road condition information. The component of an RWIS that collects weather data is called Environmental Sensor Station (ESS). An ESS is installed in fixed location close to a roadway, and it consists of a pole with a mounted cabinet, and one or more sensors that measure atmospheric, surface (i.e., pavement and soil), and/or hydrologic conditions, and specifically: Atmospheric sensors: Typically, they measure air temperature, barometric pressure, relative humidity, wind speed and direction, precipitation type and rate, and visibility distance. Surface sensors: Typically, they provide such measurements as pavement temperature and condition (e.g., dry, wet, ice, freeze point, chemical
Deliverable D2.2.2 Part B v3.2 Dissemination Level (PU) Copyright SAFESPOT
Contract N. IST-4-026963-IP
D2.2.2 Part B Technology Review and Survey v3.3.doc Page 35 of 121 Subproject INFRASENS
concentration), subsurface temperature (i.e., subsurface freeze/thaw cycles). More modern sensors include infrared cameras to assess the road surface condition. Hydrologic sensors: typically measuring stream, river and tide levels. Data collected from environmental sensors in the field are stored onsite in a so-called Remote Processing Unit (RPU) in a cabinet. In addition, the cabinet provides power supply and has battery back up devices. The RPU transmits the environmental data to a central location via a communication system. Central RWIS hardware and the corresponding software collect field weather data from numerous ESS, process data in support of various operation applications, and display or disseminate road weather data in a format easily understandable by a user (e.g., traffic operators, drivers, etc.). For example, weather data may be integrated in an automated motorist warning system, transmitted to the TMC, emergency operation centers and maintenance we facilities to support their decisions. This information may also be used to enhance weather forecasts. In addition, weather service providers also use the weather data to develop specially tailored services and products such as e.g., pavement temperature/ bridge icing forecasts, ice and snow prediction, thermal mapping, etc. Transportation managers utilize weather data to design and implement three types of traffic management strategies for safety purposes: advisory, control and treatment. The advisory strategies provide information on the prevailing and predicted weather condition to motorists. The control strategies appropriately permit or restrict traffic flow on roadway networks and regulate the roadway capacity. The treatment strategies appropriately allocate resources to a roadway network to minimize or eliminate the adverse weather impacts. It is finally noted that the specific information requirements and the spacing of ESS depend in such factors as: Average annual precipitation: The greater the precipitation (e.g., snowfall) the greater the need for more roadway information, thus a denser network of ESS. Moreover, geographic areas with significant rainfall and/or icing potential require detailed roadway information. Winter maintenance activities. An organization/agency that designs and implements proactive treatment strategies on a regular basis (e.g., anti-icing before snowfall), typically needs more weather information than an agency that performs reactive treatment strategies (e.g., ploughing and spreading abrasives after snowfall). Terrain. Typically, geographic areas of high elevation with steep upgrades/downgrades and/or areas subject to high winds and blowing snow may need a greater coverage of weather information. Microclimates and spot problems: Geographic areas with local influences (e.g., fog, high winds, etc.) need a focused coverage of weather information.
Deliverable D2.2.2 Part B v3.2 Dissemination Level (PU) Copyright SAFESPOT
Contract N. IST-4-026963-IP
D2.2.2 Part B Technology Review and Survey v3.3.doc Page 36 of 121 Subproject INFRASENS
3.4. Obstacle Ranging Sensors
Obstacle ranging technologies detect and characterize such potential obstacles as e.g., other stopped vehicles, humans, road debris, or generally any object that suddenly disrupts or prohibits the normal flow of traffic, representing, thus, a safety risk. The roadside technologies available for this scope are discussed in the previous section and include infrared scanners, video image processing, and ultraviolet headlamps. These enhancement systems improve visually acquired information, and particularly in situations where driving visibility is low as in the case of, e.g., fog or snowfall.
3.5. Dynamic Positioning Systems The use of vehicle locating technologies enables the vehicle to become an important surveillance tool for monitoring traffic conditions in a road network. Vehicles act as “moving sensors” (probes) providing information on prevailing traffic conditions on each link traversed. For safety purposes precise positioning in relation to this information is crucial. Probe surveillance can provide the following measurements: link speed, link travel time, origin and destination of a vehicle. Technologies that enable the use of vehicles as probes are briefly analyzed below. Automated Vehicle Identification (AVI) systems AVI systems uniquely identify individual vehicles as they pass through a detection area. Although there are several different types of AVI systems they are all based on the same operational principles. A roadside communication unit (so-called the “reader”) broadcasts an interrogation signal from its antenna. When an AVI equipped vehicle comes within the communication range of the antenna a transponder (so-called “tag”) in the vehicle returns a unique identification number to the roadside unit. This information is then transmitted to a central computing unit where it is processed. The most common application for AVI technology is for the automatic collection of tolls also known as Electronic Toll Collection (ETC). In this application, toll charges are electronically deducted from the driver’s account when his/her vehicle passes through the toll plaza without stopping. By installing readers at appropriate intervals along the roadway, AVI technology may also be used as a means for automatically collecting travel time information. Classes of transponders, based on the degree to which they can be programmed include: Type I transponders are read-only tags that contain such fixed data as the vehicle identification number. Type II transponders have both read and write capabilities. A part of the memory contains fixed information (e.g., the unique identification vehicle
Deliverable D2.2.2 Part B v3.2 Dissemination Level (PU) Copyright SAFESPOT
Contract N. IST-4-026963-IP
D2.2.2 Part B Technology Review and Survey v3.3.doc Page 37 of 121 Subproject INFRASENS
number), and the remaining may be re-programmed or written remotely from the reader. For example, this type of transponder is used in toll systems to record time, date, and location of entry in the toll roadway. Type III transponders are also known as “smart cards”. They have extended memory and are capable of two-way communication. This system enables the warning about incidents, congestion, or adverse weather conditions so as to re-schedule their route. Automatic Vehicle Location (AVL) system AVL systems enable the location tracking of a vehicle as it traverses a roadway network. There are numerous technologies that are used for automatic vehicle location (or positioning) that are briefly described below. Dead reckoning and map matching: These systems monitor a vehicle’s internal compass and odometer and calculate its position by measuring its distance and direction from a known central starting point. Dead-reckoning systems frequently get off track and are corrected using a technique called map matching. Map-matching systems store a map of the vehicle’s coverage area in a database and assume that when a vehicle changes direction, it must have turned from one road on to another. When a vehicle does make a turn, map-matching systems alter the vehicle’s record location to the nearest possible point at which the turn could have taken place. Because of the low degree of positional accuracy of dead reckoning and map matching, most AVL systems use more advanced technology options. Signpost: For vehicles that regularly travel on a fixed route (e.g., transit bases), sign-post based positioning systems offer a more economical alternative to advanced AVL technologies. Antennas are placed at appropriate spacing along a vehicle’s route and record the time when the vehicle passes nearby. This information is transmitted to a central computing system. For some transit-based systems, the “signpost” also transmits its location to the bus. Probe based surveillance using toll tags and readers are another form of signpost-based AVL system. Ground-based Radio Navigation: For “ground-based” radio navigation systems, the AVL vendor installs several receiving antennas in a metropolitan area. Each appropriately equipped vehicle broadcasts a radio frequency signal to all nearby receiving antennas. By measuring the time it takes for the signal to be transmitted to the antenna, the distance of the vehicle from the antennas is also determined. When the signal is received by three or more antennas the position of the vehicle is uniquely determined. A shortcoming of radio-navigation is that radio frequency signals have difficulty transmitting through large obstructions including mountains, tunnels, large building that are usually present in downtown metropolitan areas, etc.
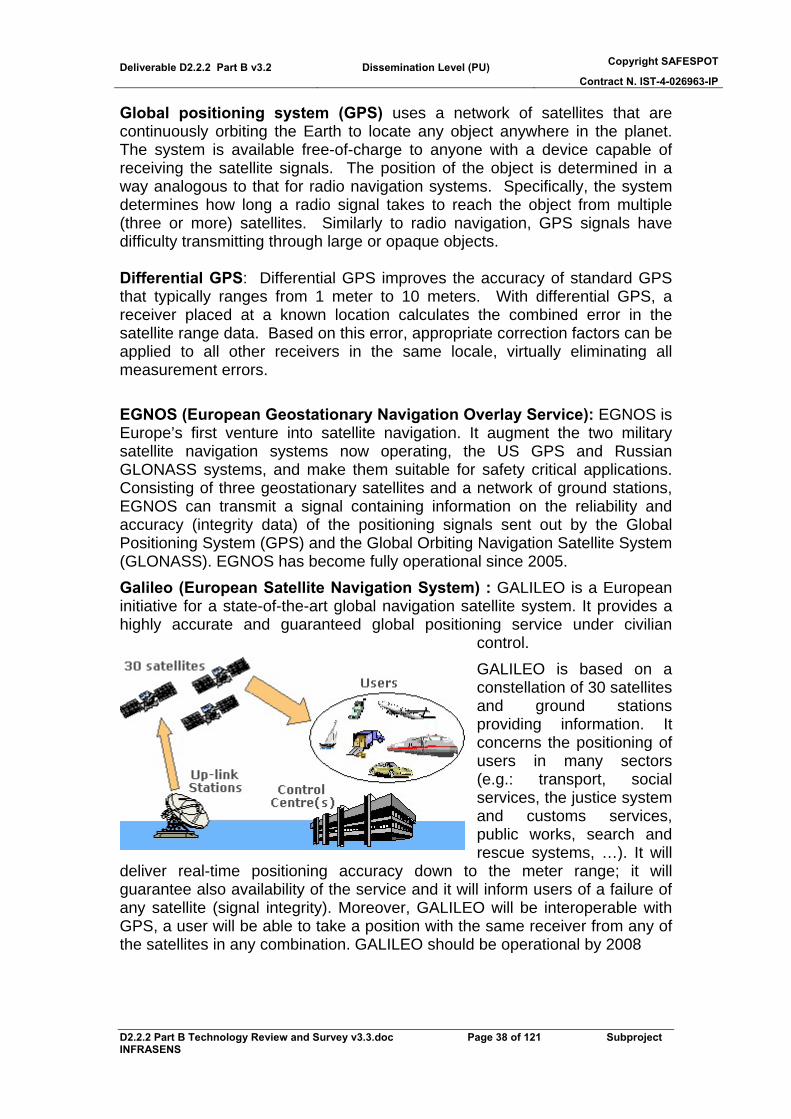
Deliverable D2.2.2 Part B v3.2 Dissemination Level (PU) Copyright SAFESPOT
Contract N. IST-4-026963-IP
D2.2.2 Part B Technology Review and Survey v3.3.doc Page 38 of 121 Subproject INFRASENS
Global positioning system (GPS) uses a network of satellites that are continuously orbiting the Earth to locate any object anywhere in the planet. The system is available free-of-charge to anyone with a device capable of receiving the satellite signals. The position of the object is determined in a way analogous to that for radio navigation systems. Specifically, the system determines how long a radio signal takes to reach the object from multiple (three or more) satellites. Similarly to radio navigation, GPS signals have difficulty transmitting through large or opaque objects. Differential GPS: Differential GPS improves the accuracy of standard GPS that typically ranges from 1 meter to 10 meters. With differential GPS, a receiver placed at a known location calculates the combined error in the satellite range data. Based on this error, appropriate correction factors can be applied to all other receivers in the same locale, virtually eliminating all measurement errors. EGNOS (European Geostationary Navigation Overlay Service): EGNOS is Europe’s first venture into satellite navigation. It augment the two military satellite navigation systems now operating, the US GPS and Russian GLONASS systems, and make them suitable for safety critical applications. Consisting of three geostationary satellites and a network of ground stations, EGNOS can transmit a signal containing information on the reliability and accuracy (integrity data) of the positioning signals sent out by the Global Positioning System (GPS) and the Global Orbiting Navigation Satellite System (GLONASS). EGNOS has become fully operational since 2005. Galileo (European Satellite Navigation System) : GALILEO is a European initiative for a state-of-the-art global navigation satellite system. It provides a highly accurate and guaranteed global positioning service under civilian
control. GALILEO is based on a constellation of 30 satellites and ground stations providing information. It concerns the positioning of users in many sectors (e.g.: transport, social services, the justice system and customs services, public works, search and rescue systems, …). It will
deliver real-time positioning accuracy down to the meter range; it will guarantee also availability of the service and it will inform users of a failure of any satellite (signal integrity). Moreover, GALILEO will be interoperable with GPS, a user will be able to take a position with the same receiver from any of the satellites in any combination. GALILEO should be operational by 2008
Deliverable D2.2.2 Part B v3.2 Dissemination Level (PU) Copyright SAFESPOT
Contract N. IST-4-026963-IP
D2.2.2 Part B Technology Review and Survey v3.3.doc Page 39 of 121 Subproject INFRASENS
3.6. Alert Systems
The information dissemination components of a management system for mobility or safety purposes ranges from a single device owned and operated by one agency, to an integrated collection of devices that are controlled by several agencies and several private sector entities. In this section we analyze information dissemination technologies that are located on the roadway, and the information transferring to the travellers occurs at a specific point or within a short segment of the roadway. These are discussed below. Variable Message Signs (VMS). One of the most fundamental and widely used technology for disseminating traffic related information from the roadside is that of variable message signs (VMS). VMSs are programmable traffic control devices that can usually display any combination of characters to present messages to motorists. These signs are either permanently installed above or on the side of the roadway, or portable devices attached to a trailer or mounted directly on a truck and driven to a desired location. Portable VMSs are much smaller than the permanent ones and are usually used in work zones, when major crashes or natural disasters occur, or for emergency situations. The information (message) presented on the VMS and the placement of the sign must be consistent and compatible with that of static signs. VMSs provide motorists real-time information that informs/warning them of a problem, and in some cases even suggest a course of actions. They are used primarily to improve motorist safety and reduce traffic congestion and delay. VMSs can be used for alleviating the impacts of black spots by displaying the following types of message: Advisory messages provide motorist with useful about a specific problem along their route. This information enables motorists to change e.g., their speed, or lane in advance of the problematic area. VMS are classified into two categories: 1) those with a fixed number of messages available and 2) those with an unlimited message capability. Signs with a fixed number of messages include the following: Fold out. This is a conventional highway sign with a hinged viewing face. It can either display two messages (one with the hinged face closed, one with the face open) or show a message only when the hinged face is open (i.e., no message is displayed when the hinged face is closed). Rotating drum: These signs are made up of one to four multi-faced drums, each containing two to six message elements (i.e., lines). Neon or Blank-Out Signs: Neon signs use neon tubing to form characters and messages that are to be displayed. Signs with an unlimited number of messages include the following:
Deliverable D2.2.2 Part B v3.2 Dissemination Level (PU) Copyright SAFESPOT
Contract N. IST-4-026963-IP
D2.2.2 Part B Technology Review and Survey v3.3.doc Page 40 of 121 Subproject INFRASENS
Reflective disk matrix: This type of VMS was popular due to its low energy requirements relatively to light-emitting VMS technologies. The viewing face of a reflective disk matrix VMS is comprised of an array of permanently magnetized, pivoted indicators that are flat matte black on one side and reflective yellow (or a similar colour) on the other. An electrical current activated when a given pixel is to be turned flips the indicator from a black matte finish to the reflective side and an appropriate message is displayed. A major disadvantage with disk signs is the need to illuminate the sign at night, sometimes causing glare or blurring problems. Shuttered Fiberoptic Signs: Fiberoptic VMSs funnel light energy from a light source through fiber bundles to the sign face. In a matrix configuration, the shuttered fiberoptic VMS positions the ends of the fiber bundles on the sign face in an array similar to that used for other matrix signs. The light sources for all of the fiber bundles remain on constantly, and shutters at the ends of the bundles open and close to create the characters needed to display each message. These signs have experienced very low failure rates. The one potential disadvantage is the relatively narrow cone of vision, making sign placement relative to the drivers' eyes an important consideration. Light-Emitting Diode (LED) Signs or Signals: LEDs are semiconductors that glow when voltage is applied. Typically, several individual LEDs are “clustered” together to create each matrix pixel. LEDs have the added benefit of being able to display signs in full colour. The reliability of LED lamps is very high. Like fiber optic VMS, the cone of vision is relatively narrow. Hybrid VMS: Hybrid VMS combine reflective disks with a light-emitting technology (i.e. fiber optic, LED). Hybrid signs offer several advantages e.g., great visibility when the sun is shining directly on the sign face, and no need for external lighting on the sign at night. On the other hand, hybrid signs also have the disadvantages of both sets of technologies.

Deliverable D2.2.2 Part B v3.2 Dissemination Level (PU) Copyright SAFESPOT
Contract N. IST-4-026963-IP
D2.2.2 Part B Technology Review and Survey v3.3.doc Page 41 of 121 Subproject INFRASENS
4. State-of-the-art Survey of Sensing Technologies This section consists of the completed survey templates. Some 24 different detector technologies and one positioning and mapping system are examined by some 11 partners. The technologies cover the following areas:
- Inductive loops, - Active infrared/laser radar (5 technologies), - Passive infrared, - Pneumatic tube, - Piezoelectric, - Microwave sensor/doppler radar (2 technologies), - Road temperature and condition, - Optical video image processing (3 technologies), - Infrared video image processing, magnets, - Radio frequency identifiers for vehicle status, - Magnetometer/magneto-resistive (2 technologies), - Combination of Doppler radar-infrared-ultrasound (2 technologies) - Sensor nodes - Wireless Sensor Networks
In addition, one dynamic positioning and mapping system is analyzed. It is interesting and significant that these technologies can be used for all of the detection purposes mentioned in the previous section: analysis and monitoring of the aggregated traffic flow, analysis of weather and roadway conditions, cargo monitoring, and obstacle ranging.

Deliverable D2.2.2 Part B Dissemination Level (PU) Copyright SAFESPOT
Contract N. IST-4-026963-IP
D2.2.2 Part B Technology Review and Survey v3.3.doc Page 42 of 121 Subproject Sp2 INFRASENS
Table 5: Laser Scanner - BME
Sensor Laser scanner
Sensor Type Environmental sensors
Laser scanner
Technology Area Please check one: Mature. Mature with rapid growth.
√ Mixed.
Measurement Min Report Interval
Multi-lane Y/N
Multi-(detection) zone Y/N
1 Congestion/Queue detection 1 min Y Y
2 Vehicle classification 5-10 Y Y 3 Road elements 1 h Y Y 4 Dangerous curve 6 h Y Y
Data Measurements
5 Measurement Accuracy
1 Congestion/Queue detection
2 Vehicle classification 70 % 3 Road elements cm 4 Dangerous curve cm
Accuracy
5 Factor Effect 1 Rain/fog Decrease sensitivity 2 Bright sunshine Decrease sensitivity
3 Special car colour/coating Decrease sensitivity
4
Sensitivity
5 Reliability
Average Life Cycle
1 No long experience in continuous sensing 2 Mounting difficulties Operational
Restrictions 3
Installation Location
Please check one: In Pavement (embedded). On Pavement (non-intrusive).
√ Roadside/Overhead Mounted (non-intrusive).
SEN
SOR
SYS
TEM
AN
ALY
SIS
Purchase Cost ~ 75 000 € (decreasing tendency)
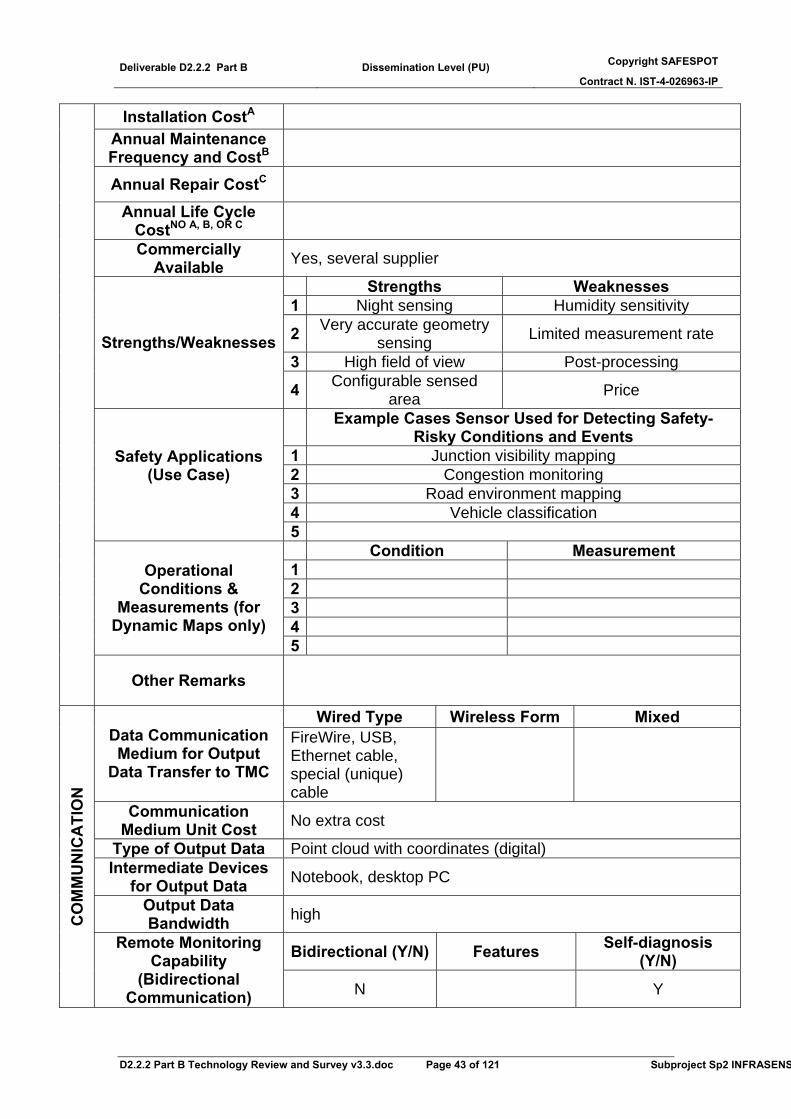
Deliverable D2.2.2 Part B Dissemination Level (PU) Copyright SAFESPOT
Contract N. IST-4-026963-IP
D2.2.2 Part B Technology Review and Survey v3.3.doc Page 43 of 121 Subproject Sp2 INFRASENS
Installation CostA Annual Maintenance Frequency and CostB
Annual Repair CostC
Annual Life Cycle CostNO A, B, OR C
Commercially Available Yes, several supplier
Strengths Weaknesses 1 Night sensing Humidity sensitivity
2 Very accurate geometry sensing Limited measurement rate
3 High field of view Post-processing Strengths/Weaknesses
4 Configurable sensed area Price
Example Cases Sensor Used for Detecting Safety-Risky Conditions and Events
1 Junction visibility mapping 2 Congestion monitoring 3 Road environment mapping 4 Vehicle classification
Safety Applications (Use Case)
5 Condition Measurement
1 2 3 4
Operational Conditions &
Measurements (for Dynamic Maps only)
5
Other Remarks
Wired Type Wireless Form Mixed Data Communication Medium for Output
Data Transfer to TMC
FireWire, USB, Ethernet cable, special (unique) cable
Communication Medium Unit Cost No extra cost
Type of Output Data Point cloud with coordinates (digital) Intermediate Devices
for Output Data Notebook, desktop PC
Output Data Bandwidth high
Bidirectional (Y/N) Features Self-diagnosis (Y/N)
CO
MM
UN
ICA
TIO
N
Remote Monitoring Capability
(Bidirectional Communication) N Y
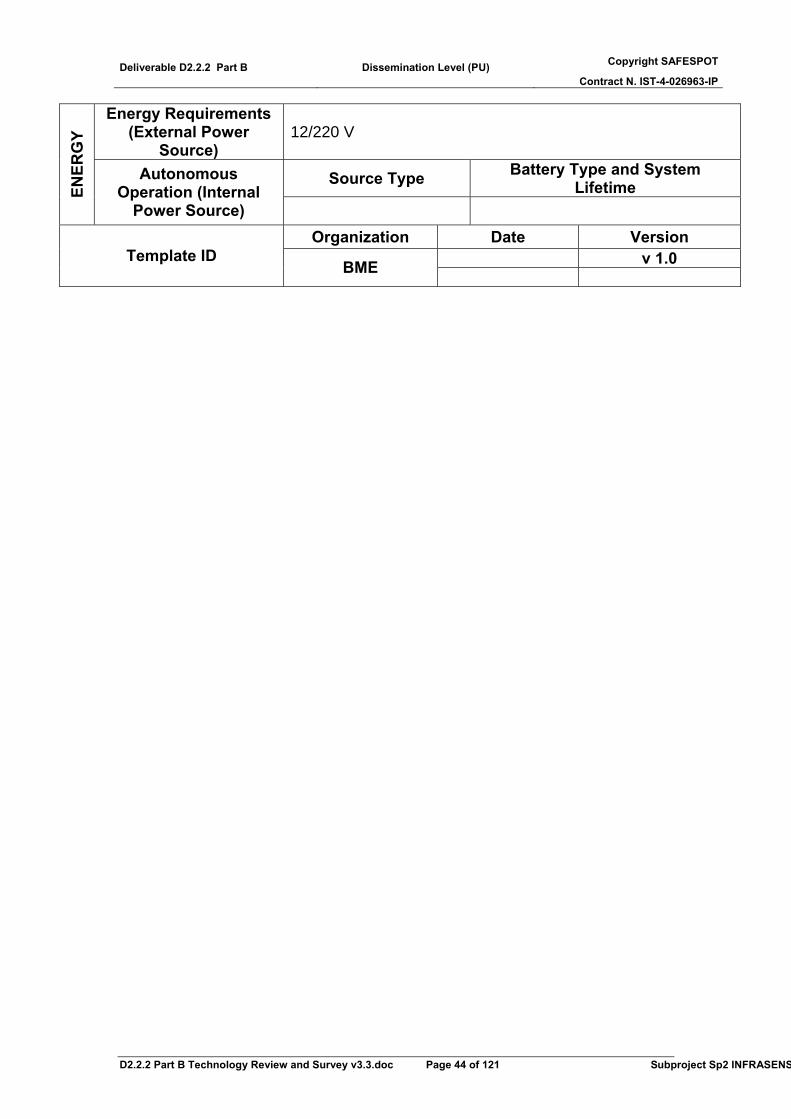
Deliverable D2.2.2 Part B Dissemination Level (PU) Copyright SAFESPOT
Contract N. IST-4-026963-IP
D2.2.2 Part B Technology Review and Survey v3.3.doc Page 44 of 121 Subproject Sp2 INFRASENS
Energy Requirements (External Power
Source) 12/220 V
Source Type Battery Type and System Lifetime EN
ERG
Y
Autonomous Operation (Internal
Power Source) Organization Date Version
v 1.0 Template ID BME
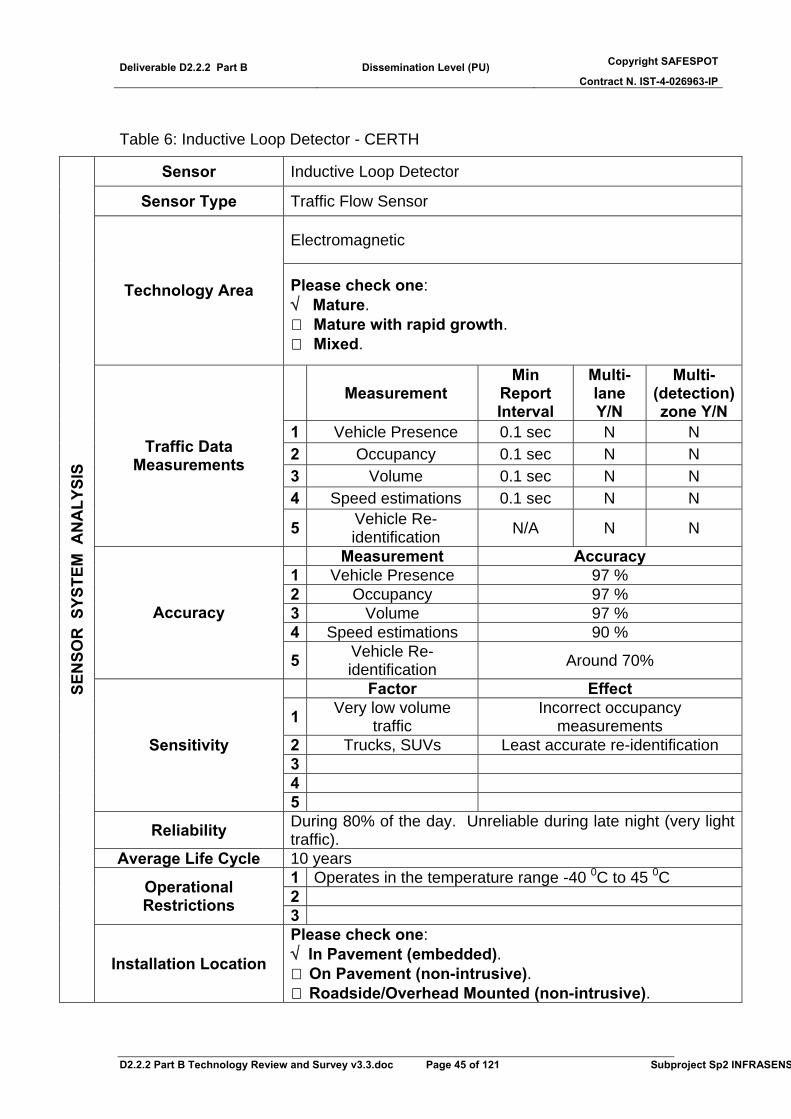
Deliverable D2.2.2 Part B Dissemination Level (PU) Copyright SAFESPOT
Contract N. IST-4-026963-IP
D2.2.2 Part B Technology Review and Survey v3.3.doc Page 45 of 121 Subproject Sp2 INFRASENS
Table 6: Inductive Loop Detector - CERTH
Sensor Inductive Loop Detector
Sensor Type Traffic Flow Sensor
Electromagnetic
Technology Area Please check one: √ Mature.
Mature with rapid growth. Mixed.
Measurement Min
Report Interval
Multi-lane Y/N
Multi-(detection) zone Y/N
1 Vehicle Presence 0.1 sec N N 2 Occupancy 0.1 sec N N 3 Volume 0.1 sec N N 4 Speed estimations 0.1 sec N N
Traffic Data Measurements
5 Vehicle Re-identification N/A N N
Measurement Accuracy 1 Vehicle Presence 97 % 2 Occupancy 97 % 3 Volume 97 % 4 Speed estimations 90 %
Accuracy
5 Vehicle Re-identification Around 70%
Factor Effect
1 Very low volume traffic
Incorrect occupancy measurements
2 Trucks, SUVs Least accurate re-identification 3 4
Sensitivity
5
Reliability During 80% of the day. Unreliable during late night (very light traffic).
Average Life Cycle 10 years 1 Operates in the temperature range -40 0C to 45 0C 2 Operational
Restrictions 3
SEN
SOR
SYS
TEM
AN
ALY
SIS
Installation Location
Please check one: √ In Pavement (embedded).
On Pavement (non-intrusive). Roadside/Overhead Mounted (non-intrusive).
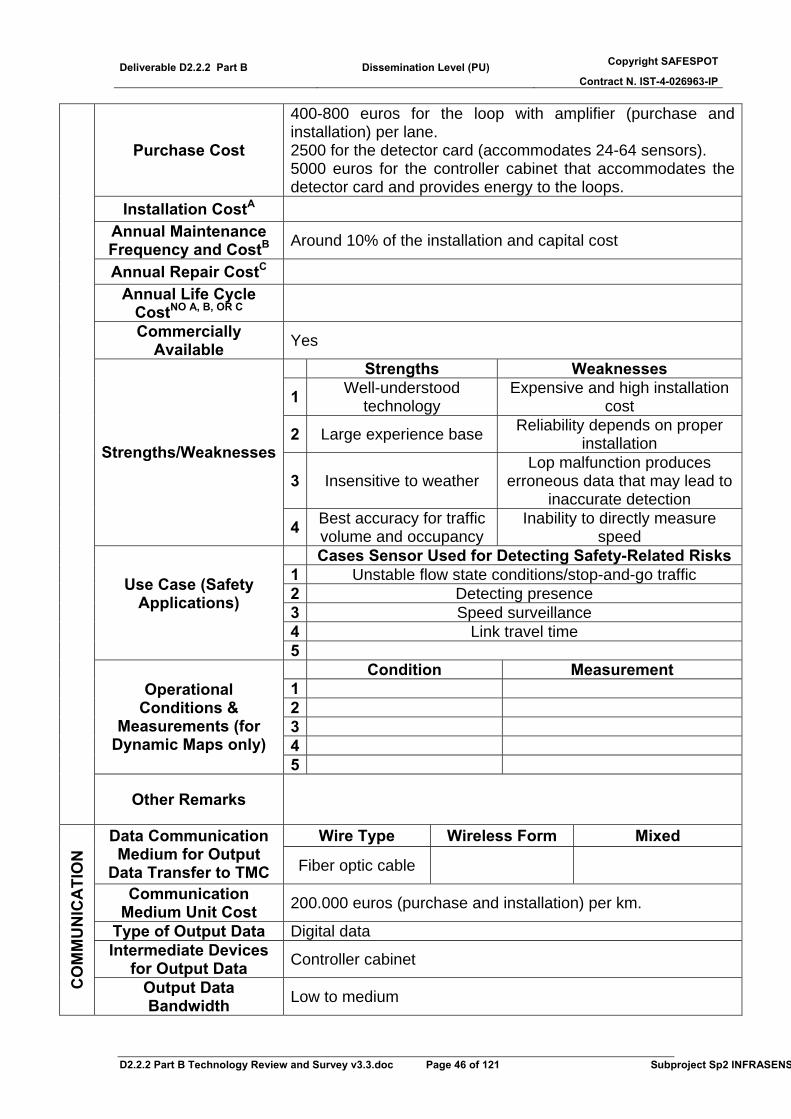
Deliverable D2.2.2 Part B Dissemination Level (PU) Copyright SAFESPOT
Contract N. IST-4-026963-IP
D2.2.2 Part B Technology Review and Survey v3.3.doc Page 46 of 121 Subproject Sp2 INFRASENS
Purchase Cost
400-800 euros for the loop with amplifier (purchase and installation) per lane. 2500 for the detector card (accommodates 24-64 sensors). 5000 euros for the controller cabinet that accommodates the detector card and provides energy to the loops.
Installation CostA Annual Maintenance Frequency and CostB Around 10% of the installation and capital cost
Annual Repair CostC Annual Life Cycle
CostNO A, B, OR C
Commercially Available Yes
Strengths Weaknesses
1 Well-understood technology
Expensive and high installation cost
2 Large experience base Reliability depends on proper installation
3 Insensitive to weather Lop malfunction produces
erroneous data that may lead to inaccurate detection
Strengths/Weaknesses
4 Best accuracy for traffic volume and occupancy
Inability to directly measure speed
Cases Sensor Used for Detecting Safety-Related Risks 1 Unstable flow state conditions/stop-and-go traffic 2 Detecting presence 3 Speed surveillance 4 Link travel time
Use Case (Safety Applications)
5 Condition Measurement
1 2 3 4
Operational Conditions &
Measurements (for Dynamic Maps only)
5
Other Remarks
Wire Type Wireless Form Mixed Data Communication Medium for Output
Data Transfer to TMC Fiber optic cable
Communication Medium Unit Cost 200.000 euros (purchase and installation) per km.
Type of Output Data Digital data Intermediate Devices
for Output Data Controller cabinet
CO
MM
UN
ICA
TIO
N
Output Data Bandwidth Low to medium

Deliverable D2.2.2 Part B Dissemination Level (PU) Copyright SAFESPOT
Contract N. IST-4-026963-IP
D2.2.2 Part B Technology Review and Survey v3.3.doc Page 47 of 121 Subproject Sp2 INFRASENS
Bidirectional (Y/N) Features Self-diagnosis (Y/N)Remote Monitoring
Capability (Bidirectional
Communication) No No
Energy Requirements (External Power
Source)
A controller cabinet is powered by 50 Amp, 120/240 Volt, single phase service. A 170 controller units (detection card) accommodates 24 loop detectors.
Source Type Battery Type and System Lifetime Autonomous Operation (Internal
Power Source) No
Organization Date Version 30/05/2006 v 1.0
ENER
GY
Template ID CERTH

Deliverable D2.2.2 Part B Dissemination Level (PU) Copyright SAFESPOT
Contract N. IST-4-026963-IP
D2.2.2 Part B Technology Review and Survey v3.3.doc Page 48 of 121 Subproject Sp2 INFRASENS
Table 7 Magneto Resistive Sensor CERTH
Sensor Magneto-resistive Sensor
Sensor Type Traffic Flow Sensor
Earth’s magnetic field
Technology Area Please check one: √ Mature.
Mature with rapid growth. Mixed.
Measurement Min
Report Interval
Multi-lane Y/N
Multi-(detection) zone Y/N
1 Vehicle Presence 0.125 sec N N 2 Occupancy 0.125 sec N N 3 Volume 0.125 sec N N 4 Speed estimations 0.125 sec N N 5 Queues 0.125 sec N N
Traffic Data Measurements
6 Vehicle Length N/A N N Measurement Accuracy
1 Vehicle Presence 97 % 2 Occupancy 97 % 3 Volume 97 % 4 Speed estimations 97 % 5 Queues 97 %
Accuracy
6 Vehicle Length Around 90% Factor Effect 1 2 3 4
Sensitivity
5 Reliability Reliable and precise detection
Average Life Cycle 10 years 1 Operates in the temperature range -40 0C to 85 0C 2 Operational
Restrictions 3
Installation Location
Please check one: √ In Pavement (embedded).
On Pavement (non-intrusive). Roadside/Overhead Mounted (non-intrusive).
SEN
SOR
SYS
TEM
AN
ALY
SIS
Purchase Cost Available upon request.
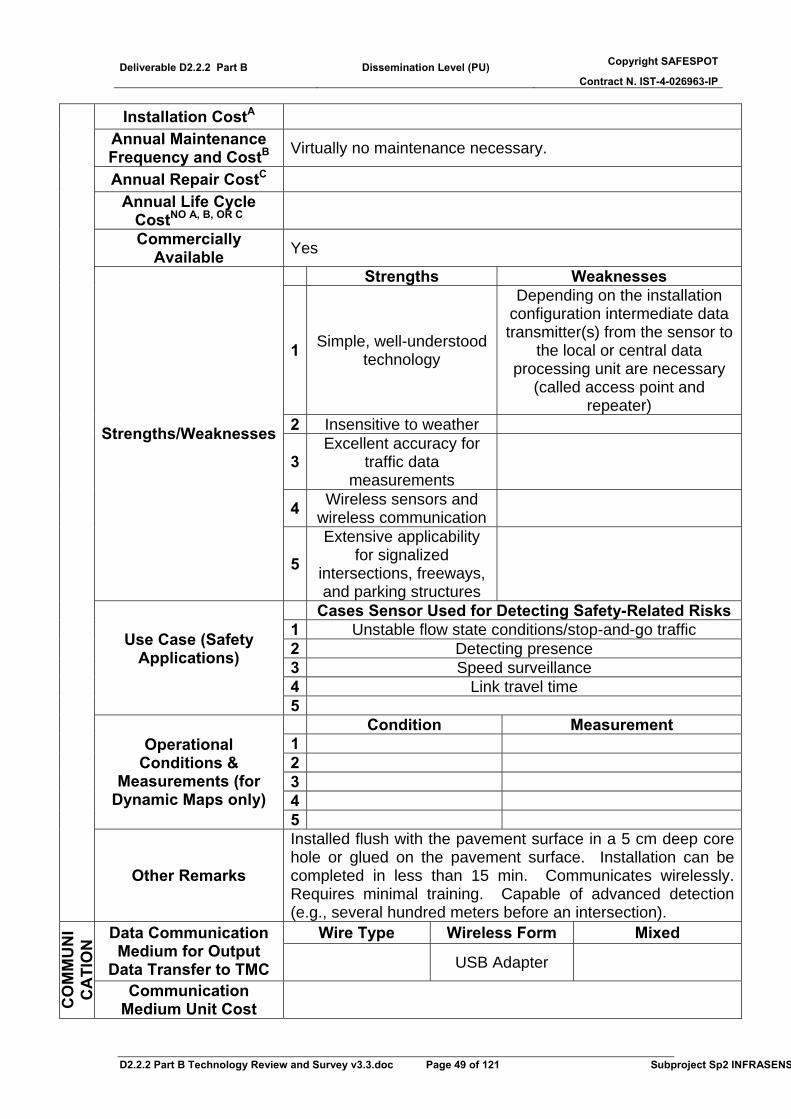
Deliverable D2.2.2 Part B Dissemination Level (PU) Copyright SAFESPOT
Contract N. IST-4-026963-IP
D2.2.2 Part B Technology Review and Survey v3.3.doc Page 49 of 121 Subproject Sp2 INFRASENS
Installation CostA Annual Maintenance Frequency and CostB Virtually no maintenance necessary.
Annual Repair CostC Annual Life Cycle
CostNO A, B, OR C
Commercially Available Yes
Strengths Weaknesses
1 Simple, well-understood technology
Depending on the installation configuration intermediate data transmitter(s) from the sensor to
the local or central data processing unit are necessary
(called access point and repeater)
2 Insensitive to weather
3 Excellent accuracy for
traffic data measurements
4 Wireless sensors and wireless communication
Strengths/Weaknesses
5 Extensive applicability
for signalized intersections, freeways, and parking structures
Cases Sensor Used for Detecting Safety-Related Risks 1 Unstable flow state conditions/stop-and-go traffic 2 Detecting presence 3 Speed surveillance 4 Link travel time
Use Case (Safety Applications)
5 Condition Measurement
1 2 3 4
Operational Conditions &
Measurements (for Dynamic Maps only)
5
Other Remarks
Installed flush with the pavement surface in a 5 cm deep core hole or glued on the pavement surface. Installation can be completed in less than 15 min. Communicates wirelessly. Requires minimal training. Capable of advanced detection (e.g., several hundred meters before an intersection).
Wire Type Wireless Form Mixed Data Communication Medium for Output
Data Transfer to TMC USB Adapter
CO
MM
UN
IC
ATI
ON
Communication Medium Unit Cost
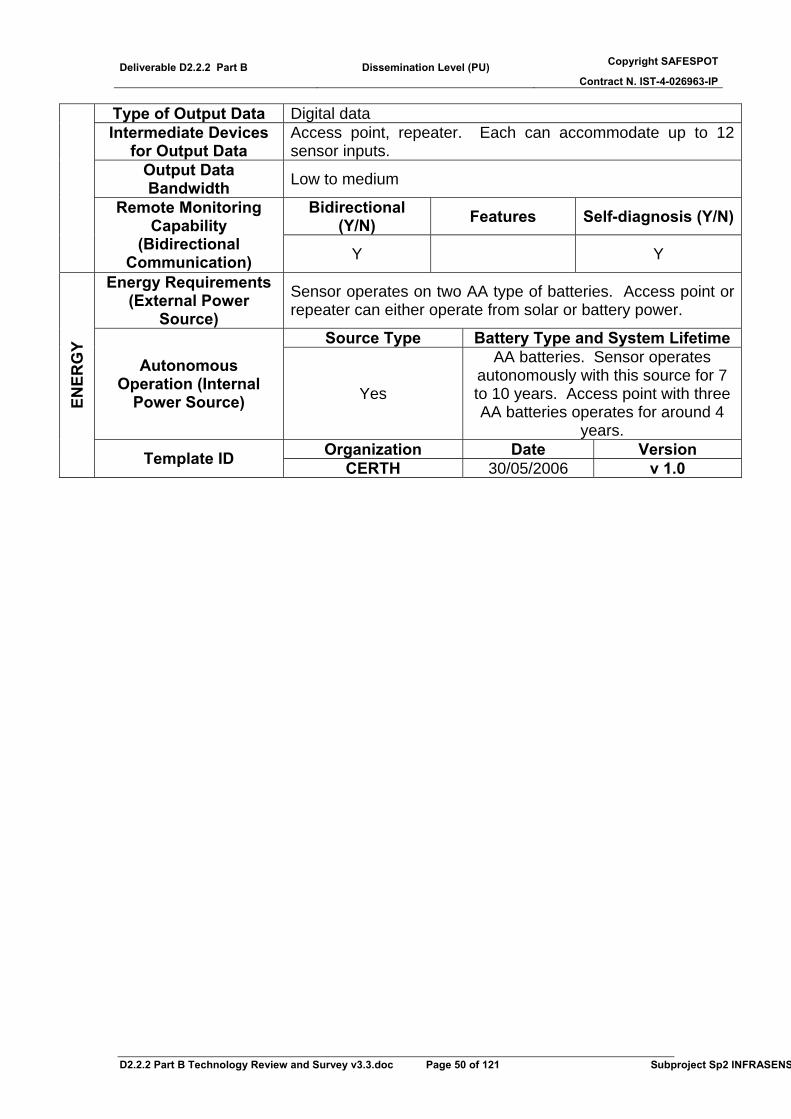
Deliverable D2.2.2 Part B Dissemination Level (PU) Copyright SAFESPOT
Contract N. IST-4-026963-IP
D2.2.2 Part B Technology Review and Survey v3.3.doc Page 50 of 121 Subproject Sp2 INFRASENS
Type of Output Data Digital data Intermediate Devices
for Output Data Access point, repeater. Each can accommodate up to 12 sensor inputs.
Output Data Bandwidth Low to medium
Bidirectional (Y/N) Features Self-diagnosis (Y/N)Remote Monitoring
Capability (Bidirectional
Communication) Y Y
Energy Requirements (External Power
Source) Sensor operates on two AA type of batteries. Access point or repeater can either operate from solar or battery power.
Source Type Battery Type and System Lifetime Autonomous
Operation (Internal Power Source) Yes
AA batteries. Sensor operates autonomously with this source for 7 to 10 years. Access point with three AA batteries operates for around 4
years. Organization Date Version
ENER
GY
Template ID CERTH 30/05/2006 v 1.0
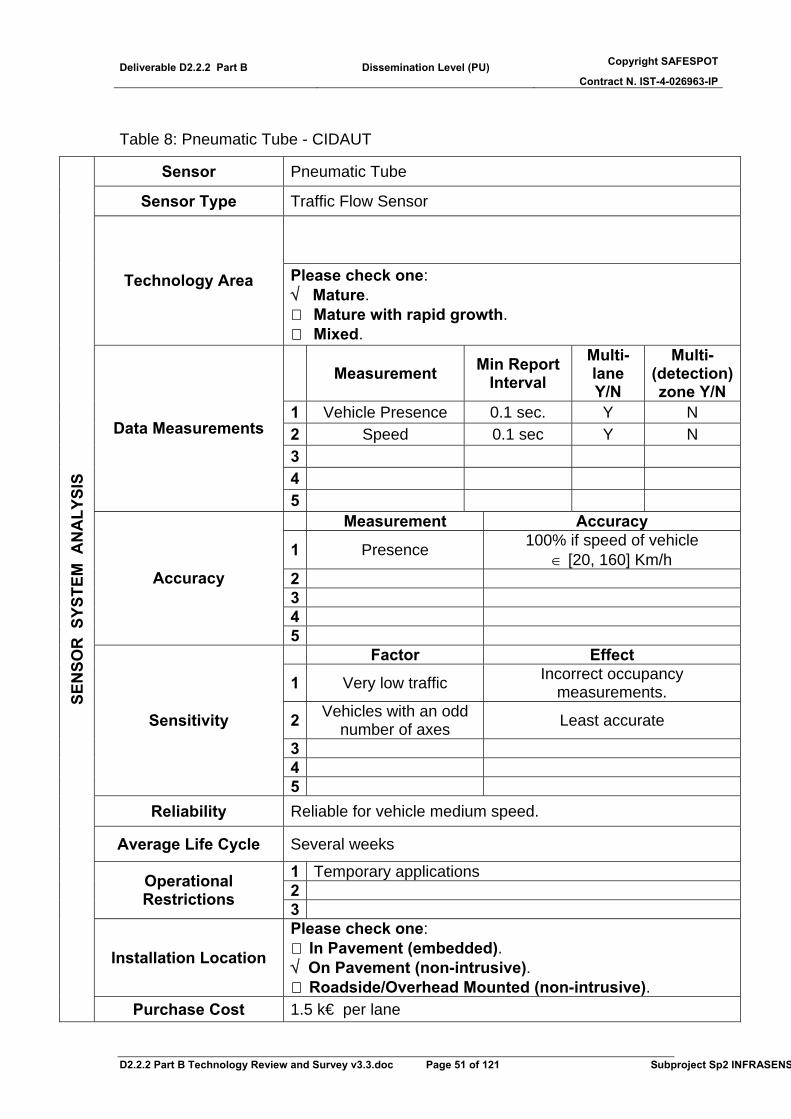
Deliverable D2.2.2 Part B Dissemination Level (PU) Copyright SAFESPOT
Contract N. IST-4-026963-IP
D2.2.2 Part B Technology Review and Survey v3.3.doc Page 51 of 121 Subproject Sp2 INFRASENS
Table 8: Pneumatic Tube - CIDAUT
Sensor Pneumatic Tube
Sensor Type Traffic Flow Sensor
Technology Area Please check one: √ Mature.
Mature with rapid growth. Mixed.
Measurement Min Report Interval
Multi-lane Y/N
Multi-(detection) zone Y/N
1 Vehicle Presence 0.1 sec. Y N 2 Speed 0.1 sec Y N 3 4
Data Measurements
5 Measurement Accuracy
1 Presence 100% if speed of vehicle ∈ [20, 160] Km/h
2 3 4
Accuracy
5 Factor Effect
1 Very low traffic Incorrect occupancy measurements.
2 Vehicles with an odd number of axes Least accurate
3 4
Sensitivity
5 Reliability Reliable for vehicle medium speed.
Average Life Cycle Several weeks
1 Temporary applications 2 Operational
Restrictions 3
Installation Location
Please check one: In Pavement (embedded).
√ On Pavement (non-intrusive). Roadside/Overhead Mounted (non-intrusive).
SEN
SOR
SYS
TEM
AN
ALY
SIS
Purchase Cost 1.5 k€ per lane

Deliverable D2.2.2 Part B Dissemination Level (PU) Copyright SAFESPOT
Contract N. IST-4-026963-IP
D2.2.2 Part B Technology Review and Survey v3.3.doc Page 52 of 121 Subproject Sp2 INFRASENS
Installation CostA Insignificant Annual Maintenance Frequency and CostB
Not applicable. Frequent checks to ensure a good data collection.
Annual Repair CostC Not applicable
Annual Life Cycle CostNO A, B, OR C Not applicable
Commercially Available Yes
Strengths Weaknesses 1 Quick installation Not permanent 2 Sensitive to vehicle speed. 3
Strengths/Weaknesses
4
Example Cases Sensor Used for Detecting Safety-Risky Conditions and Events
1 Presence and speed measurement. 2 3 4
Safety Applications (Use Case)
5 Condition Measurement
1 2 3 4
Operational Conditions &
Measurements (for Dynamic Maps only)
5
Other Remarks
Wire Type Wireless Form Mixed Data Communication Medium for Output
Data Transfer to TMC Wires. Radio-modem
Communication Medium Unit Cost 300 €
Type of Output Data Digital – Serial Intermediate Devices
for Output Data Processing and collecting unit
Output Data Bandwidth Low to medium
Bidirectional (Y/N) Features Self-diagnosis (Y/N)
CO
MM
UN
ICA
TIO
N
Remote Monitoring Capability
(Bidirectional Communication) No No
Energy Requirements (External Power
Source) No
ENER
GY
Autonomous Operation (Internal
Source Type Battery Type and System Lifetime
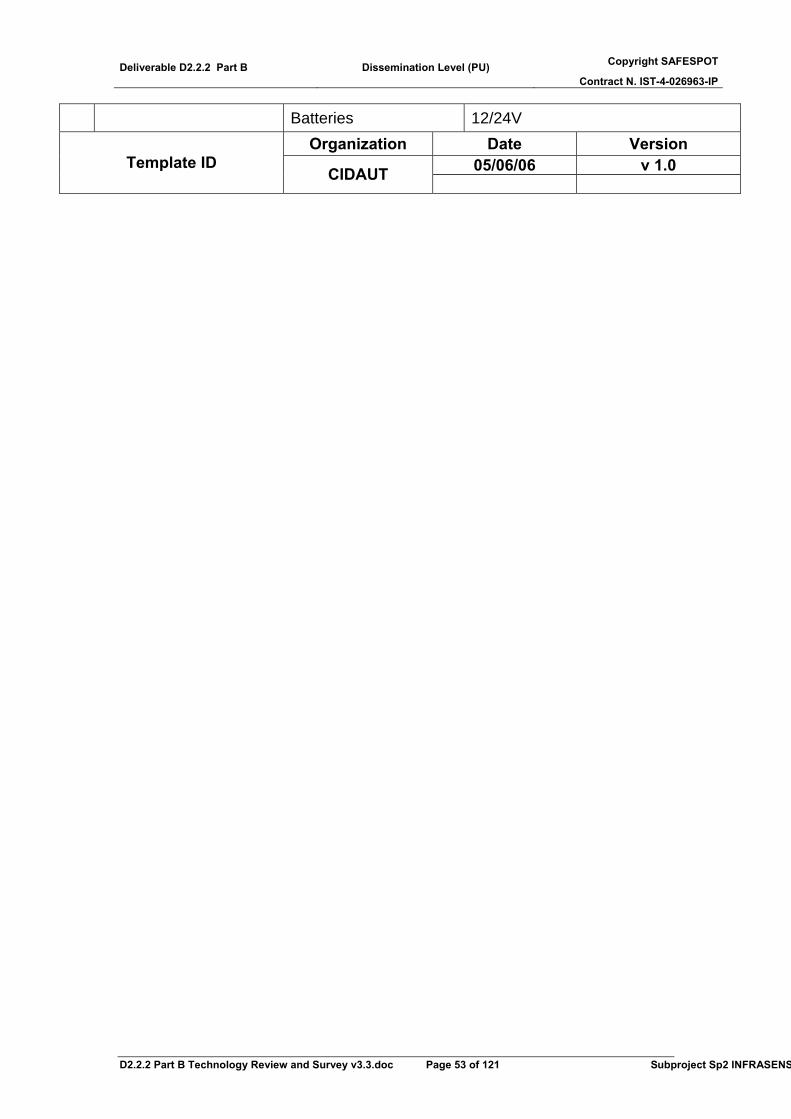
Deliverable D2.2.2 Part B Dissemination Level (PU) Copyright SAFESPOT
Contract N. IST-4-026963-IP
D2.2.2 Part B Technology Review and Survey v3.3.doc Page 53 of 121 Subproject Sp2 INFRASENS
Batteries 12/24V Organization Date Version
05/06/06 v 1.0 Template ID CIDAUT
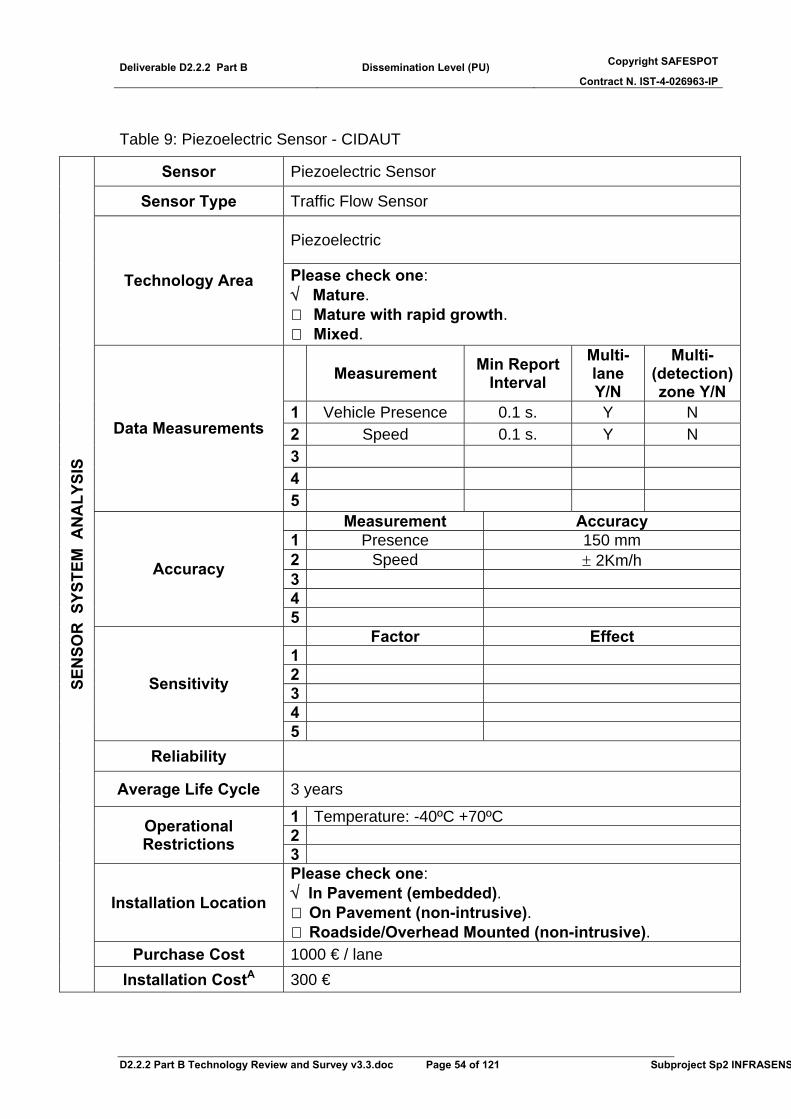
Deliverable D2.2.2 Part B Dissemination Level (PU) Copyright SAFESPOT
Contract N. IST-4-026963-IP
D2.2.2 Part B Technology Review and Survey v3.3.doc Page 54 of 121 Subproject Sp2 INFRASENS
Table 9: Piezoelectric Sensor - CIDAUT
Sensor Piezoelectric Sensor
Sensor Type Traffic Flow Sensor
Piezoelectric
Technology Area Please check one: √ Mature.
Mature with rapid growth. Mixed.
Measurement Min Report Interval
Multi-lane Y/N
Multi-(detection) zone Y/N
1 Vehicle Presence 0.1 s. Y N 2 Speed 0.1 s. Y N 3 4
Data Measurements
5 Measurement Accuracy
1 Presence 150 mm 2 Speed ± 2Km/h 3 4
Accuracy
5 Factor Effect 1 2 3 4
Sensitivity
5 Reliability
Average Life Cycle 3 years
1 Temperature: -40ºC +70ºC 2 Operational
Restrictions 3
Installation Location
Please check one: √ In Pavement (embedded).
On Pavement (non-intrusive). Roadside/Overhead Mounted (non-intrusive).
Purchase Cost 1000 € / lane
SEN
SOR
SYS
TEM
AN
ALY
SIS
Installation CostA 300 €
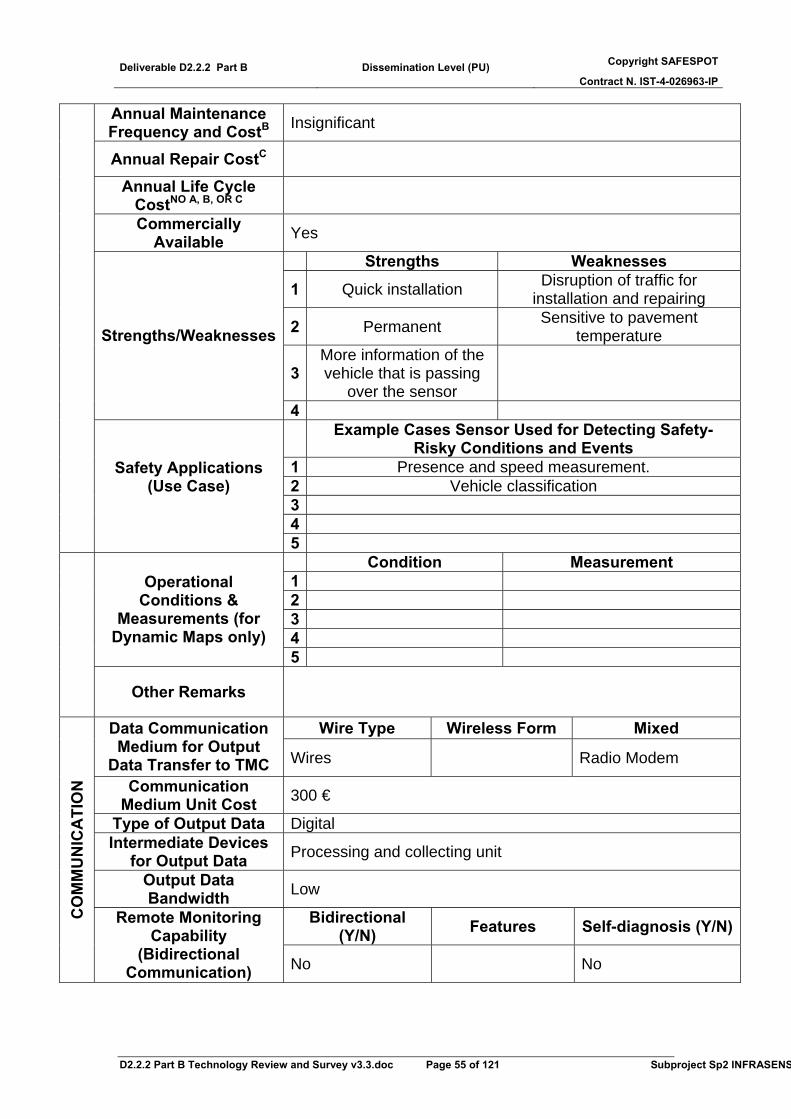
Deliverable D2.2.2 Part B Dissemination Level (PU) Copyright SAFESPOT
Contract N. IST-4-026963-IP
D2.2.2 Part B Technology Review and Survey v3.3.doc Page 55 of 121 Subproject Sp2 INFRASENS
Annual Maintenance Frequency and CostB Insignificant
Annual Repair CostC
Annual Life Cycle CostNO A, B, OR C
Commercially Available Yes
Strengths Weaknesses
1 Quick installation Disruption of traffic for installation and repairing
2 Permanent Sensitive to pavement temperature
3 More information of the vehicle that is passing
over the sensor
Strengths/Weaknesses
4
Example Cases Sensor Used for Detecting Safety-Risky Conditions and Events
1 Presence and speed measurement. 2 Vehicle classification 3 4
Safety Applications (Use Case)
5 Condition Measurement
1 2 3 4
Operational Conditions &
Measurements (for Dynamic Maps only)
5
Other Remarks
Wire Type Wireless Form Mixed Data Communication Medium for Output
Data Transfer to TMC Wires Radio Modem
Communication Medium Unit Cost 300 €
Type of Output Data Digital Intermediate Devices
for Output Data Processing and collecting unit
Output Data Bandwidth Low
Bidirectional (Y/N) Features Self-diagnosis (Y/N)
CO
MM
UN
ICA
TIO
N
Remote Monitoring Capability
(Bidirectional Communication) No No

Deliverable D2.2.2 Part B Dissemination Level (PU) Copyright SAFESPOT
Contract N. IST-4-026963-IP
D2.2.2 Part B Technology Review and Survey v3.3.doc Page 56 of 121 Subproject Sp2 INFRASENS
Energy Requirements (External Power
Source) Yes - 220VAC / 100 mAmps.
Source Type Battery Type and System Lifetime
ENER
GY
Autonomous Operation (Internal
Power Source) NO Organization Date Version
05/06/06 v 1.0 Template ID CIDAUT
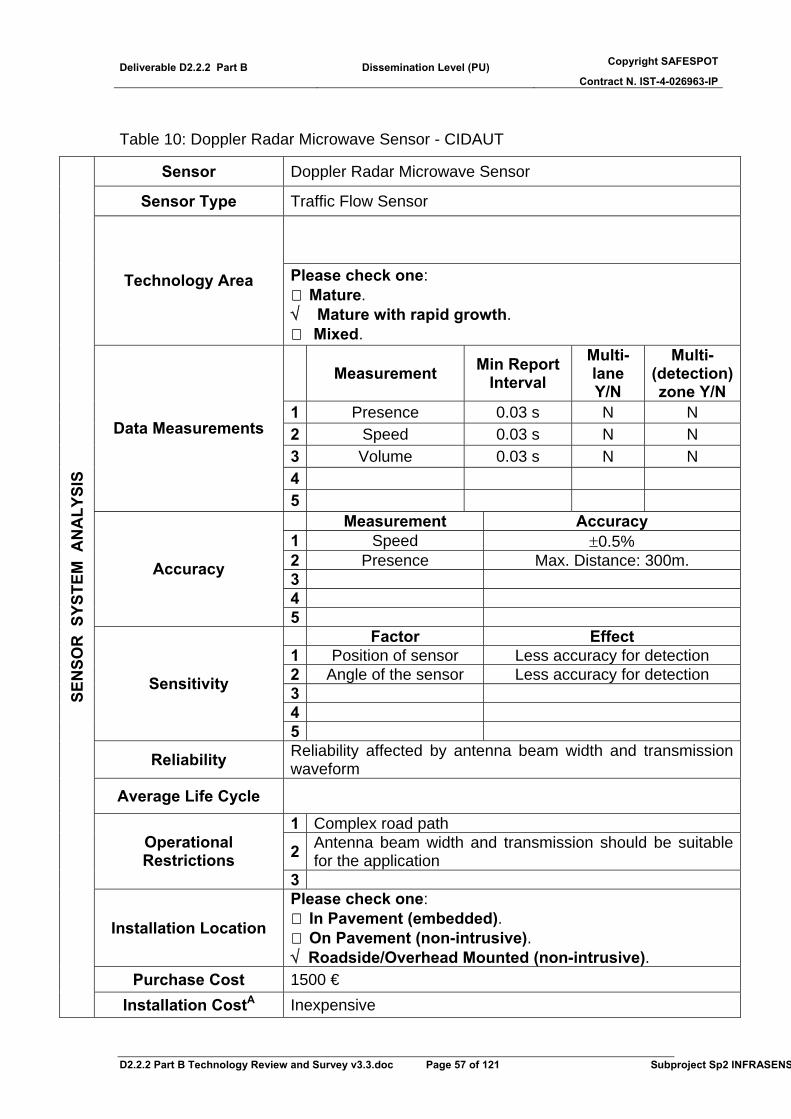
Deliverable D2.2.2 Part B Dissemination Level (PU) Copyright SAFESPOT
Contract N. IST-4-026963-IP
D2.2.2 Part B Technology Review and Survey v3.3.doc Page 57 of 121 Subproject Sp2 INFRASENS
Table 10: Doppler Radar Microwave Sensor - CIDAUT
Sensor Doppler Radar Microwave Sensor
Sensor Type Traffic Flow Sensor
Technology Area Please check one: Mature.
√ Mature with rapid growth. Mixed.
Measurement Min Report Interval
Multi-lane Y/N
Multi-(detection) zone Y/N
1 Presence 0.03 s N N 2 Speed 0.03 s N N 3 Volume 0.03 s N N 4
Data Measurements
5 Measurement Accuracy
1 Speed ±0.5% 2 Presence Max. Distance: 300m. 3 4
Accuracy
5 Factor Effect 1 Position of sensor Less accuracy for detection 2 Angle of the sensor Less accuracy for detection 3 4
Sensitivity
5
Reliability Reliability affected by antenna beam width and transmission waveform
Average Life Cycle
1 Complex road path
2 Antenna beam width and transmission should be suitable for the application
Operational Restrictions
3
Installation Location
Please check one: In Pavement (embedded). On Pavement (non-intrusive).
√ Roadside/Overhead Mounted (non-intrusive). Purchase Cost 1500 €
SEN
SOR
SYS
TEM
AN
ALY
SIS
Installation CostA Inexpensive
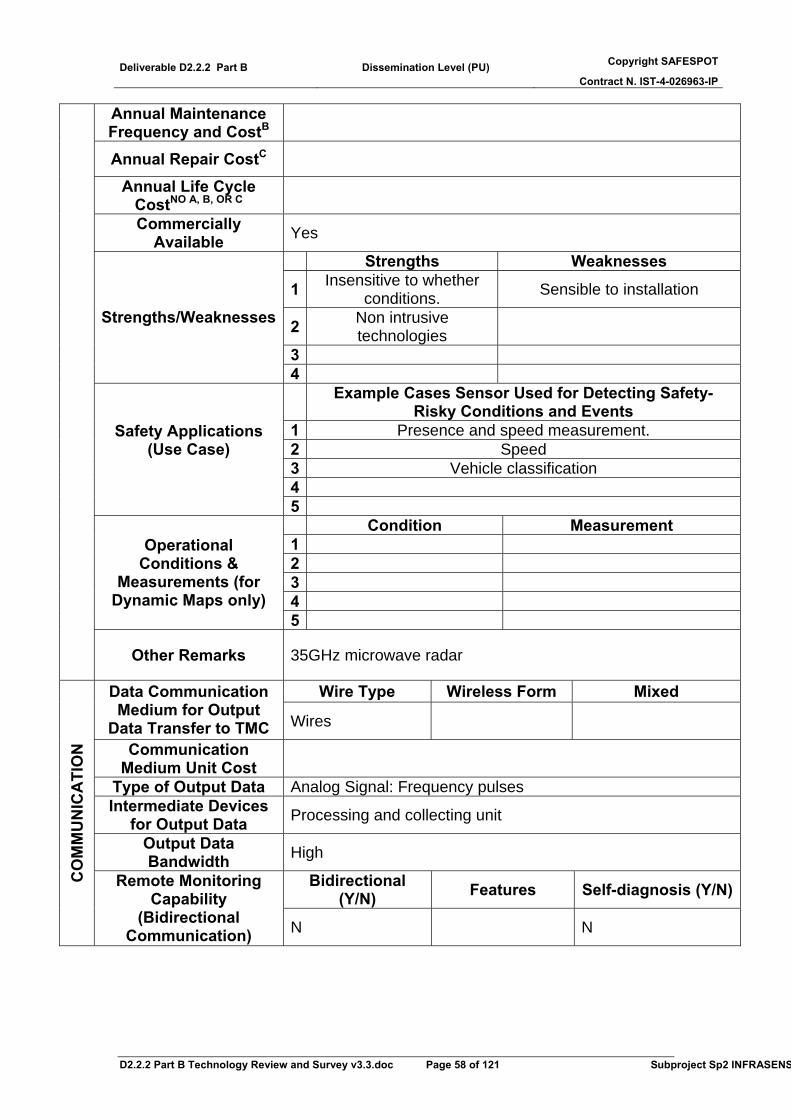
Deliverable D2.2.2 Part B Dissemination Level (PU) Copyright SAFESPOT
Contract N. IST-4-026963-IP
D2.2.2 Part B Technology Review and Survey v3.3.doc Page 58 of 121 Subproject Sp2 INFRASENS
Annual Maintenance Frequency and CostB
Annual Repair CostC
Annual Life Cycle CostNO A, B, OR C
Commercially Available Yes
Strengths Weaknesses
1 Insensitive to whether conditions. Sensible to installation
2 Non intrusive technologies
3
Strengths/Weaknesses
4
Example Cases Sensor Used for Detecting Safety-Risky Conditions and Events
1 Presence and speed measurement. 2 Speed 3 Vehicle classification 4
Safety Applications (Use Case)
5 Condition Measurement
1 2 3 4
Operational Conditions &
Measurements (for Dynamic Maps only)
5
Other Remarks 35GHz microwave radar
Wire Type Wireless Form Mixed Data Communication Medium for Output
Data Transfer to TMC Wires
Communication Medium Unit Cost
Type of Output Data Analog Signal: Frequency pulses Intermediate Devices
for Output Data Processing and collecting unit
Output Data Bandwidth High
Bidirectional (Y/N) Features Self-diagnosis (Y/N)
CO
MM
UN
ICA
TIO
N
Remote Monitoring Capability
(Bidirectional Communication) N N
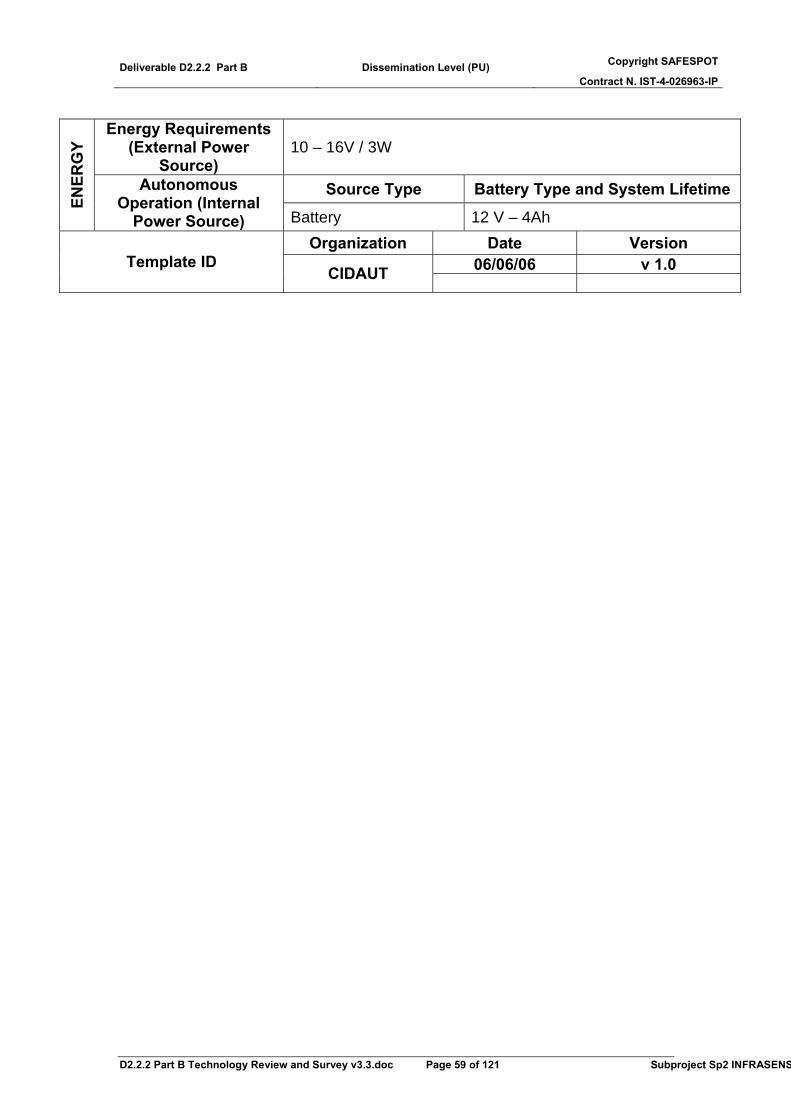
Deliverable D2.2.2 Part B Dissemination Level (PU) Copyright SAFESPOT
Contract N. IST-4-026963-IP
D2.2.2 Part B Technology Review and Survey v3.3.doc Page 59 of 121 Subproject Sp2 INFRASENS
Energy Requirements
(External Power Source)
10 – 16V / 3W
Source Type Battery Type and System Lifetime
ENER
GY
Autonomous Operation (Internal
Power Source) Battery 12 V – 4Ah Organization Date Version
06/06/06 v 1.0 Template ID CIDAUT
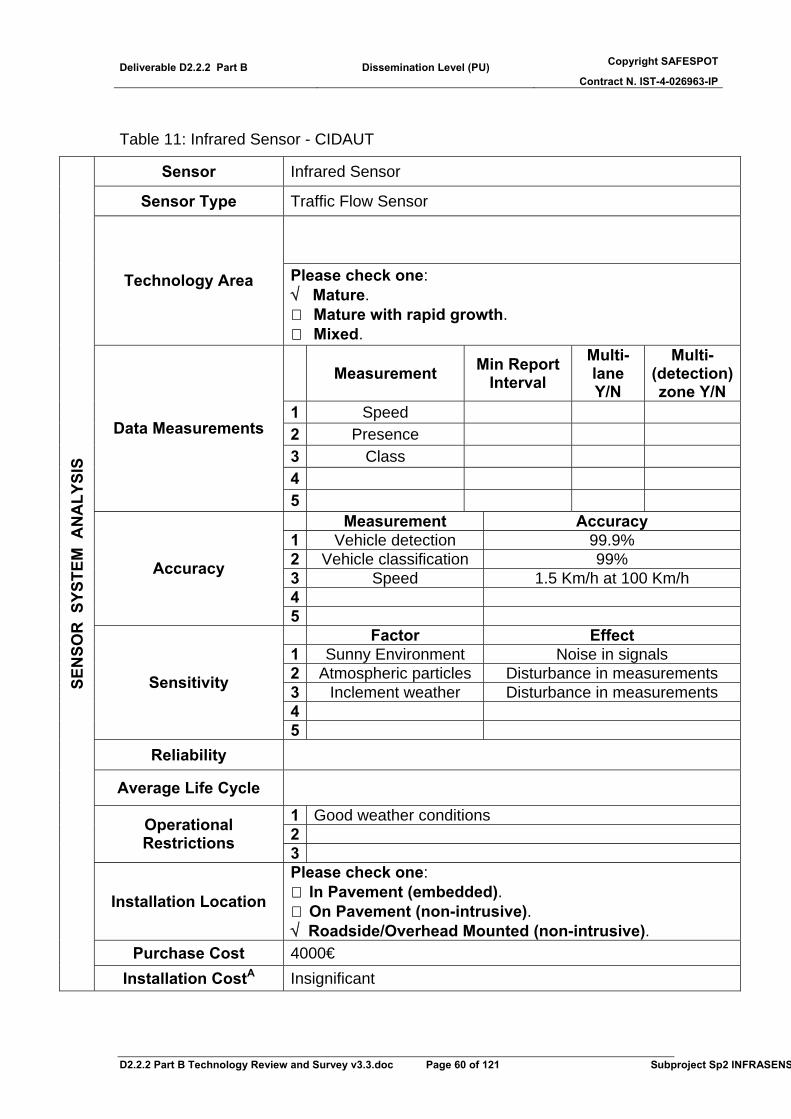
Deliverable D2.2.2 Part B Dissemination Level (PU) Copyright SAFESPOT
Contract N. IST-4-026963-IP
D2.2.2 Part B Technology Review and Survey v3.3.doc Page 60 of 121 Subproject Sp2 INFRASENS
Table 11: Infrared Sensor - CIDAUT
Sensor Infrared Sensor
Sensor Type Traffic Flow Sensor
Technology Area Please check one: √ Mature.
Mature with rapid growth. Mixed.
Measurement Min Report Interval
Multi-lane Y/N
Multi-(detection) zone Y/N
1 Speed 2 Presence 3 Class 4
Data Measurements
5 Measurement Accuracy
1 Vehicle detection 99.9% 2 Vehicle classification 99% 3 Speed 1.5 Km/h at 100 Km/h 4
Accuracy
5 Factor Effect 1 Sunny Environment Noise in signals 2 Atmospheric particles Disturbance in measurements 3 Inclement weather Disturbance in measurements 4
Sensitivity
5 Reliability
Average Life Cycle
1 Good weather conditions 2 Operational
Restrictions 3
Installation Location
Please check one: In Pavement (embedded). On Pavement (non-intrusive).
√ Roadside/Overhead Mounted (non-intrusive). Purchase Cost 4000€
SEN
SOR
SYS
TEM
AN
ALY
SIS
Installation CostA Insignificant

Deliverable D2.2.2 Part B Dissemination Level (PU) Copyright SAFESPOT
Contract N. IST-4-026963-IP
D2.2.2 Part B Technology Review and Survey v3.3.doc Page 61 of 121 Subproject Sp2 INFRASENS
Annual Maintenance Frequency and CostB
Annual Repair CostC
Annual Life Cycle CostNO A, B, OR C
Commercially Available Yes
Strengths Weaknesses 1 Influence of environment 2 3
Strengths/Weaknesses
4
Example Cases Sensor Used for Detecting Safety-Risky Conditions and Events
1 Detection 2 Classification 3 Speed measurement 4
Safety Applications (Use Case)
5 Condition Measurement
1 2 3 4
Operational Conditions &
Measurements (for Dynamic Maps only)
5
Other Remarks Requires a CPU to process data
Wire Type Wireless Form Mixed Data Communication Medium for Output
Data Transfer to TMC Wires Telemetry
Communication Medium Unit Cost 300€
Type of Output Data Digital / Binary Images Intermediate Devices
for Output Data CPU. Intel486
Output Data Bandwidth High
Bidirectional (Y/N) Features Self-diagnosis (Y/N)
CO
MM
UN
ICA
TIO
N
Remote Monitoring Capability
(Bidirectional Communication) Yes Yes
Energy Requirements (External Power
Source) 220VAC – 40W
Source Type Battery Type and System Lifetime
ENER
GY
Autonomous Operation (Internal
Power Source)
Deliverable D2.2.2 Part B Dissemination Level (PU) Copyright SAFESPOT
Contract N. IST-4-026963-IP
D2.2.2 Part B Technology Review and Survey v3.3.doc Page 62 of 121 Subproject Sp2 INFRASENS
Organization Date Version 07/06/06 v 1.0 Template ID
CIDAUT
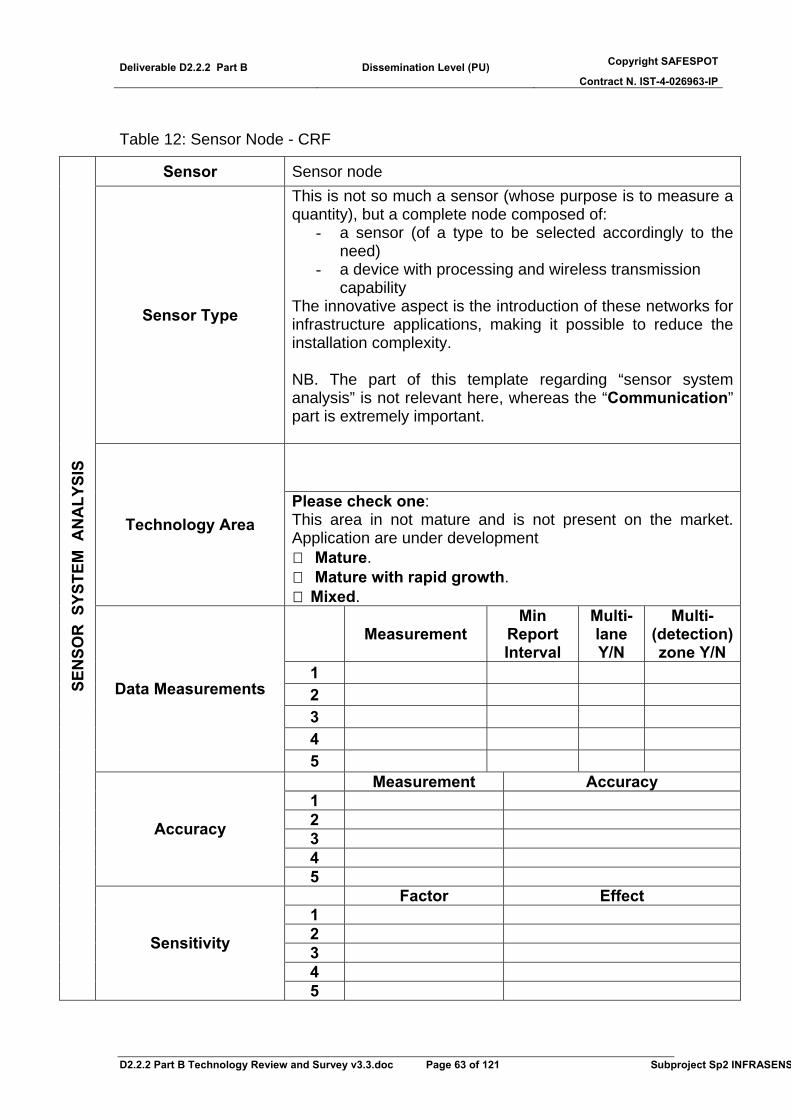
Deliverable D2.2.2 Part B Dissemination Level (PU) Copyright SAFESPOT
Contract N. IST-4-026963-IP
D2.2.2 Part B Technology Review and Survey v3.3.doc Page 63 of 121 Subproject Sp2 INFRASENS
Table 12: Sensor Node - CRF
Sensor Sensor node
Sensor Type
This is not so much a sensor (whose purpose is to measure a quantity), but a complete node composed of:
- a sensor (of a type to be selected accordingly to the need)
- a device with processing and wireless transmission capability
The innovative aspect is the introduction of these networks for infrastructure applications, making it possible to reduce the installation complexity. NB. The part of this template regarding “sensor system analysis” is not relevant here, whereas the “Communication” part is extremely important.
Technology Area Please check one: This area in not mature and is not present on the market. Application are under development
Mature. Mature with rapid growth. Mixed.
Measurement Min
Report Interval
Multi-lane Y/N
Multi-(detection) zone Y/N
1 2 3 4
Data Measurements
5 Measurement Accuracy
1 2 3 4
Accuracy
5 Factor Effect
1 2 3 4
SEN
SOR
SYS
TEM
AN
ALY
SIS
Sensitivity
5

Deliverable D2.2.2 Part B Dissemination Level (PU) Copyright SAFESPOT
Contract N. IST-4-026963-IP
D2.2.2 Part B Technology Review and Survey v3.3.doc Page 64 of 121 Subproject Sp2 INFRASENS
Reliability
Average Life Cycle
1 2 Operational
Restrictions 3
Installation Location
Please check one: In Pavement (embedded). On Pavement (non-intrusive). Roadside/Overhead Mounted (non-intrusive).
Purchase Cost Installation CostA
Annual Maintenance Frequency and CostB
Annual Repair CostC
Annual Life Cycle CostNO A, B, OR C
Commercially Available
Strengths Weaknesses 1 2 3
Strengths/Weaknesses
4
Example Cases Sensor Used for Detecting Safety-Risky Conditions and Events
1 2 3 4
Safety Applications (Use Case)
5 Condition Measurement
1 2 3 4
Operational Conditions &
Measurements (for Dynamic Maps only)
5
Other Remarks
U NI Data Communication
Medium for Output Wired Type Wireless Form Mixed
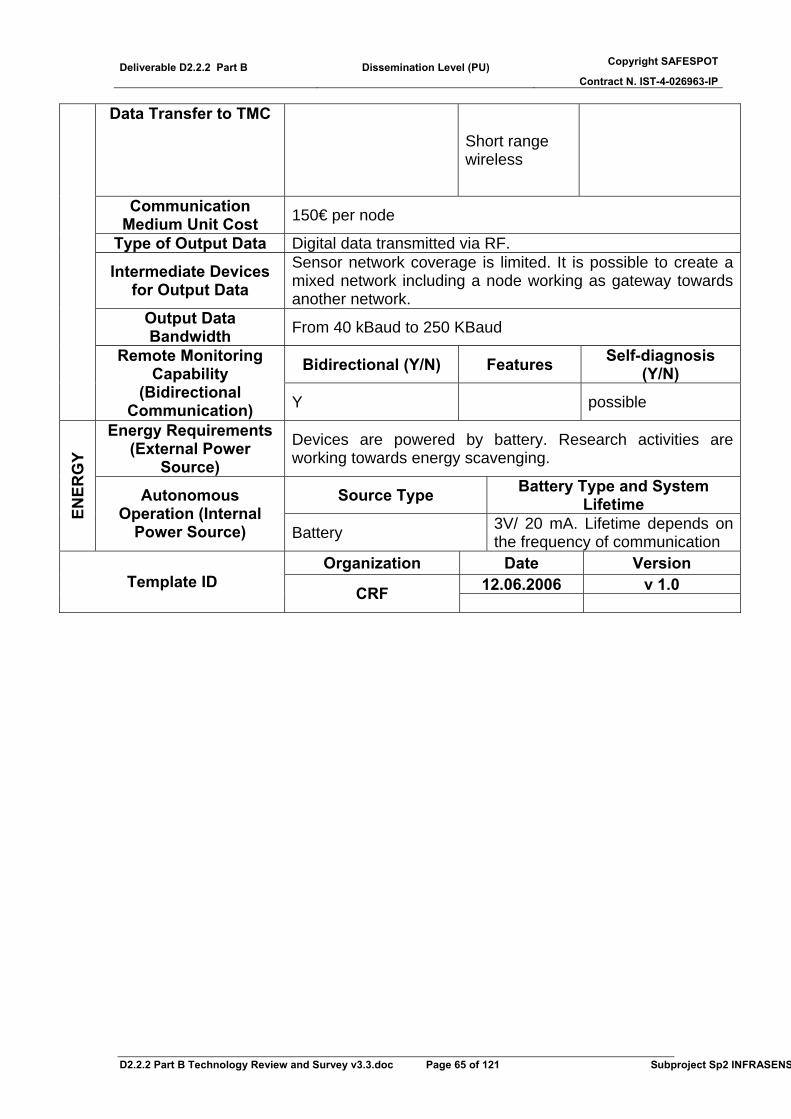
Deliverable D2.2.2 Part B Dissemination Level (PU) Copyright SAFESPOT
Contract N. IST-4-026963-IP
D2.2.2 Part B Technology Review and Survey v3.3.doc Page 65 of 121 Subproject Sp2 INFRASENS
Data Transfer to TMC
Short range wireless
Communication Medium Unit Cost 150€ per node
Type of Output Data Digital data transmitted via RF.
Intermediate Devices for Output Data
Sensor network coverage is limited. It is possible to create a mixed network including a node working as gateway towards another network.
Output Data Bandwidth From 40 kBaud to 250 KBaud
Bidirectional (Y/N) Features Self-diagnosis (Y/N)
Remote Monitoring Capability
(Bidirectional Communication) Y possible
Energy Requirements (External Power
Source) Devices are powered by battery. Research activities are working towards energy scavenging.
Source Type Battery Type and System Lifetime EN
ERG
Y
Autonomous Operation (Internal
Power Source) Battery 3V/ 20 mA. Lifetime depends on the frequency of communication
Organization Date Version 12.06.2006 v 1.0 Template ID
CRF
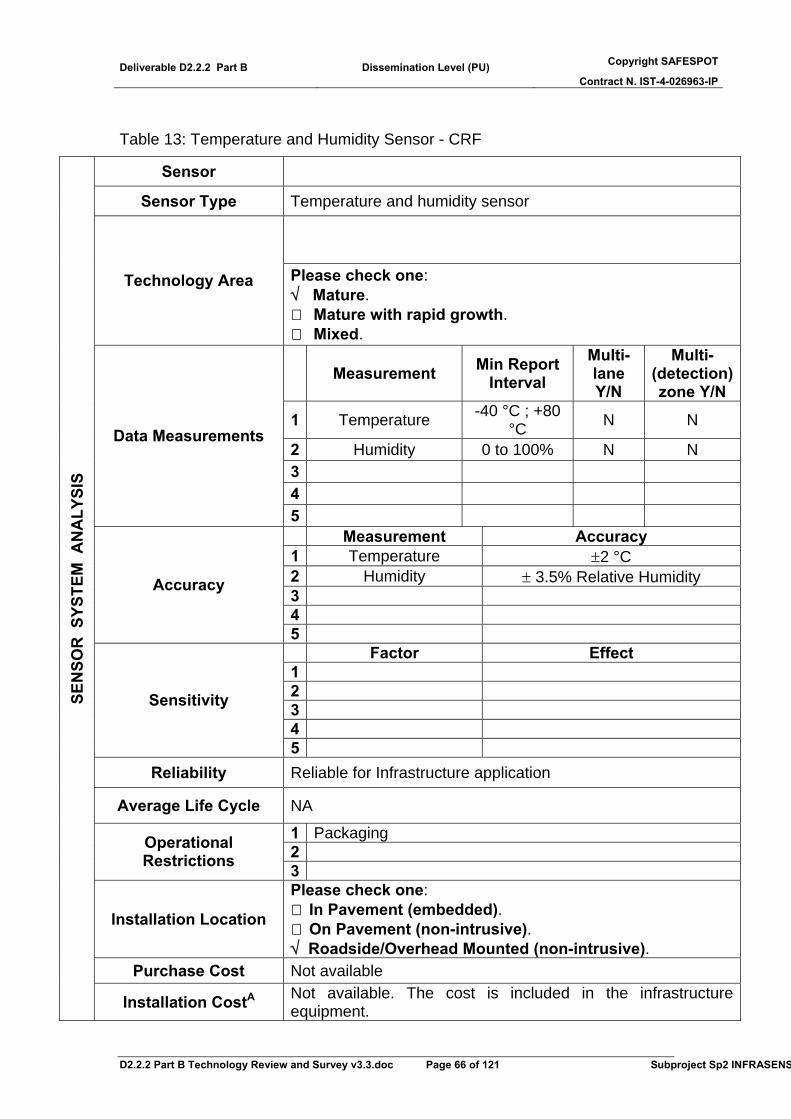
Deliverable D2.2.2 Part B Dissemination Level (PU) Copyright SAFESPOT
Contract N. IST-4-026963-IP
D2.2.2 Part B Technology Review and Survey v3.3.doc Page 66 of 121 Subproject Sp2 INFRASENS
Table 13: Temperature and Humidity Sensor - CRF
Sensor
Sensor Type Temperature and humidity sensor
Technology Area Please check one: √ Mature.
Mature with rapid growth. Mixed.
Measurement Min Report Interval
Multi-lane Y/N
Multi-(detection) zone Y/N
1 Temperature -40 °C ; +80 °C N N
2 Humidity 0 to 100% N N 3 4
Data Measurements
5 Measurement Accuracy
1 Temperature ±2 °C 2 Humidity ± 3.5% Relative Humidity 3 4
Accuracy
5 Factor Effect 1 2 3 4
Sensitivity
5 Reliability Reliable for Infrastructure application
Average Life Cycle NA
1 Packaging 2 Operational
Restrictions 3
Installation Location
Please check one: In Pavement (embedded). On Pavement (non-intrusive).
√ Roadside/Overhead Mounted (non-intrusive). Purchase Cost Not available
SEN
SOR
SYS
TEM
AN
ALY
SIS
Installation CostA Not available. The cost is included in the infrastructure equipment.
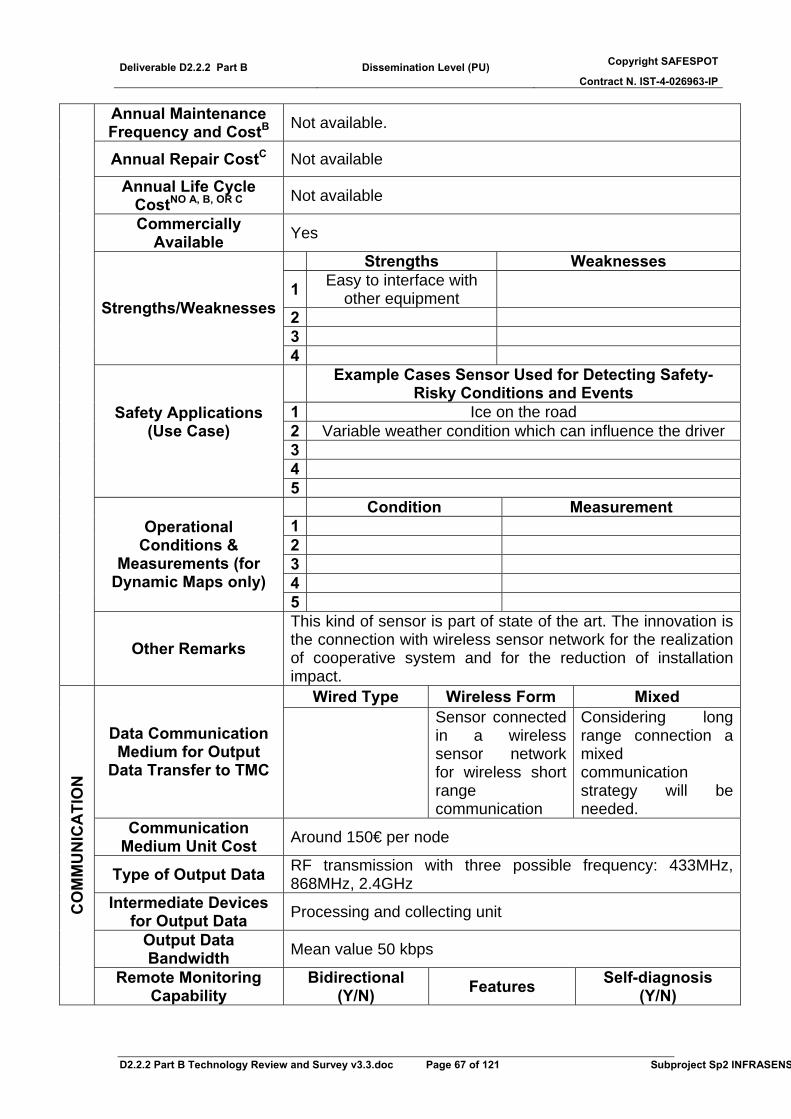
Deliverable D2.2.2 Part B Dissemination Level (PU) Copyright SAFESPOT
Contract N. IST-4-026963-IP
D2.2.2 Part B Technology Review and Survey v3.3.doc Page 67 of 121 Subproject Sp2 INFRASENS
Annual Maintenance Frequency and CostB Not available.
Annual Repair CostC Not available
Annual Life Cycle CostNO A, B, OR C Not available
Commercially Available Yes
Strengths Weaknesses
1 Easy to interface with other equipment
2 3
Strengths/Weaknesses
4
Example Cases Sensor Used for Detecting Safety-Risky Conditions and Events
1 Ice on the road 2 Variable weather condition which can influence the driver 3 4
Safety Applications (Use Case)
5 Condition Measurement
1 2 3 4
Operational Conditions &
Measurements (for Dynamic Maps only)
5
Other Remarks This kind of sensor is part of state of the art. The innovation is the connection with wireless sensor network for the realization of cooperative system and for the reduction of installation impact.
Wired Type Wireless Form Mixed
Data Communication Medium for Output
Data Transfer to TMC
Sensor connected in a wireless sensor network for wireless short range communication
Considering long range connection a mixed communication strategy will be needed.
Communication Medium Unit Cost Around 150€ per node
Type of Output Data RF transmission with three possible frequency: 433MHz, 868MHz, 2.4GHz
Intermediate Devices for Output Data Processing and collecting unit
Output Data Bandwidth Mean value 50 kbps
CO
MM
UN
ICA
TIO
N
Remote Monitoring Capability
Bidirectional (Y/N) Features Self-diagnosis
(Y/N)
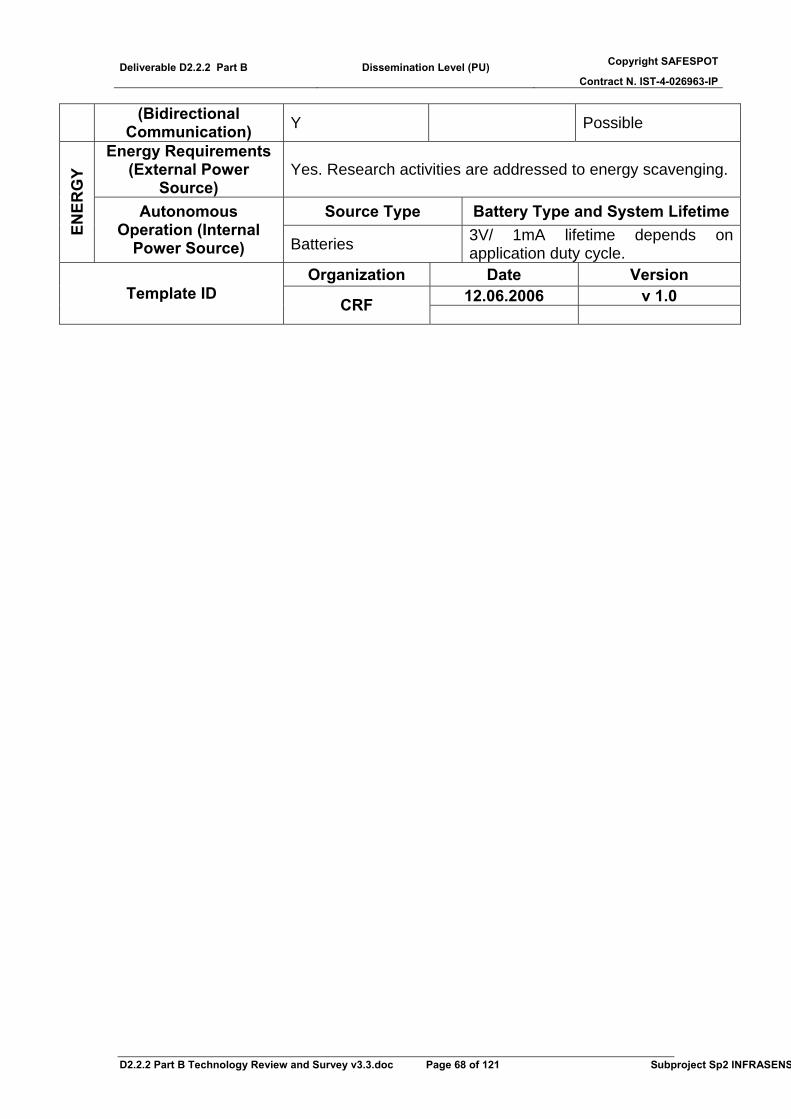
Deliverable D2.2.2 Part B Dissemination Level (PU) Copyright SAFESPOT
Contract N. IST-4-026963-IP
D2.2.2 Part B Technology Review and Survey v3.3.doc Page 68 of 121 Subproject Sp2 INFRASENS
(Bidirectional Communication) Y Possible
Energy Requirements (External Power
Source) Yes. Research activities are addressed to energy scavenging.
Source Type Battery Type and System Lifetime
ENER
GY
Autonomous Operation (Internal
Power Source) Batteries 3V/ 1mA lifetime depends on application duty cycle.
Organization Date Version 12.06.2006 v 1.0 Template ID
CRF

Deliverable D2.2.2 Part B Dissemination Level (PU) Copyright SAFESPOT
Contract N. IST-4-026963-IP
D2.2.2 Part B Technology Review and Survey v3.3.doc Page 69 of 121 Subproject Sp2 INFRASENS
Table 14: Laserscanner – IBEO
Sensor ALASCA
Sensor Type Laserscanner
Technology Area Please check one: Mature.
x Mature with rapid growth. Mixed.
Measurement Min Report Interval
Multi-lane Y/N
Multi-(detection) zone Y/N
1 Object position (Cars, Trucks, Pedestrians, Bikes, PTWs, Obstacles)
40 ms Y Y
2 Object velocity (Cars, Trucks, Pedestrians, Bikes, PTWs, Obstacles)
40 ms Y Y
3 Object classification (Cars, Trucks, Pedestrians, Bikes, PTWs)
40 ms Y Y
4
Data Measurements
5 Measurement Accuracy
1 Object position (Cars, Trucks, Pedestrians, Bikes, PTWs, Obstacles)
+/- 0.1 m
2 Object velocity (Cars, Trucks, Pedestrians, Bikes, PTWs, Obstacles)
+/- 0.5m/s
3 4
Accuracy
5 Factor Effect
1 Detection Range
Pedestrians < 80m, Cars, Trucks < 200m, Obstacles < 100 m (dependent on size, height and mounting position of the sensor)
SEN
SOR
SYS
TEM
AN
ALY
SIS
Sensitivity
2
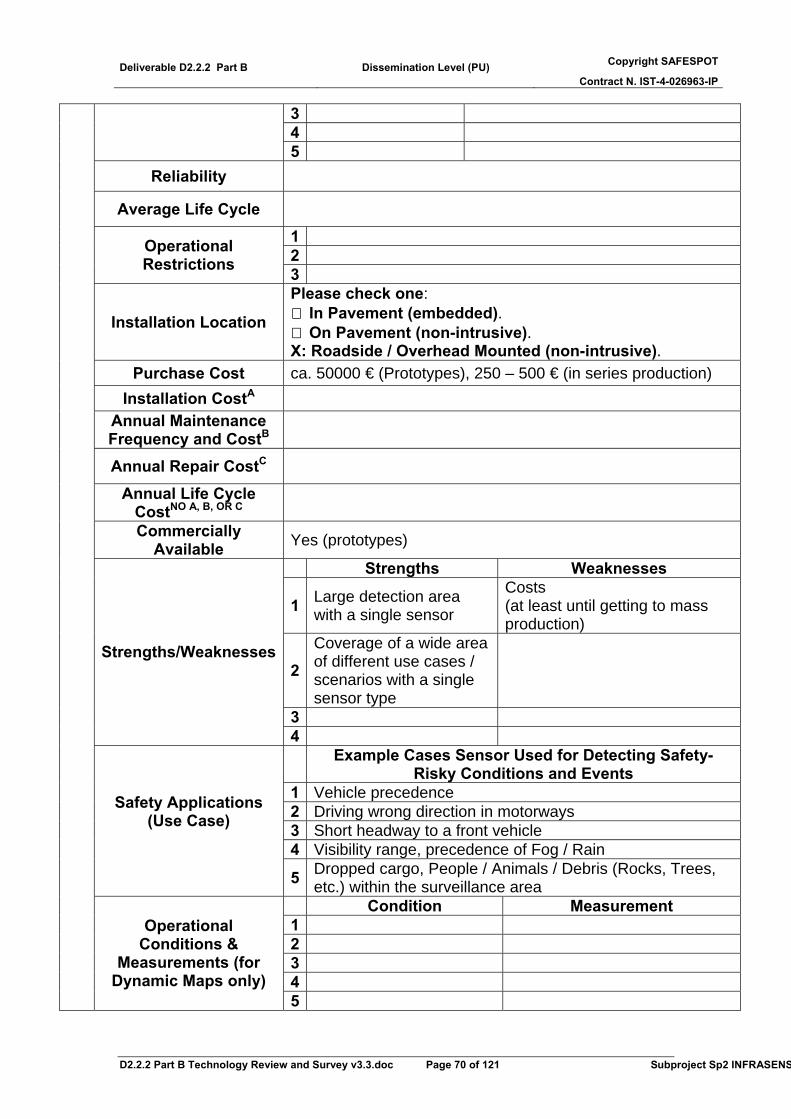
Deliverable D2.2.2 Part B Dissemination Level (PU) Copyright SAFESPOT
Contract N. IST-4-026963-IP
D2.2.2 Part B Technology Review and Survey v3.3.doc Page 70 of 121 Subproject Sp2 INFRASENS
3 4 5
Reliability
Average Life Cycle
1 2 Operational
Restrictions 3
Installation Location
Please check one: In Pavement (embedded). On Pavement (non-intrusive).
X: Roadside / Overhead Mounted (non-intrusive). Purchase Cost ca. 50000 € (Prototypes), 250 – 500 € (in series production)
Installation CostA Annual Maintenance Frequency and CostB
Annual Repair CostC
Annual Life Cycle CostNO A, B, OR C
Commercially Available Yes (prototypes)
Strengths Weaknesses
1 Large detection area with a single sensor
Costs (at least until getting to mass production)
2 Coverage of a wide area of different use cases / scenarios with a single sensor type
3
Strengths/Weaknesses
4
Example Cases Sensor Used for Detecting Safety-Risky Conditions and Events
1 Vehicle precedence 2 Driving wrong direction in motorways 3 Short headway to a front vehicle 4 Visibility range, precedence of Fog / Rain
Safety Applications (Use Case)
5 Dropped cargo, People / Animals / Debris (Rocks, Trees, etc.) within the surveillance area
Condition Measurement 1 2 3 4
Operational Conditions &
Measurements (for Dynamic Maps only)
5
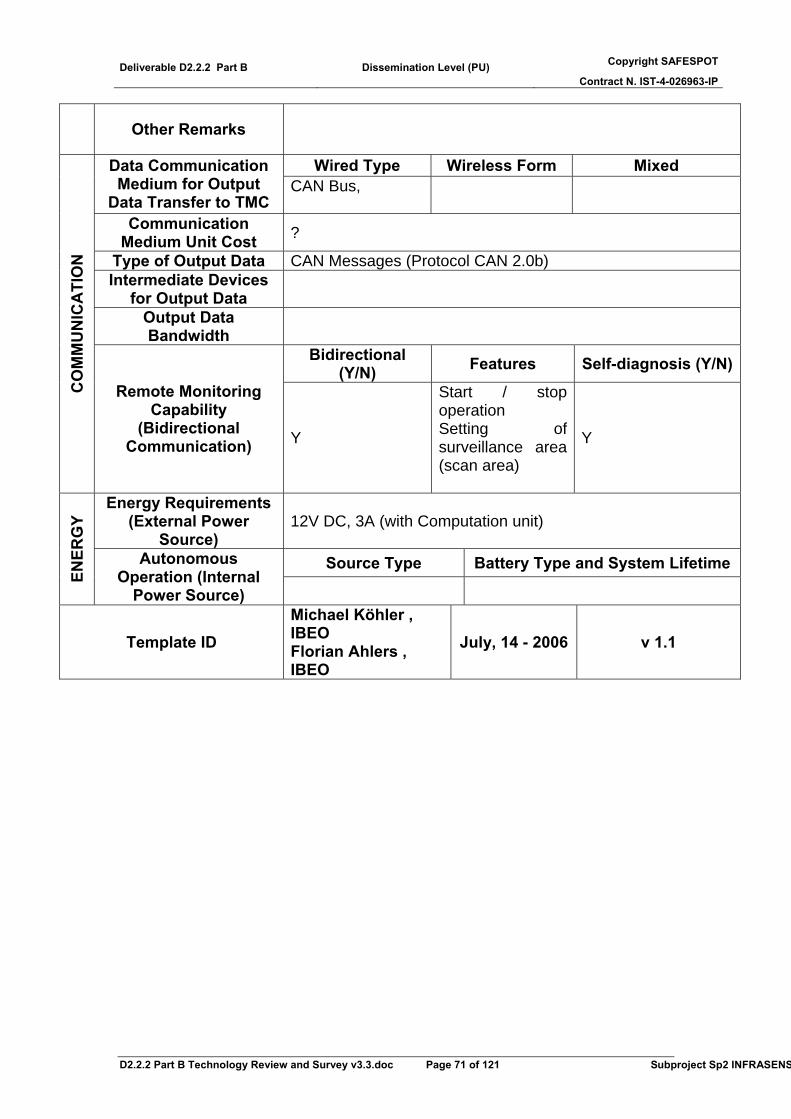
Deliverable D2.2.2 Part B Dissemination Level (PU) Copyright SAFESPOT
Contract N. IST-4-026963-IP
D2.2.2 Part B Technology Review and Survey v3.3.doc Page 71 of 121 Subproject Sp2 INFRASENS
Other Remarks
Wired Type Wireless Form Mixed Data Communication Medium for Output
Data Transfer to TMC CAN Bus,
Communication Medium Unit Cost ?
Type of Output Data CAN Messages (Protocol CAN 2.0b) Intermediate Devices
for Output Data
Output Data Bandwidth
Bidirectional (Y/N) Features Self-diagnosis (Y/N)
CO
MM
UN
ICA
TIO
N
Remote Monitoring Capability
(Bidirectional Communication) Y
Start / stop operation Setting of surveillance area (scan area)
Y
Energy Requirements (External Power
Source) 12V DC, 3A (with Computation unit)
Source Type Battery Type and System Lifetime
ENER
GY
Autonomous Operation (Internal
Power Source)
Template ID Michael Köhler , IBEO Florian Ahlers , IBEO
July, 14 - 2006 v 1.1

Deliverable D2.2.2 Part B Dissemination Level (PU) Copyright SAFESPOT
Contract N. IST-4-026963-IP
D2.2.2 Part B Technology Review and Survey v3.3.doc Page 72 of 121 Subproject Sp2 INFRASENS
Table 15: Visibility Sensor - LCPC
Sensor Type Environmental Sensor
Video Image Processing
Technology Area Please check one: Mature. Mature with rapid growth.
√ Mixed.
Sensor Visibility Sensor
Measurement Min Report Interval
Multi-lane Y/N
Multi-(detection) zone Y/N
1 Visibility Range (m^-1) Frame rate - -
2 Fog Frame rate - - 3 4
Traffic Data Measurements
5 Measurement Accuracy
1 Visibility Range Depends on camera resolution, distance…
2 Fog To be tested 3 4
Accuracy
5 Factor Effect
1 Sensor position (pitch angle)
If the pitch angle is too strong, the field of view is too restricted
and measurement is not relevant anymore.
2 Heavy traffic Difficult to distinguish the road surface
3 4
Sensitivity
5 Reliability Tests needed
Average Life Cycle ?
1 More relevant information is given by daytime. Night visibility is not clearly defined and is consequently difficult to estimate.
2
SEN
SOR
SYS
TEM
AN
ALY
SIS
Operational Restrictions
3

Deliverable D2.2.2 Part B Dissemination Level (PU) Copyright SAFESPOT
Contract N. IST-4-026963-IP
D2.2.2 Part B Technology Review and Survey v3.3.doc Page 73 of 121 Subproject Sp2 INFRASENS
Installation Location
Please check one: In Pavement (embedded). On Pavement (non-intrusive).
√ Roadside/Overhead Mounted (non-intrusive). Purchase Cost Weatherproof surveillance camera i.e. 100 €
Installation CostA Annual Maintenance Frequency and CostB
Some maintenance is needed, e.g. for cleaning the lenses regularly. (300 € / year)
Annual Repair CostC Annual Life Cycle
CostNO A, B, OR C
Commercially Available No
Strengths Weaknesses
1 Cheaper and easier to
calibrate than a transmissometer
Depends on the quality of the TV camera that are used:
resolution, dynamic…
2 More reliable than a diffusiometer
Depends on the TV camera configuration (e.g. pitch angle)
3
Strengths/Weaknesses
4 Cases Sensor Used for Detecting Safety-Related Risks
1 Fog and Visibility Range 2 3 4
Use Case (Safety Applications)
5 Condition Measurement
1 2 3 4
Operational Conditions &
Measurements (for Dynamic Maps only)
5
Other Remarks
Wire Type Wireless Form Mixed Data Communication Medium for Output
Data Transfer to TMC
Communication Medium Unit Cost
Type of Output Data Intermediate Devices
for Output Data
CO
MM
UN
ICA
TIO
N
Output Data Bandwidth Frame rate (e.g. 25 Hz)
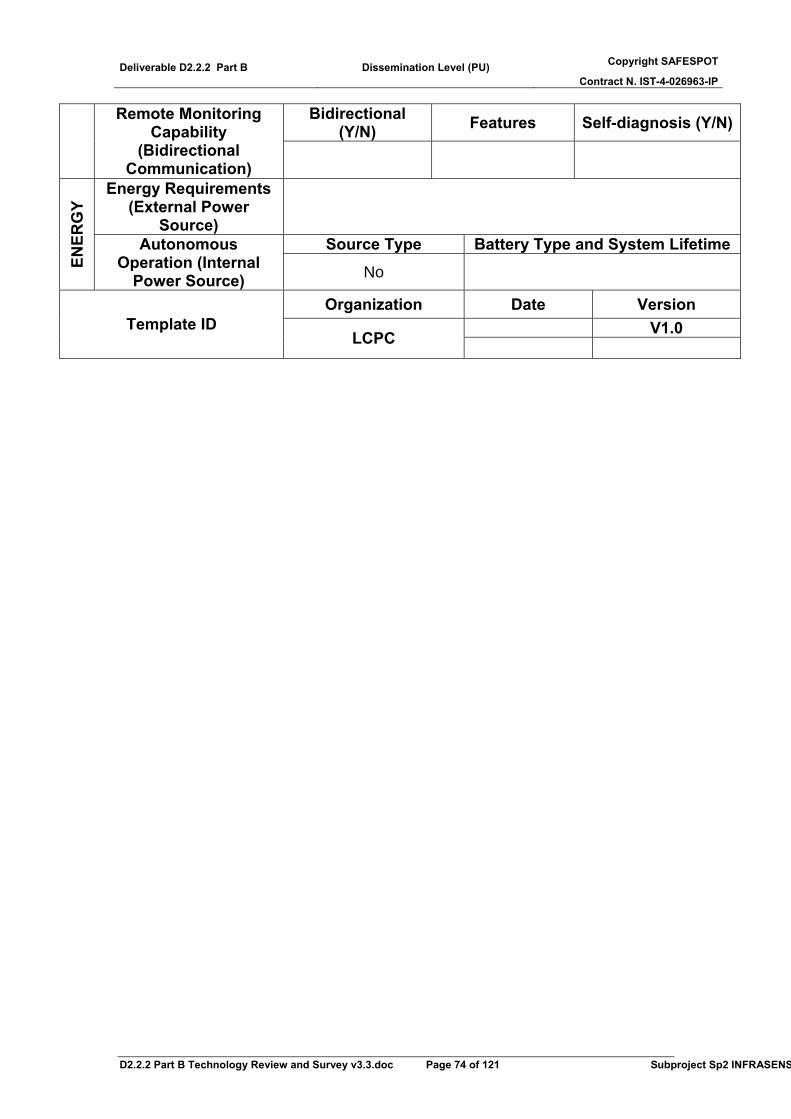
Deliverable D2.2.2 Part B Dissemination Level (PU) Copyright SAFESPOT
Contract N. IST-4-026963-IP
D2.2.2 Part B Technology Review and Survey v3.3.doc Page 74 of 121 Subproject Sp2 INFRASENS
Bidirectional (Y/N) Features Self-diagnosis (Y/N)Remote Monitoring
Capability (Bidirectional
Communication)
Energy Requirements (External Power
Source)
Source Type Battery Type and System Lifetime
ENER
GY
Autonomous Operation (Internal
Power Source) No
Organization Date Version V1.0 Template ID
LCPC
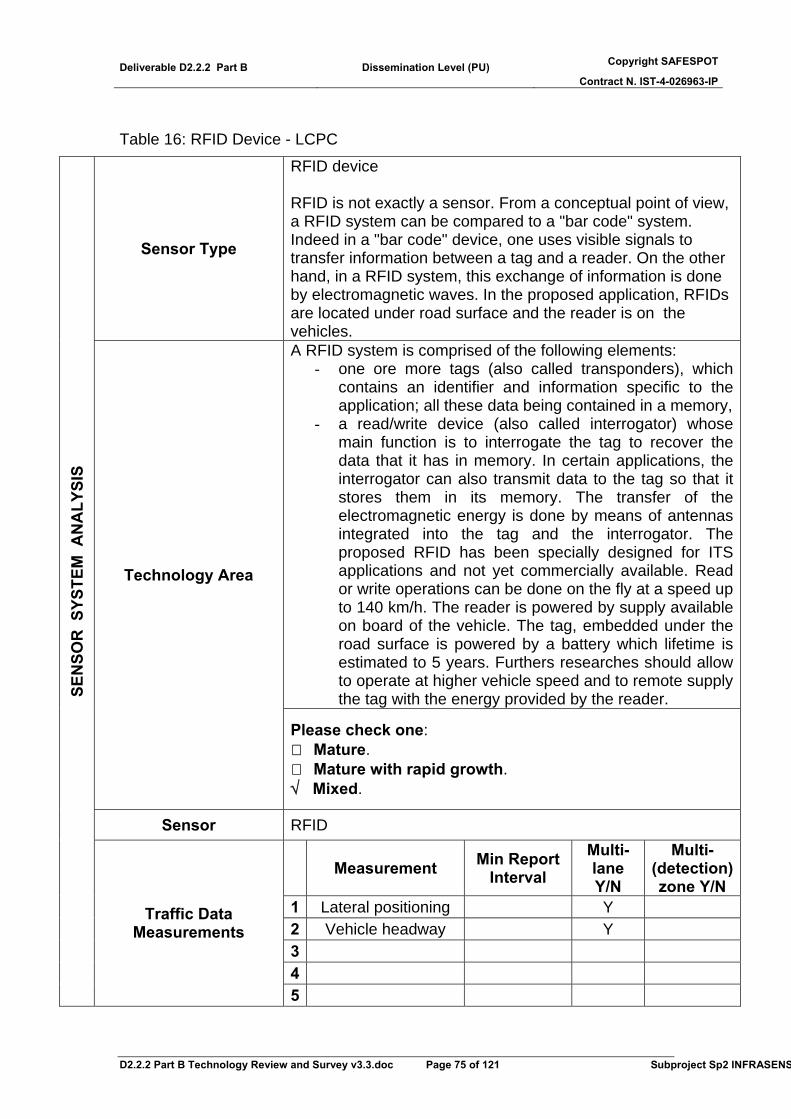
Deliverable D2.2.2 Part B Dissemination Level (PU) Copyright SAFESPOT
Contract N. IST-4-026963-IP
D2.2.2 Part B Technology Review and Survey v3.3.doc Page 75 of 121 Subproject Sp2 INFRASENS
Table 16: RFID Device - LCPC
Sensor Type
RFID device RFID is not exactly a sensor. From a conceptual point of view, a RFID system can be compared to a "bar code" system. Indeed in a "bar code" device, one uses visible signals to transfer information between a tag and a reader. On the other hand, in a RFID system, this exchange of information is done by electromagnetic waves. In the proposed application, RFIDs are located under road surface and the reader is on the vehicles. A RFID system is comprised of the following elements:
- one ore more tags (also called transponders), which contains an identifier and information specific to the application; all these data being contained in a memory,
- a read/write device (also called interrogator) whose main function is to interrogate the tag to recover the data that it has in memory. In certain applications, the interrogator can also transmit data to the tag so that it stores them in its memory. The transfer of the electromagnetic energy is done by means of antennas integrated into the tag and the interrogator. The proposed RFID has been specially designed for ITS applications and not yet commercially available. Read or write operations can be done on the fly at a speed up to 140 km/h. The reader is powered by supply available on board of the vehicle. The tag, embedded under the road surface is powered by a battery which lifetime is estimated to 5 years. Furthers researches should allow to operate at higher vehicle speed and to remote supply the tag with the energy provided by the reader.
Technology Area
Please check one: Mature. Mature with rapid growth.
√ Mixed.
Sensor RFID
Measurement Min Report Interval
Multi-lane Y/N
Multi-(detection) zone Y/N
1 Lateral positioning Y 2 Vehicle headway Y 3 4
SEN
SOR
SYS
TEM
AN
ALY
SIS
Traffic Data Measurements
5

Deliverable D2.2.2 Part B Dissemination Level (PU) Copyright SAFESPOT
Contract N. IST-4-026963-IP
D2.2.2 Part B Technology Review and Survey v3.3.doc Page 76 of 121 Subproject Sp2 INFRASENS
Measurement Accuracy 1 Lateral positioning 20 cm
2 Vehicle headway
Accuracy depends on clock synchronisation between vehicles, clock resolution Actual accuracy has not yet been estimated, but
0,001 sec. is expected. However, the method is efficient for short headways; conversely, for long headways, the probability of a
vehicle insertion ahead, becomes too important dealing to wrong
estimation. 3 4
Accuracy
5 Factor Effect 1 2 3 4
Sensitivity
5 Reliability To be tested
Average Life Cycle
1 Distance between tag and reader's antenna must be lower than 30 cm (when operating at speeds up to 140 km/h).
2 Operational Restrictions
3
Installation Location
Please check one: √ In Pavement (embedded).
On Pavement (non-intrusive). Roadside/Overhead Mounted (non-intrusive).
Purchase Cost 400 €/tag. Price should decrease depending on quantity.
Installation CostA
1) Installation of tag during road construction or on road under repair : to be evaluated 2) Installation of reader (and its antenna) on vehicle: estimated to 250 €. Price should decrease depending on quantity.
Annual Maintenance Frequency and CostB
Information stored inside the tag should be updated each time significant changes occurs on road characteristics.
Annual Repair CostC Annual Life Cycle
CostNO A, B, OR C
Commercially Available No
Strengths Weaknesses 1 2
Strengths/Weaknesses
3
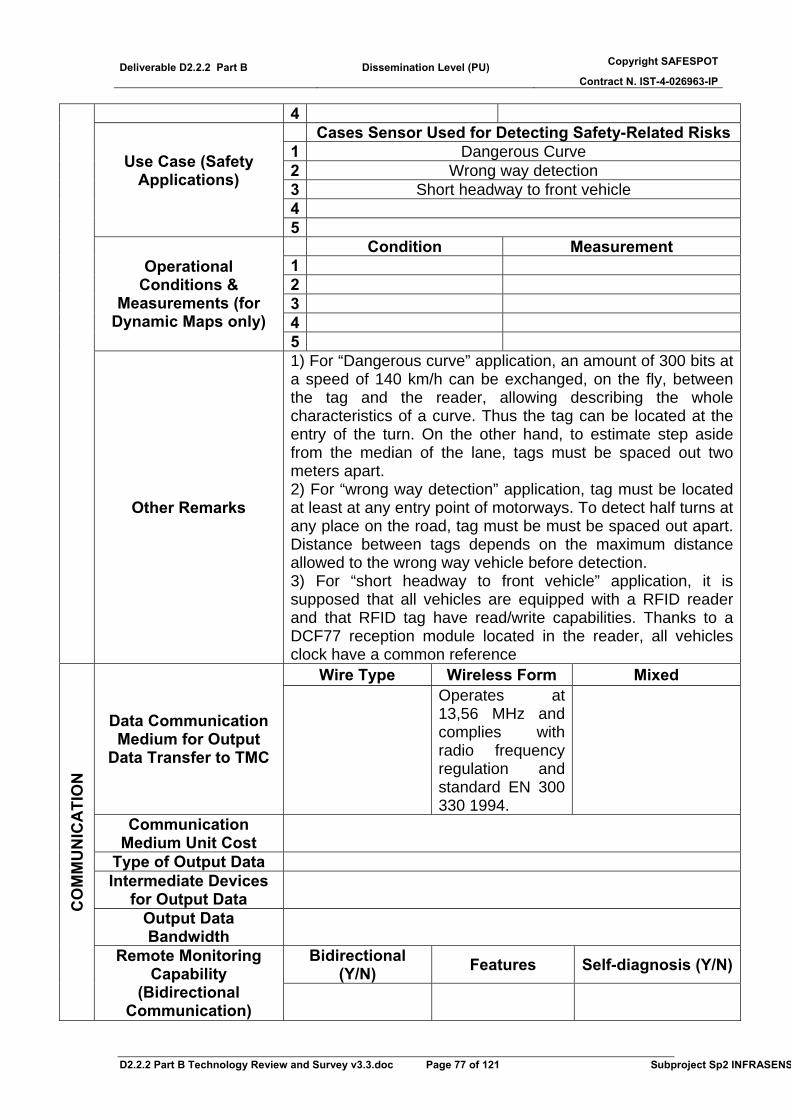
Deliverable D2.2.2 Part B Dissemination Level (PU) Copyright SAFESPOT
Contract N. IST-4-026963-IP
D2.2.2 Part B Technology Review and Survey v3.3.doc Page 77 of 121 Subproject Sp2 INFRASENS
4 Cases Sensor Used for Detecting Safety-Related Risks
1 Dangerous Curve 2 Wrong way detection 3 Short headway to front vehicle 4
Use Case (Safety Applications)
5 Condition Measurement
1 2 3 4
Operational Conditions &
Measurements (for Dynamic Maps only)
5
Other Remarks
1) For “Dangerous curve” application, an amount of 300 bits at a speed of 140 km/h can be exchanged, on the fly, between the tag and the reader, allowing describing the whole characteristics of a curve. Thus the tag can be located at the entry of the turn. On the other hand, to estimate step aside from the median of the lane, tags must be spaced out two meters apart. 2) For “wrong way detection” application, tag must be located at least at any entry point of motorways. To detect half turns at any place on the road, tag must be must be spaced out apart. Distance between tags depends on the maximum distance allowed to the wrong way vehicle before detection. 3) For “short headway to front vehicle” application, it is supposed that all vehicles are equipped with a RFID reader and that RFID tag have read/write capabilities. Thanks to a DCF77 reception module located in the reader, all vehicles clock have a common reference
Wire Type Wireless Form Mixed
Data Communication Medium for Output
Data Transfer to TMC
Operates at 13,56 MHz and complies with radio frequency regulation and standard EN 300 330 1994.
Communication Medium Unit Cost
Type of Output Data Intermediate Devices
for Output Data
Output Data Bandwidth
Bidirectional (Y/N) Features Self-diagnosis (Y/N)
CO
MM
UN
ICA
TIO
N
Remote Monitoring Capability
(Bidirectional Communication)
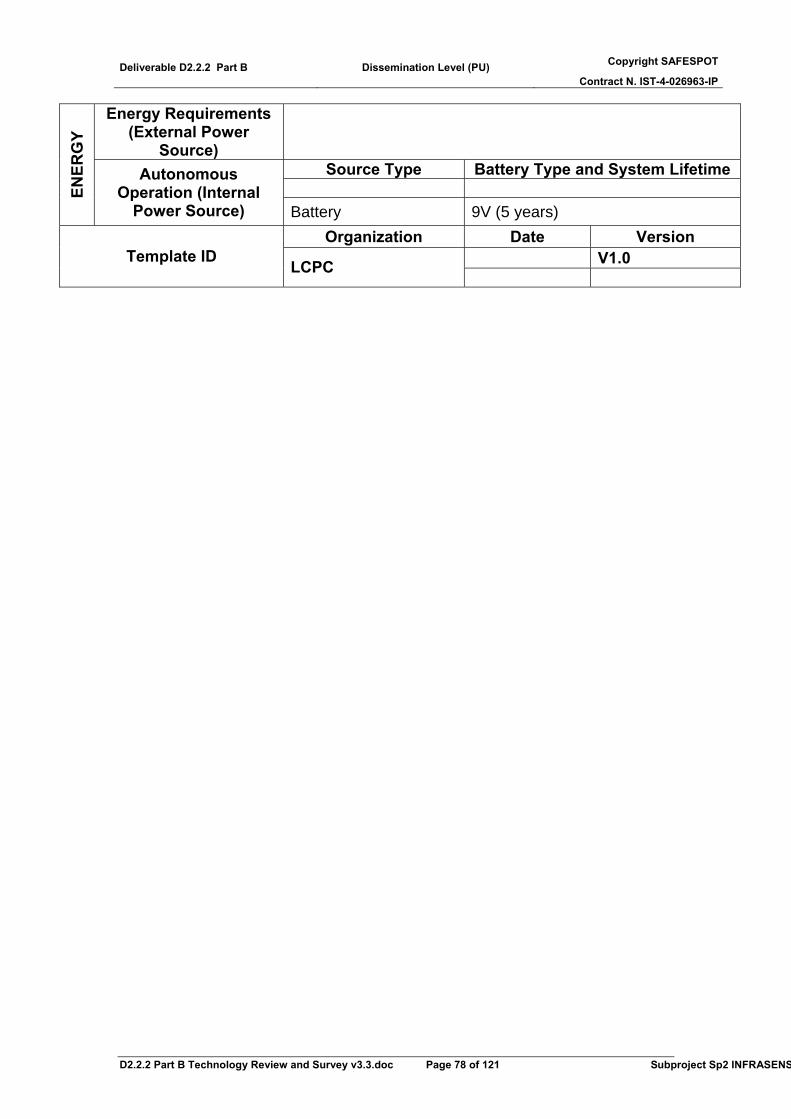
Deliverable D2.2.2 Part B Dissemination Level (PU) Copyright SAFESPOT
Contract N. IST-4-026963-IP
D2.2.2 Part B Technology Review and Survey v3.3.doc Page 78 of 121 Subproject Sp2 INFRASENS
Energy Requirements (External Power
Source)
Source Type Battery Type and System Lifetime EN
ERG
Y
Autonomous Operation (Internal
Power Source) Battery 9V (5 years) Organization Date Version
V1.0 Template ID LCPC
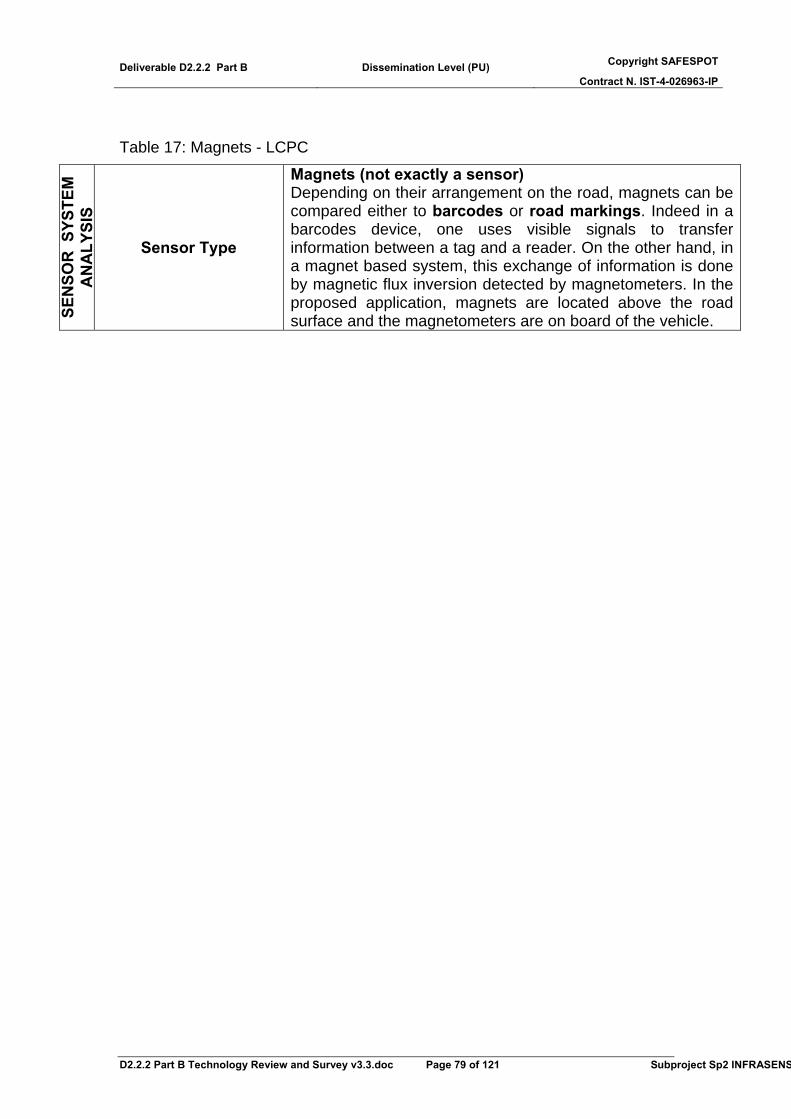
Deliverable D2.2.2 Part B Dissemination Level (PU) Copyright SAFESPOT
Contract N. IST-4-026963-IP
D2.2.2 Part B Technology Review and Survey v3.3.doc Page 79 of 121 Subproject Sp2 INFRASENS
Table 17: Magnets - LCPC
SEN
SOR
SYS
TEM
A
NA
LYSI
S
Sensor Type
Magnets (not exactly a sensor) Depending on their arrangement on the road, magnets can be compared either to barcodes or road markings. Indeed in a barcodes device, one uses visible signals to transfer information between a tag and a reader. On the other hand, in a magnet based system, this exchange of information is done by magnetic flux inversion detected by magnetometers. In the proposed application, magnets are located above the road surface and the magnetometers are on board of the vehicle.
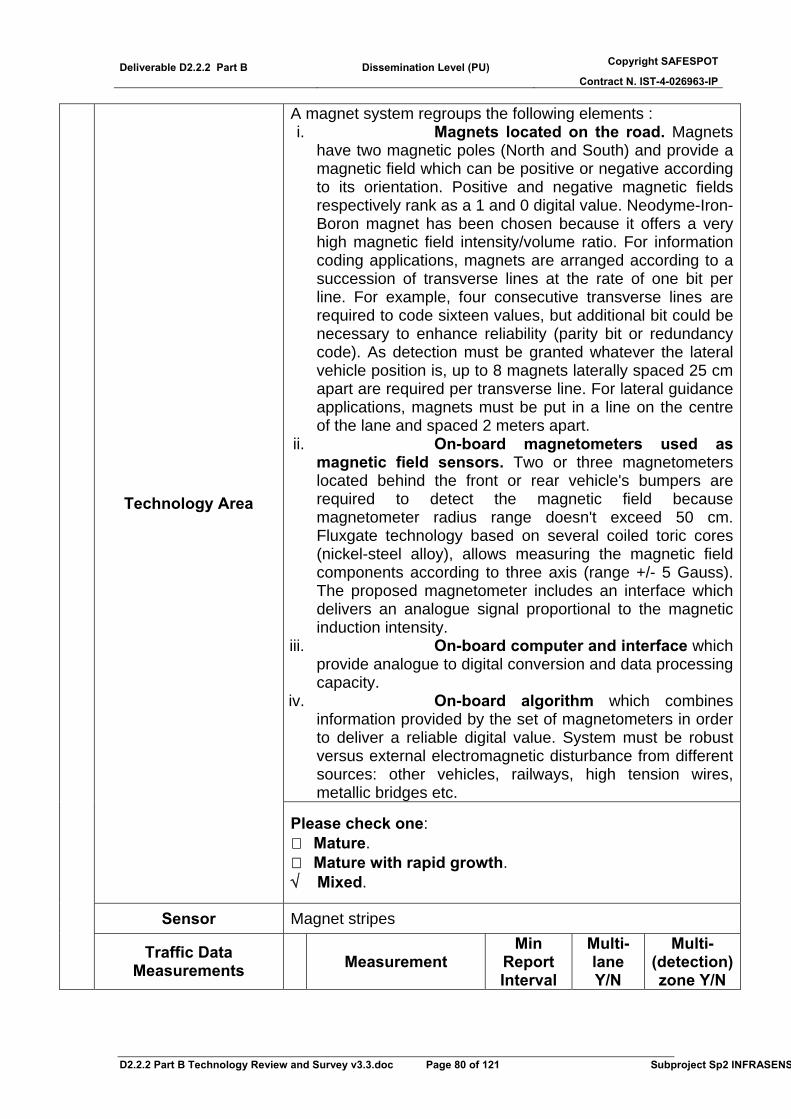
Deliverable D2.2.2 Part B Dissemination Level (PU) Copyright SAFESPOT
Contract N. IST-4-026963-IP
D2.2.2 Part B Technology Review and Survey v3.3.doc Page 80 of 121 Subproject Sp2 INFRASENS
A magnet system regroups the following elements : i. Magnets located on the road. Magnets
have two magnetic poles (North and South) and provide a magnetic field which can be positive or negative according to its orientation. Positive and negative magnetic fields respectively rank as a 1 and 0 digital value. Neodyme-Iron-Boron magnet has been chosen because it offers a very high magnetic field intensity/volume ratio. For information coding applications, magnets are arranged according to a succession of transverse lines at the rate of one bit per line. For example, four consecutive transverse lines are required to code sixteen values, but additional bit could be necessary to enhance reliability (parity bit or redundancy code). As detection must be granted whatever the lateral vehicle position is, up to 8 magnets laterally spaced 25 cm apart are required per transverse line. For lateral guidance applications, magnets must be put in a line on the centre of the lane and spaced 2 meters apart.
ii. On-board magnetometers used as magnetic field sensors. Two or three magnetometers located behind the front or rear vehicle's bumpers are required to detect the magnetic field because magnetometer radius range doesn't exceed 50 cm. Fluxgate technology based on several coiled toric cores (nickel-steel alloy), allows measuring the magnetic field components according to three axis (range +/- 5 Gauss). The proposed magnetometer includes an interface which delivers an analogue signal proportional to the magnetic induction intensity.
iii. On-board computer and interface which provide analogue to digital conversion and data processing capacity.
iv. On-board algorithm which combines information provided by the set of magnetometers in order to deliver a reliable digital value. System must be robust versus external electromagnetic disturbance from different sources: other vehicles, railways, high tension wires, metallic bridges etc.
Technology Area
Please check one: Mature. Mature with rapid growth.
√ Mixed.
Sensor Magnet stripes
Traffic Data Measurements Measurement
Min Report Interval
Multi-lane Y/N
Multi-(detection) zone Y/N
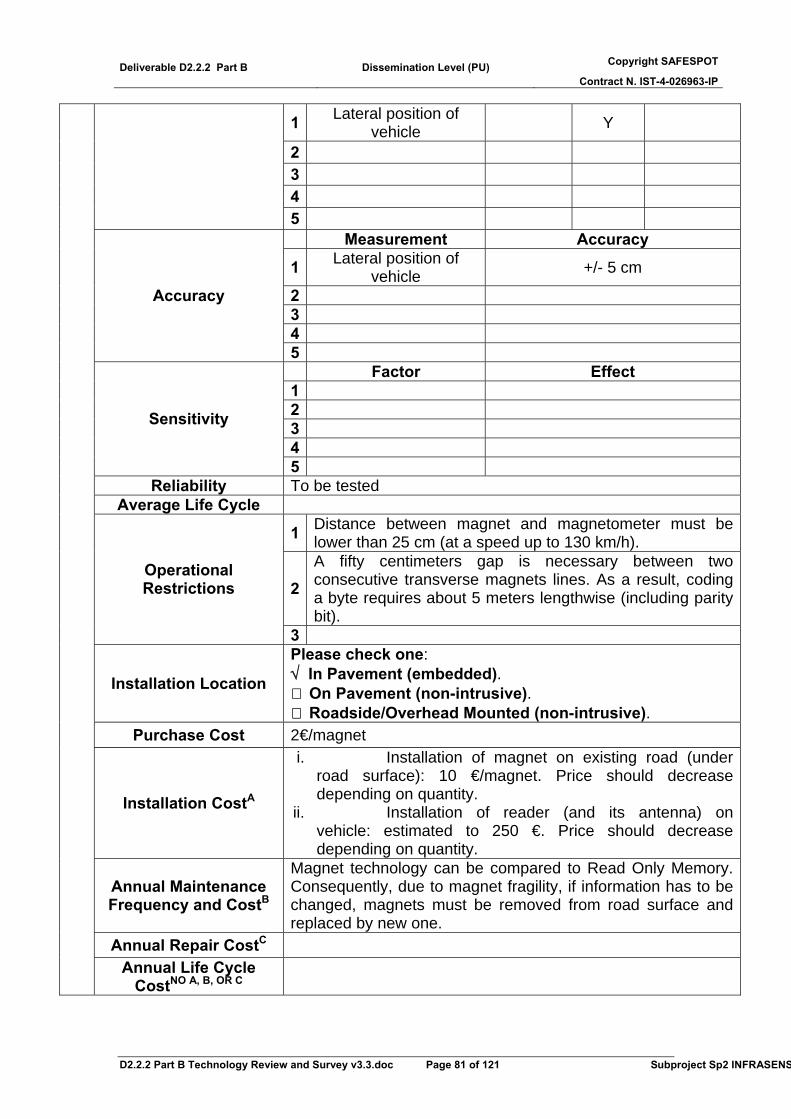
Deliverable D2.2.2 Part B Dissemination Level (PU) Copyright SAFESPOT
Contract N. IST-4-026963-IP
D2.2.2 Part B Technology Review and Survey v3.3.doc Page 81 of 121 Subproject Sp2 INFRASENS
1 Lateral position of vehicle Y
2 3 4 5 Measurement Accuracy
1 Lateral position of vehicle +/- 5 cm
2 3 4
Accuracy
5 Factor Effect 1 2 3 4
Sensitivity
5 Reliability To be tested
Average Life Cycle
1 Distance between magnet and magnetometer must be lower than 25 cm (at a speed up to 130 km/h).
2 A fifty centimeters gap is necessary between two consecutive transverse magnets lines. As a result, coding a byte requires about 5 meters lengthwise (including parity bit).
Operational Restrictions
3
Installation Location
Please check one: √ In Pavement (embedded).
On Pavement (non-intrusive). Roadside/Overhead Mounted (non-intrusive).
Purchase Cost 2€/magnet
Installation CostA
i. Installation of magnet on existing road (under road surface): 10 €/magnet. Price should decrease depending on quantity.
ii. Installation of reader (and its antenna) on vehicle: estimated to 250 €. Price should decrease depending on quantity.
Annual Maintenance Frequency and CostB
Magnet technology can be compared to Read Only Memory. Consequently, due to magnet fragility, if information has to be changed, magnets must be removed from road surface and replaced by new one.
Annual Repair CostC Annual Life Cycle
CostNO A, B, OR C

Deliverable D2.2.2 Part B Dissemination Level (PU) Copyright SAFESPOT
Contract N. IST-4-026963-IP
D2.2.2 Part B Technology Review and Survey v3.3.doc Page 82 of 121 Subproject Sp2 INFRASENS
Commercially Available No
Strengths Weaknesses 1 2 3
Strengths/Weaknesses
4 Cases Sensor Used for Detecting Safety-Related Risks
1 Dangerous Curve 2 Wrong way detection 3 4
Use Case (Safety Applications)
5 Condition Measurement
1 2 3 4
Operational Conditions &
Measurements (for Dynamic Maps only)
5
Other Remarks
Wire Type Wireless Form Mixed Data Communication Medium for Output
Data Transfer to TMC
Communication Medium Unit Cost
Type of Output Data Intermediate Devices
for Output Data
Output Data Bandwidth
Bidirectional (Y/N) Features Self-diagnosis (Y/N)
CO
MM
UN
ICA
TIO
N
Remote Monitoring Capability
(Bidirectional Communication)
Energy Requirements (External Power
Source) No
Source Type Battery Type and System Lifetime
ENER
GY
Autonomous Operation (Internal
Power Source)
Organization Date Version V1.0 Template ID LCPC
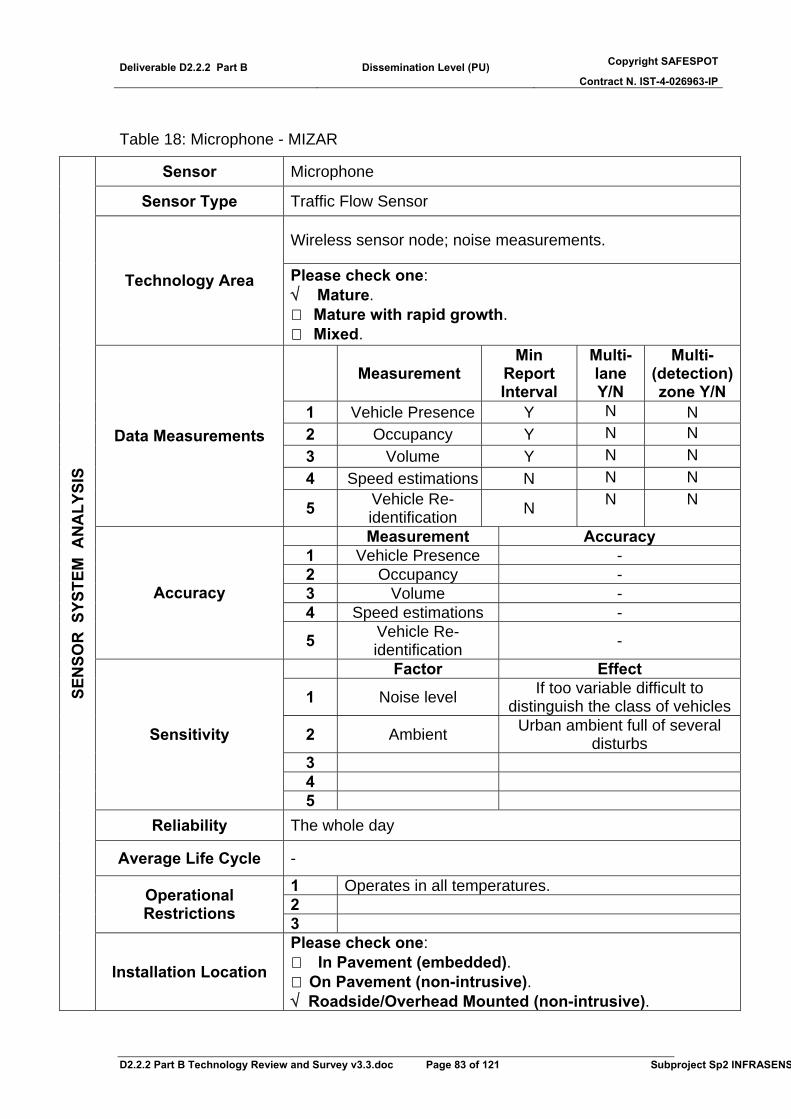
Deliverable D2.2.2 Part B Dissemination Level (PU) Copyright SAFESPOT
Contract N. IST-4-026963-IP
D2.2.2 Part B Technology Review and Survey v3.3.doc Page 83 of 121 Subproject Sp2 INFRASENS
Table 18: Microphone - MIZAR
Sensor Microphone
Sensor Type Traffic Flow Sensor
Wireless sensor node; noise measurements.
Technology Area Please check one: √ Mature.
Mature with rapid growth. Mixed.
Measurement Min
Report Interval
Multi-lane Y/N
Multi-(detection) zone Y/N
1 Vehicle Presence Y N N 2 Occupancy Y N N 3 Volume Y N N 4 Speed estimations N N N
Data Measurements
5 Vehicle Re-identification N N N
Measurement Accuracy 1 Vehicle Presence - 2 Occupancy - 3 Volume - 4 Speed estimations -
Accuracy
5 Vehicle Re-identification -
Factor Effect
1 Noise level If too variable difficult to distinguish the class of vehicles
2 Ambient Urban ambient full of several disturbs
3 4
Sensitivity
5 Reliability The whole day
Average Life Cycle -
1 Operates in all temperatures. 2 Operational
Restrictions 3
SEN
SOR
SYS
TEM
AN
ALY
SIS
Installation Location
Please check one: In Pavement (embedded). On Pavement (non-intrusive).
√ Roadside/Overhead Mounted (non-intrusive).

Deliverable D2.2.2 Part B Dissemination Level (PU) Copyright SAFESPOT
Contract N. IST-4-026963-IP
D2.2.2 Part B Technology Review and Survey v3.3.doc Page 84 of 121 Subproject Sp2 INFRASENS
Purchase Cost Very low Installation CostA Low
Annual Maintenance Frequency and CostB It depends on battery duration
Annual Repair CostC -
Annual Life Cycle CostNO A, B, OR C -
Commercially Available No
Strengths Weaknesses
1 No cost of maintenance
Inability to directly measure speed
2 Wireless application Visiting application
3 Very low consumption Only for quantity measurements
Strengths/Weaknesses
4 Good accuracy for traffic volume and
occupancy
Example Cases Sensor Used for Detecting Safety-Risky Conditions and Events
1 Unstable flow state conditions/stop-and-go traffic 2 Detecting presence 3 Crash 4
Safety Applications (Use Case)
5 Condition Measurement 1 2 3 4
Operational Conditions &
Measurements (for Dynamic Maps only)
5
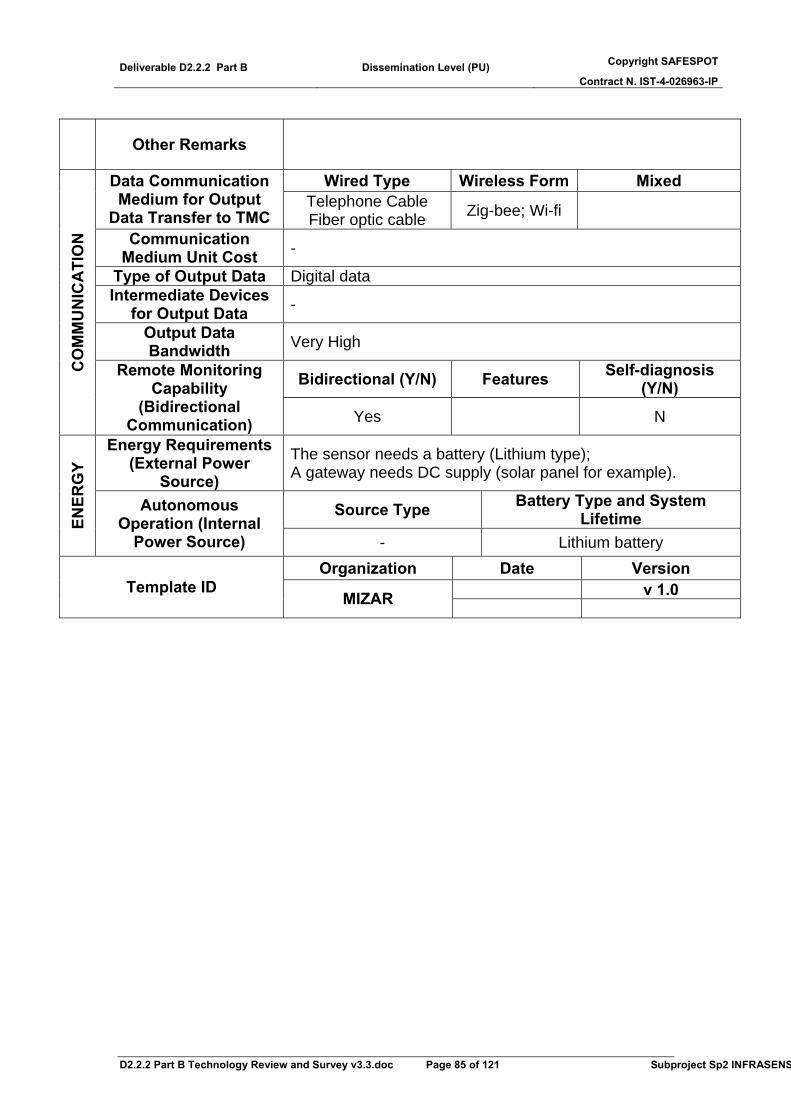
Deliverable D2.2.2 Part B Dissemination Level (PU) Copyright SAFESPOT
Contract N. IST-4-026963-IP
D2.2.2 Part B Technology Review and Survey v3.3.doc Page 85 of 121 Subproject Sp2 INFRASENS
Other Remarks
Wired Type Wireless Form Mixed Data Communication Medium for Output
Data Transfer to TMC Telephone Cable Fiber optic cable Zig-bee; Wi-fi
Communication Medium Unit Cost -
Type of Output Data Digital data Intermediate Devices
for Output Data -
Output Data Bandwidth Very High
Bidirectional (Y/N) Features Self-diagnosis (Y/N)
CO
MM
UN
ICA
TIO
N
Remote Monitoring Capability
(Bidirectional Communication) Yes N
Energy Requirements (External Power
Source) The sensor needs a battery (Lithium type); A gateway needs DC supply (solar panel for example).
Source Type Battery Type and System Lifetime EN
ERG
Y
Autonomous Operation (Internal
Power Source) - Lithium battery Organization Date Version
v 1.0 Template ID MIZAR
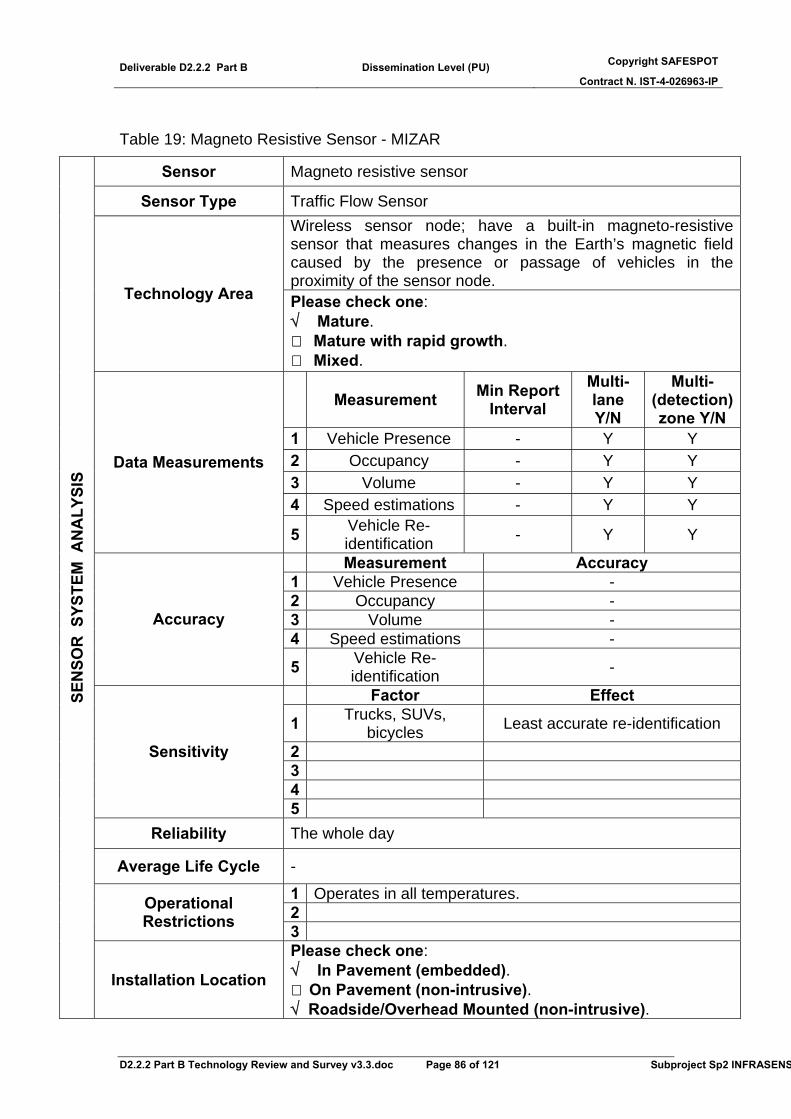
Deliverable D2.2.2 Part B Dissemination Level (PU) Copyright SAFESPOT
Contract N. IST-4-026963-IP
D2.2.2 Part B Technology Review and Survey v3.3.doc Page 86 of 121 Subproject Sp2 INFRASENS
Table 19: Magneto Resistive Sensor - MIZAR
Sensor Magneto resistive sensor
Sensor Type Traffic Flow Sensor Wireless sensor node; have a built-in magneto-resistive sensor that measures changes in the Earth’s magnetic field caused by the presence or passage of vehicles in the proximity of the sensor node.
Technology Area Please check one: √ Mature.
Mature with rapid growth. Mixed.
Measurement Min Report Interval
Multi-lane Y/N
Multi-(detection) zone Y/N
1 Vehicle Presence - Y Y 2 Occupancy - Y Y 3 Volume - Y Y 4 Speed estimations - Y Y
Data Measurements
5 Vehicle Re-identification - Y Y
Measurement Accuracy 1 Vehicle Presence - 2 Occupancy - 3 Volume - 4 Speed estimations -
Accuracy
5 Vehicle Re-identification -
Factor Effect
1 Trucks, SUVs, bicycles Least accurate re-identification
2 3 4
Sensitivity
5 Reliability The whole day
Average Life Cycle -
1 Operates in all temperatures. 2 Operational
Restrictions 3
SEN
SOR
SYS
TEM
AN
ALY
SIS
Installation Location
Please check one: √ In Pavement (embedded).
On Pavement (non-intrusive). √ Roadside/Overhead Mounted (non-intrusive).

Deliverable D2.2.2 Part B Dissemination Level (PU) Copyright SAFESPOT
Contract N. IST-4-026963-IP
D2.2.2 Part B Technology Review and Survey v3.3.doc Page 87 of 121 Subproject Sp2 INFRASENS
Purchase Cost Very low; (less than inductive loop) Installation CostA Low
Annual Maintenance Frequency and CostB It depends on battery duration
Annual Repair CostC
Annual Life Cycle CostNO A, B, OR C
Commercially Available No
Strengths Weaknesses
1 No cost of maintenance Inability to directly measure speed
2 Wireless application Visiting application 3 Very low consumption Strengths/Weaknesses
4 Good accuracy for traffic volume and occupancy
(quite similar to inductive loop)
Example Cases Sensor Used for Detecting Safety-Risky Conditions and Events
1 Unstable flow state conditions/stop-and-go traffic 2 Detecting presence 3 Speed surveillance (Speeding) 4
Safety Applications (Use Case)
5 Condition Measurement
1 2 3 4
Operational Conditions &
Measurements (for Dynamic Maps only)
5
Other Remarks
Wired Type Wireless Form Mixed Data Communication Medium for Output
Data Transfer to TMC Telephone Cable Fiber optic cable Zig-bee; Wi-fi
Communication Medium Unit Cost -
Type of Output Data Digital data Intermediate Devices
for Output Data -
Output Data Bandwidth High C
OM
MU
NIC
ATI
ON
Remote Monitoring Capability
Bidirectional (Y/N) Features Self-diagnosis (Y/N)
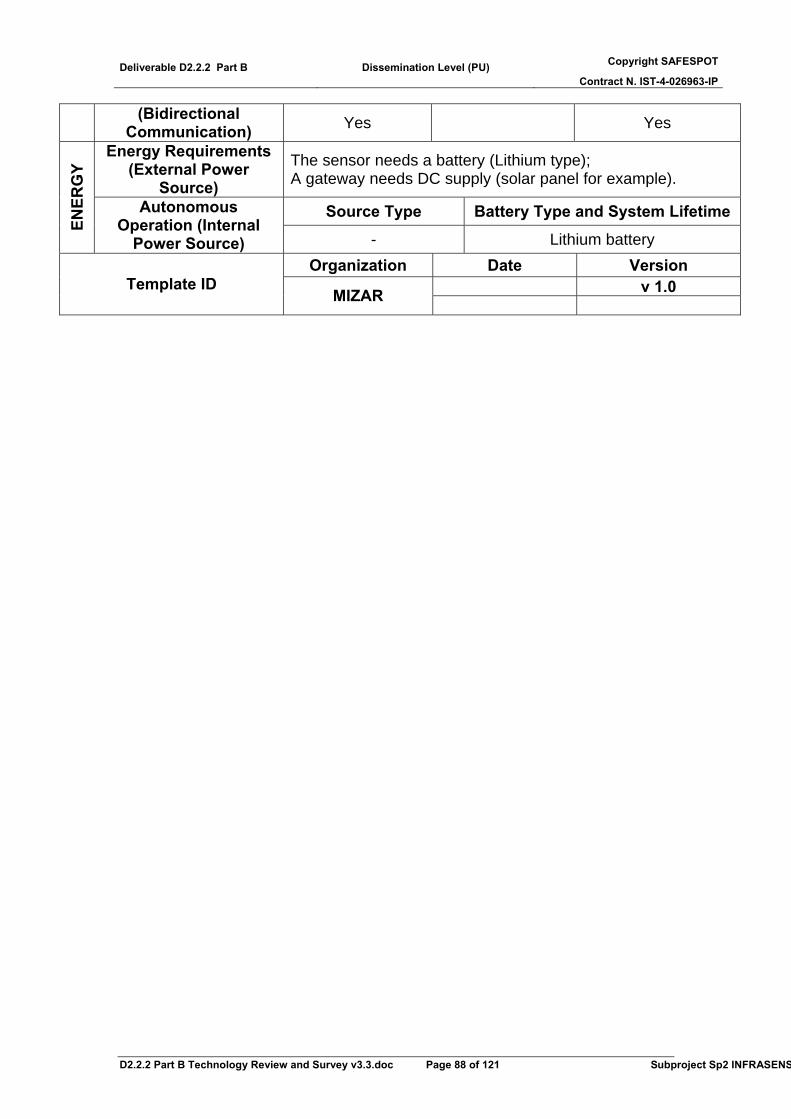
Deliverable D2.2.2 Part B Dissemination Level (PU) Copyright SAFESPOT
Contract N. IST-4-026963-IP
D2.2.2 Part B Technology Review and Survey v3.3.doc Page 88 of 121 Subproject Sp2 INFRASENS
(Bidirectional Communication) Yes Yes
Energy Requirements (External Power
Source) The sensor needs a battery (Lithium type); A gateway needs DC supply (solar panel for example).
Source Type Battery Type and System Lifetime
ENER
GY
Autonomous Operation (Internal
Power Source) - Lithium battery Organization Date Version
v 1.0 Template ID MIZAR
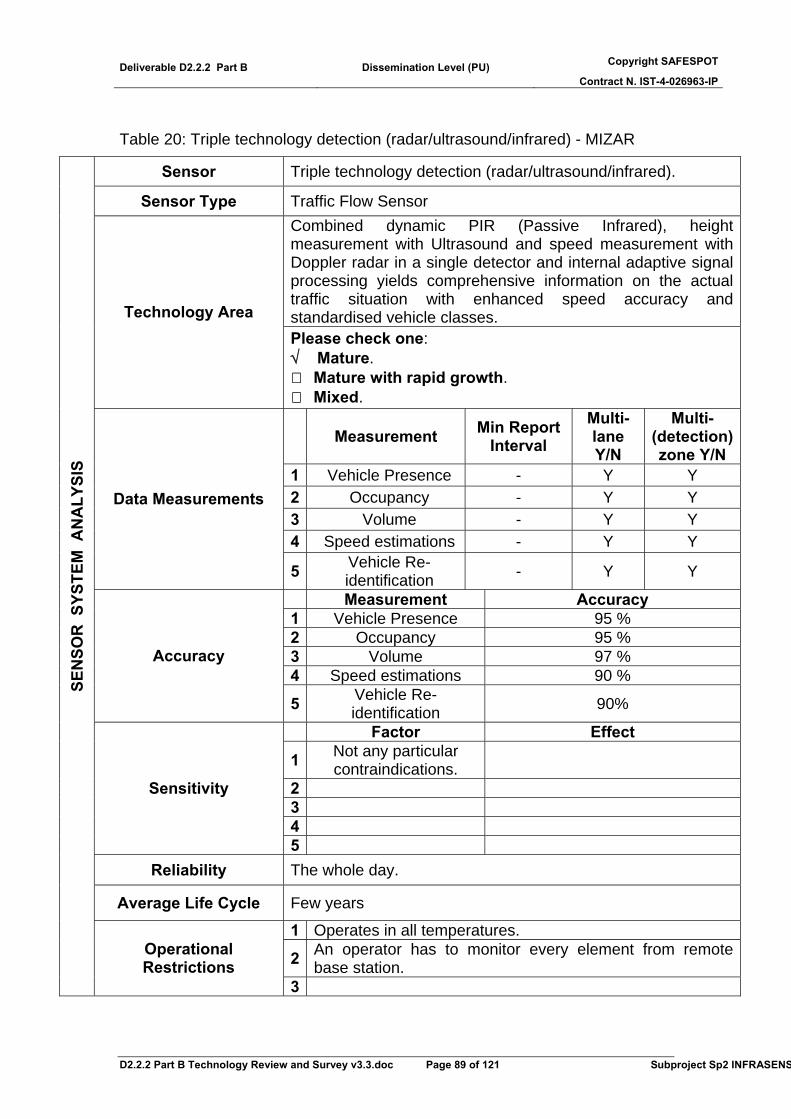
Deliverable D2.2.2 Part B Dissemination Level (PU) Copyright SAFESPOT
Contract N. IST-4-026963-IP
D2.2.2 Part B Technology Review and Survey v3.3.doc Page 89 of 121 Subproject Sp2 INFRASENS
Table 20: Triple technology detection (radar/ultrasound/infrared) - MIZAR
Sensor Triple technology detection (radar/ultrasound/infrared).
Sensor Type Traffic Flow Sensor Combined dynamic PIR (Passive Infrared), height measurement with Ultrasound and speed measurement with Doppler radar in a single detector and internal adaptive signal processing yields comprehensive information on the actual traffic situation with enhanced speed accuracy and standardised vehicle classes. Technology Area Please check one: √ Mature.
Mature with rapid growth. Mixed.
Measurement Min Report Interval
Multi-lane Y/N
Multi-(detection) zone Y/N
1 Vehicle Presence - Y Y 2 Occupancy - Y Y 3 Volume - Y Y 4 Speed estimations - Y Y
Data Measurements
5 Vehicle Re-identification - Y Y
Measurement Accuracy 1 Vehicle Presence 95 % 2 Occupancy 95 % 3 Volume 97 % 4 Speed estimations 90 %
Accuracy
5 Vehicle Re-identification 90%
Factor Effect
1 Not any particular contraindications.
2 3 4
Sensitivity
5 Reliability The whole day.
Average Life Cycle Few years
1 Operates in all temperatures.
2 An operator has to monitor every element from remote base station.
SEN
SOR
SYS
TEM
AN
ALY
SIS
Operational Restrictions
3

Deliverable D2.2.2 Part B Dissemination Level (PU) Copyright SAFESPOT
Contract N. IST-4-026963-IP
D2.2.2 Part B Technology Review and Survey v3.3.doc Page 90 of 121 Subproject Sp2 INFRASENS
Installation Location
Please check one: In Pavement (embedded). On Pavement (non-intrusive).
√ Roadside/Overhead Mounted (non-intrusive). Purchase Cost 1000 per element; it needs a support to overhead mount on.
Installation CostA Annual Maintenance Frequency and CostB Around 10% of the installation and capital cost
Annual Repair CostC
Annual Life Cycle CostNO A, B, OR C
Commercially Available Yes
Strengths Weaknesses
1 Well-understood technology
Very expensive and high installation cost
2 Large experience base 3 Insensitive to weather
Strengths/Weaknesses
4 Best accuracy for traffic volume and occupancy
Example Cases Sensor Used for Detecting Safety-Risky Conditions and Events
1 Detecting presence 2 Speed surveillance (Speeding) 3 Vehicle identification 4
Safety Applications (Use Case)
5 Condition Measurement
1 2 3 4
Operational Conditions &
Measurements (for Dynamic Maps only)
5
Other Remarks
Wired Type Wireless Form Mixed Data Communication Medium for Output
Data Transfer to TMC Telephone Cable
Fiber optic cable
Communication Medium Unit Cost
Fiber Optic Cable: 200.000 euros (purchase and installation) per km.
Type of Output Data Digital data Intermediate Devices
for Output Data Controller cabinet (intermediate data collection unit)
CO
MM
UN
ICA
TIO
N
Output Data Bandwidth Medium

Deliverable D2.2.2 Part B Dissemination Level (PU) Copyright SAFESPOT
Contract N. IST-4-026963-IP
D2.2.2 Part B Technology Review and Survey v3.3.doc Page 91 of 121 Subproject Sp2 INFRASENS
Bidirectional (Y/N) Features Self-diagnosis (Y/N)Remote Monitoring
Capability (Bidirectional
Communication) No No
Energy Requirements (External Power
Source) A controller cabinet is powered by 50 Amp, 120/240 Volt, single phase service.
Source Type Battery Type and System Lifetime
ENER
GY
Autonomous Operation (Internal
Power Source) No Organization Date Version
v 1.0 Template ID MIZAR
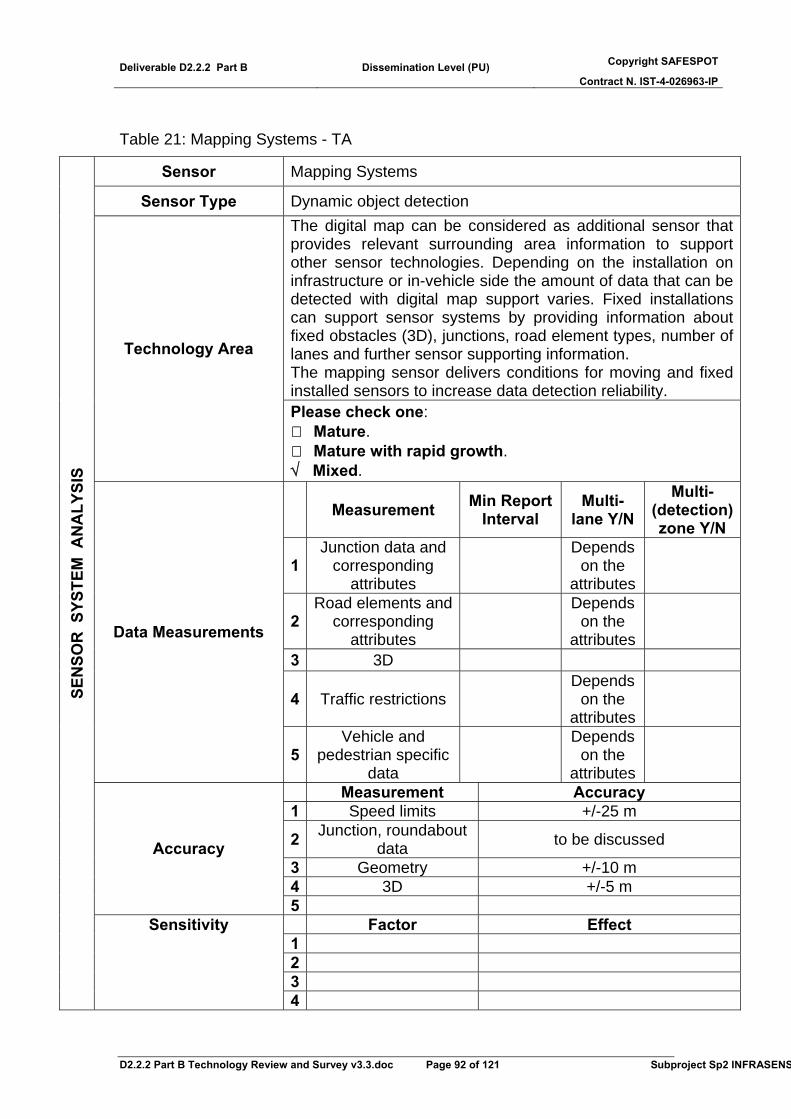
Deliverable D2.2.2 Part B Dissemination Level (PU) Copyright SAFESPOT
Contract N. IST-4-026963-IP
D2.2.2 Part B Technology Review and Survey v3.3.doc Page 92 of 121 Subproject Sp2 INFRASENS
Table 21: Mapping Systems - TA
Sensor Mapping Systems
Sensor Type Dynamic object detection The digital map can be considered as additional sensor that provides relevant surrounding area information to support other sensor technologies. Depending on the installation on infrastructure or in-vehicle side the amount of data that can be detected with digital map support varies. Fixed installations can support sensor systems by providing information about fixed obstacles (3D), junctions, road element types, number of lanes and further sensor supporting information. The mapping sensor delivers conditions for moving and fixed installed sensors to increase data detection reliability.
Technology Area
Please check one: Mature. Mature with rapid growth.
√ Mixed.
Measurement Min Report Interval
Multi-lane Y/N
Multi-(detection) zone Y/N
1 Junction data and
corresponding attributes
Depends
on the attributes
2 Road elements and
corresponding attributes
Depends
on the attributes
3 3D
4 Traffic restrictions Depends
on the attributes
Data Measurements
5 Vehicle and
pedestrian specific data
Depends
on the attributes
Measurement Accuracy 1 Speed limits +/-25 m
2 Junction, roundabout data to be discussed
3 Geometry +/-10 m 4 3D +/-5 m
Accuracy
5 Factor Effect 1 2 3
SEN
SOR
SYS
TEM
AN
ALY
SIS
Sensitivity
4
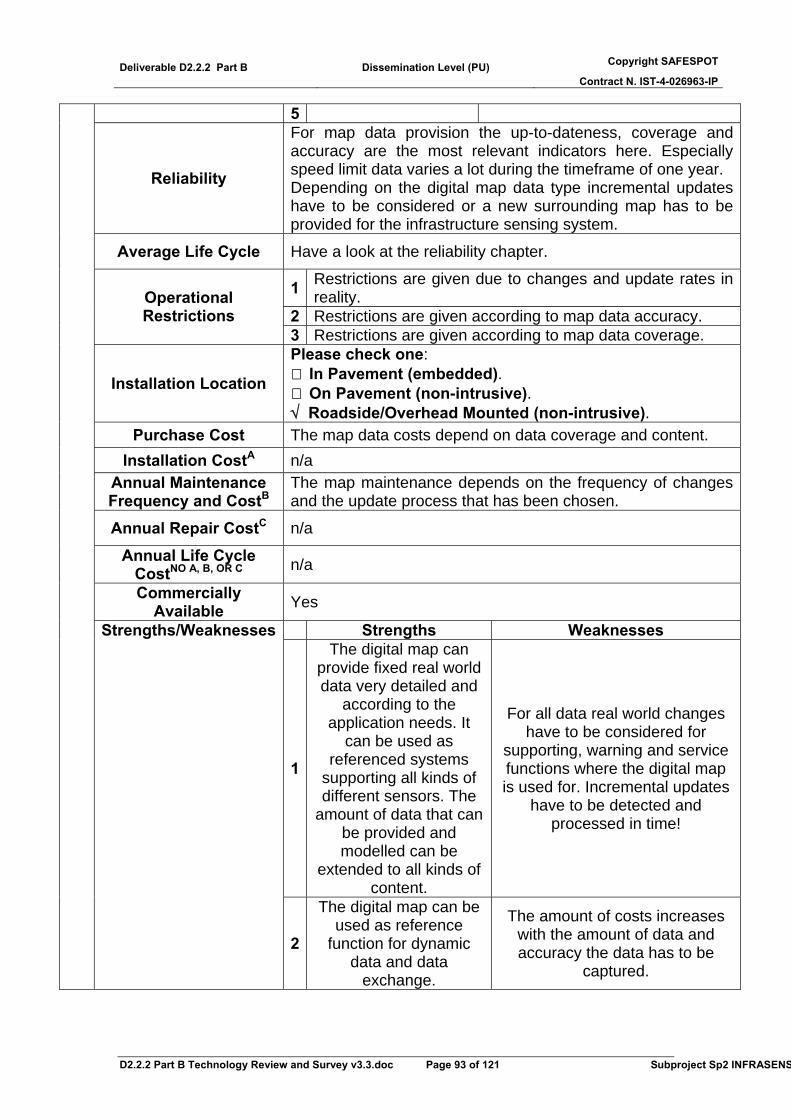
Deliverable D2.2.2 Part B Dissemination Level (PU) Copyright SAFESPOT
Contract N. IST-4-026963-IP
D2.2.2 Part B Technology Review and Survey v3.3.doc Page 93 of 121 Subproject Sp2 INFRASENS
5
Reliability
For map data provision the up-to-dateness, coverage and accuracy are the most relevant indicators here. Especially speed limit data varies a lot during the timeframe of one year. Depending on the digital map data type incremental updates have to be considered or a new surrounding map has to be provided for the infrastructure sensing system.
Average Life Cycle Have a look at the reliability chapter.
1 Restrictions are given due to changes and update rates in reality.
2 Restrictions are given according to map data accuracy. Operational Restrictions
3 Restrictions are given according to map data coverage.
Installation Location
Please check one: In Pavement (embedded). On Pavement (non-intrusive).
√ Roadside/Overhead Mounted (non-intrusive). Purchase Cost The map data costs depend on data coverage and content.
Installation CostA n/a Annual Maintenance Frequency and CostB
The map maintenance depends on the frequency of changes and the update process that has been chosen.
Annual Repair CostC n/a
Annual Life Cycle CostNO A, B, OR C n/a
Commercially Available Yes
Strengths Weaknesses
1
The digital map can provide fixed real world data very detailed and
according to the application needs. It
can be used as referenced systems
supporting all kinds of different sensors. The
amount of data that can be provided and modelled can be
extended to all kinds of content.
For all data real world changes have to be considered for
supporting, warning and service functions where the digital map is used for. Incremental updates
have to be detected and processed in time!
Strengths/Weaknesses
2
The digital map can be used as reference
function for dynamic data and data
exchange.
The amount of costs increases with the amount of data and accuracy the data has to be
captured.
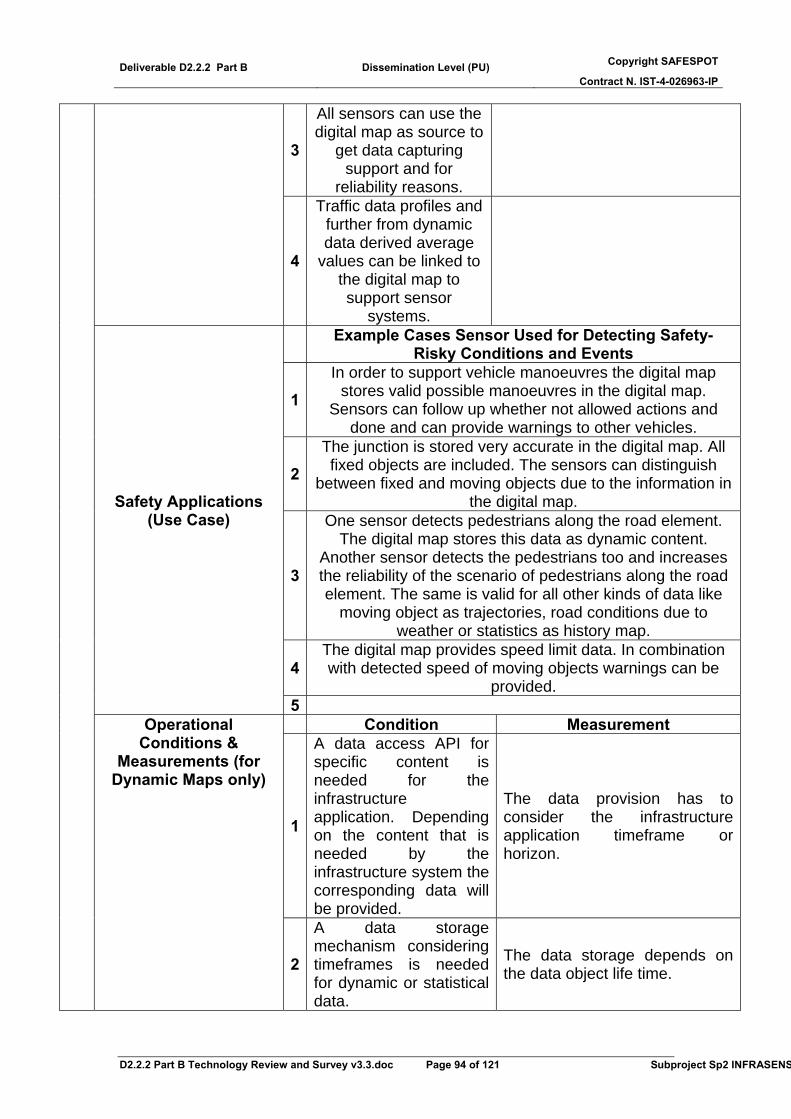
Deliverable D2.2.2 Part B Dissemination Level (PU) Copyright SAFESPOT
Contract N. IST-4-026963-IP
D2.2.2 Part B Technology Review and Survey v3.3.doc Page 94 of 121 Subproject Sp2 INFRASENS
3
All sensors can use the digital map as source to
get data capturing support and for
reliability reasons.
4
Traffic data profiles and further from dynamic data derived average
values can be linked to the digital map to support sensor
systems.
Example Cases Sensor Used for Detecting Safety-Risky Conditions and Events
1 In order to support vehicle manoeuvres the digital map
stores valid possible manoeuvres in the digital map. Sensors can follow up whether not allowed actions and
done and can provide warnings to other vehicles.
2 The junction is stored very accurate in the digital map. All fixed objects are included. The sensors can distinguish
between fixed and moving objects due to the information in the digital map.
3
One sensor detects pedestrians along the road element. The digital map stores this data as dynamic content.
Another sensor detects the pedestrians too and increases the reliability of the scenario of pedestrians along the road element. The same is valid for all other kinds of data like
moving object as trajectories, road conditions due to weather or statistics as history map.
4 The digital map provides speed limit data. In combination with detected speed of moving objects warnings can be
provided.
Safety Applications (Use Case)
5 Condition Measurement
1
A data access API for specific content is needed for the infrastructure application. Depending on the content that is needed by the infrastructure system the corresponding data will be provided.
The data provision has to consider the infrastructure application timeframe or horizon.
Operational Conditions &
Measurements (for Dynamic Maps only)
2
A data storage mechanism considering timeframes is needed for dynamic or statistical data.
The data storage depends on the data object life time.
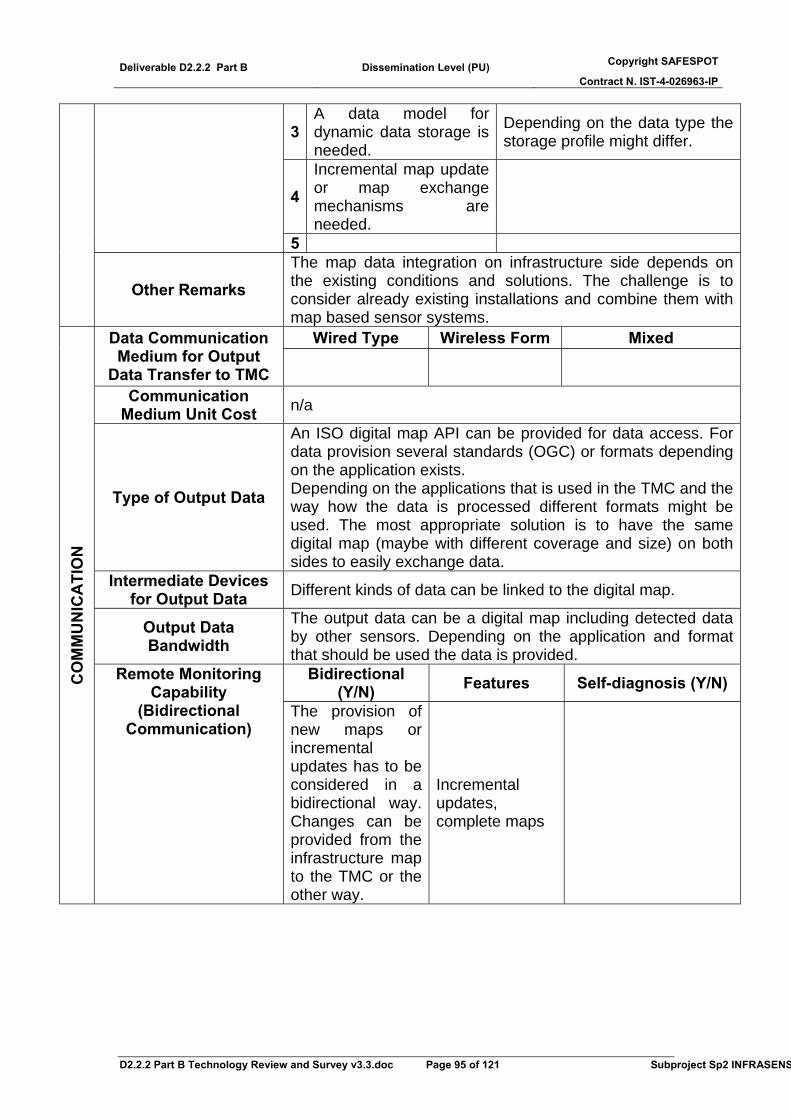
Deliverable D2.2.2 Part B Dissemination Level (PU) Copyright SAFESPOT
Contract N. IST-4-026963-IP
D2.2.2 Part B Technology Review and Survey v3.3.doc Page 95 of 121 Subproject Sp2 INFRASENS
3 A data model for dynamic data storage is needed.
Depending on the data type the storage profile might differ.
4 Incremental map update or map exchange mechanisms are needed.
5
Other Remarks The map data integration on infrastructure side depends on the existing conditions and solutions. The challenge is to consider already existing installations and combine them with map based sensor systems.
Wired Type Wireless Form Mixed Data Communication Medium for Output
Data Transfer to TMC
Communication Medium Unit Cost n/a
Type of Output Data
An ISO digital map API can be provided for data access. For data provision several standards (OGC) or formats depending on the application exists. Depending on the applications that is used in the TMC and the way how the data is processed different formats might be used. The most appropriate solution is to have the same digital map (maybe with different coverage and size) on both sides to easily exchange data.
Intermediate Devices for Output Data Different kinds of data can be linked to the digital map.
Output Data Bandwidth
The output data can be a digital map including detected data by other sensors. Depending on the application and format that should be used the data is provided.
Bidirectional (Y/N) Features Self-diagnosis (Y/N) C
OM
MU
NIC
ATI
ON
Remote Monitoring Capability
(Bidirectional Communication)
The provision of new maps or incremental updates has to be considered in a bidirectional way. Changes can be provided from the infrastructure map to the TMC or the other way.
Incremental updates, complete maps

Deliverable D2.2.2 Part B Dissemination Level (PU) Copyright SAFESPOT
Contract N. IST-4-026963-IP
D2.2.2 Part B Technology Review and Survey v3.3.doc Page 96 of 121 Subproject Sp2 INFRASENS
Data linked to the digital map can be provided in both directions: To the TMC for data monitoring, from the TMC for traffic control and steering.
Traffic and safety condition data; traffic control and advice
Energy Requirements (External Power
Source) n/a
Source Type Battery Type and System Lifetime
ENER
GY
Autonomous Operation (Internal
Power Source) Organization Date Version
v 1.0 Template ID Tele Atlas (TA)
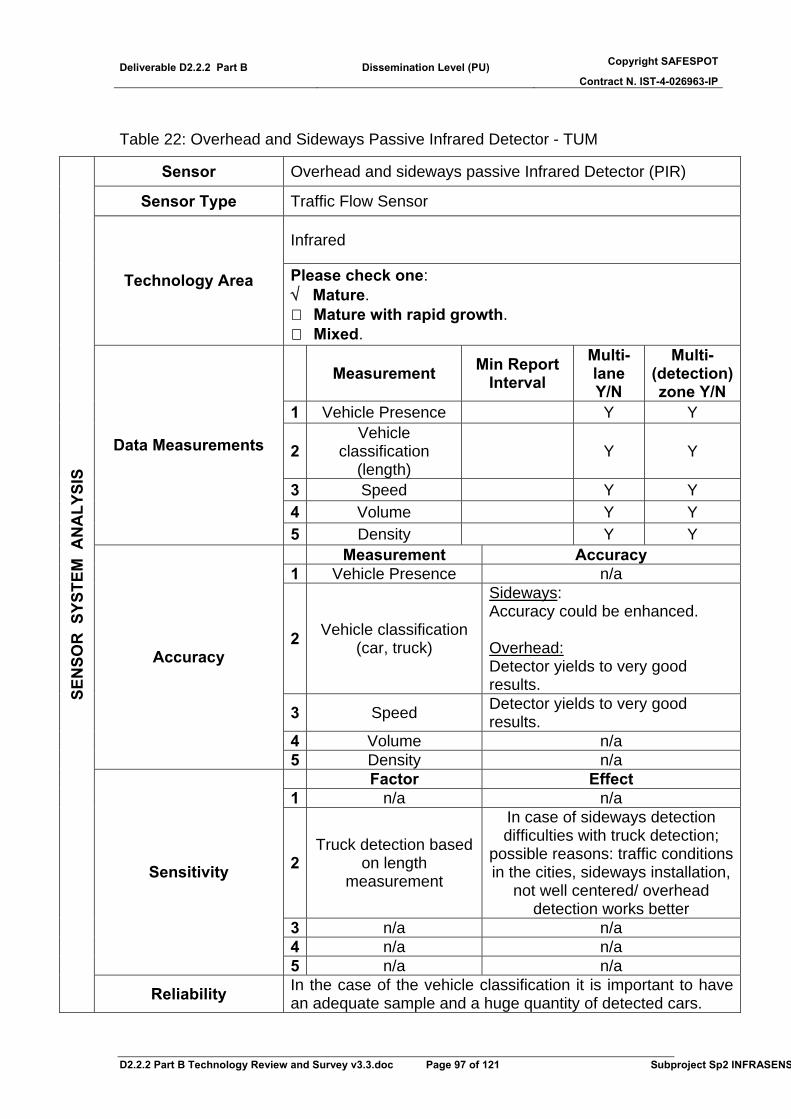
Deliverable D2.2.2 Part B Dissemination Level (PU) Copyright SAFESPOT
Contract N. IST-4-026963-IP
D2.2.2 Part B Technology Review and Survey v3.3.doc Page 97 of 121 Subproject Sp2 INFRASENS
Table 22: Overhead and Sideways Passive Infrared Detector - TUM
Sensor Overhead and sideways passive Infrared Detector (PIR)
Sensor Type Traffic Flow Sensor
Infrared
Technology Area Please check one: √ Mature.
Mature with rapid growth. Mixed.
Measurement Min Report Interval
Multi-lane Y/N
Multi-(detection) zone Y/N
1 Vehicle Presence Y Y
2 Vehicle
classification (length)
Y Y
3 Speed Y Y 4 Volume Y Y
Data Measurements
5 Density Y Y Measurement Accuracy
1 Vehicle Presence n/a
2 Vehicle classification (car, truck)
Sideways: Accuracy could be enhanced. Overhead: Detector yields to very good results.
3 Speed Detector yields to very good results.
4 Volume n/a
Accuracy
5 Density n/a Factor Effect 1 n/a n/a
2 Truck detection based
on length measurement
In case of sideways detection difficulties with truck detection;
possible reasons: traffic conditions in the cities, sideways installation,
not well centered/ overhead detection works better
3 n/a n/a 4 n/a n/a
Sensitivity
5 n/a n/a
SEN
SOR
SYS
TEM
AN
ALY
SIS
Reliability In the case of the vehicle classification it is important to have an adequate sample and a huge quantity of detected cars.

Deliverable D2.2.2 Part B Dissemination Level (PU) Copyright SAFESPOT
Contract N. IST-4-026963-IP
D2.2.2 Part B Technology Review and Survey v3.3.doc Page 98 of 121 Subproject Sp2 INFRASENS
Average Life Cycle n/a
1 Environmental Restrictions (rain, snow, fog) 2 Operates in all temperatures Operational
Restrictions 3
Installation Location
Please check one: In Pavement (embedded). On Pavement (non-intrusive).
√ Roadside/Overhead Mounted (non-intrusive). Purchase Cost n/a
Installation CostA n/a Annual Maintenance Frequency and CostB n/a
Annual Repair CostC n/a
Annual Life Cycle CostNO A, B, OR C n/a
Commercially Available Yes
Strengths Weaknesses
1 Installation on existing bridges and pylons (no
contact with vehicle necessary, no abrasion)
In case of sideways detection difficulties with vehicle detection
2 Energy supply by solar power
3 Data communication without lines (costs)
Strengths/Weaknesses
4 Free choice of location (selection only on traffic
engineering aspects)
Example Cases Sensor Used for Detecting Safety-Risky Conditions and Events
1 Unstable flow state conditions/Stop-and-go traffic 2 Dense/Heavy flow state conditions/Dynamic queues 3 Tailgating/Speeding 4
Safety Applications (Use Case)
5 Condition Measurement
1 2 3 4
Operational Conditions &
Measurements (for Dynamic Maps only)
5
Other Remarks Detector range between 10m and 20m
N I C Data Communication Wire Type Wireless Form Mixed
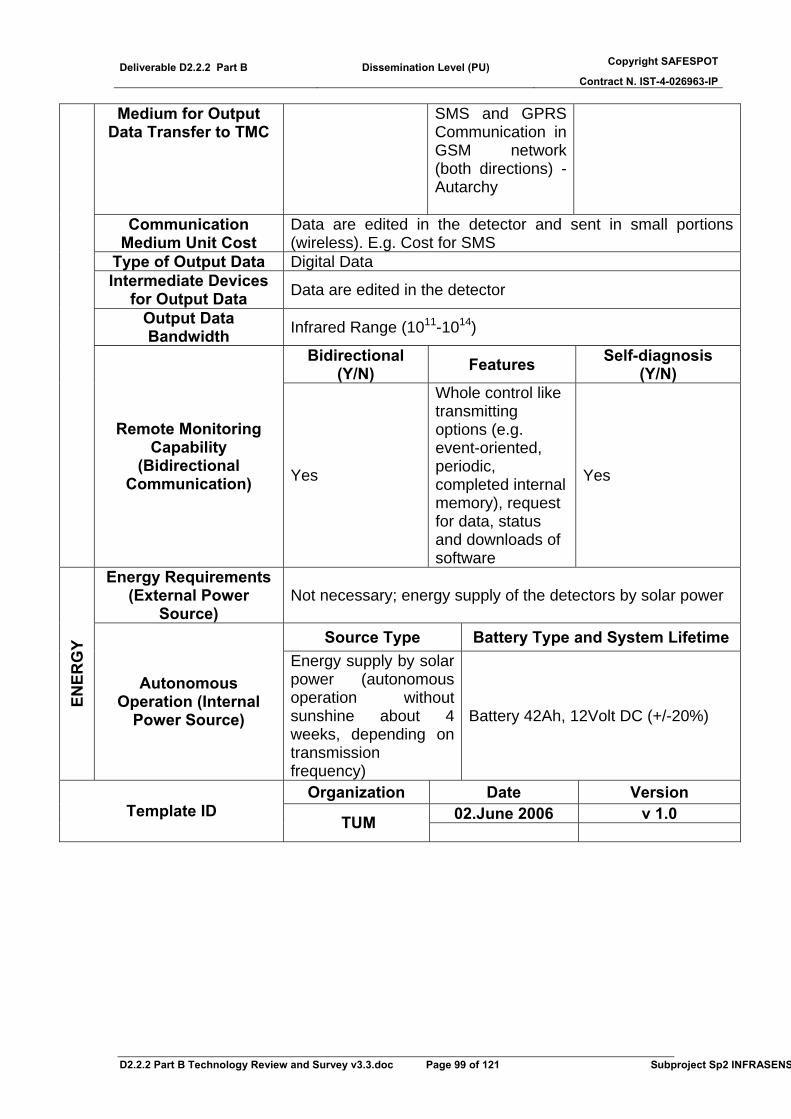
Deliverable D2.2.2 Part B Dissemination Level (PU) Copyright SAFESPOT
Contract N. IST-4-026963-IP
D2.2.2 Part B Technology Review and Survey v3.3.doc Page 99 of 121 Subproject Sp2 INFRASENS
Medium for Output Data Transfer to TMC
SMS and GPRS Communication in GSM network (both directions) - Autarchy
Communication Medium Unit Cost
Data are edited in the detector and sent in small portions (wireless). E.g. Cost for SMS
Type of Output Data Digital Data Intermediate Devices
for Output Data Data are edited in the detector
Output Data Bandwidth Infrared Range (1011-1014)
Bidirectional (Y/N) Features Self-diagnosis
(Y/N)
Remote Monitoring Capability
(Bidirectional Communication) Yes
Whole control like transmitting options (e.g. event-oriented, periodic, completed internal memory), request for data, status and downloads of software
Yes
Energy Requirements (External Power
Source) Not necessary; energy supply of the detectors by solar power
Source Type Battery Type and System Lifetime
ENER
GY
Autonomous Operation (Internal
Power Source)
Energy supply by solar power (autonomous operation without sunshine about 4 weeks, depending on transmission frequency)
Battery 42Ah, 12Volt DC (+/-20%)
Organization Date Version 02.June 2006 v 1.0 Template ID
TUM
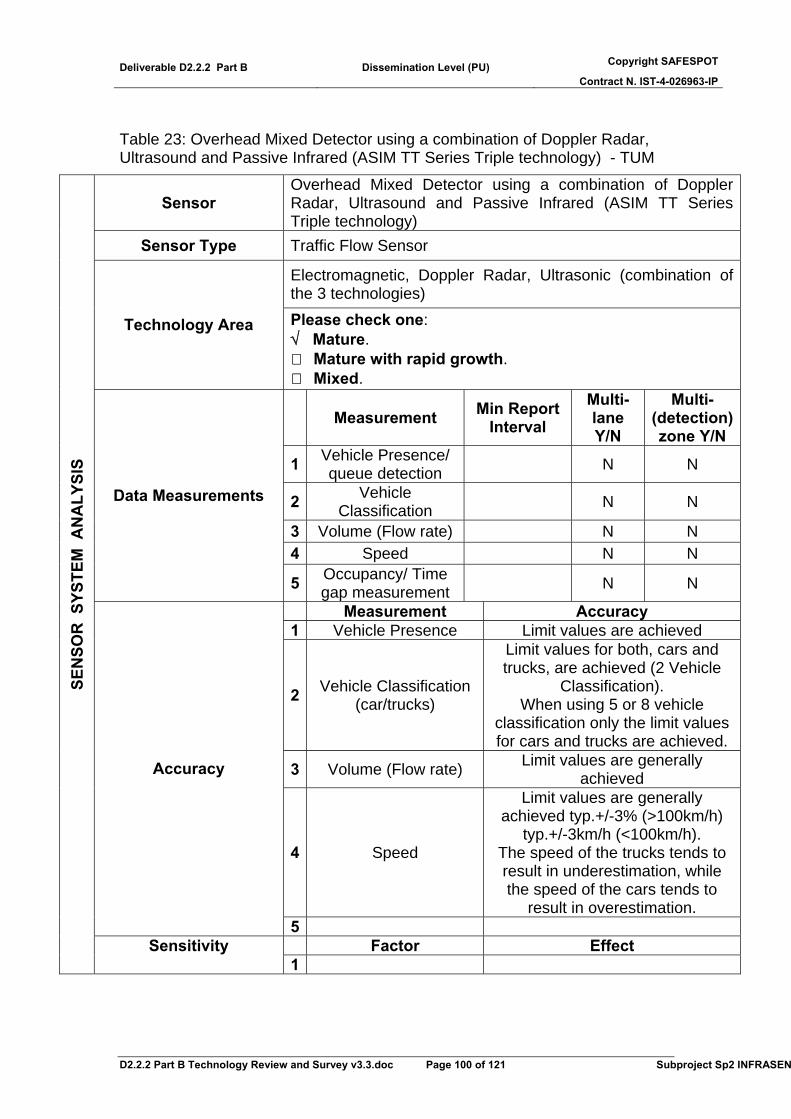
Deliverable D2.2.2 Part B Dissemination Level (PU) Copyright SAFESPOT
Contract N. IST-4-026963-IP
D2.2.2 Part B Technology Review and Survey v3.3.doc Page 100 of 121 Subproject Sp2 INFRASEN
Table 23: Overhead Mixed Detector using a combination of Doppler Radar, Ultrasound and Passive Infrared (ASIM TT Series Triple technology) - TUM
Sensor Overhead Mixed Detector using a combination of Doppler Radar, Ultrasound and Passive Infrared (ASIM TT Series Triple technology)
Sensor Type Traffic Flow Sensor
Electromagnetic, Doppler Radar, Ultrasonic (combination of the 3 technologies)
Technology Area Please check one: √ Mature.
Mature with rapid growth. Mixed.
Measurement Min Report Interval
Multi-lane Y/N
Multi-(detection) zone Y/N
1 Vehicle Presence/ queue detection N N
2 Vehicle Classification N N
3 Volume (Flow rate) N N 4 Speed N N
Data Measurements
5 Occupancy/ Time gap measurement N N
Measurement Accuracy 1 Vehicle Presence Limit values are achieved
2 Vehicle Classification (car/trucks)
Limit values for both, cars and trucks, are achieved (2 Vehicle
Classification). When using 5 or 8 vehicle
classification only the limit values for cars and trucks are achieved.
3 Volume (Flow rate) Limit values are generally achieved
4 Speed
Limit values are generally achieved typ.+/-3% (>100km/h)
typ.+/-3km/h (<100km/h). The speed of the trucks tends to result in underestimation, while the speed of the cars tends to
result in overestimation.
Accuracy
5 Factor Effect
SEN
SOR
SYS
TEM
AN
ALY
SIS
Sensitivity 1

Deliverable D2.2.2 Part B Dissemination Level (PU) Copyright SAFESPOT
Contract N. IST-4-026963-IP
D2.2.2 Part B Technology Review and Survey v3.3.doc Page 101 of 121 Subproject Sp2 INFRASEN
2 Vehicle Classification In the case of motorbikes the detection rate depends on the
detection range 3 4 5
Reliability
For all measurements the testing has shown that it is important to have an adequate sample and a huge quantity of detected cars (especially in the case of vehicle classification). Besides, the detection range influences the quality of the data (vehicle classification) and the quantity of detected vehicles. During the whole testing time, the detector showed stable results.
Average Life Cycle n/a
1 In general: Due to the use of a combination of 3 technologies neither the weather conditions nor the traffic conditions nor day and night have negative impact on the results.
2 Temperature: -40° to +70°
Operational Restrictions
3 Humidity: 95% RH max.
Installation Location
Please check one: In Pavement (embedded). On Pavement (non-intrusive).
√ Roadside/Overhead Mounted (non-intrusive). Purchase Cost n/a
Installation CostA n/a Annual Maintenance Frequency and CostB n/a
Annual Repair CostC n/a
Annual Life Cycle CostNO A, B, OR C n/a
Commercially Available Yes
Strengths Weaknesses Strengths/Weaknesses
1
Bridges, gantries and other stable structures above the lane can be
used as mounting structure. No road works and disruption of traffic during installation and
maintenance.
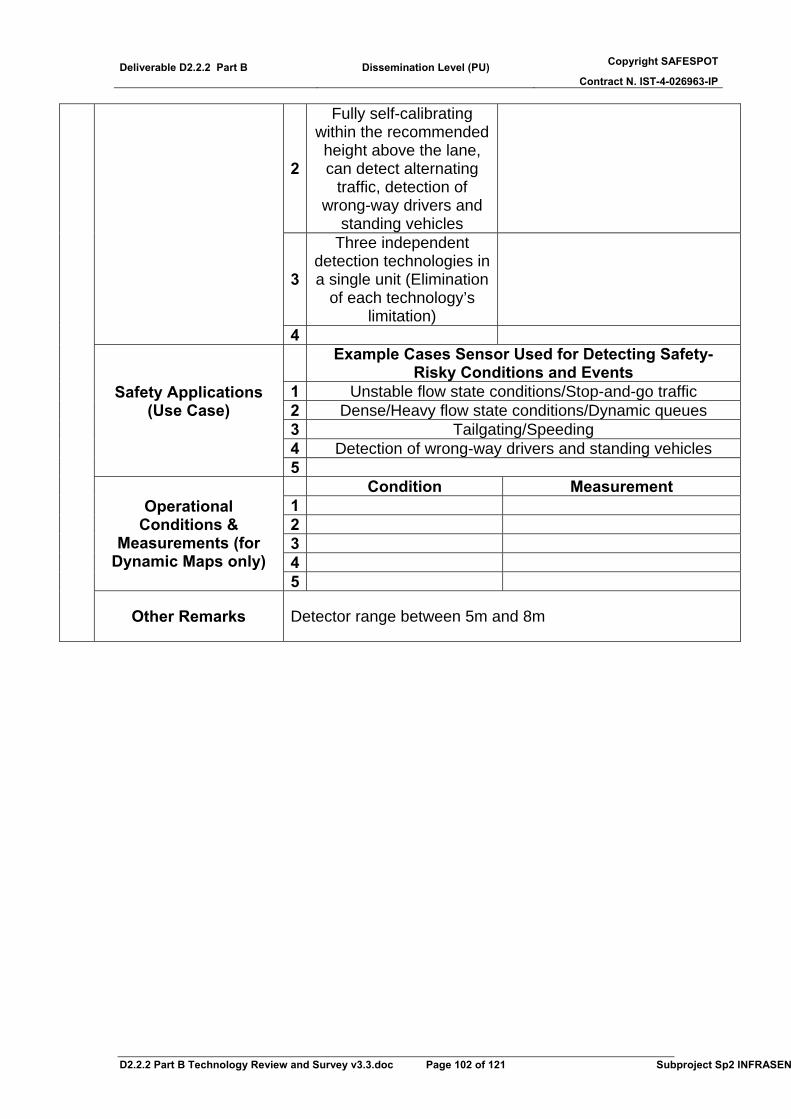
Deliverable D2.2.2 Part B Dissemination Level (PU) Copyright SAFESPOT
Contract N. IST-4-026963-IP
D2.2.2 Part B Technology Review and Survey v3.3.doc Page 102 of 121 Subproject Sp2 INFRASEN
2
Fully self-calibrating within the recommended height above the lane, can detect alternating
traffic, detection of wrong-way drivers and
standing vehicles
3
Three independent detection technologies in a single unit (Elimination
of each technology’s limitation)
4
Example Cases Sensor Used for Detecting Safety-Risky Conditions and Events
1 Unstable flow state conditions/Stop-and-go traffic 2 Dense/Heavy flow state conditions/Dynamic queues 3 Tailgating/Speeding 4 Detection of wrong-way drivers and standing vehicles
Safety Applications (Use Case)
5 Condition Measurement
1 2 3 4
Operational Conditions &
Measurements (for Dynamic Maps only)
5
Other Remarks Detector range between 5m and 8m
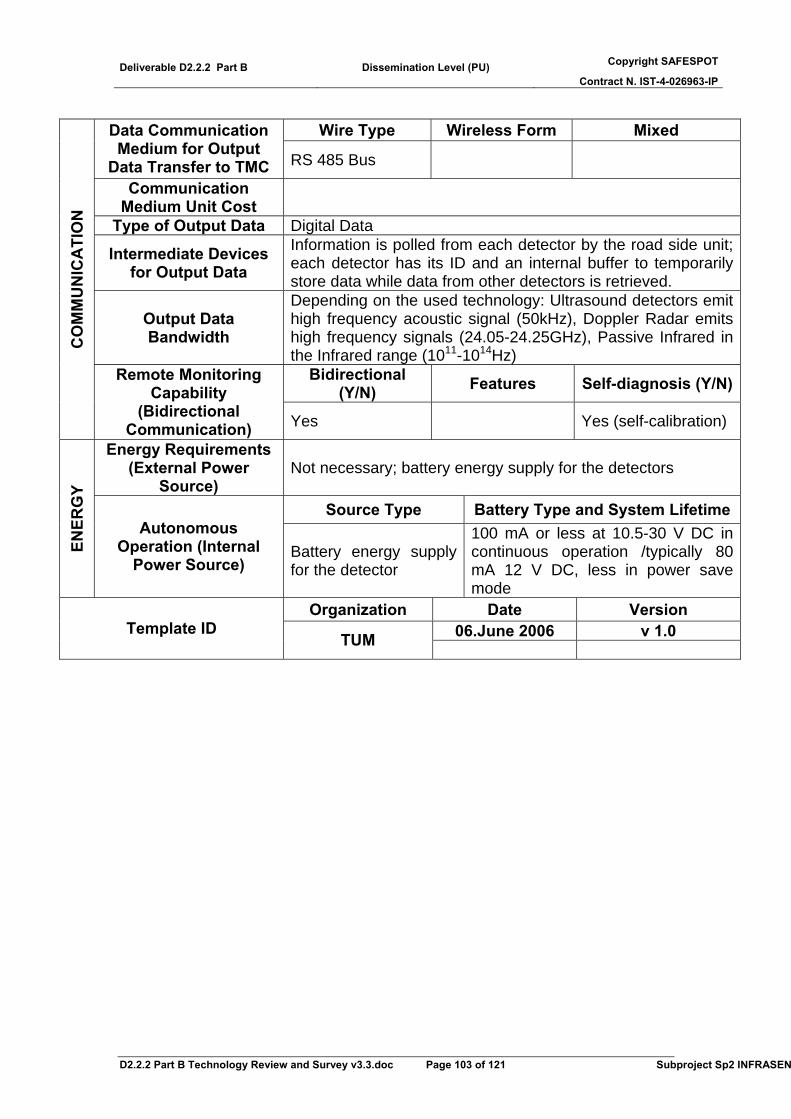
Deliverable D2.2.2 Part B Dissemination Level (PU) Copyright SAFESPOT
Contract N. IST-4-026963-IP
D2.2.2 Part B Technology Review and Survey v3.3.doc Page 103 of 121 Subproject Sp2 INFRASEN
Wire Type Wireless Form Mixed Data Communication
Medium for Output Data Transfer to TMC RS 485 Bus
Communication Medium Unit Cost
Type of Output Data Digital Data
Intermediate Devices for Output Data
Information is polled from each detector by the road side unit; each detector has its ID and an internal buffer to temporarily store data while data from other detectors is retrieved.
Output Data Bandwidth
Depending on the used technology: Ultrasound detectors emit high frequency acoustic signal (50kHz), Doppler Radar emits high frequency signals (24.05-24.25GHz), Passive Infrared in the Infrared range (1011-1014Hz)
Bidirectional (Y/N) Features Self-diagnosis (Y/N)
CO
MM
UN
ICA
TIO
N
Remote Monitoring Capability
(Bidirectional Communication) Yes Yes (self-calibration)
Energy Requirements (External Power
Source) Not necessary; battery energy supply for the detectors
Source Type Battery Type and System Lifetime
ENER
GY
Autonomous Operation (Internal
Power Source) Battery energy supply for the detector
100 mA or less at 10.5-30 V DC in continuous operation /typically 80 mA 12 V DC, less in power save mode
Organization Date Version 06.June 2006 v 1.0 Template ID
TUM
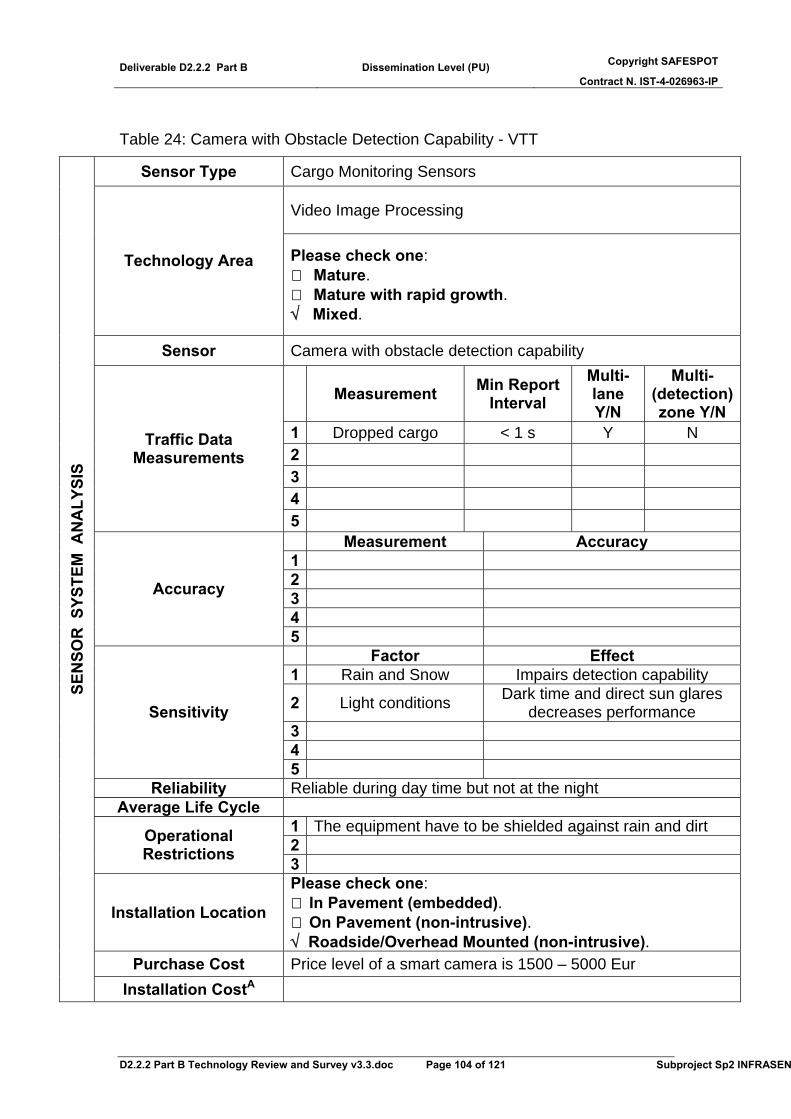
Deliverable D2.2.2 Part B Dissemination Level (PU) Copyright SAFESPOT
Contract N. IST-4-026963-IP
D2.2.2 Part B Technology Review and Survey v3.3.doc Page 104 of 121 Subproject Sp2 INFRASEN
Table 24: Camera with Obstacle Detection Capability - VTT
Sensor Type Cargo Monitoring Sensors
Video Image Processing
Technology Area Please check one: Mature. Mature with rapid growth.
√ Mixed.
Sensor Camera with obstacle detection capability
Measurement Min Report Interval
Multi-lane Y/N
Multi-(detection) zone Y/N
1 Dropped cargo < 1 s Y N 2 3 4
Traffic Data Measurements
5 Measurement Accuracy
1 2 3 4
Accuracy
5 Factor Effect 1 Rain and Snow Impairs detection capability
2 Light conditions Dark time and direct sun glares decreases performance
3 4
Sensitivity
5 Reliability Reliable during day time but not at the night
Average Life Cycle 1 The equipment have to be shielded against rain and dirt 2 Operational
Restrictions 3
Installation Location
Please check one: In Pavement (embedded). On Pavement (non-intrusive).
√ Roadside/Overhead Mounted (non-intrusive). Purchase Cost Price level of a smart camera is 1500 – 5000 Eur
SEN
SOR
SYS
TEM
AN
ALY
SIS
Installation CostA

Deliverable D2.2.2 Part B Dissemination Level (PU) Copyright SAFESPOT
Contract N. IST-4-026963-IP
D2.2.2 Part B Technology Review and Survey v3.3.doc Page 105 of 121 Subproject Sp2 INFRASEN
Annual Maintenance Frequency and CostB
Annual Repair CostC Annual Life Cycle
CostNO A, B, OR C
Commercially Available Smart cameras are available
Strengths Weaknesses
1 Simple application Price of the commercial implementations
2 Commercial equipment exist
Small detection view of commercial applications (20 x
50 m) 3
Strengths/Weaknesses
4 Cases Sensor Used for Detecting Safety-Related Risks
1 Obstacle on a road 2 3 4
Use Case (Safety Applications)
5 Condition Measurement
1 2 3 4
Operational Conditions &
Measurements (for Dynamic Maps only)
5
Other Remarks
Wire Type Wireless Form Mixed Data Communication Medium for Output
Data Transfer to TMC Optical, Firewire, USB, Ethernet WLAN, Bluetooth
Communication Medium Unit Cost
Type of Output Data Digital data Intermediate Devices
for Output Data Embedded CPU is needed in a roadside unit
Output Data Bandwidth Low
Bidirectional (Y/N) Features Self-diagnosis (Y/N)
CO
MM
UN
ICA
TIO
N
Remote Monitoring Capability
(Bidirectional Communication) Y Video output
available N
Energy Requirements (External Power
Source) 5-24 V
ENER
GY
Autonomous Source Type Battery Type and System Lifetime
Deliverable D2.2.2 Part B Dissemination Level (PU) Copyright SAFESPOT
Contract N. IST-4-026963-IP
D2.2.2 Part B Technology Review and Survey v3.3.doc Page 106 of 121 Subproject Sp2 INFRASEN
Operation (Internal Power Source)
Organization Date Version Template ID VTT 7 Jun 2006 v 1.0
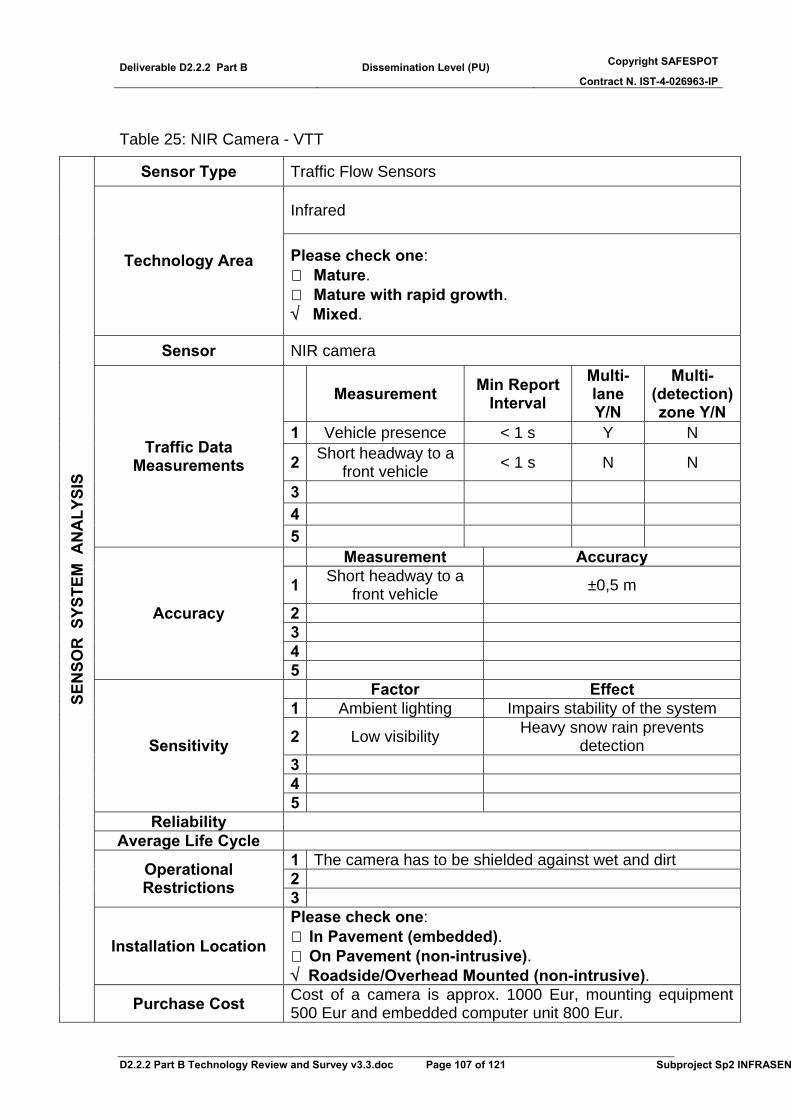
Deliverable D2.2.2 Part B Dissemination Level (PU) Copyright SAFESPOT
Contract N. IST-4-026963-IP
D2.2.2 Part B Technology Review and Survey v3.3.doc Page 107 of 121 Subproject Sp2 INFRASEN
Table 25: NIR Camera - VTT
Sensor Type Traffic Flow Sensors
Infrared
Technology Area Please check one: Mature. Mature with rapid growth.
√ Mixed.
Sensor NIR camera
Measurement Min Report Interval
Multi-lane Y/N
Multi-(detection) zone Y/N
1 Vehicle presence < 1 s Y N
2 Short headway to a front vehicle < 1 s N N
3 4
Traffic Data Measurements
5 Measurement Accuracy
1 Short headway to a front vehicle ±0,5 m
2 3 4
Accuracy
5 Factor Effect 1 Ambient lighting Impairs stability of the system
2 Low visibility Heavy snow rain prevents detection
3 4
Sensitivity
5 Reliability
Average Life Cycle 1 The camera has to be shielded against wet and dirt 2 Operational
Restrictions 3
Installation Location
Please check one: In Pavement (embedded). On Pavement (non-intrusive).
√ Roadside/Overhead Mounted (non-intrusive).
SEN
SOR
SYS
TEM
AN
ALY
SIS
Purchase Cost Cost of a camera is approx. 1000 Eur, mounting equipment 500 Eur and embedded computer unit 800 Eur.

Deliverable D2.2.2 Part B Dissemination Level (PU) Copyright SAFESPOT
Contract N. IST-4-026963-IP
D2.2.2 Part B Technology Review and Survey v3.3.doc Page 108 of 121 Subproject Sp2 INFRASEN
Installation CostA Annual Maintenance Frequency and CostB
Annual Repair CostC Annual Life Cycle
CostNO A, B, OR C
Commercially Available Cameras with proper shielding are commercially available
Strengths Weaknesses
1 Cameras can be utilized for the many detection
purposes
Dependency on environmental factors
2 Price level 3
Strengths/Weaknesses
4 Cases Sensor Used for Detecting Safety-Related Risks
1 Counting the traffic flow 2 Warning too short headways to a front vehicle 3 4
Use Case (Safety Applications)
5 Condition Measurement
1 2 3 4
Operational Conditions &
Measurements (for Dynamic Maps only)
5
Other Remarks
Wire Type Wireless Form Mixed Data Communication Medium for Output
Data Transfer to TMC Ethernet, USB, Firewire, optical link
WLAN, Bluetooth
Communication Medium Unit Cost
Type of Output Data Intermediate Devices
for Output Data An embedded processor unit have to be implemented to a roadside unit
Output Data Bandwidth Low
Bidirectional (Y/N) Features Self-diagnosis (Y/N)
CO
MM
UN
ICA
TIO
N
Remote Monitoring Capability
(Bidirectional Communication) Y Video output
available N
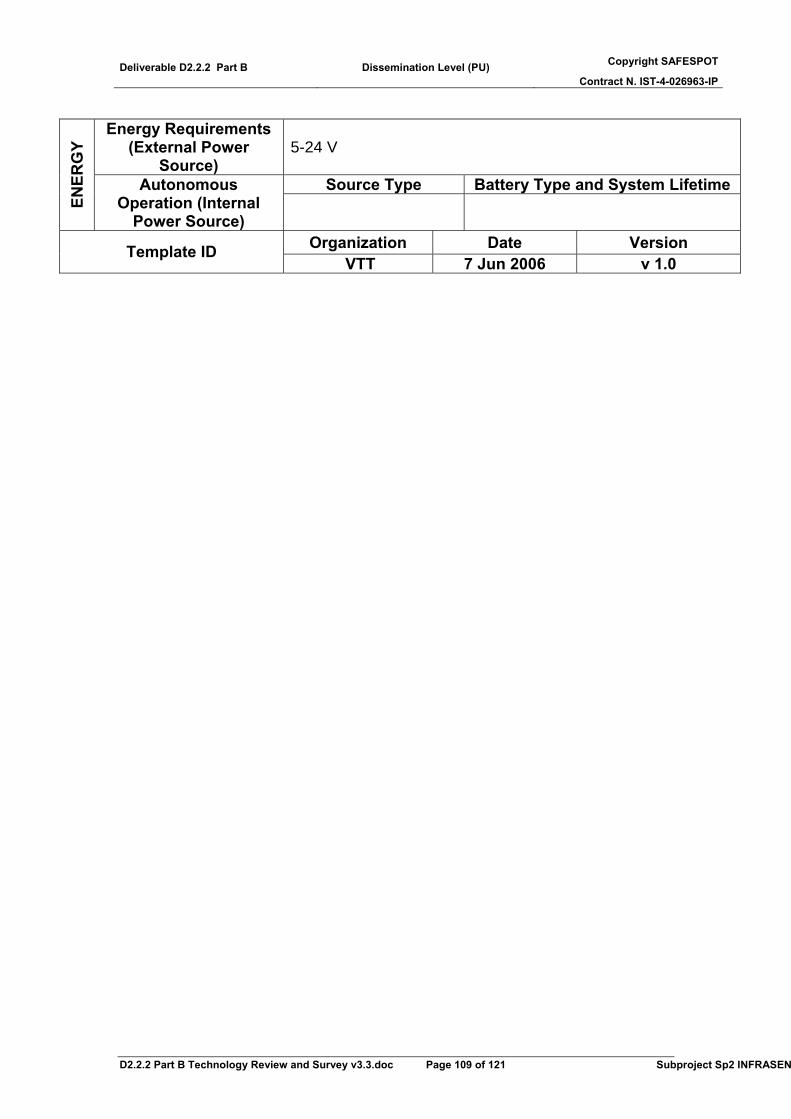
Deliverable D2.2.2 Part B Dissemination Level (PU) Copyright SAFESPOT
Contract N. IST-4-026963-IP
D2.2.2 Part B Technology Review and Survey v3.3.doc Page 109 of 121 Subproject Sp2 INFRASEN
Energy Requirements
(External Power Source)
5-24 V
Source Type Battery Type and System Lifetime
ENER
GY
Autonomous Operation (Internal
Power Source)
Organization Date Version Template ID VTT 7 Jun 2006 v 1.0
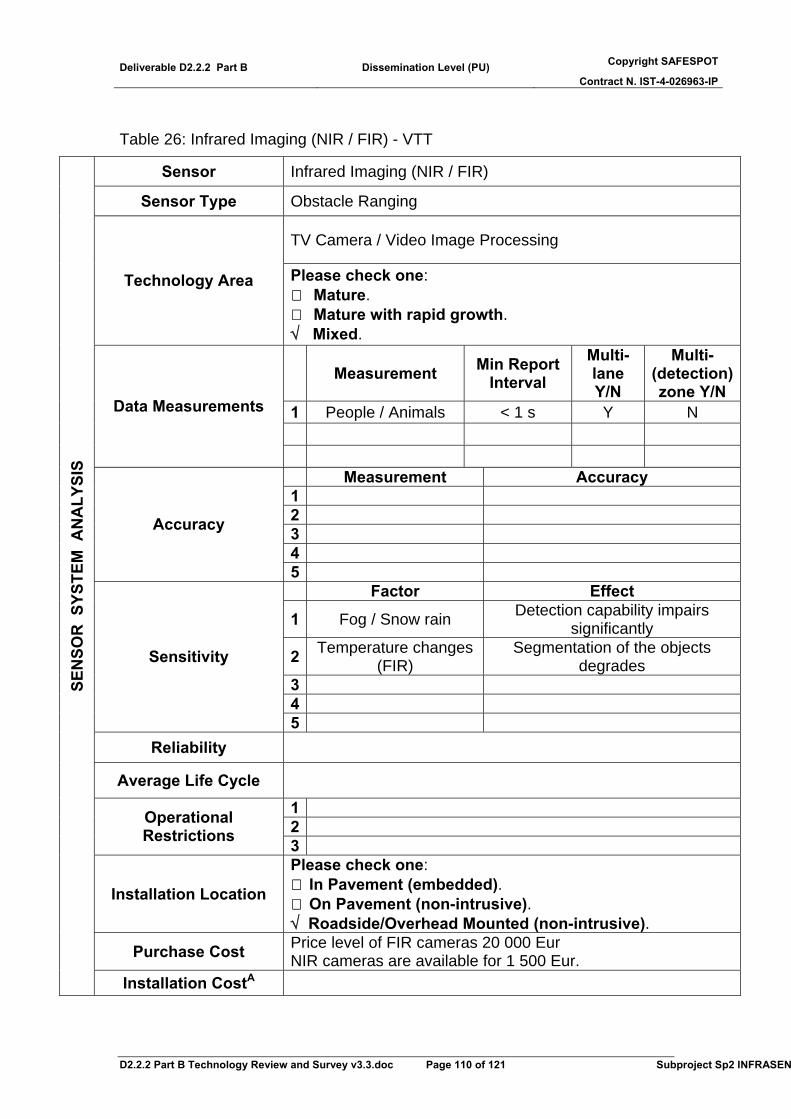
Deliverable D2.2.2 Part B Dissemination Level (PU) Copyright SAFESPOT
Contract N. IST-4-026963-IP
D2.2.2 Part B Technology Review and Survey v3.3.doc Page 110 of 121 Subproject Sp2 INFRASEN
Table 26: Infrared Imaging (NIR / FIR) - VTT
Sensor Infrared Imaging (NIR / FIR)
Sensor Type Obstacle Ranging
TV Camera / Video Image Processing
Technology Area Please check one: Mature. Mature with rapid growth.
√ Mixed.
Measurement Min Report Interval
Multi-lane Y/N
Multi-(detection) zone Y/N
1 People / Animals < 1 s Y N
Data Measurements
Measurement Accuracy
1 2 3 4
Accuracy
5 Factor Effect
1 Fog / Snow rain Detection capability impairs significantly
2 Temperature changes (FIR)
Segmentation of the objects degrades
3 4
Sensitivity
5 Reliability
Average Life Cycle
1 2 Operational
Restrictions 3
Installation Location
Please check one: In Pavement (embedded). On Pavement (non-intrusive).
√ Roadside/Overhead Mounted (non-intrusive).
Purchase Cost Price level of FIR cameras 20 000 Eur NIR cameras are available for 1 500 Eur.
SEN
SOR
SYS
TEM
AN
ALY
SIS
Installation CostA
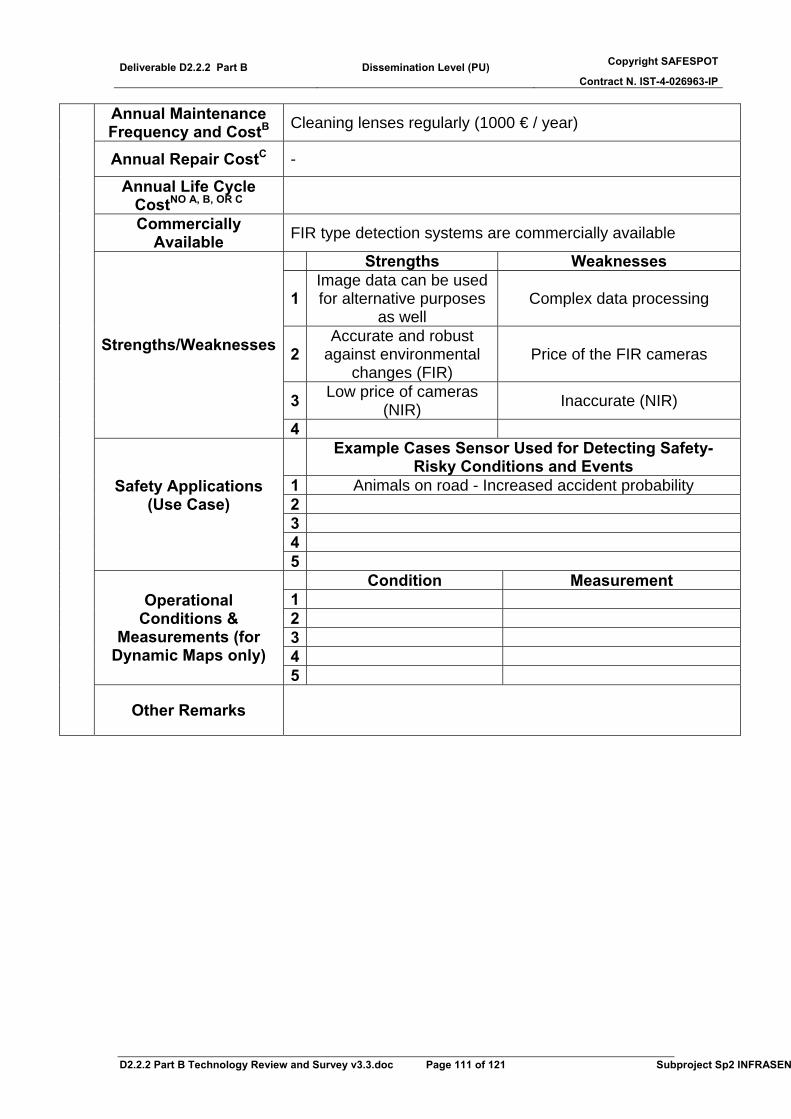
Deliverable D2.2.2 Part B Dissemination Level (PU) Copyright SAFESPOT
Contract N. IST-4-026963-IP
D2.2.2 Part B Technology Review and Survey v3.3.doc Page 111 of 121 Subproject Sp2 INFRASEN
Annual Maintenance Frequency and CostB Cleaning lenses regularly (1000 € / year)
Annual Repair CostC -
Annual Life Cycle CostNO A, B, OR C
Commercially Available FIR type detection systems are commercially available
Strengths Weaknesses
1 Image data can be used for alternative purposes
as well Complex data processing
2 Accurate and robust
against environmental changes (FIR)
Price of the FIR cameras
3 Low price of cameras (NIR) Inaccurate (NIR)
Strengths/Weaknesses
4
Example Cases Sensor Used for Detecting Safety-Risky Conditions and Events
1 Animals on road - Increased accident probability 2 3 4
Safety Applications (Use Case)
5 Condition Measurement
1 2 3 4
Operational Conditions &
Measurements (for Dynamic Maps only)
5
Other Remarks
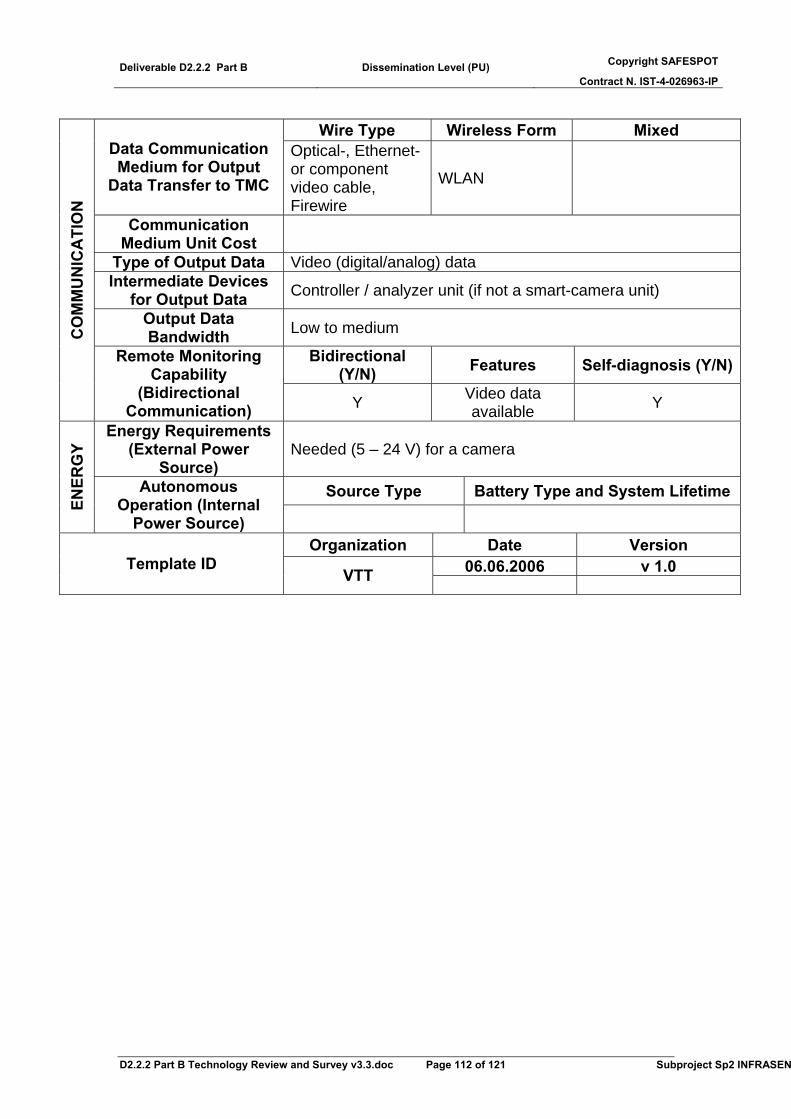
Deliverable D2.2.2 Part B Dissemination Level (PU) Copyright SAFESPOT
Contract N. IST-4-026963-IP
D2.2.2 Part B Technology Review and Survey v3.3.doc Page 112 of 121 Subproject Sp2 INFRASEN
Wire Type Wireless Form Mixed
Data Communication Medium for Output
Data Transfer to TMC
Optical-, Ethernet- or component video cable, Firewire
WLAN
Communication Medium Unit Cost
Type of Output Data Video (digital/analog) data Intermediate Devices
for Output Data Controller / analyzer unit (if not a smart-camera unit)
Output Data Bandwidth Low to medium
Bidirectional (Y/N) Features Self-diagnosis (Y/N)
CO
MM
UN
ICA
TIO
N
Remote Monitoring Capability
(Bidirectional Communication) Y Video data
available Y
Energy Requirements (External Power
Source) Needed (5 – 24 V) for a camera
Source Type Battery Type and System Lifetime
ENER
GY
Autonomous Operation (Internal
Power Source) Organization Date Version
06.06.2006 v 1.0 Template ID VTT

Deliverable D2.2.2 Part B Dissemination Level (PU) Copyright SAFESPOT
Contract N. IST-4-026963-IP
D2.2.2 Part B Technology Review and Survey v3.3.doc Page 113 of 121 Subproject Sp2 INFRASEN
Table 27: Far Infrared (FIR) Camera - VTT
Sensor Type Environmental Sensors
Infrared
Technology Area Please check one: √ Mature.
Mature with rapid growth. Mixed.
Sensor Far infrared (FIR) camera
Measurement Min Report Interval
Multi-lane Y/N
Multi-(detection) zone Y/N
1 Road surface – Ice < 1 s Y N 2 Road temperature < 1 s Y N 3 4
Traffic Data Measurements
5 Measurement Accuracy
1 Temperature ±0.5 °C 2 3 4
Accuracy
5 Factor Effect
1 Snow Degrades segmentation of the
objects, thus making temperature measurement of an object difficult
2 Fog / wet conditions Impairs detection capability 3 4
Sensitivity
5 Reliability
Average Life Cycle 1 2 Operational
Restrictions 3
Installation Location
Please check one: In Pavement (embedded). On Pavement (non-intrusive).
√ Roadside/Overhead Mounted (non-intrusive). Purchase Cost 10 000 – 20 000 Eur, embedded CPU board 1000 Eur
SEN
SOR
SYS
TEM
AN
ALY
SIS
Installation CostA
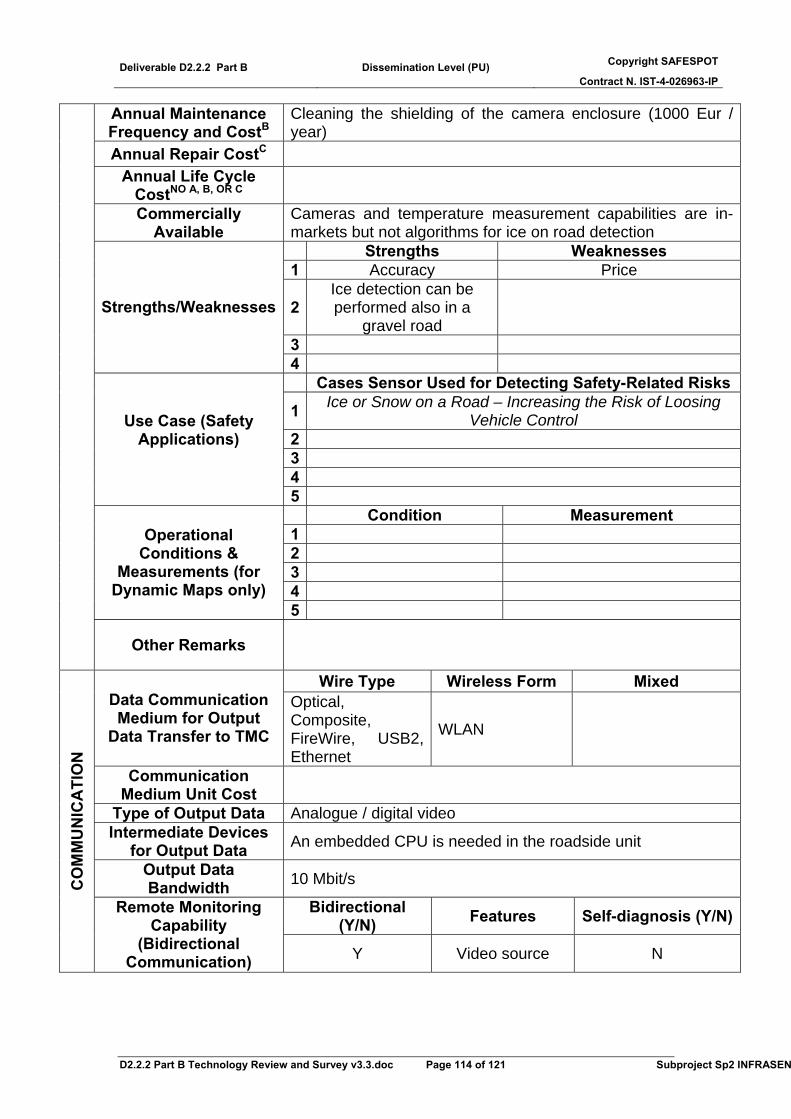
Deliverable D2.2.2 Part B Dissemination Level (PU) Copyright SAFESPOT
Contract N. IST-4-026963-IP
D2.2.2 Part B Technology Review and Survey v3.3.doc Page 114 of 121 Subproject Sp2 INFRASEN
Annual Maintenance Frequency and CostB
Cleaning the shielding of the camera enclosure (1000 Eur / year)
Annual Repair CostC Annual Life Cycle
CostNO A, B, OR C
Commercially Available
Cameras and temperature measurement capabilities are in-markets but not algorithms for ice on road detection Strengths Weaknesses
1 Accuracy Price
2 Ice detection can be performed also in a
gravel road
3
Strengths/Weaknesses
4 Cases Sensor Used for Detecting Safety-Related Risks
1 Ice or Snow on a Road – Increasing the Risk of Loosing Vehicle Control
2 3 4
Use Case (Safety Applications)
5 Condition Measurement
1 2 3 4
Operational Conditions &
Measurements (for Dynamic Maps only)
5
Other Remarks
Wire Type Wireless Form Mixed Data Communication Medium for Output
Data Transfer to TMC
Optical, Composite, FireWire, USB2, Ethernet
WLAN
Communication Medium Unit Cost
Type of Output Data Analogue / digital video Intermediate Devices
for Output Data An embedded CPU is needed in the roadside unit
Output Data Bandwidth 10 Mbit/s
Bidirectional (Y/N) Features Self-diagnosis (Y/N)
CO
MM
UN
ICA
TIO
N
Remote Monitoring Capability
(Bidirectional Communication) Y Video source N
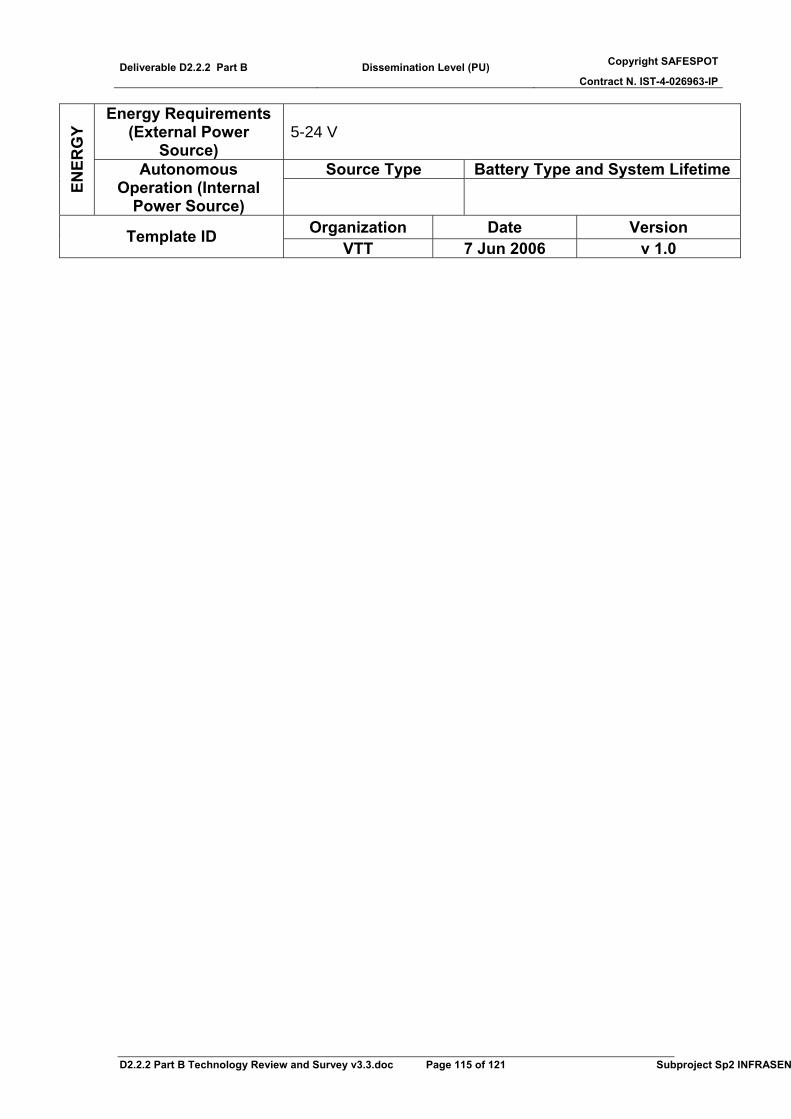
Deliverable D2.2.2 Part B Dissemination Level (PU) Copyright SAFESPOT
Contract N. IST-4-026963-IP
D2.2.2 Part B Technology Review and Survey v3.3.doc Page 115 of 121 Subproject Sp2 INFRASEN
Energy Requirements (External Power
Source) 5-24 V
Source Type Battery Type and System Lifetime
ENER
GY
Autonomous Operation (Internal
Power Source)
Organization Date Version Template ID VTT 7 Jun 2006 v 1.0
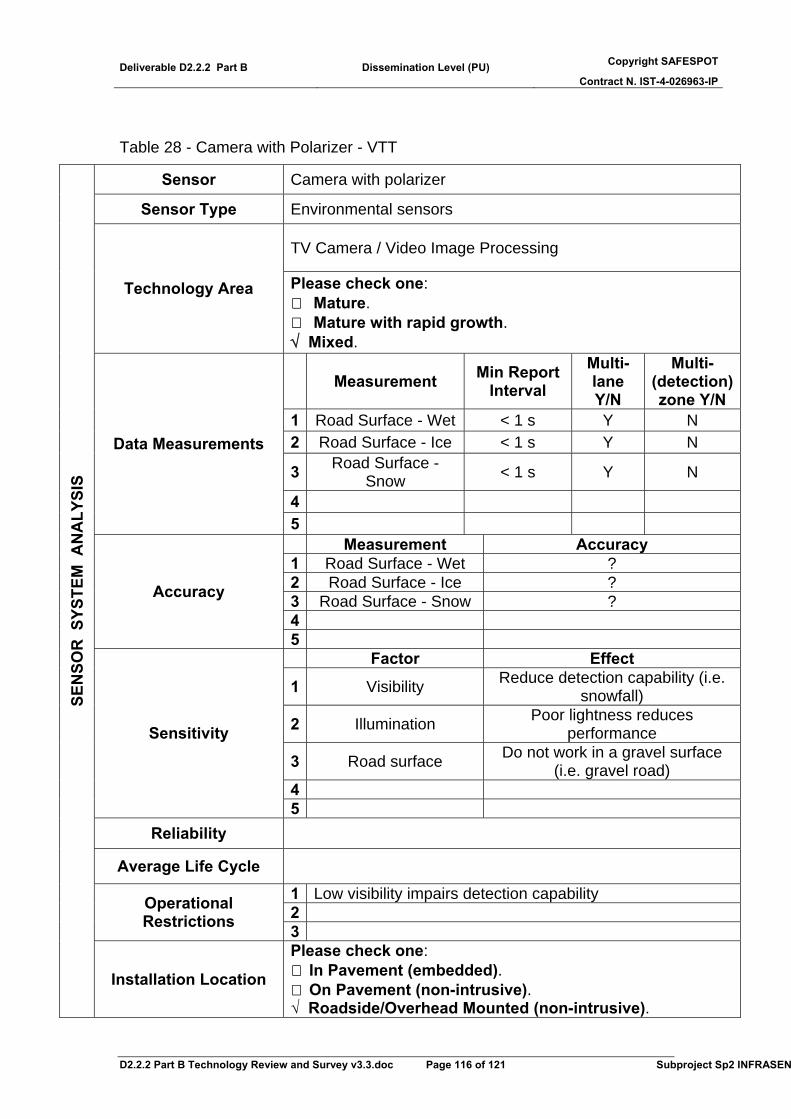
Deliverable D2.2.2 Part B Dissemination Level (PU) Copyright SAFESPOT
Contract N. IST-4-026963-IP
D2.2.2 Part B Technology Review and Survey v3.3.doc Page 116 of 121 Subproject Sp2 INFRASEN
Table 28 - Camera with Polarizer - VTT
Sensor Camera with polarizer
Sensor Type Environmental sensors
TV Camera / Video Image Processing
Technology Area Please check one: Mature. Mature with rapid growth.
√ Mixed.
Measurement Min Report Interval
Multi-lane Y/N
Multi-(detection) zone Y/N
1 Road Surface - Wet < 1 s Y N 2 Road Surface - Ice < 1 s Y N
3 Road Surface - Snow < 1 s Y N
4
Data Measurements
5 Measurement Accuracy
1 Road Surface - Wet ? 2 Road Surface - Ice ? 3 Road Surface - Snow ? 4
Accuracy
5 Factor Effect
1 Visibility Reduce detection capability (i.e. snowfall)
2 Illumination Poor lightness reduces performance
3 Road surface Do not work in a gravel surface (i.e. gravel road)
4
Sensitivity
5 Reliability
Average Life Cycle
1 Low visibility impairs detection capability 2 Operational
Restrictions 3
SEN
SOR
SYS
TEM
AN
ALY
SIS
Installation Location
Please check one: In Pavement (embedded). On Pavement (non-intrusive).
√ Roadside/Overhead Mounted (non-intrusive).

Deliverable D2.2.2 Part B Dissemination Level (PU) Copyright SAFESPOT
Contract N. IST-4-026963-IP
D2.2.2 Part B Technology Review and Survey v3.3.doc Page 117 of 121 Subproject Sp2 INFRASEN
Purchase Cost I.e. commercial speed control camera system 20 000 €, low-cost outdoor surveillance camera + polarizer 700 €
Installation CostA Annual Maintenance Frequency and CostB Cleaning lenses regularly (1000 € / year)
Annual Repair CostC -
Annual Life Cycle CostNO A, B, OR C
Commercially Available No
Strengths Weaknesses
1 Image data can be used for alternative purposes
as well Complex data processing
2 No installation inside the road
Reliability depends on the environmental factors (e.g.
visibility) 3
Strengths/Weaknesses
4
Example Cases Sensor Used for Detecting Safety-Risky Conditions and Events
1 Ice or snow on a road, increased risk of losing vehicle control
2 Slippery road (wet) 3 4
Safety Applications (Use Case)
5 Condition Measurement
1 2 3 4
Operational Conditions &
Measurements (for Dynamic Maps only)
5
Other Remarks
Wire Type Wireless Form Mixed Data Communication Medium for Output
Data Transfer to TMC
Optical-, Ethernet- or component video cable, Firewire, USB
WLAN
Communication Medium Unit Cost
Type of Output Data Video (digital/analog) data
CO
MM
UN
ICA
TIO
N
Intermediate Devices for Output Data Controller / analyzer unit (if not smart-camera unit)
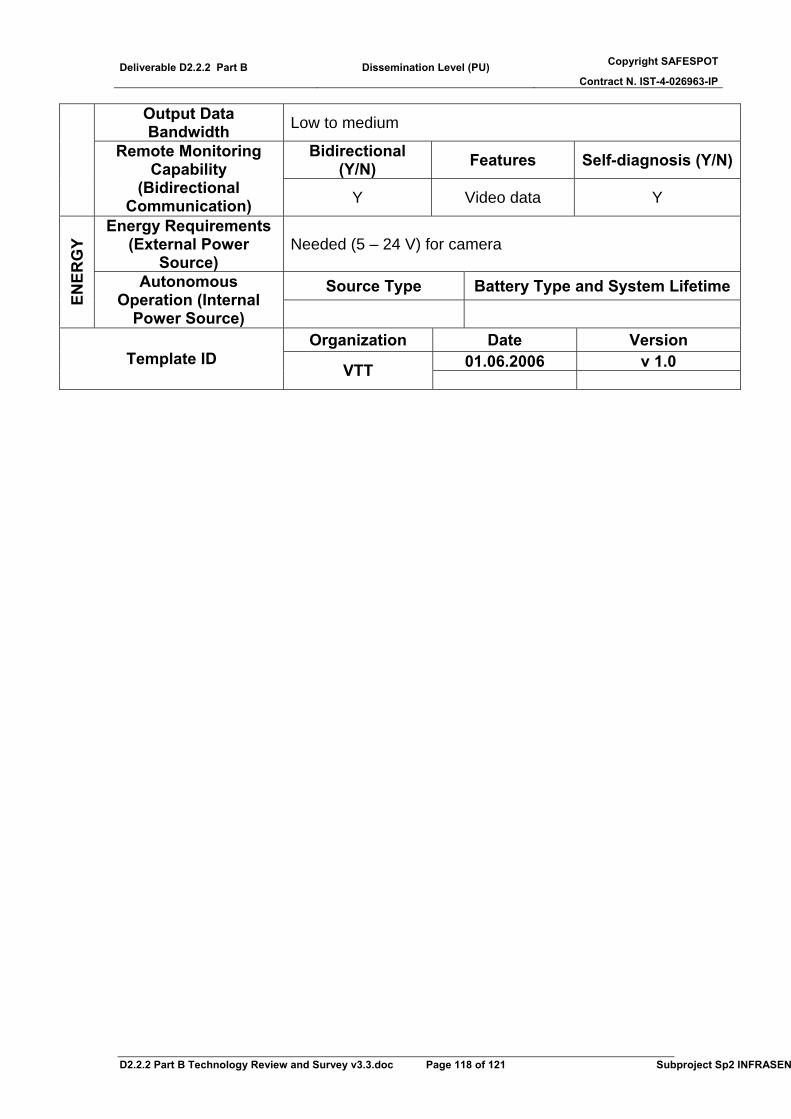
Deliverable D2.2.2 Part B Dissemination Level (PU) Copyright SAFESPOT
Contract N. IST-4-026963-IP
D2.2.2 Part B Technology Review and Survey v3.3.doc Page 118 of 121 Subproject Sp2 INFRASEN
Output Data Bandwidth Low to medium
Bidirectional (Y/N) Features Self-diagnosis (Y/N)Remote Monitoring
Capability (Bidirectional
Communication) Y Video data Y
Energy Requirements (External Power
Source) Needed (5 – 24 V) for camera
Source Type Battery Type and System Lifetime
ENER
GY
Autonomous Operation (Internal
Power Source) Organization Date Version
01.06.2006 v 1.0 Template ID VTT
Deliverable D2.2.2 Part B Dissemination Level (PU) Copyright SAFESPOT
Contract N. IST-4-026963-IP
D2.2.2 Part B Technology Review and Survey v3.3.doc Page 119 of 121 Subproject Sp2 INFRASEN
5. References Video Image Processing K. Araki, T. Hagiwara, Y. Kaneda, K. Murakami, Y. Nagata, “A Simple Approach for Using CCTV Road Images to Provide Poor-Visibility Information”, 85th Transportation Research Board Annual Meeting, Washington D.C., January 2006. V. Cavallo, M. Colomb, J. Dore. “Distance perception of vehicle rear lights in fog”. Hum. Factors 43, 442–451, 2001. N. Hautière, R. Labayrade and D. Aubert. “Real-Time Disparity Contrast Combination for Onboard Estimation of the Visibility Distance”. IEEE Transactions on Intelligent Transportation Systems, 7(2):201-212, June 2006. N. Hautière, J.-P. Tarel, J. Lavenant and D. Aubert. “Automatic Fog Detection and Estimation of Visibility Distance through use of an Onboard Camera”. Machine Vision and Applications Journal, 17(1):8–20, April 2006. L. Wixson, “Illumination Assessment for Vision-Based Traffic Monitoring”, IEEE International Conference on Pattern Recognition, 1996. N. Hautière and D. Aubert. “Contrast Restoration of Foggy Images through use of an Onboard Camera”. In IEEE Conference on Intelligent Transportation Systems (ITSC’05), Vienna, Austria, pages 1090–1095, September 2005. Machine vision based ice and road condition detection Fridthjof, J. 2005. A Device for Detection of Road Surface Condition. Patent number: NO20054213 Aoki, M., 1999, Imaging and analysis of traffic scene. Proceedings of International Conference on Image Processing (ICIP). Vol. 4. Kobe, Japan. 24-28 Oct, pp. 1-5. Siyal, M.Y., Fathy, M. 1999. Image processing techniques for real-time qualitative road traffic data analysis. Journal of Real-Time Imaging. Vol. 5. Issue: 4. pp. 271-278. Magnetic sensors and magnetometer G. Baffet, J. Bertrand et P. Briand, Guidage magnétique des véhicules routiers : Localisation d’une ligne d’aimants Rapport de recherche 32.04.99.104 LRPC d’Angers, March 2005
Deliverable D2.2.2 Part B Dissemination Level (PU) Copyright SAFESPOT
Contract N. IST-4-026963-IP
D2.2.2 Part B Technology Review and Survey v3.3.doc Page 120 of 121 Subproject Sp2 INFRASEN
M. Abaouz, P. Briand et A. Hedhli, Aides à la conduite : localisation par aimants. Utilisation de magnétomètres à capteurs magnétorésistifs. Rapport de recherche LRPC d’Angers, September 2003 C.-Y. Chan, A System Review of Magnetic Sensing System for Ground Vehicle Control and Guidance PATH Research Report UCB-ITS-PRR-2002-20 University of California, Berkeley, May 2002 H. Suzuki, Development of lane marker system in AHSRA, Proceedings of the 6th World Congress on Intelligent Transport Systems, Toronto, Canada, November 1999 A. Andrews, Theoretical and Empirical Analysis of PATH Magnetic Lane Tracking for the Intelligent Vehicle Highway System, PATH Research Report UCB-ITS-PRR-92-9 University of California, Berkeley, August 1992 Applied Physics Systems Model 535 3 Axis Fluxgate Magnetometer System : Operating Manual and Technical Reference Mountain View, August 2000 Y. Crévits, Cours de milieux magnétiques Site ftp :ftp.lyceehainaut. net/pedag/techno/ge_tsi/et/em2-materiaux.pdf S.-S. Ieng, P. Briand et J. Bertrand Deux systèmes d’aide à la conduite basés sur les magnétomètres et les aimants Rapport de recherche LRPC d’Angers, October 2005 RFID “Supply Chain RFID: How It Works and Why It Pays”, Intermetec White Paper, Corporate Headquarters, 6001 36th Avenue West, Everett, Washington 98203 “Introduction To RFID Technology”, Application Note, NPO : 00117/03 : TAGxx.MUTx/00, CAEN Technologies, Inc.321 Port Richmond Avenue, Staten Island, 10302, New York, USA “Sécurisation de la conduite par communication véhicule infrastructure à base de transpondeurs », Patrick Plainchault, Thesis Report, France, 2005. “Les transpondeurs et leurs applications“, Jean Bertrand, Technical Report, Laboratoire Régional des Ponts et Chaussées d’Angers, France, 2000. “Development of Multivalent Passive Radiowave Lane Markers”, Mizuguchi Satoshi, Oda, Masakazu, Handa, Satoru, Onoyama, Masaru, Proceedings of ITS World Congress, 2001 “13.56 MHz Transponders Use for Vehicles Infrastructure Communication”, Patrick Plainchault, Jacques Ehrlich, Thierry Bosch, Samuel Foret, ITSC’2003 IEEE Intelligent Transportation System Council, Shangaï, October 2003. Microsensors and sensor networks
Deliverable D2.2.2 Part B Dissemination Level (PU) Copyright SAFESPOT
Contract N. IST-4-026963-IP
D2.2.2 Part B Technology Review and Survey v3.3.doc Page 121 of 121 Subproject Sp2 INFRASEN
European Patent Office – Padulosi Ugo – Jet Research srl, “Apparatus to monitor traffic”, published on 25/06/2003, http://v3.espacenet.com/textdoc?DB=EPODOC&IDX=EP1321915&RPN=EP1321915&DOC=cca34af198500ac37b3bf3af7731d8a84f&QPN=EP1321915. Jiagen Ding, Sing Yiu Cheung, Chin-Woo Tan and Pravin Varaiya, “Signal Processing of Sensor Node Data for Vehicle Detection”, 7th International IEEE Conference on Intelligent Transportation Systems (ITSC), October 2004, http://path.berkeley.edu/~singyiu/vehicledetection/publications/documents/ITSC_2004_0013_MoC3.4.pdf Jiagen(Jason) Ding (University of California at Berkeley), “Vehicle Detection by Sensor Network Nodes”, Master of Science in Electrical Engineering and Computer Science, Autumn 2003, http://path.berkeley.edu/~singyiu/vehicledetection/publications/documents/03Fall_jiagenThesis_EE.pdf. Mobility LAB – Carolina Crespolini, “SMACS informazione a reazione immediata”, no. 4 June-July 2005, http://www.mobilitylab.it/pdf/ML_04_P30_P31.pdf. Sinem Coleri Ergen, Pravin Varaiya, “PEDAMACS: Power Efficient and Delay Aware Medium Access Protocol for Sensor Networks”, July 2004, http://path.berkeley.edu/~singyiu/vehicledetection/publications/documents/030714_pedamacs.pdf. Sinem Coleri Ergen, Pravin Varaiya, “PEDAMACS: Power Efficient and Delay Aware Medium Access Protocol for Sensor Networks”, March 2005, http://www.eecs.berkeley.edu/~csinem/academic/publications/pedamacs.pdf. Sinem Coleri, “PEDAMACS: Power Efficient and Delay Aware Medium Access Protocol for Sensor Networks”, Master of Science in Electrical Engineering and Computer Science, Autumn 2002, http://www.eecs.berkeley.edu/~csinem/academic/publications/master.pdf. Yiu Cheung, Sinem Coleri, Baris Dundar, Sumitra Ganesh, Chin-Woo Tan and Pravin Varaiya (University of California, Berkeley), “Traffic measurement and vehicle classification with a single magnetic sensor”, May 2004, http://paleale.eecs.berkeley.edu/~varaiya/papers_ps.dir/TrafficMeasurementAndClassification.pdf.