Embed Size (px)
Citation preview
Carbon Accounting Research
Qingliang Tang
Scientific Evidence of global warming
Damage of global warming
Kyoto Protocol
Cost of carbon emission control
Clean energy: e.g. Solar power generator, wind power, etc.
Emission Trading Scheme
The role of Carbon accounting
This is summary of review of carbon accounting
research in the recent literature.
The topics of the carbon accounting research include:
Carbon disclosure,
Carbon performance,
Carbon tax,
Corporate governance and carbon activity,
Cultural factors and carbon transparency
propensity,
Carbon management systems,
Carbon assurance and carbon auditing
The results of the review suggest carbon accounting
research is an extension of environmental or
sustainability study.
But carbon accounting is a unique dimension, so
should be separately studied, rather than combined
in a basket in sustainability research.
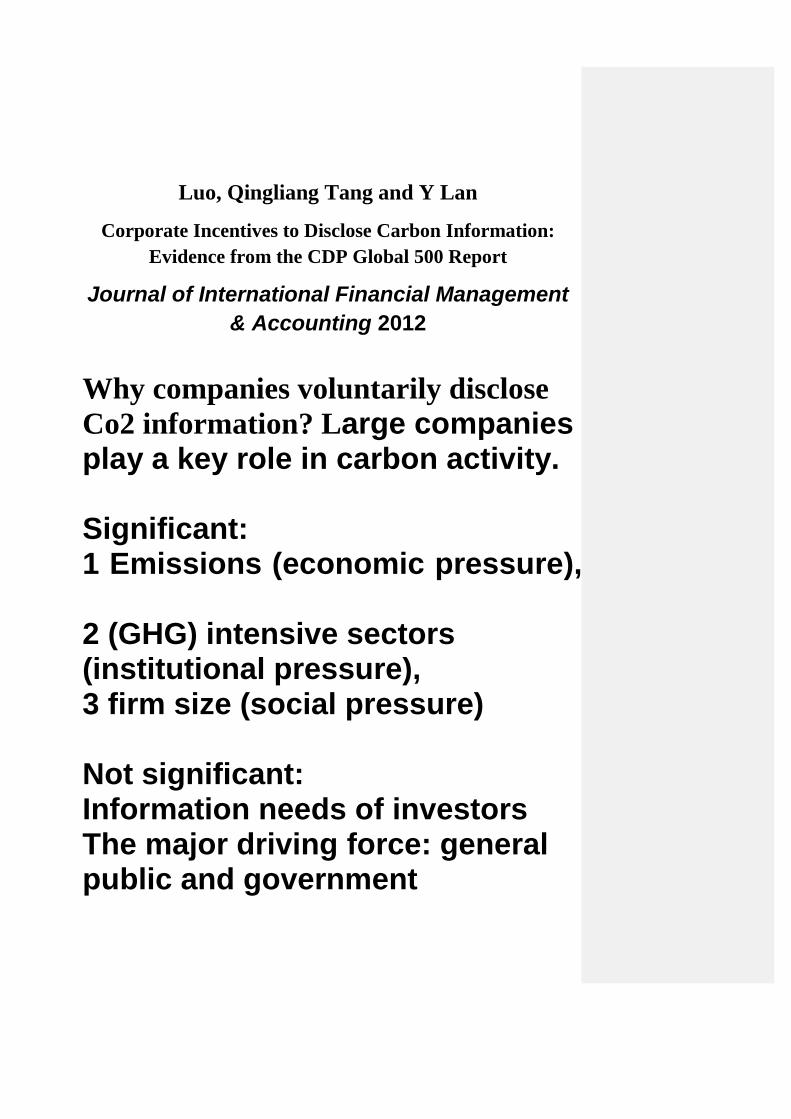
Luo, Qingliang Tang and Y Lan
Corporate Incentives to Disclose Carbon Information:
Evidence from the CDP Global 500 Report
Journal of International Financial Management
& Accounting 2012
Why companies voluntarily disclose
Co2 information? Large companies play a key role in carbon activity. Significant: 1 Emissions (economic pressure), 2 (GHG) intensive sectors (institutional pressure), 3 firm size (social pressure) Not significant: Information needs of investors The major driving force: general public and government
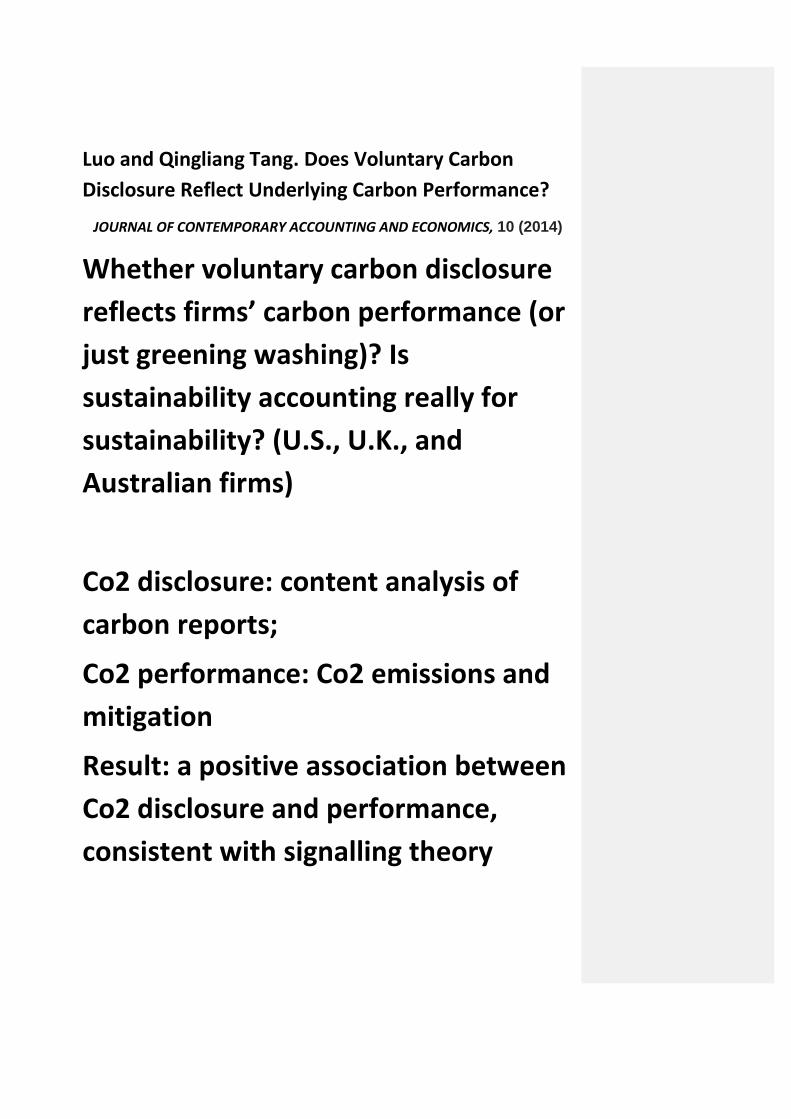
Luo and Qingliang Tang. Does Voluntary Carbon
Disclosure Reflect Underlying Carbon Performance?
JOURNAL OF CONTEMPORARY ACCOUNTING AND ECONOMICS, 10 (2014)
Whether voluntary carbon disclosure
reflects firms’ carbon performance (or
just greening washing)? Is
sustainability accounting really for
sustainability? (U.S., U.K., and
Australian firms)
Co2 disclosure: content analysis of
carbon reports;
Co2 performance: Co2 emissions and
mitigation
Result: a positive association between
Co2 disclosure and performance,
consistent with signalling theory
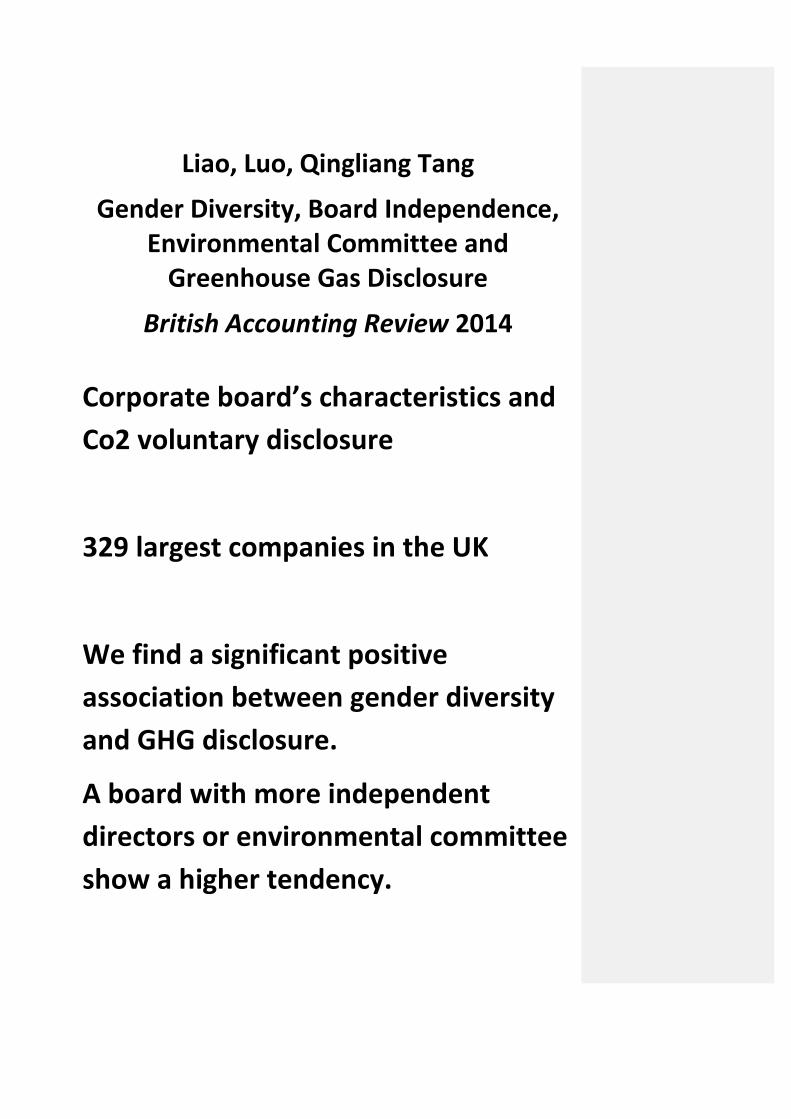
Liao, Luo, Qingliang Tang
Gender Diversity, Board Independence, Environmental Committee and
Greenhouse Gas Disclosure
British Accounting Review 2014
Corporate board’s characteristics and
Co2 voluntary disclosure
329 largest companies in the UK
We find a significant positive
association between gender diversity
and GHG disclosure.
A board with more independent
directors or environmental committee
show a higher tendency.
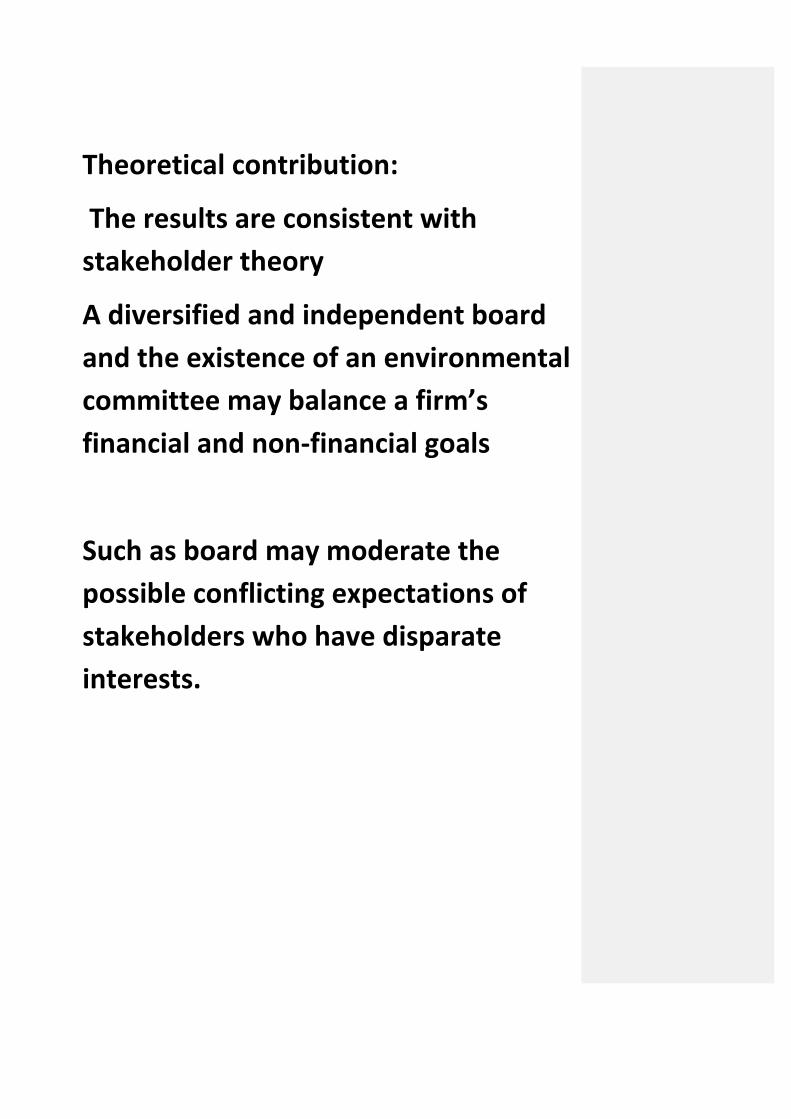
Theoretical contribution:
The results are consistent with
stakeholder theory
A diversified and independent board
and the existence of an environmental
committee may balance a firm’s
financial and non-financial goals
Such as board may moderate the
possible conflicting expectations of
stakeholders who have disparate
interests.
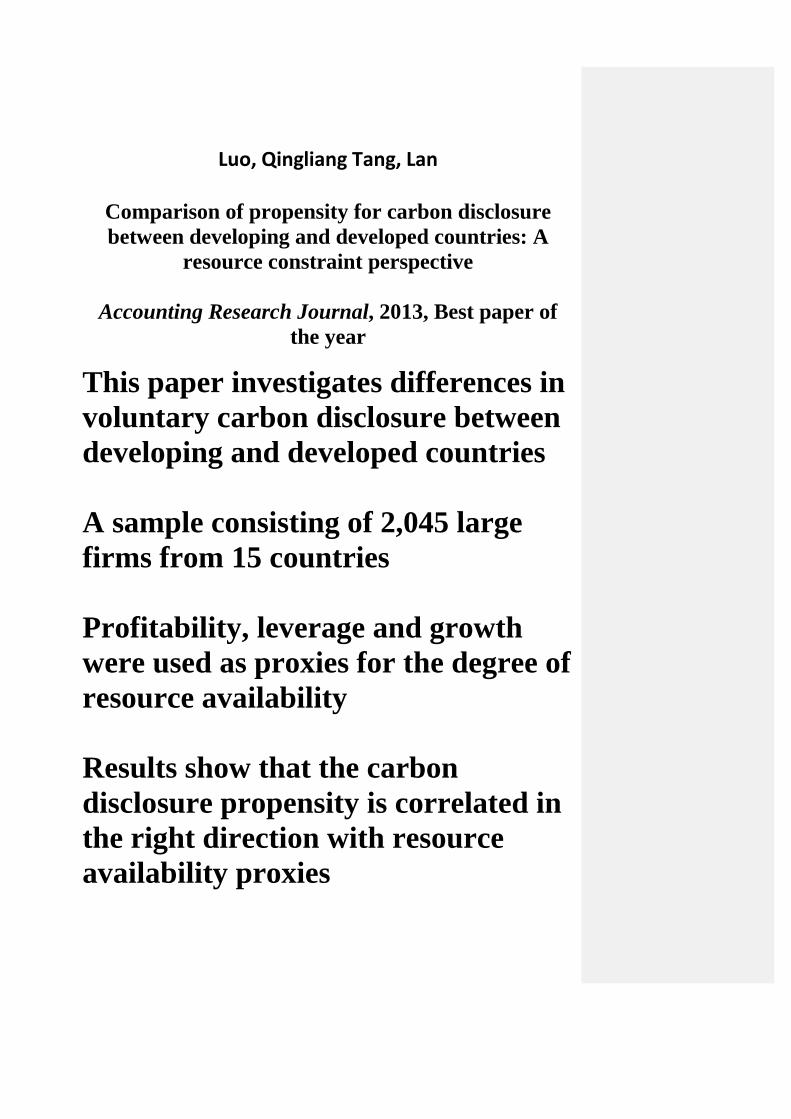
Luo, Qingliang Tang, Lan
Comparison of propensity for carbon disclosure
between developing and developed countries: A
resource constraint perspective
Accounting Research Journal, 2013, Best paper of
the year
This paper investigates differences in
voluntary carbon disclosure between
developing and developed countries
A sample consisting of 2,045 large
firms from 15 countries
Profitability, leverage and growth
were used as proxies for the degree of
resource availability
Results show that the carbon
disclosure propensity is correlated in
the right direction with resource
availability proxies
This relationship is stronger in
developing nations, suggesting that
the shortage of resources is one
reason for the lack of commitment to
carbon mitigation and disclosure in
these countries.
So resource restriction provides a
complementary explanation – largely
ignored in the existing literature – for
variation in the carbon-disclosure
propensity of firms.
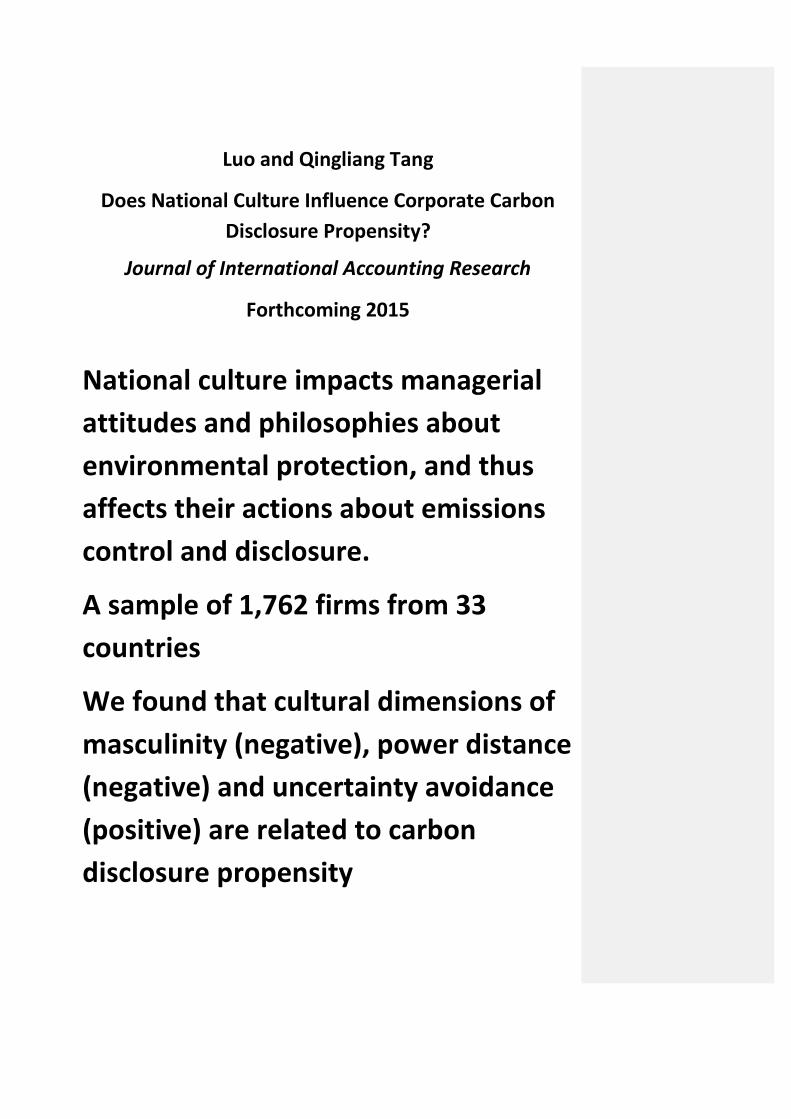
Luo and Qingliang Tang
Does National Culture Influence Corporate Carbon
Disclosure Propensity?
Journal of International Accounting Research
Forthcoming 2015
National culture impacts managerial
attitudes and philosophies about
environmental protection, and thus
affects their actions about emissions
control and disclosure.
A sample of 1,762 firms from 33
countries
We found that cultural dimensions of
masculinity (negative), power distance
(negative) and uncertainty avoidance
(positive) are related to carbon
disclosure propensity
This is regardless of whether Hofstede
or Global Leadership and
Organizational Behaviour
Effectiveness (GLOBE) culture
measures are used.
Our results also show individualism
and long-term orientation has
significant impact under Hofstede
measure though not under GLOBE
measure.
In addition, our evidence implies that
national culture may moderate the
effect of carbon control mechanisms,
such as emissions trading schemes.
Finally, the empirical evidence
indicates the impact of culture is not
sensitive to national wealth and
industry membership.
Theoretical contribution
The findings suggest culture exerts
incremental influences beyond
economic and regulatory incentives.
The result is useful in negotiation for
an international climate agreement
that is more acceptable to societies
with disparate cultural backgrounds.
Luo and Qingliang Tang. Carbon Tax, Corporate
Carbon Profile and Financial Return. Pacific Accounting
Review 2014, Volume 26, Issue 3
The impact of the proposed carbon
tax (big event in history) on the
financial market return of Australian
firms
We utilise the event-study method.
Sample includes 336 firm-event
observations.
The proposed tax has negative
impact on abnormal returns,
particularly for the materials,
industrial and financial sectors.
Scope 1 emission is significantly
associated with abnormal returns,
but not Scope 2.
He, Qingliang Tang, Wang. Carbon disclosure,
carbon performance, and cost of capital, China
Journal of Accounting Studies, 2013
Data: S&P 500 firms (CDP) in 2010.
The cost of capital is negatively
associated with carbon disclosure.
This relationship is weaker for firms
with good carbon performance.
The results contrast with Matsumura et
al (2014) that find that, for every
additional thousand metric tons of Co2,
firm value decreases by $212,000 for US
firm in 2006-2008.
Matsumura, Ella Mae and Rachna Prakash, and Sandra C. Vera-Munoz. Firm-
Value Effects of Carbon Emissions and Carbon Disclosures. The Accounting
Review Vol. 89, No. 2 March 2014 pp. 695–724.
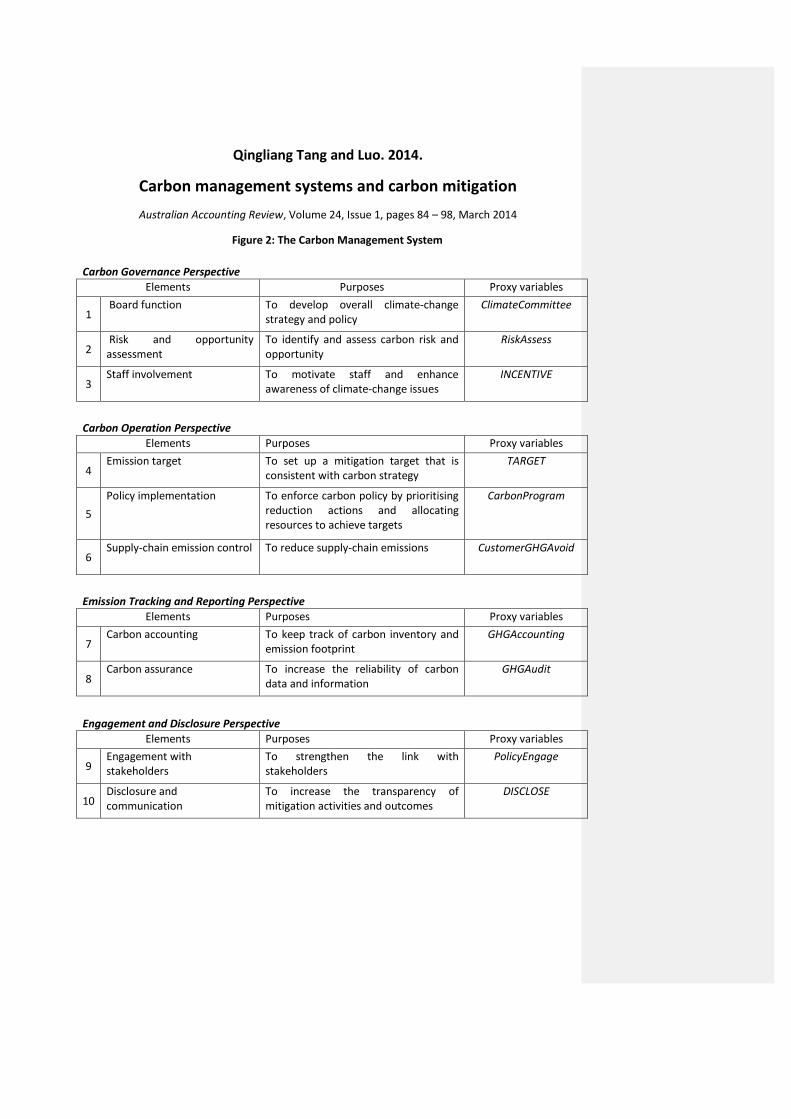
Qingliang Tang and Luo. 2014.
Carbon management systems and carbon mitigation
Australian Accounting Review, Volume 24, Issue 1, pages 84 – 98, March 2014
Figure 2: The Carbon Management System
Carbon Governance Perspective
Elements Purposes Proxy variables
1 Board function To develop overall climate-change
strategy and policy ClimateCommittee
2 Risk and opportunity assessment
To identify and assess carbon risk and opportunity
RiskAssess
3 Staff involvement To motivate staff and enhance
awareness of climate-change issues INCENTIVE
Carbon Operation Perspective
Elements Purposes Proxy variables
4 Emission target To set up a mitigation target that is
consistent with carbon strategy TARGET
5
Policy implementation To enforce carbon policy by prioritising reduction actions and allocating resources to achieve targets
CarbonProgram
6 Supply-chain emission control To reduce supply-chain emissions CustomerGHGAvoid
Emission Tracking and Reporting Perspective
Elements Purposes Proxy variables
7 Carbon accounting To keep track of carbon inventory and
emission footprint GHGAccounting
8 Carbon assurance To increase the reliability of carbon
data and information GHGAudit
Engagement and Disclosure Perspective
Elements Purposes Proxy variables
9 Engagement with stakeholders
To strengthen the link with stakeholders
PolicyEngage
10 Disclosure and communication
To increase the transparency of mitigation activities and outcomes
DISCLOSE
Qingliang Tang
Institutional influence and the demand for carbon
auditing: Chinese experience (working paper)
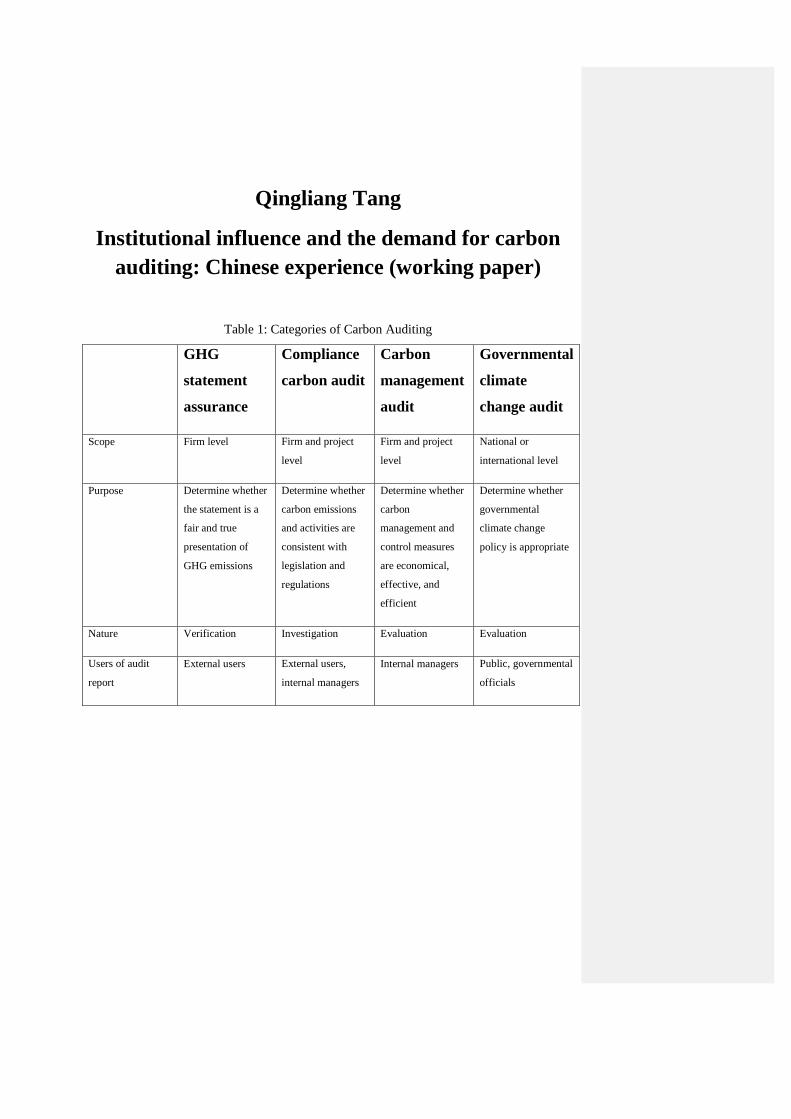
Table 1: Categories of Carbon Auditing
GHG
statement
assurance
Compliance
carbon audit
Carbon
management
audit
Governmental
climate
change audit
Scope Firm level Firm and project
level
Firm and project
level
National or
international level
Purpose Determine whether
the statement is a
fair and true
presentation of
GHG emissions
Determine whether
carbon emissions
and activities are
consistent with
legislation and
regulations
Determine whether
carbon
management and
control measures
are economical,
effective, and
efficient
Determine whether
governmental
climate change
policy is appropriate
Nature Verification Investigation Evaluation Evaluation
Users of audit
report
External users External users,
internal managers
Internal managers Public, governmental
officials
Why is a significant increase in
demand for carbon auditing (2009 -
2013)?
A change in economic development
model, and the institution of business
An explosion of carbon and energy
laws and regulations prior to the audit
An increasing governmental greening
investment
Institutional changes make carbon
auditing from rhetoric to practice
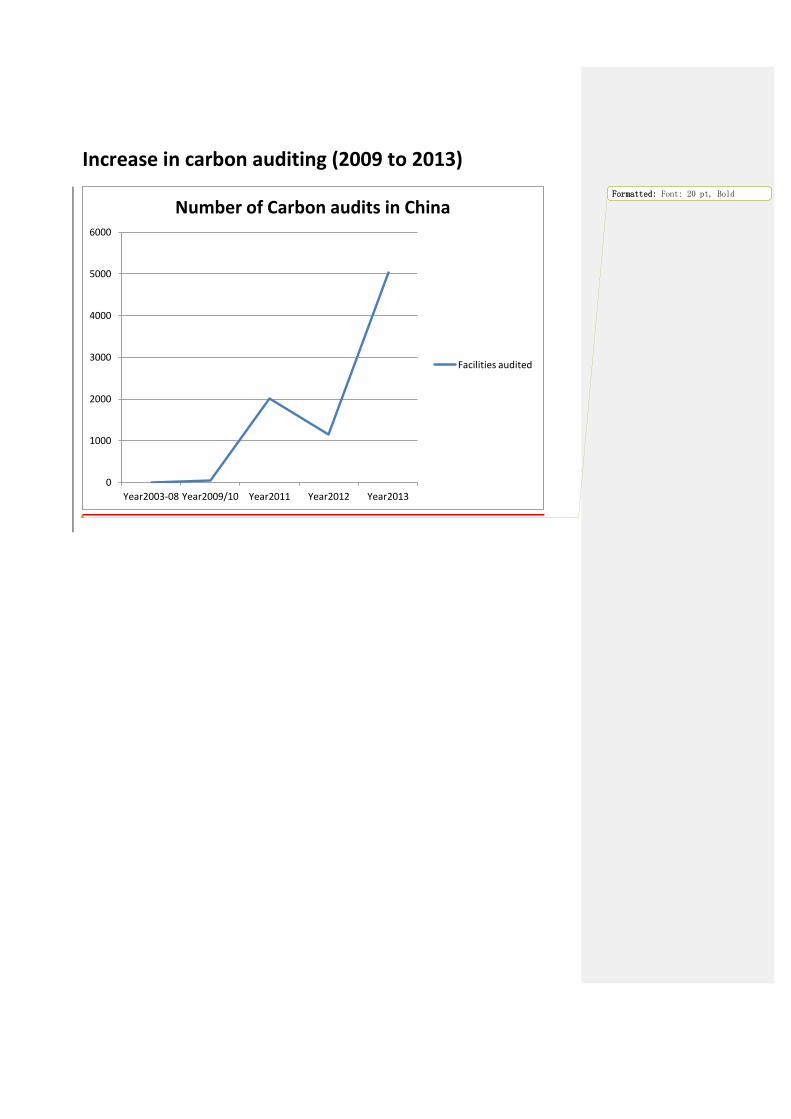
Increase in carbon auditing (2009 to 2013)
0
1000
2000
3000
4000
5000
6000
Year2003-08 Year2009/10 Year2011 Year2012 Year2013
Number of Carbon audits in China
Facilities audited
Formatted: Font: 20 pt, Bold
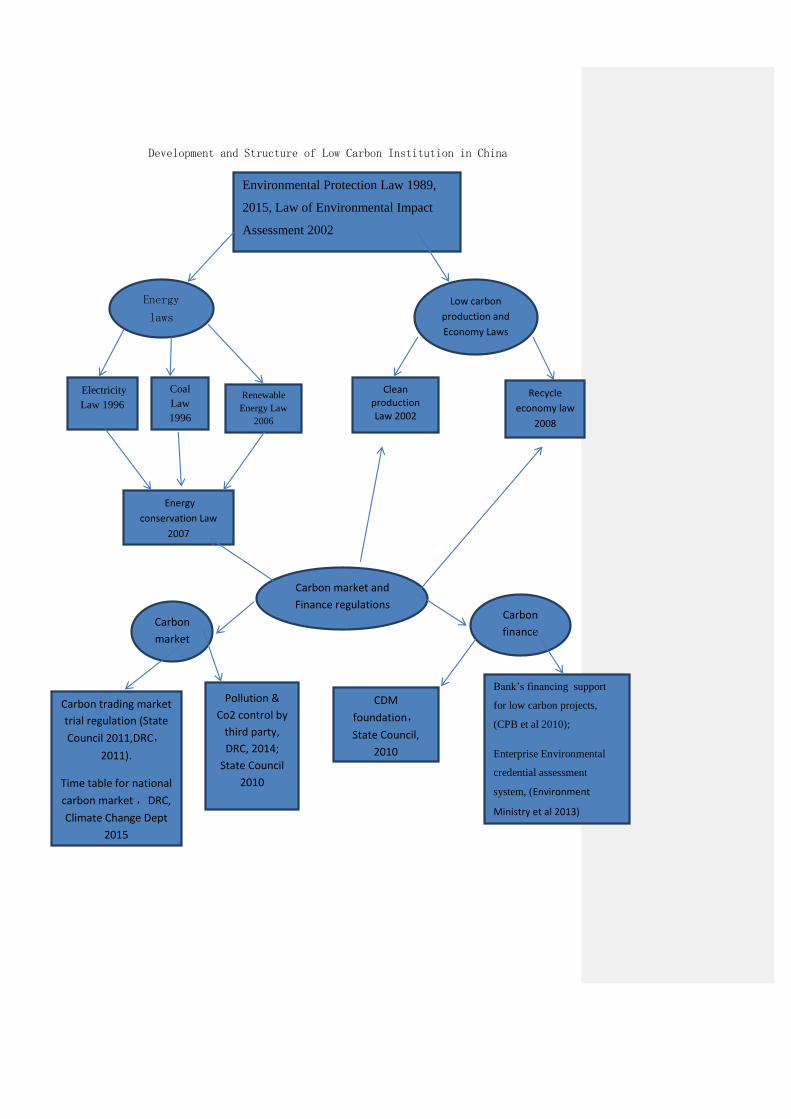
Development and Structure of Low Carbon Institution in China
Environmental Protection Law 1989,
2015, Law of Environmental Impact
Assessment 2002
Electricity
Law 1996
Coal
Law
1996
Renewable
Energy Law
2006
Energy
laws
Low carbon
production and
Economy Laws
Clean production Law 2002
Recycle
economy law
2008
Energy
conservation Law
2007
Carbon market and
Finance regulations
CDM
foundation,
State Council,
2010
Carbon trading market
trial regulation (State
Council 2011,DRC,
2011).
Time table for national
carbon market ,DRC,
Climate Change Dept
2015
Bank’s financing support
for low carbon projects,
(CPB et al 2010);
Enterprise Environmental
credential assessment
system, (Environment
Ministry et al 2013)
Carbon
market
Carbon
finance
Pollution &
Co2 control by
third party,
DRC, 2014;
State Council
2010
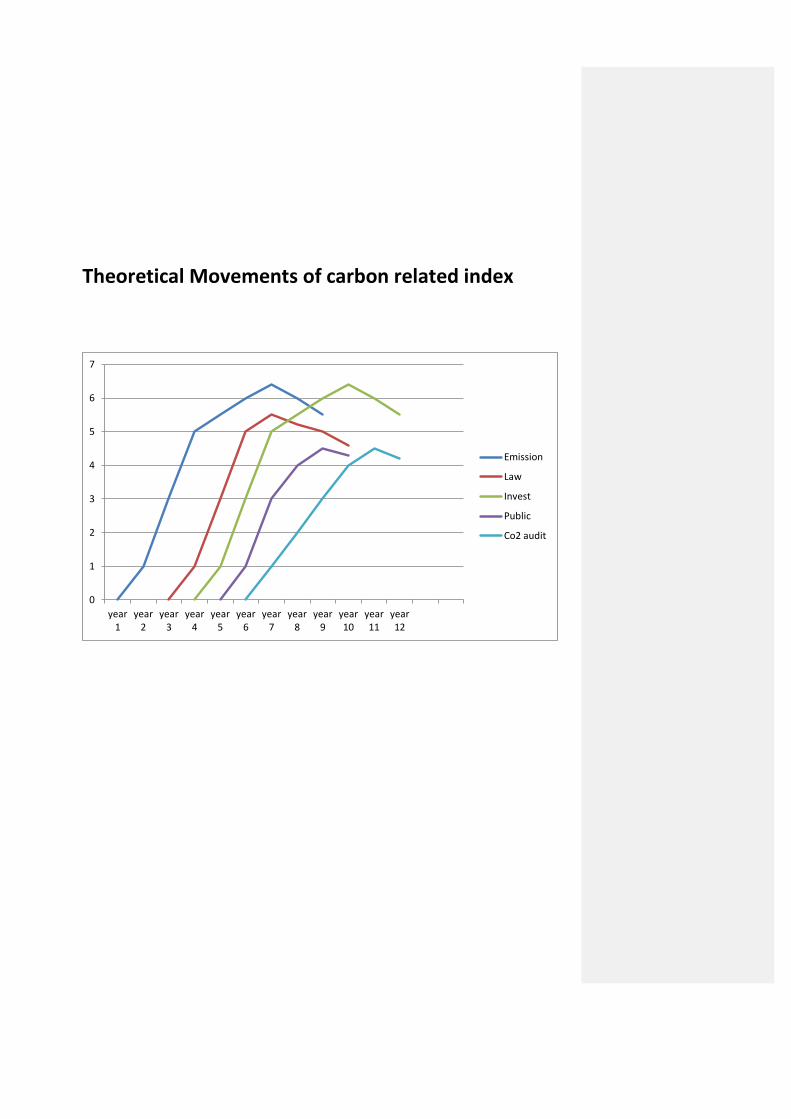
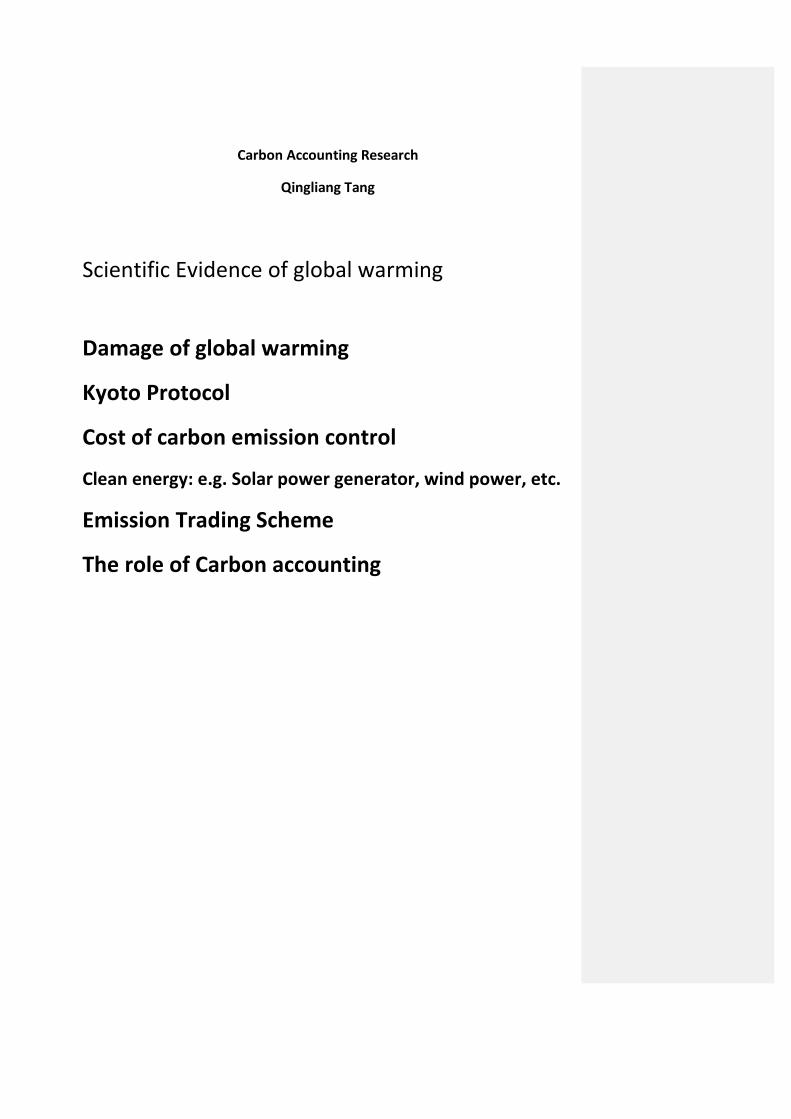
Theoretical Movements of carbon related index
0
1
2
3
4
5
6
7
year 1
year 2
year 3
year 4
year 5
year 6
year 7
year 8
year 9
year 10
year 11
year 12
Emission
Law
Invest
Public
Co2 audit
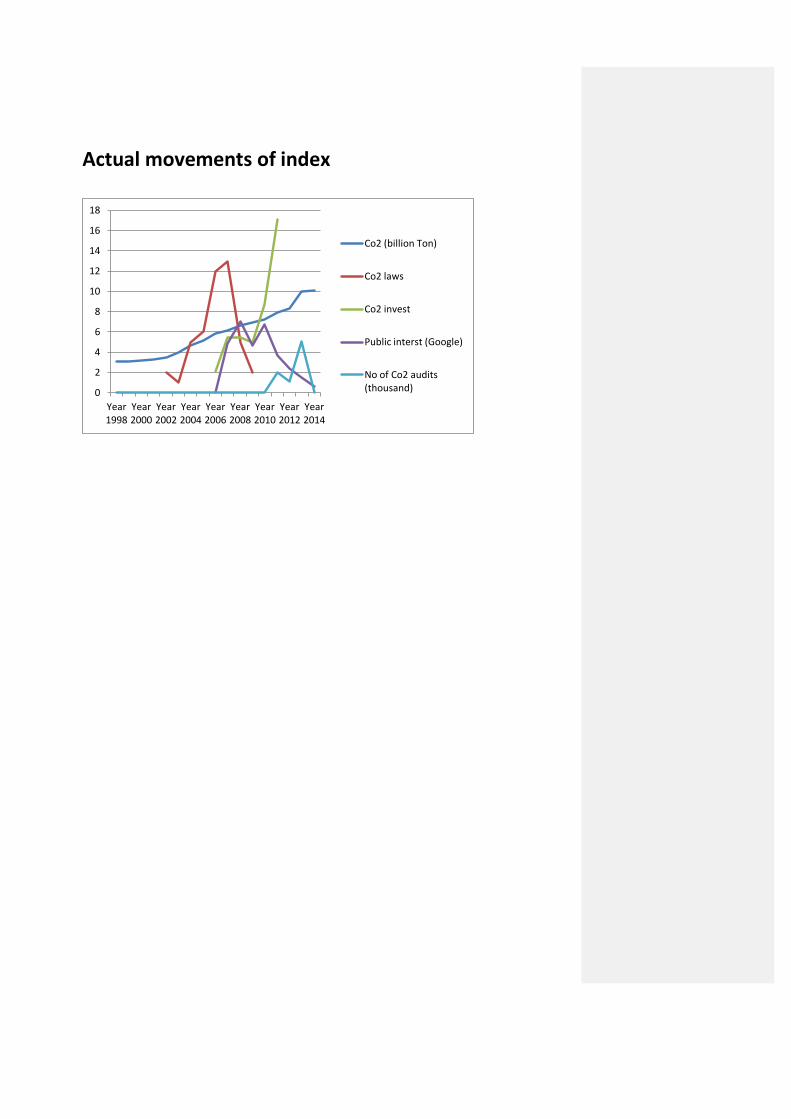
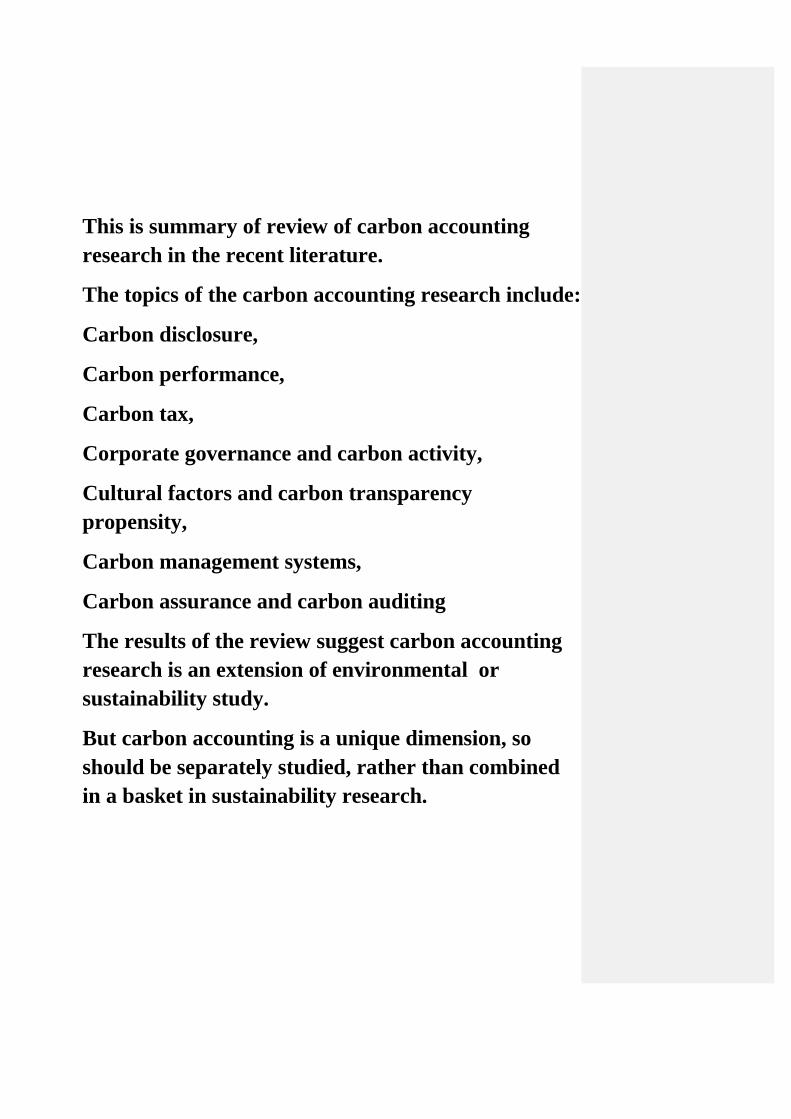
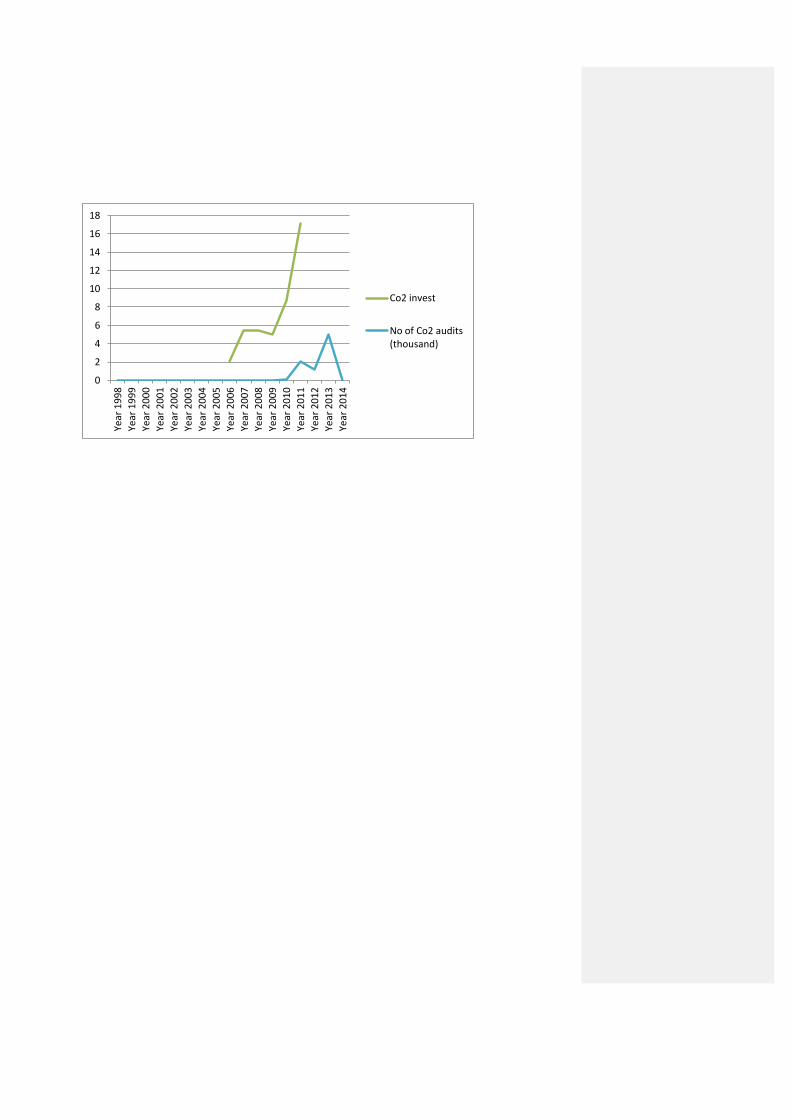
Actual movements of index
0
2
4
6
8
10
12
14
16
18
Year 1998
Year 2000
Year 2002
Year 2004
Year 2006
Year 2008
Year 2010
Year 2012
Year 2014
Co2 (billion Ton)
Co2 laws
Co2 invest
Public interst (Google)
No of Co2 audits (thousand)
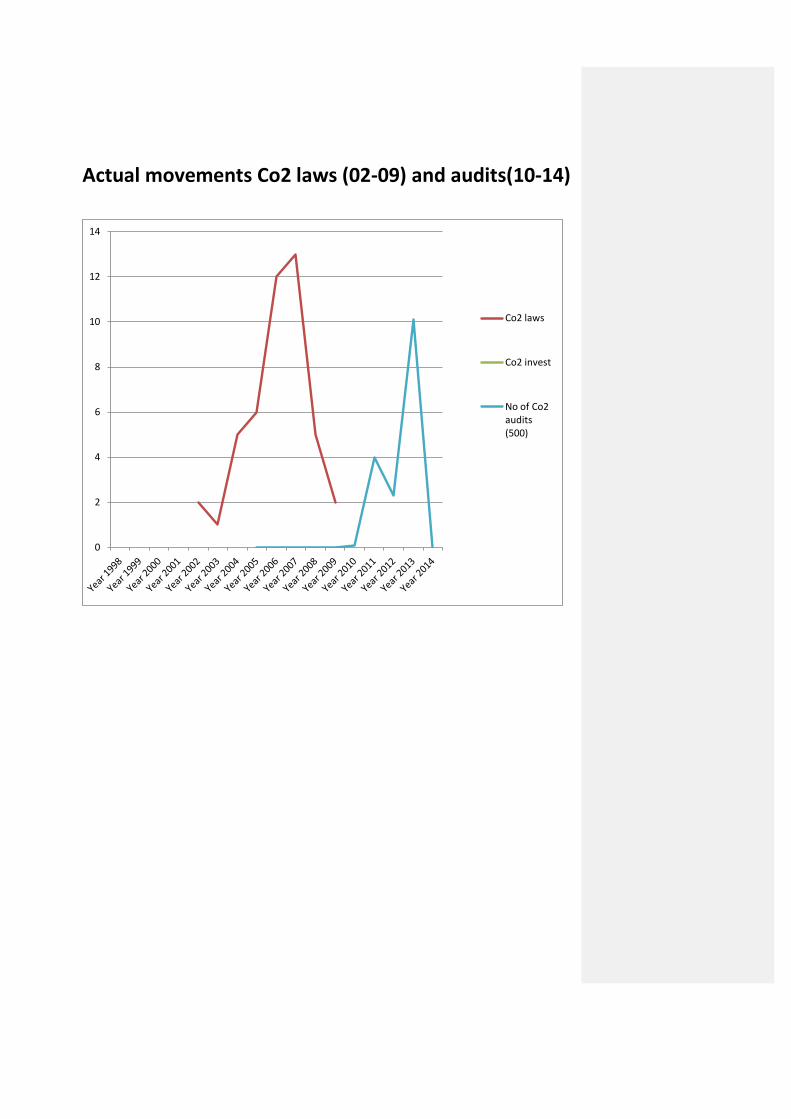
Actual movements Co2 laws (02-09) and audits(10-14)
0
2
4
6
8
10
12
14
Co2 laws
Co2 invest
No of Co2 audits (500)
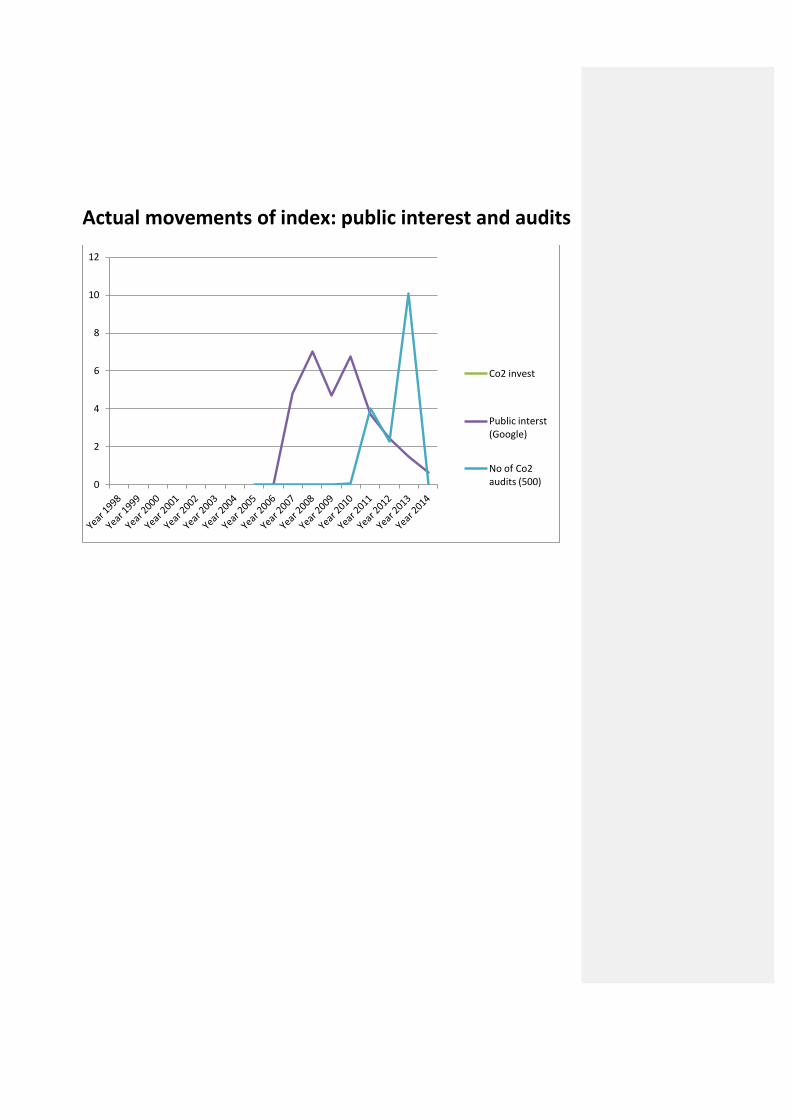
Actual movements of index: public interest and audits
0
2
4
6
8
10
12
Co2 invest
Public interst (Google)
No of Co2 audits (500)
0
2
4
6
8
10
12
14
16
18
Year
19
98
Year
19
99
Year
20
00
Year
20
01
Year
20
02
Year
20
03
Year
20
04
Year
20
05
Year
20
06
Year
20
07
Year
20
08
Year
20
09
Year
20
10
Year
20
11
Year
20
12
Year
20
13
Year
20
14
Co2 invest
No of Co2 audits (thousand)
Pacific Accounting Review, 2014, Volume 26, Issue 3
Carbon Tax, Corporate Carbon Profile and Financial Return
Le Luo, University of Newcastle
Qingliang Tang, University of Western Sydney
Abstract
Purpose: This study investigates the impact of the proposed carbon tax on the financial market
return of Australian firms. We also consider the differential tax effect on individual firms with
different carbon profiles, including factors such as emissions costs, carbon disclosure and climate-
change policies.
Design/methodology/approach: Utilising the event-study method, we examine the market reaction
to seven key carbon legislative information events that occurred from February 2011 to November
2011. Our sample includes 48 different firms whose emissions-related data are available from
Carbon Disclosure Project reports; thus, 336 firm-event observations are employed for our cross-
sectional analysis.
Findings: The paper documents evidence that the proposed tax has an overall negative impact on
shareholder wealth as measured by abnormal returns. The negative impact varies across sectors,
with the most significant effect found in the materials, industrial and financial sectors. We also
found that a firm’s direct carbon exposure (as measured by Scope 1 emissions) is significantly
associated with abnormal returns, whereas the indirect exposure (as measured by Scope 2 emissions)
is not, because Scope 2 emissions are not covered by the tax. In addition, our findings suggest that
the information content of the events is more notable during the early stages of the development of
the carbon tax.
Research limitations/implications: Our sample is restricted to the largest firms with relevant carbon
profile information. Thus, caution should be exercised when generalising our inferences.
Practical implications: The introduction of the carbon tax was largely unexpected and most firms
were unprepared for it; thus, their carbon policy appears inadequate and does not impress investors.
An understanding of how the carbon tax affects shareholder value and welfare will encourage
management to take proactive actions to mitigate the compliance costs of carbon legislation.
Originality/Value: The enactment of the Australian carbon tax perhaps represents one of the biggest
social and economic restructuring events in the country’s history. Our results offer initial insight into
its impact and suggest that investors would penalise firms with heavy direct operational emissions.
In addition, Australian corporate carbon policy seems inadequate, so does not reverse the negative
effect of the tax on the value of a firm.
Keywords: carbon tax, corporate carbon profile, greenhouse gas (GHG) emissions, Carbon Disclosure
Project (CDP), carbon reduction target
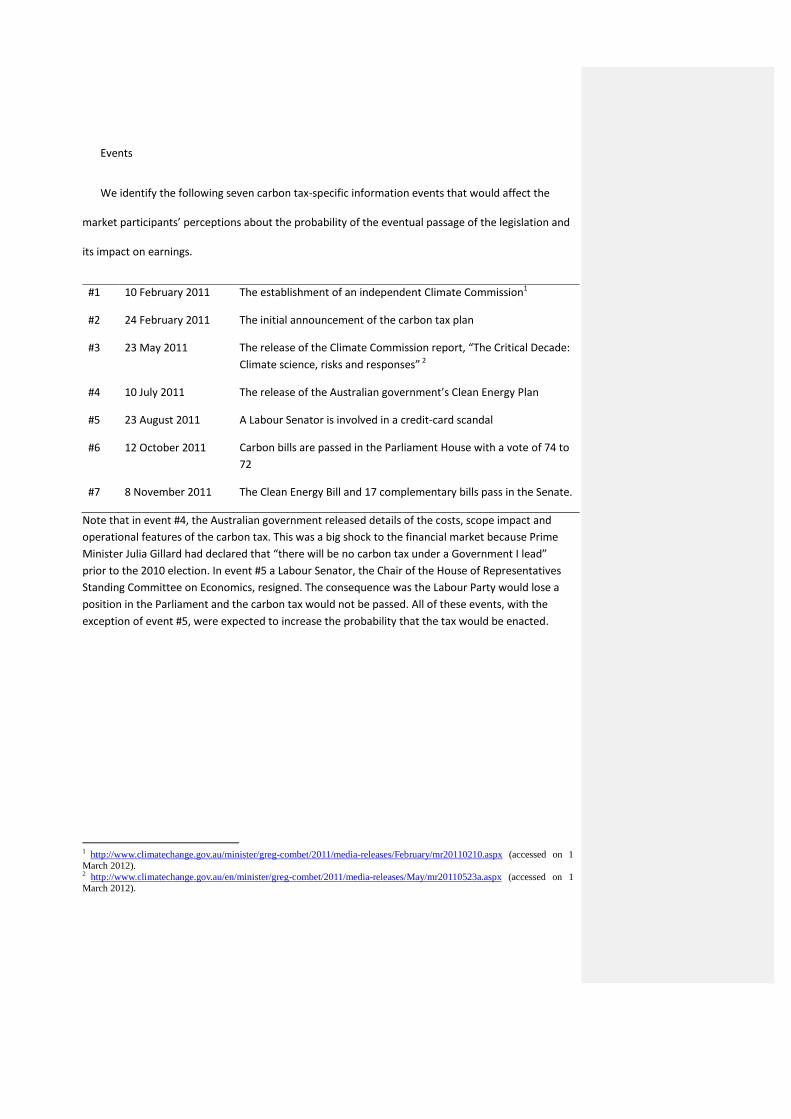
Events
We identify the following seven carbon tax-specific information events that would affect the
market participants’ perceptions about the probability of the eventual passage of the legislation and
its impact on earnings.
#1 10 February 2011 The establishment of an independent Climate Commission1
#2 24 February 2011 The initial announcement of the carbon tax plan
#3 23 May 2011 The release of the Climate Commission report, “The Critical Decade:
Climate science, risks and responses” 2
#4 10 July 2011 The release of the Australian government’s Clean Energy Plan
#5 23 August 2011 A Labour Senator is involved in a credit-card scandal
#6 12 October 2011 Carbon bills are passed in the Parliament House with a vote of 74 to
72
#7 8 November 2011 The Clean Energy Bill and 17 complementary bills pass in the Senate.
Note that in event #4, the Australian government released details of the costs, scope impact and
operational features of the carbon tax. This was a big shock to the financial market because Prime
Minister Julia Gillard had declared that “there will be no carbon tax under a Government I lead”
prior to the 2010 election. In event #5 a Labour Senator, the Chair of the House of Representatives
Standing Committee on Economics, resigned. The consequence was the Labour Party would lose a
position in the Parliament and the carbon tax would not be passed. All of these events, with the
exception of event #5, were expected to increase the probability that the tax would be enacted.
1 http://www.climatechange.gov.au/minister/greg-combet/2011/media-releases/February/mr20110210.aspx (accessed on 1
March 2012). 2 http://www.climatechange.gov.au/en/minister/greg-combet/2011/media-releases/May/mr20110523a.aspx (accessed on 1
March 2012).

Our test model is as follows:
(1) where
= return for the portfolio of firms for day t
= dummy variable that equals 1 for each event window (3-day window)
and 0 otherwise.
= return on an equal-weighted New Zealand 50 market index for day t
= return on an equal-weighted Tokyo market index for day t
= return on an equal-weighted Standard & Poor’s (S&P) 500 index for day t
= return on an equal-weighted FTSE 100 index for day t
= return on an equal-weighted Chinese A share market index for day t
= return on an equal-weighted S&P 500 index for day t-1
= return on an equal-weighted FTSE 100 index for day t-1
k = the kth event, k = 1, … , 7
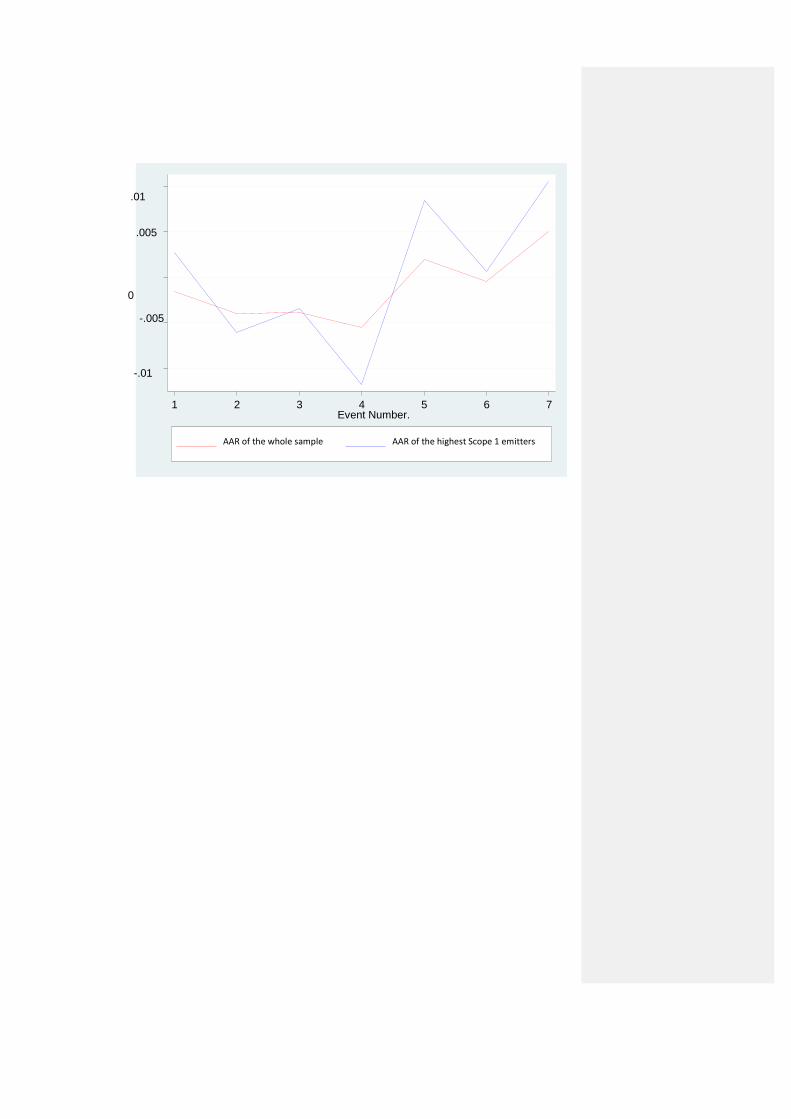
-.01
-.005
0
.005
.01
1 2 3 4 5 6 7 Event Number.
AAR of the whole sample AAR of the highest Scope 1 emitters