Embed Size (px)
Citation preview

IDENTIFYING OPPORTUNITIES FOR LOW CARBON
EMISSION ZONES IN SOUTH AFRICA: A CASE
STUDY OF DURBAN
by
MERYL JAGARNATH
209509503
Submitted in fulfilment of the academic requirements for the degree of
Master of Science in Environmental Science in the
School of Agriculture, Earth, and Environmental Sciences, in the
College of Agriculture, Engineering and Science,
University of KwaZulu-Natal,
Westville campus.
December 2015
Supervisor: Dr Tirusha Thambiran
Co-Supervisor: Dr Michael Gebreslasie

i
ABSTRACT There is increasing attention on emissions reduction strategies that also deliver
developmental co-benefits (i.e. low carbon development), especially in developing cities, thus
research on the links between emissions, spatial planning, and urban development are
emerging. The majority of studies on emissions inventories lack integration with strategic
spatial planning, which is critical for place-based mitigation strategies. In response to this
gap, a bottom-up methodological framework for the spatial representation of emissions was
developed, based on the consumption perspective, to identify high emission zones and assess
their urban development goals. The framework was applied to Durban (eThekwini
Municipality), which aims to become a low carbon city and is also representative of a
developing city.
The total emissions calculated for Durban in 2013, was 12 219 118 tCO2e, of which the road
transport sector contributed the most to total emissions (43%), followed by industry
electricity consumption (30%) A high emissions zone was identified along the coast, from
Durban south, through the central business district (CBD) and the north to Umhlanga.
Specifically, the areas with the highest emissions activities are from energy-intensive
manufacturing industries in south Durban, and road transport, specifically private passenger
cars, in central and north Durban. Furthermore, the highest emitting area, Prospecton, (767
172 tCO2e), emitted ~ 6.5 times more than the Durban ward average (118 632 tCO2e).
Furthermore, Prospecton is highlighted for further port, fuel, chemical and petrochemicals,
transport equipment manufacturing, and logistics development. The lowest emissions were
from the rural edges, where the neighbourhoods emitted ~11 times less than the Durban
average, which are also the areas with the most developmental needs, therefore highlighting
the spatial disparity in emissions contribution within the city.
A three-pronged approach of specific mitigation measures are recommended to
simultaneously reduce emissions and achieve development: (i) manufacturing industries in
south Durban must invest in carbon offset projects in the rural periphery to ensure that the
development of those areas are not associated with increasing emissions, (ii) the
implementation of car-free roads in central and north Durban to reduce distances travelled by
private cars and to also ensure the widespread use of the Integrated Rapid Public Transport

ii
Network and other eco-mobility options, (iii) limit industrial expansion in south Durban and
commercial and residential developments in north Durban which do not have a low carbon
plan. Thus, the spatially-resolved emissions inventory generated emissions profiles which
identified suitable mitigation strategies to assist with the transition to a low carbon city.

iii
PREFACE
This thesis was completed at the School of Agriculture, Earth and Environmental Sciences,
University of KwaZulu-Natal, Westville campus, between March 2014 and December 2015
under the supervision of Dr Tirusha Thambiran and Dr Michael Gebreslasie.
The work contained in this thesis is my own, and where the work of other authors has been
used, it has been acknowledged accordingly. This dissertation has not been submitted in any
form for any degree or diploma to any tertiary institution.
Meryl Jagarnath

iv
DECLARATION 1 - PLAGIARISM
I, Meryl Jagarnath, declare that
1. The research reported in this thesis, except where otherwise indicated, is my
original research.
2. This thesis has not been submitted for any degree or examination at any other
university.
3. This thesis does not contain other persons’ data, pictures, graphs or other
information, unless specifically acknowledged as being sourced from other
persons.
4. This thesis does not contain other persons' writing, unless specifically
acknowledged as being sourced from other researchers. Where other written
sources have been quoted, then:
a. Their words have been re-written but the general information attributed to
them has been referenced
b. Where their exact words have been used, then their writing has been placed
inside quotation marks, and referenced.
5. This thesis does not contain text, graphics or tables copied and pasted from the
Internet, unless specifically acknowledged, and the source being detailed in the
thesis and in the References sections.
Signed: ………………………………… date………4 December 2015…………….
Meryl Jagarnath
v
ACKNOWLEDGEMENTS
I would like to acknowledge the support and contributions of the following:
My supervisor, Dr Tirusha Thambiran for her guidance, patience, calmness, insightful
advice and enthusiastic discussions, which always left me inspired. My co-supervisor,
Dr Michael Gebreslasie for his constant support, assistance with resources, and
valuable suggestions. I feel privileged and honoured to have two great mentors in my
life and benefit from their vast knowledge and exceptional human qualities.
The eThekwini Municipality Energy Office and the eThekwini Municipality
Electricity Department for providing data.
My family and friends for their unwavering support, understanding, and
encouragement.
The National Research Foundation for financial support during the course of this
research.

vi
TABLE OF CONTENTS
ABSTRACT I
PREFACE III
DECLARATION 1 - PLAGIARISM IV
ACKNOWLEDGEMENTS V
TABLE OF CONTENTS VI
LIST OF ABBREVIATIONS AND ACRONYMS IX
LIST OF FIGURES XIV
LIST OF TABLES XVII
CHAPTER 1: INTRODUCTION 1
1.1 Background 1
1.1 Motivation 3
1.2 Aims and Objectives 6
1.3 Thesis Structure 6
CHAPTER 2: LITERATURE REVIEW 7
2.1 Introduction 7
2.2 Climate Change Mitigation 7 2.2.1 International Agreements on Climate Change Mitigation 10 2.2.2 Local Scale Climate Change Mitigation 13 2.2.3 Low Carbon City 15
2.3 Emissions Inventory 19 2.3.1 Direct and Indirect Measurements 21 2.3.2 Top-down and Bottom-up Approaches 23 2.3.3 Boundaries and Scopes 23 2.3.4 Inventory Methods 24 2.3.5 Emission Indicators 32

vii
2.3.6 Emission Inventory Uncertainties 36
2.4 Emissions Inventory and Spatial Planning 38 2.4.1 Emissions Inventory and Spatial Planning Challenges 44
2.5 South African Perspective 46 2.5.1 National Mitigation Policy 47 2.5.2 GHG Emissions Inventories Research in SA 52 2.5.3 Local Scale Mitigation in SA 54
2.6 Synthesis and Conclusion 56
CHAPTER 3: RESEARCH DESIGN 58
3.1 Introduction 58
3.2 Key Sectors of GHG Emissions 58
3.3 Emissions Inventory Framework 59 3.3.1 Energy 60 3.3.2 Waste 62 3.3.3 Local Spatial Development Plans 64
3.4 Case Study: Durban (eThekwini Municipality) 67
3.5 Study Scope and Boundary 72
3.6 Data Collection and Inventory Calculations 73 3.6.1 Residential 73 3.6.2 Industry 75 3.6.3 Road Transport 76 3.6.4 Solid Waste Disposal 81 3.6.5 Wastewater Treatment 83 3.6.6 Local Development Plans 84 3.6.7 Analysis 84
3.7 Challenges and Limitations 85 3.7.1 Data Collection 85 3.7.2 Spatial Scale 86 3.7.3 Residential 86 3.7.4 Industry 87 3.7.5 Road Transport 88 3.7.6 Waste 89 3.7.7 Local Development Plans 90
CHAPTER 4: RESULTS AND DISCUSSION 91
4.1 Introduction 91

viii
4.2 Policy Analysis for Climate Change and Spatial Development in the eThekwini Municipality 91
4.2.1 LTDF- ‘Imagine Durban’ 94 4.2.2 IDP Eight Point Plan 96 4.2.3 SDF and SDP 98 4.2.4 Industrial Land Strategy 100 4.2.5 Key Development Priorities 101
4.3 Total Emissions in Durban 107 4.3.1 Emissions Inventory Comparisons 108 4.3.2 Sectoral Emissions in Durban 110 4.3.3 Emissions Inventory Uncertainties 129
4.4 Spatial Analysis of Emissions in Durban 130
4.5 High Emission Zones 136 4.5.1 South Durban 136 4.5.2 Central Durban 142 4.5.3 North Durban 145
4.6 Synthesis and Conclusion 148
CHAPTER 5: CONCLUSION 151
5.1 Introduction 151
5.2 Summary of Study 151
5.3 Recommendations for Future Research 154
CHAPTER 6: REFERENCES 156
APPENDIX A– INFORMATION AND EQUATION FOR THE CALCULATION OF LANDFILL EMISSIONS I
APPENDIX B- EQUATIONS FOR THE CALCULATION OF EMISSIONS FROM WASTEWATER TREATMENT II
APPENDIX C- SECTORAL AND TOTAL EMISSIONS, AND EMISSIONS INTENSITY OF DURBAN WARDS IV

ix
LIST OF ABBREVIATIONS AND ACRONYMS
AD activity data
AFOLU Agriculture, Forestry and Other Land
Use
AIDS Acquired Immune Deficiency
Syndrome
ASSAf Academy of Science of South Africa
BOD biological oxygen demand
CAIA Chemical and Allied Industries
Association
CBD central business district
CCP Cities for Climate Protection
CCS carbon capture and storage
CDM Clean Development Mechanism
CH4 methane
CO2 carbon dioxide
CO2e carbon dioxide equivalents
COP Congress of Parties
COPERT Computer Programme to Calculate
Emissions from Road Transport
DCCS Durban Climate Change Strategy
DDOP Durban Dig-Out Port
DEA Department of Environmental Affairs
DEFRA Department of Environment, Food,
and Rural Affairs
DEROs Desired Emission Reduction
Outcomes
DMOSS Durban Metropolitan Open Space
System
DoE Department of Energy
DoT Department of Transport

x
EEA European Environment Agency
EF emission factor
EIA Environmental Impact Assessment
EM eThekwini Municipality
eNATIS electronic National Traffic
Information System
EPA Environmental Protection Agency
EPCP Environmental Planning and Climate
Protection
ESRI Environmental Systems Research
Institute
FOD first-order decay
GDP gross domestic product
GHG greenhouse gas
GIS Geographic Information Systems
GVA gross value added
GVM gross vehicle mass
GWC growth without constraints
GWP global warming potential
HDI Human Development Index
HFCs hydrofluorocarbons
HIV Human Immunodeficiency Virus
IA integrated assessment
ICLEI International Council for Local
Environmental Initiatives
IDA Infrastructure Development Act
IDP Integrated Development Plan
IEA International Energy Agency
ILS Industrial Land Strategy
INDCs Intended Nationally Determined
Contributions
INK Inanda, Ntuzuma, and KwaMashu
IPCC Intergovernmental Panel on Climate

xi
Change
IPPU Industrial Processes and Product Use
IRPTN Integrated Rapid Public Transport
Network
ISO International Organization for
Standardization
IUDF Integrated Urban Development
Framework
JI Joint Implementation
kg kilogram
km2 kilometres square
kWh kilowatt hours
KZN Kwa-Zulu Natal
LCA life cycle assessment
LEAP Long Range Energy Alternative
Planning
LEZ Low Emission Zone
LFG landfill gas
LTDF Long Term Development Framework
LTMS Long Term Mitigation Scenarios
m metre
M&E Monitoring and Evaluation
MARKEL Market Allocation Model
MCCP Municipal Climate Protection
Programme
MGHG-INT modified greenhouse gas intensity
MMSCF million standard cubic feet
MPA Mitigation Potential Analysis
Mt Mega tonnes
MW megawatt
MWh megawatt hours
N2O nitrous oxide
NAEIS National Atmospheric Emissions

xii
Inventory System
NCCRP National Climate Change Response
Policy
NDP National Development Plan
NF3 nitrogen trifluoride
NGO non-governmental organizations
NOx nitrous oxide
PFCs perfluorocarbons
PICC Presidential Infrastructure
Coordinating Commission
PM particulate matter
ppm parts per million
RBS required by science
RTMC Road Traffic Management
Corporation
SA South Africa
SAPREF South African Petroleum Refinery
SDB South Durban Basin
SDB-MPP South Durban Basin Multi-Point Plan
SDCEA South Durban Community
Environmental Alliance
SDF Spatial Development Framework
SDIB South Durban Industrial Basin
SDP Spatial Development Plan
SEA Strategic Environmental Assessment
SF6 sulphur hexafluoride
SIP Strategic Integrated Project
SO2 sulphur dioxide
SPLUMA Spatial Planning and Land Use
Management Act
StatsSA Statistics South Africa
tCO2e tons per CO2 equivalents
UDL Urban Development Line

xiii
UK United Kingdom
UN United Nations
UNEP United Nations Environment
Programme
UNFCCC United Nations Framework
Convention on Climate Change
USA United States of America
VKT vehicle kilometres travelled
W/m2 watts per square metre
WMO World Meteorological Society
WRI World Resources Institute
WWTP wastewater treatment plants

xiv
LIST OF FIGURES
Figure 2.1 Coupling and decoupling of development from carbon emissions. Adapted from
Chen and Zhu (2013)………………………………………………………………………....17
Figure 2.2 GHG emissions inventory and mitigation cycle. Adapted from the WRI (2014).. 20
Figure 3.1 Total (in MtCO2e) and percentage (%) share of South Africa's GHG emissions,
according to the IPCC categories. Adapted from DEA (2011c)…………………………….. 59
Figure 3.2 The conceptual framework developed to integrate emissions inventory in spatial
planning (VandeWeghe and Kennedy, 2007; Brown and Logan, 2008; Gallivan et al., 2008;
Knuth, 2010; Merven et al., 2012; Dhar et al., 2013; Garibaldi et al., 2014; Liu et al., 2014b;
Winkler, 2014; Feng et al., 2015; Guo et al., 2015)…………………………………………66
Figure 3.3 Major suburbs of Durban and the city location within SA and KZN (top)………68
Figure 3.4 Durban ward population density (in population per square kilometre). Source:
StatsSA (2013)………………………………………………………………………………. 70
Figure 4.1 Visual representation of the EM LTDF 'Imagine Durban' (Source: EM IDP, 2015;
p. 401)………………………………………………………………………………………...95
Figure 4.2 The SDF of the EM for the years 2010-2015. Source: EM SDF (2014; p. 163)…………100
Figure 4.3 Sectoral shares of GHG emissions (in MtCO2e and percentage) in the EM for the year
2013…………………………………………………………………………………………………..108
Figure 4.4 Total GHG emissions (tCO2e) from road transport in the EM for the year
2013........................................................................................................................................112
Figure 4.5 The GHG emissions (tCO2e) from road transport, according to (a) vehicle class
and fuel type, and (b) vehicle class composition (in figures and percentage) of the EM vehicle
population for the year 2013. ................................................................................................. 113
Figure 4.6 GHG emissions (tCO2e) from major industrial and commercial electricity
consumption in the EM for the year 2013. ............................................................................ 116
Figure 4.7 Electricity consumption emissions and emissions intensities of the economic
sectors in the EM for the year 2013 (with GVA expressed in millions of rands). ................. 118

xv
Figure 4.8 GHG emissions (in tCO2e) from household electricity consumption in the EM for
the year 2013. ......................................................................................................................... 121
Figure 4.9 GHG emissions from waste emissions (in tCO2e and percentage) in the EM for the
year 2013. ............................................................................................................................... 122
Figure 4.10 GHG emissions (tCO2e) from solid waste disposal at landfills in the EM for the
year 2013. ............................................................................................................................... 125
Figure 4.11 Average annual amount and composition of waste received at the landfills
studied. The years used to calculate averages are in brackets. .............................................. 126
Figure 4.12 GHG emissions (tCO2e) from wastewater treatment plants in EM for the year 2013........................................................................................................................................ 127
Figure 4.13 GHG emissions (in tCO2e and percentage) from wastewater treatment plants in the EM for the year 2013. ...................................................................................................... 129
Figure 4.14 Total GHG emissions (in tCO2e) in the EM for the year 2013. ......................... 132
Figure 4.15 The GHG emissions profile (in tCO2e) of south Durban wards for the year 2013. The emission rankings of wards are in brackets (1= highest emitter in the EM). ................. 138
Figure 4.16 The GHG emissions profile (in tCO2e) of central Durban wards for the year 2013. The emission rankings of wards are in brackets (1= highest emitter in the EM). ....... 143
Figure 4.17 The GHG emissions profile (in tCO2e) of north Durban wards for the year 2013. The emission rankings of wards are in brackets (1= highest emitter in the EM). ................. 146

xvi
LIST OF TABLES
Table 2.1 The major GHGs and their sources, lifetime, and GWP. Adapted from Ramanathan
and Feng (2009) and IPCC (2013). ..………………………………………………………… 9
Table 2.2 Summary of emission inventory uncertainty types and categories. Adapted from
Rypdal and Winiwarter (2001), van Aardenne and Pulles (2002), and Wilbanks et al.
(2003). .…...………...…………………………………………………………………......... 37
Table 3.1 Main vehicle types and their associated fuel types, mileage, fuel economy, and
emission factors. ..…………………………………………………………………………... 80
Table 3.2 Data inputs required for the ICLEI FOD model for landfills without gas
collection.………….....………………………………………………………………………82
Table 3.3 Data inputs require for the calculation of emissions from landfills with gas
collection. ………………………………………………………………………………….. .. 83
Table 4.1 Scope and purpose of the EM plans studied. Adapted from the EM SDF (2014;
p.35). ........................................................................................................................................ 93
Table 4.2 Summary of key development projects in the EM for the years 2010- 2015.
Adapted from the EM SDF (2014) and the EM IDP (2015). ..……………………………..106
Table 4.3 Comparison of this study's emissions inventory with other studies, expressed in
MtCO2e, with the year of study within brackets. ……..…………………………………... 110
Table 4.4 Passenger car ownership rates expressed in per capita. ..………………………..114
Table 4.5 Industrial emissions footprint of the highest emitting wards, expressed in tCO2e per
hectare (ha). ..……………………………………………………………………………… 117
Table 4.6 GHG emissions intensity (in tCO2e per capita) of the EM wards for the year
2013………………………………………………………………………………………... 135

1
CHAPTER 1: INTRODUCTION
1.1 Background
Climate change, attributed to the release of greenhouse gases (GHGs) caused by human
activities, has emerged as one of the most challenging issues that humanity faces, as it
manifests itself at both the local and global scale. Thus, feasible strategies and policies to
address climate change require the synchronization of various institutions and frameworks for
the international, local and sectoral levels (Biesbroek et al., 2009). According to the
Intergovernmental Panel on Climate Change (IPCC, 2013), the impacts associated with
climate change are direct, such as global temperature increase and exposure to extreme
weather events, and indirect, as climate change will exacerbate already existing challenges
such as poverty, disease outbreaks, food insecurity and water scarcity (Revi et al., 2014).
Therefore it is vital to not only adapt to the impacts of climate change but also limit the cause
that is anthropogenic sources of GHG emissions.
The majority of climate change studies are on impacts and future emissions forecast
(Bastianoni et al., 2004; Ezcurra, 2007; Hamin and Gurran, 2009). There is a growing move
towards the development of low carbon, resilient cities but there are few studies on the spatial
distribution of carbon dioxide (CO2) and other GHG emissions even though it is vital for
developing, implementing and assessing policies (Bulkeley, 2006; Ezcurra, 2007;
VandeWeghe and Kennedy, 2007; Dulal et al., 2011; Williams, 2012; Zhang et al., 2013;
Jones and Kammen, 2014; Konstantinaviciute and Bobinaite, 2015). Furthermore, studies on
CO2 emissions are important in climate change negotiations on emissions attribution, as
protocols that are perceived as unequitable will not be ratified (Beg et al., 2002; Ezcurra,
2007; Huang and Meng, 2013; Lu, 2014).
The concentration of population, economic activities, and built environments in cities1 are
responsible for the high rates of GHG emissions from resource consumption and waste
production (Bulkeley and Betsill, 2005; Hallegatte et al., 2011), and also increases risk to
vulnerabilities, such as flooding and heat waves, which will increase in intensity (Wilbanks et
1 City, urban, local government, local scale, municipality, and metropolitan are considered similar and used interchangeably.

2
al., 2003; Satterthwaite, 2010; Romero-Lankao and Dodman, 2011). Thus, there is a
consensus (Sperling and Cannon, 2006; Dhakal, 2010; Satterthwaite, 2010; Hoornweg et al.,
2011; Seto et al., 2014; Jabareen, 2015) that the long-term solution for climate change
requires the complete transformation and planning of cities from “hotbeds of GHG emissions
and vulnerability to seedbeds of sustainability and resilience” (Romero-Lankao and Dodman,
2011; p. 113), which can be achieved through innovative mitigation and adaptation strategies
(Satterthwaite, 2010). The low carbon city concept is prevalent amongst urban planners and
city governments (Lehmann, 2013), to reduce emissions from production and consumption,
whilst securing a high quality of life for all citizens (Ho and Fong, 2007; Dhar et al., 2013;
Yang and Yanan, 2013).
Responses to global warming and climate change focus on international, regional and
national scale (IPCC, 2013; Seto et al., 2014). However, in the last decade, research and
policy have placed importance on urban GHGs (Betts, 2007; Dhakal, 2010; Satterthwaite,
2014; Seto et al., 2014). Expert reports, such as Stern (2008), called for urgent carbon
emission reductions from cities, and the IPCC Fifth Assessment Report (IPCC, 2013)
highlighted the need for more coverage on issues of urban carbon mitigation. Currently, more
than half of the world’s population live in urban areas and this number is expected to grow,
by the United Nations (UN, 2014), to more than 66% of the global population residing in
cities by 2050.
The urban transition (change from being predominantly rural to increasingly urbanized
nations) has now switched from Europe, North and South America to Africa and Asia, where
the middle to low income nations are located (Romero-Lankao and Dodman, 2011; UN,
2014). Thus, the share of emissions from developing cities is expected to increase (Cai and
Zhang, 2014). The priorities of developing cities are economic growth and service delivery
(Dhakal, 2010; Dulal and Akbar, 2013; Garibaldi et al., 2014; Jabareen, 2015), with pro-poor
and environmental strategies receiving less attention, thus causing conflicts (Hannan and
Sutherland, 2014).
Due to uncertainties associated with the future, the developmental decisions that are made
now have the potential to cause maladaptation’s, where activities result in increased GHG
emissions, risk, and vulnerability (Barnett and O'Neill, 2010). However, most of the
development in emerging economies are occurring or yet to occur so the resilience of cities

3
can be enhanced through adaptation and mitigation initiatives, achieved by effective urban
planning, thereby delivering additional benefits, or co-benefits (Beg et al., 2002; Campbell,
2006; Dhakal, 2010; Dulal and Akbar, 2013; Cai and Zhang, 2014). This is demonstrated by
many cities, even developing nation cities, where urban climate change mitigation actions
have been led by the local government municipals and related city networks (Dhakal, 2010;
Romero-Lankao and Dodman, 2011).
1.2 Motivation
Atmospheric carbon dioxide (CO2) concentrations greatly exceed the natural range of 180-
300 parts per million (ppm) (Dulal et al., 2011), with the current (2015) concentration at 400
ppm (Huisingh et al., 2015). Therefore, it is essential to explore all possible strategies to
reduce GHG emissions. The combustion of fossil fuels for energy and transport, and the
generation of waste are the main contributors to GHG emissions (IPCC, 2013). Furthermore,
the activities which emit GHG are distributed disproportionately in space.
Globally, developed countries, which contain 20% of the world’s population, are responsible
for 46.4% of GHG emissions and developing countries are home to 80% of the world’s
population and contribute 53.6% of GHG emissions (Dodman, 2009a). It is estimated that up
to 80% of global GHG emissions are attributed to cities, thus highlighting the disparate
contribution of cities to global emissions when compared to their extent (Hoornweg et al.,
2011). There are also spatial differences in GHG emissions within countries and cities, due to
variable industrial, development, social, economic, and natural conditions, and this motivates
for tailoring mitigation efforts to those differences (VandeWeghe and Kennedy, 2007;
Dodman, 2009a; Dhakal, 2010; Knuth, 2010; Chuai et al., 2012; Yu et al., 2012; Dulal and
Akbar, 2013; Garibaldi et al., 2014; Jones and Kammen, 2014; Seto et al., 2014; Winkler,
2014; Zhang et al., 2014). Additionally, the impacts, effects, resources, and responses of
countries and cities to climate change are disparately distributed in space (Aylett, 2010; Stone
et al., 2012).
The United Kingdom (UK) Department of Environment, Food, and Rural Affairs (DEFRA,
2010) emphasized identifying the spatial location of emissions to determine low emission
zones (LEZs). LEZs are the geographic areas where the low emission strategy is applied
4
(DEFRA, 2010). A low emission strategy is a broad package of measures to mitigate the
impacts of development and complement other mitigation options such as planning and
infrastructure (DEFRA, 2010). Therefore, the quantity of GHG emissions and associated
spatial distribution of emissions from the various sectors are identified through the
compilation of an emissions inventory (VandeWeghe and Kennedy, 2007; Knuth, 2010; Qin
and Xie, 2011; Hillmer-Pegram et al., 2012; Yu et al., 2012; Jones and Kammen, 2014), as is
the case for air pollution (Hsu et al., 2013). This information assists policy makers and city
planners to make informed decisions about mitigation strategies and action; to focus on
reducing large emitters and develop place-based mitigation strategies and infrastructure
improvements for urban development (Knuth, 2010; Jones and Kammen, 2014; Baur et al.,
2015), and thus facilitate low carbon city planning.
Overall, research on GHG emissions calculations are in its early development and requires
further and urgent research so that approaches can be improved (Chuai et al., 2012; Lesiv et
al., 2014). The majority of studies undertaken on GHG emissions are focused on the national
scale with few studies on the local scale, of which the majority are for cities in developed
countries (Kates et al., 1998; Grazi and van den Bergh, 2008; Carney and Shackley, 2009;
Chuai et al., 2012; Jones and Kammen, 2014; Seto et al., 2014; Baur et al., 2015; Feng et al.,
2015). Furthermore, Simon and Leck (2015) noted that climate change research for African
cities were disjointed, lacked consideration of the links between urban, rural, and peri-urban,
and often addressed a single topic focused on a specific location or community within a city.
In addition, some view that cities are not doing their fair share of the work to achieve the
binding mitigation targets and, with increasing emissions, they are hindering progress by
making the target less achievable (VandeWeghe and Kennedy, 2007). Although cities have
increasingly unsustainable resource usage rates they can become centres of low GHG
emissions with high standards of living with the correct guidelines, policy and
implementation.
South Africa (SA) is the 13th highest CO2 emitter in the world and the largest CO2 emitter in
Africa. SA’s CO2 emission per capita is between 9.22-9.9 tons of CO2 equivalents (tCO2e)
(Winkler, 2009; DEA, 2011c) and much greater than the world average of 4.9 tCO2e per
capita (Singer et al., 2014). SA’s high carbon emissions are due to the energy-intensive
economy reliant on fossil fuels (Raubenheimer, 2011). Additionally, the vast majority of
SA’s electricity supply is generated from coal, synthetic petroleum, and diesel with

5
renewable energy generation nominal (Eskom, 2014). This must be noted in the context that
many South African households do not have access to electricity and other basic services.
In SA, GHGs have been recently declared as priority air pollutants by the Department of
Environmental Affairs (DEA) and activities that produce an excess of 0.1 Mega tonnes (Mt)
of emissions annually will have to produce an air pollution prevention plan (DEA, 2014a).
Areas with high air pollution emissions are considered priority areas and therefore areas of
high GHG emissions and emitting activities should also be considered as such. Cities have a
pivotal role in mitigating climate change, through the role of local government strategies and
policies, in reducing polluting activities and implementing GHG reduction policies and
programmes (Lazarus et al., 2013). Thus, South African cities will need to play a key role in
achieving the legally binding GHG emission reduction targets of 34% by 2020 and 42% by
2025 as well as deliver development, redress Apartheid inequalities, and promote socio-
economic growth whilst maintaining a healthy and safe environment (DEA, 2011b; DEA,
2014b; Winkler, 2014). Therefore there is a need for detailed information to target emissions
reduction effectively (Ramachandra et al., 2015) that will deliver additional benefits to South
African local development goals and improve quality of life.
Durban2 endeavours to become a low carbon city and is considered a leader in South Africa
with climate change mitigation efforts (Roberts, 2008; Aylett, 2011; Roberts, 2013; Roberts
and Donoghue, 2013; Walsh et al., 2013). Durban has produced GHG emissions inventories
on an annual basis since 2010 (EM Energy Office, 2012), however, these emissions are not
spatially allocated and do not inform development planning and mitigation actions in the city.
Thus, given the importance of aligning mitigation strategies with development (Dulal and
Akbar, 2013; Garibaldi et al., 2014; Winkler, 2014), this study focuses on the compilation of
an emissions inventory with a spatial focus to identify the sources and sectors that contribute
the most to emissions, and the implications for low carbon development.
2 Durban and the eThekwini Municipality (EM) share the same geographic and administrative boundary, and are used interchangeably. Durban is the city name and eThekwini is used in official documents (Sutherland et al., 2013).

6
1.3 Aims and Objectives
The aim of this study is to identify the spatial distribution of anthropogenic GHG emissions
in Durban, thus providing an indication of high carbon emission zones, thereby planning and
development of low emissions zones can be spatially focused in order to achieve the goal of a
low carbon city.
Research Question
What are the opportunities for using emission inventories to inform low carbon spatial
planning at a local scale in South Africa?
The specific objectives are:
(i) Develop a conceptual framework for the attribution of GHG emissions.
(ii) Create GHG emissions inventories for the energy, transport and waste sectors for
Durban.
(iii) Explore the spatial distribution of emissions using Geographic Information
Systems (GIS).
(iv) Identify high emission areas in Durban and, in conjunction with city development
priorities, assess the opportunities for mitigation.
(v) Provide recommendations to reduce emissions in order to facilitate the planning of
a low carbon city.
1.4 Thesis Structure
Chapter 2 comprises the literature review of the linkages between GHG emissions inventory
and spatial planning, and also highlights the relevant policy in South Africa. Chapter 3 details
the research design including the conceptual framework developed for this study, focusing on
the key sectors underlined in the literature review and the methodological approach which
discusses the scope of this study, data sources, and analysis applied. The results and
discussion are provided in Chapter 4. Chapter 5 provides an overview of the key findings of
the study within the context of the aim and objectives, and presents recommendations for
future research.

7
CHAPTER 2: LITERATURE REVIEW
2.1 Introduction
Climate change is a cross cutting issue, particularly relevant in the developing city context,
that has the potential to present benefits and challenges to policy-makers. This review focuses
on the linkages between GHG emissions inventory and spatial planning from a mitigation
perspective. Specifically, the major international mitigation agreements are highlighted, as
well as the significance of the local scale as the appropriate scale to formulate and implement
mitigation actions. The various concepts, methods and challenges associated with compiling
an emissions inventory and spatial planning at the local scale are reviewed. In order to
compare emissions from different methods, cities, and sectors, emissions indicators are
required. The most commonly used emission indicators are discussed. Thereafter, South
African policies on emissions mitigation, specifically emissions inventory and spatial
planning are reviewed.
2.2 Climate Change Mitigation
Over the past century, the global average temperature has increased by 0.84°C, with a range
of 0.65°C to 1.02°C (IPCC, 2013). The earth’s climate is influenced by various factors, such
as solar radiation, the reflectivity of earth’s surface, clouds, fine particles, and GHG
concentrations in the atmosphere. GHGs are the natural and anthropogenic gaseous
components of the atmosphere that absorb and emit radiation at specific wavelengths within
the thermal infrared radiation spectrum emitted by the Earth’s surface, atmosphere, and
clouds, thus causing the greenhouse effect.
The greenhouse effect warms the earth to a habitable temperature for all life forms, however
the increasing concentration of GHGs, due to anthropogenic activities, have modified the
natural effect. The GHGs that contribute the most to global warming are CO2, methane
(CH4), nitrous oxide (N2O), sulphur hexafluoride (SF6), and halons, such as
hydrofluorocarbons (HFCs) and perfluorocarbons (PFCs), which are known as the Kyoto

8
gases. Furthermore, in 2013, nitrogen trifluoride (NF3) was designated a major GHG due to
the observed high atmospheric concentrations, which were previously thought to be minimal
(GHG Protocol, 2013). GHGs are measured in global warming potential (GWP), which is the
contribution of a mass of GHG to global warming, compared to the same mass of CO2 over
100 years. CO2e emissions refer to the amount of CO2 emissions that would cause the same
amount of radiative forcing. Radiative forcing is the change in net vertical irradiance, in watts
per square metre (W/m2) between the boundaries of the troposphere and stratosphere (IPCC,
2013). There is considerable variability in GHG lifetimes, their contribution to warming, and
their sources (Table 2.1; p. 9). CO2 has received crucial attention because fossil fuel
combustion directly adds CO2 into the atmosphere and has a larger greenhouse effect than
other GHGs. SF6 and halons are synthetic GHGs, known as ‘super GHGs’ due to their long
lifetimes and strong radiative forcing, produced by the chemical industry since 1930
(Ramathan and Feng, 2009).
There is consensus in the literature that both mitigation and adaptation measures are needed
to combat climate change and ensure resilient communities (Haman and Garran, 2009;
Puppis de Oliveira, 2009; IPCC, 2013). Mitigation involves the reduction of GHG emissions
and adaptation entails the reduction of climate change impacts (Biesbroek et al., 2009). Most
of the focus is on mitigation, as emissions are quantified, thus producing measurable targets
and monitoring when compared to adaptation (Biesbroek et al., 2009; Puppim de Oliveira,
2009; Ho et al., 2013). However, mitigation strategies are long-term whereas adaptation
strategies can be implemented in the short and medium-term (Hamin and Gurran, 2009).
Successful mitigation requires the co-ordination with other disciplines, sectors, and scales
(Biesbroek et al., 2009), but is considered an international and national issue, due to the
global and stock nature of GHG emissions, and the effects of local mitigation actions are
difficult to conceptualise (Wilbanks et al., 2003; Moriarty and Honnery, 2015). Furthermore,
even if a country or city achieves their emissions reduction targets, it will be futile if others
do not do the same, thus decreasing the motivation for mitigation policies and actions
(Moriarty and Honnery, 2015). Therefore, to ensure the wide-scale undertaking of mitigation
actions, Garibaldi et al. (2014) motivated for mitigation actions to be linked with
developmental objectives.

9
Table 2.1 The major GHGs and their sources, lifetime, and GWP. Adapted from Ramanathan and Feng (2009) and IPCC (2013).
GHG Main anthropogenic
source
Lifetime (years) Radiative Forcing (W/m2) GWP (100 years)
CO2 Fossil fuel combustion,
deforestation, cement and
lime manufacture
Unspecified 1.68 1
CH4 Agriculture, landfills,
biomass burning
12 0.97 28
N2O Fertilizer use, fossil fuel
combustion
114 0.17 265
HFC Refrigerants, air
conditioning, propellants
1.4-270 0.34 116-12400
Other halocarbons Refrigerants, air
conditioning, propellants
10000-50000 0.34 5700-11000
SF6 Refrigerants, air
conditioning, propellants
3200 0.34 23500
NF3 (nitrogen trifluoride) Electronics manufacture,
PFC replacement
740 0.21 16100

10
2.2.1 International Agreements on Climate Change Mitigation
Attention was first drawn to global warming and climate change at the ‘World Climate
Conference’ by the World Meteorological Society (WMO) in 1979, which highlighted the
concern that human activities may cause substantial changes in regional and global climate
and this information must be included in planning for development. The 1987 Brundtland
Report highlighted sustainable development and the acknowledgement of the sustainable
cities concept, which emphasized the role that cities play in addressing environmental issues,
especially climate change (Bulkeley and Betsill, 2005). In 1988, the WMO and the UN
Environment Programme (UNEP) formed the IPCC to provide the current state of scientific
knowledge on climate change and its’ associated environmental and socio-economic impacts
(IPCC, 2013). Thus, it is recognized that the focus on climate change should not only be on
the science but also the socio-economic and political contexts (Aylett, 2010).
At the 1992 Rio de Janeiro Earth Summit conference on sustainable development, the UN
Framework Convention on Climate Change (UNFCCC) was formed as 189 countries
endorsed voluntary GHG emissions reductions, which later became mandatory under the
Kyoto Protocol in 2005 (Sperling and Cannon, 2006; Couth and Trois, 2010). The purpose of
the UNFCCC is to stabilize GHG concentrations at a level that would prevent dangerous
anthropogenic interference with the climate system whilst also allowing systems to adapt
(UNFCCC, 2014). However, there is no indicator of what is ‘dangerous’, thus it is left to
policy makers to make informed decisions based on the best available knowledge
(Fuglestvedt et al., 2010; Dhar et al., 2013). The highest authority in the UNFCCC is the
Congress of Parties (COP), which reviews current agreements or adopts new ones. Under the
UNFCCC, industrialized countries, known as Annex I countries which have ratified the
Kyoto Protocol, have to regularly report their climate change policies and submit annual
GHG emissions inventories from the base year (usually 1990) and subsequent years.
Developing countries (non-Annex I countries) are required to report generally on their
climate change mitigation and adaptation actions however, this is dependent on funding,
especially for least developed countries (Sookun et al., 2014).

11
The Kyoto Protocol also provides three flexible mechanisms for Annex I countries to achieve
binding targets to reduce GHG emissions: (i) carbon trading, (ii) the Clean Development
Mechanism (CDM) and (iii) Joint Implementation (JI). The CDM projects allows the carbon
emissions reduction achieved in non-Annex countries, to be allocated to Annex I countries
which have supported the project, of which the most popular project is the capture and
combustion of landfill gas with energy generation (Couth and Trois, 2010).
The Kyoto Protocol represents the most comprehensive action on climate change as it states
climate change must be included in all policy and planning, made provisions for market
based approaches, flexible in allowing countries to meet commitment targets in any way they
decide, seen as fair due to the principle of common but differentiated responsibility, and also
provides a source of funding for sustainable development in non-Annex I countries (Bumpus
and Liverman, 2008; Aldy and Stavins, 2010). However, there are various criticisms
(Sperling and Cannon, 2006; Aldy and Stavins, 2010) as there are no penalties for non-
compliance (Yang and Yanan, 2013), as many big emitters, such as United States of America
(USA), have not ratified the agreement. The fastest-growing emerging economies, which are
associated with increasing emissions and intense deforestation, did not set emission targets
(Aldy and Stavins, 2010). Furthermore, the basic assumption is that the economy of a country
is independent of another country’s economy, which does not apply with the current global
economy (Moghaddam et al., 2013). The flexibility of the Kyoto Protocol has created
opportunities for compliance without reducing emissions, such as developed nations reducing
their emissions by shifting carbon-intensive production to emerging economies, which is
known as ‘carbon leakage’, that has occurred during the de-industrialization of Europe
(Moghaddam et al., 2013; Geels, 2014). The flexibility also resulted in countries aiming to
reduce emissions intensity, which is the easier than reducing absolute emissions (Stern and
Jotzo, 2010; Cansino et al., 2015).
The distinction between absolute targets and intensity targets are important. An absolute
emission target commits to reducing total emissions by a specific amount whereas reducing
emission intensity is the decrease of CO2 emissions per unit economic activity, such as gross
domestic product (GDP) (Lin et al., 2014). However, carbon intensity reduction does not
guarantee a decrease in overall total emissions, as demonstrated by industries in China (Lin et
al., 2014; Liu et al., 2014b). According to Lin et al. (2014), an absolute target reduction is
viewed as unfeasible for developing countries, due to urbanization and industrialization;

12
therefore it is vital to reduce CO2 emissions by reducing energy intensity and carbon
intensity. Furthermore, emissions intensity does have value in focusing policies to target
structural and technological change (Stern and Jotzo, 2010). However, as Levitt (2006)
stated, any increase in GHG emissions from any sector or country is unsustainable, due to the
stock nature of GHG emissions (Singer et al., 2014).
Agreements for the Post-Kyoto period aims to restrict temperature increase by 2°C, which
translates to stabilization of CO2 concentrations at 450 ppm (IPCC, 2013). These agreements
include the Copenhagen Accord 2009, the Cancun Agreement 2010, and the Lima Accord
2014 (den Elzen et al., 2013; Lu, 2014), which were underlined by the key roles played by
developing nations such as China, India, Brazil and South Africa (Lau et al., 2012).
Currently, there is a process to develop a protocol to represent a new binding climate
agreement to be finalized in 2015 and implemented from 2020. Parties to the UNFCCC are
required to prepare their Intended Nationally Determined Contributions (INDCs) (Höhne et
al., 2014), which presents what countries are willing to commit to adaptation and mitigation,
and provides the foundation for the climate agreement negotiations in Paris in December
2015 (Levin et al., 2015). Some important components of the INDCs concerning mitigation
are: (i) the information used to calculate GHG emissions, such as base year and methods
used, (ii) evaluation of the emission reduction targets (i.e., if they are fair and ambitious), (iii)
and how the reduction targets help to achieve the UNFCCC goals (Höhne et al., 2014; Lu,
2014). Thus, this highlights the importance of emission inventories to quantify emissions,
across all scales and sectors to provide timeous information for setting emission reduction
goals.
However, the other current agreements are also criticised for not being binding like the Kyoto
Protocol. Specifically, there is no explicit requirement on how the temperature restriction is
to be realized, lacks a global emissions limit, and countries still retain the freedom to set their
own emissions reduction targets (Lau et al., 2012). Furthermore, the financial, human, and
resource capacity of developing countries are not significant issues in climate negotiations,
even though it is a vital component which determines the success of emissions reduction or
prevention of further emissions increase (Garibaldi et al., 2014). Therefore, it must be noted
that the current negotiated agreements fall short of what is required to reduce GHGs and limit
average global temperature increase by 2°C (Lau et al., 2012; Cam, 2013).

13
2.2.2 Local Scale Climate Change Mitigation
Development scholars and geographers maintain that sole focus on the international level
climate agreements, with national commitments, to reduce emissions are limited as it does
not provide context specific solutions for climate change action (Gupta, 2007). This is
demonstrated by the lack of progress on international agreements (Singer et al., 2014), which
have led to the focus on the local scale for climate mitigation analysis and action, as it is
difficult to comply with agreements by only focusing on the global or national scale
(Bulkeley and Betsill, 2005; Holgate, 2007; Dhakal, 2010; Knuth, 2010; Hillmer-Pegram et
al., 2012).
A city is defined as the physical space with social, economic, and human development (Chen
and Zhu, 2013). Cities are sites of high resource consumption and waste production
(Bulkeley and Betsill, 2005; Hallegatte et al., 2011) and directly impacts climate due to the
warming effect on the near-surface atmosphere, known as the urban heat island effect (Mills,
2014). Broadly, sustainable development also encompasses the various aspects of the
ecological, social and economic environment and inter and intra-generational equity (Hannan
and Sutherland, 2014). The current warming experienced is due to past GHG emissions,
hence our current decisions and emissions will affect future generations (Dulal and Akbar,
2013). With emissions reductions, the current generation will receive benefits in improved
quality of life and it is in our best interest to act now according to the prevention principle,
which will also benefit future generations.
Place-based mitigation is advocated as the environmental, socio-economic, and political
conditions specific to a city influences emissions and thus determines the success of
mitigation (Gupta, 2007; D'Avignon et al., 2010; Glaeser and Kahn, 2010; Knuth, 2010;
Villalba and Gemechu, 2011; Dulal and Akbar, 2013; Winkler, 2014). For example, airports
and seaports, which are vital for the global economy, contribute significant amounts of
emissions (Villalba and Gemechu, 2011) and climate mitigation plans are more likely to be
taken up if the city has strong environmental values, and least accepted by cities with carbon-
intensive industries (Zahran et al., 2008). Specifically, local government can influence
emissions through various ways through their functions, as it is responsible for infrastructure

14
and service provision, land use by-laws and zoning, and interactions with other cities (Larsen
and Hertwich, 2009; Hillmer-Pegram et al., 2012; Lazarus et al., 2013; Seto et al., 2014).
Notably, local government is closest to the people, and thus can influence citizens behaviour
and be held accountable by citizens (Kates et al., 1998; Bai, 2007; Aylett, 2010).
Demonstrations of successful local action are Local Agenda 21, which showed that cities are
willing to achieve sustainable development agendas, and the International Council for Local
Environmental Initiatives (ICLEI) Cities for Climate Protection (CCP), initiated in 1993,
which is a global city network that facilitates municipal mitigation responses by providing
technical assistance to develop emissions inventory, sharing of best practice, and technical
and financial support (Wheeler, 2008). This is further revealed by states with ambitious
targets such as California (USA) which aims to cut emissions 80% below 1990 level by 2050
and cities such as London (UK), with 60% reduction in emissions from 2000 levels by 2050
(Jabareen, 2015). Furthermore, per capita emissions have decreased in cities such as Berlin
(Germany), Boston (USA), London, New York (USA) and Seattle (USA) (Kennedy et al.,
2012). However, this is countered by the lack of progress in emissions reductions, innovative
measures, and public involvement in other developed cities even though they have joined
these networks (Wheeler, 2008; Jabareen, 2015). In developing cities, these programmes
place high administrative costs in already resource-poor local authorities (Bai, 2007; Aylett,
2011). Nevertheless, networks like these are vital especially when political and economic
support are lacking from higher levels of government (Bulkeley, 2006; Wilson, 2006;
Hoornweg et al., 2011; Bulkeley and Betsill, 2013; Singer et al., 2014). For example, the
USA government rejected the Kyoto Protocol, yet 1017 American cities agreed to meet or
exceed the mitigation targets of the Kyoto Protocol (Hoornweg et al., 2011). Additionally,
cities in developing countries cannot afford not to reduce emissions, as there are increasing
global pressure, international agreements, and resource constraints.
However, economists argue that since countries and cities compete and are connected
globally, there is a need for more international policies, thus local level actions are weak
(Gupta, 2007). Even the UNFCCC does not recognize cities as stakeholders in the climate
change negotiations (Roberts, 2013). Furthermore, only in the most recent IPCC Fifth
Assessment Report were the roles of cities in adaptation and mitigation defined
(Satterthwaite, 2014; Seto et al., 2014). Small scale mitigation projects in cities have been

15
successful (Aylett, 2011) however reducing emissions from large scale systematic causes,
such as energy consumption, have not been achieved (Robinson, 2006; Lemon et al., 2015).
Additionally, in developing cities, the capacity, resources, and jurisdiction of local
government are limited (Bai, 2007; Aylett, 2011). Mitigation requires the influence of all
stakeholders, however the role of local government is necessary but not sufficient
(Satterthwaite, 2008). Therefore, it is argued that cities have a limited influence in reducing
emissions due to macro-economic and structural factors in the city (Wilson, 2006; Bai, 2007;
Holgate, 2007; Burch, 2010; Dhakal, 2010; Geels, 2014), for example, the city is a facilitator
instead of an actor, increasing focus on the financial performance of the municipality, and the
tendering of municipal utility service delivery to the private sector (Kocabas, 2013).
2.2.3 Low Carbon City
In order to stabilize GHG emissions, various development pathways and associated emission
scenarios were developed by the IPCC (Nakicenovic et al., 2000). A low carbon development
scenario encompasses social, economic, and technological transitions to reduce emissions
from both production and consumption (Dhar et al., 2013; Yang and Yanan, 2013). A low
carbon city is a vision for the future and is a combination of low carbon economy and low
carbon society. The concept of low carbon economy was first proposed by the British
government in 2003 to achieve economic development and job creation through cleaner
production systems, and a low carbon society is focused on reducing emissions associated
with consumption and lifestyle (Yang and Yanan, 2013). Globally, 110 cities have declared
the development of a low carbon city (Lehmann, 2013).
The transition to a low carbon city is achieved through the adoption of a circular economy
and clean industrial production, which reduces energy consumption, pollution, and GHG
emissions, and recycles waste (Liu et al., 2014b) and is compatible with sustainable
development principles (Burch, 2010; Wang, 2011; Cam, 2013; Dhar et al., 2013; Ho et al.,
2013; Garibaldi et al., 2014). Thus, the focus is on consuming less resources, however, this
approach ignores the situation that a large number of people in cities face the opposite
challenge of access to resources to lead a decent life (Satterthwaite, 2009), as the urban poor
in middle and low income countries do not have basic housing, energy, and sanitation. The
16
goal of reducing emissions and working towards a low carbon city is important as the
convergence concept assumes that regions with low CO2 per capita emissions will eventually
catch up with the regions with high CO2 per capita emissions (Ezcurra, 2007; Huang and
Meng, 2013; Moutinho et al., 2014). Globally, this is also seen as low income nations
achieving high growth rates due to the production of emissions-intensive goods and the slow
growth rates of developed countries due to the production of cleaner goods (Ezcurra, 2007).
This convergence is assumed in most emissions projection models (Huang and Meng, 2013).
However, there is no clear definition of what constitutes a low carbon city, as well as how to
measure the current situation and evaluate progress (Price et al., 2013; Yang and Yanan,
2013; Zhou et al., 2014). This is because the low-city concept is evolving as more research is
undertaken and best practice is identified (Zhou et al., 2014).
Amekudzi et al. (2011) identified two types of low carbon development. The first type has
emissions reductions as the primary objective, with co-benefits, and the second type involves
development as the primary objective and emissions reduction as the co-benefit. The second
type of low carbon development is preferred, especially in emerging economies, because their
first priority is economic growth (Dhakal, 2010; Dulal and Akbar, 2013; Garibaldi et al.,
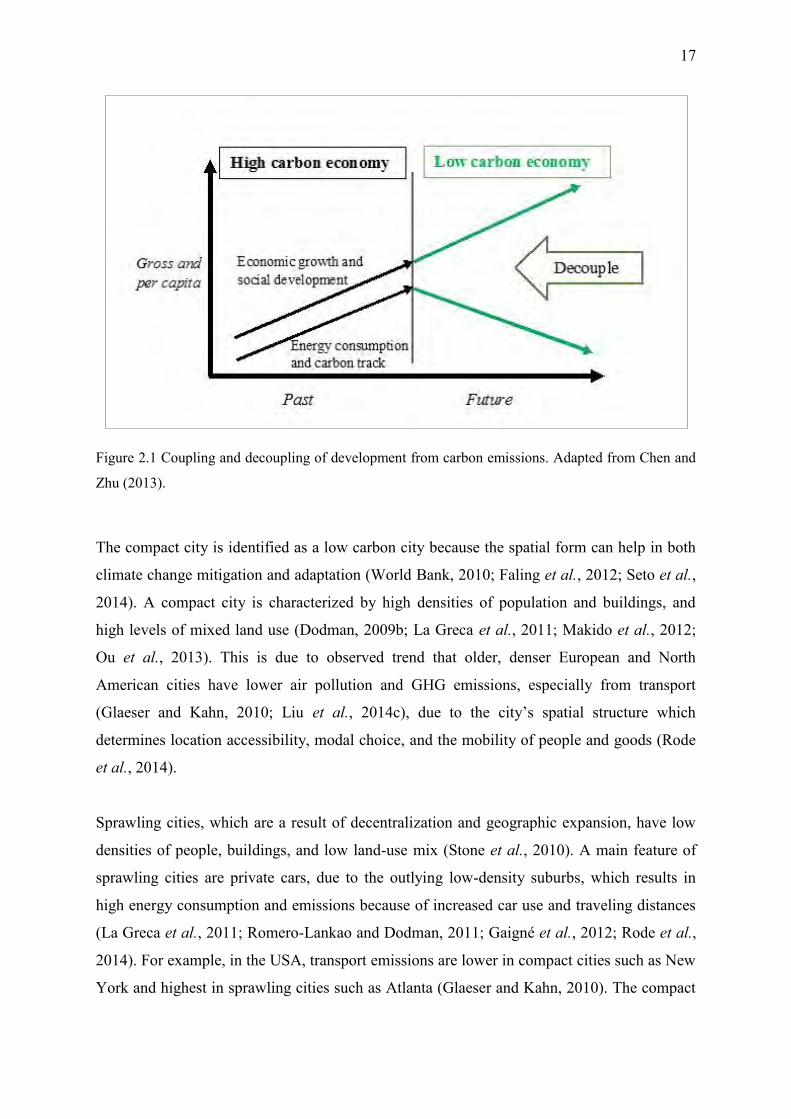
2014; Jabareen, 2015). Chen and Zhu (2013) presented two classifications of low carbon city
based on economics. From a macro perspective, economic development must be decoupled
from energy consumption or CO2 emissions (Figure 2.1; p. 17). The micro-economic point of
view focuses on material flows to decrease resource use, increase use of renewable resources,
and enhance carbons sinks (Chen and Zhu, 2013).
17
Figure 2.1 Coupling and decoupling of development from carbon emissions. Adapted from Chen and
Zhu (2013).
The compact city is identified as a low carbon city because the spatial form can help in both
climate change mitigation and adaptation (World Bank, 2010; Faling et al., 2012; Seto et al.,
2014). A compact city is characterized by high densities of population and buildings, and
high levels of mixed land use (Dodman, 2009b; La Greca et al., 2011; Makido et al., 2012;
Ou et al., 2013). This is due to observed trend that older, denser European and North
American cities have lower air pollution and GHG emissions, especially from transport
(Glaeser and Kahn, 2010; Liu et al., 2014c), due to the city’s spatial structure which
determines location accessibility, modal choice, and the mobility of people and goods (Rode
et al., 2014).
Sprawling cities, which are a result of decentralization and geographic expansion, have low
densities of people, buildings, and low land-use mix (Stone et al., 2010). A main feature of
sprawling cities are private cars, due to the outlying low-density suburbs, which results in
high energy consumption and emissions because of increased car use and traveling distances
(La Greca et al., 2011; Romero-Lankao and Dodman, 2011; Gaigné et al., 2012; Rode et al.,
2014). For example, in the USA, transport emissions are lower in compact cities such as New
York and highest in sprawling cities such as Atlanta (Glaeser and Kahn, 2010). The compact

18
city is also associated with residential energy efficiency and the increased use of public
transport by households, which reduce fossil fuel consumption, and thus emissions, as
revealed by Ou et al. (2013) and Makido et al. (2012) for Chinese and Japanese cities
respectively.
However, the compact city also brings challenges when densities are too high. Increased
densification concentrates urban activities which increases noise, reduces air quality, causes
traffic congestion and the urban heat island effect, (Carsjens and Ligtenberg, 2007; Gaigné et
al., 2012; Makido et al., 2012; Walsh et al., 2013), overcrowding (Liu et al., 2014c), and the
loss of permeable surface and vegetation cover, thus potentially increasing flood risks
(Hamin and Gurran, 2009). Simply understood, mitigation requires densification to reduce
distances travelled and fuel consumption, however adaptation measures require open space
for storm-water management, urban cooling, and biodiversity conservation (Hamin and
Gurran, 2009). Therefore, this can lead to conflicts in addressing climate change and termed
by de Roo (2000) as the ‘compact city paradox’. Thus, Muniz et al. (2013) argued that
policies cannot be based on compactness alone.
When considering emissions and urban form, Heinonen and Junnila (2011) revealed that
urban density in Finnish cities have a minimal effect on carbon emissions yet the cities have
dense centres, diverse public transport whilst suburbs have lower building density and use
more private transport. Furthermore, Makido et al. (2012) argued that the compact urban
form limits flexible building design which uses natural lighting and ventilation. Studies on
the benefit of compact cities are largely focused on the residential and transport sectors, and
do not include the implications for waste management (Muniz et al., 2013), the impact of
industrial structure, technological advancement, and the role of institutions (Makido et al.,
2012; Qin and Wu, 2014).
As developing countries grow, the level of social inequality in the country also increases,
which is further compounded by urban sprawl (Romero-Lankao and Dodman, 2011).
Furthermore, Singh and Kennedy (2015) revealed, in a study of emission scenarios, if urban
density stays the same as the rates for the year 2000 and the urban population increases, then
by the year 2050, both electricity and transport emissions can double. Therefore, planners do
have many reasons to adopt high density compact city planning due to the positive impacts
on social equity, the environment and GHG mitigation (Dulal et al., 2011; Seto et al., 2014).

19
However caution must be applied so that densities are not too high (Muniz et al., 2013). In
developing cities, high densities are associated with informal settlements and negative health
issues such as poor air quality, sanitation and improper waste management (Friedrich and
Trois, 2011; Romero-Lankao and Dodman, 2011). Nevertheless, this is an opportunity for co-
benefits, to simultaneously improve reduce GHG emissions and improve local and global
conditions, through effective planning and policy (Romero-Lankao and Dodman, 2011).
Therefore, before establishing the opportunities in the city to reduce GHG emissions and
identify co-benefits, it is important to quantify emissions from all sectors by producing an
emissions inventory (VandeWeghe and Kennedy, 2007; Hillmer-Pegram et al., 2012; Yu et
al., 2012; Jones and Kammen, 2014). This information assists policy makers and city
planners to make informed decisions about reduction strategies, management systems and
infrastructure improvement and thus facilitate low carbon city planning.
2.3 Emissions Inventory
Emissions are the physical transfer of material, across a boundary, from one compartment of
the world to another, due to natural or human activities (Winiwarter and Schimak, 2005). In
this study, emissions are the flows into the environment attributed to human activities and
thus, can be regulated and limited by humans (Winiwarter and Schimak, 2005). An emissions
inventory accounts for the anthropogenic emissions of place, system, or boundary for a
specified time period (Hillmer-Pegram et al., 2012). The purpose of atmospheric emission
inventories are for: (i) regulation (with air pollution emission standards and the declaration of
CO2 and GHG as priority pollutants), (ii) compliance (with international air pollution and
climate protocols), and (iii) inputs in air quality and climate change models to develop future
scenarios and projections (Ferreira et al., 2013).
According to the World Bank (2010) and the World Resources Institute (WRI, 2014), the
compilation of emissions inventory is the first step in the shift towards low carbon
development. An emissions inventory indicates the emissions-intensive sectors, so that
emissions reduction plans can be developed and progress towards mitigation goals can be
tracked (Figure 2.2; p. 20) (Dalvi et al., 2006; Kennedy et al., 2010; Hillmer-Pegram et al.,
2012; Ibrahim et al., 2012; Yu et al., 2012; Singer et al., 2014; WRI, 2014).

20
Figure 2.2 GHG emissions inventory and mitigation cycle. Adapted from the WRI (2014).
Moreover, a growing number of researchers (Tuia et al., 2007; VandeWeghe and Kennedy,
2007; Knuth, 2010; Davidson et al., 2011; Jones and Kammen, 2014; Velasco et al., 2014;
Guo et al., 2015) stated the need for identifying the spatial distribution of emission activities.
Furthermore, the emissions profiles generated, together with the city or country’s’ resource
base, can be used by government to assess future development pathways and their proficiency
to apply the changes needed to reduce emissions (Garibaldi et al., 2014). Emissions
inventories are significant public policy instruments (D'Avignon et al., 2010) that are vital in
determining fairness and equity in global climate change negotiations (Huang and Meng,
2013). The quantification of the impact of human activities in terms of CO2 emissions is
becoming an increasingly popular task, for nations, local governments, corporations and even
individuals (WRI, 2014).

21
The most commonly used method to calculate emissions is building an emissions inventory,
which is a list of emission sources and sectors, including their temporal and spatial resolution
(Winiwarter and Schimak, 2005; IPCC, 2006; Bellasio et al., 2007). Broadly, there are two
methods to quantify emissions in an inventory; (i) direct (in situ) quantification methods
through mass balance method, continuous emissions monitoring, and flux measurements, and
(ii) indirect, through estimations using emission factor-based method (IPCC, 2006; WRI,
2014).
2.3.1 Direct and Indirect Measurements
The reasoning behind direct monitoring is that higher mixing ratios are found closer to
emission sources, under constant atmospheric conditions (Christen, 2014). Direct monitoring
of emissions can be made from instruments on board satellites, which measure the GHG mole
fractions in the atmospheric column. However, this is done at coarse spatial scales (Manfredi
et al., 2009). At finer than local scales, emissions monitoring have focussed on processes
(combustion or leaks), transect measurements (using gas analysers) or along a fixed vertical
profile (use of towers). These methods measure emissions at the actual location of release and
is realistic, however it is expensive and impractical, especially for developing nations
(Hillmer-Pegram et al., 2012; Ou et al., 2013).
Flux measurements are from towers that directly quantify GHG emissions and the uptake by
eddy covariance (Christen, 2014). Eddy covariance is a micro-meteorological method which
measures the exchanges of GHG between the surface and atmosphere (Vaccari et al., 2013),
and have been recently applied to urban areas (Vaccari et al., 2013; Christen, 2014; Velasco
et al., 2014). The flux measurement area ranges from 0.2 - 5 kilometres square (km2), and can
be used as grid inputs, but cannot be considered as typical of the whole city (Christen, 2014).
Furthermore, this method is dependent on specific atmospheric conditions and terrain criteria
for monitoring sites, such as neighbourhood scale, with flat landscapes, uniform buildings,
land use and land cover (Christen, 2014; Velasco et al., 2014; Gioli et al., 2015) thus is not
applicable to all cities. The financial and technological resources required to obtain
instruments are other considerable constraints in developing cities (Hsu et al., 2013; Gioli et
al., 2015). However, these approaches are important for validating emissions inventory

22
calculations, determining emission factors, and monitoring of CO2 emissions (Christen, 2014;
Gioli et al., 2015). The equation for the direct measurement of emissions from direct
monitoring, mass balance or stoichiometry is:
𝐺𝐻𝐺 𝑒𝑚𝑖𝑠𝑠𝑖𝑜𝑛𝑠 = 𝐸𝑚𝑖𝑠𝑠𝑖𝑜𝑛𝑠 𝑑𝑎𝑡𝑎 × 𝐺𝑊𝑃 (12
44) (1)
Where, GHG emissions are reported in tCO2e and emissions data refer to the weight of gas
(WRI, 2014).
From a sustainability perspective, there is increasing attention on activities; which can refer
to the activity that is responsible for the emissions polluting process, or the activity which has
produced the actual emissions pollution (VandeWeghe and Kennedy, 2007; Peters and
Hertwich, 2008). The most commonly used method is emission factor-based method
(equation 2) where GHG emissions are the product of activity data (AD) and emission factors
(EF), which are proxy information (IPCC, 2006; Velychko and Gordiyenko, 2009):
𝐺𝐻𝐺 𝑒𝑚𝑖𝑠𝑠𝑖𝑜𝑛𝑠 = 𝐴𝐷 𝑥 𝐸𝐹 𝑥 𝐺𝑊𝑃 (2)
Where, AD refers to the level of human activity, such as energy consumption, and EF is
emissions from per unit activity and GHG emissions are expressed in tCO2e per activity.
Emission factors express the mass of GHG emitted per activity or energy use and assumes a
linear relationship with activities, however, in reality, this is not the case as it is a complex
relationship (van Aardenne and Pulles, 2002; Christen, 2014; Wattenbach et al., 2015).
Emission factors are determined in controlled environments with small sample sizes
(Christen, 2014). Additionally, for CO2, the emission factor is well defined, however for CH4
and N2O there are uncertainties associated with the combustion process (Christen, 2014).
Emission models can also be used to calculate emissions from activity data and emission
factors, which are often sector-specific (Winiwarter and Schimak, 2005). However emission
models require a large amount of background data inputs therefore the use of emissions
models are limited for developing nations due to the data requirements and costs, as it is
already difficult to compile emission inventories (Dhakal, 2010). Christen (2014) confirmed

23
the value of both estimations and in-situ measurements of emissions. The calculation of
emissions from activities are required for policy and planning to mitigate emissions, and
direct measurements are needed to verify and evaluate existing emissions calculations,
activity data and emissions sources, emissions inventory models, and identify missing
emission sources (Christen, 2014). Ultimately, the best approach for emissions inventory is a
combination of direct measurements, activity data calculations, and emissions modelling, as
each aspect can be used to verify the others.
2.3.2 Top-down and Bottom-up Approaches
A bottom-up emissions inventory approach involves adding the results of a detailed
calculation on each individual emission source (Tsilingiridis et al., 2002; Larsen and
Hertwich, 2009). However, the bottom-up approach requires local level data, which is often
unavailable and difficult to collect, especially in developing nations, thus it is reasonable to
use top-down approaches (Dhakal, 2009). The top-down approach distributes overall
emission estimates from the national or provincial scale to individual emission sources by an
appropriate disaggregation proxy such as population density, land use and land cover,
building density, or road density (Tsilingiridis et al., 2002; Parshall et al., 2009; Christen,
2014). The success of specific local mitigation actions, whether place-based or sector-based,
is difficult to assess with the top-down approach (Larsen and Hertwich, 2009). Moreover, the
top-down approach is unsuitable for scenario forecasting and projections due to many
uncertainties at fine spatial scales (Kellett et al., 2013; Christen, 2014). However, it is
generally accepted that the best approach is a combination of top-down and bottom-up
(Kellett et al., 2013).
2.3.3 Boundaries and Scopes
The compilation of national emissions inventories is easier as the majority of emissions occur
within the country’s boundaries (Hillman and Ramaswami, 2010). The numerous definitions
of boundaries for cities (Seto et al., 2014) have produced differing and conflicting results in
CO2 emissions. An example of the disparity was demonstrated by Cai and Zhang (2014)
where different urban boundary definitions in China resulted in CO2 emission differences as

24
high as 654%. This indicated that a fundamental aspect of defining boundaries can result in
vastly different emissions. Thus, it is imperative that the boundary of the city is properly
defined. To separate emissions from what is generated inside the city boundary and across
boundaries, the WRI (2014) developed scopes for cities. Scopes are the conceptual
organizational boundaries of emission categories which cities should be held responsible for
and guides methodology, data collection, and prevents double counting of emissions (Lebel et
al., 2007; Ramaswami et al., 2008; Bader and Bleischwitz, 2009; Kennedy et al., 2009;
Kennedy and Sgouridis, 2011; Lazarus et al., 2013; WRI, 2014).
2.3.4 Inventory Methods
Emissions inventories based on activity data are calculated for local municipal operations
only or for the whole city, which is referred to as community emissions (ICLEI, 2010; ICLEI,
2014) and also with the help of emissions models. Emissions modelling require assumptions
and estimates based on judgement, and are associated with uncertainty (Zheng et al., 2015).
However, the commonly used models, such as Long Range Energy Alternative Planning
(LEAP), used to develop Durban’s emission scenarios (Moolla, 2010), and Market Allocation
Model (MARKEL), used to model SA emissions (Merven et al., 2013), do not have a spatial
dimension and lacks relation to urban planning and development (Larson et al., 2012; Tanoto
and Handoyo, 2014). Furthermore, these models are more suited for the national and regional
scales and energy (Bhattacharyya and Timilsina, 2010) and energy-supply side modelling
(Merven et al., 2013).
Although high quality emissions modelling are important, municipalities need an
inventorying approach that yields results in quick time, can be easily applied and integrates
the biggest emission drivers (Baur et al., 2015). Furthermore, the use of datasets which are
already available are preferred to save costs, time and resources (Price et al., 2013), as data
collection is the most intensive aspect of an emissions inventory (Dhakal, 2009; Weisz and
Steinberger, 2010; Huang and Meng, 2013; Price et al., 2013). Furthermore, many local
governments in SA do not have the resources to spend on modelling, as these energy models
are expensive, specialized software that require detailed data inputs, and even if they are free,
municipalities often lack the human and technical capacity (Merven et al., 2013).

25
Furthermore, the nature of the urban form, which is complex and concentrates people and
activities, makes in-situ monitoring of emissions challenging (Kellett et al., 2013). Thus, a
growing number of researchers (Tuia et al., 2007; VandeWeghe and Kennedy, 2007; Knuth,
2010; Davidson et al., 2011; Jones and Kammen, 2014) argued for the calculation and
mapping of emissions from the end-user location, for example, electricity consumption in
buildings, as the end user is ultimately responsible for the action which has led to emissions
release and thus, vital for planning and mitigation strategies. The three main methods that are
commonly used for local scale emissions inventories are (i) production (ii) consumption, and
(iii) life cycle which are discussed in detail below:
2.3.4.1 Production- based Method
The production-based method accounts for emissions which are released directly from
sources within the city’s geographically-defined boundaries (Weisz and Steinberger, 2010;
Minx et al., 2013). For example, electricity emissions are allocated to the location where they
are generated and not where they are consumed. This approach is exemplified by the IPCC
(2006) national inventory method. The results from production perspective showed that cities
can significantly lower emissions through energy efficient urban form (Weisz and
Steinberger, 2010). However, Bastianoni et al. (2004) reasoned that this method is unfair,
specifically, that a place which produces goods for exports will have a high level of GHG
emissions, and places which imports goods will have a low level of emissions.
The production method is associated with ‘carbon leakage’ (Peters and Hertwich, 2008;
Muñoz and Steininger, 2010; Paloheimo and Salmi, 2013), that occurs in embodied imports
from developing areas to developed areas because of the relocation of high-emitting
activities, due to environmental and carbon emissions regulations, and the decrease of
emissions in one area is associated with increase of emissions in another area (Parshall et al.,
2009; Muñoz and Steininger, 2010; Bednar-Friedl et al., 2012; Geels, 2014). An example was
found by Su et al. (2010) in China, where the developed regions are net importers of
emissions and the developing regions are net exporters of emissions.
The majority of studies on CO2 emissions are from the production perspective (Dhakal, 2010;
Muñoz and Steininger, 2010) due to the prevalence of the IPCC (2006) methodology
26
guidelines. However, it is widely acknowledged that production-based inventories are useful
but insufficient for the city-scale (Ramaswami et al., 2008; Kennedy et al., 2009; Hillman
and Ramaswami, 2010; Ho et al., 2013). Therefore the production perspective needs to be
complemented with the consumption and life cycle approaches to distribute responsibility
(Peters and Hertwich, 2008; Minx et al., 2013).
Example of Method: IPCC (2006) Guidelines
The IPCC (2006) emissions inventory guidelines were designed for the national level, but are
applied to the local level, as they are the most comprehensive guidelines and the first
published guidelines. The main sources of emissions that must be included are energy,
Industrial Processes and Product Use (IPPU), Agriculture, Forestry and Other Land Use
(AFOLU), and waste. The IPCC (2006) uses the concept of three tiers to assess accuracy of
the methodology: Tier 1 is the basic method, that uses general activity data and default
emission factors therefore it is feasible for all countries. Tier 2 and Tier 3 are intermediate
and complex methods respectively, which require disaggregated activity data and country-
specific emission factors.
The value of this method is in the provision of detailed information and guidelines, the varied
database and default emission factors, when country-specific data are unavailable, which are
internationally recognized and applied (Ibrahim et al., 2012). However, the limits of this
method are: it does not recognize the WRI (2014) definitions of scopes, which are
specifically applied to smaller scale accounting (Ibrahim et al., 2012) and the emission
categories cannot be directly related to GDP (Peters and Hertwich, 2008). The major limit is
that cities differ from countries in terms of scale, processes, and services; therefore it is not
ideal to apply national guidelines to the city-scale, as it will not be representative of cities
contribution to global emissions (D'Avignon et al., 2010; Harris et al., 2012).
2.3.4.2 Consumption-based Method
This approach recognizes that the concentration of population and activities in cities rely on a
wide array of resources and ecosystem services from outside the cities geographical boundary

27
(Weisz and Steinberger, 2010; Romero-Lankao and Dodman, 2011) therefore the method
used to calculate city emissions need to differ from national inventory method as many cities
are service-orientated (Ramaswami et al., 2008; Dhakal, 2010; ICLEI, 2014). Therefore, it is
preferable to calculate emissions from the consumption activities as they are ultimately
responsible for emissions, therefore the inventory is based on the location of activity and not
on the location of physical emissions release (VandeWeghe and Kennedy, 2007;
Satterthwaite, 2008; Larsen and Hertwich, 2009; Heinonen and Junnila, 2011; Paloheimo and
Salmi, 2013; Jones and Kammen, 2014; Zhang et al., 2014). This approach also accounts for
responsibility and carbon leakage (Peters and Hertwich, 2008; Muñoz and Steininger, 2010),
however there is a paucity of studies from the consumption perspective (Ho et al., 2013).
The results of consumption-based emissions inventories revealed that urban areas have
almost double the amount of emissions, when compared to the production-based method
(Dhakal, 2010). However, urbanization is not the main problem but the high-income
lifestyles which often accompanies urbanization are responsible for high emissions
(Satterthwaite, 2009; Weisz and Steinberger, 2010; Weinzettel et al., 2013; Seto et al., 2014;
Huisingh et al., 2015). Furthermore, the significant relationship between high population
densities and lower emissions in cities (i.e., the compact city) were discovered through the
consumption method (Dodman, 2009b). Additionally, the savings of energy efficiency and
consumer choices are often underestimated in emission reduction policies (Girod et al.,
2014). The information from consumption-based inventories can be used to track the
performance of key sectors and the effectiveness of strategies (Ramaswami and Chavez,
2013) because emissions are expressed based on the location of important sectors, such as
residential, commercial, and industrial buildings, transport, and waste (Bulkeley and Betsill,
2005; Dulal and Akbar, 2013; Paloheimo and Salmi, 2013; Jones and Kammen, 2014).
The various criticisms and limitations of this method are: Satterthwaite (2008) and Dodman
(2009a) argued that the actual urban contribution to CO2 emissions are lower because urban
areas provide through-traffic and through-services. However, cities consume materials which
are produced elsewhere and energy and GHG emissions are embedded in the goods and
service flows of cities (Romero-Lankao and Dodman, 2011). Bastianoni et al. (2004) and
Dhakal (2010) pointed out that the consumption perspective attributes the majority of carbon
mitigation burden to commercial cities, due to their service demand, thus releasing industrial
cities of the responsibility to adopt cleaner production systems. Therefore, results from this

28
method places much emphasis on consumers and individuals to be responsible and choose
products and services associated with cleaner energy and efficiency yet places no
encouragement for producers to reduce emissions (Bastianoni et al., 2004).
Example of Method: ICLEI
The ICLEI- Local Governments for Sustainability was one of the first organizations to
recognize the importance of addressing emissions at the local scale and to assist local
governments in conducting GHG emissions inventories (Wilbanks et al., 2003). Their main
objective is to support to local government efforts to reduce emissions, and simultaneously
identify sustainable development goals such as curbing urban sprawl and develop efficient
public transport systems (ICLEI, 2010).
The major strengths of this method include: the methodology requires minimal time and
resources; therefore it is applicable to cities, especially in developing countries, which have
limited resources and other challenges to address, that are seen as more urgent than emissions
inventory (Holgate, 2007). Furthermore, over 1000 cities and towns are part of the ICLEI
network (Feng et al., 2015), which enables comparison, learning, and sharing (Holgate,
2007). However, the ICLEI (2014) method is limited because it is not as comprehensive as
the IPCC (2006) emission categories as marine, aviation, and AFOLU emissions do not need
to be reported (Ibrahim et al., 2012). Although the energy sector is broken down into sub-
sectors, such as residential, commercial, and industry, this method is limited as road transport
does not have sub-sectors such as vehicle types. Furthermore, cities undertake and complete
the inventories themselves thus have the freedom to choose their own data sources, baseline
year, detail level, and also whether to publish the inventory results (Parshall et al., 2009).
2.3.4.3 Life Cycle-based Method
There is a growing number of studies in support of including embodied emissions (Peters and
Hertwich, 2008; Ramaswami et al., 2008; Kennedy et al., 2010; Ramaswami and Chavez,
2013). Life cycle assessment (LCA) is a widely accepted method for holistically estimating
the GHG emission of a product or service, and is guided by the International Organization for

29
Standardization (ISO) 14000 environmental management standards (Shi and Meier, 2012).
This approach is similar to consumption, as it also avoids carbon leakage. However, the
application of LCA is difficult as the urban structure is complex with a wide range of
variables (Heinonen and Junnila, 2011). Thus, these studies are limited in understanding the
complexity of indirect emissions and responsibility attribution, with the majority of studies
undertaken at the product level (Plassmann et al., 2010; Heinonen and Junnila, 2011).
Additionally, the flexibility of the LCA method prevents comparisons (Plassmann et al.,
2010).
Barton et al. (2008) used the LCA for waste emissions and found that sanitary landfills with
gas collection and electricity generation emitted the least GHG emissions of 0.09 tCO2e per
ton of waste, and sanitary landfills which lack landfill gas capture produced the most
emissions (1.2 tCO2e per ton of waste). Manfredi et al. (2009) undertook a similar study for
developed nations only and found that low-organic carbon landfills that are in Europe emits
0.07 tCO2e per ton of waste.
Example of method: Urban Metabolism
The metabolism of a city is similar to the metabolism of on organism, as it requires inputs of
resources (energy, electricity, water, food) and releases outputs, such as waste, heat,
pollutants, and GHG emissions (VandeWeghe and Kennedy, 2007). However, natural
metabolism systems are self-sustaining and self-maintaining but the urban system requires a
constant intake of resources from areas (Kellett et al., 2013). The resources required by the
urban system often extend beyond the spatial boundary and extent of the city (Minx et al.,
2010). This concept is often used as the framework for calculating city-level CO2 emissions
using energy, census and economic data (Hoornweg et al., 2011; Kellett et al., 2013).
Theoretically, the urban metabolism concept provides a complete and inclusive picture of
processes of a city, however there are difficulties in application because the concept requires
comprehensive data thus, there is a lack of complete quantification of city urban metabolism
(Minx et al., 2010). The majority of the sub-sectors modelled in city urban metabolism
studies are buildings, transport, vegetation, and soils (Kellett et al., 2013). VandeWeghe and
Kennedy (2007) showed that land-use patterns, road networks, building types, technology

30
and behaviour influences energy demand and carbon emissions, and these factors differs
significantly within an urban area. Therefore the application of the urban metabolism
framework is most suited for the smaller neighbourhood scale as it is difficult to apply to a
whole city, province or country (VandeWeghe and Kennedy, 2007; Kellett et al., 2013).
2.3.4.4 Carbon Footprint
A carbon footprint is a measure of the direct or indirect CO2 emissions caused by an activity
or product from consumption or during its’ life cycle (Wackermagel et al., 2006; Wiedmann
and Minx, 2008; Plassmann et al., 2010; Muniz et al., 2013) and often used interchangeably
with life-cycle perspective (Shi and Meier, 2012); however, there are two views on carbon
footprints. The first view regards carbon footprint as the carbon emissions of human activities
and measures an emission amount (Wiedmann and Minx, 2008; Shi and Meier, 2012). This
view is similar to emissions inventory and typically uses the WRI scope definitions to
calculate emissions (Shi and Meier, 2012). The alternate view defines carbon footprint as
based on the ecological footprint concept, thus calculates the ecological carrying capacity
required to absorb CO2 emissions from fossil fuel combustion (Wackermagel et al., 2006;
Wiedmann and Minx, 2008). The amount is often expressed as carbon footprint per unit area
and includes the calculation of carbon sinks, which is the ability of vegetation and soil to
absorb carbon (Chuai et al., 2012). Chuai et al. (2012) applied this definition of carbon
footprint and found the carbon sink from productive land (woodland and grassland) in China
is insufficient to reduce the carbon footprint of energy consumption from industrial areas, as
carbon emissions increased by 125.46% between 1991-2008 while the carbon sinks can only
absorb 16.43% of emissions.
2.3.4.5 Summary of Emissions Inventories
The studies reviewed on urban emissions inventories encompassed a wide range cities that
differ in emission sources, economic structure (such as manufacturing and service industries),
development, local climate, and state of public transport systems. The sectors covered by
urban emissions inventories included energy use and waste from cities in Canada
(VandeWeghe and Kennedy, 2007; Hoornweg et al., 2011; Mohareb et al., 2011), USA

31
(Parshall et al., 2009; Glaeser and Kahn, 2010), Europe (Gomes et al., 2008; Baur et al.,
2015), UK (Minx et al., 2013); China (Dhakal, 2009; Bi et al., 2011; Geng et al., 2011; Xi et
al., 2011; Zhao et al., 2011; Chuai et al., 2012; Harris et al., 2012; Feng et al., 2014; Liu et
al., 2014b; Su et al., 2014; Fang et al., 2015; Feng et al., 2015; Wang et al., 2015 ), Japan
(Makido et al., 2012), and South Africa (Thambiran and Diab, 2011a; Thambiran and Diab,
2011b; Ramsay and Naidoo, 2012; Friedrich and Trois, 2015). Furthermore, the studies on
city-scale GHG emissions have used various methods and activity data to account for the
emissions; such as combining various data to estimate activity, using average activity levels,
disaggregating regional, provincial and national data, and modelling. Due to a variety of
methods, definitions, and level of data availability and quality, there are inconsistencies in the
gases covered, emission sources and sector, scope and boundaries, and emission factors
(Bader and Bleischwitz, 2009; Kennedy et al., 2010; Romero-Lankao and Dodman, 2011;
Ibrahim et al., 2012; Seto et al., 2014). The aviation and marine transport sub-sectors also
have their complexities because they interact and extend city and national boundaries, and are
also estimated through various approaches (Kennedy et al., 2009; Villalba and Gemechu,
2011).
The inventorying methods discussed were devised by researchers and institutions from
developed nations, thus the vast majority of studies are focussed on developed cities
(Plassmann et al., 2010; Seto et al., 2014). The majority of studies for cities are from the
production perspective thus, there is a gap in emissions profiles from the consumption and
life cycle perspectives (Wheeler, 2008; Girod et al., 2014). Furthermore, Wheeler (2008)
stated that, often when emissions inventories are compiled at the local level, it is regarded as
a major achievement itself, therefore falls short in applying the knowledge generated and
implementing the recommendations.
Hence, cities, especially developing cities, require an emissions inventory method from a
spatial perspective, which is easily applied, to identify zones within the city, so that
mitigation efforts can be focused, due to the limited resources available. Furthermore,
inequalities in developing cities are increasing, therefore the city cannot be considered as
homogenous, because there will be various emissions profiles based on the different
conditions within the city. Therefore, there is need to find a way to apply information from
the emissions inventory to improve the city, such as delivering developmental co-benefits.

32
2.3.5 Emission Indicators
The concept of indicators was highlighted at the 1992 Rio Earth Conference to provide a
solid basis for decision-making (Hsu et al., 2013). Indicators involve a numerator and a
denominator and presents data to describe the state of something (Hsu et al., 2013; Zhou et
al., 2014). Emission indicators are essential to measure, evaluate and track the performance
and progress of cities towards mitigation targets and respond effectively, thus forming part of
integrated environmental management (Parshall et al., 2009; Shen et al., 2011; Lin et al.,
2014; Liu et al., 2014a). Emissions indicators are also used to measure efficiency and enables
comparison between places (Villalba and Gemechu, 2011).
However, developing countries lack performance indicator systems and strategies, with the
majority of indicator studies and use in developed countries (Zhou et al., 2014). Furthermore,
indicators are usually prepared at the national level (Moghaddam et al., 2013), thus there is a
paucity of indicator studies to assess variability at the local level. In addition, there is a lack
of consensus on indicator types, methodology, data sources, weighting of variables, and
whether there should be single or multiple indicators (Zhou et al., 2014). Economic based or
population based macro-indicators, which measure the carbon intensity of an area, are often
used by cities. Furthermore, Ramaswami and Chavez (2013) motivated for the use of per
capita indicators for consumption-based inventories and GDP indicators for production-based
inventories. These types of indicators are discussed below.
2.3.5.1 Economic-based Indicators
The economic-based emission indicators are based on economic activity, and the most
commonly used unit is GDP, which is a measure of the market value of all final goods and
services produced in a country in a given period (Moghaddam et al., 2013). For the local
scale, gross value added (GVA), which is similar to GDP, is the appropriate unit of analysis
(Price et al., 2013). This indicator is expressed as amount of CO2 emitted per economic
activity, based on energy intensity (Price et al., 2013).
33
Economic based indicators provide sector specific information and measures of efficiency,
because the dominant economic sector has political, environmental, and socio-economic
impacts on the city (Zhou et al., 2014). These indicators are also considered mixed indicators
because they account for both energy efficiency and the economic structure, which drives
energy consumption (Price et al., 2013; Lin et al., 2014). The application of these indicators
by Lin et al. (2014), in low carbon development scenarios for Xiamen (China), revealed that
as economic development in the city will increase, the energy intensity will decrease, but
carbon emissions will rise.
The implications of this indicator was considered by Moghaddam et al. (2013), which
claimed that a country will favour this indicator if they have a high GDP and high emissions,
such as the USA (Singer et al., 2014), as emissions and GDP are considered proportional.
Furthermore, Price et al. (2013) found these indicators favour the more economically
developed regions, as regions that consume more energy can be given the status of low
carbon, and regions that have power plants are designated high carbon areas. Additionally,
the energy consumption of buildings is dependent on weather conditions of a region and
indicators ignore these differences (Price et al., 2013).
2.3.5.2 Population-based Indicators
One of the most popular emission indicators is based on population which express CO2
emissions per person (capita) (Moghaddam et al., 2013; Singer et al., 2014). Population
growth is considered a threat to sustainability and a major driver of emissions (Friedrich and
Trois, 2013; Moghaddam et al., 2013). However, this is countered by minimal contribution to
global emissions, from developing nations with large populations, such as African countries
(Satterthwaite, 2009). Research has indicated that it is increasing over-consumption by the
affluent which are major emission drivers (Hughes and Johnston, 2005; Satterthwaite, 2009;
Weinzettel et al., 2013; Shaker, 2015). Therefore, population growth is not a problem itself,
but is rather a symptom of unsustainability, such as lack of access to resources, increasing
social inequality and poverty, which are features of developing countries.
34
However, individual scale indicators can help connect citizens to the global scale (Ramsay
and Naidoo, 2012) and individual mitigation measures, when viewed collectively, are
important for mitigation (Moriarty and Honnery, 2015). Generally, wealthy, more developed
nations have higher per capita emissions than less developed countries (Satterthwaite, 2009;
Singer et al., 2014). However, there are variations within developing nations, as their
economies are rapidly growing, the inequalities are also rapidly increasing, therefore there
exists increasingly wealthy and increasingly deprived conditions in developing nations
(Romero-Lankao and Dodman, 2011).
According to Singer et al. (2014), per capita emissions are considered misleading, as it
implies individual responsibility, when there are other factors which often place more
pressure than population (Burgalassi and Luzzati, 2015), for example, affluence and
economic development (Hughes and Johnston, 2005; Satterthwaite, 2009; Weinzettel et al.,
2013; Singer et al., 2014; Shaker, 2015). Furthermore, problems with this indicator arise
when there is a city with a small population and heavy industry which produces exports
(Ramaswami and Chavez, 2013). This will result in the city having high energy consumption
and emissions per capita, yet the population uses little residential energy. Another criticism of
this indicator is that cities with a moderate climate will always have less energy consumption
than cities with cold climates (Price et al., 2013). Additionally, migrant populations can cause
over-estimation or underestimation of the indicator (Price et al., 2013).
Although macro-indicators are commonly used to express carbon intensity and emissions,
they are considered too aggregated to provide significant information on whether a city is
really low carbon (Price et al., 2013; Lin et al., 2014), as they are based on a top-down
approach. Price et al. (2013) found that with the GDP indicator, China’s emissions are 20
times more carbon intensive than major international cities. In contrast, the per capita
indicator suggested that emissions are similar to major international cities. Macro-indicators
do not show inefficiencies or where actions and interventions are required and depending on
whether the indicator is economic-based or population-based, it can be well received in one
country and rejected in another (Yu et al., 2012; Moghaddam et al., 2013).

35
2.3.5.3 Other Indicators
In response to the shortcomings of macro-indicators, Moghaddam et al. (2013) and Price et
al. (2013) developed other indicators. Moghaddam et al. (2013) developed an international
indicator called the Modified GHG Intensity (MGHG-INT), based on GHG intensity, that
accounted for a country’s production and consumption activities, using GDP, population, and
the Human Development Index (HDI). However, high HDIs can correspond with both low
and high carbon emissions (Sperling and Ramaswami, 2013). The study by Moghaddam et al.
(2013) also used the concept of emission debts and credits to define the emission per capita
allowed for country. However, Moghaddam et al. (2013) results showed the most admissible
emissions allowed are for developed countries such as, USA, Japan and Germany (due to
high GDP and HDI) and the major emerging countries such as China and India (due to high
GDP) whilst African countries are allowed the least admissible emissions (due to low GDP
and HDI).
Price et al. (2013) developed a sectoral end-use energy low carbon indicator system, for cities
and provinces in China, to calculate the energy and carbon intensity of end users (industry,
residential, commercial, transport) with a ranking and weighting system. The results from
Price et al. (2013) revealed both the eastern and southern provinces have the lowest carbon
emissions, yet the GDP indicator revealed only the southern provinces have the lowest
emissions. However, this method is insufficient in defining low carbon cities, as it does not
provide a specific value that is considered as low carbon.
However, the indicators reviewed do not calculate what is required to reduce emissions, as in
provide a benchmark. Due to the range of indicators, and lack of standardized indicators, a
variety of emission indicators can be used for a city. Furthermore, indicators, whether at a
national or city-scale, are considered misleading by Yu et al. (2012) because countries or
cities are regarded as homogenous. Furthermore, the inappropriate indicator choice has
serious implications and can result in missed opportunities to focus on specific areas that
could have the most impact achieving a low carbon city (Price et al., 2013). The use of
macro-indicators, without the proper context, can result in contradictory conclusions and no
single indicator can fully explain the emissions situation of a city or area.

36
2.3.6 Emission Inventory Uncertainties
Uncertainty refers to a lack of knowledge on accuracy and reliability (van Aardenne and
Pulles, 2002). Reliability is the degree in which the inventory can be trusted to meet the user-
specific requirements. From a scientific perspective, the reliability of the emissions inventory
is directly related to accuracy as atmospheric models require accurate estimations of
emissions to understand the chemical and physical processes of emissions in the atmosphere;
whilst for policy purposes, accuracy is one of five conditions that need to be met (van
Aardenne and Pulles, 2002). Other conditions are transparency, consistency, comparability,
and completeness (IPCC, 2006). Accuracy refers to the level which the inventory is a true
representation of reality (van Aardenne and Pulles, 2002). There are two types of inaccuracy
from inventories, structural and input value, each with their own associated categories (Table
2.2; p. 37) (van Aardenne and Pulles, 2002).
Uncertainties in the inventory are due to assumptions, diverse data sources, various emission
factors, inventory processes, and the random errors associated with measurement and
statistics (Rypdal and Flugsrud, 2001; Zhang et al., 2013; Lesiv et al., 2014). Firstly, the
processes that generate emissions are variable in time and space, therefore this requires the
appropriate emissions data (Rypdal and Flugsrud, 2001; Rypdal and Winiwarter, 2001).
Thus, due to the variabilities, it is impossible to monitor each emission source therefore
inventories are assumptions based on limited data (van Aardenne and Pulles, 2002).
Secondly, errors may arise in data processing and even in the data itself (Rypdal and
Winiwarter, 2001). Additionally, a linear relationship is assumed between activity and
emissions (Wilbanks et al., 2003; Christen, 2014; Zhang et al., 2014; Wattenbach et al.,
2015).

37
Table 2.2 Summary of emission inventory uncertainty types and categories. Adapted from Rypdal and
Winiwarter (2001), van Aardenne and Pulles (2002), and Wilbanks et al. (2003).
Type Categories Explanation
Structural: the emissions
inventory structure
Aggregation Emissions calculated for a
different spatial and
temporal scale from which
they occur in reality
Incompleteness Missing data sources and
lack of understanding of
emissions processes
Mathematical formula Linear relationship is
assumed between emissions
and activities
Input value: activity data and
emission factor values
Extrapolation Lack of measurements on
emission rates and activity
data at the appropriate
temporal and spatial scale
Unknown developments Constructing future emission
and socio-economic
development scenarios
Reporting Typing errors

38
Uncertainties are often reportedly separately or undertaken as a separate study, derived from
indirect sources or expert knowledge and judgement (Rypdal and Flugsrud, 2001; IPCC,
2006), because there is a lack of knowledge in assessing emissions inventory uncertainties
(Minx et al., 2013; Lesiv et al., 2014). The analyses of inventory uncertainties are through
direct measurements (Christen, 2014). However, verification is only considered possible in a
closed system where all components are independent (Oreskes et al., 1994) but cities are
open systems, with interconnected components (Weisz and Steinberger, 2010). Uncertainties
are commonly assessed internally or externally (van Aardenne and Pulles, 2002; IPCC,
2006). Internal assessments involve the qualitative or quantitative assessment of the method
and data used to compile the emission inventory. Examples of internal assessments (van
Aardenne and Pulles, 2002) are qualitative discussion, data quality ratings, calculation
checks, and expert estimations. External assessments refer to the differences between the
emissions inventory and other independent information, in order to identify and quantify the
inaccuracies (Christen, 2014). External assessments include comparisons with other
emissions inventories, direct and indirect measurements, and air quality and inverse
modelling studies (van Aardenne and Pulles, 2002; Christen, 2014). However, the main factor
in reducing uncertainties and improving emissions inventory methods and models is
increasing knowledge and research in activity data collection and emission factors, which
encompass ‘learning by doing’ (Lesiv et al., 2014).
2.4 Emissions Inventory and Spatial Planning
The role of spatial planning in climate change mitigation has only recently been discussed
and addressed in climate literature and research (Campbell, 2006; Biesbroek et al., 2009; Qin
and Han, 2013; Jabareen, 2015). Spatial planning is an approach to shape development, by
coordinating socio-economic objectives and identifying the effects of spatial measures in the
long-term (Biesbroek et al., 2009). However, there is a lack of agreement on what is
specifically required due to various types of governments, policies and socio-economic and
environmental contexts. Nel (2011) stated that spatial planning is the core of the land-use
management system, whereas the emerging perspective is that it is wider than land use
planning, as it integrates social, economic, and ecological policies to organize future
development (Wang et al., 2014a). It is from the latter view, that the spatial planning process

39
is identified as holistic, strategic, reiterative regulative and facilitative, and each of these roles
can deliver low carbon development as the urban area is never ‘complete’ and requires
progress and improvement towards a vision (Crawford and French, 2008; Broekhof and van
Marwijk, 2012; Williams, 2012).
There are two main approaches of spatial planning: (i) Rational planning and (ii)
Communicative planning. Rational planning has been the main planning paradigm since the
1900s, and maintains the planner as the expert to achieve the balance between public and
private interests (Dymen, 2014). The criticism of the rational planning approach led to the
development of communicative planning, which realizes that social, economic and
environmental processes underlie spatial organization, and stakeholders, citizens, and civil
society are considered the experts with the planner as the mediator (Wilson, 2006).
Nevertheless, there are concerns that consultations and participation are tokens (Dymen,
2014).
Spatial planning can shape sustainable development and emissions mitigation, especially in
developing countries as their development is occurring (Romero-Lankao and Dodman, 2011;
Broekhof and van Marwijk, 2012; Seto et al., 2014; Wang et al., 2014a). Biesbroek et al.
(2009) highlighted the changing perception of climate change issues, from an environmental
concern to a development issue, and also from mono-disciplinary to trans-disciplinary
research. Baur et al. (2015) indicated that the linkages between GHG emissions and urban
development and policy are expected to become stronger. Currently, there is a lack of
knowledge on new and comprehensive approaches in spatial and urban planning, especially
as the traditional plans are inadequate for developing countries (Wende et al., 2010;
Lehmann, 2013; Taylor et al., 2014). This will entail shifting attention towards establishing
new values and standards in already existing and familiar practices, institutions and social
habits to mitigate GHG emissions (Burch, 2010; Garibaldi et al., 2014).
Urban spatial planning is not a direct emission reduction technology but is a platform for
strategic policies to be integrated and implemented (Guo et al., 2015). Therefore, there is
increasing attention on the compilation of emissions inventories with the associated spatial
distribution of such emissions, to provide technical and theoretical information to support
planning for a low carbon city (Bulkeley, 2006; DEFRA, 2010; Williams, 2012; Asdrubali et
al., 2013; Zhang et al., 2013; Guo et al., 2015). The spatial dimension is important due to the

40
long-lasting nature of infrastructure (Wackermagel et al., 2006) and there are uncertainties
associated with new energy sources and energy efficiency improvements (Qin and Han,
2013; Moriarty and Honnery, 2015).
There are few studies on emissions mitigation at the local level and the majority of studies
that were undertaken, are non-spatial (Ramaswami et al., 2008; Dhakal, 2009; Qin and Han,
2013; Sperling and Ramaswami, 2013; Singh and Kennedy, 2015). Emissions inventories at a
local and community scale creates awareness by connecting their activities to the global
impact (Kuzyk, 2012; Ramsay and Naidoo, 2012). Emissions inventories with spatial
distribution are often top-down and based on proxy information such as land use and
population. Thus, there is lack of bottom up emissions inventories based on activity data and
emission factors (Velasco et al., 2014). Singer et al. (2014) highlighted issues with visioning
the spatial distribution of emissions from the production perspective, such as power plants, as
it only reflects the spatial distribution of resources, and is not a measure of consumption.
Additionally, the scale of emissions reduction required is large therefore all options should be
considered. However it has not received the recognition as a viable instrument of mitigating
GHG emissions (Dulal et al., 2011). This is due to a lack of a single representative spatial
planning approach or best practice example as each city is unique with its own characteristics
such as natural environment, level of socio-economic development, and industrial structure
(Su et al., 2012).
City spatial planning has the potential to reduce emissions by determining the form of
development; whether the city is compact or sprawled, building design standards and
regulations, and guidance on energy efficiency and renewable energy measures (Bulkeley and
Betsill, 2005; Ou et al., 2013; Qin and Han, 2013). Furthermore Nel (2011) suggested that the
land-use management system, which includes the regulatory and enforcement element of the
spatial development framework, has a role to play in reducing carbon emissions as without
strong enforcement of regulations and harsh penalties, compliance would be limited and
voluntary. The determination of LEZs depends on the identification of the spatial location of
emissions. LEZs are the geographic area, such as a road network or land area, in which the
low emission strategy is applied (DEFRA, 2010). A low emission strategy is a broad package
of measures to mitigate the impacts of development and complement other mitigation options
such as planning and infrastructure (DEFRA, 2010). Furthermore, Garibaldi et al. (2014)

41
explained that mitigation approaches which are aligned with the developmental priorities are
more likely to be accepted and successfully implemented.
The mitigation targets set by cities, whether current or future will shape spatial planning
objectives (Wilson, 2006; Crawford and French, 2008). The already established planning
guidelines are often outdated and have to follow past precedents which are ineffective for the
present challenges (Burch, 2010; Taylor et al., 2014). Moreover, the traditional focus of
spatial planning consists of control and service provision, instead of proactively promoting
innovative development, and the integration of mitigation and adaptation strategies in
municipal function (Bulkeley, 2006; Crawford and French, 2008; Burch, 2010). Furthermore,
cities lack precise estimation of their contribution to global GHG emissions, especially from
consumption perspective, and the emission profiles and underlying factors (Romero-Lankao
and Dodman, 2011; Minx et al., 2013). Therefore the integration of climate change
mitigation into spatial planning represents an opportunity for cities to move away from
conventional spatial planning, and associated limits, by investing in local-specific knowledge
to generate place-based solutions, especially at the community level (Bulkeley and Betsill,
2005; Crawford and French, 2008; Hamin and Gurran, 2009; Burch, 2010; Knuth, 2010; Su
et al., 2012; Rogerson, 2013; Jones and Kammen, 2014).
Crawford and French (2008) further explained how climate change considerations can
transform spatial planning in two divergent directions. One direction is the setting of national
spatial planning standards and measures to deliver rapid, large scale transformation to a low
carbon society. However, this vision will inhibit local innovation as decisions are made by
national government. The other direction is transformation through decentralization and
innovation by developing a local low carbon development framework that is compatible with
the local vision, thus increasing the role of local government. Bulkeley (2006) stated that
local government spatial planning plays an important part in facilitating the development of
mitigation strategies with a spatial component, as it has experience in integrating many
components, stakeholders, and interests.
The challenges associated with climate change are complex, multifaceted and dynamic
therefore Campbell (2006) and Biesbroek et al. (2009) stated that it cannot be handled by
spatial planning alone. There are limits associated with emissions reduction and spatial
planning in the short-term, due to uncertainties (Wilson, 2006). However, spatial planning

42
can be highly effective in reducing emission in the long term, as planning takes time and
involves the relocation of activities, and modification of existing and construction of new
buildings and infrastructure (Grazi and van den Bergh, 2008). It is countered by Kocabas
(2013) that municipalities do not have control over key infrastructure and service delivery in
developing countries anymore due to the increasing role of the private sector in service
delivery.
Campbell (2006) maintained that although spatial planning can contribute to abatement of the
causes and impacts of climate change, there exists a gap between policy and action, referred
to as implementation deficit (Robinson, 2006). Reasons for the implementation deficit are
varied and include: lack of knowledge amongst official about climate change issues, inter-
departmental tensions in the local authority, and resistance to changing already existing
institutionalized practices and entrenched policies (Bulkeley and Betsill, 2005). Thus,
planning becomes a contest between the economic, social and environmental concerns,
therefore inhibiting integrated resource management, innovation, and action (Lehmann,
2013). Nevertheless, the contributions of cities to global emissions have gained increasing
attention (Seto et al., 2014). The opportunity for cities to integrate climate change
considerations into spatial plans is vital as it demonstrates leadership (Crawford and French,
2008; Bulkeley and Betsill, 2013) and must be included in the early stages of planning
process, instead of assessments later in the process (Carsjens and Ligtenberg, 2007; Jabareen,
2015).
Investigations on the spatial analysis and characteristics of urban air pollution emissions
inventories are vast, well documented, and studied for long periods as the formulation of
efficient Air Quality Management requires accurate emissions inventories. This is because
ambient measurements of air pollutants describe concentrations but does not identity sources,
health impacts and exposures (Hsu et al., 2013). Studies highlighted as examples of such
investigations using activity data and emission factors were found in Tsilingiridis et al.
(2002), Streets et al. (2003), Dalvi et al. (2006), Tuia et al. (2007), and Zhang et al. (2013).
Less frequent are studies on the spatial characteristics of carbon emissions, especially from
the consumption perspective. Therefore the approach of addressing GHGs as one would with
air pollutants is valid, as the majority of GHG and air pollutants share the same source, which
are fossil fuels.

43
Similar to the intent of this study, Guo et al. (2015) integrated the emissions inventory of
Guangzhou (China), which is a low carbon city pilot project, into urban spatial planning,
which revealed that spatial planning must focus on industrial energy efficiency and road
transport, which contributed 56% and 17% to total emissions respectively, to achieve the
most carbon emission reductions. However, the study provided generic recommendations to
develop into a low carbon city and did not look at variations within the city by using a
smaller scale of analysis, but data were collected for a longer time period (2005 to 2010).
In China, residential, industrial and commercial spaces were responsible for the highest
carbon emissions (Zhao and Huang, 2010; Huang et al., 2013). Similarly, Minx et al. (2013)
revealed that municipalities in northern England have the highest emissions due to large
industrial facilities and London has the highest per capita emissions as it is a business district
and associated with high-income households and lifestyles. Furthermore Huang et al. (2013)
found that centralizing industrial land may reduce carbon emissions but the centralization of
residential, commercial, traffic or agricultural land can increase carbon emissions intensity.
The study on the determinants of CO2 emissions from manufacturing firms in Japan by Cole
et al. (2013) was distinct as it focussed solely on the spatial analysis of industry emissions,
which found that firms improved their emissions mitigation due to location-specific
environmental regulations and also revealed the iron, steel, chemicals, petroleum, paper and
cement industries are major contributors to emissions. Similarly, in the USA, land use
regulations are low in places with high emissions and places with low emissions have high
land use regulations (Glaeser and Kahn, 2010).
A production-based emissions inventory to assess the performance of an eco-industrial park
in Beijing, China was compiled by Liu et al. (2014b). The results showed GHG emissions
intensity decreased by 20% from 2005 to 2010; however, under the same time period, total
GHG emissions increased by 94% with the construction industry emissions overtaking the
manufacturing emissions (Liu et al., 2014b). This has serious implications because due to
energy efficiency, production is increasing thus increasing actual emissions. Therefore, this is
an important lesson, as the eco-industrial park has met the national target however total
emissions are not decreasing and the situation has created the opportunity for other sectors to
increase emissions.

44
A spatial analysis of emissions inventory from residential and transport energy use were
calculated on a census tract level in Toronto (Canada) by VandeWeghe and Kennedy (2007).
The results revealed that per capita emissions from zones in the city core were less than the
surrounding tracts, however buildings in the central core were more energy intensive than the
surroundings, and transport was the main contributor to emissions from suburbs
(VandeWeghe and Kennedy, 2007). Similar results of lower emissions in the city core than
surrounding suburbs were found by Dodman (2009a), Satterthwaite (2010), Hoornweg et al.
(2011), and Hillmer-Pegram et al. (2012). Furthermore, the implication is that high emissions
from suburbs undermine the benefits of low emissions associated with the compact core
(Jones and Kammen, 2014). A production and consumption based emission inventory for
Pennsylvania (USA), was assembled by Hillmer-Pegram et al. (2012), to find the tracts with
the highest energy emissions, of which electricity consumption dominated (59% of total
energy emissions). The tracts with the highest population also contributed the most to
emissions, and these findings were presented to residents who were actively involved in
identifying place-based mitigation options.
However, Reckien et al. (2007) found that local and regional planning alone had a smaller
than expected potential to reduce GHG emissions from road transport, therefore other
integrated approaches such as green infrastructure, management, and pricing measures were
required for mitigation. According to Minx et al. (2013), carbon accounting has a limited role
in overall local infrastructure planning, but has a vital role in specific sectors such as housing
and transport planning to reduce emissions. Additionally, an emissions inventory only
quantifies environmental pressures and does not express concepts that are vital, such as
resilience and carrying capacity.
2.4.1 Emissions Inventory and Spatial Planning Challenges
An emissions inventory is reliant on a large variety of input parameters, which includes the
extensive data collection, assumptions, consistent methodology and time series, and
justification if sectors or gases are excluded (IPCC, 2006; Satterthwaite, 2008; Bader and
Bleischwitz, 2009; Zhang et al., 2014). Furthermore, timeously produced emissions
inventories are required for robust mitigation analysis and action (Seymore et al., 2014).
There are many challenges faced when inventorying emissions since there is a lack of a

45
standardized methodology to calculate emissions, and variations in definitions of urban
boundaries, which creates confusion, limits comparisons, and can be overwhelming, due to
the open nature of cities (Bader and Bleischwitz, 2009; Biesbroek et al., 2009; Weisz and
Steinberger, 2010; Wattenbach et al., 2015).
The most critical component of an emissions inventory is data availability and quality
(Winiwarter and Schimak, 2005; Lesiv et al., 2014). Data are often not unavailable, withheld
or only available at great expense (Wilbanks et al., 2003), and when data are available, it is
often inadequate for the task and need to be downscaled, aggregated or weighted (Parshall et
al., 2009) and the consequence is that local variability is disregarded (Wilbanks et al., 2003).
Such examples are for fuel and electricity consumption data, which are only available at
national or provincial level for most places, which inhibits bottom up emissions inventories
(Wilbanks et al., 2003; Dhakal, 2009; Weisz and Steinberger, 2010) or companies unwilling
to share data (Ramsay and Naidoo, 2012). The majority of data available are non-spatial in
nature (Kellett et al., 2013). Parshall et al. (2009) explained the challenges experienced in
preparing a spatially resolves emission inventory at the local level, even with energy
consumption and industry stack monitoring data, as data intersects more than one census
tract. Therefore there is difficulty in integrating, assembling and reconciling an emissions
inventory with spatial information.
There is a lack of local activity data and emission factors (Qin and Xie, 2011; Zhang et al.,
2014), especially in developing countries, as they are not mandated to report emissions and
also lack the expertise (Crawford and French, 2008; Dhakal, 2009; Friedrich and Trois,
2011). Furthermore, due to the small datasets which are available, even in developed cities,
studies are focussed on descriptive analysis and not statistical analysis (Minx et al., 2013). In
almost all inventories, the data inputs required were available from the government therefore
there are concerns about data reliability, for example, there were discrepancies in national
and aggregated provincial coal consumption data in China (Qin and Xie, 2011; Huang and
Meng, 2013). Although climate change issues are increasingly gaining attention there is still a
paucity of data from industries especially at the plant level (Cole et al., 2013).
From a local government planning perspective, there are key internal challenges that
municipality’s face, of which there are four broad categories Dymen (2014):

46
Cognitive: lack of knowledge about climate change science
Strategic: different interests of stakeholders in the municipal
Institutional: decisions are made at different levels and sectors with competing
objectives (Wilson, 2006; Hannan and Sutherland, 2014)
Value: the different views within the municipality regarding climate change, such as,
the climate scientist views climate change as one of the main challenges for society
but the spatial planner views climate change as one of the many environmental and
socio-economic challenges, and is largely contextual dependent (Robinson et al.,
2006; Biesbroek et al., 2009).
2.5 South African Perspective
The response of sub-Saharan Africa to climate change is focused on adaptation, rather than
mitigation, due to their low contribution to global emissions (Devarajan et al., 2009).
However, SA is an exception, as it is the largest GHG emitter in Africa and 11th largest per
capita GHG emitter in the world (World Bank, 2012). According to the latest national GHG
emissions inventory prepared by the DEA (2011c), more than 80% of SA’s emissions are
related to energy supply and use and CO2 emissions contribute 79% to total emissions, with
the energy industries, manufacturing and transport sectors as the major emitters.
The South African economy is energy-intensive (Seymore et al., 2014) with the reliance on
coal due to the combustion of low grade coal, the provision of cheap electricity rates to
inefficient industrial consumers, and the coal to liquids process to provide liquid fuel
(Raubenheimer, 2011; Roman, 2011). The emissions intensity of the economy is highlighted
by the national contribution to global GHG emissions that is three times more than the
national contribution to global GDP (Seymore et al., 2014). This must also be noted in the
context of a highly divided society where, according to the national Department of Energy
(DoE, 2012), 3 million households do not have access to grid-supplied electricity.

47
2.5.1 National Mitigation Policy
South Africa has taken steps to reduce emissions by signing and ratifying many international
agreements such as the Kyoto Protocol (signed in June 1993 and ratified in August 2004) and
the Copenhagen Accord and has also prepared three national GHG emissions inventories for
the years 1990, 1994, and 2000 (DEA, 2011c). SA has set ambitious mitigation targets to
reduce GHG emissions by 34% and 42% below baseline by 2020 and 2025 respectively
(DEA, 2011b). In March 2014, the six Kyoto Protocol gases were declared priority
pollutants, and activities which emit more than 0.1 MtCO2e must submit an air pollution
prevention plan (DEA, 2014a). The main documents relating to emissions mitigation are the
Long Term Mitigation Scenarios (LTMS), the National Climate Change Response Policy
(NCCRP) White Paper, and the GHG Mitigation Potential Analysis (MPA) (DEA, 2011b;
DEA, 2011c; Winkler et al., 2011; DEA, 2014b).
SA’s approach to mitigation, provided in NCCRP, aims to balance the country’s emissions
reduction, with social and economic opportunities that are available in the transition to the
low carbon economy (DEA, 2011b). The NCCRP provides a package of strategic mitigation
and adaptation measures, based on sustainable development, within the context of national
development goals (Winkler, 2009; DEA, 2011b; Winkler, 2014). The National Development
Plan (NDP), which is the long-term plan to reduce inequality and eliminate poverty by 2030
(National Planning Commission, 2012), highlighted the transition to a green economy by
2030, and has provided policy and planning instruments such as Integrated Resource
Planning (IRP) and carbon pricing (Msimanga and Sebitosi, 2014).
The NCCRP was informed by the LTMS (Winkler et al., 2011) which defined national
government’s commitments under international climate agreements, and shaped long-term
climate policy. The LTMS emission scenarios, completed in 2007, were based on the 1994
national emissions inventory (DEA, 2014b). The boundaries of the LTMS scenario
framework were defined by a ‘growth without constraints’ (GWC) emission scenario (based
on an assumption of growth without any carbon constraint) and a ‘required by science’ (RBS)
emission scenario. The NCCRP highlighted mitigation from the energy, industry, and
transport sectors and also addresses adaptation and disaster management. The mitigation
framework (DEA, 2011b) included the compilation of a carbon budget, i.e., emissions
inventory, as the first step in determining emissions reduction. The second step involves the

48
submission of mitigation plans on how to achieve the emissions reduction and to develop a
GHG monitoring system. Thereafter, a range of economic instruments and monitoring and
evaluation (M&E) must be in place to support emissions reduction (DEA, 2011b). The
NCCRP recognized the role local municipalities play in the implementation of projects and
calls for increased capacity and knowledge sharing between government departments and
spheres (DEA, 2011b). Specifically, the adaptation aspect of the NCCRP has a stronger local
framework that mitigation, as adaptation benefits are seen more quickly and have more job
creation potential.
The mitigation aspect of the NCCRP was criticized for the technological and economic focus,
rather than a behavioural and social justice focus (Rogerson, 2013). Technologies or practice
that have already been demonstrated as effective are promoted, therefore innovative measures
are not investigated. Furthermore, the requirement is on government and state-owned
enterprises to align their plans with climate change considerations, however there are no
mandates for private establishments and industry to fulfil the requirements of the NCCRP, by
compiling emissions inventories, therefore their actions are voluntary. However, the DEA
(2011a) is currently in the process of developing a South African National Atmospheric
Emissions Inventory System (NAEIS), which will include the mandatory reporting of entities
with annual GHG emissions exceeding 0.1 Mt or consume electricity which emits more than
0.1 Mt of emissions. This information will be used to allocate carbon budgets at the
company-level. However, the information reported by entities to the NAEIS will remain
confidential.
Presently, there are difficulties in accessing information from major industries, due to the
National Key Points Act 102 of 1980 put in place by the Apartheid government (Scott and
Barnett, 2009) and have not been repealed. Ramsay and Naidoo (2012) recorded the
challenge in obtaining data from major industries, despite numerous attempts, due to
confidentiality and competition issues. Furthermore, drafted legislation such as the Protection
of Information Bill 6 of 2010 aims to restrict public access to publish and distribute
scientifically and politically sensitive data (Ramsay and Naidoo, 2012). This is problematic,
as citizens need to know who is responsible for the most emissions and energy use and,
according to social justice; citizens need access to information (Rogerson, 2013).

49
The National GHG MPA revealed the measurable amount of GHGs, expressed in tCO2e,
which can be reduced and is an update of the LTMS (DEA, 2014b). The MPA identified the
mitigation potential of key economic sectors highlighted in the NCCRP and addressed
various shortcomings of the LTMS, such as the optimistic growth rates assumed in the
LTMS, lack of detailed sectoral and sub-sectoral information and socio-economic and
environmental impacts, and is based the on updated emissions inventory from 2000-2010
(DEA, 2014b). The mitigation potential is also based on economic growth trajectories were
used in the NDP thus highlighting the link between reducing emissions and also ensuring
development.
The main mitigation measures highlighted for electricity generation are wind and nuclear
power and carbon capture and storage (CCS) from coal-fired power plants (DEA, 2014b).
However, there are various risks associated with nuclear energy and carbon CCS (Roman,
2011). Furthermore, a one per cent increase in nuclear power would lead to uranium
shortages (Dittmar, 2013). For industries, the implementation of energy monitoring and
management systems and on-site electricity generation are recommended (DEA, 2014b). The
shift from private passenger cars to public transport, and freight from road to rail, in the road
transport sector achieves the most emission reductions in the road transport sector (DEA,
2014b). The successful implementation and effectiveness of modal shift is site-specific
(DEA, 2014b), therefore the role of local government is vital. Therefore, this is an
opportunity for areas to be pilot programmes in implementing sectoral and sub-sectoral
mitigation and carbon offsets, to align with the national strategy.
The National Treasury (2014) has plans to introduce carbon offsets as part of the package of
mitigation strategies to achieve the DEA (2011b) sectoral Desired Emission Reduction
Outcomes (DEROs). Other strategies include carbon tax, environmental regulations,
renewable energy projects, and targeted support programmes (DEA, 2011b). A carbon tax,
which is planned to be implemented in 2016, is one of the main economic instruments to
encourage low-carbon economic growth (National Treasury, 2013) however, there is lack of
standardized method to calculate emissions, and thus firms can use different methods, as it is
open to interpretation. An environmental offset is an intervention implemented to
counterbalance for an adverse environmental impact of land use change, resource use,
discharge, emissions, or other activities at one location which is implemented at another
location to deliver net environmental benefit (Paauw, 2014), thus relates to place-based

50
mitigation. Carbon offsets are projects or activities which avoid, reduce or sequester CO2
(Ramseur, 2007). The National Treasury (2014) further defined carbon offset as an external
investment made by a firm to mitigate emissions, in a way that is cheaper than investing
within its own operations, to cost-effectively lower their tax liability (National Treasury,
2014).
Eligible projects must present mitigation and development co-benefits, such as rural
development, energy efficiency, conservation, and job creation and ineligible projects are
those subjected to carbon tax (such as reducing industrial gases), and lack co-benefits
(National Treasury, 2014). Carbon offsets implies responsibility (Paauw, 2014), which is
what emissions inventories from the consumption perspective provides. As carbon offset
projects and activities are undertaken, the pool of potential carbon offset options will grow
smaller (Ramseur, 2007), therefore it is important to be a leader.
Since emissions mitigation is a cross-cutting issue, there is a concern on the lack of
coordination between government departments and the capacity of departments themselves
(Msimanga and Sebitosi, 2014), for example, the DEA (2011b) developed the NCCRP but
other departments are also vital for mitigation, such as DoE, which is responsible for energy
provision. Moreover, the NDP focused on a low carbon economy, and many current decisions
do not fit in with the low carbon society, such as nuclear energy and fracking which brings
risks to society and the environment.
The emphasis on the NDP to reduce SA’s vulnerability to climate change impacts while
simultaneously reducing emissions, through sustainable development, are further
consolidated in SA’s INDC submission to the UNFCCC (DEA, 2015). Furthermore, the
importance of all scale and sector responses and policy in the short, medium, and long-term
constitutes the collective action that is required. However the implementation of significant,
large-scale mitigation actions such as increasing expansion of renewable energy,
decarbonising electricity production, CCS, and hybrid and electric vehicles require
investments from developed countries (DEA, 2015). The prioritization of the mitigation
actions mentioned above further underlines the technological focus of mitigation by the South
African government.

51
2.5.1.1 National Spatial Planning Context
Many countries have recognized the importance of urban planning in energy conservation
and GHG emission reductions such as the UK, Germany and China (Bulkeley, 2006; Wende
et al., 2010; Huang et al., 2013). However the spatial planning policies and framework in SA
lacks this vital aspect. There are two main plans and policies for spatial planning in SA,
which are the NDP (National Planning Commission, 2012) and the Spatial Planning and Land
Use Management Act (SPLUMA), No. 16 of 2013 (The Presidency, 2013). SPLUMA and the
NDP requires spatial planning to be practice in all tiers of government and also requires
municipals to include guidelines on land use management in their Integrated Development
Plan (IDP) in the form of a Spatial Development Framework (SDF).
The SPLUMA legislation has moved away from control towards holistic land use
management which links spatial planning and development (The Presidency, 2013), in
keeping with international trends, however the legislation lacked the mention of climate
change impacts, adaptation and mitigation. The NDP is the long-term plan to reduce
inequality, eliminate poverty, and transition to the green economy by 2030 by improving
service delivery and integrating policies and programmes from all spheres of government
(National Planning Commission, 2012). The spatial component of the NDP is the Integrated
Urban Development Framework (IUDF) which provides the context for urban development
at a national level. Furthermore, the NDP has highlighted social and economic infrastructure
which can fast track growth and development, which are Strategic Integrated Projects (SIPs)
(National Planning Commission, 2012). According to the Presidential Infrastructure
Coordinating Commission (PICC, 2012), there are 18 SIPs which covers the whole country,
of which there are seven foci: five for geographical; three for energy, spatial, and social
infrastructure; two for knowledge, one for regional integration, and one for water and
sanitation.
The Infrastructure Development Act (IDA, 2014), No. 23 of 2014 was promulgated to
provide the legislation to fast track and meet the objectives of the SIPs. A major implication
of the IDA (2014) is the timeframe of approval for projects must be met within 250 days,
including the Environmental Impact Assessment (EIA). However, this is in conflict with the
Environmental Management Act which requires at least 300 days for an EIA to be undertaken
(Bond, 2014a; Vecchiatto, 2014). Furthermore, another critique is that although the NDP

52
highlighted the transition to the green economy, the SIPs are not required to be green
infrastructure, and climate change issues are not core aspects of urban spatial planning.
The spatial planning policies that address energy conservation do so indirectly, from an
economic perspective, as the national entity responsible for electricity, Eskom, could not
meet electricity demand, due to rapid electricity demand coupled with no growth in
generation capacity, therefore load shedding, which are rotational power cuts, were
implemented in 2008, 2011 and 2014 (Eskom, 2014), to prevent the collapse of the electricity
grid (Aylett, 2011). Therefore, cities were instructed to reduce electricity consumption by
10% (Nel, 2011). Furthermore, the focus of the national electricity conservation programme
is on encouraging households to reduce electricity consumption; however 70% of households
are energy poor and reliant on paraffin and biomass burning which is detrimental to their
health and the cause of home fires (DoE, 2012).
2.5.2 GHG Emissions Inventories Research in SA
In addition to the three national emission inventories submitted as communications to the
UNFCCC, Seymore et al. (2014) identified other national emissions inventories prepared by
researchers and government departments. The time period of the emissions inventories range
from 1971-2008, and are based on the IPCC (1996) guidelines, except for the DEA inventory
for 2000, which used the IPCC (2000) guidelines (Seymore et al., 2014). Other limits
identified were the top-down approach and the out-dated nature of the older inventories as
they have not been updated with new inventory guidelines (Seymore et al., 2014). In
response to these limitations, Seymore et al. (2014) developed an emissions inventory, based
on energy balance and fuel consumption, for the years 2007-2008. However, this method is
production-based so emissions were calculated from electricity generation. The emissions
inventory compiled by Seymore et al. (2014) did not calculate electricity demand and does
not help with mitigation policy as activities need to reduce electricity consumption.
Tongwane et al. (2015) compiled a road transport emissions inventory for the nine South
African provinces, based on the distance travelled method, and used the IPCC (2006) Tier 2
method, which recommended the use of local fuel specifications. Nationally, road transport
contributed 43.5 mega tonnes of CO2 emissions (MtCO2) emissions in 2009, of which freight

53
accounted for 48% and light passenger vehicles contributed 41%, and minibus taxis 5.5%
(Tongwane et al., 2015). Gauteng had the highest contribution of CO2 emissions from cars
(47%) to total provincial emissions and in Kwa-Zulu Natal (KZN), freight contributed ~51%,
followed by light passenger (39%), and minibuses (~6%).
Emissions inventory studies specifically focussed on Durban, for the road transport,
industrial, commercial, residential, and waste sectors were compiled by Thambiran and Diab
(2011a), Thambiran and Diab (2011b), Ramsay and Naidoo (2012), and Friedrich and Trois
(2015). Thambiran and Diab (2011a) used the European Environment Agency (EEA)
Computer Programme to Calculate Emissions from Road Transport (COPERT) to model both
CO2 and air pollution emissions from the road transport sector in Durban for the year 2008.
The results from Thambiran and Diab (2011a) indicated that road transport emissions
contributed 6.03 MtCO2 in 2008, of which heavy duty vehicles contributed the most to CO2
emissions from road transport, at ~41%, followed by passenger cars (35%), which was
similar to the national and provincial situation revealed by Tongwane et al. (2015). However,
Thambiran and Diab (2011a) did not further disaggregate the modal emissions into fuel type.
Thambiran and Diab (2011b) revealed that emissions from industrial energy use was
responsible for 6.6 MtCO2 in 2008, of which electricity consumption contributed 41%,
followed by coal (28%), and refinery gas (22%). However, GHG emissions from process and
fugitive emissions were omitted due to the paucity of direct measurements from industries
(Thambiran and Diab, 2011b).
Friedrich and Trois (2015) estimated the GHG emissions from solid waste disposal from
three municipal landfills in Durban for the year 2012 from a life cycle perspective, thus
included emissions from the collection, transport, and recycling of waste. The method used
by Friedrich and Trois (2015) was based on the methane commitment method, which is
suited for planning, whereas the waste in place method is appropriate for emissions inventory
(Mohareb et al., 2011). The authors (Friedrich and Trois, 2015) calculated emissions which
excluded landfill gas (LFG) collection and electricity generation at two landfill sites (753740
tCO2e), and also included the savings from LFG collection and electricity generation, which
resulted in net GHG emission savings of -161780 tCO2e. However, the LFG collection and
electricity generation are CDM projects, therefore the emission savings attained are attributed
to the party that has funded the project or purchased emission credits. Nevertheless, the study

54
highlighted the importance of LFG collection and electricity generation for large reductions
of waste emissions.
A study undertaken by Ramsay and Naidoo (2012) revealed the per capita footprint of
household, traffic, and commercial activities along a main road (Tara Road) in South Durban
were comparable to Asian cities. However, this was due to CO2 stack emissions from
industry, which was responsible for 98% of the total carbon footprint (Ramsay and Naidoo,
2012). When industrial CO2 stack emissions were excluded from the total, then 80% of CO2
emissions were from residential (5%) and commercial electricity use (75%), followed by road
transport (18%). When considering emissions from the road, which were calculated from
traffic counts, cars contributed 58%, followed by trucks (13%) and minibus taxi’s (7%),
which differs from other studies undertaken at the city, provincial and national scale
(Thambiran and Diab, 2011a; Tongwane et al., 2015). The study was limited by the lack of
socio-economic information from households, road transport categories were not consistent
with South African convention (Merven et al., 2012; Tongwane et al., 2015) and did not
disaggregate road transport emissions into vehicle types and fuel usage, as it was based on
traffic count data, and lacked electricity consumption information from industry. However,
the value of this study was in GHG emissions research in a developing city at a small spatial
scale of analysis and use of surveyed information.
2.5.3 Local Scale Mitigation in SA
South African cities will play a vital role in achieving the national reduction targets. The
current development decisions made by SA cities will impact on their ability to mitigate
emissions, reduce vulnerability and adapt to the impacts of climate change. However, there is
a lack of city-specific mitigation targets, and no guidelines on emissions inventories for SA
cities or the mandatory preparation of emissions inventory. Thus, city-scale emissions
inventory preparation is voluntary and initiated by international organizations such as ICLEI
(2014), and not driven by the national government. Furthermore, South African cities are
characterized by urban sprawl with high density areas found in former townships, which are
associated with low-income households, due to Apartheid and modernism planning (Nel,
2011; Merven et al., 2012; Sutherland et al., 2013), therefore a study of spatial form and
emissions would be futile.

55
A low carbon city report was developed for Durban by the Academy of Science of South
Africa (ASSAf, 2011). This report highlighted the Apartheid legacy that has resulted in
inequalities and an inefficient city form, and the increasing development on the city fringes,
such as the airport. The core recommendations of the report include the transition to the green
economy, reduce consumption, realize co-benefits of low carbon development, the use of
land use planning for low carbon development, industry and road transport (specifically, the
heavy trucks vehicle class) sector mitigation, and the focus on the neighbourhood scale to
implement mitigation and adaptation actions (ASSAf, 2011).
However, the report lacked specific recommendations which deal with the city context.
Additionally, many of the recommendations to transition to a low carbon economy were
considered ‘greenwash’, due to the overtly technological mitigation recommendations (Bond,
2011). According to Chen and Zhu (2013), low carbon development must include the
government-administration, company-market, and non-governmental organizations (NGO)
and social factors in the low carbon development strategy. However, the low carbon city
report lacked the integration of these factors. The report highlighted the road freight sector as
the highest potential to reduce emissions, but the transport sector is not included as a
polluting activity in the declaration of GHG as air pollutants (DEA, 2014a). Bond (2011)
criticized the emphasis on residential behaviour to reduce emissions, as there are still many
households in the city who do not have access to basic services, such as electricity, housing,
water, and sanitation (EM IDP, 2015). Thus, it is vital to identify the locations of high
consumption and low consumption within the city.
Although the report mentions industry mitigation, it failed to identify the role of Durban’s
largest industrial zone, the South Durban Industrial Basin (SDIB), which is a major air
polluter, in mitigation (Ramsay and Naidoo, 2012). This is especially since there are
proposed industry and port expansions, of which the impact is not considered in the report
(Bond, 2011; Ramsay and Naidoo, 2012). These developments will result in increased carbon
emissions due to increased ship and heavy truck vehicle activities, loss of significant carbon
sinks and livelihoods, and the displacement of residents (Bond, 2014b; Mottiar, 2014).
Furthermore, the final EIA prepared for the port was rejected by the DEA (2013) as it lacked
climate change considerations. This indicates that the development decisions of Durban are

56
incompatible with mitigation. Therefore, there is an urgent need for the identification of
development and mitigation options which are compatible and able to deliver co-benefits.
2.6 Synthesis and Conclusion
Significant action is required to stabilize CO2 concentrations at 450 ppm and restrict the
global average temperature increase by 2°C (IPCC, 2013). International agreements are
important and have increased attention on climate change, however there is increased focus
on the local scale because the international agreements have not delivered what is urgently
required. This has led to cities identified as the appropriate scale to address climate change
issues, and take up mitigation efforts, especially as co-benefits are realised. This is
particularly important for cities in developing countries, as their share of emissions are
increasing and their priorities are on economic development and service delivery. Therefore,
there is a gap in the identification of co-benefits from emissions mitigation and development,
so that informed choices can be made for integrated development. This is further exemplified
by cities that have undertaken emissions reductions initiatives, even without the support of
national government. This is due to global city networks which have provided support and
facilitated knowledge-sharing between cities.
Place-based mitigation is advocated because the specific environmental, economic, social,
and political conditions of a city influence emissions. A low carbon city is identified as the
main development pathway to reduce emissions from production and consumption. This must
be noted as there are also many people in cities, especially emerging cities, which do not have
secure access to resources. Thus, it is important to identify areas which need to decrease
resource use and the areas which need to secure access to resource. This is especially relevant
in developing nations, as there are increasing inequalities.
Thus, an emissions inventory is the first step in developing place-based mitigation plans. An
emissions inventory quantifies the direct or indirect emissions from sectors to facilitate low
carbon city development. The most common approach for an emissions inventory is activity
data based, with the majority of the studies from the production perspective. However, the
transition to a low carbon city must focus on both production and consumption. Furthermore,
the production perspective is not ideal for cities as emissions are underestimated and lacks

57
attribution of responsibility. The consumption and life-cycle perspectives are more suited for
cities as increasing consumption is a major driver of environmental pressure.
However, the inventory methods were devised for developed world cities. These methods do
not consider developing cities context and lacked integration with socio-economic factors.
Specifically, South African cities are unique due to Apartheid planning and legislation
inequalities, which local government is mandated to redress. There are a few studies on
emissions at the city level. Additionally, there are limited studies regarding emissions
inventories and spatial planning, as this is an emerging concept. Of the limited studies, the
majority of the research reviewed is carried out in developed countries with the only
emerging economy is China. However, there is a lack of a single approach due to the various
contexts of cities due to various emission drivers. An important lesson from the research
reviewed is the importance of reducing both actual emissions and emissions intensity, and
also be cautious that emissions reductions in one place or sector is not associated with an
increase in emissions in another place or sector, due to simple relocation of activities.
There is an overwhelming focus on emissions from household and transport energy sectors
and a general lack of studies on industry emissions. This is due to difficulty in obtaining data
from industries due to confidentiality and competition laws. This is recognized as one of the
major barriers to activity data collection, especially as the industrial sector is a major emitter
of GHGs.
In conducting the literature review, a variety of methods and approaches were discussed
which adds to the challenges of undertaking an emissions inventory. It is clear from the
studies reviewed that for climate change mitigation to be effective in developing cities, it
needs to be aligned with local development. Therefore strategies are required that tackle
climate change and development. When preparing an emissions inventory to be integrated
with local development plans, many assumptions need to be made. Thus, guided by the
literature review, the research design is presented in the next chapter, detailing the direction
of this study.

58
CHAPTER 3: RESEARCH DESIGN
3.1 Introduction
Due to the variety of emissions inventory methods discussed in Chapter 2 and the paucity of
approaches to allocate GHG emissions spatially, an approach to estimate these emissions for
Durban was developed. This chapter outlines the approach developed, to attribute GHG
emissions according to the location of activities, and identify local development plans, which
has guided data collection and the materials used, to identify high emissions areas. This
chapter also provides information on Durban and also the choice of emissions inventory
method. Thereafter, the data collection for the compilation of emissions inventory for the
energy, transport, and waste sectors, and the qualitative analysis of local development plans
to identify the specific areas prioritized by the municipality for development are discussed.
3.2 Key Sectors of GHG Emissions
All human activities contribute various GHGs and aerosols to global warming and climate
change therefore it is ideal for an emissions inventory to be accurate, precise, comprehensive,
transparent, complete, reliable, and comparable; accounting for all emissions from all
sources, and have gone through internal and external assessments and quality control (IPCC,
2006). However, the challenge of collecting comprehensive activity data are well-
documented (Wilbanks et al., 2003; Winiwarter and Schimak, 2005; Dhakal, 2009; Parshall
et al., 2009; Weisz and Steinberger, 2010; Friedrich and Trois, 2011; Qin and Xie, 2011;
Ramsay and Naidoo, 2012; Zhang et al., 2014). Nevertheless, the ability to compile an annual
emissions inventory is vital to track progress towards mitigation targets, and this requires
easily obtainable activity data (Price et al., 2013; Baur et al., 2015). Therefore, the activities
with the greatest contribution to climate change is referred to as ‘key sectors’ (Dhar et al.,
2013) and the inclusion and exclusion of sources and activities are context-dependent (Bader
and Bleischwitz, 2009; Knuth, 2010; Hillmer-Pegram et al., 2012). The latest South African
national GHG emissions inventory prepared by the DEA (2011c) stated that 86% of SA’s

59
emissions are related to energy supply and use (Figure 3.1), with the energy industries,
manufacturing and transport sectors as the major emitters.
Figure 3.1 Total (in MtCO2e) and percentage (%) share of South Africa's GHG emissions, according
to the IPCC categories. Adapted from DEA (2011c).
3.3 Emissions Inventory Framework
The emissions calculations are based on the emission factor-based method (equation 2) where
GHG emissions are the product of activity data (AD) and emission factors (EF), which are
proxy information (IPCC, 2006; Velychko and Gordiyenko, 2009):
𝐺𝐻𝐺 𝑒𝑚𝑖𝑠𝑠𝑖𝑜𝑛𝑠 = 𝐴𝐷 𝑥 𝐸𝐹 𝑥 𝐺𝑊𝑃 (2)
Emissions are expressed in tCO2e of activity, which is a source that produces emissions of the
GHG considered (Ramachandra et al., 2015). Activity data are information on the extent of
actions which result in GHG emissions over a specific time period and spatial boundary
(Wattenbach et al., 2015). The activity data are based on the spatial location of consumption
activity (VandeWeghe and Kennedy, 2007; Peters and Hertwich, 2008; Jones and Kammen,
2014) for energy emissions and the location of actual emissions release (i.e. production
perspective) for waste emissions. This is due to the lack of information on waste in South
Africa. Furthermore, waste is related to consumption, and is the only sector which

60
municipalities directly manage and plan (Manfredi et al., 2009; Friedrich and Trois, 2011).
Emission factors are the conversion values used to relate the amount of emissions released
into the atmosphere with an associated activity (Ramachandra et al., 2015). Emission factors
are the averaged emission rates, which assumes a linear relationship between activities and
emissions (Wattenbach et al., 2015). Furthermore, there are also default and geographically
specific emission factors, which are based on the country or local context.
3.3.1 Energy
The reliable supply of energy is a driving force for human development (Liu et al., 2011).
However, the current non-renewable energy sources contribute to environmental problems.
The main factors which drive energy consumption are industrial production, transport, and
households (Chen and Zhu, 2013). The most widely-supported mitigation policies relate to
technology and the supply-side, such as renewable energy on a commercial scale, carbon
capture and storage, and biofuels (Roman, 2011; Moriarty and Honnery, 2015). However,
there are concerns about this focus as there are questions on the development, availability,
and uptake of new technology. This is highlighted by Geels (2014), where renewable energy
and technology is in policy but not implemented. This highlights the importance of the
demand-side, which is often overlooked as a crucial component in climate change mitigation
Knuth (2010).
Electricity is of particular focus in SA because it is key to achieving emissions reduction
(DEA, 2011c; Inglesi-Lotz and Blignaut, 2011; DEA, 2014b) and the national development
goal (National Planning Commission, 2012) to ensure universal access to energy, which
entails that all households in SA have access to modern energy sources, which includes
electricity and renewable sources, and excludes energy sources which are detrimental to
health and the environment (Aylett, 2010; DoE, 2012). Coal-fired power plants generate
~90% of electricity in SA, and is also a major source of CH4 and N2O, and air pollutants such
as sulphur dioxide (SO2), nitrous oxide (NOx), and particulate matter (PM) (Gaffney and
Marley, 2009). Eskom is one of the highest CO2 emitters in the world and is also currently
unable to comply with the National Atmospheric Emission Standards for air pollution
(Eskom, 2012; Eskom, 2014).

61
3.3.1.1 Residential
Energy consumption from the residential sector accounts for 17% of global CO2 emissions
and is the sector that is recognized to have the greatest potential to achieve energy efficiency
(Nejat et al., 2015). Electricity is used for heating, air-conditioning, geysers, appliances, and
lighting (Chen and Zhu, 2013). Other energy sources, such as candles, paraffin, firewood,
coal, and gas are also used for lighting, cooking, and heating (DoE, 2012). Direct fuel and gas
combustion is a major source of energy used household space heating in many of the
emissions inventories studies (VandeWeghe and Kennedy, 2007; Qin and Han, 2013; Jones
and Kammen, 2014). However in SA, according to the national household energy use survey
by the DoE (2012), the main source of heating is electricity (44%), whilst 34% of households
do not use an energy source for heating, and the rest use firewood, paraffin or coal.
3.3.1.2 Industry
According to the International Energy Agency (IEA, 2007), industry energy use has risen by
61% from 1971 to 2004. Heavy industry is a major consumer of electricity and a source of
environmental impacts (IEA, 2007; Cole et al., 2013), such as air pollution, due to the direct
combustion of energy sources, such as coal, coke, natural gas, heavy fuel oil, bitumen,
liquefied petroleum gas, paraffin wax, and refinery gas (Gaffney and Marley, 2009; ICLEI,
2014). A third of global CO2 emissions are due to manufacturing industries, specifically, the
chemical, petrochemicals, iron and steel, cement, paper and pulp, and minerals and metals
industries (IEA, 2007). The analysis of industrial energy consumption and emissions are
divided along economic sectors to enable comparison with economic data to identify energy
intensity (Moghaddam et al., 2013).
3.3.1.3 Road Transport
Globally, road transport contributes almost three-quarters to transport emissions (Grazi and
van den Bergh, 2008; Raux and Lee-Gosselin, 2010). The share of transport emissions from
developing cities are increasing due to increasing population, rising affluence, availability of
cheaper private vehicles, increase in road freight, rapid urbanization and suburbanization

62
(Dulal et al., 2011). GHG emissions from motor vehicles are attributed to the following three
factors (Yu et al., 2012; Merven et al., 2013; Ramachandra et al., 2015; Tongwane et al.,
2015):
(i) the amount of driving (mileage), expressed in vehicle kilometres travelled (VKT),
(ii) fuel (petrol and diesel) consumption, which is related to fuel economy of the vehicle
type, and
(iii) the GHG intensity of the fuel type, which is the EF of the fuel.
However, only CO2, which is the dominant GHG emissions produced by road transport
(Dulal et al., 2011), is dependent on the above three factors. CH4 and N2O are not dependent
on fuel consumption, but on driving, fuel properties, and technology (Graham et al., 2009;
Merven et al., 2012). The road transport sector in SA differs greatly from global averages as
road transport emissions accounts for 80% of transport emissions (DEA, 2011c).
Furthermore, generally road transport emissions have a linear relationship with population
growth, however in SA, road transport emissions growth tracks GDP growth (Merven et al.,
2012), which is similar to China (Huang and Meng, 2013). Additionally, Tongwane et al.
(2015) revealed that road transport emissions in SA are closely correlated with vehicle
population. Therefore, calculating emissions or disaggregating according to proxies such as
population or road density would be inappropriate.
3.3.2 Waste
The waste sector contributes 3-4% to global GHG emissions, of which developing nations
contribute 29%, however there is a lack of studies on waste emissions in developing
countries, especially Africa (Couth and Trois, 2010; Friedrich and Trois, 2011). Reductions
from waste emissions have been achieved in many European municipalities (ISWA, 2009),
thus decoupling waste from economic growth (Couth and Trois, 2010). The factors which
determine the amount of GHG emitted from waste are the amount of waste generated, the
carbon content of the waste, and the technologies used for waste handling and disposal
(Friedrich and Trois, 2011).
63
3.3.2.1 Wastewater
Wastewater, from domestic and industrial sources, is treated to remove the soluble organic
matter, suspended solids, pathogenic organisms, and chemical contaminants (Bao et al.,
2014). Treatments occur on-site, through septic systems, or off-site, in centralized treatment
systems, which includes lagoons and advanced treatments (ICLEI, 2010). The treatment
process produces CH4 and N2O depending on the type of treatments. CH4 is produced due to
microbial activities, where the soluble organic material is biodegraded under anaerobic
conditions and N2O is produced by the nitrification and denitrification of domestic
wastewater, with urea, ammonia, and proteins (Shrestha et al., 2012; Bao et al., 2014).
3.3.2.2 Solid Waste
Solid waste is primarily disposed of in landfills, from which emissions are expected to
increase (Friedrich and Trois, 2011). The major emission from waste is CH4 from landfill gas
(LFG), due to anaerobic degradation of organic matter in the landfill, which is dependent on
the carbon content of waste, and is higher in developing countries (Manfredi et al., 2009;
Friedrich and Trois, 2013). CH4 can be recovered or converted to electricity, which is the
most common CDM project undertaken; thus, landfills can potentially offset emissions
(Manfredi et al., 2009).
There are six types of landfills, identified by Manfredi et al. (2009): (i) open dump, (ii)
conventional landfills without gas collection, (iii) conventional landfills with gas collection
and flaring, (iv) conventional landfills with gas collection and electricity generation, (v)
engineered landfills, and (vi) landfills receiving low-organic-carbon waste. An open dump
lacks engineering plans to compact and cover the waste and prevent gas and leachate
emissions into the environment, and is the most damaging landfill type (Manfredi et al.,
2009). In SA, there are no municipal-run open dumps as the main solid waste disposal
method is in conventional landfills with engineering plans (Friedrich and Trois, 2013).

64
3.3.3 Local Spatial Development Plans
Reducing emissions are complicated as economic and social development are the main
priorities for developing cities (Romero-Lankao and Dodman, 2011; Dulal and Akbar, 2013;
Liu et al., 2014b). Thus, when determining mitigation efforts, the development strategies of
the region must be included as this defines emissions responsibility, ensures policy
coherence, and provides co-benefits and cost-effectiveness (Chen and Zhu, 2013; Dhar et al.,
2013; Dulal and Akbar, 2013; Garibaldi et al., 2014; Winkler, 2014).
Planning in South African municipalities is shared by various strategic frameworks (Hannan
and Sutherland, 2014). Local governments are tasked with the Long Term Development
Framework (LTDF) policies that guide the future development of the city and the Integrated
Development Plan (IDP), which is produced every five years and progress is tracked annually
(Sutherland et al., 2013). The IDP communicates the requirements and vision of city, and
serves the role of addressing backlogs in service delivery, due to Apartheid, and also ensure
economic growth (Ballard et al., 2007). The IDP requires the alignment of municipal
departments with its objectives and regarded as a high status document, therefore it should be
a “powerful vehicle for mainstreaming climate change considerations” (Aylett, 2011; p. 12).
This is further reinforced by the LTMS which requires the inclusion of mitigation actions in
the IDP (Nel, 2011). The IDP also includes the Spatial Development Framework (SDF),
which is the principal spatial planning guidance and is dependent on the city’s development
context (Sutherland et al., 2013). The IDP and SDF make up the main development
framework of the municipality. Therefore the mitigation actions included in the IDP will need
to deliver development goals and the enabling of co-operative mitigation.
Mitigation strategies are required to be within the traditional administrative framework of
states, provinces and municipalities. However, the places that have major concentrations of
GHG emitters and the regions impacted by climate change do not necessarily match the
traditional administrative boundaries (Biesbroek et al., 2009), thus making mitigation policy
a challenge to implement. Therefore there is a need to frame mitigation policies within the
planning framework of the municipality.
The conceptual framework is summarized (Figure 3.2; p. 66) to identify the spatial location
of key energy emission sources, from a consumption perspective, in each ward. The non-

65
energy emissions are from a production perspective, at the location of wastewater treatment
plans and solid waste disposal sites, but are still the result of consumption, thus generated and
disposed of within the city. Furthermore, it represents localized emissions, which has impacts
on the surrounding communities. The framework informs the activity data required and the
relevant local development policy, as both are required to be defined by spatial locations.
After the emissions inventory is complete and emissions are calculated, together with
indicators, the high emission wards are identified. The spatial development priorities are
identified from the municipal plans. The information from the identification of key
development plans for wards and the identification of high emitting wards, and their
associated emitting sectors, will be used to identify opportunities for both development and
emissions reductions.

66
Figure 3.2 The conceptual framework developed to integrate emissions inventory in spatial planning (VandeWeghe and Kennedy, 2007; Brown and
Logan, 2008; Gallivan et al., 2008; Knuth, 2010; Merven et al., 2012; Dhar et al., 2013; Garibaldi et al., 2014; Liu et al., 2014b; Winkler, 2014; Feng et
al., 2015; Guo et al., 2015).
67
3.4 Case Study: Durban (eThekwini Municipality)
The spatial configuration of South African cities is due to Apartheid regulation, which
restricted the movement and ownership of land for the majority of the population, which
resulted in racially segregated cities. Since the abolishment of these regulations in 1994,
the legacy of Apartheid spatial inequalities continues as there are developed and
developing world conditions in South Africa cities (Hannan and Sutherland, 2014).
South African cities are characterized by urban sprawl due to Apartheid and post-
Apartheid developments (Faling et al., 2012). Furthermore, South African cities are
influenced by globalization which encourages the re-branding of their image based on
physical, social, environmental, and economic advantages (Hannan and Sutherland,
2014). Hence, the role of South African cities are significant to address both local
challenges such as, to re-dress Apartheid inequalities and also global concerns, such as
sustainable development and climate change.
The eThekwini Municipality (EM), located on the east coast of SA in the KwaZulu-
Natal (KZN) province (Figure 3.3; p. 68), is the local authority which governs the city
of Durban. The EM has a population of 3.5 million and covers an area of 2297 km2 (EM
IDP, 2015). The EM is the third largest municipality in SA, contributing 10.9% and
65.5% to the national and provincial GDP respectively (EM IDP, 2015). The city is
noted for having the busiest port in Africa (EM IDP, 2015), thus, the major economic
activities of the city are shipping, logistics, manufacturing industries, and tourism.
The EM was chosen as the case study as it is representative of a developing city, faced
with many socio-economic and environmental challenges yet has the potential for
innovation. An example of the city’s innovation was the provision of free basic water to
indigent households in 1998, which was adopted as national policy in 2000 (Galvin,
2012). Furthermore, the EM provides free basic services such as water to over 300 000
households, electricity to 70 000 households and property rates exemptions to 200 000
households (Roberts and O'Donoghue, 2013). However, developmental challenges still
persist, such as high poverty levels, informal settlements and housing backlogs, an
unemployment rate of 20.4%, high rate of infectious diseases such as Human

68
Immunodeficiency Virus (HIV) and Acquired Immune Deficiency Syndrome (AIDS)
(EM IDP, 2015).
Figure 3.3 Major suburbs of Durban and the city location within SA and KZN (top).

69
Durban is also located in one of 34 global biodiversity hotspots therefore the Durban
Metropolitan Open Space System (DMOSS) was created, to meet conservation targets
and secure ecosystem services, which are also valuable in emissions offset and
adaptation (EM IDP, 2015). DMOSS covers 23% of the municipal area, but is under
threat of development (Aylett, 2011). Since the late 1990s sustainable development has
arisen in EM planning and policy (Roberts, 2008; Hannan and Sutherland, 2014), in
response to national government objectives (Ruwanza and Shackleton, 2015), however
has lacked application in large-scale development plans (Hannan and Sutherland, 2014).
According to Turok (2012), development and spatial planning is considered challenging
in the EM, as the topography is steep and dissected with hills and valleys and the spatial
form is the most fragmented of South African cities. Furthermore, only 25% of the land
is considered urban, 30% is peri-urban, and 45% is rural (EM IDP, 2015). Specifically,
the urban sprawl spatial form consists of an urban core surrounded by less dense rural
areas along the periphery, the majority of which are under traditional ownership (Michel
and Scott, 2005; Turok, 2012; Sutherland et al., 2013; EM IDP, 2015). Additionally, the
Durban population density profile by Breetzke (2009) revealed that areas within 10 km
of the central business district (CBD), which represents the urban core, is low density,
comprised of predominantly wealthy and white suburbs and higher densities are found
in low income, black townships and informal settlements (Figure 3.4, p. 70). Therefore
there is a separation of the majority of residential areas from places of work; however
the exception is the SDIB (Sutherland et al., 2013). The SDIB is one of four air
pollution hotspots in South Africa, due to the proximity of residences to heavy industry
and traffic, especially heavy trucks (Scott and Barnett, 2009; Ramsay and Naidoo,
2012).

70
Figure 3.4 Durban ward population density (in population per square kilometre). Source:
StatsSA (2013).
Climate change and associated impacts projected for Durban includes (EM IDP, 2015):
(i) sea level rise (ii) temperature rise between 1.5°C-2.5°C and 3°C-5°C by 2065 and
2100 respectively, (iii) increase in the number and intensity of extreme rainfall events
interspersed with long drought conditions, (iv) species extinction which will negatively
impact on DMOSS, (v) food insecurity and water shortages, (vi) health impacts such as
heat stress, increase in vector-borne and water-borne diseases, and respiratory problems

71
due to decreased air quality. The city has experienced impacts of extreme weather, such
as coastal storms on the north and south coast of Durban and flooding (Aylett, 2011;
Smith et al., 2013).
Durban is also considered a leader in climate change efforts in South Africa (Roberts,
2008; Roberts and O'Donoghue, 2013), as it was the first South African city to compile
a low carbon development report, a comprehensive GHG emissions inventory, and a
Municipal Climate Protection Programme (MCCP), which focused initially on
adaptation and then mitigation (Aylett, 2011; Walsh et al., 2013; EM IDP, 2015).
However, the adaptation and mitigation departments are separated, and their efforts
have not been streamlined with other departments or included in the everyday practice
of the municipality (Aylett, 2011).
Specifically, the mitigation efforts have produced emission inventories and CDM
projects. Durban is a participating city in ICLEI’s CCP, and produced its first inventory
of municipal operations in 2002 and included a community inventory for years
2003/2004. Inventories for both the municipal operations and community emissions
were produced from 2010, with the most recent inventory for the year 2012. However,
there are no emissions reduction targets (Aylett, 2011). Durban’s CDM-approved
projects are LFG to electricity run at two landfills (Aylett, 2011), one of which is the
Bisasar Road landfill, which is the largest landfill in Africa (Friedrich and Trois, 2013).
The above has shown that action on mitigation is focused on single projects, and has not
addressed the major emitters, such as industry and transport, despite the potential
opportunities for major emissions reduction due to the innovative municipality (Aylett,
2011).
Furthermore, the Environmental Planning and Climate Protection (EPCP) department in
the municipal developed an integrated assessment (IA) model, documented in Walsh et
al. (2013), to focus on mitigation, adaptation and spatial development. The development
of the IA model was a data-intensive and time-consuming process, yet it has not been
fully implemented by planners and included in policy to inform development, due to
data limitations, and the lack of sectoral analysis (Walsh et al., 2013). Thus, this

72
example stresses the importance of an easily applied approach and method, calculated
from already available data, so that it can be widely utilized.
The conceptual framework is applied to the case study of Durban. The framework
guides the method, specifically, the activity data sources, the collection of activity data
sources which are available, the calculation of emissions, and the identification of
relevant municipal spatial development plans and policies.
3.5 Study Scope and Boundary
The focus of this emissions inventory and spatial analysis is on the key energy sectors
from the location of consumption activity, and also non-energy emissions from waste,
as this is the sector which the municipality has direct control over. Energy emissions are
from the residential, industrial sector, and road transport sector. Road transport
emissions are only considered due to the difficulty in spatializing aviation and marine
transport emissions. Waste emissions are from solid waste landfills and wastewater
treatment plants. The emission calculations were guided by ICLEI (2014) as these are
specifically designed for local scale emissions, The method involved the ICLEI (2014)
guidelines as well as suggestions identified in other similar studies (VandeWeghe and
Kennedy (2007), Brown and Logan (2008), Gallivan et al. (2008), Knuth (2010), Qin
and Xie (2011), and Hillmer-Pegram et al. (2012). Sectoral and total emissions were
calculated for each of the 103 wards (i.e. neighbourhoods) in Durban.
A study of the urban spatial form, population densities, and emissions will be futile as
South African cities are characterized by urban sprawl, with high densities in low-
income areas (Nel, 2011). Therefore, there is a need for a framework that covers the key
sectoral emissions that are spatially allocated, but is not disaggregated according to
proxy information such as population or building density, as there is a lack of bottom up
studies from the activity data and emission factor approach (Velasco et al., 2014). The
results from applying the framework will be used to inform mitigation strategies based
on the emission profiles and the development required for areas. Furthermore, future
73
emission scenarios complex uncertainty analysis (such as Monte Carlo simulations) of
the emissions inventory and spatial statistics are not investigated, as it is outside the
scope of this study.
The spatial focus of this approach is on the ward scale, which is equivalent to the
neighbourhood scale. GHG emissions for the individual 103 wards in the EM for the
year 2013 were calculated. Due to data availability limits, this study focuses on CO2
emissions from energy and CH4 and N2O from waste that could be spatialized,
expressed as tCO2e. Ideally, all Kyoto Protocol gases should be covered in an emissions
inventory. However, it is still appropriate to focus on those three gases as they are
prevalent GHGs. Emissions were calculated for consumption activities related to
households, road transport and industry, from within the municipality boundary only,
and which could be attributed to the ward spatial scale. Initially, this study was expected
to be prepared for the year 2010, as this is considered the baseline year by the EM, but
data were requested from 2010-2013. However, data from a key sector, which was
annual electricity consumption for individual industry customers, were only provided by
the EM Electricity Department for the year 2013. In the next section that follows a
description of the data for the key sectors, assumptions, calculation methods and
analysis are provided.
3.6 Data Collection and Inventory Calculations
The compilation of an emissions inventory requires the collection of activity data from a
variety of sources, of which data are available at different scales. This section details the
sources of activity data, emission factors, and tools used to apply the framework.
3.6.1 Residential
The EM does not produce its own electricity, and is reliant on electricity produced
outside its borders and supplied by Eskom. Electricity is supplied to households by the
74
EM Electricity Department and Eskom however; the municipality has a much larger
household customer base than Eskom in Durban (EM Energy Office, 2012). Initially,
the electricity consumption of individual residential customers were requested from the
EM Electricity Department, however this information was not provided. The EM
Electricity Department residential customer billing system does not record actual
consumption, but is based on the residential electricity meters which are read only a few
times a year, and estimated for the rest of the year (EM Energy Office, 2012).
Therefore, it was decided to calculate residential electricity consumption based on the
bottom up methods found in VandeWeghe and Kennedy (2007) and Brown and Logan
(2008) for spatial analysis, where the average annual electricity consumption of
households was multiplied by the number of households per ward.
However, calculating the emissions from electricity consumption in the EM, and even
SA, is not comparable to developed countries because there are two types of electricity
consumers: (i) conventional (credit) and (ii) prepaid. Credit customers receive bills
based on estimated electricity consumption, and prepaid customers buy cards or
payment slips which activates an electricity amount (DoE, 2012). The prepaid and credit
customer split of the EM for 2013 was 52% and 48% respectively (EM Electricity,
2014). Furthermore, prepaid customers use significantly less electricity (~200 kilowatt
hours (kWh) per month) than credit customers (~740 kWh per month) (EM Electricity,
2014). This information needs to be accounted for, thus electricity consumption was
calculated as follows:
1. The number of households per ward, available from Statistics SA Census
(StatsSA, 2013) (StatsSA, 2013), was multiplied by the credit and prepaid
customer ratio (EM Electricity, 2014) to get the number of prepaid and credit
customers per ward. The assumption was made as the number of households in
the census data are similar to the EM electricity customer base.
2. The number of credit and prepaid customers per ward were multiplied by the
average credit and prepaid electricity consumption respectively.
3. Steps 1 and 2 constitutes the activity data, expressed in megawatt hours (MWh),
which was multiplied by the Eskom (2014) grid emission of 0.93 tCO2e/MWh,

75
to express emissions in tCO2e. The emission factor excluded electricity
transmission and distribution losses as justified by ICLEI (2014).
3.6.2 Industry
The electricity consumption of industry customers were requested from the EM
Electricity Department. The monthly raw electricity consumption data from 711
customers, which represents 43% of total electricity consumption (EM Electricity,
2014), were provided. The data were summed to get the annual electricity consumption
in kWh. The addresses of the customers, and the economic sector they belonged to,
were identified using Google Maps (www.google.co.za/maps) and Braby’s Business
Directory (www.brabys.com) searches. Electricity consumption from buildings was
considered as point data, however, due to ethical considerations at the request of the EM
Electricity Department, the customer name, address, and electricity consumption could
not be revealed. Thus, the addresses were sorted into wards and then summed to
calculate the total electricity consumption per ward. This value for the total electricity
consumed was then multiplied by the Eskom emission factor to calculate tCO2e
emissions per ward.
Industry customers were categorized into economic sectors, to calculate sectoral
emissions intensity. The following economic sectors were identified, based on the EM
economic sub-sector analysis:
Agriculture
Construction
Education
Financial services
Food, beverages, and tobacco products
Fuel, petroleum, chemical and rubber products
Health and social services
Hotels and restaurants
Metals, machinery, and appliances

76
Non- metallic materials
Paper, pulp, printing, and publishing
Retail and wholesale
Textiles and clothing
Transport equipment manufacture.
Emissions intensity indicators for the various economic sectors listed previously were
calculated, to enable cross-sectoral comparisons. The emissions intensity of a sector is
the ratio of its emissions to its GVA, calculated according to equation (3):
𝐸𝑚𝑖𝑠𝑠𝑖𝑜𝑛𝑠 𝑖𝑛𝑡𝑒𝑛𝑠𝑖𝑡𝑦𝑖,𝑗 = 𝑇𝑜𝑡𝑎𝑙 𝑒𝑚𝑖𝑠𝑠𝑖𝑜𝑛𝑠𝑖,𝑗
𝐺𝑉𝐴𝑖,𝑗 (3)
Where, emissions intensityi,j is the amount of GHG emissions released per economic
activity of sector i for the year j, expressed in tCO2e/ GVA. Total emissionsi.j refers to
the total emissions calculated for sector i for year j, expressed in tCO2e. GVAi,j is the
economic output of sector i for year j, in millions of Rands.
GVA is a measure of the economic output of each individual producer, industry, or
sector to the economy, and is used in the estimation of GDP (StatsSA, 2014). Whereas
GDP provides an indication of the state of the whole economy and is calculated using
production, income, and expenditure; GVA only considers the contribution from the
production of goods and provision of services (StatsSA, 2014), and therefore, is
preferred for local scale analysis (Turok, 2012; Price et al., 2013). The individual
industry customers were sorted into sectors, as described previously, and the emissions
were summed to get total emissions for each sector. The sectoral GVA for the EM for
2013 was sourced from the projected GVA for 2013 found in EM Economic Review
(2012), which was found on the EM municipality website.
3.6.3 Road Transport
The calculation of road transport emissions from fuel consumption and fuel sales as
proxy data are recommended by ICLEI (2014); however, this method assumes that the

77
amount of fuel sold is equivalent to fuel use. Furthermore, this method does not
consider the storage and stockpile of fuel which results in temporal offsets (Gregg et al.,
2009) and the fuel sold in one area may be consumed in another area, outside of the
city’s boundary therefore, another assumption is made, that fuel is sold and consumed
within the same boundary (Gregg et al., 2009; Parshall et al., 2009). Furthermore, the
fuel sales method is suited for the national scale (Ramachandra et al., 2015). In SA, fuel
sales are only reported according to magisterial district, which is outdated, and
incompatible with the local scale, thus limiting disaggregation. Furthermore, the South
African Petroleum Industry Association, (SAPIA, 2008) estimated that 95% of petrol
and 51% of diesel sold are used for road transport, as other sectors also use petrol and
diesel (Tongwane et al., 2015). Thus, fuel sales alone cannot identify where
interventions to decrease road transport emissions can be made.
Therefore, many studies (Bandivadekar and Heywood, 2006; Gallivan et al., 2008;
Knuth, 2010; Yu et al., 2012; Merven et al., 2013; Zhang et al., 2013; Ramachandra et
al., 2015; Tongwane et al., 2015) used a bottom up emissions inventory method based
on annual mileage and registered vehicle population and type, which are the factors that
influence CO2 emissions from road transport. The distance travelled method is preferred
over fuel consumption (fuel sales) method for the local scale, as the latter is more suited
for the national level (Ramachandra et al., 2015). This information is easily accessed by
policy makers to make decisions on how to limit fuel consumption, transform the
transport system, and change travel behaviour (Gallivan et al., 2008). Furthermore,
Tongwane et al. (2015) showed that road transport GHG emissions in SA correlated
closely with vehicle kilometres, which is the product of vehicle population and mileage,
than with distance travelled alone. Therefore, this further justified the calculation of
emissions based on vehicle population, fuel type, and mileage, which can be used to
identify interventions and assess the success of policy implementation.
Emissions from road transport (in tCO2e) were calculated for each ward as follows in
equation (4) (Bandivadekar and Heywood, 2006; Knuth, 2010; Hillmer-Pegram et al.,
2012; Merven et al., 2012; Yu et al., 2012; Zhang et al., 2013; Ramachandra et al.,

78
2015) (Bandivadekar and Heywood, 2006; Knuth, 2010; Hillmer-Pegram et al., 2012;
Merven et al., 2012; Zhang et al., 2013):
𝐸 = ∑( 𝑉𝑃𝑖𝑗 × 𝑉𝐾𝑇𝑖𝑗 × 𝐹𝐸𝑖𝑗 × 𝐸𝐹𝑗) (4)
Where,
E = GHG emissions in tCO2e per year
VP = vehicle population of vehicle type i and fuel type j
VKT = vehicle kilometres travelled by vehicle type i and fuel type j per year (km/year)
FE = Fuel economy of vehicle type i and fuel type j, expressed as the litres of fuel
consumed per kilometre of vehicle travel (litres/ km)
EF = Emission factor of fuel type j in tCO2e per litre.
The vehicle population was based on the number of registered vehicles in Durban were
available from the Department of Transport (DoT) Road Traffic Management
Corporation’s (RTMC) electronic National Traffic Information System (eNATIS, 2014)
database, which records vehicle type, fuel type, age, and engine size of vehicles,
according to postal codes, which was subjected to confidentiality. The eNATIS database
provides high quality, up to date information on SA’s vehicle population (Tongwane et
al., 2015). The main vehicle types (Table 3.1; p. 80) were identified, together with
petrol and diesel as the main fuel types. Hybrid vehicles and vehicles running on
renewable energy were identified, but these types are minimal and were excluded from
calculations. The postal codes, and thus vehicle information, were sorted into to the
wards that they belonged to, based on postal code areas found on the South African Post
Office website (www.postoffice.co.za).
SA lacks official statistics on mileage and fuel economy; therefore assumptions were
derived from literature summarized in Merven et al. (2012). The average mileage and
fuel economy values found in Stone (2004) were used, because the values are specific to
coastal KZN vehicles (Table 3.1; p. 80). Recent mileage and fuel economy data are
available and were used in similar studies (Merven et al., 2012; Ramsay and Naidoo,
2012; Tongwane et al., 2015) but are national or international averages. Fuel economy
was assumed to increase by 1% every year (Merven et al., 2012) and the UK DEFRA

79
(2010) default emission factors for petrol and diesel were used (Table 3.1; p. 80), as SA
lacks specific fuel emission factors.

80
Table 3.1 Main vehicle types and their associated fuel types, mileage, fuel economy, and emission factors. Adapted from Stone (2004) and Merven et
al. (2012).
3Assumed 1% improvement in fuel economy per year from 2004 to 2013 (Merven et al., 2012

81
3.6.4 Solid Waste Disposal
There are five landfills in Durban of which there are two types: (i) landfills without gas
collection, and (ii) landfills with gas collection. The municipality owns, controls, and
operates three landfills: two landfills which collect gas (Bisasar and Mariannhill), and
one landfill without gas collection (Buffelsdraai). The other two landfills (Shongweni
and Bulbul) are operated by independent contractors and do not collect gas.
Accounting for emissions from landfills are complex, due to the various types of
landfills, ages, and degradation levels (Manfredi et al., 2009). Furthermore, the waste
that currently contributes to emissions are from the past and there is a lack of records on
historical waste composition (Manfredi et al., 2009), especially in developing nations,
therefore they are estimated or extrapolated (Friedrich and Trois, 2011).
CH4 emissions from landfills without LFG collection are rarely directly measured but
are calculated with models that condenses the complex decomposition processes
(Friedrich and Trois, 2011). These models have different kinetic orders such as zero-
order, first-order, and second-order. The most widely used are first-order decay (FOD)
models (Kamalan et al., 2011). The FOD model assumes LFG production peaks soon
after waste is disposed of in the landfill, and then exponentially decreases as the organic
matter in the waste decays. Thus, an exponential equation is used to estimate the
amount of LFG generated based on three factors: (i) the amount of waste in the landfill
(waste-in-place), (ii) the capacity of the waste to generate emissions (based on the
organic material), and (iii) the rate that the solid waste is expected to decay, which is a
constant. The ICLEI FOD model, created in partnerships with the USA Environmental
Protection Agency (EPA) Air Resources Board, The Climate Registry and the Climate
Action reserve, is a Microsoft Excel-base model used to calculation CH4 emissions,
expressed in tCO2e. The FOD model was downloaded from the EPA Air Resources
Board website (http://www.arb.ca.gov/cc/protocols/localgov/localgov.htm). The model
requires various inputs (Table 3.2; p. 82), such as waste in place, landfill lifetime, and

82
average annual rainfall, which were provided by the EM Energy Office, and the waste
composition of landfills, which was sourced from Friedrich and Trois (2013).
Table 3.2 Data inputs required for the ICLEI FOD model for landfills without gas collection.
FOD model input Unit Further details
Waste in place Tons/ year Wet weight
Waste composition % per waste type Friedrich and Trois (2013)
Landfill lifetime Year Landfill open year and
close year (if applicable)
Average annual rainfall Inches/ year Determines CH4
generation rate constant (k)
value (Appendix A)
The ICLEI (2010) equation for the calculation of annual fugitive CH4 emissions from
landfill with comprehensive LFG collection systems were used (Appendix A). The LFG
collection systems are assumed to be comprehensive, as both the landfills are CDM
projects. The landfill-specific information required for the equation (Table 3.3; p. 83)
were provided by the EM Energy Office.

83
Table 3.3 Data inputs require for the calculation of emissions from landfills with gas collection.
Data input Units
LFG collected Million standard cubic feet (MMSCF) per
year
CH4 fraction in LFG Percentage
CH4 destruction efficiency Percentage
Collection efficiency Percentage
3.6.5 Wastewater Treatment
The EM owns, controls, and operates 21 wastewater treatment plants (WWTP) in
Durban (EM Energy Office, 2012). The wastewater treatment plant types identified
were: (i) stationary combustion of digester gas, (ii) anaerobic treatment lagoons, (iii)
with nitrification/ denitrification, (iv) without nitrification and/or denitrification, and (v)
effluent discharge into aquatic environment. Due to lack of data in this sector (DEA,
2014b) emissions calculations were based on population. The ICLEI (2010) equations
for the five wastewater treatment types (Appendix B) were used to calculate CH4 and
N2O emissions based on the population served by the wastewater treatment plant and
industrial effluent discharge, expressed in tCO2e. The population data, based on the
consumption of 400 litres per person per day, and industrial effluent discharge
information were provided by the EM Energy Office, which was subjected to
confidentiality.

84
3.6.6 Local Development Plans
A qualitative document analysis of EM strategic planning documents were undertaken
to (i) identify existing mitigation efforts in the development plans of the municipality,
(ii) identify spatial locations relating to development, referred to as key development
areas, which are the areas of economic, social, and environmental priorities highlighted
in the municipal plans. This information was summarized in a table, according to
location, economic sectors and sub-sectors, the stakeholders involved, and also project
specific details, and compared to the areas of high and low emissions to identify
synergies and links for emissions reduction and development co-benefits.
The local development plans of importance are the Long Term Development
Framework (LTDF), which is ‘Imagine Durban’, the IDP, SDF, and Industrial Land
Strategy (ILS), from 2010-2015, as this represents the five year planning cycle of the
municipality. The municipal planning documents were found on the EM website
(www.durban.gov.za).
3.6.7 Analysis
Microsoft Excel spreadsheets were used to sort data, calculate emissions equations and
indicators, and build the emissions inventory database, from which graphs and tables
were created. For the spatial analysis, a Geographic Information Systems (GIS), was
used to create maps. GIS is a tool that has the means to store, manipulate and process
digital information and to provide it in an appropriate format (Dalvi et al., 2006). GIS
also integrates different data sets to provide support in estimations and decision-making
in planning, develop policy and analyse the spatial-temporal effects of policy (Wang et
al., 2014b). ArcMap 10.1, developed by the Environmental Systems Research Institute
(ESRI), was used to spatially analyse and visualize the emissions inventories results. All
shapefile layers for Durban, used in ArcMap, were found on the EM mapping website
(citymaps.durban.gov.za), which is publicly accessible.
85
The emissions inventory calculation spreadsheets were joined to the wards layer by
tabular joins and displayed as maps. Maps were created to visual emissions and
emissions intensities to identify the wards with the highest amounts. The sectoral
emissions maps were combined to produce a total emissions map. Rankings or
weighting were not applied, as all the sectors were considered equal and linked in the
development of a low carbon city. The spatial analysis of total emissions reveals the
distribution of emission activities and the areas with the highest emissions in Durban.
Thus, the high emission areas were identified from the emissions inventories and
presented in relation to development priorities so that interventions for emissions
reductions and development co-benefits can be recommended.
3.7 Challenges and Limitations
The emissions inventory was constructed using the best available data collected under
the time and budget constraints of this project. Furthermore, in SA there is a lack of
detailed information on energy (Inglesi-Lotz and Blignaut, 2011) and waste (Friedrich
and Trois, 2013; DEA, 2014b). Thus, various assumptions were made, which
contributes to uncertainties and limits in this study. The main challenges and limitations
are related to activity data sources as it is the most critical aspect of the emissions
inventory, and the use of default emission factors.
3.7.1 Data Collection
The information and data collected for the compilation of the emissions inventory were
sourced from organizations and agencies, such as the EM Energy Office, EM Electricity
Department, and the national DoT, which lacked meta-data. Average values for
residential electricity consumption, mileages, fuel economy, and waste received at
landfills were used, which hides variations in the data. The bottom up approach of this
study scales up and accumulates errors and uncertainties. The use of default emission
factors to convert activity to emissions for all sectors, except to electricity, is another

86
major implication, because there is a lack of SA-specific emission factors. The default
emission factors used are based on the developed nations context, and therefore not
suited for SA-specific conditions and processes. Furthermore, in the literature review
and research design chapters of this study, the importance of accounting for the South
African context was highlighted yet there is a lack of national emission factors, which
limits the accuracy, reliability, representability, and completeness of the emissions
inventory.
3.7.2 Spatial Scale
The spatial unit for emissions calculation and representation were the ward scale, which
is equivalent to neighbourhood scale. However, this is still an aggregated unit, as
average values were used to represent individual amounts. Individual point data were
required to be aggregated, due to data confidentiality. This masks the variation within
wards, as it treats all sources within the ward as homogenous (Kennedy et al., 2009), of
which the common concept which this uncertainty is related to is ecological fallacy
(Loveland, 2012). Furthermore, the boundaries used to delimit wards and the EM are
artificial and can change in the future.
3.7.3 Residential
This study assumed that residential prepaid and credit customer average electricity
consumption were representative of the residential energy sector, and therefore used to
calculate emissions. The use of electricity averages to calculate household consumption
is a limitation as it does not show the variations in electricity use. Furthermore,
electricity consumption meter readings are based on averages (EM Electricity, 2014).
Furthermore, many households in Durban do not have access, or have limited access to
electricity; therefore other sources of energy are used, such as candles, paraffin,
firewood, and gas (DoE, 2012), which has health and safety implications in the form of
outdoor and indoor air pollution, and fires. This study lacks emission from the other
household energy sources mentioned, because there is a paucity of studies in SA,

87
specifically on the amounts that are combusted (DoE, 2012). Although the uses of other
energy sources are low, they create localized emissions which are harmful to human
health and the environment. This information can also be used to identify potential areas
for air pollution and carbon emission offsets (National Treasury, 2014; Paauw, 2014),
for example, high air polluting and GHG emitting industries can invest in reducing
emissions from domestic burning, in communities, instead of large emissions on-site,
which may be limited by infrastructure (Moriarty and Honnery, 2015).
3.7.4 Industry
This study only included emissions from electricity consumption and excluded other
energy sources, such as coal and refinery gas. Data on the consumption of other sources
of energy, based on fuel sales, are available from the DoE but are aggregated at the
magisterial district scale. Therefore it was difficult to disaggregate this information to
attribute to the economic sub-sectors, and even to the individual facility level.
Additionally, this study lacked emissions from industrial processes due to the lack of
data on direct measurements of GHG emissions from industrial processes (Thambiran
and Diab, 2011b).
Furthermore, the annual sustainability reports for major industries located in Durban
were sourced to provide information on energy consumption and industry process
emissions, but it does not provide the relevant information that could be useful in this
study, as they were expressed in different units. For example, the sustainability report
for the South African Petroleum Refinery (SAPREF, 2013) presented electricity and
furnace fuel consumption, however the same amount is recorded for both MW and
MWh, yet there is a difference between those two energy terms. The use of electric
power (MW) over a period of time is expressed in MWh (Climate Council, 2013),
however the same figure is reported for both MW and MWh, which means that the
information is unreliable. Other sustainability reports presented total energy
consumption or CO2 emissions for all their facilities within SA, and thus cannot be
disaggregated for the facilities located in Durban.

88
An issue applicable to the calculation of emissions from electricity consumption for
households and industry was the use of the Eskom (2014) emission factor to convert
electricity consumption to carbon emissions. Although the Eskom emission factor is for
SA, there is a lack of agreement on how to calculate the electricity emission factor
(National Business Initiative, 2013). The Eskom emission factor is 1.03 tCO2e per
MWh but this value includes the emissions from losses in electricity transmission and
distribution. Therefore, it is not ideal when calculating electricity consumption
emissions (ICLEI, 2014). This study excluded emissions from electricity transmission
and distribution, in accordance with ICLEI (2014) guidelines.
Additionally, the emission factor is based on the Eskom grid, which is reasonable as
they produce the majority of electricity. However, there also exists electricity generated
and consumed on–site such as coal, gas, or diesel which are not accounted for, therefore
there is a need for a country specific emission factor (National Business Initiative,
2013), which includes both Eskom grid and non-Eskom (independent) sources.
3.7.5 Road Transport
The method used to calculate emissions from road transport assumed that the number of
registered vehicles in Durban is indicative of the actual vehicle population; however,
there may be vehicles which are not registered and driven, and also vehicles which are
registered but are not driven. It was also assumed that the vehicles registered in Durban
are driven within the city; however, there are vehicles which are registered in Durban
but driven in other parts of SA, and vehicles which are driven in Durban, but registered
elsewhere in SA. Furthermore, this study also does not show traffic but rather the fuel
demand of vehicles, with the expectation that the place where the vehicle is registered is
the starting and end point of travel. Additionally, only CO2 emissions from vehicle fuel
consumption were calculated because CH4 and N2O are dependent on driving, fuel
properties, and technology (Graham et al., 2009; Merven et al., 2012), and thus were
not considered as these factors fall outside the scope of this study.

89
The mileage and fuel economy information used in this study from Stone (2004) are
more than 10 years old but is specific to coastal KZN. Furthermore, Merven et al.
(2012) used recent, national average mileages and fuel economy, and found the most
discrepancies from between model and actual diesel fuel consumption, due to the
movement of road freight from Durban to Gauteng. Thus, all vehicle types were
subjected to the same driving conditions by using average mileages and fuel economy.
The default UK DEFRA (2010) petrol and diesel emission factors were used to convert
fuel consumption calculated to CO2 emissions, due to the lack of SA-specific petrol and
diesel emission factors. However, the UK DEFRA (2010) emission factors were based
on UK vehicle conditions but were also used in the emissions inventories prepared by
the EM Energy Office (2012) and Ramsay and Naidoo (2012).
The second largest contributor to total transport emissions is aviation, which is more
damaging as GHGs are released directly into the upper atmosphere (Chapman, 2007).
However, air and marine transport emissions are difficult to spatialize and there is lack
of consensus on how to attribute those emissions (Villalba and Gemechu, 2011).
3.7.6 Waste
In SA, there is a scarcity of information in the waste sector (Friedrich and Trois, 2015).
Specifically, according to the Department of Environmental Affairs (DEA, 2014b),
there is a lack of direct measurements of GHG emissions from wastewater treatment
processes in SA. The estimated population served by the wastewater treatment plant
was used as proxy information, according to ICLEI (2014) guidelines, which are catered
for American WWTP. Furthermore, default ICLEI (2014) values for industrial
wastewater discharge into WWTP, biological oxygen demand (BOD) values, and
emission factors where used, which were based on American averages.
More data were available for the solid waste disposal at landfills sub-sector. However,
this information is limited by short timescales, as landfill waste annual volume received

90
and composition data were only available for the past five years from the municipal
landfills, and 15 years from the private landfills. However, the above data were
available on a monthly scale for the municipal landfills, and yearly scale for the private
landfills
Furthermore ICLEI (2010) equations and default emission factors were used to calculate
emissions from landfills with LFG collection and electricity generation. The emission
from landfills without LFG collection and electricity generation were modelled with the
ICLEI (2014) FOD model. The implications of using equations and models devised by
international organizations from developed countries, is that the equations, emission
factors, and models were developed for cities and countries that have a different context
from SA. Specifically, developing countries have high volume of organic waste
(Friedrich and Trois, 2015).
3.7.7 Local Development Plans
The key development areas identified are based on strategic development plans, which
are visions. Therefore, this does not mean that the developments mentioned are
approved or implemented as they are intents (Ruwanza and Shackleton, 2015).
Furthermore, the drawing up of municipal plans, such as the IDP, is based on guidelines
which focus on the preparation processes and not on the contents. However, the plans
do provide an indication of how the city defines itself and its environmental and socio-
economic development future.
91
CHAPTER 4: RESULTS AND DISCUSSION
4.1 Introduction The aim of this study was to identify the spatial distribution of anthropogenic GHG
emissions in Durban, which indicated the areas of highest emissions for place-based
mitigation to achieve a low carbon city. Therefore, this information will be used to
identify the opportunities for using emission inventories to inform low carbon spatial
development at a local scale in SA. A conceptual framework, based on the consumption
perspective, was developed to combine the spatially-resolved emissions inventory and
municipal development plans. The results and discussion from applying the framework
are presented in this chapter.
The first section of this chapter presents the analysis of the key development plans and
projects identified from the qualitative analysis of local development plans. This
information provides the spatial development framework and context of the EM.
Thereafter, the results of the emissions inventory are presented which identifies the high
emission zones. Subsequently, the emissions profiles of the high emission zones are
discussed in conjunction with key development plans to identify place-specific
mitigation options and developmental co-benefits. The final part of this chapter
discusses the limitations and opportunities in using emissions inventories to inform
spatial planning, specifically what was established in this research.
4.2 Policy Analysis for Climate Change and Spatial Development in the
eThekwini Municipality This section will discuss the context of spatial planning in the EM, and current and
future development plans. Prior to the formation of the eThekwini metropolitan
municipality in 2000, there existed six local councils, designated according to their
geographical location. The six councils were: North Local Council, South Local

92
Council, Inner West Local Council, Outer West Local Council, North Central Local
Council, and South Central Local Council, which were responsible for spatial planning
and service delivery, primarily to the white suburbs, within their respective jurisdiction
(Breetzke, 2009). Thus, this demonstrated that the use of spatial planning in the
municipality is not a new phenomenon, but due to the different local councils the EM
inherited the impacts of fragmented spatial planning.
This study is focused on the EM strategic plans, which are the Long Term Development
Framework (LTDF), Integrated Development Plan (IDP), Spatial Development
Framework (SDF), and Spatial Development Plan (SDP) (Table 4.1; p. 93). The LTDF
provides the development direction for the municipality and the IDP is the
implementation of the LTDF and provides the imperatives for the municipality. The
SDF as a conceptual plan that spatially represents the growth nodes and corridors and
the SDP focuses on each of the four sub-metro planning regions, to identify the long
term land use carrying capacity (Breetzke, 2009). The details and analysis of the LTDF
(‘Imagine Durban’), the IDP Eight Point Plan, SDF and SDP and the Industrial Land
Strategy (ILS) are discussed in the sub-sections that follow. The industrial land strategy
is not a compulsory document required by local government, but is also reviewed as
manufacturing is a major economic activity, and also represents the industrial
development vision of the EM.

93
Table 4.1 Scope and purpose of the EM plans studied. Adapted from the EM SDF (2014; p.35).
Plan Scope Purpose
LTDF Strategic economic, social,
and environmental
objectives
Provides the strategic
development direction for
the municipality
IDP Strategic operational
implementation
Provides the strategic
implementation direction
and imperatives for the
municipality
SDF Strategic spatial
development
Provides the strategic
development intentions
based on the LTDF and the
IDP
SDP Strategic spatial
development
Translates the spatial
development intentions of
the SDF into land use
plans, transport,
environmental, and
infrastructure implications.

94
4.2.1 LTDF- ‘Imagine Durban’
The LTDF, known as ‘Imagine Durban’, was a community-based process on the shared
developmental pathway of the city towards sustainability (Imagine Durban, 2010). The
LTDF included specific programmes and outcomes, and measurable targets for its six
thematic areas, which are:
Creating a safe city;
Ensuring a more environmentally sustainable city
Promoting an accessible city
Creating a prosperous city where all enjoy sustainable livelihoods
Fostering a caring and empowering city
Celebrating our cultural diversity, history and heritage.
Furthermore, the framework developed by the EM provided targets to achieve the
milestones from the thematic area (Figure 4.1; p. 95). For example, the EM stated that
climate protection interventions should begin now so that the sustainable city can be
achieved by 2100 (Imagine Durban, 2010). However, it does not state how it will be
achieved or integrated with the other priorities. The framework itself displays climate
protection as the last step in achieving sustainability, separated from service delivery,
job creation and economic development goals. Furthermore, the framework only
mentions adaptation and not mitigation, and this is a concern as future development,
especially economic development, tourism, spatial development, bulk infrastructure,
and energy resources can either increase or decrease future emissions. Therefore, the
consideration of emissions mitigation is vital to development, specifically climate risk
management, and in preparation for future emission limits.

95
Figure 4.1 Visual representation of the EM LTDF 'Imagine Durban' (Source: EM IDP, 2015; p.
401).
Emissions mitigation is a cross cutting issue, which applies to all the thematic areas
listed above, as all human activities and behaviour has an impact on emissions. Climate
change mitigation is only addressed, albeit indirectly, in the second thematic area of
ensuring a more environmentally sustainable city. Although, Garibaldi et al. (2014)
stated that mitigation actions do not need an explicit climate change purpose and can
fall under the umbrella of sustainable development actions. The environmentally
sustainable city theme aims to ensure that the environment protects and promotes
human and biodiversity health (Imagine Durban, 2010), which can be achieved through
various strategies such as:
1. Incentives and discentives to ensure sustainability
2. Information and education
3. Integrated waste management systems
4. Pollution prevention
5. Water conservation
6. Energy efficiency and alternative energy production
7. Climate change prevention and preparedness
8. Productive ecosystems.

96
All of the above strategies require critical behaviour changes from individuals, business,
and government to become responsible in using resources sparingly (Imagine Durban,
2010). The strategies are used to achieve short term (10 years), medium term (20 years)
and long term (50 years) targets. The targets specifically related to emissions mitigation
are that the city must be carbon neutral and energy is produced from renewable sources
are long term targets. Short term targets are mitigation and adaptation measures for
climate change must be put in place and citizens must use energy efficiently. Ensuring
that the air in Durban is not harmful to human health is both a short term and medium
term target and another medium term target is a zero waste city, which does not need
landfill sites.
4.2.2 IDP Eight Point Plan
IDP plans are drawn out for a five year period, but are reviewed annually. The IDP and
SDF were studied from the years 2011/2012- 2015/2016, as the pre-2011/2012 IDP’s
main developmental challenges were sufficiently summarized by Sutherland et al.,
(2013), and still remain the same, such as high poverty and unemployment, HIV/AIDS
and lack of access to basic services. Furthermore, Sutherland et al., (2013) found that
unsustainable development was only mentioned in the pre-2011/2012 IDP’s and climate
change considerations were only included in the IDP’s from 2011/2012 onwards. The
short term outcomes of the IDP are to address key challenges in delivering the LTDF,
and are expressed in the Eight Point Plan. The EM IDP (2015) stated that the plans are
separate yet supportive of each other. The current (2011/2012- 2015/2016) eight plans
are:
1. Develop and sustain our spatial, natural and built environment.
2. Developing a prosperous, diverse economy and employment creation.
3. Creating a quality living environment.
4. Fostering a socially equitable environment.
5. Creating a platform for growth, empowerment and skills development
6. Embracing our cultural diversity, arts and heritage.
7. Good governance and responsive local government.

97
8. Financially accountable and sustainable municipality.
The IDP also mentions urban sprawl prevention, public transport provision, and a focus
on ecosystem services. The EM has highlighted the need to reduce economic
inequalities, and to identify sustainable livelihoods and economic opportunities for
economic growth and job creation. Specifically, the focus of the EM local development
opportunities are the identification of industrial land and the logistics corridor, which
are derived from the national SIP, which aims to fast track large scale infrastructural
projects. Therefore, the focus is only on the economic aspect of sustainable
development.
The EM IDP has also recognized the importance of spatial planning to identify the ideal
location of these economic opportunities, such as “economic nodes and transport
corridors, and to contribute to urban service delivery efficiency, address rural needs and
historical inequalities for the benefit of previously disadvantaged populations” (EM
IDP, 2015; p. 98). However, the IDP does not mention the impact of economic and
spatial development on the environment and lacks climate change considerations,
including the spatial representation of climate change impacts or the areas of high
emissions, to inform development options. Furthermore, the information on climate
change in the IDP has remained the same in the annual reviews, and lacks new
information. The transition to a green economy is highlighted from 2010 but lacks
concrete plans and objectives.
Furthermore, the threat and impacts of climate change are mentioned but the
mainstreaming of mitigation and adaptation measures are absent in the IDP, even
though mitigation measures are short term and medium targets of the LTDF. However,
the LTDF does not state the specific mitigation measures to be achieved in 10-20 years.
Furthermore, climate change considerations lack details and a small fraction of the EM
budget is set aside for environmental programmes (Aylett, 2010). This is similar to
findings of Sowman and Brown (2006) and Ruwanza and Shackleton (2015), where
environmental and sustainable measures have small budgets in the South African
municipals, as other socio-economic developmental issues are more pressing. However,

98
mitigation plans are cross-cutting, so does not require a specific budget, hence they
could be included in each department’s budget, to set aside for mitigation measure. Yet,
the mitigation initiatives undertaken by the city such as the preparation of a low carbon
report (ASSAf, 2011) and the results of the municipal and community emissions
inventories (EM Energy Office, 2012) are not used to inform development planning in
the IDP or used to set specific targets and actions to achieve the LTDF goals.
4.2.3 SDF and SDP
The SDF is a spatial representation of the IDP and the SDP which guides municipal
decisions on the use, development, and planning of land, as well as the form and
location of future spatial development (EM SDF, 2014). The SDF was formally adopted
by the EM in 1997 in preparation for metropolitan consolidation to foster integration of
the local councils (Breetzke, 2009). However, the six local councils followed their own
plans, which increased competition to attract development in their own jurisdiction,
even if it had negative implications on other councils or the metropolitan (Breetzke,
2009). One of the key tenets of the IDP is public participation, however the SDF is an
internal process, undertaken by city planners, often guided by an external consultants,
and lacks public participation during the process but undertaken at the end process
(Hannan and Sutherland, 2014). This is based on planners know best, and also required
to be aligned with national and provincial spatial development priorities.
The vision of the EM SDF (2014), since 2002 (Breetzke, 2009), is to develop a compact
city to overcome the inefficiency of low density urban sprawl and to spatially
restructure the Apartheid city (Figure 4.2; p. 100). The key strategies of the SDF are
inner city urban renewal, densification and intensification of the urban development
nodes and corridors, public transport infrastructure development, and projects which
fulfil both the social and economic agendas, with the focus on industrial development.
The development of the Integrated Rapid Public Transport Network (IRPTN) is key as
densification is recommended along and within 4000 metres (m) of the network (EM
SDF, 2014) and urban development is limited by the Urban Development Line (UDL)

99
(Sutherland et al., 2013). Furthermore, the automotive, tourism, agriculture, chemicals,
construction, textile, wood, pulp and paper sectors are highlighted as key in achieving
job creation and local economic development. The spatial principles of the SDF are:
1. Mainstreaming and coordinating environmental planning:
Emissions mitigation and environmentally sensitive development.
2. Promoting spatial concentration and efficiency:
Densification and development of effective public transport and non-
motorized transport.
3. Enhancing economic potential, coordinated planning and implementation to
support economic growth:
Priorities are the promotion of Dube Tradeport in the north, freight and
logistics, and ensure greater industrial land in south Durban, specifically
Prospecton and Clairwood.
4. Promote balance and sustainable urban and rural development

100
Figure 4.2 The SDF of the EM for the years 2010-2015. Source: EM SDF (2014; p. 163).
4.2.4 Industrial Land Strategy
The industrial land strategy is not a compulsory document required by local
government, but is reviewed in this study because manufacturing is a major economic
activity, and also represents the industrial development vision of the EM. The EM ILS
vision is to be a proactive “facilitator of industrial land development, in order to build
confidence in the market to invest in Durban and contribute towards economic growth

101
and job creation” (The Planning Initiative, 2014; p. 7). A three-pronged approach is
recommended for the municipality to facilitate industrial development, which are
through: (i) decisive business and political culture, (ii) proactive infrastructure
development, and (iii) innovation, research and development. It is under the third
approach that green industrial development and climate change is considered.
Specifically, the development of strategies to offset CO2 emissions, the reduction of
energy use of buildings and transport, and the support for renewable energy are
applicable to emissions mitigation. The EM ILS also recommended the fast tracking of
EIAs for major developments (The Planning Initiative, 2014). However, a thorough EIA
was pertinent to the success of Mariannhill and Buffelsdraai landfill sites, as the EIA
process with stakeholders took about 10 years (Payne, 2005; Moodley et al., 2011).
4.2.5 Key Development Priorities
The spatial planning of the EM is considered fragmented due to the past Apartheid
legacy and the competing local authorities (Breetzke, 2009). The current post-Apartheid
spatial planning has given prominence to private developers in the north, which is in
conflict with the EM plan to limit urban sprawl. Since 2006, Umhlanga has undergone
high rates of development from undeveloped land, which was previously used for
commercial sugar cane agriculture, to upmarket residential, commercial, and tourist
buildings (Ahmed, 2008; EM IDP, 2015). Furthermore, there is increasing emphasis by
the municipal for industrial development in the western edge, such as Cato Ridge and
Hammarsdale, which lies outside the UDL, thus also contributing to urban sprawl by
increasing edge development. The focus on these areas for green-field development will
also threaten vital carbon sinks, as the majority of green spaces in these areas are not
protected. Therefore, this demonstrates the rhetoric of the municipal IDP; that two
opposing strategies that are found within the same document. Northern eThekwini
(DubeTrade Port and Cornubia) is highlighted for future industry and business park
development. Pinetown, DSIB, and CBD are rated as high potential for brownfields
development, together with road upgrades for increasing road freight as much of the
development in Durban is centred on the dig out port.

102
The SIP for Durban is the geographically-focused SIP 2, which aims to strengthen the
logistics and transport corridor between SA’s main industrial hubs (which are Gauteng,
Free State, and Durban), improve access to export and import facilities, and the new
port development. Although the NDP highlighted the transition to the green economy,
the SIPs are not required to be green infrastructure. However, the IRPTN which is
currently under construction in various road networks in the city and aims to be
completed in 2027, can be considered a mitigation action, as it aims to improve public
transport. The IRTP will have dedicated routes for public transport (bus, rail, and taxis),
cycling, and walking which will connecting the major residential and mixed land use
areas of Umlazi, KwaMashu, Hillcrest, Chatsworth, Tongaat, and Umhlanaga to the
major places of employment such as Pinetown, Warwick CBD, the airport, Rossburgh,
and Prospecton (EM IDP, 2015).
Faling et al. (2012) highlighted the following spatial planning measures for the
development of a low carbon compact city:
Identify strategic nodes and corridors which are the already existing
concentrated, high density, mixed land use developments and develop public
transport routes along these corridors.
Developments should be located at established nodes to discourage urban sprawl
and ensure efficient service provision and optimal resource use.
Encourage mixed land use development so that infrastructure and facilities are
shared
Develop brownfields and vacant sites in city centre.
The EM has developed the above plans highlighted (Faling et al., 2012) in the IDP’s
and SDF’s, however there are inconsistencies, as urban sprawl needs to be limited and
densification must be prioritized, yet commercial and private residential developments
are prioritized at the edges of Durban. Moreover, the value of the SDF and SDP are
criticized as it is the infrastructural limits, such as roads and the sanitation network,
which are considered limits to urban sprawl rather than the actual development plans
(Breetzke, 2009).

103
The EM has also developed a deprivation index, which shows the wards with the
greatest needs. The deprivation index is a composite measure that includes engineering
and social infrastructure backlogs, unemployment, and income. The most deprived
wards are the peri-urban and former township communities, such as Cato Ridge, and
INK. Therefore, this highlighted the wards which are in most need of development. The
least deprived wards are the urban core, which are well developed, such as the CBD,
Pinetown, and Umhlanga (EM IDP, 2015).
In addition to limiting urban sprawl, the densification of the city is mentioned as a
strategy. The nodes which are the foci of the city IRTPN are the same nodes which are
highlighted for densification. However, densification in Durban is limited due to the
limited viable land due to topography, green space and natural resource protection
(Breetzke, 2009). Furthermore, guidelines on densification are lacking in SA, as the
municipality will have to overcome several barriers, such as the importance of land and
house ownership in SA due to culture and history (Nel, 2011). An institutional barrier to
constructing multi-storey residences in central areas, which are near places of work and
easily accessible to the population, is financial viability because it costs more to build
than single houses (Breetzke, 2009). Furthermore, there is a lack of market testing on
higher density residences in SA (Breetzke, 2009). Thus, densification will only be
possible in few locations in the city as well as there is a need to change the mind-set in
the long-term, therefore other strategies are required to achieve a low carbon city, such
as greening household infrastructure.
It is often stated that municipals in SA, and other developing countries, do not consider
climate change mitigation, as they have other pressing issues such as economic
development (Sowman and Brown, 2006; Holgate, 2007; Winkler, 2009; Romero-
Lankao and Dodman, 2011; Ruwanza and Shackleton, 2015). However, this is not
unique to South African cities, as Jabareen (2015) revealed that major developed cities
have included emission targets but limited adaptation measures in their city plans, and
the majority of developing African, Asian and Middle Eastern cities and Eastern
European cities, lack emission mitigation targets and adaptation measures (Jabareen,
2015).

104
In summary, most of the development projects are initiated by private developers and
national government (Table 4.2; p. 106). Private developers and owners do not allow
municipalities to negotiate on the release of land at appropriate locations, as they have
the advantage, thus rapid development takes place on an ad hoc basis (Ahmed, 2008) or
even when they are not warranted (Michel and Scott, 2005). Furthermore, the national
SIPs, which are based on socio-economic developmental needs, without recognizing the
distinct strengths and potential of places. Thus, key development projects are seen to
lack geographical context as places are not regarded as influencing factors in economic
productivity and performance (Turok, 2012). Furthermore, this is similar to other
studies which indicated that the local scale emissions reductions are limited due to
macro-economic and structural factors (Wilson, 2006; Bai, 2007; Holgate, 2007; Burch,
2010; Dhakal, 2010; Kocabas, 2013; Geels, 2014), which are beyond the control and
jurisdiction of local government (Bai, 2007; Aylett, 2011).
The economic development and large scale infrastructural plans show the most
alignment because they are the national development plans. The plans for compact city
development and limiting urban sprawl are disjointed and in conflict with the economic
development and infrastructural plans of both local and national government. Emissions
mitigation and environmentally sensitive development are mentioned but are considered
as rhetoric because strong policies and guidelines are lacking, let alone implemented.
Furthermore, none of the major developments summarized in Table 4.2 (p. 106) pertain
to the green economy. However, although the municipality has undertaken the
construction of public transport infrastructure, which can be considered a mitigation
action, it is expected that the amount of road freight transport will increase due to the
expansion of the current port and development of the new port.
Additionally, the recommendations of the ASSAf (2011) Low Carbon Report for
Durban, such as focusing on reducing emissions from heavy trucks, were not considered
by the municipal. Furthermore, the results of the EM Energy Office (2012) emissions
inventory does not inform city plans and policies or even mentioned in the IDP. Thus,
the emissions inventory has not been used to set targets, and identify interventions for

105
emission reductions and low carbon development. Moreover, the municipal lacks spatial
representation of climate change impacts, information on areas of high emissions, or
potential areas for low carbon pilot programmes.

106
Table 4.2 Summary of key development projects in the EM for the years 2010- 2015. Adapted from the EM SDF (2014) and the EM IDP (2015).

107
4.3 Total Emissions in Durban
The total emissions calculated for Durban for the year 2013 amounted to 12.21 MtCO2e.
Road transport fuel use contributes the most to emissions (43%), followed by industry and
residential electricity use (Figure 4.3; p. 108). Overall, electricity consumption from industry
and residential use contributed to more than half of emissions (55%). The EM GHG
emissions inventories for 2010-2012 also indicated that the transport sector was the highest
contributor to emissions, followed by industrial and residential sectors (EM Energy Office,
2012). Only CO2 emissions were calculated from road transport fuel, and industrial and
electricity consumption, as it is the dominant GHG emitted from those sectors, due to the
combustion of fossil fuel (DEA, 2011c; IPCC, 2013; DEA, 2014b; Eskom, 2014; Tongwane
et al., 2015). Thus, CO2 is the dominant GHG, represented by ~98% of the total emissions.
CH4 and N2O are the dominant gases emitted by solid waste disposal and wastewater
treatment (Manfredi et al., 2009; Mohareb et al., 2011; Shrestha et al., 2012; Bao et al., 2014;
Friedrich and Trois, 2015). However, CH4 and N2O emissions from the waste sector makes
minimal contributions to global, South African, and Durban total emissions, when compared
to CO2 (DEA, 2011c; EM Energy Office, 2012; DEA, 2014b). However these emissions are
expected to rise, with the specific focus on solid waste disposal, as it creates localized
emissions and also has the potential to offset emissions (Manfredi et al., 2009). Therefore, in
this study, CH4 and N2O emissions were calculated from solid waste disposal and wastewater
treatment disposal, expressed in tCO2e. CH4 contributed ~2% and N2O contributed 0.11% to
total emissions in 2013 in Durban.

108
Figure 4.3 Sectoral shares of GHG emissions (in MtCO2e and percentage) in the EM for the year
2013.
4.3.1 Emissions Inventory Comparisons
The results from this study are compared to the official EM community emissions inventories
(EM Energy Office, 2012), and other studies undertaken for Durban for the transport
(Thambiran and Diab, 2011a), industry (Thambiran and Diab, 2011b), and solid waste
(Friedrich and Trois, 2015) sectors, to determine the suitability of the emissions inventory for
further analysis.
The total emissions from this study are significantly less than the EM inventories from 2010-
2012, due to the varying approaches of the study. This study was limited by the spatial
location of consumption activities, and also lacked data on direct energy consumption from
industry. Other energy types used by industries in the municipality, such as coal, fuel oil,
refinery gas, paraffin, liquid petroleum gas, and methane rich gas data are only available at
the magisterial district scale, therefore it is difficult to disaggregate into economic sub-sectors
and, furthermore, industries are not obligated to provide information on their energy use.
Additionally, this study lacked emissions from air and marine transport, because there are
uncertainties on how to attribute those emissions and also to spatialize the emissions.

109
Therefore, this study is not comprehensive but does account for the key sectors which are
discussed in section 4.3.2.
Overall, the sectoral emissions calculated for this study are in agreement with similar studies
(Table 4.3; p. 110), with the most variations in the road transport, industrial electricity
consumption, and solid waste disposal emissions, due to the different approaches and
emission factors used. For the road transport sector, both EM Energy Office (2012) and
Thambiran and Diab (2011a) recorded higher emissions due to the fuel balance method,
which assumed that all fuel sold within the municipality is used within the boundaries, and
also that all petrol and diesel were consumed by road transport vehicles. Therefore, the
method used by EM Energy Office (2012) and Thambiran and Diab (2011a) did not account
for usage from other sectors, such as off-road vehicles used in agriculture, mining, and
construction (SAPIA, 2008; Tongwane et al., 2015).
This study recorded lower industrial and residential electricity consumption emissions than
the EM Energy Office (2012), despite industry and residential electricity use increasing by
0.26% and 0.92% respectively, from 2012 to 2013. The EM electricity consumption
emissions are higher due to the use of the Eskom emission factor, which included losses from
transmission and distribution (Eskom, 2012). This study did not include losses from
transmission and distribution in accordance with ICLEI (2014) guidelines. Similar to this
study, Thambiran and Diab (2011b) accounted for CO2 emissions from industry electricity
use and excluded GHG emissions through process and fugitive emissions related to
manufacturing due to the lack of data on direct measurements.
Friedrich and Trois (2015) recorded higher emissions from solid waste disposal at the three
municipal landfill sites, whereas this study calculated emissions from the three municipal and
two private landfills. However, Friedrich and Trois (2015) used a life cycle approach, thus
included emissions from the collection and transportation of waste, of which the authors
developed their own emission factors. Furthermore, the authors (Friedrich and Trois, 2015)
used a methane commitment method, which is suited to planning and the waste in place FOD
method, which was used in this study, is appropriate for emissions inventory (Mohareb et al.,
2011). Furthermore, ICLEI (2014) stated that GHG emissions calculated with the methane
commitment method will be higher than emissions estimated with the FOD model. The
increase in wastewater treatment emissions are expected, due to population increase.

110
Table 4.3 Comparison of this study's emissions inventory with other studies, expressed in MtCO2e,
with the year of study within brackets.
Sector
EM Energy Office (2010)
EM Energy Office (2011)
EM Energy Office (2012)
Other studies
This study (2013)
Road transport
5.26 5.66 6.18 6.03 (2008)4 5.19
Industrial electricity
4.81 4.74 4.84 2.71 (2008)5 3.63
Residential electricity
3.56 3.41 3.58 - 3.08
Solid waste 0.30 0.36 0.28 0.75 (2012)6 0.27
Wastewater treatment
0.02 0.02 0.03 - 0.04
4Thambiran and Diab (2011a), 5Thambiran and Diab (2011b), 6Friedrich and Trois (2015)
4.3.2 Sectoral Emissions in Durban
The comparison of sectoral emissions with published studies and the municipal inventory
suggested the emissions inventory compiled in this study is suitable for further analysis.
Emissions from the road transport, industry and residential electricity consumption, and
waste sectors will be examined in detail, together with the respective sectoral emission maps
to indicate the wards within Durban that are associated with high sectoral emissions.
Therefore, the sectoral specific information will help to develop sectoral specific mitigation
strategies, as the areas of high emissions activity can be identified. The road transport
emissions are discussed in relation to the vehicle population in Durban. Emissions from
industrial and major commercial electricity are further disaggregated into economic sub-

111
sectors, and compared to the specific contribution of these sub-sectors to Durban’s economy,
to provide an indicator of emissions intensity. The residential electricity consumption
emissions are examined in the context of household access to electricity. Wastewater
treatment emissions are considered in relation to the UDL and solid waste emissions are
compared to the amount of waste received in landfills, and also the household access to waste
collection and disposal services.
4.3.2.1 Road Transport
The highest total emissions from both petrol and diesel fuel use are above 200000 tCO2e. In
comparison, the average eThekwini road transport emissions are at 50000 tCO2e and below
(Figure 4.4; p. 112). The spatial distribution of emissions from road transport fuel demand is
from central Durban to the North coast, and Durban South, which is concentrated in Isipingo
(Figure 4.4. p. 112). Specifically, the highest emitting wards such as Umhlanga, Effingham,
and Durban North have high emissions from both petrol and diesel consumption. These areas
are associated with affluent residential suburbs, tertiary economic activities, such as business
and office parks, and light industry. Isipingo and Umbilo road transport emissions are mainly
due to diesel consumption. Petrol emissions are from wards which are associated with light
industry, commercial activities, and middle to high income residential neighbourhoods.
Diesel emissions are from wards which are associated with heavy and light industry.
Specifically, the wards with the highest emissions are associated with light passenger petrol
and heavy load diesel vehicle ownership and heavy passenger petrol vehicles, which are
minibus taxis, are mostly located in Umlazi.
In Durban, light passenger vehicles make up 68% of the total vehicle population registered,
which is higher than the national level of 54.5% (Merven et al., 2012). This is due to rising
affluence and the status associated with private vehicle ownership, as well as the inadequate
and unreliable public transport infrastructure. Light load vehicles are the second most
common vehicle type, followed by heavy load vehicles. Nationally, heavy load vehicles make
up 3.2% of the vehicle fleet (Merven et al., 2012), but constitutes 5% of the vehicle fleet in
Durban, thus indicating the influence of logistics and port activities, specifically the
movement of goods between Durban and the economic hub of Gauteng. Heavy passenger
vehicles are the least represented vehicle type, indicating the low level of public transport

112
available on roads. Furthermore, approximately 25500 heavy passenger vehicles are
classified as minibus taxis (eNatis, 2014), which are the most popular mode of public
transport available, as it is easily accessible and flexible (Merven et al., 2012). Moreover,
Apartheid planning and racial segregation of neighbourhoods have resulted in low densities
(Nel, 2011) and a large number of commuters, whom are often located far from their
employment (Merven et al., 2012).
Figure 4.4 Total GHG emissions (tCO2e) from road transport in the EM for the year 2013.

113
Overall, the dominant fuel type is diesel which is responsible for 57% of road emissions. This
finding is similar to national trends, where diesel consumption has grown at a faster rate than
petrol consumption (Merven et al., 2012) and has overtaken petrol consumption (SAPIA,
2013). Heavy load vehicles make up 5% of the total vehicle population in Durban, yet
contributes the most to emissions from road transport (Figure 4.5). Diesel is the dominant
fuel used in heavy load trucks, which are the main transport mode used in the frequent
haulage of goods, between Durban and Johannesburg. The second major contributor to road
emissions is light passenger petrol vehicles. Another salient feature is that heavy passenger
vehicles contribute the third most to emissions, yet are the least represented vehicle type (4%
of total vehicle population). This is due to the high mileages of these vehicles due to the
urban sprawl spatial form and as is the most accessible mode of public transport available to
commuters, many of whom live considerable distances away from where they work (Merven
et al., 2012).
Figure 4.5 The GHG emissions (tCO2e) from road transport, according to (a) vehicle class and fuel
type, and (b) vehicle class composition (in figures and percentage) of the EM vehicle population for
the year 2013.

114
Furthermore, the emissions are considered together with the passenger car vehicle ownership
rate, which is expressed as the number of vehicles per capita (Table 4.4). Low car ownership
rates indicate that the people do not have access to private transport and are reliant on public
and other modes of transport, such as walking (Merven et al., 2012). The South African
average is 180 vehicles per capita, which is higher than the KZN average (117 vehicles per
capita) (Merven et al., 2012) and the Durban average of 157 vehicles per capita. However,
within Durban, there are localized areas with high passenger car ownership. Generally, the
wards with the highest emissions have the highest car ownership rates per capita, that range
from 618-1030 vehicles per capita, and are similar to the private vehicle ownership rates of
developed countries, which are 500-800 vehicles per capita (Merven et al., 2012). However,
the exception is Prospecton, which has a lowest passenger car ownership rate of the high
emitters (25 vehicles per capita), which is the lowest vehicle ownership rate studied. Thus,
this indicates the dominance of heavy trucks and freight transport in Prospecton.
Table 4.4 Passenger car ownership rates expressed in per capita.
Place Vehicle ownership per capita
Developed countries average* 500-800
African average* 40
South African average 180
Gauteng average* 314
KZN average* 117
Durban average 157
Umhlanga 1030
Umbilo 785
Morningside 699
Durban North 791
Effingham 618
Prospecton 25
*Source: Merven et al. (2012)
115
4.3.2.2 Industry
The highest emissions from industry and commercial activities electricity consumption are
the SDIB wards of Prospecton, Merebank, and Bluff and west of the SDIB which includes
the Harbour and Clairwood (Figure 4.6; p. 116). There are 102 major manufacturing
industries located in these wards which are fuel, petrochemicals, chemicals, and oil, paper
production, transport equipment, food and beverages, metals and machinery, textiles, and
non-metallic materials, such as plastics. These industries are responsible for approximately
45% of the total industry emissions and 13% of total GHG emissions calculated.
The major users of electricity are the paper mill located in Merebank, two petroleum
refineries located in Prospecton and Bluff, and the port. These industrial activities are of local
and national economic importance. For example, the port is the busiest in Africa (EM, 2014)
and the two petrochemical refineries produce about 60% of the petrol in SA (Aylett, 2010).
Other areas of interest are Pinetown and Umhlanga, which are associated with light industry
and service industries respectively. Industrial process emissions are significant contributors to
GHG emissions, however due to the lack of information on direct measurements of GHG
emissions from industrial facilities in Durban (Thambiran and Diab, 2011b). Furthermore,
this study only included emissions from electricity consumption and excluded other energy
sources, such as coal and refinery gas, because this information is only available at the
magisterial district scale and could not be disaggregated into sectors. Furthermore, industries
are not mandated to provide data, nor is it in their competitive interest to make data available.
However, the inclusion of energy emissions from electricity consumption is justified as it
contributed 41% to total emissions from industry energy use in Durban, followed by coal
(28%) and refinery gas (22%) (Thambiran and Diab, 2011b).

116
Figure 4.6 GHG emissions (tCO2e) from major industrial and commercial electricity consumption in
the EM for the year 2013.

117
The highest emitting wards are compared according to the emissions per floor space (Table
4.5), and expressed as emissions footprint (tCO2e per hectare). Prospecton has the highest
emissions, and the largest industry floor space area, due to 29 heavy industries, but has a low
emissions footprint. Merebank has the lowest industrial extent and the highest emissions
footprint, thus indicating the intensity of the industrial plants located, which are both owned
by the paper mill. Jacobs is a major industrial area, and has the largest number of industrial
plants located yet has the second lowest emissions footprint.
Table 4.5 Industrial emissions footprint of the highest emitting wards, expressed in tCO2e per hectare
(ha).
Ward
Number of
industrial
plants
Floor space7
(ha)
Emissions
(tCO2e)
Emissions
footprint
(tCO2e/ha)
Prospecton 29 190 536012 2821
Jacobs 37 118 202729 1718
Harbour 21 141 258309 1832
Bluff 13 18 410516 22806
Merebank 2 11 424081 38553
7Source: The Planning Initiative (2014).
Globally, the chemical and petrochemicals and paper pulp industry are the most energy
intensive manufacturing industries (IEA, 2007), and amongst the largest GHG emitters due to
process emissions (Huisingh et al., 2015). Similarly in Durban, the fuel, petroleum and
chemicals industry are the main users of electricity, followed by the paper and pulp industry,
and transport equipment manufacturing (Figure 4.7; p. 118). These industries are almost
exclusively located in the SDIB. Furthermore, the paper and pulp industry has the highest
emissions intensity, followed by the transport equipment manufacture, and metal, machinery
and appliances manufacture. Thus, the manufacturing industries are the most emissions
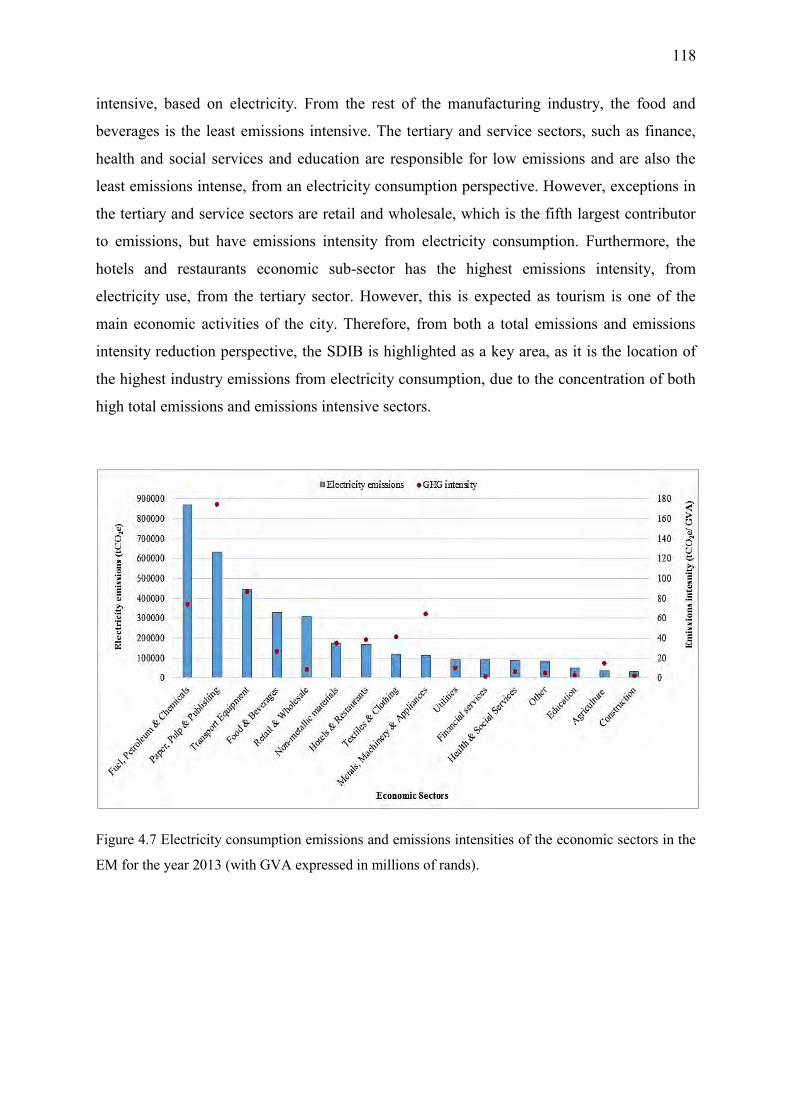
118
intensive, based on electricity. From the rest of the manufacturing industry, the food and
beverages is the least emissions intensive. The tertiary and service sectors, such as finance,
health and social services and education are responsible for low emissions and are also the
least emissions intense, from an electricity consumption perspective. However, exceptions in
the tertiary and service sectors are retail and wholesale, which is the fifth largest contributor
to emissions, but have emissions intensity from electricity consumption. Furthermore, the
hotels and restaurants economic sub-sector has the highest emissions intensity, from
electricity use, from the tertiary sector. However, this is expected as tourism is one of the
main economic activities of the city. Therefore, from both a total emissions and emissions
intensity reduction perspective, the SDIB is highlighted as a key area, as it is the location of
the highest industry emissions from electricity consumption, due to the concentration of both
high total emissions and emissions intensive sectors.
Figure 4.7 Electricity consumption emissions and emissions intensities of the economic sectors in the
EM for the year 2013 (with GVA expressed in millions of rands).

119
4.3.2.3 Residential
The highest CO2e emissions from residential electricity consumption (Figure 4.8; p. 121)
were found in suburbs in the urban core. The specific suburbs are the Pinetown south, Hilary,
Durban North, Umhlanga, and Illovu. These suburbs have middle to high income households
and low population densities (EM IDP, 2015). The lower emissions are found in the rural
periphery and the CBD, which is associated with business and commercial activities and
more dense residences. This is consistent with studies in literature on the spatial distribution
of carbon emissions from households, which have lower emissions from household energy
use in the CBD and higher emissions in suburbs (VandeWeghe and Kennedy, 2007; Dodman,
2009a; Satterthwaite, 2010; Hoornweg et al., 2011; Hillmer-Pegram et al., 2012; Jones and
Kammen, 2014). There are patches of low emissions in between areas of high emissions
which are the former townships. Furthermore, the majority of emissions from the former
township areas are below 30 000 tCO2e, which is close to the city average of 29916 tCO2e.
Although there are about 956 000 households in Durban, the focus was on formal households,
as ~34% of households are considered informal and 11% are rural households, which lack
access or have limited access to electricity (Taylor et al., 2014; EM IDP, 2015).
Household electricity consumption is the main target of national governments electricity
saving campaigns and also subjected to electricity load shedding and electricity price
increases. However, information from the EM Electricity (2014) indicated that, overall, total
electricity consumption of households has decreased. Household electricity emissions (and
thus consumption) from the major residential households, which are credit customers,
decreased from 2008 to 2011 due to load shedding, followed by a slight increase from 2011
to 2013, when load shedding was re-introduced. The slight increase in household electricity
consumption emissions could be due to load shedding and electricity saving campaigns
initiated by the EM, such as changing of lightbulbs, which could have mitigated a large
increase in electricity consumption. Although it is positive that emissions are decreasing, it is
still problematic as the source of electricity generation is still fossil fuel-based. If Eskom did
not implement load shedding to reduce supply, emissions would be higher.
However, it is important to note that the number of credit customers are decreasing, thus
indicating that a fewer number of households are responsible for major electricity
consumption. Prepaid customers are increasing, which indicates that more households are

120
using less electricity, due to increasing electricity prices, and are also becoming reliant on
other forms of energy to meet their needs. This is informed by the DoE (2012) National
Household Energy Survey which indicated that prepaid electricity households also use other
energy sources such as candles, paraffin, firewood, and gas. Furthermore, 323000 households
are not electrified, and it is expected to take 32 years to address this backlog (EM SDF,
2014). The backlogs represent the future energy demand, which will increase GHG emissions
in the future. Therefore, it is important to provide these communities with low carbon solar
energy, generated on-site, so that they are not reliant on the unreliable national grid, and not
subjected to electricity price increases. This will ensure that the future provision of electricity
will not increase emissions.

121
Figure 4.8 GHG emissions (in tCO2e) from household electricity consumption in the EM for the year
2013.
4.3.2.4 Waste
Emissions from waste, such as solid waste disposal and wastewater treatment plants,
contribute the least to total emissions as shown in Figure 4.1 (p. 95). Further disaggregation
of the waste sector revealed that solid waste emissions contributed 91% to the sectoral

122
emissions (Figure 4.9). Solid waste emissions were estimated from the landfills mentioned in
section 3.6.4. Wastewater treatment emissions were calculated from the municipal owned and
operated plants only. Further analysis of emissions from solid waste disposal in landfills and
WWTPs will be discussed.
Figure 4.9 GHG emissions from waste emissions (in tCO2e and percentage) in the EM for the year
2013.
Solid Waste
The emissions inventory for solid waste disposal at landfills in the for 2013 (Figure 4.10; p.
125) established that the two private landfills, Bulbul and Shongweni were the highest
emitters, contributing 36% and 35% respectively, to total solid waste emissions. The Bisasar
landfill was responsible for 20% of solid waste emissions, and Mariannhill contributed the
least emissions (2%) in this sector.
Bulbul landfill, is a privately owned and operated by Wasteman waste services company, is
surrounded by Indian and African communities of Chatsworth and Umlazi, located in close
proximity to households. The landfill, which accepted low hazardous level industrial waste
(Friedrich and Trois, 2010), closed in 2011, meaning that it stopped receiving waste, after
numerous community protests and campaigns (Cole, 2011). However Bulbul landfill is still
the highest emitter in this sub-sector, as it does not have a LFG collection system (EM
Energy Office, 2012). The Shongweni landfill is located on the peri-urban fringe of the EM,

123
near Shongweni nature reserve and KwaNdengezi community, is privately owned and
operated by EnviroServ waste management company. The landfill which also does not have
an LFG collection system and this has contributed to high emissions in this sub-sector.
Furthermore, Shongweni landfill is the only currently operating landfill that accepts low to
moderate hazardous level industrial waste (Friedrich and Trois, 2010).
The Bisasar landfill is the most important landfill in the EM, and also the largest and busiest
landfill in SA (Parkin et al., 2006; Friedrich and Trois, 2013). The landfill caters for central
Durban and received the most volume of waste, but is not the largest emitter due to the CDM
project which is LFG collection and electricity generation, which has significantly mitigated
emissions so that it was the third highest emitter in the EM. However, the Bisasar landfill is
associated with conflict and community protests due to its location within the residential area
(Parkin et al., 2006; Leonard, 2012). Another example of the CDM LFG collection and
electricity generation project is Mariannhill landfill, which is located about 20 km from the
city centre, and receives waste from the western areas of the EM (Moodley et al., 2011)
Mariannhill landfill received the second least amount of waste but is the lowest GHG emitter
due to emissions mitigation. Furthermore, the Mariannhill landfill is SA’s first landfill
conservancy, and is considered a textbook example due to its location hidden from public
view, by the natural topography and vegetation, although it is located near communities
(Parkin et al., 2006; Moodley et al., 2011).
Buffelsdraai landfill was established in 2009 to cater for northern EM (Moodley et al., 2011),
and is hidden from public view and away from communities. The Buffelsdraai landfill has
low emissions because it receives the lowest volume of waste. However, the landfill does not
have the LFG collection system in place (Friedrich and Trois, 2015). Furthermore, the closure
of the Bisasar landfill at the end of 2015 will increase the amount of waste received at
Buffelsdraai, which is located ~40 km from Bisasar. Furthermore, Mariannhill landfill will
also close and be replaced by new site in Shongweni in 2022, and a new landfill is planned in
Illovu, although the date is unknown (EM IDP, 2015). Thus, solid waste will be transported
further north, west and south to landfills which do not have LFG collection systems and
electricity generation (and plans are unclear if it will be in place), which will increase
emissions from solid waste disposal, as well as life cycle emissions from the collection and
transportation of solid waste (Friedrich and Trois, 2015).

124
Furthermore landfill emissions must be noted in the context of solid waste disposal in EM,
where 88% of total households have their refuse removed by the local authority or private
contractors (StatsSA, 2013). The remaining households (12%) do not have their refuse
removed, and subsequently dump waste on their own, in a communal dump, or do not have a
specific method, and thus cause the most environmental damage (Manfredi et al., 2009). The
wards associated with these activities are the peri-urban tribal authority areas, which
experience non-refuse removal service rates of 52-83% (StatsSA, 2013). The medium term
(20 year) target of the EM LTDF is a zero waste city (Imagine Durban, 2010), which does not
need landfill sites, yet more landfill sites are being planned, whereas municipal resources
should be targeted at diverting waste away from landfills and encouraging citizens to reduce
consumption, recycle, and compost organic waste (Friedrich and Trois, 2015).

125
Figure 4.10 GHG emissions (tCO2e) from solid waste disposal at landfills in the EM for the year
2013.

126
An analysis of the waste composition received by the landfills, which are represented by
average values (Figure 4.11), are important to understand the contribution to emissions.
The municipal landfills received solid waste mostly from households, garden, business,
and industry, thus the majority of the waste were organic waste. The private landfills
received the highest contribution of general solid waste from businesses and industry.
The highest emissions were from Bulbul landfill, which received high contributions of
both general solid waste from businesses and industry, and household waste, which has
high organic content, and building rubble. The waste composition from Shongweni
landfill differs from the other landfills, as it does not receive household or garden waste
but received waste mainly from business and industry, as well as the high makeup of
sludge and liquid, and ash, which are considered low to moderate hazardous industrial
waste.
Figure 4.11 Average annual amount and composition of waste received at the landfills studied.
The years used to calculate averages are in brackets.
Wastewater Treatment
Emissions from the Central, Isipingo, and Umbilo wastewater treatment plants were
responsible for nearly half of the emissions from the wastewater treatment sector

127
(Figure 4.12). However, this is expected as these three plants serve the most population.
Furthermore, the waterborne WWT network in the EM is limited by the UDL, which is
based on the areas served by the current water-borne municipal sanitation network
infrastructure (Breetzke, 2009). The intention of this was an attempt to limit urban
sprawl, specifically the increasing westward growth of the Umhlanga development,
which was in competition with the CDB development and revitalization (Breetzke,
2009).
Figure 4.12 GHG emissions (tCO2e) from wastewater treatment plants in EM for the year 2013.

128
Additionally, the rural areas are important green spaces which need to be preserved,
thus waterborne sanitation infrastructure will be detrimental and also unfeasible, due to
the low sparse densities and the under-development of those areas (EM IDP, 2015). To
overcome these barriers and also to ensure basic service provision to those areas which
were non-serviced during Apartheid, the EM sanitation department provided alternative
services of on-site sewage treatment to the peri-urban, rural and also informal
settlements. The alternative services include ventilated improved pit latrines for dense
settlements and urine diversion toilets for less dense areas (EM IDP, 2015). Thus, the
emissions from wastewater treatment from those areas are significantly lower, due to
the lack of waterborne wastewater.
The wastewater treatment processes which contribute the most to emissions are the
plants with effluent discharge into streams, rivers, and oceans (43%), followed by the
stationary combustion of the biogas with anaerobic digestion of biosolids (40%) (Figure
4.13; p. 129). The only WWT types that contributed CH4 emissions were the stationary
combustion of biogas with anaerobic digestion of biosolids, and anaerobic lagoons
whilst the rest of the processes contributed N2O only. However, a single plant employs
various methods; for example, Central WWTP employs treatment without nitirification
or denitrification and also effluent discharge into aquatic body, which is the Indian
Ocean.

129
Figure 4.13 GHG emissions (in tCO2e and percentage) from wastewater treatment plants in the
EM for the year 2013.
4.3.3 Emissions Inventory Uncertainties
The major uncertainty is related to the lack of coverage of other sources and sectors
which limits the completeness and comprehensiveness of the emissions inventory and
emissions profiles. Specifically, the emissions inventory lacks emissions from industry
process, residential on-site burning of biofuel and other energy sources, and energy
consumption from the marine, and aviation transport sectors. The inclusion of this
information is expected to change the emissions profile at the ward scale. For example,
the inclusion of industrial process emissions and other energy sources will change the
emissions profile of SDIB wards. Likewise, the inclusion of residential burning and
other energy sources can change the emissions profile of the rural fringes. The
implication of this is that the mitigation strategies will need to be modified.
Despite these gaps, the study presented is a first attempt which is focused on key sectors
and sources of emissions, which were highlighted in similar studies for Durban.
Furthermore, there is increasing motivation for reducing emissions from the activities
which contribute the most to emissions, especially in cities from developing nations, as
local government has limited resources to focus on emissions reductions from all

130
activities. However, future sectoral studies and data availability and access could work
towards improving the representation of emissions.
4.4 Spatial Analysis of Emissions in Durban
Following from the qualitative analysis of the municipal strategic planning documents,
the key development areas in Durban were identified, which were industrial and
logistics expansion in the SDIB and in the western fringe of the city (Cato Ridge and
Hammarsdale). Furthermore, commercial development is expected to increase in north
Durban, and development of former township areas and CBD revitalization were
highlighted.
The areas identified as high emission zones will be discussed in detail in section 4.5.
Similarly to air pollution priority areas, the highest emitting activities located in the high
emissions zones must be considered priority areas where interventions are required to
reduce emissions. The emission profiles of the highest emission zones will be discussed
in conjunction with the development plans identified in the qualitative analysis of
municipal strategic plans.
The spatial analysis of emissions revealed significant emissions along the coast, and low
emissions from the adjacent hinterlands (Figure 4.14; p. 132). The highest emissions are
from the SDIB, specifically from Prospecton, (767172 tCO2e), which is ~6.5 times more
than the Durban ward average (118632 tCO2e). A spatial trend of high emissions zone
running parallel along the coast, and the national N2 road, is identified from
Umbongtwini through the CBD and the north to Umhlanga. Another spatial trend of
relatively lower emissions is identified from east to west, along the national road which
is the N3, from central Durban to the west and includes Westville, Pinetown, and Cato
Ridge. Both emission trends are attributed to historical city growth trends from the port
outwards, and infrastructure focus on the two national roads (Breetzke, 2009). The least
emissions are from rural and the former township areas. The lowest emissions are found
in Shangase Ta (9985 tCO2e), which is about 11.9 times less than the Durban average.

131
This indicates the disparity in emissions contribution which exists in the city. To further
highlight emissions inequality, the 10 highest emission wards (between 300001-770000
tCO2e) are responsible for 35% of total emissions, of which 15% is attributed to the
three highest emitting wards, whilst the rest of Durban contributed 65% to total
emissions.
Prospecton, Merebank and Bluff, found in south Durban, are the three highest emitters
in eThekwini. This is followed by Umhlanga in the north and the Harbour. The majority
of South Durban emissions are associated with the manufacturing industries, and the
port, and related activities, specifically road freight which uses heavy trucks that
consume diesel. Residential and private car and public transport, from the residential
suburbs of Isipingo, Clairwood, Merebank, and Bluff, makes minimal contributions to
emissions, when compared to the magnitude of industry emissions.
Central Durban wards (CBD west and north such as Morningside) wards are similar to
other studies due to the low sectoral contribution of residential energy to emissions.
However, contrary to other studies (VandeWeghe and Kennedy, 2007; Jones and
Kammen, 2014), the high total and per capita emissions are associated with the city
centre, due to the high contribution of road transport because of urban sprawl which has
impacted on the lack of efficient and reliable public transport. This has led to a reliance
on private transport as well as heavy trucks for haulage. Furthermore, the energy
intensive tourism service industry is also located in central Durban wards. The north
Durban suburbs of Umhlanga and Durban North are characterized by the high
contribution of road transport, specifically private cars (both petrol and diesel) to their
total emissions. Therefore the high emissions zones identified broadly are south Durban,
central Durban, and north Durban. These places are highlighted for further private
housing, commercial office parks and industrial development. Thus, these zones and
their context, together with the municipalities’ development plans will be discussed in
detail in section 4.5.

132
Figure 4.14 Total GHG emissions (in tCO2e) in the EM for the year 2013.

133
The intra-ward comparison of the populations GHG intensity (tCO2e per capita) is in
agreement with total emissions, thus, the wards with the highest emissions are highest
per capita emitters and the wards with the lowest per capita emissions are the lowest
emitters (Table 4.6; p. 135). Furthermore, the GHG intensity of these wards is above the
South African average carbon intensity (9.90 tCO2e per capita). This differs from the
situation in Chinese and American cities, where China contributes the most to
emissions, yet their per capita emissions are low when compared to the lifestyles of
American citizens (Moghaddam et al., 2013).
When compared to Oslo (Norway) per capita emission of 2.19 tCO2e per capita, which
was chosen by Zhou et al. (2014) as the benchmark indicator to assess low carbon
development, the average per capita emissions calculate for this study (3.43 tCO2e per
capita) are high. Furthermore, the GHG intensity of the majority of the wards in Durban
is below the average for this study. Therefore this indicates the inequality in emissions
intensity in Durban. Furthermore, the only wards which are lower than the Oslo
benchmark, are the rural tribal authorities, which correspond the most deprived areas in
the EM, and are characterized as poverty stricken and lack formal housing, and basic
services, such as sanitation and electricity (EM IDP, 2015), thus providing further
evidence to highlight the emissions disparity within Durban.
Due to the overwhelming contribution of industry emissions in Prospecton, the per
capita emissions are comparable to Chinese cities, such as Lanzhou (21.04 tCO2e per
capita), where industry accounts for the bulk of emissions (Wang et al., 2012).
Additionally, Ramsay and Naidoo (2012) found that the emissions intensity of Tara
Road in the SDIB are comparable to Asian cities, and recorded a value of 73.26 tCO2
per capita, due to the energy consumption of industry and buildings. Furthermore, the
emissions are also comparable to developed nations, such as USA, where the city of
Denver has emissions of 20.12 tCO2e per capita which are related to lifestyle emissions
(Wang et al., 2012). However, south Durban communities not affluent and are exposed
to various environmental and health risk due to the proximity to industry.

134
Furthermore, when the emissions from industry electricity consumption are excluded
from the emissions intensity calculation (Appendix C), the new GHG emissions
intensity of Prospecton is 8.49 tCO2e per capita, due to fuel consumption emissions
from freight vehicles, as the private passenger car ownership rates of this ward is low.
Other south Durban wards emissions intensity also decreases to 3.90tCO2e per capita
for Bluff and 3.21 tCO2e per capita for Merebank, which can be compared to cities in
developing nations, such as Kolkata (3.29 tCO2e per capita), Amman (3.3 tCO2e per
capita), and European cities such as Barcelona (4.0 tCO2e per capita) (Feng et al.,
2015). Morningside then becomes the emissions intense ward, with 10.83 tCO2e per
capita, followed by Umhlanga (8.88tCO2e per capita) and Durban North (8.07 tCO2e
per capita), which are still comparable to cities in USA and Canada, such as New York
(7.96 tCO2e per capita), Seattle (11.47 tCO2e per capita), and Toronto (8.81 tCO2e per
capita) (Kennedy et al., 2012). This underlined the impact of structural influence on
emissions intensity in SDIB, which are outside the control of citizens, due to the
concentration of industries. Furthermore, the significance of lifestyles emissions in
Morningside, Umhlanga, and Durban North neighbourhoods are emphasized, especially
the contribution of road transport and passenger cars, because these wards recorded high
passenger car ownership rates which are comparable to developed countries.

135
Table 4.6 GHG emissions intensity (in tCO2e per capita) of the EM wards for the year 2013.
136
4.5 High Emission Zones
The high emission zones are discussed in the context of three zones: (i) south Durban-
from the harbour south along the coast to Umbogintwini, (ii) central Durban (iii) north
Durban- north of the CBD along the coast to Umhlanga. The wards in these zones
constitute the ten highest emitters and the nine highest emissions intense
neighbourhoods (which are all above the South African average GHG emissions
intensity) in Durban. Many of the wards which fall under south Durban in this study are
considered central Durban in the EM spatial planning. However, the use of south
Durban to describe these wards is due to the common use of SDIB to describe the strip
of land from the Harbour which extends southwards to Prospecton. The socio-economic
context of the high emitting wards are first discussed, followed by the GHG emissions
profiles with the relative sectoral contributions to total emissions which are then
discussed together with future development implications and mitigation options.
4.5.1 South Durban
The SDIB is the second largest industrial hub in South Africa, due to its proximity to
the port. Prior to 1950, south Durban was a multicultural area (Nurick and Johnson,
1998). However the current make of the south Durban communities is the legacy of
racial segregation of the Group Areas Act of 1953. Thus, the wards of SDIB are
predominantly made up of historically marginalized and disenfranchised black
communities, such as Bluff, Merebank, Isipingo and Clairwood. The exception is the
Bluff, which was considered a white area.
During Apartheid, heavy industrial development of the area was prioritized due to
economic sanctions, port proximity, and the availability of cheap labour from the
surrounding marginalized communities (Scott et al., 2002). Therefore, the large
industries in the SDIB, such as the petrochemical refineries, were considered national
strategic interests, and operated with little restriction in terms of air pollution and also
were given special electricity pricing deals. Although there is progress in stricter air

137
pollution laws than those that existed in the past, and the development of Air Quality
Management Plans and the SDB Multi-Point Plan (SDB-MPP) to improve air quality,
the special electricity pricing rates and the significance of petrochemical and oil
refineries as National Key Points, and the prohibition of disclosure of information to
third parties have yet to be withdrawn (Nurick and Johnson, 1998; Scott and Barnett,
2009). There are strong civil society organizations and community resistance against the
poor air quality and climate change issues related to industries and heavy trucks (Nurick
and Johnson, 1998; Scott and Barnett, 2009; Aylett, 2011; Sutherland et al., 2013;
Bond, 2014b; Mottiar, 2014).
The current GHG emissions profiles of the wards in south Durban shows the high
contribution of industry emissions (Figure 4.15; p. 138) followed by road transport.
Household electricity use was generally low, however the highest contribution were
from Bluff and Umbogintwini. About 57% of the households in south Durban are
considered low to middle income, earning between less than R38200 to R614400
annually (StatsSA, 2013). The exception is Umbogintwini, where 70% of households
have no income or earn less than R38200 annually (StatsSA, 2013). Furthermore, the
emissions profile for south Durban is comparable to Singapore, where energy emissions
(dominated by electricity consumption) from industry, commercial and residential
buildings contributed 83% to total emissions, followed by road transport emissions
(17%) (Sovacool and Brown, 2010). A further similarity is the economic activities in
Singapore, such as petroleum and oil refineries and the port (Sovacool and Brown,
2010).

138
Figure 4.15 The GHG emissions profile (in tCO2e) of south Durban wards for the year 2013.
The emission rankings of wards are in brackets (1= highest emitter in the EM).
Specifically, the chemicals manufacturing industries contributed the most to emissions.
Nationally, Hallowes (2015) reported that the Chemical and Allied Industries
Association (CAIA) does not support further development of government’s climate
change policy including the carbon tax, and the DEA’s plans to set a national carbon
budget applicable to sectors to limit emissions, as they view SA’s national emissions are
insignificant and government’s carbon reduction targets were met. This indicates the
perceptions of major industry towards emissions mitigation in South Africa, which is a
clear contrast from what the DEA and citizens’ demand, and further indicative of
structural influences beyond the control of the municipality.
The emissions profile of the harbour shows the high contribution of industry electricity
consumption to total emissions (69%), followed by road transport (30%), especially
private vehicles as ownership rates are high and heavy trucks, due to port-related
activities. Specifically, the port is one of the highest electricity consumers in the city.
Other major economic activities are the manufacturing of chemicals and rubber, food
and beverages, electrical appliances, and transport equipment, specifically shipbuilding
and repairs.
139
A major future development in South Durban is the Durban Dig-Out Port (DDOP) and
the petrochemical sector. Furthermore, other major infrastructural developments are
hinged on the DDOP development. The development of the DDOP at the former
Durban airport site in Prospecton arose to increase port performance. The current port is
considered inefficient as a container port due to high tariffs thus making it one of the
most expensive in the world (EM, 2014). This is further indicated by the loss of
rankings in logistics performance by the World Bank (EM, 2014).
The DDOP is expected to increase port capacity by eight-fold. The increase in container
handling capacity and efficiency, plus the increase in the existing port capacity, and the
expansion of the petrochemical complex in south Durban.is the second mega-project
priority of the National Development Plan (NDPs) Strategic Infrastructure Projects
(SIP). This is in conjunction with Operation Phakisa, which aims to create economic
growth and job creation in the maritime sector. However, the increase in port size by the
extreme eight-fold multiple due to projected increase in shipping is considered
unwarranted, since there is lack of major growth in shipping volumes, the increased
attention on GHG emissions from ships, proposed carbon taxes and emission
limitations, and the global economic market risk (Bond, 2014b; Hutson, 2014). There is
an overwhelming focus on freight transport and logistics, especially heavy trucks, which
are expected to increase due to the potential development of a logistics park in
Clairwood on former green space land. Furthermore, the EM expects that heavy
vehicles will double by 2030, even despite plans for improvements in air and rail
transport (Maharaj, 2013).
According to Maharaj (2013) the highest sea level rise projected will not pose a
challenge as the port infrastructure will be adequate. However, the link between
increasing ocean temperature, wind speeds and already projected sea level rise, and the
impact of coastal storms on the port and ships is not considered. Furthermore, the
Durban Climate Change Strategy (DCCS, 2014), considers the rising sea level and the
increased intensity of coastal storms a threat to the port expansion, thus there is a need
to adopt a risk-averse approach to land use, infrastructure planning, and development.
However, this lack of climate change considerations resulted in the DEA (2013)

140
rejecting the ports’ EIA. The EIA also claimed that emissions from the DDOP will be
reduced due to larger ships which will result in lower GHG emissions per container.
However, a reduction in emissions intensity is not equivalent to a reduction in actual
emissions because an increase in emissions efficiency can still lead to increase in total
emissions, due to increased shipping activities.
More manufacturing industries are expected to be developed and/or expanded in the
areas adjacent to the DDOP. Presently, the proposed location for the DDOP is the
highest emitting ward in eThekwini. An example of proposed industry is the expansion
of transport equipment manufacturing. The transport manufacturing sector is already
located in the highest emitting zone and is the third highest emitting and emissions
intense sector. However, it represents an opportunity to reduce both emissions intensity
and total emissions.
The industrial and road upgrades and developments of other key development areas,
which are directly linked to the site or in other parts of eThekwini are based on the
DDOP. Thus, if climate change impacts are not considered, Durban will be left behind
as only the economic aspect is considered, and the social and environmental are
ignored. However, the DDOP development is incompatible with a low carbon strategy
as it will increase emissions directly and through related activities, such as increase in
road freight. Even though technology can play a role in emissions decrease, any benefits
will be offset by the increase in number of calls at port and increasing demand. The
current port is already a high electricity user and the new DDOP will also use more
electricity, thereby increasing emissions in the already highest emitting south Durban
zone. The increase in petrochemical manufacturing shows the increasing reliance on
fossil fuel for SA. Furthermore, the Durban estuarine bay, which is threatened by the
port expansion, provides vital ecosystem services including carbon sinks (DEA, 2013).
An alternative development for south Durban, recommended by South Durban
Community Environmental Alliance (SDCEA), entailed local economic development
based on labour intensive industry, agriculture, public transport accessibility and
efficiency, less consumerism, and zero-waste generation, and investment in social

141
infrastructure to provide and improve access and efficiency of basic services (Bond,
2014).
4.5.1.1 Recommendations for Mitigation Strategies in South Durban
Industrial electricity consumption emissions from the chemicals, paper, and transport
manufacturing industries are the highest, therefore it is important for these industries to
upgrade their structure and move towards improved and cleaner production (Feng et al.,
2015; Zhao et al., 2015). Since industries of the same sector in the same space can
adopt renewable energy generation on site (DEA, 2014b) to achieve industrial
symbiosis, which is the effective use of energy and resources (Huisingh et al., 2015).
However, large scale infrastructural projects for renewable energy generation are
limited in cities (Moriarty 2015), even more so in Durban, due to the topography and
green space protection, but also in the SDIB as it is prime industrial land.
Furthermore, there are limits to technological measures to mitigation emissions, as
demonstrated in China, where increasing energy efficiency resulted in increasing
production, thus resulting in no net reductions in emissions. Moreover, Feng et al.
(2015) recommended limiting and even eliminating the development of industries with
high energy consumption, emissions and low-value added. Similarly, restricting and
limiting the development of industries which are not low carbon, or do not have a low
carbon strategies are recommended. However, the municipality needs to be cautious of
imposing limiting regulations as this can be offset by leakage by increasing emissions
and non-low carbon development in less stringent areas, or areas with low emissions
(Bushnell et al., 2008). Although this structural reduction is recommended for industries
which emit significant pollutants (Bushnell et al., 2008; Wang et al., 2014b) of which
the majority are in SDIB, it is unsuitable for GHG emissions.
Therefore, a viable option for industries in SDIB to reduce emissions is through carbon
offsets with developmental co-benefits, as recommended by the National Treasury
(2014). Specifically, the industries in South Durban can invest in renewable energy

142
projects, ecosystem rehabilitation, and food security in the rural periphery, which are
also the lowest emitting areas in the municipal, thereby ensuring that the development
of those areas are not associated with increasing emissions.
4.5.2 Central Durban
Since the 1900’s the area which is referred to as central Durban was an important
location for residences and businesses which led to a racially diverse community. In
1963 the area was designated for whites; however Africans and Indians remained in
some locations, which led to local authorities neglecting these locations which resulted
in urban degradation (Nomico and Sanders, 2003). Thus, the Durban CBD and inner
city is characterized by decentralization since the 1980’s due the impacts of neglect by
the then local government, which led to the relocation of many major corporates to
office parks in mixed land use areas, such as Umhlanga (Nomico and Sanders, 2003;
Michel and Scott, 2005). However, currently there are plans for urban renewal in the
inner city to attract investors (EM IDP, 2015). Morningside, north of the CBD, is a
generally affluent area, formerly designated for whites. The main economic activities
are tertiary services such as retail, entertainment and corporate offices.
The western CBD profile shows that road transport dominates (54%), followed by the
commercial sectors (Figure 4.16; p. 143). This part of the CBD hosts the Warwick
Junction, which is a major transport node and is the main gateway into the city for
commuters (Nomico and Sanders, 2003). Furthermore, the majority of economic
activities are wholesale and retail, financial services and commercial office parks.
Similarly, the emissions profile of Morningside shows the high contribution of road
transport (77%) to the total ward emissions. This is due to the large number of petrol
and diesel private passenger car ownership rates. Furthermore, Morningside has the
highest residential emissions in central Durban. Morningside is considered middle
income as 50% of households earn an annual income of more than R153801. In
contrast, the CBD is the one of the lowest residential emitters in eThekwini and
households in the CBD are considered low income, because ~70% of households earn

143
less than R76400 annually (StatsSA, 2013). The high contribution of road transport
emission to the emissions profile is comparable to developing cities such as Delhi and
Sao Paulo, where road transport contributed 66% and 51% respectively (Sovacool and
Brown, 2010), of which the dominant source of CO2 emissions were private cars.
Therefore, Morningside is more similar to those cities than the rest of the CBD.
Figure 4.16 The GHG emissions profile (in tCO2e) of central Durban wards for the year 2013.
The emission rankings of wards are in brackets (1= highest emitter in the EM).
4.5.2.1 Recommendations for Mitigation Strategies in central Durban
The road transport sector is recommended to be the focus of mitigation strategies, with
the specific focus on minibus taxis in the CBD and private passenger cars in
Morningside. The mitigation strategy which achieves the most reductions in road
transport emissions in SA is reducing vehicle mileages and the vehicle population
(Thambiran and Diab, 2011b; Tongwane et al., 2015) and modal shift from private cars
to public transport (DEA, 2014b). Furthermore, there are concerns about the limits of
technological improvements in motor vehicles, because increasing vehicle energy
efficiency and the encouraging of taking up these vehicles may result in the rebound
144
effect, where increased energy efficiency is offset by increased driving (Larson et al.,
2012; Muniz et al., 2013; Moriarty and Honnery, 2015). Therefore, the strategy to
reduce mileages and the number of motor vehicles on the road are vital and are
applicable to both minibus taxis and cars. Furthermore, the revitalization of the CBD is
focused on improving infrastructure to create a walkable and accessible inner city. This
ties in with the concept of eco-mobility, which are sustainable transport systems, that
have recently gained impetus amongst cities worldwide (Gota, 2015; Lah et al., 2015).
EM should provide financial incentives and subsidies for minibus taxi owner’s purchase
more fuel efficient vehicles (Gota, 2015; Lah et al., 2015). The vehicle population and
the distance travelled by private vehicles need to be reduced in Morningside.
Furthermore, the reduction of car mileages can be achieved by providing incentives for
companies that apply car sharing schemes for their employees. Companies can provide
incentives for employees residing in the same neighbourhoods to carpool. These
incentives can also be supported by the EM. Furthermore, the EM should implement
vehicle restrictions and limits on specific major roads to create a low emissions zone
(DEFRA, 2010) within the CBD and Morningside; for example, the restriction of cars
on major roads will need to be mandatory so that it would be a car-free zone, and
commuters would need to use public transport, walk or cycle. This strategy is in
alignment with the DEA (2014b) MPA, which stated that the successful implementation
and effectiveness of modal shift from private passenger cars to public transport is site-
specific therefore the role of local government is vital. This will ensure greater use of
public transport in the IRPTN, especially as the CBD is one of the main corridors in the
network.
The success and uptake of mass transit is vital for emissions mitigation, sustainability,
and social cohesiveness especially in developing cities due to increasing populations
and limited space for transport infrastructure (Lah et al., 2015). These socio-economic
and physical factors are particularly relevant to the EM, as the inequalities in emitting
activities are evident and spatial planning is limited by dissected topography and green
spaces (Breetzke, 2009; Turok, 2012). However, with these eco-mobility strategies and

145
the IRPTN, the EM needs to ensure the reliability and efficiency of public transport, and
the safety of commuters.
4.5.3 North Durban
Umhlanga and Durban North have always been generally high income, low density
residential suburbs, associated with holiday makers due to the coastline (Michel and
Scott, 2005; Ahmed, 2008). The Apartheid context of Umhlanga and Durban North
were designated “white” suburbs buffered against former tribal areas and African
townships, such as INK, by the designated Indian areas of Newlands, Tongaat, and
Verulam (Michel and Scott, 2005). Umhlanga is located about 20 kilometres from the
city centre, and was bordered by large areas of undeveloped land, used for sugarcane
farming. The undeveloped land was ideal for the development of gated residential
suburbs, large retail spaces and office parks for tertiary economic activities and
corporate headquarters (Michel and Scott, 2005). Presently, this situation is still
occurring due to more former agricultural land being released by the Tongaat-Hulett
Sugar Company to be transformed into urban land use, thus increasing the western
expansion of Umhlanga (Michel and Scott, 2005; Ahmed, 2008; EM IDP, 2015).
The key contributor to emissions in the north is road transport in Umhlanga (57%) and
Durban North (64%), (Figure 4.17; p. 146), which is dominated by private passenger car
ownership rates, which are even higher than rates in developed countries, due to the
affluent inhabitants. The industry emissions are related to the tertiary sector, such as
retail, and commercial office parks and increased development is expected in those sub-
sectors. The emissions profiles of Durban North and Umhlanga are comparable to
Morningside, and internationally with Delhi and Sao Paulo (Sovacool and Brown,
2010), due to the dominance of road transport emissions, especially from cars.
This area has the highest residential electricity emissions of the three zones. The private
car ownership and high residential electricity consumption emissions are due to the
affluent lifestyles of the inhabitants. According to the StatsSA (2013), about 47% of
households in Umhlanga and Durban North earn between R307601- 2457601 and more

146
annually, and are thus classified as upper middle to high income households.
Furthermore, Umhlanga has the highest number of households (24%) in Durban which
earn R2457601 or more annually. The increase in upmarket gated residential housing
estates, commercial developments, such as retail and office parks, and tourist facilities
(Michel and Scott, 2005; Ahmed, 2008; EM IDP, 2015) are expected to increase
affluence. Although there is development of low cost housing in Cornubia, which is
west of Umhlanga, the majority of developments are aimed at the wealthy. However,
important infrastructure developments such as sewerage and roads have lagged behind
the residential and commercial development growth (Ahmed, 2008; ASSAf, 2011).
Figure 4.17 The GHG emissions profile (in tCO2e) of north Durban wards for the year 2013.
The emission rankings of wards are in brackets (1= highest emitter in the EM).
4.5.3.1 Recommendations for Mitigation Strategies in North Durban
Similar to central Durban, the road transport sector is recommended to be the focus of
mitigation strategies. However since the emissions profile of Umhlanga and Durban
North are similar to Morningside, the specific measure recommended is on reducing the

147
number of private cars and the distance travelled (Thambiran and Diab, 2011b;
Tongwane et al., 2015). This strategy should be prioritized in the form of vehicle
restrictions, such as a car-free road, which is in agreement with the DEA (2014b) MPA
recommendation for modal shift from private passenger cars to public transport.
Furthermore, the inhabitants of these wards can afford energy efficient cars, which will
be driven more, hence emissions can still increase as energy efficiency is offset (Larson
et al., 2012; Muniz et al., 2013; Moriarty and Honnery, 2015). Furthermore, major
multinational companies have their headquarters in Umhlanga (Michel and Scott, 2005),
therefore these companies can provide incentives for employees to carpool and use
public transport. This will ensure greater use of public transport in the IRPTN,
especially as Umhlanga is one of the main corridors in the network.
Michel and Scott (2005) revealed that the majority of people that work in Umhlanga are
from the surrounding wards of Durban North, Verulam, KwaMashu and Phoenix, which
is about 30 minutes travel to work, and also inner Durban suburbs, such as Morningside,
Overport, Berea, Musgrave, Umbilo and CBD, and outer Durban suburbs, such as
Pinetown, which is about 30- 60 minutes travelling time to work. Therefore, the
employees are less affluent, since most of them do not live in Umhlanga because they
cannot afford to live near to where they work, thus commuters rely on public transport
or private passenger vehicles (Michel and Scott, 2005). Furthermore, with the
increasing attention on eco-mobility and social cohesiveness (Gota, 2015; Lah et al.,
2015), the IRPTN is vital in delivering these goals, as Umhlanga is characterised by
upmarket, gated residential estates (Scott et al., 2002).
Another pertinent issue is reducing electricity consumption from households in in
Umhlanga and Durban North. Currently there are plans for the further expansion of
commercial office spaces and upmarket residential developments. These EM needs to
limit the developments which are not green infrastructure and lack energy efficiency.
The EM also needs to encourage residences in these areas to install photovoltaic
installation on roofs, which is a municipal initiative (EM, 2015), especially as these
residents can afford this technology.

148
Furthermore, socio-economic transformation is required to move away from a luxurious
to a sustainable lifestyle, to reduce energy and waste emissions. This is especially
applicable to affluent neighbourhoods. The EM needs to place more emphasis,
encouragement and provide incentives for low carbon lifestyles, as within Durban
(demonstrated by the disparate distribution of emission emitting activities), SA, and
globally, there is increasing inequality and rising consumption of resources by the
affluent.
4.6 Synthesis and Conclusion
The EM does demonstrate climate change mitigation strategies, yet the majority of
developmental decisions planned for economic growth are from national government
through the NDP and SIPs, are in conflict with climate change strategies. This limits the
mitigation actions of the EM, even with development co-benefits, as the projects are
nationally mandated. Furthermore urban sprawl is both motivated for and against in the
municipal plans, due to the conflict between national, provincial, and local visions of
spatial development. Therefore, there is greater need for multi-level governance in
development, which also needs to include the implications for emissions mitigation, as
the incorrect developmental decisions and projects will have devastating implications
for future emissions.
The major emission zones are parallel to the coastline, which are south Durban, central
Durban, and north Durban. South Durban, has the majority of highest emitting wards
and are characterized by emissions from industry electricity use. The majority of
emissions from central Durban are due to road transport, specifically passenger cars and
the emission profile of north Durban reveals the significance of road transport emissions
from private passenger cars. The areas with the lowest emissions are under traditional
authority and former townships, especially to the west and north, and are highlighted for
regeneration and development as they have low levels of access to services and
economic opportunities. Furthermore, many households in Durban do not have access,
or have limited access to electricity; therefore other sources of energy are used, such as

149
candles, paraffin, firewood, and gas, which have carbon emissions, health and safety
implications in the form of outdoor and indoor air pollution, and fires. Therefore these
areas represent ideal opportunities to run pilot programmes for low carbon resilient
development and for government and the high emitting manufacturing companies to
invest in carbon, air pollution, and other environmental offsets, so that quality of life of
the inhabitants can be increased without the associated increase in emissions.
The specific mitigation measures recommended for south Durban were that the
manufacturing industries which use the most electricity and also the most intensive
(petrochemical and chemicals, paper, and transport equipment manufacturers) invest in
renewable energy projects, ecosystem rehabilitation, and food security in the rural
periphery and former townships, which are also the lowest emitting areas in the
municipal, thereby ensuring that the development of those areas are not associated with
increasing emissions. Furthermore, the EM should limit the expansion of industries
which do not have a low carbon development plan. Road transport emissions are the
focus of central and north Durban, specifically the reduction of cars and distance
travelled is recommended, as these areas have car ownership rates which are
comparable and even higher than developed nations. It is recommended that the
reduction of both mileages and vehicle be achieved by vehicle restrictions on roads,
which will also ensure the uptake of the IRPRN in Durban, which is currently under
construction, as well as other eco-mobility options.
Thus, with the integration of emission inventories, the suitable development based on
place (an area or region) or sector can be identified. The emission profiles generated
from emissions inventories can identify the strategies for the transition to a low carbon
city, with development co-benefits, and also assess the capacity of those responsible for
emissions to implement the change that is required. Moreover, the emissions profiles
can be presented to citizens, so that they can be actively involved in place-based
mitigation, as shown in Hillmer-Pegram et al. (2012).
However, a major barrier experienced was the lack of availability and access to data,
especially from industry. This limits the compilation of the emissions inventory.

150
Another barrier identified is the scepticism of new initiatives (Burch, 2010), and the
lack of mechanisms in place for interdepartmental collaboration and innovation, which
are vital for emissions inventory compilation and mitigation measures. This is due to
different municipal departments with their individual mandates and different goals, such
as the central way municipality generates income is through services such as electricity
provision. In the EM, electricity sales contributed the most, which is 37%, to
municipality revenue (EM IDP, 2015) thus it is a challenge for electricity department to
instruct consumers to use less electricity as it will impact on their revenue.
Emissions inventories can be used in EIA and Strategic Environmental Assessments
(SEAs) (Sookun et al., 2014), which requires simplified methodologies and analysis,
and also in the IDP, which is drawn up every five years and the IDP reviews, which are
published annually. EIA’s are applied at the project level therefore it is recommended to
move towards SEA, which assess and informs plans, policies and programmes at the
proposal early stage so that it can have an important influence on the proposed
development (Ahmed, 2008). Thus, the use of emission inventories, which can be
compiled annually, can be used in conjunction with the annual IDP review. This is vital
as the EM cannot afford to follow old development paths, especially with increasing
attention and responsibility on emissions reductions. Thus, the EM needs to show that it
is innovative and a leader in climate change actions by developing place-based
mitigation measures.

151
CHAPTER 5: CONCLUSION
5.1 Introduction
Cities are key sources of GHG emissions, and this is expected to increase as urban
development increases. Thus, cities have a key role to play in emissions reductions,
specifically cities in developing countries, as they will experience the most urban
growth, which represents an ideal opportunity for transitioning into a low carbon city.
The successful implementation of mitigation strategies requires alignment with the
development goals of local government. There are spatial variations in the distribution
of emission activities and sources. Thus, a spatially resolved emission inventory is vital
to identify the quantity of GHG emissions and the associated spatial distribution from
the various sectors in the city. This information will enable decision-makers to find the
high emission hotspots within the city, and develop specific place-based mitigation
strategies.
The aim of this study, which as motivated for in Chapter 1, was to identify the spatial
distribution of anthropogenic GHG emissions in Durban to identify high carbon
emission zones. Once the high emission zones are identified, strategies can be
introduced, based on emissions profiles, to ensure the spatial planning and development
of low emissions zones, to achieve the goal of a low carbon city. Thus, the information
from this study was used to assess the opportunity for using emissions inventory in
spatial planning for a low carbon city.
5.2 Summary of Study
A literature review, detailed in Chapter 2, was undertaken on the current state of
knowledge on the use of emissions inventories in spatial planning. The review identified
gaps such as the lack of emissions inventory methods for developing countries.
Furthermore, the use of emissions inventories in spatial planning is an emerging

152
concept, thus few studies were undertaken, of which the majority were from developed
nations and China. Moreover, many of the studies focused on a single sector, such as
households or road transport.
The first objective of this study was to develop a conceptual framework to attribute
GHG emissions. Based on the major emitting activity data identified from previous
studies, a conceptual framework was developed to spatially attribute emissions. A
method was developed, based on the ICLEI emission inventory principles, to account
for the spatial location of activity data and related emissions, as well as the South
African city context. The achievement of this objective was presented in Chapter 3.
The second objective of this study entailed the creation of GHG emissions inventories
for the energy, road transport, and waste sectors. The third objective of this study was to
explore the spatial distribution of emissions using GIS. Both of the objectives were
achieved in Chapter 4, where the emissions inventory results, and maps for sectoral and
total emissions, were presented. The spatially resolved emissions inventory, in
conjunction with the municipality’s spatial development plans, was used to identify
high emission areas and areas of priority development, as per objective 4, which was
also found in Chapter 4. South Durban, central Durban, and north Durban were
identified as the areas of high total and sectoral emissions, as well as the areas which are
the most developed areas in the city, and the areas highlighted for future development
and expansion. The fifth objective was to provide recommendations to reduce emissions
to facilitate the planning of a low carbon city. This was accomplished in Chapter 4,
where the emission profile of the high emitting areas presented the sectors which
contributed the most to emissions, thus recommendations were provided for targeted
emission reductions, specific to a place.
South Durban, which has the majority of highest emitting wards, is characterized by
industrial and heavy truck emissions. Furthermore, the most emission intense industries,
such as petrochemical, paper, and transport equipment manufacturing are concentrated
in this area. Therefore, it is recommended that industries work towards becoming more
energy efficient and also invest in renewable energy, and also reduce dependency on

153
heavy trucks to transport freight by switching to rail. However, this does not seem likely
as the EM development plans are geared towards increasing production of
petrochemicals and transport equipment manufacture, and increasing road freight due to
the development of the port and expansion of the pier. This is evident of the limited role
of the EM in development, as many of these plans are driven by provincial or national
government, thus highlighting the structural influence. Therefore, it was recommended
that the EM encourage these manufacturing industries use the opportunity to offset their
carbon emissions by investing in low carbon resilient development of areas in the
Durban which are the most deprived and also associated with the lowest emissions,
thereby fulfilling the goal of emissions reductions and developmental co-benefits.
The majority of emissions from central and north Durban were due to road transport,
specifically passenger cars. Thus, the IRPTN is vital in reducing passenger car
emissions by reducing the distance travelled and the need for cars, especially in the
CBD and Umhlanga, which are also the main corridors of the network. Furthermore,
development north of Durban is expected to increase, which will increase urban sprawl
and thus transport emissions. This is also further evident of the conflicting municipal
plans, which plan to limit urban sprawl but edge developments are driven by private
developers.
In summary, a three-pronged approach is recommended to simultaneously reduce
emissions and achieve development: (i) energy audits of already existing industrial and
commercial spaces in south, central, and north Durban must be mandatory to encourage
technological improvements and renewable energy and further development and
expansion should only be approved if they are energy efficient and low carbon, and do
not rely on road transport, (ii) the implementation of car-free roads in central and north
Durban to reduce distances travelled and the light passenger vehicle population, and
also to ensure the widespread use of the IRPTN and other eco-mobility options (iii)
areas with the most development needs, such as rural and former township areas, are the
lowest emitters, for example up to 11.9 times less than the Durban average, which is an
ideal opportunity for climate resilient development and for industries to offset their
emissions by investing in the low carbon development of these areas.

154
This study is the first attempt in the identification of locations that contribute the most
to emissions and their specific development needs, so that the most gains in emissions
reductions and development co-benefits can be achieved. The concept of sustainable
development, is by default, integrated, and is still viewed solely as an environmental
issue. Sustainable development is not practiced strongly in local developmental
decisions in the EM, and other local governments, both in South Africa and
internationally. Emissions inventories at the neighbourhood scale are vital in identifying
place-based mitigation opportunities. However, since municipalities lack strong
sustainability in local development projects, it does not give confidence to the
applicability of emissions inventory integration in local development. Therefore, what is
required is more research and innovation into the application and value of emissions
inventories in cities as planning and policy tools to facilitate low carbon development.
5.3 Recommendations for Future Research
This study quantified emissions from a spatial perspective to identify the place-based
contribution to GHG emissions, and thus responsibility for emissions mitigation.
However, this study will be further improved by more research and improved data
availability and collection in the future. Thus, the following additional research is
recommended to improve and apply the wide-scale use of emissions inventories:
Detailed sector specific studies, based on main sectors highlighted in this
research.
The road transport emissions and passenger car ownership rates can be used in
future studies; to compare the emissions profile and spatial distribution of the
current vehicle classes and fuel types to the status of the future vehicle
population after the IRPTN has been utilized.
In-depth place-based research to capture variations within wards.
Studies on the lifestyles of the affluent communities and their contribution to
emissions.
155
Building on this inventory and projecting GHG emissions in conjunction with
future development scenarios.
Although not extensive and inclusive, this research was the first attempt in identifying
the main local contributors to global emissions, so that place-based mitigation strategies
can be put in place to achieve the most emissions reductions, based on the specific
emission profile. Therefore, this work aims to contribute to the growing body of
research in emissions inventories and their application, as GHG emissions
considerations need to be integrated in local development.

156
CHAPTER 6: REFERENCES
Ahmed, F. 2008. Development pressures and management constraints in the coastal
zone- The case of KwaZulu-Natal North Coast. Alternation, 15 (1). 45-65.
Aldy, J.E. and Stavins, R.N. 2010. Introduction. In: Aldy, J. E. and Stavins, R. N. (eds.)
Post-Kyoto Climate Policy: Implementing Architectures for Agreement.
Cambridge: Cambridge University Press, 1-30.
Amekudzi, A.A., Ramaswami, A., Chan, E., Lam, K., Meng, W.H. and Zhu, D. 2011.
Contextualizing carbon reduction initiatives: How should carbon mitigation be
addressed by various cities worldwide? Carbon Management, 2 (4). 363-365.
Asdrubali, F., Presciutti, A. and Scrucca, F. 2013. Development of a greenhouse gas
accounting GIS-based tool to support local policy making- Application to an
Italian municipality. Energy Policy, 61. 587-594.
ASSAf 2011. Towards a low carbon city: Focus on Durban, Pretoria, South Africa,
Academy of Science of South Africa (ASSAf). 1-265. Available:
http://www.assaf.org.za/files/PDF/LCC.pdf [Accessed 20 January 2014].
Aylett, A. 2010. Conflict, collaboration and climate change: Participatory democracy
and urban environmental struggles in Durban, South Africa. International
Journal of Urban and Regional Research, 34 (3). 478-495.
Aylett, A. 2011. Changing perceptions of climate mitigation among competing
priorities: The case of Durban, South Africa, UN Habitat. 1-16.
Bader, N. and Bleischwitz, R. 2009. Measuring urban greenhouse gas emissions: The
challenge of comparability. Sapiens, 2 (3). 1-15.
Bai, X. 2007. Integrating global environmental concerns into urban management.
Journal of Industrial Ecology, 11 (2). 15-29.

157
Ballard, R., Bonnin, D., Robinson, J. and T., X. 2007. Development and new forms of
democracy in Durban. Critical Dialogue: Public Participation in Review, 3 (2).
3-10.
Bandivadekar, A.P. and Heywood, J.B. 2006. Co-ordinated policy measures for
reducing the fuel use of the US light-duty vehicle fleet. In: Sperling, D. and
Cannon, J. S. (eds.) Driving Climate Change: Cutting Carbon from
Transportation. Oxford, UK: Academic Press Elsevier, 41-72.
Bao, Z., Sun, S. and Sun, D. 2014. Characteristics of direct CO2 emissions in four full-
scale wastewater treatment plants. Desalination and Water Treatment, 54. 1070-
1079.
Barnett, J. and O'Neill, S. 2010. Maladaptation. Global Environmental Change, 20. 211-
213.
Barton, J.R., Issaias, I. and Stentiford, E.I. 2008. Carbon- Making the right choice for
waste management in developing countries. Waste Management, 28. 690-698.
Bastianoni, S., Pulselli, F.M. and Tiezzi, E. 2004. The problem of assigning
responsibility for greenhouse gas emissions. Ecological Economics, 49. 253-
257.
Baur, A.H., Lauf, S., Forster, M. and Kleinschmit, B. 2015. Estimating greenhouse gas
emissions of European cities - Modelling emissions with only one spatial and
one socioeconomic variable. Science of the Total Environment, 520. 49-58.
Bednar-Friedl, B., Schinko, T. and Steininger, K.W. 2012. The relevance of process
emissions for carbon leakage: A comparison of unilateral policy options with
and without border carbon adjustment. Energy Economics, 34. S168-S180.
Beg, N., Corfee Morlot, J., Davidson, O., Afrane-Okesse, Y., Tyani, L., Denton, F.,
Sokona, Y., Phillippe Thoms, J., Lebre La Rovere, E., Parikh, J.K., Parikh, K.
and Rahman, A.A. 2002. Linkages between climate change and sustainable
development. Climate Policy, 2 (2). 129-144.

158
Bellasio, R., Bianconi, R., Corda, G. and Cucca, P. 2007. Emission inventory for the
road transport sector in Sardinia (Italy). Atmospheric Environment, 41 (4). 677-
691.
Betts, R. 2007. Implications of land ecosystem-atmosphere interactions for strategies for
climate change adaptation and mitigation. Tellus Series B: Chemical and
Physical Meteorology, 7 (2). 203-214.
Bhattacharyya, S.C. and Timilsina, G.R. 2010. A review of energy system models.
International Journal of Energy Sector Management, 4 (4). 494-518.
Bi, J., R., Z., Wang, H., Liu, M. and Wu, Y. 2011. The benchmarks of carbon emissions
and policy implications for China's cities: Case of Nanjing. Energy Policy, 39.
4785-4794.
Biesbroek, G.R., Swart, R.J. and van der Knaap, W.G.M. 2009. The mitigation-
adaptation dichotomy and the role of spatial planning. Habitat International, 33.
230-237.
Bond, P. 2011. Dirty Durban's manual for climate greenwashing. Available:
http://www.durbanclimatejustice.org/articles/dirty-durban%E2%80%99s-
manual-for-climate-greenwashing.html [Accessed 19 May 2015].
Bond, P. 2014a. Infrastructure ‘fast-track’ may trip up government and corporations.
Daily Maverick, 21 January 2014. Available:
http://www.dailymaverick.co.za/opinionista/2014-01-21-infrastructure-fast-
track-may-trip-up-government-and-corporations/#.VhtsRuyqqko [Accessed 12
October 2015].
Bond, P. 2014b. Post-carbon, post-capitalist development in South Africa: Starting from
where the movements already are. 2014 ISS-GNU Annual Conference.
Gyeongsang National University, Jinju, South Korea. Available:
http://ccs.ukzn.ac.za/files/Bond-Jinju-paper-22-August-2014.pdf [Accessed 19
May 2015].

159
Breetzke, K. 2009. From conceptual frameworks to quantitative models: Spatial
planning in the Durban metropolitan area, South Africa- The link to housing
and infrastructure planning. Available: http://www.unhabitat.org/grhs/2009. 1-
22 [Accessed 11 August 2015].
Broekhof, S. and van Marwijk, R. The role of spatial information for planning
sustainable cities. Planning, Environment and Water Management, 6-10 May
2012 Rome, Italy. 1-12. Available:
https://www.fig.net/resources/proceedings/fig_proceedings/fig2012/papers/ts07g
/TS07G_broekhof_vanmarwijk_5985.pdf [Accessed 16 March 2014].
Brown, M. and Logan, E. 2008. The residential and carbon footprints of the 100 largest
US metropolitan areas. School of Public Policy Working Papers. Georgia
Institute of Technology. 1-78. Available http://hdl.handle.net/1853/22228
[Accessed 20 June 2014].
Bulkeley, H. 2006. A changing climate for spatial planning. Planning Theory and
Practice, 7 (2). 203-214.
Bulkeley, H. and Betsill, M. 2005. Rethinking sustainable cities: Multilevel governance
and the 'urban' politics of climate change. Environmental Politics, 14 (1). 42-63.
Bulkeley, H. and Betsill, M. 2013. Revisiting the urban politics of climate change.
Environmental Politics, 22 (1). 136-154.
Bumpus, A.G. and Liverman, D.M. 2008. Accumulation by decarbonisation and the
governance of carbon offsets. Economic Geography, 84 (2). 127-155.
Burch, S. 2010. In pursuit of resilient, low carbon communities: An examination of
barriers to action in three Canadian cities. Energy Policy, 38. 7575-7585.
Burgalassi, D. and Luzzati, T. 2015. Urban spatial structure and environmental
emissions: A survey of the literature and some empirical evidence for Italian
NUTS 3 regions. Cities, 49. 134-148.

160
Bushnell, J., Peterman, C. and Wolfram, C. 2008. Local solutions to global problems:
Climate change policies and regulatory jurisdiction. Review of Environmental
Economics and Policy, 2 (2). 175-193.
Cai, B. and Zhang, L. 2014. Urban CO2 emissions in China: Spatial boundary and
performance comparisons. Energy Policy, 66. 557-567.
Cam, W.C.N. 2013. Fostering interconnectivity dimension of low-carbon cities: The
triple bottom line re-interpretation. Habitat International, 37. 88-94.
Campbell, H. 2006. Is the issue of climate change too big for spatial planning? Planning
Theory and Practice, 7 (2). 201-230.
Cansino, J.M., Roman, R. and Rueda-Cantuche, J.M. 2015. Will China comply with its
2020 carbon intensity commitment? Environmental Science and Policy, 47. 108-
117.
Carney, S. and Shackley, S. 2009. The greenhouse gas regional inventory project
(GRIP): Designing and employing a regional greenhouse gas measurement tool
for stakeholder use. Energy Policy, 37. 4293-4302.
Carsjens, G., J. and Ligtenberg, A. 2007. A GIS-based support tool for sustainable
spatial planning in metropolitan areas. Landscape and Urban Planning, 80. 72-
83.
Chapman, L. 2007. Transport and climate change: A review. Journal of Transport
Geography, 15. 354-367.
Chen, F. and Zhu, D. 2013. Theoretical research on low-carbon city and empirical study
of Shanghai. Habitat International, 37. 33-42.
Christen, A. 2014. Atmospheric measurement techniques to quantify greenhouse gas
emissions from cities. Urban Climate. 1-20.
161
Chuai, L., Lai, L., Huang, X., Zhao, R., Wang, W. and Chen, Z. 2012. Temporospatial
changes of carbon footprint based on energy consumption in China. Journal of
Geographical Sciences, 22 (1). 110-124.
Climate Council. 2013. The difference between installed capacity (MW) and energy
generation (MWh). Available: https://www.climatecouncil.org.au/the-difference-
between-installed-capacity-mw-and-energy-generation-mwh [Accessed 2
October 2015].
Cole, B. 2011. Jubilation after landfill site is shut. Daily News, 16 November 2011.
Available: http://www.iol.co.za/dailynews/news/jubilation-after-landfill-site-is-
shut-1.1179442#.Vh_oD_mqqkp [Accessed 13 October 2015].
Cole, M.A., Elliott, R.J.R., Okubo, T. and Zhou, Y. 2013. The carbon dioxide emissions
of firms: A spatial analysis. Journal of Environmental Economics and
Management, 65. 290-309.
Couth, R. and Trois, C. 2010. Carbon emissions reduction strategies in Africa from
improved waste management: A review. Waste Management, 30. 2336-2346.
Crawford, J. and French, W. 2008. A low carbon future: Spatial planning's role in
enhancing technological innovation in the built environment. Energy Policy, 36.
4575-4579.
D'Avignon, A., Carloni, F.A., La Rovere, E.L. and Dubeux, C.B.S. 2010. Emission
inventory: An urban public instrument and benchmark. Energy Policy, 38. 4838-
4847.
Dalvi, M., Beig, G., Patil, U., Kaginalkar, A., Sharma, C. and Mitra, A.P. 2006. A GIS
based methodology for gridding of large-scale emission inventories: Application
to carbon monoxide emissions over Indian region. Atmospheric Environment,
40. 2995-3007.
Davidson, G., Theobald, k. and Walker, S. 2011. Community energy solutions:
Involving residents in developing low-carbon urban neighbourhoods. Built and
Natural Environment Research Papers, 4 (2). 149-286.
162
de Roo, G. 2000. Environmental conflicts in compact cities: Complexity, decision-
making, and policy approaches. Environment and Planning, 27. 151-162.
DEA 2011a. Introducing the South African Air Quality Information System (SAAQIS)
Phase II- An emissions inventory module, presented by the Atmospheric Quality
Information Unit- Joint Implementation with the South African Weather Service
(SAWS). 6th Annual Air Quality Lekgotla, 12 October 2011, East London,
South Africa. Available: http://www.saaqis.org.za/Downloads.aspx?type=AQ
[Accessed 20 March 2014].
DEA 2011b. National Climate Change Response White Paper, Pretoria, Republic of
South Africa. 1-56. Available:
http://www.gov.za/sites/www.gov.za/files/national_climatechange_response_wh
itepaper_0.pdf [Accessed 24 January 2014].
DEA 2011c. South Africa's National Communication under the United Nations
Framework Convention on Climate Change, Pretoria, Republic of South Africa.
1-288. Available: http://unfccc.int/resource/docs/natc/zafnc02.pdf [Accessed 14
July 2015].
DEA 2013. Rejection of the Final Environmental Impact Assessment Report for the
proposed deepening, lengthening, and widening of Berths 203 to 205 at Pier 2,
Container Terminal, Port of Durban, KwaZulu-Natal Province. Pretoria,
Republic of South Africa.
DEA 2014a. National Environmental Management: Air Quality Act, 2004 (Act No. 39
of 2004) Notice 172 of 2014: Declaration of greenhouse gases as air pollutants,
Department of Environmental Affairs, Pretoria, Republic of South Africa. 1-4.
Available:
https://www.environment.gov.za/sites/default/files/gazetted_notices/nemaqa_gre
engasdeclaration_airpolutants_g37421gn172.pdf [Accessed 20 February 2014].
DEA 2014b. South Africa's Greenhouse Gas (GHG) Mitigation Potential Analysis,
Department of Environmental Affairs, Pretoria, Republic of South Africa. 1-152.
Available:

163
https://www.environment.gov.za/sites/default/files/docs/mitigationreport.pdf
[Accessed 14 July 2015].
DEA 2015. Discussion Document: South Africa's Intended Nationally Determined
Contribution (INDC): 1 August 2015, Department of Environmental Affairs,
Pretoria, Republic of South Africa. 1-14. Available:
https://www.environment.gov.za/sites/default/files/docs/sanational_determinedc
ontribution.pdf [Accessed 1 November 2015].
DEFRA 2010. Low emission strategies: Using the planning system to reduce transport
emissions, United Kingdom. 1-35. Available:
http://www.lowemissionstrategies.org/downloads/LES_Good_Practice_Guide_2
010.pdf [Accessed 24 January 2014].
den Elzen, M.G.J., Hof, A.F. and Roelfsema, M. 2013. Analysing the greenhouse gas
emission reductions of the mitigation plans by non-Annex I countries by 2020.
Energy Policy, 56. 633-643.
Devarajan, S., Go, D.S., Robinson, S. and Thierfelder, K. 2009. Policy Research
Working Paper 4933: Tax policy to reduce carbon emissions in South Africa,
The World Bank. 1-36.
Dhakal, S. 2009. Urban energy use and carbon emissions from cities in China and
policy implications. Energy Policy, 37. 4208-4219.
Dhakal, S. 2010. GHG emissions from urbanization and opportunities for urban carbon
mitigation. Current Opinion in Environmental Sustainability, 2. 277-283.
Dhar, S., Pathak, M. and Shukla, P.R. 2013. Promoting low carbon transport in India,
New Delhi, Magnum Custom Publishing. 1-88.
Dittmar, M. 2013. The end of cheap uranium. Science of the Total Environment, 461-
462. 792-798.
Dodman, D. 2009a. Blaming cities for climate change? An analysis of urban greenhouse
gas emissions inventories. Environment and Urbanization, 21. 185-201.

164
Dodman, D. 2009b. Paper 1: Urban density and climate change, United Nations
Population Fund (UNFPA). 1-23. Available:
http://www.uncclearn.org/sites/default/files/inventory/unfpa14.pdf [Accessed 20
March 2014].
DoE 2012. A survey of energy-related behaviour and perceptions in South Africa: The
residential sector, Department of Energy, Pretoria, Republic of South Africa. 1-
118. Available: http://www.energy.gov.za/files/media/Pub/DoE-2013-Survey-
of-EnergyRelated-Behaviour-and-Perception-in-SA.pdf [Accessed 20 February
2015].
Dulal, H.B. and Akbar, S. 2013. Greenhouse gas emission reduction options for cities:
Finding the "Coincidence of Agendas" between local priorities and climate
change mitigation objectives. Habitat International, 38. 100-105.
Dulal, H.B., Brodnig, G. and Onoriose, C.G. 2011. Climate change mitigation in the
transport sector through urban planning: A review. Habitat International, 35.
494-500.
Dymen, C. 2014. Engendering spatial planning: A gender perspective on municipal
climate change response. Doctoral thesis in Planning and Decision Analysis,
Kth Royal Institute of Technology. Available:
http://www.nordregio.se/en/System/News/Gender-and-communicative-
planning-towards-climate-change-response/ [Accessed 20 June 2014].
EM. 2015. Durban Solar Map. Available: http://www.durbansolarmap.co.za/viewer/
[Accessed 18 October 2015].
EM Economic Review. 2012. Economic Review for the eThekwini Municipal Region
2010/11. Available:
http://www.durban.gov.za/City_Services/Economic_Development/PSIR/Docum
ents/Draft3%20eThekwini%20Economic%20Review%2025Sept2012.pdf
[Accessed 1 September 2014].

165
EM Electricity. 2014. eThekwini electricity annual report 2013-2014. Available:
http://www.durban.gov.za/City_Services/electricity/About%20Us/Documents/2
013_14AnnualReport.pdf [Accessed 6 August 2014].
EM Energy Office. 2012. eThekwini GHG Inventory 2012. Available:
http://www.durban.gov.za/City_Services/energyoffice/Documents/eThekwini_G
HG_Inventory_2012_SummaryReport_Final.pdf [Accessed 9 March 2014].
EM IDP 2015. eThekwini Municipality: 2015/16 IDP. Available:
http://www.durban.gov.za/City_Government/City_Vision/IDP/Documents/Final
%20Adopted%20IDP%2027May2015.pdf [Accessed 14 August 2015].
EM SDF 2014. Spatial Development Framework (SDF) report: 2014/15 review.
Available:
http://www.durban.gov.za/Resource_Centre/reports/Framework_Planning/Docu-
ments/SDF_Full_Report_2014_2015_May_2014.pdf [Accessed 14 August
2015].
eNATIS. 2014. Vehicle population statistics. Available:
http://www.enatis.com/index.php/statistics/13-live-vehicle-population [Accessed
30 July 2014].
Eskom 2012. Electricity generation options considered by Eskom. Energy Planning
Colloquium, 30 March 2012. Available:
http://www.energy.gov.za/files/IEP/presentations/ElectricityGenerationOptions
Considered_30March2012.pdf [Accessed 14 July 2014].
Eskom 2014. Integrated Report 2014. Available:
http://integratedreport.eskom.co.za/index2014.php [Accessed 14 July 2014].
Ezcurra, R. 2007. Is there cross-country convergence in carbon dioxide emissions?
Energy Policy, 35. 1363-1372.
Faling, W., Tempelhoff, J.W.N. and van Niekerk, D. 2012. Rhetoric or action: Are
South African municipalities planning for climate change? Development
Southern Africa, 29 (2). 241-257.

166
Fang, C., Wang, S. and Li, G. 2015. Changing urban forms and carbon dioxide
emissions in China: a case study of 30 provincial capital cities. Applied Energy,
158. 519-531.
Feng, C., Gao, X., Wu, J., Tang, Y., He, J., Qi, Y. and Zhang, Y. 2015. Greenhouse gas
emissions investigation for towns in China: a case study of Xiaolan. Journal of
Cleaner Production, 103. 130-139.
Feng, K., Hubacek, K., Sun, L. and Liu, Z. 2014. Consumption-based CO2 accounting
of China's megacities: The case of Beijing, Tianjin, Shanghai and Chongqing.
Ecological Indicators, 47. 26-31.
Ferreira, J., Guevara, M., Baldasano, J.M., Tchepel, O., Schaap, M., Miranda, A.I. and
Borrego, C. 2013. A comparative analysis of two spatially resolved European
atmospheric emission inventories. Atmospheric Environment, 75. 43-57.
Friedrich, E. and Trois, C. 2010. Greenhouse gases accounting and reporting for waste
management- A South African perspective. Waste Management, 30. 2347-2353.
Friedrich, E. and Trois, C. 2011. Quantification of greenhouse gas emissions from waste
management for municipalities- A comparative review focusing on Africa.
Waste Management, 31. 1585-1596.
Friedrich, E. and Trois, C. 2013. GHG emission factors developed for the collection,
transport and landfilling of municipal waste in South African municipalities.
Waste Management, 33. 1013-1026.
Friedrich, E. and Trois, C. 2015. Current and future greenhouse gas (GHG) emissions
from the management of municipal solid waste in the eThekwini Municipality-
South Africa. Journal of Cleaner Production. Article in Press. 1-13.
Fuglestvedt, J.S., Shine, K.P., Berntsen, T., Cook, J., Lee, D.S., Stenke, A., Skeie, R.B.,
Velders, G.J.M. and Waitz, I.A. 2010. Transport impacts on atmosphere and
climate: Metrics. Atmospheric Environment, 44. 4648-4677.

167
Gaffney, J.S. and Marley, N.A. 2009. The impacts of combustion emissions on air
quality and climate- From coal to biofuels and beyond. Atmospheric
Environment, 43. 23-36.
Gaigné, C., Riou, S. and Thisse, J.-F. 2012. Are compact cities environmentally
friendly? Journal of Urban Economics, 72. 123-136.
Gallivan, F., Grant, M. and Davies, J. 2008. Improving the transportation component of
state greenhouse gas inventories. Available:
http://www3.epa.gov/ttnchie1/conference/ei17/session5/davies.pdf [Accessed 5
October 2015].
Galvin, M. 2012. The tap runs for all in Durban. The Mercury, 12 June 2012. Available:
http://www.iol.co.za/mercury/the-tap-runs-for-all-in-durban-
1.1317414#.VZQBbPmqqko [Accessed 6 September 2015].
Garibaldi, J.A., Winkler, H., Lebre La Rovere, E., Cadena, A., Palma, R., Sanhueza,
J.E., Tyler, E. and Gunfaus Torres, M. 2014. Comparative analysis of five case
studies: Commonalities and differences in approaches to mitigation actions in
five developing countries. Climate and Development, 6 (1). 59-70.
Geels, F.W. 2014. Regime resistance against low-carbon transitions: Introducing
politics and power into the multi-level perspective. Theory, Culture and Society,
0 (0). 1-20.
Geng, Y., Peng, C. and Tian, M. 2011. Energy use and CO2 emissions inventories in the
four municipalities of China. Energy Procedia, 5. 370-376.
GHG Protocol 2013. Required greenhouse gases in inventories- Accounting and
reporting standard amendment: February 2013. Available:
http://www.ghgprotocol.org/files/ghgp/NF3-Amendment_052213.pdf [Accessed
1 July 2015].
Gioli, B., Gualteri, G., Busillo, C., Calastrini, F., Zaldei, A. and Toscano, P. 2015.
Improving high resolution emission inventories with local proxies and urban
eddy covariance flux measurements. Atmospheric Environment, 115. 246-256.

168
Girod, B., van Vuuren, D.P. and Hertwich, E.G. 2014. Climate policy through changing
consumption choices: Options and obstacles for reducing greenhouse gas
emissions. Global Environmental Change, 25. 5-15.
Glaeser, E.L. and Kahn, M.E. 2010. The greenness of cities: Carbon dioxide emissions
and urban development. Journal of Urban Economics, 67. 404-418.
Gomes, J., Nascimnto, J. and Rodrigues, H. 2008. Estimating local greenhouse gas
emissions- A case study on a Portuguese municipality. International Journal of
Greenhouse Gas Control, 2. 130-135.
Gota, S. 2015. A call to action on green freight in cities, ICLEI Local Governments for
Sustainability Available: http://www.ecomobilityfestival.org/wp-
content/uploads/2015/10/EcoMobility_Call-to-action-on-greent-freight-in-
cities_1-Oct-2015.pdf [Accessed 13 November 2015].
Graham, L.A., Belisle, S.L. and Rieger, P. 2009. Nitrous oxide emissions from light
duty vehicles. Atmospheric Environment, 43. 2031-2044.
Grazi, F. and van den Bergh, J.C.J.M. 2008. Spatial organization, transport, and climate
change: Comparing instruments of spatial planning and policy. Ecological
Economics, 67. 630-639.
Gregg, J.S., Losey, L.M., Andres, R.J., Blasing, T.J. and Marland, G. 2009. The
temporal and spatial distribution of carbon dioxide emissions from fossil-fuel
use in North America. Journal of Applied Meteorology and Climatology, 48.
2528-2542.
Guo, H., Cai, Y. and Zhu, Z. 2015. Study on low-carbon city planning strategies based
on urban greenhouse gas inventory. Journal of Landscape Research, 7 (4). 20-
24.
Gupta, J. 2007. The multi-level governance challenge of climate change. Environmental
Sciences, 4 (3). 131-137.

169
Hallegatte, S., Henriet, F. and Corfee Morlot, J. 2011. The economics of climate change
impacts and policy benefits at city scale: A conceptual framework. Climatic
Change, 104. 51-87.
Hamin, E.M. and Gurran, N. 2009. Urban form and climate change: Balancing
adaptation and mitigation in the U.S and Australia. Habitat International, 33.
238-245.
Hannan, S. and Sutherland, C. 2014. Mega-projects and sustainability in Durban, South
Africa: Convergent or divergent agendas? Habitat International, 45 (3). 205-
212.
Harris, P.G., Chow, A.S.Y. and Symons, J. 2012. Greenhouse gas emissions from cities
and regions: International implications revealed by Hong Kong. Energy Policy,
44. 416-424.
Heinonen, J. and Junnila, S. 2011. Implications of urban structure on carbon
consumption in metropolitan areas. Environmental Research Letters, 6. 1-9.
Hillman, T. and Ramaswami, A. 2010. Greenhouse gas emission footprints and energy
use benchmarks for eight U.S cities. Environmental Science and Technology, 44
(6). 1902-1910.
Hillmer-Pegram, K.C., Howe, P.D., Greenberg, H. and Yarnal, B. 2012. A geographic
approach to facilitating local climate governance: From emission inventories to
mitigation planning. Applied Geography, 34. 76-85.
Ho, C.S. and Fong, W.K. Planning for Low Carbon Cities: The case of Iskandar
Development Region, Malaysia. Toward Establishing Sustainable Planning and
Governance II Conference, 29-30 November 2007 2007 Seoul, Korea.
Available:
http://eprints.utm.my/6475/1/HCSiong_FWKean2007_PlanningForLowCarbon
Cities.pdf [Accessed 20 October 2014].

170
Ho, C.S., Matsuoka, Y., Simson, J. and Gomi, K. 2013. Low carbon urban development
strategy in Malaysia- The case of Iskandar Malaysia development corridor.
Habitat International, 37. 43-51.
Höhne, N., Ellerman, C. and Fekete, H. 2014. Process guidance for Intended Nationally
Determined Contributions (INDCs). Available:
http://mitigationpartnership.net/sites/default/files/ipmm_2014_process_guidance
_for_intended_nationally_determined_contributions_indcs.pdf [Accessed 15
August 2015].
Holgate, C. 2007. Factors and actors in climate change mitigation: A tale of two South
African cities. Local Environment: The International Journal of Justice and
Sustainability, 12 (5). 471-484.
Hoornweg, D., Sugar, L. and Trejos Gomez, C.L. 2011. Cities and greenhouse gas
emissions: Moving forward. Environment and Urbanization, 23 (1). 207-227.
Hsu, A., Reuben, A., Shindell, D., de Sherbini, A. and Levy, M. 2013. Toward the next
generation of air quality monitoring indicators. Atmospheric Environment, 80.
561-570.
Huang, B. and Meng, L. 2013. Convergence of per capita carbon dioxide emissions in
urban China: A spatio-temporal perspective. Applied Geography, 40. 21-29.
Huang, Y., Xia, B. and Yang, L. 2013. Relationship study on land use spatial
distribution structure and energy-related carbon emission intensity in different
land use types in Guangdong, China, 1996-2008. The Scientific World Journal,
2013. 1-15.
Hughes, B.B. and Johnston, P.D. 2005. Sustainable futures: Policies for global
development. Futures, 37 (8). 813-831.
Huisingh, D., Zhang, Z., Moore, J.C., Qiao, Q. and Li, Q. 2015. Recent advances in
carbon emissions reduction: Policies, technologies, monitoring, assessment and
modelling. Journal of Cleaner Production, 103. 1-12.

171
Hutson, T. 2014. Berth-deepening is in the dock. The Mercury, 22 January 2014.
Ibrahim, N., Sugar, L., Hoornweg, D. and Kennedy, C. 2012. Greenhouse gas emissions
from cities: comparison of international inventory frameworks. Local
Environment: The International Journal of Justice and Sustainability, 17 (2).
223-241.
ICLEI 2010. Local Government Operations Protocol- for the quantification and
reporting of greenhouse gas emissions inventories, Version 1.1, California,
USA. Available:
http://www.arb.ca.gov/cc/protocols/localgov/pubs/lgo_protocol_v1_1_2010-05-
03.pdf [Accessed 17 May 2014].
ICLEI 2014. The global protocol for community-scale greenhouse gas emissions
inventories (GPC). Available: http://www.iclei.org/our-activities/our-
agendas/low-carbon-city/gpc.html [Accessed 17 May 2014].
IDA 2014. Act No. 23 of 2014: Infrastructure Development Act, 2014, Cape Town.
Available: http://www.gov.za/documents/infrastructure-development-act
[Accessed 14 October 2015].
IEA 2007. Tracking industrial energy efficiency and CO2 emissions, International
Energy Agency (IEA), Paris, France. 1-324. Available:
https://www.iea.org/publications/freepublications/publication/tracking_emission
s.pdf [Accessed 20 July 2015].
Imagine Durban. 2010. Ensuring an environmentally sustainable city. Available:
http://www.imaginedurban.org/Pages/sustainability.aspx [Accessed 6 July
2015].
Inglesi-Lotz, R. and Blignaut, J. 2011. South Africa's electricity consumption: A
sectoral decomposition analysis. Applied Energy, 88 (12). 4779-4784.
IPCC. 2006. Guidelines for national greenhouse gas inventories. Available: www.ipcc-
nggip.iges.or.jp [Accessed 11 March 2013].

172
IPCC 2013. Climate Change 2013: The Physical Science Basis. Contribution of
Working Group I to the Fifth Assessment Report of the Intergovernmental Panel
on Climate Change, Cambridge, United Kingdom and New York, NY, USA. 1-
1535. Available: http://www.ipcc.ch/report/ar5/wg1/ [Accessed 15 January
2015].
ISWA 2009. Waste and climate change. International Solid Waste Association White
Paper. Available:
https://www.iswa.org/fileadmin/user_upload/_temp_/WEB_ISWA_White_paper
.pdf [Accessed 5 March 2014].
Jabareen, Y. 2015. City planning deficiencies and climate change- The situation in
developed and developing cities. Geoforum, 63. 40-43.
Jones, C. and Kammen, D.M. 2014. Spatial distribution of U.S household carbon
footprints reveals suburbanization undermines greenhouse gas benefits of urban
population density. Environmental Science and Technology, 48. 895-902.
Kamalan, H., Sabour, M. and Shariatmadari, N. 2011. A review of available landfill gas
models. Journal of Environmental Science and Technology, 4. 72-92.
Kates, R., W., Mayfield, M.W., Torrie, R.D. and Witcher, B. 1998. Methods for
estimating greenhouse gases from local places. Local Environment: The
International Journal of Justice and Sustainability, 3 (3). 279-297.
Kellett, R., Christen, A., Coops, N.C., van der Laan, M., Crawford, B., Rory Tooke, T.
and Olchovski, I. 2013. A systems approach to carbon cycling and emissions
modelling at an urban neighbourhood scale. Landscape and Urban Planning,
110. 48-58.
Kennedy, C., Demoullin, S. and Mohareb, E. 2012. Cities reducing their greenhouse gas
emissions. Energy Policy, 49. 774-777.
Kennedy, C., Steinberger, J., Gasson, B., Hansen, Y., Hillman, T., Havranek, M.,
Pataki, D., Phdungsilp, A., Ramaswami, A. and Villalba Mendez, G. 2009.

173
Greenhouse gas emissions from global cities. Environmental Science and
Technology, 43 (19). 7297-7302.
Kennedy, C., Steinberger, J., Gasson, B., Hansen, Y., Hillman, T., Havranek, M.,
Pataki, D., Phdungsilp, A., Ramaswami, A. and Villalba Mendez, G. 2010.
Methodology for inventorying greenhouse gas emissions from global cities.
Energy Policy, 38. 4828-4837.
Kennedy, S. and Sgouridis, S. 2011. Rigorous classification and carbon accounting
principles for low and Zero Carbon Cities. Energy Policy, 39. 5259-5268.
Knuth, S.E. 2010. Addressing place in climate change mitigation: Reducing emissions
in a suburban landscape. Applied Geography, 30. 518-531.
Kocabas, A. 2013. The transition to low carbon urbanization in Turkey: Emerging
policies and initial action. Habitat International, 37. 80-87.
Konstantinaviciute, I. and Bobinaite, V. 2015. Comparative analysis of carbon dioxide
emission factors for energy industries in European Union countries. Renewable
and Sustainable Energy Reviews, 51. 603-612.
Kuzyk, L.W. 2012. The ecological footprint housing component: A geographic
information system analysis Ecological Indicators, 16. 31-39.
La Greca, P., Barbarossa, L., Ignaccolo, M., Inturri, G. and Martinico, F. 2011. The
density dilemma. A proposal for introducing smart growth principles in a
sprawling settlement within Catania Metropolitan Area. Cities, 28. 527-535.
Lah, O., Shrestha, S. and Hüging, H. 2015. Transferring sustainable transport and
ecomobility solutions, EcoMobility World Festival 2015, ICLEI Local
Governments for Sustainability. Available:
http://www.ecomobilityfestival.org/wp-
content/uploads/2015/10/EcoMobility_Transferring-Sustainable-Transport-and-
EcoMobility-Solutions_1-Oct-2015.pdf [Accessed 15 October 2015].

174
Larsen, H.N. and Hertwich, E.G. 2009. The case for consumption-based consumption
accounting of greenhouse gas emissions to promote local climate action.
Environmental Science and Policy, 12. 791-798.
Larson, W., Liu, F. and Yezer, A. 2012. Energy footprint of the city: Effects of urban
land use and transportation policies. Journal of Urban Economics, 72. 147-159.
Lau, L.C., Lee, K.T. and Mohamed, A.R. 2012. Global warming mitigation and
renewable energy policy development from the Kyoto Protocol to the
Copenhagen accord. Renewable and Sustainable Energy Reviews, 16. 5280-
5284.
Lazarus, M., Chandler, C. and Erickson, P. 2013. A core framework and scenario for
deep GHG reductions at the city scale. Energy Policy, 57. 563-574.
Lebel, L., Garden, P., Banaticla, M.R.N., Lasco, R.D., Contreras, A., Mitra, A.P.,
Sharma, C., Nguyen, H.T., Ooi, G.L. and Sari, A. 2007. Integrating carbon
management into the development strategies of urbanizing regions in Asia.
Journal of Industrial Ecology, 11 (2). 61-81.
Lehmann, S. 2013. Low-to-no carbon city: Lessons from western urban projects for the
rapid transformation of Shanghai. Habitat International, 37. 61-69.
Lemon, M., Pollitt, M. and Steer, S. 2015. Local energy policy and managing low
carbon transition: The case of Leicester, UK. Energy Strategy Reviews, 6. 57-63.
Leonard, L. 2012. Another political ecology of civil society reflexiveness against urban
industrial risks for environmental justice: The case of the Bisasar landfill,
Durban, South Africa. Singapore Journal of Tropical Geography, 33. 77-92.
Lesiv, M., Bun, A. and Jonas, M. 2014. Analysis of change in relative uncertainty in
GHG emissions from stationary sources for the EU 15. Climatic Change, 124
(3). 505-518.
Levin, K., Rich, D., Bonduki, Y., Comstock, M., Tirpak, D., McGray, H., Noble, I.,
Modelgaard, K. and Waskow, D. 2015. Designing and preparing Intended

175
Nationally Determined Contributions (INDCs), Washington, USA, World
Resources Institute. Available: http://www.wri.org/sites/default/files/designing-
preparing-indcs-report.pdf [Accessed 15 August 2015].
Levitt, R. 2006. Planning for climate change: Reality time? Planning Theory and
Practice, 7 (2). 214-218.
Lin, J., Jacoby, J., Cui, S., Liu, Y. and Lin, T. 2014. A model for developing a target
integrated low carbon city indicator system: The case of Xiamen, China.
Ecological Indicators, 40. 51-57.
Liu, L.-C., Liang, Q.-M. and Wang, Q. 2014a. Accounting for China's regional carbon
emissions in 2002 and 2007: production-based versus consumption-based
principles. Journal of Cleaner Production, 103. 384-392.
Liu, L.-Q., Liu, C.-X. and Sun, Z.-Y. 2011. A survey of China's low-carbon application
practice- Opportunity goes with challenge. Renewable and Sustainable Energy
Reviews, 15. 2895-2903.
Liu, W., Tian, J. and Chen, L. 2014b. Greenhouse gas emissions in China's eco-
industrial parks: A case study of the Beijing Economic Technological
Development Area. Journal of Cleaner Production, 66. 384-391.
Liu, Y., Song, Y. and Song, X. 2014c. An empirical study on the relationship between
urban compactness and CO2 efficiency in China. Habitat International, 41. 92-
98.
Loveland, S.J. 2012. Spatial aspects of greenhouse gas emissions from transport
demands by households in Trondheim. Master in Industrial Ecology, Norwegian
University of Science and Technology, 1-77. Available:
http://brage.bibsys.no/xmlui/handle/11250/242286 [Accessed 14 July 2014].
Lu, X.-D. 2014. Assessment of achievements of the Lima Climate Change Conference
and perspectives on the future. Advances in Climate Change Research, 5. 219-
223.

176
Maharaj, A. 2013. Economic development position paper on the port expansion,
eThekwini Municipality Economic Development and Investment Promotion
Unit. 1-35. Available:
http://www.durban.gov.za/Resource_Centre/edge/Documents/Port%20Expansio
n%20Research%20Paper%20(Feb%202013).pdf [Accessed 20 March 2015].
Makido, Y., Dhakal, S. and Yamagata, Y. 2012. Relationship between urban form and
CO2 emissions: evidence from fifty Japanese cities. Urban Climate, 2. 55-67.
Manfredi, S., Tonini, D. and Christensen, T.H. 2009. Landfilling of waste: accounting
of greenhouse gases and global warming contributions. Waste Management and
Research, 27. 825-836.
Merven, B., Cohen, B., Hughes, A. and Stone, A. 2013. Guidelines for the selection of
Long-Range Energy Systems modelling platforms to support the MAPS
processes: Part 1, Cape Town, South Africa. 1-14. Available:
http://www.mapsprogramme.org/wp-content/uploads/Model-Selection_Part-
1_Final.pdf [Accessed 13 July 2015].
Merven, B., Stone, A., Hughes, A. and Cohen, B. 2012. Quantifying the energy needs of
the transport sector for South Africa: A bottom-up model, South African
National Energy Development Institute and University of Cape Town Energy
Research Centre. 1-78. Available:
http://www.erc.uct.ac.za/Research/publications/12-Merven-
etal_Quantifying_energy_needs_transport%20sector.pdf [Accessed 20 March
2014].
Michel, D.P. and Scott, D. 2005. The La Lucia- Umhlanga Ridge as an emerging "Edge
City". South African Geographical Journal, 87 (2). 104-114.
Mills, G. 2014. Urban climatology: History, status, and prospects. Urban Climate, 10
(3). 479-489.

177
Minx, J., Baiocchi, G., Wiedmann, T., J., B., Creutzig, F., Feng, K., Forster, M., Pichler,
P., Weisz, H. and Hubacek, K. 2013. Carbon footprint of cities and other human
settlements in the UK. Environmental Research Letters, 8. 1-10.
Minx, J., Creutzig, F., Medinger, V., Ziegler, T., Owen, A. and Baiocchi, G. 2010.
Developing a pragmatic approach to assess urban metabolism in Europe: A
report to the European Environment Agency, Berlin, Germany, Stockholm
Environment Institute and Technische Universitat Berlin. 1-82. Available:
http://ideas.climatecon.tu-berlin.de/documents/wpaper/CLIMATECON-2011-
01.pdf [Accessed 15 July 2014].
Moghaddam, F.R., Moghaddam, F.F. and Cheriet, M. 2013. A modified GHG intensity
indicator: Toward a sustainable global economy based on a carbon border tax
and emissions trading. Energy Policy, 57. 363-380.
Mohareb, E., MacLean, H.L. and Kennedy, C.A. 2011. Greenhouse gas emissions from
waste management- assessment of quantification methods. Journal of Air and
Waste Management Association, 61 (5). 480-493.
Moodley, L., Winn, R. and Parkin, J. 2011. Buffer zones: The long term interface.
Available: http://www.landfillconservancies.com/moodley-et-al-lig-2011-08-01-
lm.pdf [Accessed 11 August 2015].
Moolla, Z. 2010. Greenhouse gas emissions and energy scenarios for Durban: The
implications of urban development on future energy demand and emissions.
Master of Science, University of Kwa-Zulu Natal, 1-149. Available:
http://researchspace.ukzn.ac.za/xmlui/handle/10413/5422 [Accessed 24 January
2014].
Moriarty, P. and Honnery, D. 2015. Future cities in a warming world. Futures, 66. 45-
53.
Mottiar, S. 2014. Protest and participation in Durban: A focus on Cato Manor,
Merebank and Wentworth. Politikon: South African Journal of Political Studies,
41 (3). 371-385.

178
Moutinho, V., Robaina-Alves, M. and Mota, J. 2014. Carbon dioxide emissions
intensity of Portuguese industry and energy sectors: A convergence analysis and
econometric approach. Renewable and Sustainable Energy Reviews, 40. 438-
449.
Msimanga, B. and Sebitosi, A.B. 2014. South Africa's non-policy options for renewable
energy development. Renewable Energy, 69. 420-427.
Muniz, I., Calatayud, D. and Dobano, R. 2013. The compensation hypothesis in
Barcelona measured through the ecological footprint of mobility and housing.
Landscape and Urban Planning, 113. 113-119.
Muñoz, P. and Steininger, K.W. 2010. Austria's CO2 responsibility and carbon content
if it’s international trade. Ecological Economics, 69. 2003-2019.
Nakicenovic, N., Davidson, O., Davis, G., Grübler, A., Kram, T., Lebre La Rovere, E.,
Metz, B., Morita, T., Pepper, W., Pitcher, H., Sankovski, A., Shukla, P., Swart,
R., Watson, R. and Zhou, D. 2000. Special Report on Emissions Scenarios,
Cambridge, England, Intergovernmental Panel on Climate Change. 1-570.
Available: https://www.ipcc.ch/pdf/special-reports/spm/sres-en.pdf [Accessed
12 July 2015].
National Business Initiative. 2013. South Africa's Grid Emission Factor. Available:
http://www.nbi.org.za/Lists/Publications/Attachments/302/South%20Africa's%2
0Grid%20Emission%20Factor%20Mar-13.pdf [Accessed 29 June 2014].
National Planning Commission 2012. National Development Plan 2030: Our Future-
Make it Work, Pretoria, South Africa., National Planning Commission of South
Africa. Available:
http://www.poa.gov.za/news/Documents/NPC%20National%20Development%2
0Plan%20Vision%202030%20-lo-res.pdf [Access 14 March 2015].
National Treasury 2014. Carbon offsets paper, Pretoria, South Africa. 1-50. Avilable:
http://www.treasury.gov.za/public%20comments/CarbonOffsets/2014042901%2
0-%20Carbon%20Offsets%20Paper.pdf [Accessed 15 July 2015].

179
Nejat, P., Jomehzadeh, F., Thaheri, M.M., Gohari, M. and Majid, M.Z.A. 2015. A
global review of energy consumption, CO2 emissions and policy in the
residential sector (with an overview of the top ten CO2 emitting countries).
Renewable and Sustainable Energy Reviews, 43. 843-862.
Nel, V. 2011. Land-use management system as a tool towards achieving low-carbon
cities in South Africa. Town and Regional Planning, 58. 1-5.
Nomico, M. and Sanders, P. 2003. Dichotomies of urban change in Durban. Urban
Design International, 8 (4). 207-222.
Nurick, R. and Johnson, V. 1998. Towards community based indicators for monitoring
quality of life and the impact of industry in south Durban. Environment and
Urbanization, 10 (1). 233-250.
Oreskes, N., Shrade-Frechette, K. and Belitz, K. 1994. Verification, validation and
confirmation of numerical models in the earth sciences. Science, 263. 641-646.
Ou, J., Liu, X., Li, X. and Chen, Y. 2013. Quantifying the relationship between urban
forms and carbon emissions using panel data analysis. Landscape Ecology, 28.
1889-1907.
Paauw, C. 2014. Not any simpler: Key concepts for air pollution offsetting. Clean Air
Journal, 24 (1). 7-9.
Paloheimo, E. and Salmi, O. 2013. Evaluating the carbon emissions of the low carbon
city: A novel approach for consumer based allocation. Cities, 30. 233-239.
Parkin, J., Strachan, L., Bowers, A., Wright, M. and Winn, R. 2006. Extreme landfill
engineering: developing and managing South Africa's busiest and largest
landfill facilities. Available:
http://www.landfillconservancies.com/docs/parkin_et_al_extreme_landfill_engi
neering_paper_wastecon_2006.pdf [Accessed 11 August 2015].
Parshall, L., Gurney, K., Hammer, S.A., Mendoza, D., Zhou, Y. and Geethakumar, S.
2009. Modelling energy consumption and CO2 emissions at the urban scale:
180
Methodological challenges and insights from the United States. Energy Policy,
38 (9). 4765-4782.
Payne, G.J. 2005. Buffelsdraai landfill: A new regional landfill for the eThekwini
Council. Available:
http://www.landfillconservancies.com/docs/gjp_lig_paper_sept_2005.pdf
[Accessed 11 August 2015].
Peters, G.P. and Hertwich, E.G. 2008. Post-Kyoto greenhouse gas inventories:
Production versus consumption. Climatic Change, 86. 51-66.
PICC 2012. Presidential Infrastructure Coordinating Commission Report 2012- A
summary of the South African National Infrastructure Plan, Pretoria. Available:
http://www.gov.za/sites/www.gov.za/files/PICC_Final.pdf, 1-50
Plassmann, K., Norton, A., Attarzadeh, N., Jensen, M.P., Brenton, P. and Edwards-
Jones, G. 2010. Methodological complexities of product carbon footprinting: A
sensitivity analysis of key variables in a developing country context.
Environmental Science and Policy, 13. 393-404.
Price, L., Zhou, N., Fridley, D., Ohshita, S., Lu, H., Zheng, N. and Fino-Chen, C. 2013.
Development of a low carbon indicator system for China. Habitat International,
37. 4-21.
Puppim de Oliveira, J.A. 2009. The implementation of climate change related policies
at the subnational level: An analysis of three countries. Habitat International,
33. 253-259.
Qin, B. and Han, S.S. 2013. Planning parameters and household carbon emission:
Evidence from high- and low-carbon neighbourhoods in Beijing. Habitat
International, 37. 52-60.
Qin, B. and Wu, J. 2014. Does urban concentration mitigate CO2 emissions? Evidence
from China 1998-2008. China Economic Review, 35. 220-231.

181
Qin, Y. and Xie, S.D. 2011. Estimation of county-level black carbon emissions and its
spatial distribution in China in 2000. Atmospheric Environment, 45. 6995-7004.
Ramachandra, T.V., Aithal, B.H. and Sreejith, K. 2015. GHG footprint of major cities
in India. Renewable and Sustainable Energy Reviews, 44. 473-495.
Ramanathan, V. and Feng, Y. 2009. Air pollution, greenhouse gases and climate
change: Global and regional perspectives. Atmospheric Environment, 43. 37-50.
Ramaswami, A. and Chavez, A. 2013. What metrics best reflect the energy and carbon
intensity of cities? Insights from theory and modelling of 20 US cities.
Environmental Research Letters, 8. 1-11.
Ramaswami, A., Hillman, T., Janson, B., Reiner, M. and Thomas, G. 2008. A demand-
centred, hybrid life-cycle methodology for city-scale greenhouse gas inventories.
Environmental Science and Technology, 42 (17). 6455-6461.
Ramsay, L.F. and Naidoo, R. 2012. Carbon footprints, industrial transparency and
community engagement in a South Durban neighbourhood. South African
Geographical Journal, 94 (2). 174-190.
Ramseur, J.L. 2007. Voluntary carbon offsets: overview and assessment, Congress
Research Service. Available:
http://fpc.state.gov/documents/organization/96418.pdf [Accessed 2 October
2015].
Raubenheimer, S. 2011. Facing climate change: Building South Africa's strategy, Cape
Town, South Africa, Unity Press.
Raux, C. and Lee-Gosselin, M. 2010. Transport, energy and greenhouse gases:
perspectives on demand limitation. Energy Efficiency, 3. 111-113.
Reckien, D., Ewald, M., Edenhofer, O. and Ludeke, M.K.B. 2007. What parameters
influence the spatial variations in CO2 emissions from road traffic in Berlin?
Urban Studies, 44 (2). 339-355.

182
Revi, A., Satterthwaite, D.E., Aragorn-Durand, F., Corfee-Morlot, J., Kiunsi, R.B.R.,
Pelling, M., Roberts, D.C. and Solecki, W. 2014. Contribution of Working
Group II to the Fifth Assessment Report of the Intergovernmental Panel on
Climate Change. In: Field, C. B., Barros, V. R., Dokken, D. J., Mach, K. J.,
Mastrandrea, M. D., Bilar, T. E., Chatterjee, M., Ebi, K. L., Estrada, Y. O.,
Genova, R. C., Girma, B., Kissel, E. S., Levy, A. N., MacCracken, S.,
Mastrandrea, P. R. and White, L. L. (eds.) Climate Change 2014: Impacts,
Adaptation, Vulnerability. Part A: Global and Sectoral Aspects. Cambridge,
United Kingdom and New York, NY, USA: Cambridge University Press, 535-
612. Available: https://ipcc-wg2.gov/AR5/report/ [Access 15 July 2015].
Roberts, D. 2008. Thinking globally, acting locally- Institutionalizing climate change at
the local government level in Durban, South Africa. Environment and
Urbanization, 20 (2). 521-537.
Roberts, D. 2013. Cities OPT in while nations COP out: Reflections on COP18. South
African Journal of Science, 109 (5/6). 1-3.
Roberts, D. and O'Donoghue, S. 2013. Urban environmental challenges and climate
change action in Durban, South Africa. Environment and Urbanization, 25 (2).
299-319.
Robinson, J., Bradley, M., Busby, P., Connor, D., Murray, A. and Sampson, B. 2006.
Climate change and sustainable development: Realizing the opportunity. Ambio,
35 (1). 2-8.
Robinson, P. 2006. Canadian municipal response to climate change: Measurable
progress and persistent challenges for planners. Planning Theory and Practice, 7
(2). 218-223.
Rode, P., Floater, G., Thomopoulos, N., Doherty, J., Schwinger, P., Mahendra, A.,
Fang, W., Friedel, B., Gomes, A., Heeckt, C. and Slavcheva, R. 2014.
Accessibility in cities: Transport and urban form, London School of Economics
and Political Science. 1-61. Available:

183
http://2014.newclimateeconomy.report/wp-content/uploads/2014/11/Transport-
and-urban-form.pdf. [Accessed 15 July 2015].
Rogerson, C.M. 2013. Reframing local economic development futures in South Africa.
Journal of Public Administration, 48 (4). 640-655.
Roman, M. 2011. Carbon capture and storage in developing nations: A comparison of
Brazil, South Africa and India. Global Environmental Change, 21. 391-401.
Romero-Lankao, P. and Dodman, D. 2011. Cities in transition: transforming urban
centres from hotbeds of GHG emissions and vulnerability to seedbeds of
sustainability and resilience. Current Opinion in Environmental Sustainability,
3. 113-120.
Ruwanza, S. and Shackleton, C.M. 2015. Incorporation of environmental issues in
South Africa's municipal Integrated Development Plans. International Journal
of Sustainable Development and World Ecology. 1-13.
Rypdal, K. and Flugsrud, K. 2001. Sensitivity analysis as a tool for systematic
reductions in greenhouse gas inventory uncertainties. Environmental Science
and Policy, 4. 117-135.
Rypdal, K. and Winiwarter, W. 2001. Uncertainties in greenhouse gas emission
inventories- evaluation, comparability and implications. Environmental Science
and Policy, 4. 107-116.
SAPIA 2008. Petrol and diesel in South Africa and the impact on air quality, South
African Petroleum Industry Association. Available:
www.sapia.co.za/_literature_86491/Petrol_and_Diesel_in_South_Africa_and_th
e_impact_on_air_quality,_November_2008 [Accessed 15 September 2014].
SAPREF. 2013. Sustainability Report 2013- A report to our stakeholders. Available:
http://www.sapref.co.za/Media/Default/Page/SAPREF%20FINAL%20WEB.pdf
[Accessed 2 October 2015].

184
Satterthwaite, D. 2008. Cities' contribution to global warming: Notes on the allocation
of greenhouse gas emissions. Environment and Urbanization, 20. 539-549.
Satterthwaite, D. 2009. The implications of population growth and urbanization for
climate change. Environment and Urbanization, 21. 545-576.
Satterthwaite, D. 2010. The contribution of cities to global warming and their potential
contributions to solutions. Environment and Urbanization, 1 (1). 1-12.
Satterthwaite, D. 2014. Getting local governments, residents and enterprises to respond
to the new IPCC assessment. Environment and Urbanization, 26 (3). 3-10.
Scott, D. and Barnett, C. 2009. Something in the air: Civic science and contentious
environmental politics in post-Apartheid South Africa. Geoforum, 40 (3). 373-
382.
Scott, D., Oelefse, C. and Guy, C. 2002. Double trouble: Environmental injustice in
South Durban. Agenda: Empowering women for gender equity, 17 (52). 50-57.
SDCEA 2014. Comments in the Transnet Environmental Impact Assessment of Berths
203-205. Durban. Available:
http://www.sdcea.co.za/images/stories/pdfs/positionpaper4a.pdf [Accessed 16
June 2015].
Seto, K.C., Dhakal, S., Bigio, A., Blanco, H., Delgado, G.C., Dewar, D., Huang, L.,
Inaba, A., Kansal, A., Lwasa, S., McMahon, J.E., Müller, D.B., Murakami, J.,
Nagendra, H. and Ramaswami, A. 2014. Human Settlements, Infrastructure and
Spatial Planning, Cambridge, United Kingdom and New York, NY, USA,
Intergovernmental Panel on Climate Change. 923-1000.
Seymore, R., Inglesi-Lotz, R. and Blignaut, J. 2014. A greenhouse gas emissions
inventory for South Africa: A comparative analysis. Renewable and Sustainable
Energy Reviews, 34. 371-379.
Shaker, R.R. 2015. The spatial distribution of development in Europe and its underlying
sustainability correlations. Applied Geography, 63. 304-314.

185
Shen, L.-Y., Ochoa, J.J., Shah, M.N. and Zhang, X. 2011. The application of urban
sustainability indicators - A comparison between various practices. Habitat
International, 35. 17-29.
Shi, X. and Meier, H. 2012. Carbon emission assessment to support planning and
operation of low-carbon production systems. Procedia CIRP, 3. 329-334.
Shrestha, E., Ahmad, S., Johnson, W. and J.R., B. 2012. The carbon footprint of water
management policy options. Energy Policy, 42. 201-212.
Simon, D. and Leck, H. 2015. Understanding climate adaptation and transformation
challenges in African cities. Current Opinion in Environmental Sustainability,
13. 109-116.
Singer, A.M., Branham, M., Hutchins, M.G., Welker, J., Woodard, D.L., Badurek, C.A.,
Ruseva, T., Marland, E. and Marland, G. 2014. The role of CO2 emissions from
large point sources in emissions totals, responsibility, and policy. Environmental
Science and Policy, 44. 190-200.
Singh, S. and Kennedy, C. 2015. Estimating future energy use and CO2 emissions of the
world's cities Environmental Pollution, (203). 271-278.
Smith, A., Guastella, L.A., Bundy, S.C. and Haigh, I.D. 2013. KwaZulu-Natal coastal
erosion events of 2006/2007 and 2011: A predictive tool? South African Journal
of Science, 109 (3/4). 1-4.
Sookun, A., Boojhawon, R. and Rughooputh, S.D.D.V. 2014. Assessing greenhouse gas
and related air pollutant emissions from road traffic counts: A case study for
Mauritius. Transportation Research Part D, 32. 35-47.
Sovacool, B.K. and Brown, M.A. 2010. Twelve metropolitan carbon footprints: A
preliminary comparative global assessment. Energy Policy, 38. 4856-4869.
Sowman, M. and Brown, A.L. 2006. Mainstreaming environmental sustainability into
South Africa's integrated development planning process. Journal of
Environmental Planning and Management, 49 (5). 695-712.

186
Sperling, D. and Cannon, J.S. 2006. Introduction and overview. In: Sperling, D. and
Cannon, J. S. (eds.) Driving Climate Change: Cutting Carbon from
Transportation. 1st ed. Oxford, UK: Academic Press Elsevier, 1-7.
Sperling, J.B. and Ramaswami, A. 2013. Exploring health outcomes as a motivator for
low-carbon development: Implications for infrastructure interventions in Asian
cities. Habitat International, 37. 113-123.
StatsSA. 2013. Superweb Census 2011. Statistics South Africa. Available:
http://interactive.statssa.gov.za/superweb/login.do [Accessed 12 April 2014].
StatsSA. 2014. Statistical Release P0441: Gross domestic product annual estimates
2004- 2013, Regional estimates 2004- 2013, Third quarter 2014. Pretoria, South
Africa: Statistics South Africa. Available:
http://beta2.statssa.gov.za/publications/P0441/P04413rdQuarter2014.pdf
[Accessed 29 June 2015].
Stern, D.I. and Jotzo, F. 2010. How ambitious are China and India's emissions intensity
targets? Energy Policy, 38 (11). 6776-6783.
Stern, N. 2008. The economics of climate change. American Economic Review, 98 (2).
1-37.
Stone, A.C. Creating a national database of traffic based vehicle emissions factors and
vehicle parc data: Lessons from the South Durban Basin. National Association
of Clean Air, 20 May 2004, Western Cape.
Stone, B., Hess, J.J. and Frumkin, H. 2010. Urban form and extreme heat events: Are
sprawling cities more vulnerable to climate change than compact cities?
Environmental Health Perspectives, 118 (10). 1425-1428.
Stone, B., Vargo, J. and Habeeb, D. 2012. Managing climate change in cities: Will
climate action plans work? Landscape and Urban Planning, 107. 263-271.
Streets, D.G., Bond, T.C., Carmichael, G.R., Fernandes, S.D., Fu, Q., He, D., Klimont,
Z., Nelson, S.M., Tsai, N.Y., Wang, M.Q., Woo, J.H. and K.F., Y. 2003. An

187
inventory of gaseous and primary aerosol emissions in Asia in the year 2000.
Journal of Geophysical Research, 108. 1-23.
Su, B., Huang, H.C., Ang, B.W. and Zhou, P. 2010. Input-output analysis of CO2
emissions embodied in trade: The effects of sector aggregation. Energy
Economics, 32 (1). 166-175.
Su, M., Liang, C., Chen, B., Chen, S. and Yang, Z. 2012. Low-carbon development
patterns: Observations of typical Chinese cities. Energies, 5. 291-304.
Su, Y., Chen, X., Li, Y., Liao, J., Ye, Y., Zhang, H., Huang, N. and Kuang, Y. 2014.
China's 19-year city-level carbon emissions of energy consumptions, driving
forces and regionalized mitigation guidelines. Renewable and Sustainable
Energy Reviews, 35. 231-243.
Sutherland, C., Robbins, G., Scott, D. and Sim, V. 2013. Durban City Report,
Chance2Sustain. 1-90
Tanoto, Y. and Handoyo, E.A. 2014. Sustainable long-term electricity supply-demand:
Bottom-up models review and overview of the proposed framework. Journal of
Engineering and Applied Sciences, 9 (9). 1490-1494.
Taylor, A., Cartwright, A. and Sutherland, C. 2014. Institutional pathways for local
climate adaptation: a comparison of three South African municipalities, France,
Agence Francaise de Development. 1-142
Thambiran, T. and Diab, R.D. 2011a. Air pollution and climate change co-benefit
opportunities in the road transportation sector in Durban, South Africa.
Atmospheric Environment, 45. 2683-2689.
Thambiran, T. and Diab, R.D. 2011b. Air quality and climate change co-benefits for the
industrial sector in Durban, South Africa. Energy Policy, 39. 6658-6666.
The Planning Initiative 2014. eThekwini Municipality industrial land study and land
strategy development- Industrial land strategy 1G-10205. 1-79

188
The Presidency 2013. Spatial Planning and Land Use Management Act No. 16 of 2013.
Cape Town, Republic of South Africa. Available:
http://www.gov.za/documents/spatial-planning-and-land-use-management-
white-paper [Accessed 20 March 2014].
Tongwane, M., Piketh, S., Stevens, L. and Ramotubei, T. 2015. Greenhouse gas
emissions from road transport in South Africa and Lesotho between 2000 and
2009. Transportation Research Part D, 37. 1-13.
Tsilingiridis, G., Zachariadis, T. and Samaras, Z. 2002. Spatial and temporal
characteristics of air pollutant emissions in Thessaloniki, Greece: Investigation
of emission abatement measures. The Science of the Total Environment, 300. 99-
113.
Tuia, D., Osses de Eicker, M., Zah, R., Osses, M., Zarate, E. and Clappier, A. 2007.
Evaluation of a simplified top-down model for the spatial assessment of hot
traffic emissions in mid-sized cities. Atmospheric Environment, 41. 3658-3671.
Turok, I. 2012. Urbanisation and development in South Africa: Economic imperatives,
spatial distortions and strategic responses, London, United Nations Population
Fund. Available: http://pubs.iied.org/10621IIED.html [Accessed 14 July 2015].
UN 2014. World Urbanization Prospects- Highlights, New York, United Nations.
Available: http://esa.un.org/unpd/wup/Highlights/WUP2014-Highlights.pdf
[Accessed 12 July 2015].
UNFCCC. 2014. United Nations Framework Convention on Climate Change- About.
Available: http://unfccc.int/2860.php [Accessed 30 September 2015].
Vaccari, F.P., Gioli, B., Toscano, P. and Perrone, C. 2013. Carbon dioxide balance
assessment of the city of Florence (Italy) and implications for urban planning.
Landscape and Urban Planning, 120. 138-146.
van Aardenne, J. and Pulles, T. 2002. Uncertainty in emission inventories: What do we
mean and how could we assess it? Available:

189
http://www3.epa.gov/ttnchie1/conference/ei11/qa/pulles.pdf [Accessed 15 July
2014].
VandeWeghe, J. and Kennedy, C. 2007. A spatial analysis of residential greenhouse gas
emissions in the Toronto census metropolitan area. Journal of Industrial
Ecology, 11 (2). 133-144.
Vecchiatto, P. 2014. Warning over infrastructure bill's targets. Business Day Live, 20
January 2014. Available: http://www.bdlive.co.za/national/2014/01/20/warning-
over-infrastructure-bills-targets [Accessed 6 October 2015].
Velasco, E., Perrusquia, R., Jimenez, E., Hernandez, F., Camacho, P., Rodriguez, S.,
Retama, A. and Molina, L.T. 2014. Sources and sinks of carbon dioxide in a
neighbourhood of Mexico City. Atmospheric Environment, 97. 226-238.
Velychko, O. and Gordiyenko, T. 2009. The use of guide to the expression of
uncertainty in measurement for uncertainty management in National Greenhouse
Gas Inventories. International Journal of Greenhouse Gas Control, 3. 514-517.
Villalba, G. and Gemechu, E.D. 2011. Estimating GHG emissions of marine ports- the
case of Barcelona. Energy Policy, 39. 1363-1368.
Wackermagel, M., Kitzes, J., Moran, D., Goldfinger, S. and Thomas, M. 2006. The
ecological footprint of cities and regions: comparing resource availability with
resource demand. Environment and Urbanization, 18 (1). 103-112.
Walsh, C.L., Roberts, D., Dawson, R.J., Hall, J.W., Nickson, A. and Hounsome, R.
2013. Experiences of integrated assessment of climate impacts, adaptation and
mitigation modelling in London and Durban. Environment and Urbanization, 52
(2). 361-380.
Wang, H., Wang, Y., Wang, H., Liu, M., Zhang, Y., Zhang, R., Yang, J. and Bi, J.
2014a. Mitigating greenhouse gas emissions from China's cities: case study of
Suzhou. Energy Policy, 68. 482-489.

190
Wang, H., Zhang, R., Liu, M. and Bi, J. 2012. The carbon emissions of Chinese cities.
Atmospheric Chemistry and Physics, 12. 6197-6206.
Wang, H., Zhang, Y., Lu, X., Nielsen, C.P. and Bi, J. 2015. Understanding China's
carbon dioxide emissions from both production and consumption perspectives.
Renewable and Sustainable Energy Reviews, 52. 189-200.
Wang, Q., M'Ikiugu, M.M. and Kinoshita, I. 2014b. A GIS-based approach in support
of spatial planning for renewable energy: A case study of Fukushima, Japan.
Sustainability, 6. 2087-2117.
Wang, Z. 2011. Strategic path of China's low-carbon technology development. Procedia
Environmental Sciences, 8. 90-96.
Wattenbach, M., Redweik, R., Lüdtke, S., Kuster, B., Ross, L., Barker, A. and Nagel, C.
2015. Uncertainties in city greenhouse gas inventories. Energy Procedia, 76.
388-397.
Weinzettel, J., Hertwich, E.G., Peters, G.P., Steen-Olsen, K. and Galli, A. 2013.
Affluence drives the global displacement of land use. Global Environmental
Change, 23 (2). 433-438.
Weisz, H. and Steinberger, J.K. 2010. Reducing energy and material flows in cities.
Current Opinion in Environmental Sustainability, 2. 182-192.
Wende, W., Huelsmann, W., Marty, M., Penn-Bressel, G. and Bobylev, N. 2010.
Climate protection and compact urban structures in spatial planning and local
construction plans in Germany. Land Use Policy, 27. 864-868.
Wheeler, S.M. 2008. State and municipal climate change plans: The first generation.
Journal of American Planning Association, 74 (4). 481-496.
Wiedmann, T. and Minx, J. 2008. A definition of 'Carbon Footprint'. In: Pertsova, C. C.
(ed.) Ecological Economics Research Trends. Hauppauge NY, USA: Nova
Science Publishers, 1-11.

191
Wilbanks, T.J., Kates, R., W., Angel, D.P., Cutter, S.L., Easterling, W.E. and Mayfield,
M.W. 2003. The research strategy: linking the local to the global. In:
Geographers, T. A. o. A. (ed.) Global Change and Local Places: Estimating,
Understanding, and Reducing Greenhouse Gases. 1st ed. Cambridge:
Cambridge University Press, 27-56.
Williams, J. 2012. Regulative, facilitative and strategic contributions of planning to
achieving low carbon development. Planning Theory and Practice, 13 (1). 131-
145.
Wilson, E. 2006. Adapting to climate change at the local level: The spatial planning
response. Local Environment: The International Journal of Justice and
Sustainability, 11 (6). 609-625.
Winiwarter, W. and Schimak, G. 2005. Environmental software systems for emissions
inventories. Environmental Modelling and Software, 20. 1469-1477.
Winkler, H. 2009. Changing development paths: from an energy-intensive to low-
carbon economy in South Africa. Climate and Development, 1 (1). 47-65.
Winkler, H. 2014. Emerging lessons on designing and implementing mitigation actions
in five developing countries. Climate and Development. 1-3.
Winkler, H., Hughes, A., Marquard, A., Haw, M. and Merven, B. 2011. South Africa's
greenhouse gas emissions under business-as-usual: The technical basis of
'Growth without Constraints' in the Long-Term Mitigation Scenarios. Energy
Policy, 39. 5818-5828.
World Bank 2010. World development report 2010- Development and Climate Change
Washington, DC., USA, The International Bank for Reconstruction and
Development/ The World Bank. 1-439. Available:
http://siteresources.worldbank.org/INTWDR2010/Resources/5287678-
1226014527953/WDR10-Full-Text.pdf [Accessed 10 July 2015].
192
World Bank 2012. Little Green Data Book. Available:
http://data.worldbank.org/products/data-books/little-data-book/little-green-data-
book [Accessed 14 March 2014].
WRI. 2014. Global protocol for community-scale greenhouse gas emissions inventories.
Available: http://ghgprotocol.org/files/ghgp/GHGP_GPC.pdf [Accessed 14 June
2014].
Xi, F., Geng, Y., Chen, X., Zhang, Y., Wang, X., Xue, B., Dong, H., Liu, Z., Ren, W.,
Fujita, T. and Zhu, Q. 2011. Contributing to local policy making on GHG
emission reduction through inventorying and attribution: A case study of
Shenyang, China. Energy Policy, 39. 5999-6010.
Yang, L. and Yanan, L. 2013. Low-carbon city in China. Sustainable Cities and Society,
9. 62-66.
Yu, W., Pagani, R. and Huang, L. 2012. CO2 emission inventories for Chinese cities in
highly urbanized areas compared with European cities. Energy Policy, 47. 298-
308.
Zahran, S., Brody, S.D., Vedlitz, A., Grover, H. and Miller, C. 2008. Vulnerability and
capacity: Explaining local commitment to climate change policy. Environment
and Planning C, 26. 544-562.
Zhang, N., Qin, Y. and Xie, S.D. 2013. Spatial distribution of black carbon emissions in
China. Chinese Science Bulletin, 58 (31). 3830-3839.
Zhang, Y., Wang, H., Liang, S., Xu, M., Liu, W., Li, S., Zhang, R., Nielsen, C.P. and
Bi, J. 2014. Temporal and spatial variations in consumption-based carbon
dioxide emissions in China. Renewable and Sustainable Energy Reviews, 40. 60-
68.
Zhao, R., Huang, X., Zhong, T. and Peng, J. 2011. Carbon footprint of different
industrial spaces based on energy consumption in China. Journal of
Geographical Sciences, 21 (2). 185-300.

193
Zhao, R.Q. and Huang, X.J. 2010. Carbon emission and carbon footprint of different
land use types based on energy consumption. Geographical Research, 29 (9).
1639-1649.
Zhao, Y., Zhang, Z., Wang, S., Zhang, Y. and Liu, Y. 2015. Linkage analysis of sectoral
CO2 emissions based on the hypothetical extraction method in South Africa.
Journal of Cleaner Production, 103. 916-924.
Zheng, B., Zhang, Q., Kleefeld-Borken, J., Huo, H., Guan, D., Klimont, Z., Peters, G.P.
and He, K. 2015. How will greenhouse gas emissions from motor vehicles be
constrained in China around 2030? Applied Energy, 156. 230-240.
Zhou, N., He, G., Williams, C. and Fridley, D. 2014. ELITE cities: A low-carbon eco-
city evaluation tool for China. Ecological Indicators, 48. 448-456.

I
APPENDIX A– INFORMATION AND EQUATION FOR
THE CALCULATION OF LANDFILL EMISSIONS
Average annual rainfall and CH4 generation rate constant (k) value
Average Rainfall (Inches/Year)
<20 20-40 >40
k = 0.02 k = 0.038 k = 0.057
ICLEI Equation 9.1 Landfills with Comprehensive LFG Collection Systems
𝐶𝐻4 𝑒𝑚𝑖𝑡𝑡𝑒𝑑 (𝑡𝐶𝑂2𝑒)
= 𝐿𝐹𝐺 𝑐𝑜𝑙𝑙𝑒𝑐𝑡𝑒𝑑 × 𝐶𝐻4% × {(1 − 𝐷𝐸) + [((1 − 𝐶𝐸) ÷ 𝐶𝐸) × (1
− 𝑂𝑋)]} × 𝑢𝑛𝑖𝑡 𝑐𝑜𝑛𝑣𝑒𝑟𝑠𝑖𝑜𝑛 × 𝐺𝑊𝑃
Where,
LFG collected = Annual LFG collected by the collection system, in million standard
cubic feet (MMSCF)
CH4% = Amount of CH4 in LFG (percentage)
DE = CH4 Destruction efficiency of (percentage)
CE = Collection efficiency (percentage)
OX = Oxidation factor (percentage)
Unit conversion = used to convert MMSCF into tonnes
GWP = Global warming potential of CH4

II
APPENDIX B- EQUATIONS FOR THE CALCULATION
OF EMISSIONS FROM WASTEWATER TREATMENT
ICLEI Equation 10.2 Stationary CH4 from Incomplete Combustion of Digester Gas
𝐴𝑛𝑛𝑢𝑎𝑙 𝐶𝐻4 𝑒𝑚𝑖𝑠𝑠𝑖𝑜𝑛𝑠 (𝑡𝐶𝑂2𝑒)
= 𝑃 × 𝐷𝑖𝑔𝑒𝑠𝑡𝑒𝑟 𝑔𝑎𝑠 × 𝐹𝐶𝐻4 × 𝜌(𝐶𝐻4) × (1 − 𝐷𝐸) × 0.0283
× 365.25 × 10−6) × 𝐺𝑊𝑃
Where,
P = Population served by the WWTP with anaerobic digesters
Digester gas = Cubic feet of digester gas produced per person per day (default value = 1
ft3/ person/ day)
FCH4 = Fraction of CH4 in biogas (default value = 65%)
DE = CH4 Destruction efficiency (default value = 99%)
GWP = Global warming potential of CH4.
ICLEI Equation 10.4 Process CH4 from Wastewater Treatment Lagoons
𝐴𝑛𝑛𝑢𝑎𝑙 𝐶𝐻4 𝑒𝑚𝑖𝑠𝑠𝑖𝑜𝑛𝑠 (𝑡𝐶𝑂2𝑒)
= ((𝑃 × 𝐹𝑖𝑛𝑑 −𝑐𝑜𝑚) × 𝐵𝑂𝐷5 𝑙𝑜𝑎𝑑 × (1 − 𝐹𝑝) × 𝐵𝑜
× 𝑀𝐶𝐹𝑎𝑛𝑎𝑒𝑟𝑜𝑏𝑖𝑐 × 365.25 × 10⁻³) × 𝐺𝑊𝑃
Where,
P = Population served by the lagoons
Find- com = Factor for industrial and commercial co-discharge (default value = 1.25)
BOD5 load = Amount of BOD5 produced per person per day (default value = 0.09
kgBOD5/ person/ day)
Fp = Fraction of BOD5 removed in primary treatment (default value = 32.5%)

III
Bo = Maximum CH4 producing capacity for domestic wastewater (default value = 0.6
kgCH4/ kgBOD5 removed)
MCFanaerobic = CH4 correction factor for anaerobic systems (default value= 0.8)
GWP = Global warming potential of CH4.
ICLEI Equation 10.7 Process Emissions from WWTP with Nitrification/
Denitrification
𝐴𝑛𝑛𝑢𝑎𝑙 𝑁2𝑂 𝑒𝑚𝑖𝑠𝑠𝑖𝑜𝑛𝑠 (𝑡𝐶𝑂2𝑒)
= ((𝑃𝑡𝑜𝑡𝑎𝑙 × 𝐸𝐹𝑖𝑛𝑑−𝑐𝑜𝑚) × 𝐸𝐹 𝑛𝑖𝑡 𝑜𝑟 𝑑𝑒𝑛𝑖𝑡 × 10−6) × 𝐺𝑊𝑃
Where,
Ptotal = Total population served by the WWTP
Find-com = Factor for industrial and commercial co-discharge (default value = 1.25)
EF = Emission factor for the WWTP with nitrification or denitrification (default value =
7g N2O/ person/ year)
GWP = Global warming potential of N2O.
ICLEI Equation 10.8 Process Emissions from WWTP without Nitrification/
Denitrification
𝐴𝑛𝑛𝑢𝑎𝑙 𝑁2𝑂 𝑒𝑚𝑖𝑠𝑠𝑖𝑜𝑛𝑠 (𝑡𝐶𝑂2𝑒)
= ((𝑃𝑡𝑜𝑡𝑎𝑙 × 𝐸𝐹𝑖𝑛𝑑−𝑐𝑜𝑚) × 𝐸𝐹 𝑤𝑖𝑡ℎ𝑜𝑢𝑡 𝑛𝑖𝑡 𝑜𝑟 𝑑𝑒𝑛𝑖𝑡 × 10−6)
× 𝐺𝑊𝑃
Where,
Ptotal = Total population served by the WWTP
Find-com = Factor for industrial and commercial co-discharge (default value = 1.25)

IV
EF = Emission factor for the WWTP without nitrification or denitrification (default
value = 3.2g N2O/ person/ year)
GWP = Global warming potential of N2O.
ICLEI Equation 10.10 Process N2O Emissions from Effluent Discharge
𝐴𝑛𝑛𝑢𝑎𝑙 𝑁2𝑂 𝑒𝑚𝑖𝑠𝑠𝑖𝑜𝑛𝑠 (𝑡𝐶𝑂2𝑒)
= ((𝑃𝑡𝑜𝑡𝑎𝑙 × 𝐹𝑖𝑛𝑑−𝑐𝑜𝑚)
× (𝑇𝑜𝑡𝑎𝑙 𝑁 𝑙𝑜𝑎𝑑 − 𝑁 𝑢𝑝𝑡𝑎𝑘𝑒 × 𝐵𝑂𝐷5 𝑙𝑜𝑎𝑑) × 𝐸𝐹 𝑒𝑓𝑓𝑙𝑢𝑒𝑛𝑡 ×44
28
× (1 − 𝐹 𝑝𝑙𝑎𝑛𝑡 𝑛𝑖𝑡 𝑜𝑟 𝑑𝑒𝑛𝑖𝑡) × 365.24 × 𝐺𝑊𝑃
Where,
Ptotal = population served
Find-com = Factor for industrial and commercial co-discharge (default value = 1.25)
Total N load = total nitrogen load (default value = 0.026 kg N/ person/ day)
N uptake = Nitrogen uptake for cell growth in aerobic system (default value = 0.05 kg
N/ kg BOD5)
BOD5 load = Amount of BOD5 produced per person per day (default value = 0.09
kgBOD5/ person/ day)
EF effluent = Emission factor (default value = 0.005 kg N2O - N/ kg sewage - N
produced)
F plant nit/denit = Fraction of nitrogen removed for the centralized WWTP with
nitrification/denitrification (default value = 70%)
GWP = Global warming potential of N2O.

IV
APPENDIX C- SECTORAL AND TOTAL EMISSIONS, AND EMISSIONS INTENSITY OF
DURBAN WARDS
Ward No Ward
Name
Resident-
ial
electricity
use
emissions
(tCO2e)
Industry
electricity
use
emissions
(tCO2e)
Road
Transport
fuel use
emissions
(tCO2e)
Wastewat
er
Treatmen
t
emissions
(tCO2e)
Solid
Waste
disposal
emissions
(tCO2e)
Total
emissions
(tCO2e)
Populatio
n
GHG
intensity
(tCO2e/
capita)
Total
emissions
exlc
industry
(tCO2e)
GHG
intensity
exlc.
Industry
(tCO2e/
capita)
1 Ximba 12916 0 507 781 0 14204 31923 0.44 14204 0.44
2 Shangase
Ta
9985 0 0 0 0 9985 31525 0.32 9985 0.32
3 Inanda
Farm
21204 0 367 0 0 21571 43926 0.49 21571 0.49
4 Hammars
dale
30812 0 83979 308 0 115098 39325 2.93 115098 2.93
5 Georgeda
le
20135 0 81558 1067 0 102760 29625 3.47 102760 3.47
6 Mpumala
nga
26953 0 0 0 0 26953 28801 0.94 26953 0.94

V
7 Shongwe
ni
18269 530 73006 0 94248 186053 30711 6.06 185523 6.04
8 Hillcrest 36750 5441 73852 0 0 116043 36813 3.15 110602 3.00
9 Waterfall 37654 13340 669 0 0 51663 33066 1.56 38323 1.16
10 Kloof 36257 45513 74024 0 0 155793 23046 6.76 110280 4.79
11 Newlands 46034 11716 131201 0 0 188951 50449 3.75 177235 3.51
12 KwaNde
ngezi
24158 0 0 919 0 25077 28024 0.89 25077 0.89
13 Dassenho
ek
36247 0 1036 0 0 37283 36987 1.01 37283 1.01
14 KwaNde
ngezi
31266 0 0 0 0 31266 27790 1.13 31266 1.13
15 Westmea
d
47185 94919 75201 0 4318 221623 40753 5.44 126704 3.11
16 Pinetown
South
47320 2122 531 0 0 49974 37886 1.32 47852 1.26
17 Savannah
Park
42054 0 0 0 0 42054 38047 1.11 42054 1.11
18 Pinetown
Central
33181 168118 82008 3620 0 286928 29479 9.73 118810 4.03
19 Wyebank 46160 1245 73006 0 0 120411 45079 2.67 119166 2.64
20 Kwadabe
ka
22606 0 0 0 0 22606 24380 0.93 22606 0.93
21 New 35913 10613 8027 0 0 54553 27947 1.95 43940 1.57

VI
Germany
22 Clermont 19913 0 73006 0 0 92919 26449 3.51 92919 3.51
23 Reservoir
Hills
28085 11868 74284 0 0 114236 31686 3.61 102368 3.23
24 Westville 40376 114622 103444 0 0 258442 34653 7.46 143820 4.15
25 Springfiel
d
25870 20117 198373 781 54470 299610 40422 7.41 279494 6.91
26 South
Beach
4400 114808 129095 0 0 248303 35840 6.93 133495 3.72
27 Mornings
ide
18520 51562 239204 0 0 309286 23796 13.00 257725 10.83
28 CBD 5909 150761 184009 6857 0 347537 24000 14.48 196776 8.20
29 Chestervi
lle
33858 1850 49593 0 0 85301 35043 2.43 83451 2.38
30 Sherwoo
d
38302 854 49593 0 0 88749 38890 2.28 87895 2.26
31 Musgrave 24830 25982 129257 0 0 180069 34297 5.25 154088 4.49
32 Harbour 5232 258309 113019 0 0 376560 22918 16.43 118251 5.16
33 Umbilo 26179 11999 240620 0 0 278799 33073 8.43 266799 8.07
34 Effingha
m
32253 43110 206715 3466 0 285543 38545 7.41 242433 6.29
35 Umhlang
a
43486 137761 241264 1069 0 423580 32198 13.16 285819 8.88
36 Durban 45425 75289 215281 0 0 335995 32275 10.41 260706 8.08

VII
North
37 Newlands
West
43650 0 0 0 0 43650 42239 1.03 43650 1.03
38 Lindelani 31527 0 0 0 0 31527 40347 0.78 31527 0.78
39 KwaMas
hu
25667 0 0 0 0 25667 25496 1.01 25667 1.01
40 KwaMas
hu B
27325 0 0 0 0 27325 31119 0.88 27325 0.88
41 KwaMas
hu K
32437 0 251 0 0 32687 36598 0.89 32687 0.89
42 Ntuzuma
F and H
38234 0 0 0 0 38234 40236 0.95 38234 0.95
43 Ntuzuma
E
26658 0 0 0 0 26658 34402 0.77 26658 0.77
44 eMachob
eni
36111 0 0 0 0 36111 43482 0.83 36111 0.83
45 Ntuzuma
B
29564 0 1196 0 0 30760 40080 0.77 30760 0.77
46 KwaMas
hu F
24792 19992 0 0 0 44783 30514 1.47 24792 0.81
47 KwaMas
hu M
30086 0 0 0 0 30086 32032 0.94 30086 0.94
48 Phoenix
Industrial
22553 66011 0 0 0 88564 31157 2.84 22553 0.72
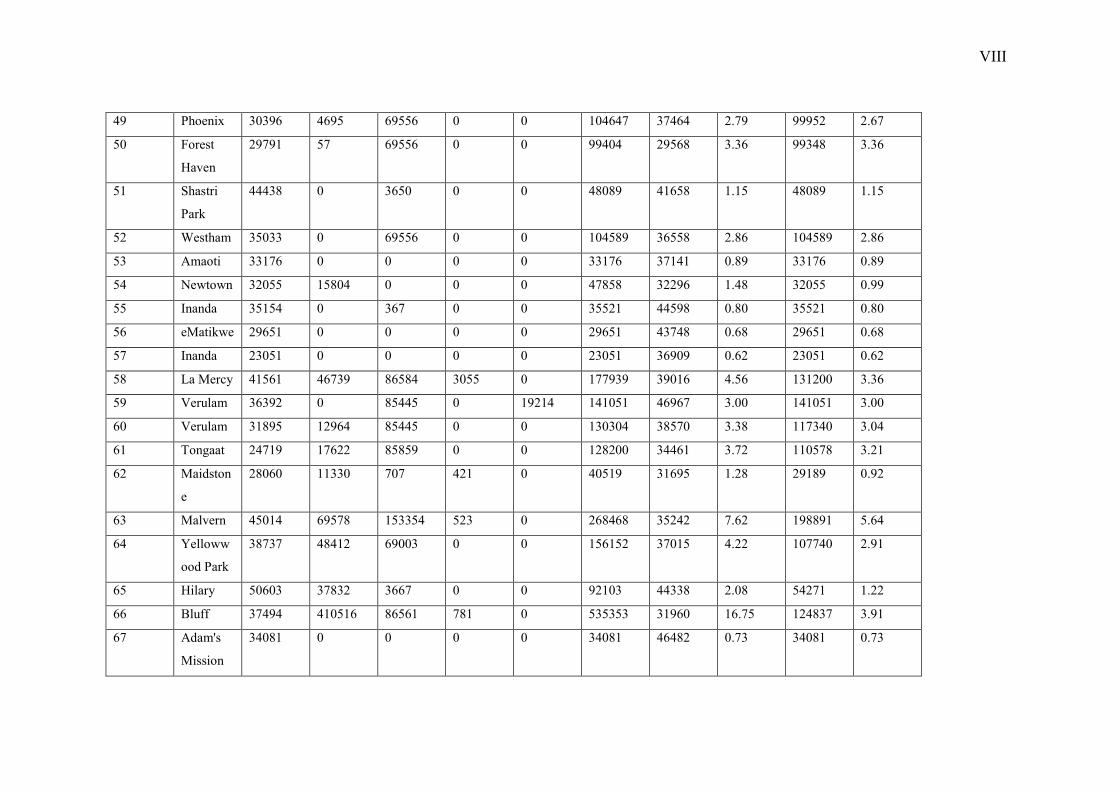
VIII
49 Phoenix 30396 4695 69556 0 0 104647 37464 2.79 99952 2.67
50 Forest
Haven
29791 57 69556 0 0 99404 29568 3.36 99348 3.36
51 Shastri
Park
44438 0 3650 0 0 48089 41658 1.15 48089 1.15
52 Westham 35033 0 69556 0 0 104589 36558 2.86 104589 2.86
53 Amaoti 33176 0 0 0 0 33176 37141 0.89 33176 0.89
54 Newtown 32055 15804 0 0 0 47858 32296 1.48 32055 0.99
55 Inanda 35154 0 367 0 0 35521 44598 0.80 35521 0.80
56 eMatikwe 29651 0 0 0 0 29651 43748 0.68 29651 0.68
57 Inanda 23051 0 0 0 0 23051 36909 0.62 23051 0.62
58 La Mercy 41561 46739 86584 3055 0 177939 39016 4.56 131200 3.36
59 Verulam 36392 0 85445 0 19214 141051 46967 3.00 141051 3.00
60 Verulam 31895 12964 85445 0 0 130304 38570 3.38 117340 3.04
61 Tongaat 24719 17622 85859 0 0 128200 34461 3.72 110578 3.21
62 Maidston
e
28060 11330 707 421 0 40519 31695 1.28 29189 0.92
63 Malvern 45014 69578 153354 523 0 268468 35242 7.62 198891 5.64
64 Yelloww
ood Park
38737 48412 69003 0 0 156152 37015 4.22 107740 2.91
65 Hilary 50603 37832 3667 0 0 92103 44338 2.08 54271 1.22
66 Bluff 37494 410516 86561 781 0 535353 31960 16.75 124837 3.91
67 Adam's
Mission
34081 0 0 0 0 34081 46482 0.73 34081 0.73

IX
68 Mereban
k
33723 424081 86958 10389 0 555151 40765 13.62 131070 3.22
69 Havensid
e
33418 729 304 0 94744 129195 33760 3.83 128466 3.81
70 Westcliff 31484 10157 64238 0 0 105880 31052 3.41 95722 3.08
71 Shallcros
s
29908 6088 64368 0 0 100363 37698 2.66 94275 2.50
72 Risecliff 40807 0 64238 0 0 105045 40734 2.58 105045 2.58
73 Chatswor
th
36339 1365 67310 0 0 105014 32581 3.22 103648 3.18
74 Lamontvi
lle
16387 0 34892 0 0 51279 23699 2.16 51279 2.16
75 Clairwoo
d
16692 202729 89400 0 0 308821 22446 13.76 106093 4.73
76 Umlazi V 12891 7414 8786 0 0 29091 20081 1.45 21677 1.08
77 Umlazi H 31063 0 8216 0 0 39279 47697 0.82 39279 0.82
78 Umlazi K 20193 0 8216 0 0 28409 29401 0.97 28409 0.97
79 Umlazi G 28597 0 8216 0 0 36813 40380 0.91 36813 0.91
80 Umlazi E 21663 0 8216 0 0 29879 31777 0.94 29879 0.94
81 Umlazi C 21445 0 8216 0 0 29662 25566 1.16 29662 1.16
82 Umlazi R 22973 1599 142742 0 0 167314 30270 5.53 165715 5.47
83 Umlazi L 24903 0 8216 0 0 33119 37549 0.88 33119 0.88
84 eMathole 32635 0 8216 0 0 40851 40579 1.01 40851 1.01
85 Umlazi 26121 0 8216 0 0 34338 33261 1.03 34338 1.03

X
86 Umlazi U 33907 0 8216 0 0 42123 35252 1.19 42123 1.19
87 Umlazi Q 19666 0 8216 0 0 27882 27574 1.01 27882 1.01
88 Umlazi S 28457 0 8216 0 0 36673 36821 1.00 36673 1.00
89 Isipingo 24700 2902 8216 0 0 35818 32899 1.09 32916 1.00
90 Prospecto
n
21760 536012 202344 7057 0 767172 27238 28.17 231161 8.49
91 Mpumala
nga
Complex
32146 0 0 0 0 32146 36520 0.88 32146 0.88
92 Westville
-
Pitlochry
30488 0 0 0 0 30488 28629 1.06 30488 1.06
93 Umbogin
twini
35754 157132 121501 1274 0 315660 37316 8.46 158528 4.25
94 Folweni 22959 0 283 0 0 23242 31042 0.75 23242 0.75
95 Folweni 30328 0 0 0 0 30328 39927 0.76 30328 0.76
96 Folweni 26407 0 0 0 0 26407 35585 0.74 26407 0.74
97 Amanzim
toti
28191 28060 133331 186 0 189768 25970 7.31 161708 6.23
98 Illovu 44825 0 0 0 0 44825 48177 0.93 44825 0.93
99 Umkoma
as
34506 0 516 0 0 35022 38918 0.90 35022 0.90
100 Isimahla
Ta
10242 0 12770 0 0 23012 33486 0.69 23012 0.69

XI
101 Universit
y of Natal
20014 36820 53248 0 0 110082 26372 4.17 73262 2.78
102 Mt
Edgecom
be
45604 85818 69627 1381 0 202429 42814 4.73 116611 2.72
103 Qadi 24545 0 0 0 0 24545 28777 0.85 24545 0.85
Total 3081343 3634904 5191940 43937 266994 12219118 3565668 3.43 8584214 2.41