Embed Size (px)
Citation preview
1 | Data Breach Intelligence Copyright © 2014 Risk Based Security, Inc. All rights reserved.
Data Breach QuickView
Data Breach Trends during the First Half of 2014
Sponsored by:
Risk Based Security Open Security Foundation
Issued in July 2014
Mid-year 2014 at a Glance … • There were 1331 incidents reported during the first six months of 2014 exposing 502 million records. • Two Hacking incidents alone exposed a combined 318 million records. • A single act of Fraud exposed 104 million records. • The Business sector accounted for 54.9% of reported incidents, followed by Government (16.1%), Unknown (11.8%), Education (8.7%), and Medical (8.5%). • The Business sector accounted for 64.3% of the number of records exposed, followed by Government (34.9%), • 78.2% of reported incidents were the result of Hacking, which accounted for 78.7% of the exposed records. • Fraud accounted for 20.7% of the exposed records, but represented just 2.1% of the reported incidents. • Breaches involving U.S. entities accounted for 39.6% of the incidents and 74.3% of the exposed records. • 61.7% of the incidents exposed between one and 1000 records. • Ten incidents exposed more than one million records. • Three First Half of 2014 incidents have secured a place on the Top 10 All Time Breach List. • The number of reported incidents tracked by Risk Based Security has exceeded 12,700 exposing over 2.9 billion records.
2 | Data Breach Intelligence Copyright © 2014 Risk Based Security, Inc. All rights reserved.
Looking Back at the Last Five Years
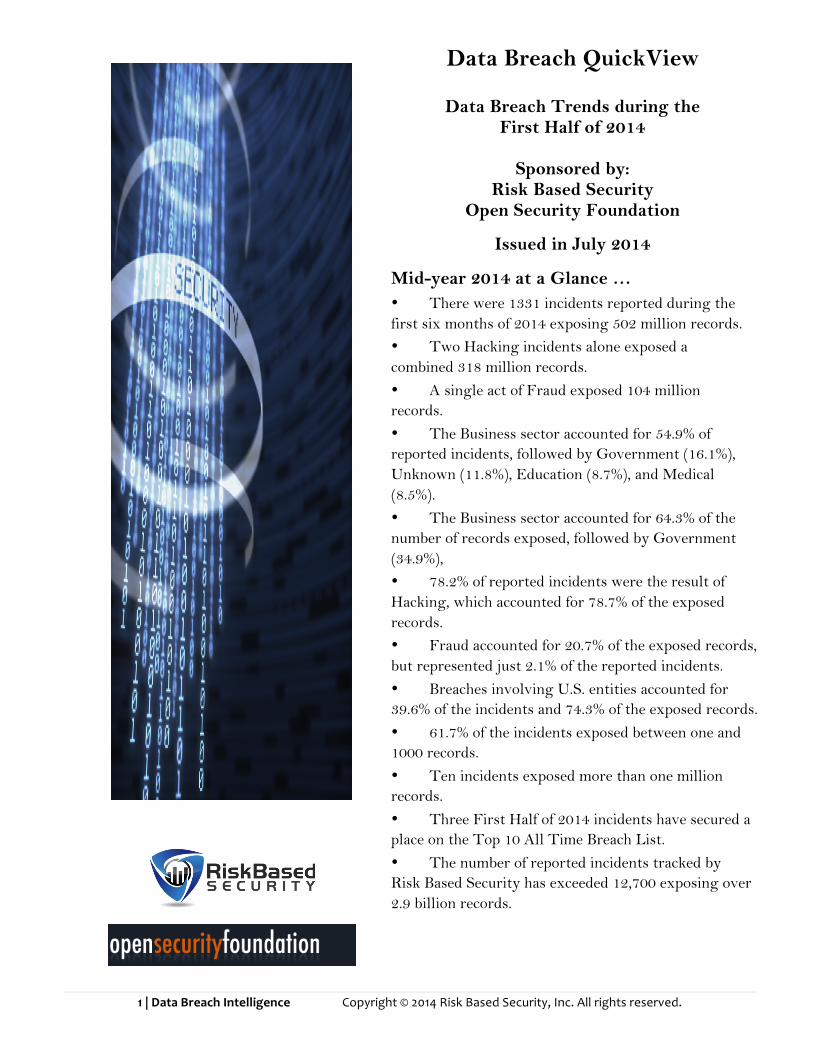
Mid 2014 by Industry by Month
952 1,236
3,193
2,261
1,331
2010 2011 2012 2013 Mid 2014
Number of Incidents
96M
413M
265M
823M
502M
2010 2011 2012 2013 Mid 2014
Number of Records Exposed
0 50
100 150 200 250 300
JAN FEB MAR APR MAY JUN
Mid 2014 Incidents by Industry
Business Government Medical Education Unknown
0%
20%
40%
60%
80%
100%
JAN FEB MAR APR MAY JUN
Mid 2014 Exposed Records by Industry
Business Government Medical Education Unknown
3 | Data Breach Intelligence Copyright © 2014 Risk Based Security, Inc. All rights reserved.
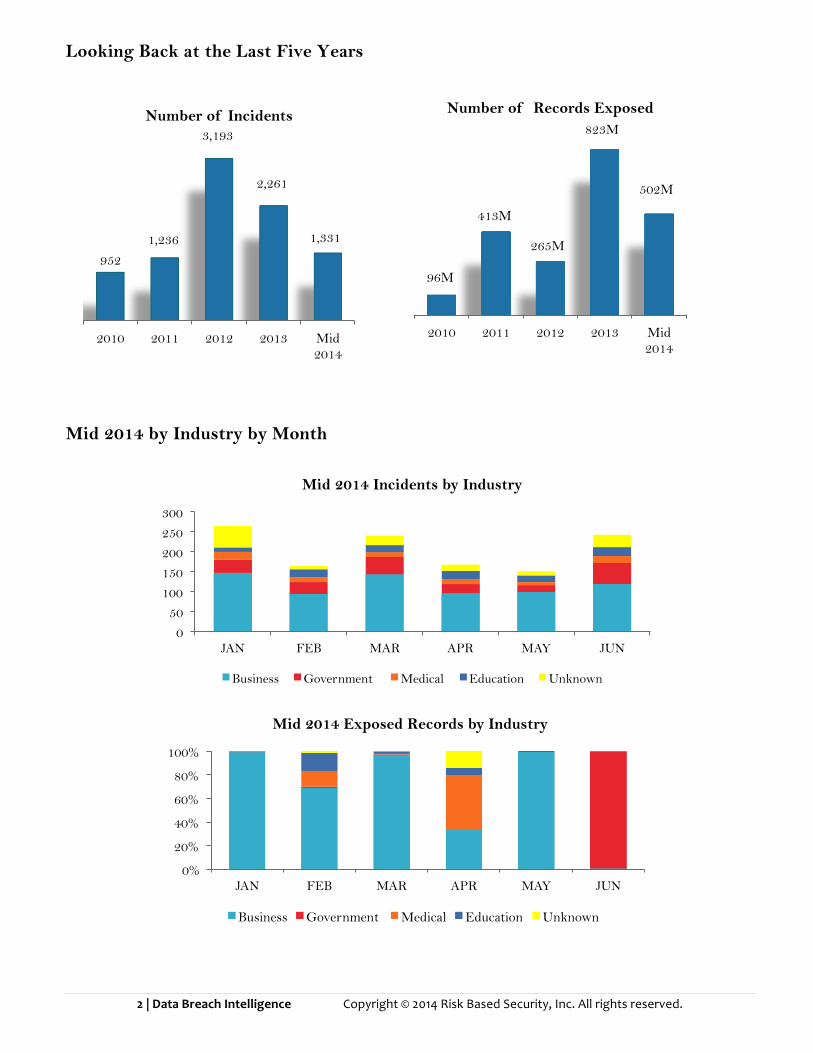
Mid 2014 Analysis by Breach Type
Mid 2014 Analysis by Threat Vector
1041
48
32
28
22
22
20
18
16
16
14
9
Hacking
Web
Documents
Fraud SE
Unknown
Stolen Laptop
Snooping
Phishing
Other
Snail Mail
Virus
Mid 2014 Incidents by Breach Type
78.8%
20.7%
0.3%
0.1%
0.1%
Hacking
Fraud SE
Other
Web
Stolen Laptop
Mid 2014 Records Exposed by Breach Type
33
37
43
92
1126
Inside-Unknown
Unknown
Inside-Malicious
Inside-Accidental
Outside
Mid 2014 Incidents by Threat Vector
84.6% of incidents involved outside the organization activity.
4 | Data Breach Intelligence Copyright © 2014 Risk Based Security, Inc. All rights reserved.
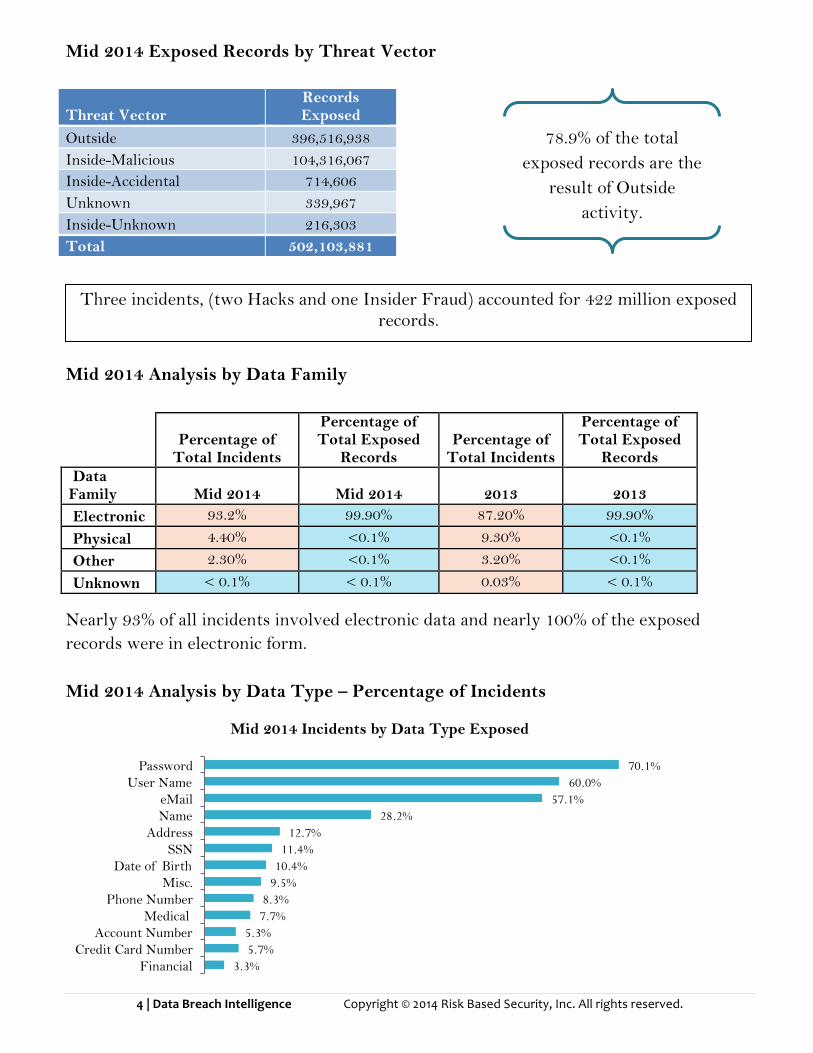
Mid 2014 Exposed Records by Threat Vector
Threat Vector Records Exposed
Outside 396,516,938 Inside-Malicious 104,316,067 Inside-Accidental 714,606 Unknown 339,967 Inside-Unknown 216,303 Total 502,103,881
Mid 2014 Analysis by Data Family
Percentage of Total Incidents
Percentage of Total Exposed
Records Percentage of
Total Incidents
Percentage of Total Exposed
Records Data Family Mid 2014 Mid 2014 2013 2013 Electronic 93.2% 99.90% 87.20% 99.90%
Physical 4.40% <0.1% 9.30% <0.1%
Other 2.30% <0.1% 3.20% <0.1%
Unknown < 0.1% < 0.1% 0.03% < 0.1%
Nearly 93% of all incidents involved electronic data and nearly 100% of the exposed records were in electronic form. Mid 2014 Analysis by Data Type – Percentage of Incidents
3.3%
5.7% 5.3%
7.7% 8.3%
9.5% 10.4%
11.4% 12.7%
28.2% 57.1%
60.0% 70.1%
Financial Credit Card Number
Account Number Medical
Phone Number Misc.
Date of Birth SSN
Address Name eMail
User Name Password
Mid 2014 Incidents by Data Type Exposed
Three incidents, (two Hacks and one Insider Fraud) accounted for 422 million exposed records.
78.9% of the total exposed records are the
result of Outside activity.
5 | Data Breach Intelligence Copyright © 2014 Risk Based Security, Inc. All rights reserved.
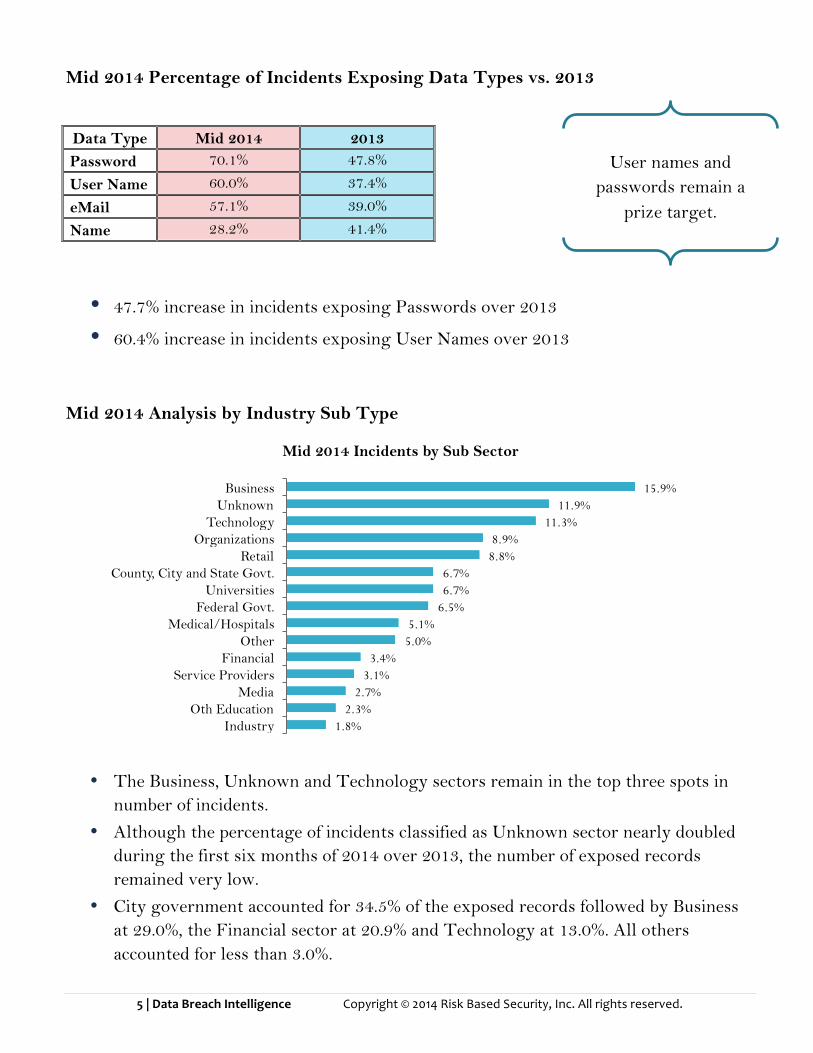
Mid 2014 Percentage of Incidents Exposing Data Types vs. 2013
Data Type Mid 2014 2013 Password 70.1% 47.8%
User Name 60.0% 37.4%
eMail 57.1% 39.0%
Name 28.2% 41.4%
• 47.7% increase in incidents exposing Passwords over 2013 • 60.4% increase in incidents exposing User Names over 2013
Mid 2014 Analysis by Industry Sub Type
• The Business, Unknown and Technology sectors remain in the top three spots in
number of incidents. • Although the percentage of incidents classified as Unknown sector nearly doubled
during the first six months of 2014 over 2013, the number of exposed records remained very low.
• City government accounted for 34.5% of the exposed records followed by Business at 29.0%, the Financial sector at 20.9% and Technology at 13.0%. All others accounted for less than 3.0%.
1.8% 2.3%
2.7% 3.1%
3.4% 5.0% 5.1%
6.5% 6.7% 6.7%
8.8% 8.9%
11.3% 11.9%
15.9%
Industry Oth Education
Media Service Providers
Financial Other
Medical/Hospitals Federal Govt.
Universities County, City and State Govt.
Retail Organizations
Technology Unknown
Business
Mid 2014 Incidents by Sub Sector
User names and passwords remain a
prize target.
6 | Data Breach Intelligence Copyright © 2014 Risk Based Security, Inc. All rights reserved.
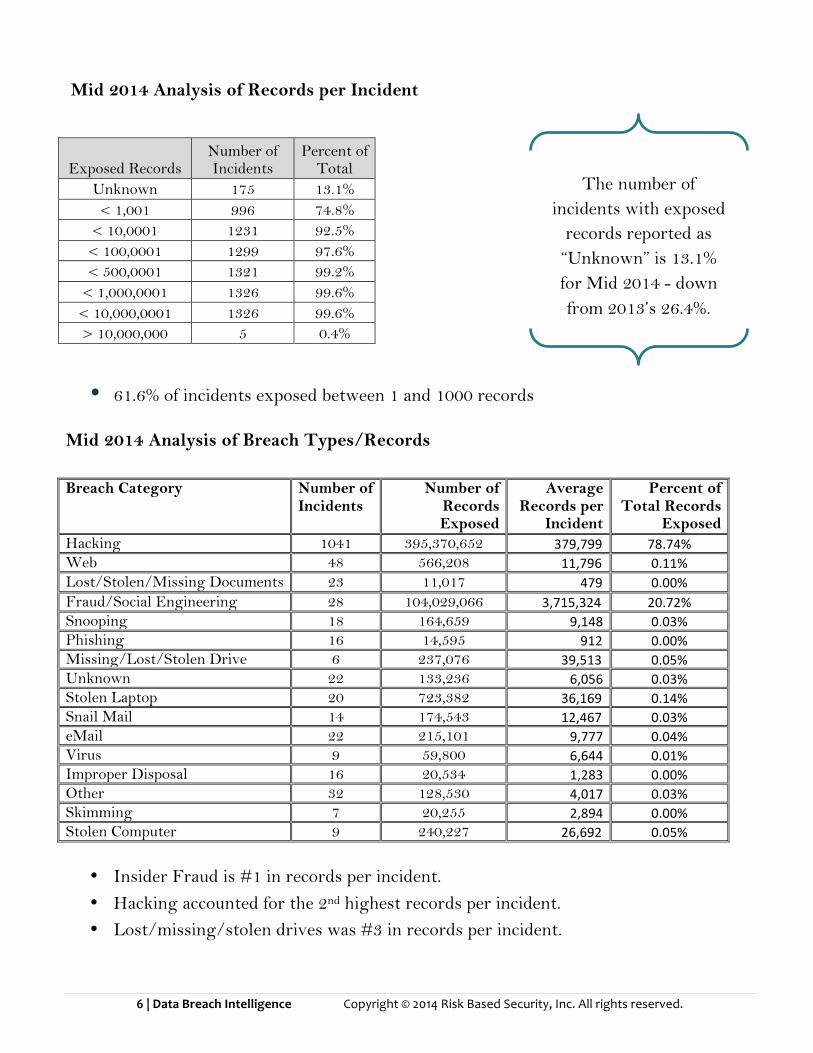
Mid 2014 Analysis of Records per Incident
Exposed Records Number of Incidents
Percent of Total
Unknown 175 13.1% < 1,001 996 74.8%
< 10,0001 1231 92.5% < 100,0001 1299 97.6% < 500,0001 1321 99.2%
< 1,000,0001 1326 99.6% < 10,000,0001 1326 99.6% > 10,000,000 5 0.4%
• 61.6% of incidents exposed between 1 and 1000 records
Mid 2014 Analysis of Breach Types/Records Breach Category Number of
Incidents Number of
Records Exposed
Average Records per
Incident
Percent of Total Records
Exposed Hacking 1041 395,370,652 379,799 78.74% Web 48 566,208 11,796 0.11% Lost/Stolen/Missing Documents 23 11,017 479 0.00% Fraud/Social Engineering 28 104,029,066 3,715,324 20.72% Snooping 18 164,659 9,148 0.03% Phishing 16 14,595 912 0.00% Missing/Lost/Stolen Drive 6 237,076 39,513 0.05% Unknown 22 133,236 6,056 0.03% Stolen Laptop 20 723,382 36,169 0.14% Snail Mail 14 174,543 12,467 0.03% eMail 22 215,101 9,777 0.04% Virus 9 59,800 6,644 0.01% Improper Disposal 16 20,534 1,283 0.00% Other 32 128,530 4,017 0.03% Skimming 7 20,255 2,894 0.00% Stolen Computer 9 240,227 26,692 0.05%
• Insider Fraud is #1 in records per incident. • Hacking accounted for the 2nd highest records per incident. • Lost/missing/stolen drives was #3 in records per incident.
The number of incidents with exposed
records reported as “Unknown” is 13.1% for Mid 2014 - down from 2013’s 26.4%.
7 | Data Breach Intelligence Copyright © 2014 Risk Based Security, Inc. All rights reserved.
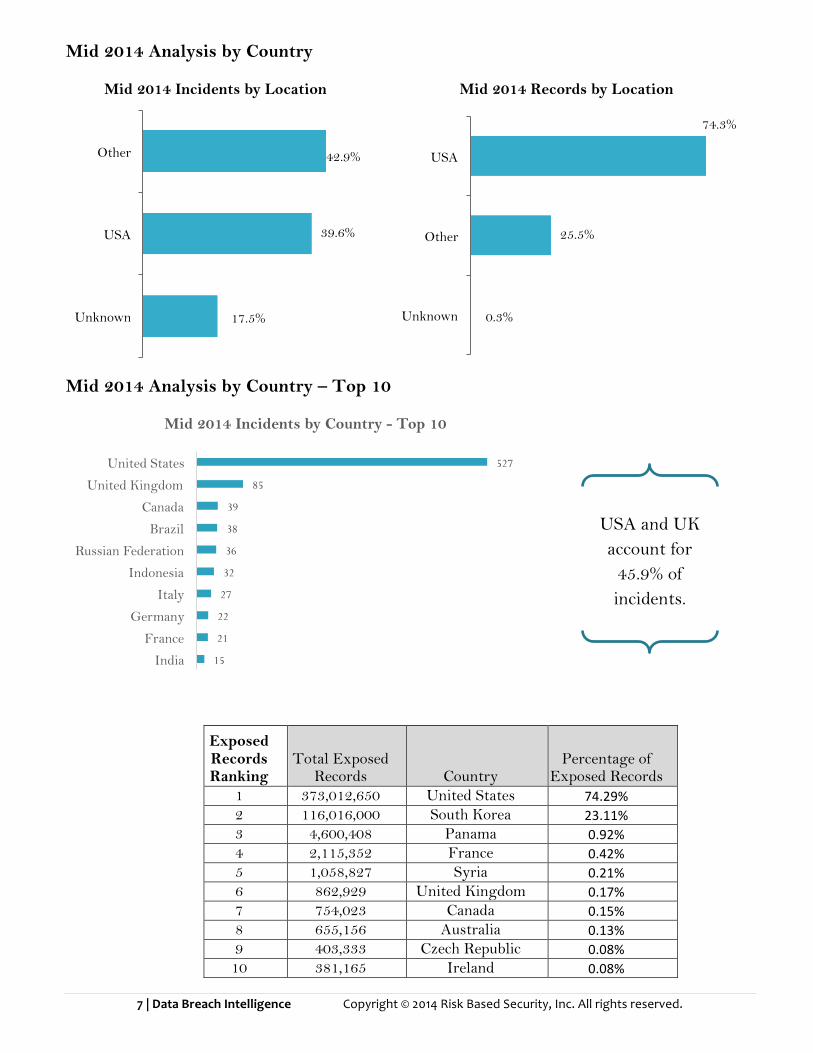
Mid 2014 Analysis by Country
Mid 2014 Analysis by Country – Top 10
Exposed Records Ranking
Total Exposed Records Country
Percentage of Exposed Records
1 373,012,650 United States 74.29% 2 116,016,000 South Korea 23.11% 3 4,600,408 Panama 0.92% 4 2,115,352 France 0.42% 5 1,058,827 Syria 0.21% 6 862,929 United Kingdom 0.17% 7 754,023 Canada 0.15% 8 655,156 Australia 0.13% 9 403,333 Czech Republic 0.08% 10 381,165 Ireland 0.08%
17.5%
39.6%
42.9%
Unknown
USA
Other
Mid 2014 Incidents by Location
0.3%
25.5%
74.3%
Unknown
Other
USA
Mid 2014 Records by Location
15
21
22
27
32
36
38
39
85
527
India
France
Germany
Italy
Indonesia
Russian Federation
Brazil
Canada
United Kingdom
United States
Mid 2014 Incidents by Country - Top 10
USA and UK account for
45.9% of incidents.
8 | Data Breach Intelligence Copyright © 2014 Risk Based Security, Inc. All rights reserved.
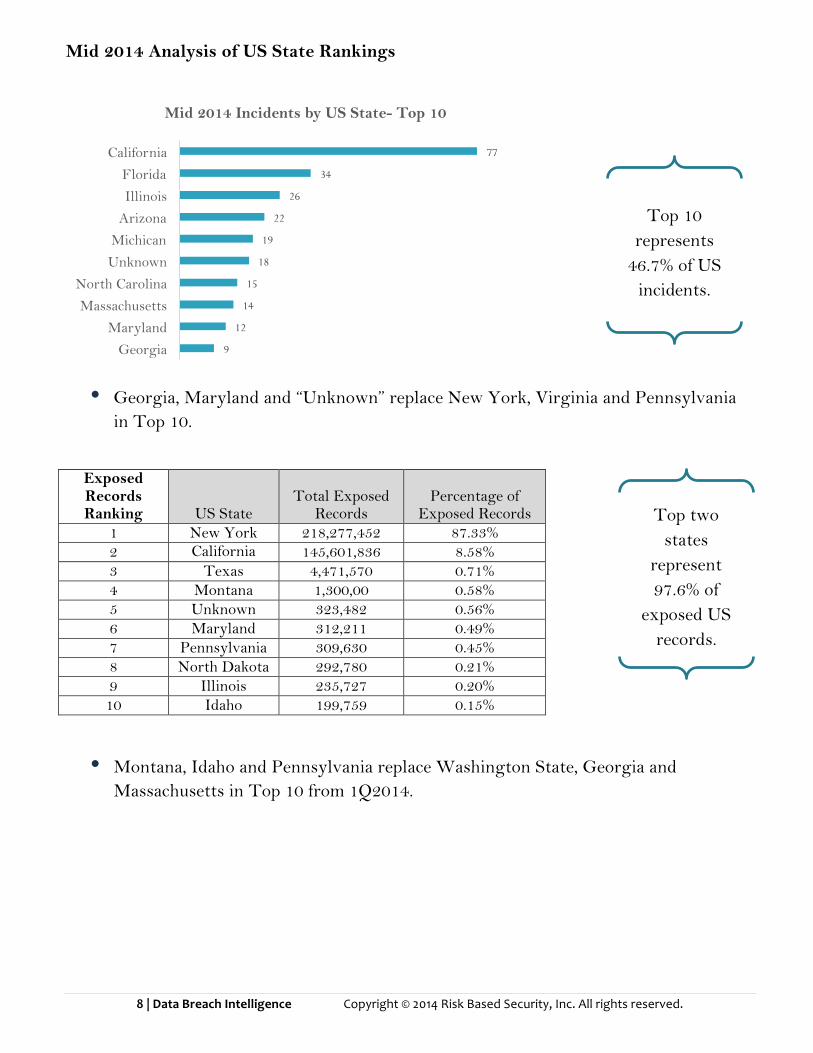
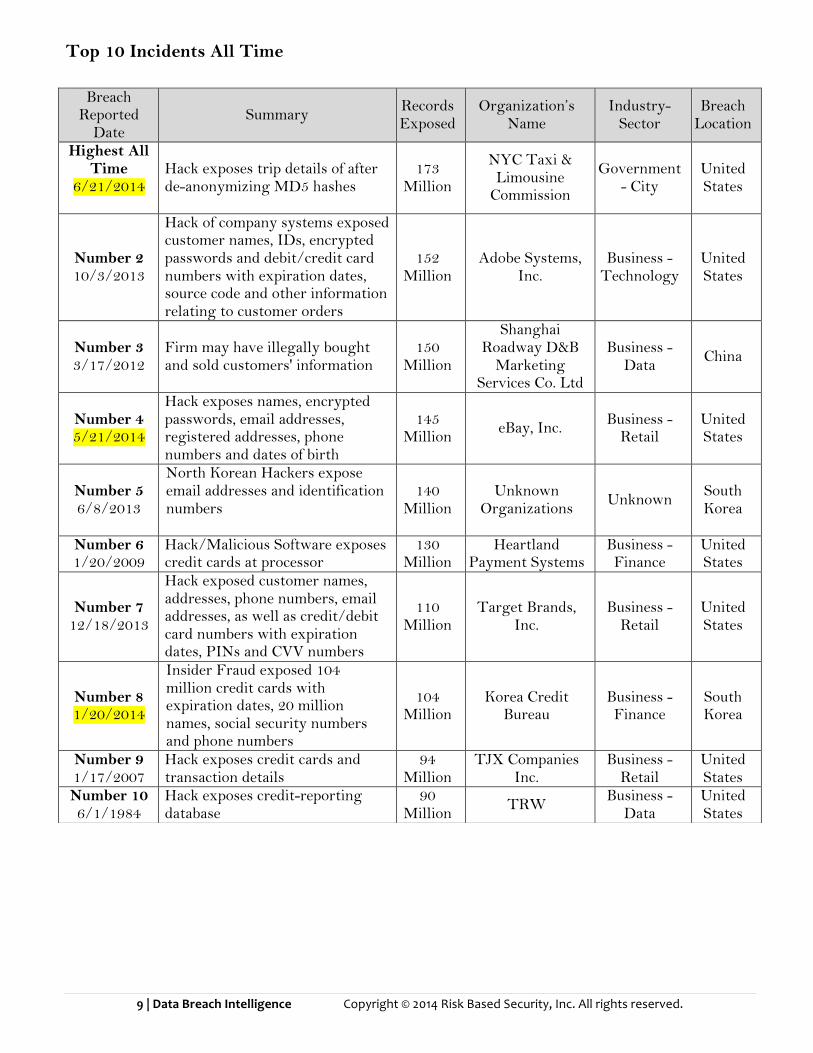
Mid 2014 Analysis of US State Rankings
• Georgia, Maryland and “Unknown” replace New York, Virginia and Pennsylvania
in Top 10.
Exposed Records Ranking US State
Total Exposed Records
Percentage of Exposed Records
1 New York 218,277,452 87.33% 2 California
Texas 145,601,836 8.58%
3 Texas 4,471,570 0.71% 4 Montana 1,300,00 0.58% 5 Unknown 323,482 0.56% 6 Maryland 312,211 0.49% 7 Pennsylvania 309,630 0.45% 8 North Dakota 292,780 0.21% 9 Illinois 235,727 0.20% 10 Idaho 199,759 0.15%
• Montana, Idaho and Pennsylvania replace Washington State, Georgia and
Massachusetts in Top 10 from 1Q2014.
9
12
14
15
18
19
22
26
34
77
Georgia
Maryland
Massachusetts
North Carolina
Unknown
Michican
Arizona
Illinois
Florida
California
Mid 2014 Incidents by US State- Top 10
Top 10 represents
46.7% of US incidents.
Top two states
represent 97.6% of
exposed US records.
9 | Data Breach Intelligence Copyright © 2014 Risk Based Security, Inc. All rights reserved.
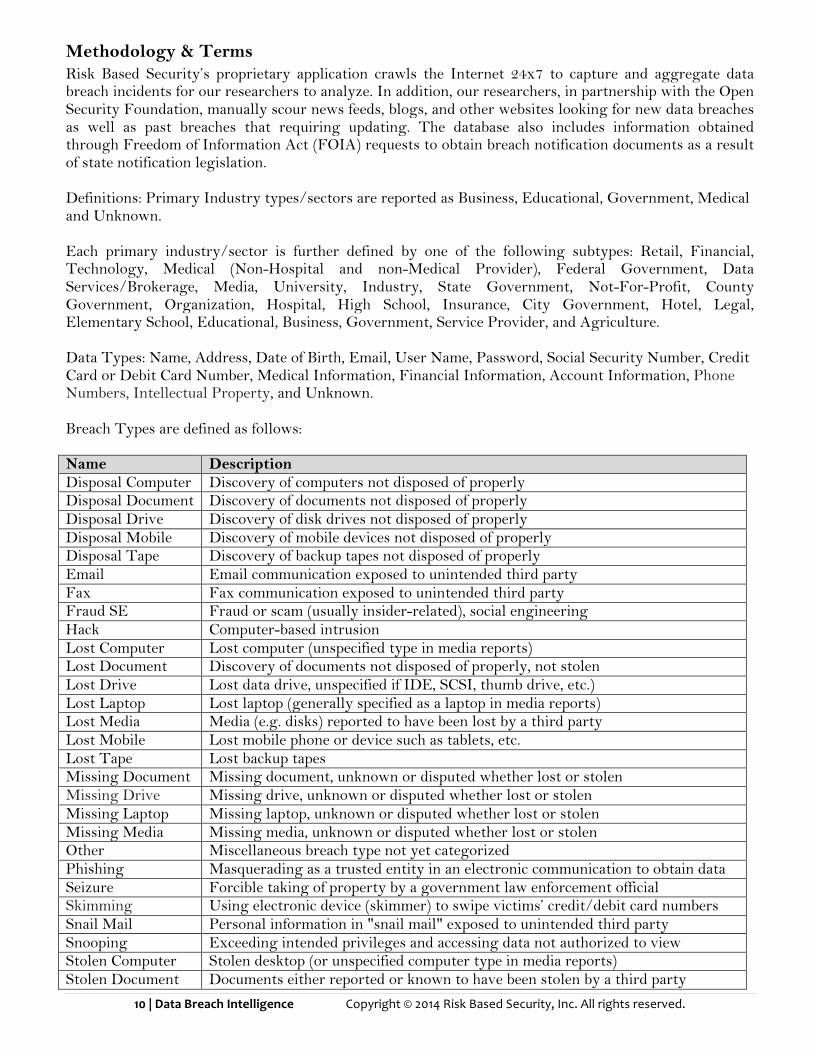
Top 10 Incidents All Time
Breach Reported
Date Summary Records
Exposed Organization’s
Name Industry-
Sector Breach
Location
Highest All Time
6/21/2014
Hack exposes trip details of after de-anonymizing MD5 hashes
173 Million
NYC Taxi & Limousine
Commission
Government - City
United States
Number 2 10/3/2013
Hack of company systems exposed customer names, IDs, encrypted passwords and debit/credit card numbers with expiration dates, source code and other information relating to customer orders
152 Million
Adobe Systems, Inc.
Business - Technology
United States
Number 3 3/17/2012
Firm may have illegally bought and sold customers' information
150 Million
Shanghai Roadway D&B
Marketing Services Co. Ltd
Business - Data China
Number 4 5/21/2014
Hack exposes names, encrypted passwords, email addresses, registered addresses, phone numbers and dates of birth
145 Million eBay, Inc. Business -
Retail United States
Number 5 6/8/2013
North Korean Hackers expose email addresses and identification numbers
140 Million
Unknown Organizations Unknown South
Korea
Number 6 1/20/2009
Hack/Malicious Software exposes credit cards at processor
130 Million
Heartland Payment Systems
Business -Finance
United States
Number 7 12/18/2013
Hack exposed customer names, addresses, phone numbers, email addresses, as well as credit/debit card numbers with expiration dates, PINs and CVV numbers
110 Million
Target Brands, Inc.
Business - Retail
United States
Number 8 1/20/2014
Insider Fraud exposed 104 million credit cards with expiration dates, 20 million names, social security numbers and phone numbers
104 Million
Korea Credit Bureau
Business -Finance
South Korea
Number 9 1/17/2007
Hack exposes credit cards and transaction details
94 Million
TJX Companies Inc.
Business - Retail
United States
Number 10 6/1/1984
Hack exposes credit-reporting database
90 Million TRW Business -
Data United States
10 | Data Breach Intelligence Copyright © 2014 Risk Based Security, Inc. All rights reserved.
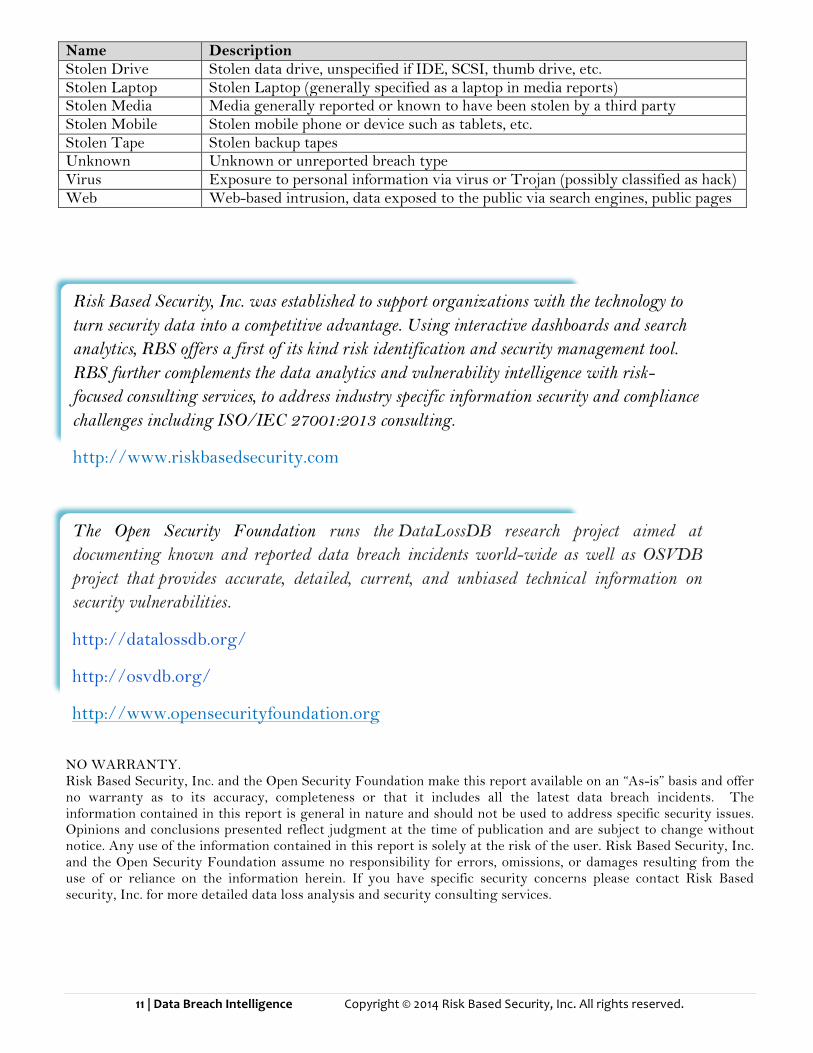
Methodology & Terms Risk Based Security’s proprietary application crawls the Internet 24x7 to capture and aggregate data breach incidents for our researchers to analyze. In addition, our researchers, in partnership with the Open Security Foundation, manually scour news feeds, blogs, and other websites looking for new data breaches as well as past breaches that requiring updating. The database also includes information obtained through Freedom of Information Act (FOIA) requests to obtain breach notification documents as a result of state notification legislation. Definitions: Primary Industry types/sectors are reported as Business, Educational, Government, Medical and Unknown. Each primary industry/sector is further defined by one of the following subtypes: Retail, Financial, Technology, Medical (Non-Hospital and non-Medical Provider), Federal Government, Data Services/Brokerage, Media, University, Industry, State Government, Not-For-Profit, County Government, Organization, Hospital, High School, Insurance, City Government, Hotel, Legal, Elementary School, Educational, Business, Government, Service Provider, and Agriculture. Data Types: Name, Address, Date of Birth, Email, User Name, Password, Social Security Number, Credit Card or Debit Card Number, Medical Information, Financial Information, Account Information, Phone Numbers, Intellectual Property, and Unknown. Breach Types are defined as follows: Name Description Disposal Computer Discovery of computers not disposed of properly Disposal Document Discovery of documents not disposed of properly Disposal Drive Discovery of disk drives not disposed of properly Disposal Mobile Discovery of mobile devices not disposed of properly Disposal Tape Discovery of backup tapes not disposed of properly Email Email communication exposed to unintended third party Fax Fax communication exposed to unintended third party Fraud SE Fraud or scam (usually insider-related), social engineering Hack Computer-based intrusion Lost Computer Lost computer (unspecified type in media reports) Lost Document Discovery of documents not disposed of properly, not stolen Lost Drive Lost data drive, unspecified if IDE, SCSI, thumb drive, etc.) Lost Laptop Lost laptop (generally specified as a laptop in media reports) Lost Media Media (e.g. disks) reported to have been lost by a third party Lost Mobile Lost mobile phone or device such as tablets, etc. Lost Tape Lost backup tapes Missing Document Missing document, unknown or disputed whether lost or stolen Missing Drive Missing drive, unknown or disputed whether lost or stolen Missing Laptop Missing laptop, unknown or disputed whether lost or stolen Missing Media Missing media, unknown or disputed whether lost or stolen Other Miscellaneous breach type not yet categorized Phishing Masquerading as a trusted entity in an electronic communication to obtain data Seizure Forcible taking of property by a government law enforcement official Skimming Using electronic device (skimmer) to swipe victims’ credit/debit card numbers Snail Mail Personal information in "snail mail" exposed to unintended third party Snooping Exceeding intended privileges and accessing data not authorized to view Stolen Computer Stolen desktop (or unspecified computer type in media reports) Stolen Document Documents either reported or known to have been stolen by a third party
11 | Data Breach Intelligence Copyright © 2014 Risk Based Security, Inc. All rights reserved.
Name Description Stolen Drive Stolen data drive, unspecified if IDE, SCSI, thumb drive, etc. Stolen Laptop Stolen Laptop (generally specified as a laptop in media reports) Stolen Media Media generally reported or known to have been stolen by a third party Stolen Mobile Stolen mobile phone or device such as tablets, etc. Stolen Tape Stolen backup tapes Unknown Unknown or unreported breach type Virus Exposure to personal information via virus or Trojan (possibly classified as hack) Web Web-based intrusion, data exposed to the public via search engines, public pages
NO WARRANTY. Risk Based Security, Inc. and the Open Security Foundation make this report available on an “As-is” basis and offer no warranty as to its accuracy, completeness or that it includes all the latest data breach incidents. The information contained in this report is general in nature and should not be used to address specific security issues. Opinions and conclusions presented reflect judgment at the time of publication and are subject to change without notice. Any use of the information contained in this report is solely at the risk of the user. Risk Based Security, Inc. and the Open Security Foundation assume no responsibility for errors, omissions, or damages resulting from the use of or reliance on the information herein. If you have specific security concerns please contact Risk Based security, Inc. for more detailed data loss analysis and security consulting services.
Risk Based Security, Inc. was established to support organizations with the technology to turn security data into a competitive advantage. Using interactive dashboards and search analytics, RBS offers a first of its kind risk identification and security management tool. RBS further complements the data analytics and vulnerability intelligence with risk-focused consulting services, to address industry specific information security and compliance challenges including ISO/IEC 27001:2013 consulting.
http://www.riskbasedsecurity.com
The Open Security Foundation runs the DataLossDB research project aimed at documenting known and reported data breach incidents world-wide as well as OSVDB project that provides accurate, detailed, current, and unbiased technical information on security vulnerabilities.
http://datalossdb.org/
http://osvdb.org/
http://www.opensecurityfoundation.org