Embed Size (px)
Citation preview
Th e TJ X Co mpa ni es , Inc .
16
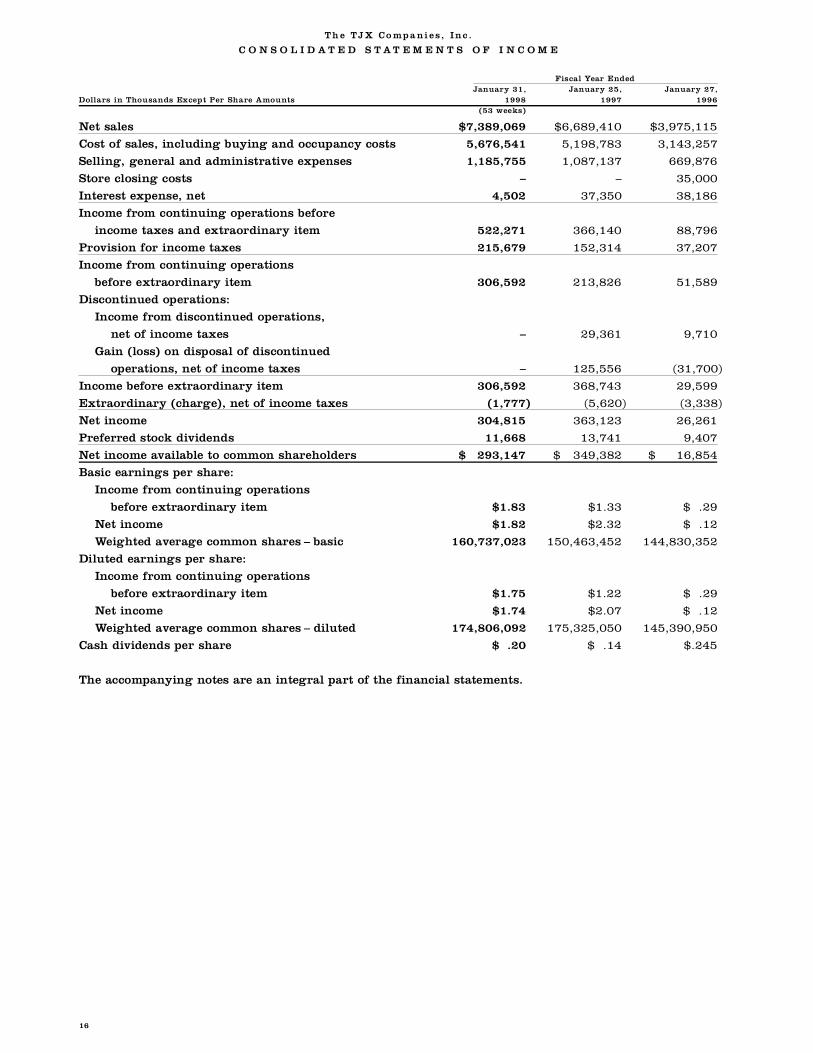
C O N S O L I D A T E D S T A T E M E N T S O F I N C O M E
Fiscal Year EndedJ a n u a ry 31, J a n u a ry 25, J a n u a ry 27,
Dollars in Thousands Except Per Share Amounts 1 9 9 8 1 9 9 7 1 9 9 6(53 weeks)
Net sales $ 7 , 3 8 9 , 0 6 9 $ 6 , 6 8 9 , 4 1 0 $ 3 , 9 7 5 , 1 1 5
Cost of sales, including buying and occupancy costs 5 , 6 7 6 , 5 4 1 5 , 1 9 8 , 7 8 3 3 , 1 4 3 , 2 5 7
Selling, general and administrative expenses 1 , 1 8 5 , 7 5 5 1 , 0 8 7 , 1 3 7 6 6 9 , 8 7 6
S t o re closing costs – – 3 5 , 0 0 0
I n t e rest expense, net 4 , 5 0 2 3 7 , 3 5 0 3 8 , 1 8 6
Income from continuing operations before
income taxes and extraord i n a ry item 5 2 2 , 2 7 1 3 6 6 , 1 4 0 8 8 , 7 9 6
P rovision for income taxes 2 1 5 , 6 7 9 1 5 2 , 3 1 4 3 7 , 2 0 7
Income from continuing operations
b e f o re extraord i n a ry item 3 0 6 , 5 9 2 2 1 3 , 8 2 6 5 1 , 5 8 9
Discontinued operations:
Income from discontinued operations,
net of income taxes – 2 9 , 3 6 1 9 , 7 1 0
Gain (loss) on disposal of discontinued
operations, net of income taxes – 1 2 5 , 5 5 6 ( 3 1 , 7 0 0 )
Income before extraord i n a ry item 3 0 6 , 5 9 2 3 6 8 , 7 4 3 2 9 , 5 9 9
E x t r a o rd i n a ry (charge), net of income taxes ( 1 , 7 7 7 ) ( 5 , 6 2 0 ) ( 3 , 3 3 8 )
Net income 3 0 4 , 8 1 5 3 6 3 , 1 2 3 2 6 , 2 6 1
P re f e rred stock dividends 1 1 , 6 6 8 1 3 , 7 4 1 9 , 4 0 7
Net income available to common share h o l d e r s $ 2 9 3 , 1 4 7 $ 349,382 $ 16,854
Basic earnings per share :
Income from continuing operations
b e f o re extraord i n a ry item $ 1 . 8 3 $ 1 . 3 3 $ .29
Net income $ 1 . 8 2 $ 2 . 3 2 $ .12
Weighted average common share s – b a s i c 1 6 0 , 7 3 7 , 0 2 3 1 5 0 , 4 6 3 , 4 5 2 1 4 4 , 8 3 0 , 3 5 2
Diluted earnings per share :
Income from continuing operations
b e f o re extraord i n a ry item $ 1 . 7 5 $ 1 . 2 2 $ .29
Net income $ 1 . 7 4 $ 2 . 0 7 $ .12
Weighted average common share s – d i l u t e d 1 7 4 , 8 0 6 , 0 9 2 1 7 5 , 3 2 5 , 0 5 0 1 4 5 , 3 9 0 , 9 5 0
Cash dividends per share $ . 2 0 $ .14 $ . 2 4 5
The accompanying notes are an integral part of the financial statements.
T he TJX Com pan ies , In c .
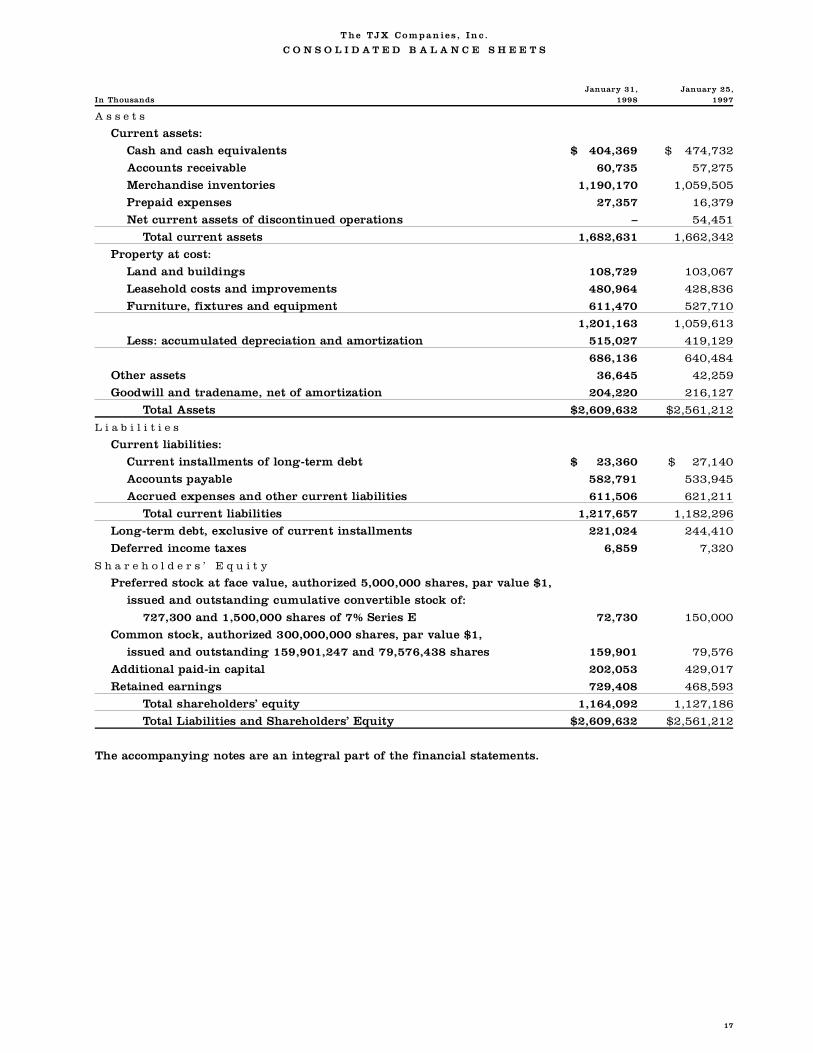
C O N S O L I D A T E D B A L A N C E S H E E T S
J a n u a ry 31, J a n u a ry 25,In Thousands 1 9 9 8 1 9 9 7
A s s e t s
C u rrent assets:
Cash and cash equivalents $ 4 0 4 , 3 6 9 $ 474,732
Accounts re c e i v a b l e 6 0 , 7 3 5 5 7 , 2 7 5
M e rchandise inventories 1 , 1 9 0 , 1 7 0 1 , 0 5 9 , 5 0 5
P repaid expenses 2 7 , 3 5 7 1 6 , 3 7 9
Net current assets of discontinued operations – 5 4 , 4 5 1
Total current assets 1 , 6 8 2 , 6 3 1 1 , 6 6 2 , 3 4 2
P ro p e rty at cost:
Land and buildings 1 0 8 , 7 2 9 1 0 3 , 0 6 7
Leasehold costs and impro v e m e n t s 4 8 0 , 9 6 4 4 2 8 , 8 3 6
F u rn i t u re, fixtures and equipment 6 1 1 , 4 7 0 5 2 7 , 7 1 0
1 , 2 0 1 , 1 6 3 1 , 0 5 9 , 6 1 3
Less: accumulated depreciation and amort i z a t i o n 5 1 5 , 0 2 7 4 1 9 , 1 2 9
6 8 6 , 1 3 6 6 4 0 , 4 8 4
Other assets 3 6 , 6 4 5 4 2 , 2 5 9
Goodwill and tradename, net of amort i z a t i o n 2 0 4 , 2 2 0 2 1 6 , 1 2 7
Total Assets $ 2 , 6 0 9 , 6 3 2 $ 2 , 5 6 1 , 2 1 2
L i a b i l i t i e s
C u rrent liabilities:
C u rrent installments of long-term debt $ 2 3 , 3 6 0 $ 27,140
Accounts payable 5 8 2 , 7 9 1 5 3 3 , 9 4 5
A c c rued expenses and other current liabilities 6 1 1 , 5 0 6 6 2 1 , 2 1 1
Total current liabilities 1 , 2 1 7 , 6 5 7 1 , 1 8 2 , 2 9 6
L o n g - t e rm debt, exclusive of current installments 2 2 1 , 0 2 4 2 4 4 , 4 1 0
D e f e rred income taxes 6 , 8 5 9 7 , 3 2 0
S h a r e h o l d e r s ’ E q u i t y
P re f e rred stock at face value, authorized 5,000,000 shares, par value $1,
issued and outstanding cumulative convertible stock of:
727,300 and 1,500,000 shares of 7% Series E 7 2 , 7 3 0 1 5 0 , 0 0 0
Common stock, authorized 300,000,000 shares, par value $1,
issued and outstanding 159,901,247 and 79,576,438 share s 1 5 9 , 9 0 1 7 9 , 5 7 6
Additional paid-in capital 2 0 2 , 0 5 3 4 2 9 , 0 1 7
Retained earn i n g s 7 2 9 , 4 0 8 4 6 8 , 5 9 3
Total shareholders’ equity 1 , 1 6 4 , 0 9 2 1 , 1 2 7 , 1 8 6
Total Liabilities and Shareholders’ Equity $ 2 , 6 0 9 , 6 3 2 $ 2 , 5 6 1 , 2 1 2
The accompanying notes are an integral part of the financial statements.
17
The TJX Com pan ies , In c .
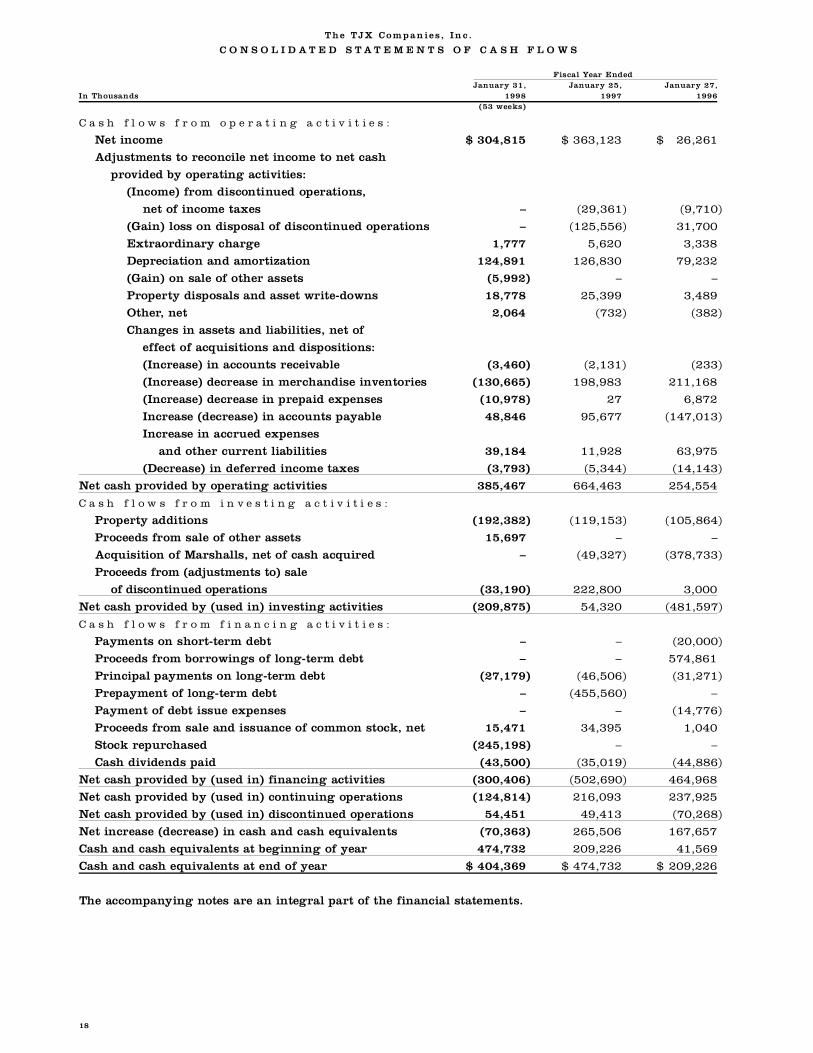
C O N S O L I D A T E D S T A T E M E N T S O F C A S H F L O W S
Fiscal Year EndedJ a n u a ry 31, J a n u a ry 25, J a n u a ry 27,
In Thousands 1 9 9 8 1 9 9 7 1 9 9 6(53 weeks)
C a s h f l o w s f r o m o p e r a t i n g a c t i v i t i e s :
Net income $ 304,815 $ 363,123 $ 26,261
Adjustments to reconcile net income to net cash
p rovided by operating activities:
(Income) from discontinued operations,
net of income taxes – ( 2 9 , 3 6 1 ) ( 9 , 7 1 0 )
(Gain) loss on disposal of discontinued operations – ( 1 2 5 , 5 5 6 ) 3 1 , 7 0 0
E x t r a o rd i n a ry charg e 1 , 7 7 7 5 , 6 2 0 3 , 3 3 8
D e p reciation and amort i z a t i o n 1 2 4 , 8 9 1 1 2 6 , 8 3 0 7 9 , 2 3 2
(Gain) on sale of other assets ( 5 , 9 9 2 ) – –
P ro p e rty disposals and asset write-downs 1 8 , 7 7 8 2 5 , 3 9 9 3 , 4 8 9
O t h e r, net 2 , 0 6 4 ( 7 3 2 ) ( 3 8 2 )
Changes in assets and liabilities, net of
e ffect of acquisitions and dispositions:
( I n c rease) in accounts re c e i v a b l e ( 3 , 4 6 0 ) ( 2 , 1 3 1 ) ( 2 3 3 )
( I n c rease) decrease in merchandise inventories ( 1 3 0 , 6 6 5 ) 1 9 8 , 9 8 3 2 1 1 , 1 6 8
( I n c rease) decrease in prepaid expenses ( 1 0 , 9 7 8 ) 2 7 6 , 8 7 2
I n c rease (decrease) in accounts payable 4 8 , 8 4 6 9 5 , 6 7 7 ( 1 4 7 , 0 1 3 )
I n c rease in accrued expenses
and other current liabilities 3 9 , 1 8 4 1 1 , 9 2 8 6 3 , 9 7 5
( D e c rease) in deferred income taxes ( 3 , 7 9 3 ) ( 5 , 3 4 4 ) ( 1 4 , 1 4 3 )
Net cash provided by operating activities 3 8 5 , 4 6 7 6 6 4 , 4 6 3 2 5 4 , 5 5 4
C a s h f l o w s f r o m i n v e s t i n g a c t i v i t i e s :
P ro p e rty additions ( 1 9 2 , 3 8 2 ) ( 1 1 9 , 1 5 3 ) ( 1 0 5 , 8 6 4 )
P roceeds from sale of other assets 1 5 , 6 9 7 – –
Acquisition of Marshalls, net of cash acquire d – ( 4 9 , 3 2 7 ) ( 3 7 8 , 7 3 3 )
Proceeds from (adjustments to) sale
of discontinued operations ( 3 3 , 1 9 0 ) 2 2 2 , 8 0 0 3 , 0 0 0
Net cash provided by (used in) investing activities ( 2 0 9 , 8 7 5 ) 5 4 , 3 2 0 ( 4 8 1 , 5 9 7 )
C a s h f l o w s f r o m f i n a n c i n g a c t i v i t i e s :
Payments on short - t e rm debt – – ( 2 0 , 0 0 0 )
P roceeds from borrowings of long-term debt – – 5 7 4 , 8 6 1
Principal payments on long-term debt ( 2 7 , 1 7 9 ) ( 4 6 , 5 0 6 ) ( 3 1 , 2 7 1 )
P repayment of long-term debt – ( 4 5 5 , 5 6 0 ) –
Payment of debt issue expenses – – ( 1 4 , 7 7 6 )
P roceeds from sale and issuance of common stock, net 1 5 , 4 7 1 3 4 , 3 9 5 1 , 0 4 0
Stock re p u rc h a s e d ( 2 4 5 , 1 9 8 ) – –
Cash dividends paid ( 4 3 , 5 0 0 ) ( 3 5 , 0 1 9 ) ( 4 4 , 8 8 6 )
Net cash provided by (used in) financing activities ( 3 0 0 , 4 0 6 ) ( 5 0 2 , 6 9 0 ) 4 6 4 , 9 6 8
Net cash provided by (used in) continuing operations ( 1 2 4 , 8 1 4 ) 2 1 6 , 0 9 3 2 3 7 , 9 2 5
Net cash provided by (used in) discontinued operations 5 4 , 4 5 1 4 9 , 4 1 3 ( 7 0 , 2 6 8 )
Net increase (decrease) in cash and cash equivalents ( 7 0 , 3 6 3 ) 2 6 5 , 5 0 6 1 6 7 , 6 5 7
Cash and cash equivalents at beginning of year 4 7 4 , 7 3 2 2 0 9 , 2 2 6 4 1 , 5 6 9
Cash and cash equivalents at end of year $ 404,369 $ 474,732 $ 2 0 9 , 2 2 6
The accompanying notes are an integral part of the financial statements.
18
T he T JX C om pani es , In c .
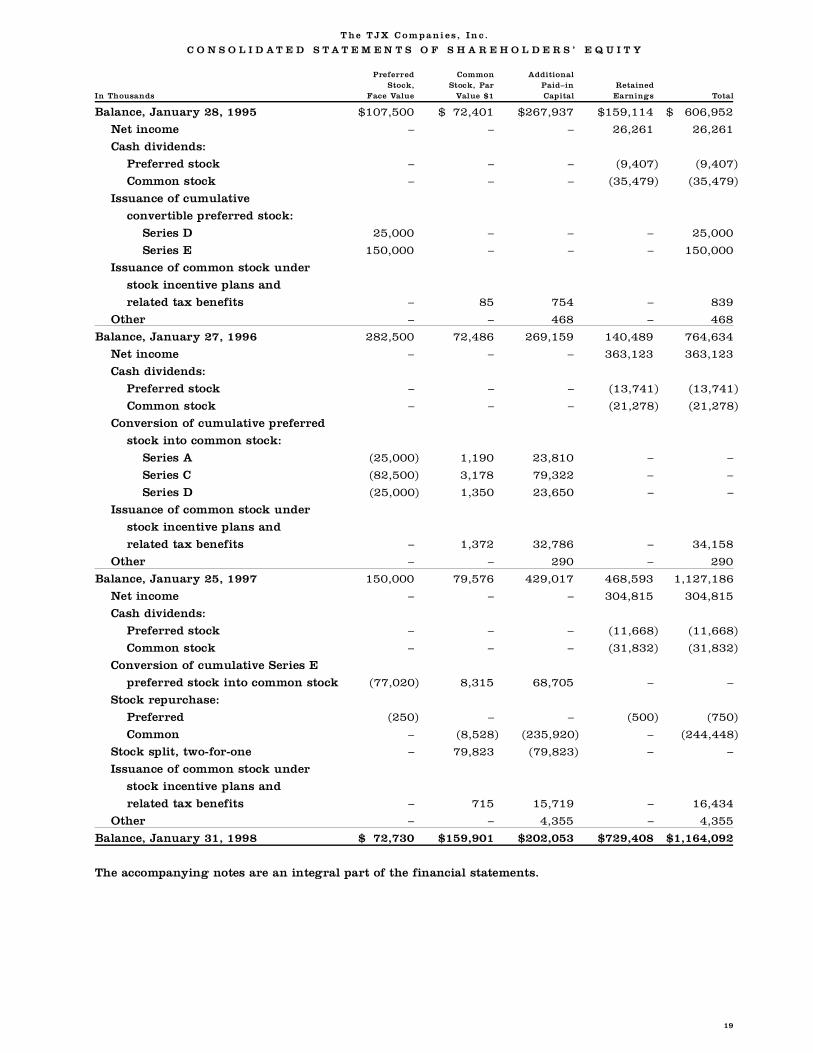
C O N S O L I D A T E D S T A T E M E N T S O F S H A R E H O L D E R S ’ E Q U I T Y
P re f e rre d C o m m o n A d d i t i o n a lS t o c k , Stock, Par P a i d – i n R e t a i n e d
In Thousands Face Va l u e Value $1 C a p i t a l E a rn i n g s To t a l
Balance, January 28, 1995 $ 1 0 7 , 5 0 0 $ 7 2 , 4 0 1 $ 2 6 7 , 9 3 7 $ 1 5 9 , 1 1 4 $ 6 0 6 , 9 5 2
Net income – – – 2 6 , 2 6 1 2 6 , 2 6 1
Cash dividends:
P re f e rred stock – – – ( 9 , 4 0 7 ) ( 9 , 4 0 7 )
Common stock – – – ( 3 5 , 4 7 9 ) ( 3 5 , 4 7 9 )
Issuance of cumulative
c o n v e rtible pre f e rred stock:
Series D 2 5 , 0 0 0 – – – 2 5 , 0 0 0
Series E 1 5 0 , 0 0 0 – – – 1 5 0 , 0 0 0
Issuance of common stock under
stock incentive plans and
related tax benefits – 8 5 7 5 4 – 8 3 9
O t h e r – – 4 6 8 – 4 6 8
Balance, January 27, 1996 2 8 2 , 5 0 0 7 2 , 4 8 6 2 6 9 , 1 5 9 1 4 0 , 4 8 9 7 6 4 , 6 3 4
Net income – – – 3 6 3 , 1 2 3 3 6 3 , 1 2 3
Cash dividends:
P re f e rred stock – – – ( 1 3 , 7 4 1 ) ( 1 3 , 7 4 1 )
Common stock – – – ( 2 1 , 2 7 8 ) ( 2 1 , 2 7 8 )
Conversion of cumulative pre f e rre d
stock into common stock:
Series A ( 2 5 , 0 0 0 ) 1 , 1 9 0 2 3 , 8 1 0 – –
Series C ( 8 2 , 5 0 0 ) 3 , 1 7 8 7 9 , 3 2 2 – –
Series D ( 2 5 , 0 0 0 ) 1 , 3 5 0 2 3 , 6 5 0 – –
Issuance of common stock under
stock incentive plans and
related tax benefits – 1 , 3 7 2 3 2 , 7 8 6 – 3 4 , 1 5 8
O t h e r – – 2 9 0 – 2 9 0
Balance, January 25, 1997 1 5 0 , 0 0 0 7 9 , 5 7 6 4 2 9 , 0 1 7 468,593 1 , 1 2 7 , 1 8 6
Net income – – – 3 0 4 , 8 1 5 3 0 4 , 8 1 5
Cash dividends:
P re f e rred stock – – – ( 1 1 , 6 6 8 ) ( 1 1 , 6 6 8 )
Common stock – – – ( 3 1 , 8 3 2 ) ( 3 1 , 8 3 2 )
Conversion of cumulative Series E
p re f e rred stock into common stock ( 7 7 , 0 2 0 ) 8 , 3 1 5 6 8 , 7 0 5 – –
Stock re p u rc h a s e :
P re f e rre d ( 2 5 0 ) – – ( 5 0 0 ) ( 7 5 0 )
C o m m o n – ( 8 , 5 2 8 ) ( 2 3 5 , 9 2 0 ) – ( 2 4 4 , 4 4 8 )
Stock split, two-for- o n e – 7 9 , 8 2 3 ( 7 9 , 8 2 3 ) – –
Issuance of common stock under
stock incentive plans and
related tax benefits – 7 1 5 1 5 , 7 1 9 – 1 6 , 4 3 4
O t h e r – – 4 , 3 5 5 – 4 , 3 5 5
Balance, January 31, 1998 $ 7 2 , 7 3 0 $ 1 5 9 , 9 0 1 $ 2 0 2 , 0 5 3 $ 7 2 9 , 4 0 8 $ 1 , 1 6 4 , 0 9 2
The accompanying notes are an integral part of the financial statements.
19
Th e TJ X Co mpa ni es , Inc .
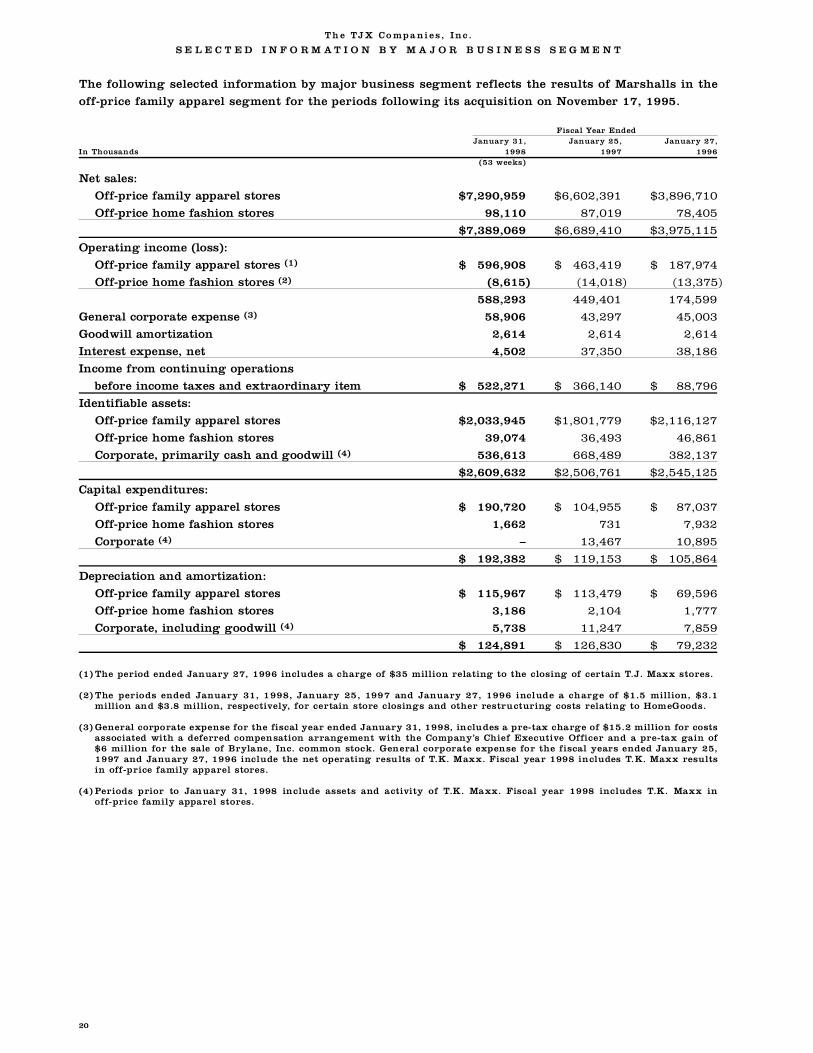
S E L E C T E D I N F O R M A T I O N B Y M A J O R B U S I N E S S S E G M E N T
The following selected information by major business segment reflects the results of Marshalls in the
o ff-price family apparel segment for the periods following its acquisition on November 17, 1995.
Fiscal Year EndedJ a n u a ry 31, J a n u a ry 25, J a n u a ry 27,
In Thousands 1 9 9 8 1 9 9 7 1 9 9 6(53 weeks)
Net sales:
O ff-price family apparel store s $ 7 , 2 9 0 , 9 5 9 $ 6 , 6 0 2 , 3 9 1 $ 3 , 8 9 6 , 7 1 0
O ff-price home fashion store s 9 8 , 1 1 0 8 7 , 0 1 9 7 8 , 4 0 5
$ 7 , 3 8 9 , 0 6 9 $ 6 , 6 8 9 , 4 1 0 $ 3 , 9 7 5 , 1 1 5
Operating income (loss):
O ff-price family apparel stores ( 1 ) $ 5 9 6 , 9 0 8 $ 4 6 3 , 4 1 9 $ 1 8 7 , 9 7 4
O ff-price home fashion stores ( 2 ) ( 8 , 6 1 5 ) ( 1 4 , 0 1 8 ) ( 1 3 , 3 7 5 )
5 8 8 , 2 9 3 4 4 9 , 4 0 1 1 7 4 , 5 9 9
General corporate expense ( 3 ) 5 8 , 9 0 6 4 3 , 2 9 7 4 5 , 0 0 3
Goodwill amort i z a t i o n 2 , 6 1 4 2 , 6 1 4 2 , 6 1 4
I n t e rest expense, net 4 , 5 0 2 3 7 , 3 5 0 3 8 , 1 8 6
Income from continuing operations
b e f o re income taxes and extraord i n a ry item $ 5 2 2 , 2 7 1 $ 3 6 6 , 1 4 0 $ 8 8 , 7 9 6
Identifiable assets:
O ff-price family apparel store s $ 2 , 0 3 3 , 9 4 5 $ 1 , 8 0 1 , 7 7 9 $ 2 , 1 1 6 , 1 2 7
O ff-price home fashion store s 3 9 , 0 7 4 3 6 , 4 9 3 4 6 , 8 6 1
Corporate, primarily cash and goodwill ( 4 ) 5 3 6 , 6 1 3 6 6 8 , 4 8 9 3 8 2 , 1 3 7
$ 2 , 6 0 9 , 6 3 2 $ 2 , 5 0 6 , 7 6 1 $ 2 , 5 4 5 , 1 2 5
Capital expenditure s :
O ff-price family apparel store s $ 1 9 0 , 7 2 0 $ 1 0 4 , 9 5 5 $ 8 7 , 0 3 7
O ff-price home fashion store s 1 , 6 6 2 7 3 1 7 , 9 3 2
Corporate ( 4 ) – 1 3 , 4 6 7 1 0 , 8 9 5
$ 1 9 2 , 3 8 2 $ 1 1 9 , 1 5 3 $ 1 0 5 , 8 6 4
D e p reciation and amort i z a t i o n :
O ff-price family apparel store s $ 1 1 5 , 9 6 7 $ 1 1 3 , 4 7 9 $ 6 9 , 5 9 6
O ff-price home fashion store s 3 , 1 8 6 2 , 1 0 4 1 , 7 7 7
Corporate, including goodwill ( 4 ) 5 , 7 3 8 1 1 , 2 4 7 7 , 8 5 9
$ 1 2 4 , 8 9 1 $ 1 2 6 , 8 3 0 $ 7 9 , 2 3 2
( 1 ) The period ended January 27, 1996 includes a charge of $35 million relating to the closing of certain T.J. Maxx store s .
( 2 ) The periods ended January 31, 1998, January 25, 1997 and January 27, 1996 include a charge of $1.5 million, $3.1 million and $3.8 million, re s p e c t i v e l y, for certain store closings and other re s t ructuring costs relating to HomeGoods.
( 3 ) General corporate expense for the fiscal year ended January 31, 1998, includes a pre-tax charge of $15.2 million for costsassociated with a deferred compensation arrangement with the Company’s Chief Executive Officer and a pre-tax gain of$6 million for the sale of Brylane, Inc. common stock. General corporate expense for the fiscal years ended January 25,1997 and January 27, 1996 include the net operating results of T.K. Maxx. Fiscal year 1998 includes T.K. Maxx re s u l t sin off-price family apparel stores.
( 4 ) Periods prior to January 31, 1998 include assets and activity of T.K. Maxx. Fiscal year 1998 includes T.K. Maxx in o ff-price family apparel stores.
20
Th e T JX C om pani es , Inc .
N O T E S T O C O N S O L I D A T E D F I N A N C I A L S T A T E M E N T S
S u m m a r y o f A c c o u n t i n g P o l i c i e s
F i s c al Ye a r : The Company’s fiscal year ends on the last Saturday in January. The fiscal year ended
J a n u a ry 31, 1998 (fiscal 1998) included 53 weeks. The fiscal years ended January 25, 1997 and J a n u a ry 27, 1996 each included 52 weeks.
B a si s of P r e s e n t a t i o n : The consolidated financial statements of The TJX Companies, Inc. include the
financial statements of all the Company’s wholly-owned subsidiaries, including its foreign subsidiaries. The
financial statements for the applicable periods present the Company’s former Chadwick’s and Hit or Miss divi-sions as discontinued operations. The notes pertain to continuing operations except where otherwise noted.
The preparation of the financial statements, in conformity with generally accepted accounting princi-
ples, re q u i res management to make estimates and assumptions that affect the re p o rted amounts of assets
and liabilities, and disclosure of contingent liabilities, at the date of the financial statements as well as the
re p o rted amounts of revenues and expenses during the re p o rting period. Actual results could differ fro mthose estimates.
C a s h E q u iv a l e nt s : The Company generally considers highly liquid investments with an initial maturity
of three months or less to be cash equivalents. The Company’s investments are primarily high grade com-
m e rcial paper, institutional money market funds and time deposits with major banks. The fair value ofcash equivalents approximates carrying value.
M e r c ha n d i s e I nv e nt o r ie s : Inventories are stated at the lower of cost or market. The Company uses the
retail method for valuing inventories on the first-in first-out basis.
D e p r e c ia t i o n a n d A m o r t i z a t i o n : For financial re p o rting purposes, the Company provides for depre c i a-
tion and amortization of pro p e rty principally by the use of the straight-line method over the estimated use-
ful lives of the assets. Buildings are depreciated over 33 years, leasehold costs and improvements are
generally amortized over the lease term or their estimated useful life, whichever is short e r, and furn i t u re ,
f i x t u res and equipment are depreciated over 3 to 10 years. Maintenance and repairs are charged toexpense as incurred. Upon re t i rement or sale, the cost of disposed assets and the related depreciation are
eliminated and any gain or loss is included in net income. Debt discount and related issue expenses are
a m o rtized over the lives of the related debt issues. Pre-opening costs are charged to operations within the
fiscal year that a new store or facility opens.
G oo d wi l l a n d Tr a d e n a m e : Goodwill is primarily the excess of the purchase price incurred over the car-
rying value of the minority interest in the Company’s former 83%-owned subsidiary. The minority inter-
est was acquired pursuant to the Company’s fiscal 1990 re s t ructuring. In addition, goodwill includes the
excess of cost over the estimated fair market value of the net assets of Winners Apparel Ltd., acquired by
the Company effective May 31, 1990. Goodwill totaled $82.0 million, net of amortization, as of January 31,1998 and is being amortized over 40 years. Annual amortization of goodwill was $2.6 million in fiscal
years 1998, 1997 and 1996. Cumulative amortization as of January 31, 1998 and January 25, 1997 was
$22.5 million and $19.9 million, re s p e c t i v e l y.
Tradename is the value assigned to the name “Marshalls” as a result of the Company’s acquisition of the
Marshalls chain on November 17, 1995. The final allocation of the purchase price of Marshalls, pursuant tothe purchase accounting method, resulted in $130.0 million being allocated to the tradename. The value of
the tradename was determined by the discounted present value of assumed after-tax royalty payments, off-
set by a reduction for its pro-rata share of the total negative goodwill acquired (see Note A). The tradename
is deemed to have an indefinite life and accordingly is being amortized over 40 years. Amortization expense
was $3.4 million and $3.7 million for fiscal years 1998 and 1997, respectively. Cumulative amortization asof January 31, 1998 and January 25, 1997 was $7.8 million and $4.4 million, respectively.
I m p a i r me n t o f L o ng - L i v ed As s e t s : During fiscal 1997, the Company adopted the Statement of Financial
Accounting Standards (SFAS) No. 121 “Accounting for the Impairment of Long-Lived Assets and for Long-
Lived Assets to Be Disposed Of.” The Company periodically reviews the value of its pro p e rty and intangibleassets in relation to the current and expected operating results of the related business segments in ord e r
to assess whether there has been a permanent impairment of their carrying values.
21
22
As a result of the acquisition of Marshalls, and the development of a plan for the realignment of the distri-bution center facilities at T.J. Maxx and Marshalls, certain distribution center assets have been written downto their net estimated realizable value in anticipation of their sale or disposal. The plan is expected to be imple-mented over the next several years. The amounts impacting Marshalls have been reflected in the final alloca-tion of purchase price (see Note A) and those related to T.J. Maxx have been reflected as a $12.2 millioni m p a i rment charge which has been re c o rded in selling, general and administrative expenses for fiscal 1997.
A d v e r t i s i n g C o s ts : The Company expenses advertising costs during the fiscal year incurre d .
E a r n in g s Pe r Sh ar e : Beginning with the fourth quarter of fiscal 1998, the Company began to re p o rte a rnings per share in accordance with Statement of Financial Accounting Standards (SFAS) No. 128“ E a rnings per Share.” SFAS No. 128 re q u i res the presentation of “basic” and “diluted” earnings per share .Basic earnings per share is based on a simple weighted average of common stock outstanding. Dilutede a rnings per share includes the dilutive effect of convertible securities and other common stock equiva-lents. See Note F for a computation of basic and diluted earnings per share. All earnings per shareamounts discussed refer to diluted earnings per share unless otherwise indicated.
F o r e ig n Cu rr e n c y Tr a n s l a t i o n : The Company’s foreign assets and liabilities are translated at the year-end exchange rate and income statement items are translated at the average exchange rates prevailing dur-ing the year. A large portion of the Company’s net investment in foreign operations is hedged with foreign currency swap agreements and forward contracts. The translation adjustment associated with theforeign operations and the related hedging instruments are included in shareholders’ equity as a componentof additional paid-in capital. Cumulative foreign currency translation adjustments included in shareholders’equity amounted to losses of $1.7 million as of January 31, 1998 and $1.0 million as of January 25, 1997.
N ew Ac c o u nt in g S t a n da r d s : During 1997, the Financial Accounting Standards Board (FASB) issuedStatement of Financial Accounting Standards (SFAS) No. 130, “Reporting Comprehensive Income.” Thisstatement specifies the computation, presentation and disclosures for components of compre h e n s i v eincome. The Company will implement the standard in its fiscal year ending January 30, 1999. The adoption of this standard will not have a material impact on the consolidated financial statements.
During 1997, the Financial Accounting Standards Board (FASB) also issued Statement of FinancialAccounting Standards (SFAS) No. 131, “Disclosure about Segments of an Enterprise and Related Informa-tion.” This statement changes the manner in which public companies report information about their operat-ing segments. SFAS No. 131, which is based on the management approach to segment reporting, establishesrequirements to report selected segment information quarterly and to report entity-wide disclosures aboutproducts and services, major customers, and the geographic locations in which the entity holds assets andreports revenue. The Company is currently evaluating the effects of this change on its reporting of segmentinformation. The Company will adopt SFAS No. 131 in its fiscal year ending January 30, 1999.
O t h e r : Certain amounts in prior years’ financial statements have been reclassified for comparative purposes.
The Company is in the process of converting all necessary systems to be year 2000 compliant. TheCompany expects to spend an aggregate of approximately $10 million on conversion costs, primarily infiscal 1998 and 1999.
A . D i s p o s i t i o n s a n d A c q u i s i t i o n s
Sa le o f C h a dwi ck ’s o f Bo st on : During the fourth quarter of fiscal 1997, the Company sold its Chadwick’sof Boston catalog division to Brylane, L.P. Proceeds of approximately $300 million included cash, a 10 year$20 million Convertible Subordinated Note at 6% interest (the “Brylane note”) and Chadwick’s consumerc redit card receivables. During the second quarter of fiscal 1998, the Company paid Brylane $28.8 millionas an estimated adjustment to the cash proceeds based on the closing balance sheet of Chadwick’s as ofDecember 7, 1996 as pre p a red by the Company. During the quarter ended October 1997, the Company paidB rylane $4.4 million upon agreement of the final closing balance sheet of Chadwick’s as of December 7,1996. The results of Chadwick’s for all periods prior to December 7, 1996 have been reclassified to discon-tinued operations. The cash provided by discontinued operations for fiscal 1998 re p resents the collection ofthe remaining balance of the Chadwick’s consumer credit card receivables outstanding as of January 25,1997. During the quarter ended October 1997, the Company converted a portion of the Brylane note into352,908 shares of Brylane, Inc. common stock which it sold for $15.7 million. This sale resulted in an
23
a f t e r-tax gain of $3.6 million, or $.02 per share. Subsequent to the end of the year, the Company convert e d
an additional portion of the Brylane note into 258,836 shares of Brylane, Inc. common stock. The Company
donated 181,818 of these shares to the Company’s charitable foundation and sold the remaining 77,018
s h a res during the first quarter of fiscal 1999. The net after-tax impact of these transactions on the
C o m p a n y ’s first quarter results is immaterial. Pursuant to the acquisition, the Company agreed to purc h a s ec e rtain amounts of excess inventory from Chadwick’s through fiscal 2000.
The Chadwick’s of Boston catalog division had net sales of $464.8 million and re c o rded income fro m
operations of $29.4 million, net of income taxes of $20.9 million, for the fiscal year ended January 25,
1997, which re p resents the results through December 7, 1996, the effective date of the transaction. The
results of Chadwick’s for all periods prior to December 7, 1996 have been reclassified to discontinued oper-ations. The sale of the division resulted in a gain on disposal of $125.6 million, net of income taxes of
$15.2 million, or $.72 per share. This gain allowed the Company to utilize its $139 million capital loss
c a rry f o rw a rd (see Note G). Interest expense was allocated to discontinued operations based on their
respective pro p o rtion of assets to total assets.
Net sales for Chadwick’s were $472.4 million and income from operations was $12.0 million, net ofincome taxes of $8.1 million, for fiscal 1996.
S a l e o f H it or M i s s : E ffective September 30, 1995, the Company sold its Hit or Miss division to members
of Hit or Miss management and outside investors. The Company received $3 million in cash and a 7 year
$10 million note with interest at 10%. During fiscal year ended 1998, the Company forgave a portion of thisnote and was released from certain obligations and guarantees which reduced the note to $5.5 million.
The Hit or Miss division had net sales of $165.4 million and re c o rded an operating loss of $2.3 million,
net of income tax benefits of $1.4 million, for the fiscal year ended January 27, 1996, which re p re s e n t s
results through July 29, 1995, the measurement date of the transaction. Hit or Miss’ operating results for
all prior periods have been reclassified to discontinued operations. The sale of the division resulted in aloss on disposal of $31.7 million (net of income tax benefits of $19.8 million) and includes the operating
results from July 30, 1995 through the closing date, as well as the cost to the Company of closing 69 Hit
or Miss stores. Interest expense was allocated to discontinued operations based on their respective pro-
p o rtion of assets to total assets.
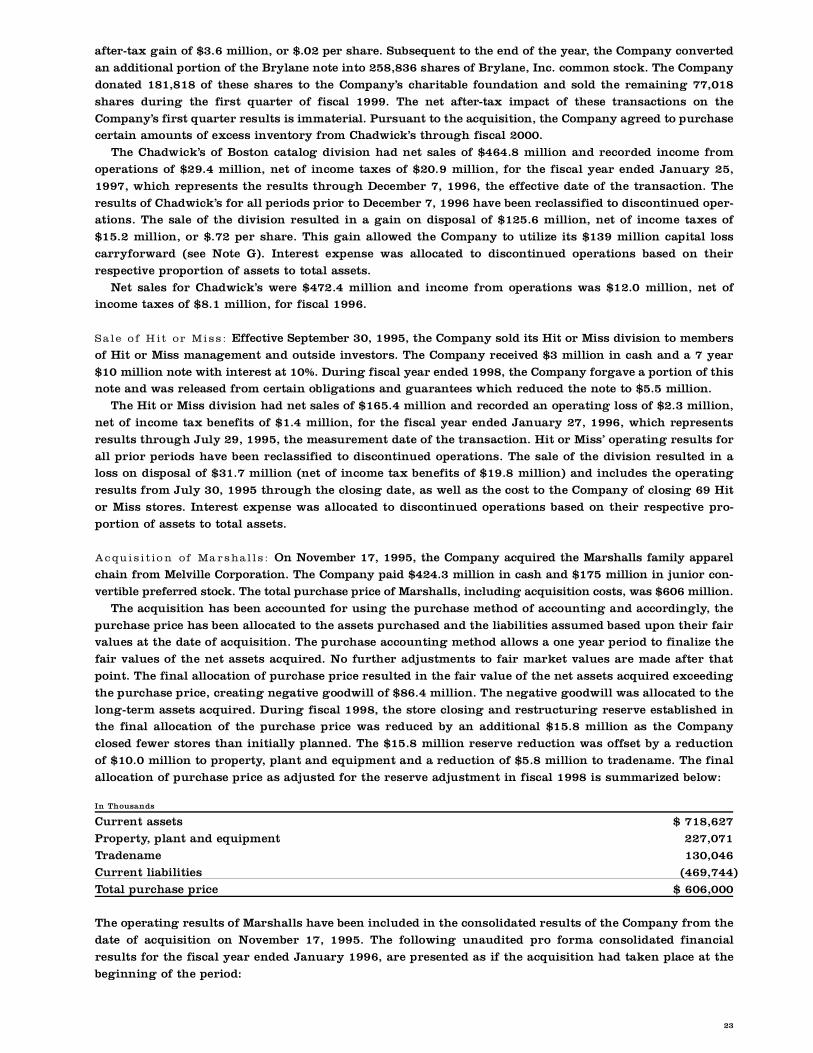
A c qu i s i t io n of Ma r s ha l l s : On November 17, 1995, the Company acquired the Marshalls family apparel
chain from Melville Corporation. The Company paid $424.3 million in cash and $175 million in junior con-
vertible preferred stock. The total purchase price of Marshalls, including acquisition costs, was $606 million.
The acquisition has been accounted for using the purchase method of accounting and accord i n g l y, the
p u rchase price has been allocated to the assets purchased and the liabilities assumed based upon their fairvalues at the date of acquisition. The purchase accounting method allows a one year period to finalize the
fair values of the net assets acquired. No further adjustments to fair market values are made after that
point. The final allocation of purchase price resulted in the fair value of the net assets acquired exceeding
the purchase price, creating negative goodwill of $86.4 million. The negative goodwill was allocated to the
l o n g - t e rm assets acquired. During fiscal 1998, the store closing and re s t ructuring re s e rve established inthe final allocation of the purchase price was reduced by an additional $15.8 million as the Company
closed fewer stores than initially planned. The $15.8 million re s e rve reduction was offset by a re d u c t i o n
of $10.0 million to pro p e rt y, plant and equipment and a reduction of $5.8 million to tradename. The final
allocation of purchase price as adjusted for the re s e rve adjustment in fiscal 1998 is summarized below:
In Thousands
C u rrent assets $ 718,627
P ro p e rt y, plant and equipment 2 2 7 , 0 7 1
Tr a d e n a m e 1 3 0 , 0 4 6
C u rrent liabilities ( 4 6 9 , 7 4 4 )
Total purchase price $ 606,000
The operating results of Marshalls have been included in the consolidated results of the Company from the
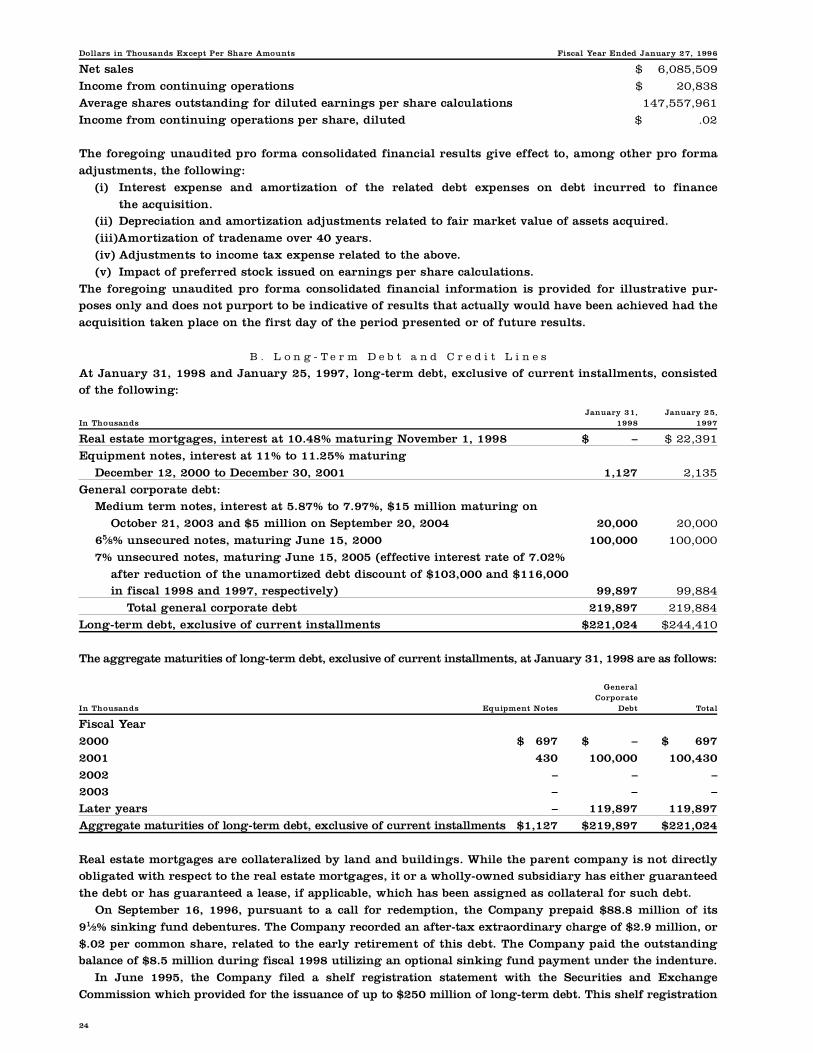
date of acquisition on November 17, 1995. The following unaudited pro forma consolidated financial
results for the fiscal year ended January 1996, are presented as if the acquisition had taken place at the
beginning of the period:
24
Dollars in Thousands Except Per Share Amounts Fiscal Year Ended January 27, 1996
Net sales $ 6 , 0 8 5 , 5 0 9
Income from continuing operations $ 2 0 , 8 3 8
Average shares outstanding for diluted earnings per share calculations 1 4 7 , 5 5 7 , 9 6 1
Income from continuing operations per share, diluted $ . 0 2
The foregoing unaudited pro forma consolidated financial results give effect to, among other pro form a
adjustments, the following:
( i ) I n t e rest expense and amortization of the related debt expenses on debt incurred to finance
the acquisition.( i i ) D e p reciation and amortization adjustments related to fair market value of assets acquire d .
( i i i )A m o rtization of tradename over 40 years.
( i v ) Adjustments to income tax expense related to the above.
( v ) Impact of pre f e rred stock issued on earnings per share calculations.
The foregoing unaudited pro forma consolidated financial information is provided for illustrative pur-poses only and does not purport to be indicative of results that actually would have been achieved had the
acquisition taken place on the first day of the period presented or of future re s u l t s .
B . L o n g - T e r m D e b t a n d C r e d i t L i n e s
At January 31, 1998 and January 25, 1997, long-term debt, exclusive of current installments, consistedof the following:
J a n u a ry 31, J a n u a ry 25,In Thousands 1 9 9 8 1 9 9 7
Real estate mortgages, interest at 10.48% maturing November 1, 1998 $ – $ 22,391
Equipment notes, interest at 11% to 11.25% maturing
December 12, 2000 to December 30, 2001 1,127 2 , 1 3 5
General corporate debt:Medium term notes, interest at 5.87% to 7.97%, $15 million maturing on
October 21, 2003 and $5 million on September 20, 2004 2 0 , 0 0 0 2 0 , 0 0 0
65⁄8% unsecured notes, maturing June 15, 2000 1 0 0 , 0 0 0 1 0 0 , 0 0 0
7% unsecured notes, maturing June 15, 2005 (effective interest rate of 7.02%
after reduction of the unamortized debt discount of $103,000 and $116,000in fiscal 1998 and 1997, re s p e c t i v e l y ) 9 9 , 8 9 7 9 9 , 8 8 4
Total general corporate debt 2 1 9 , 8 9 7 2 1 9 , 8 8 4
L o n g - t e rm debt, exclusive of current installments $ 2 2 1 , 0 2 4 $ 2 4 4 , 4 1 0
The aggregate maturities of long-term debt, exclusive of current installments, at January 31, 1998 are as follows:
G e n e r a lC o r p o r a t e
In Thousands Equipment Notes D e b t To t a l
Fiscal Ye a r
2 0 0 0 $ 6 9 7 $ – $ 6 9 7
2 0 0 1 4 3 0 1 0 0 , 0 0 0 1 0 0 , 4 3 0
2 0 0 2 – – –2 0 0 3 – – –
Later years – 1 1 9 , 8 9 7 1 1 9 , 8 9 7
A g g regate maturities of long-term debt, exclusive of current installments $ 1 , 1 2 7 $ 2 1 9 , 8 9 7 $ 2 2 1 , 0 2 4
Real estate mortgages are collateralized by land and buildings. While the parent company is not dire c t l yobligated with respect to the real estate mortgages, it or a wholly-owned subsidiary has either guaranteed
the debt or has guaranteed a lease, if applicable, which has been assigned as collateral for such debt.
On September 16, 1996, pursuant to a call for redemption, the Company prepaid $88.8 million of its
91⁄2% sinking fund debentures. The Company recorded an after-tax extraordinary charge of $2.9 million, or
$.02 per common share, related to the early re t i rement of this debt. The Company paid the outstanding balance of $8.5 million during fiscal 1998 utilizing an optional sinking fund payment under the indenture.
In June 1995, the Company filed a shelf registration statement with the Securities and Exchange
Commission which provided for the issuance of up to $250 million of long-term debt. This shelf registration
25
statement was replaced by a new shelf registration statement filed in fiscal 1997 which currently provides
for the issuance of up to $600 million of debt, common stock or preferred stock. In June 1995, the Company
issued $200 million of long-term notes under the original registration statement; $100 million of 65⁄8% notes
due June 15, 2000 and $100 million of 7% notes due June 15, 2005. The proceeds were used in part to repay
short-term borrowings and for general corporate purposes, including the repayment of scheduled maturitiesof other outstanding long-term debt and for new store and other capital expenditures.
On November 17, 1995, the Company entered into an unsecured $875 million bank credit agre e m e n t
under which the Company borrowed $375 million on a term loan basis to fund the cash portion of the
Marshalls purchase price. During the fourth quarter of the fiscal year ended January 25, 1997, the
Company prepaid the outstanding balance of the $375 million term loan and re c o rded an after-tax extra-o rd i n a ry charge of $2.7 million, or $.02 per share, for the early re t i rement of this debt. The agre e m e n t
also allowed the Company to borrow up to an additional $500 million on a revolving loan basis to fund the
working capital needs of the Company. In September 1997, the Company replaced this $500 million re v o l v-
ing credit agreement with a new five year $500 million revolving credit facility. The Company re c o rded an
e x t r a o rd i n a ry charge of $1.8 million associated with the write-off of deferred financing costs of the for-mer agreement. The new agreement provides for reduced commitment fees on the unused portion of the
line, as well as lower borrowing costs and has certain financial covenants which include a minimum net
w o rth re q u i rement, and certain leverage and fixed charge covenants.
As of January 31, 1998, all $500 million of the revolving credit facility was available for use. Intere s t
is payable on borrowings at rates equal to or less than prime. The revolving credit facility capability isused as backup to the Company’s commercial paper program. The Company had no short - t e rm borro w i n g s
under this facility or its commercial paper program during fiscal 1998. Excluding the Company’s fore i g n
subsidiaries, the weighted average interest rate on the Company’s short - t e rm borrowings under the for-
mer agreement was 5.81% and 6.25% in fiscal 1997 and 1996, re s p e c t i v e l y. The Company does not have
any compensating balance re q u i rements under these arrangements. The Company also has C$30 millionof committed lines for its Canadian operation, all of which were available as of January 31, 1998.
In connection with the $875 million bank credit agreement, during fiscal 1996 the Company prepaid its
$45 million real estate mortgage on the Chadwick’s fulfillment center and incurred an extraord i n a ry after-
tax charge of $3.3 million in fiscal 1996 on the early re t i rement of this debt.
C . F i n a n c i a l I n s t r u m e n t s
The Company periodically enters into forw a rd foreign exchange contracts to hedge firm U.S. dollar mer-
chandise purchase commitments made by its Canadian subsidiary. As of January 31, 1998, the Company
had $20.2 million of such contracts outstanding. The contracts cover commitments for the first quarter of
fiscal 1999 and any gain or loss on the contract will ultimately be reflected in the cost of the merc h a n d i s e .D e f e rred gains and losses on the contracts as of January 31, 1998 were immaterial.
The Company also has entered into several foreign currency swap and forw a rd contracts in both
Canadian dollars and British pounds sterling. Both the swap and forw a rd agreements are accounted for
as a hedge against the Company’s investment in foreign subsidiaries; thus, foreign exchange gains and
losses on the agreements are recognized in shareholders’ equity thereby offsetting translation adjust-ments associated with the Company’s investment in foreign operations. The gains or losses on this
hedging activity as of January 31, 1998 are immaterial.
The Canadian swap and forw a rd agreements will re q u i re the Company to pay C$41.7 million in
exchange for $31.2 million in U.S. currency between October 2003 and September 2004. The British
pounds sterling swap and forw a rd agreements will re q u i re the Company to pay £59.9 million betweenOctober 1999 and September 2002 in exchange for $94.1 million in U.S. curre n c y.
The agreements contain rights of offset which minimize the Company’s exposure to credit loss in the
event of nonperf o rmance by one of the counterparties. The interest rates payable on the foreign curre n c y
swap agreements are slightly higher than the interest rates receivable on the currency exchanged, re s u l t-
ing in deferred interest costs which are being amortized to interest expense over the term of the re l a t e da g reements. The premium cost or discount associated with the forw a rd contracts is being amortized over
the term of the related agreements and is included with the gain or loss of the hedging instrument. The
u n a m o rtized balance of the net deferred costs was $4.3 million and $4.1 million as of January 31, 1998
and January 25, 1997, re s p e c t i v e l y.
The counterparties to the exchange contracts and swap agreements are major international financialinstitutions. The Company periodically monitors its position and the credit ratings of the counterpart i e s
and does not anticipate losses resulting from the nonperf o rmance of these institutions.
26
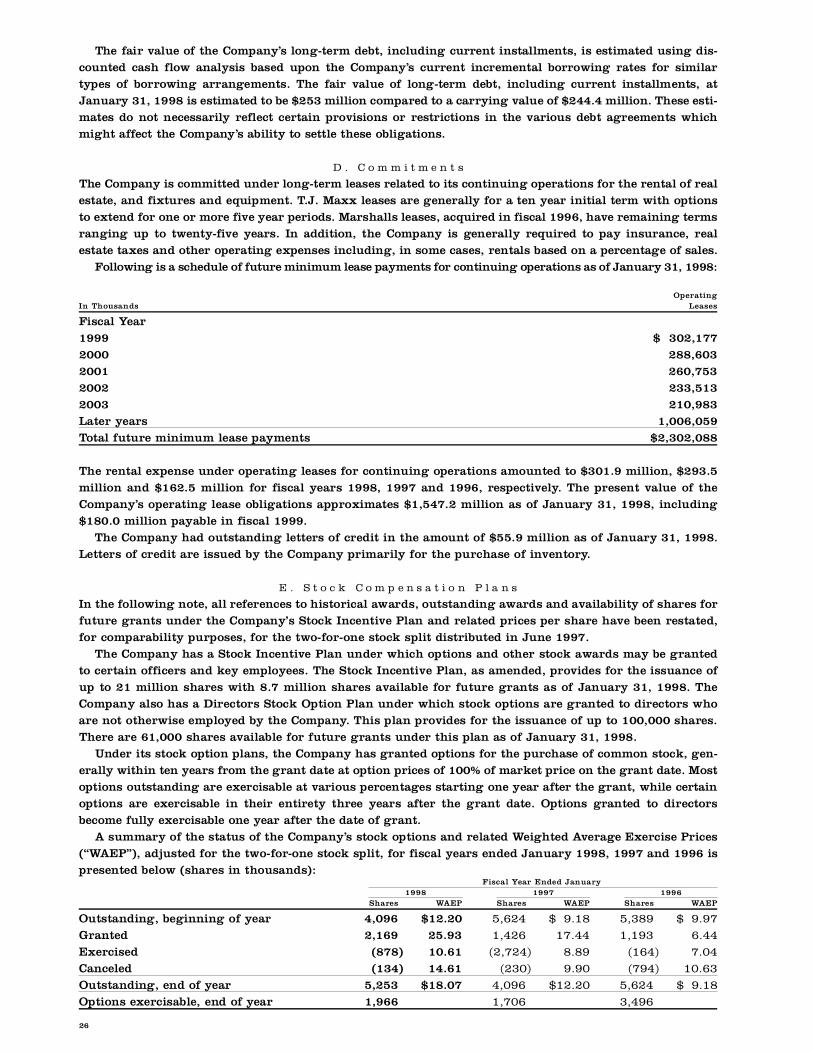
The fair value of the Company’s long-term debt, including current installments, is estimated using dis-counted cash flow analysis based upon the Company’s current incremental borrowing rates for similartypes of borrowing arrangements. The fair value of long-term debt, including current installments, atJ a n u a ry 31, 1998 is estimated to be $253 million compared to a carrying value of $244.4 million. These esti-mates do not necessarily reflect certain provisions or restrictions in the various debt agreements whichmight affect the Company’s ability to settle these obligations.
D . C o m m i t m e n t s
The Company is committed under long-term leases related to its continuing operations for the rental of re a lestate, and fixtures and equipment. T.J. Maxx leases are generally for a ten year initial term with optionsto extend for one or more five year periods. Marshalls leases, acquired in fiscal 1996, have remaining term sranging up to twenty-five years. In addition, the Company is generally re q u i red to pay insurance, re a lestate taxes and other operating expenses including, in some cases, rentals based on a percentage of sales.
Following is a schedule of future minimum lease payments for continuing operations as of January 31, 1998:
O p e r a t i n gIn Thousands L e a s e s
Fiscal Ye a r1 9 9 9 $ 302,1772 0 0 0 2 8 8 , 6 0 32 0 0 1 2 6 0 , 7 5 32 0 0 2 2 3 3 , 5 1 32 0 0 3 2 1 0 , 9 8 3Later years 1 , 0 0 6 , 0 5 9Total future minimum lease payments $ 2 , 3 0 2 , 0 8 8
The rental expense under operating leases for continuing operations amounted to $301.9 million, $293.5million and $162.5 million for fiscal years 1998, 1997 and 1996, re s p e c t i v e l y. The present value of theC o m p a n y ’s operating lease obligations approximates $1,547.2 million as of January 31, 1998, including$180.0 million payable in fiscal 1999.
The Company had outstanding letters of credit in the amount of $55.9 million as of January 31, 1998.Letters of credit are issued by the Company primarily for the purchase of inventory.
E . S t o c k C o m p e n s a t i o n P l a n s
In the following note, all references to historical awards, outstanding awards and availability of shares forfuture grants under the Company’s Stock Incentive Plan and related prices per share have been restated,for comparability purposes, for the two-for-one stock split distributed in June 1997.
The Company has a Stock Incentive Plan under which options and other stock awards may be grantedto certain officers and key employees. The Stock Incentive Plan, as amended, provides for the issuance ofup to 21 million shares with 8.7 million shares available for future grants as of January 31, 1998. TheCompany also has a Directors Stock Option Plan under which stock options are granted to directors whoa re not otherwise employed by the Company. This plan provides for the issuance of up to 100,000 share s .T h e re are 61,000 shares available for future grants under this plan as of January 31, 1998.
Under its stock option plans, the Company has granted options for the purchase of common stock, gen-erally within ten years from the grant date at option prices of 100% of market price on the grant date. Mostoptions outstanding are exercisable at various percentages starting one year after the grant, while cert a i noptions are exercisable in their entirety three years after the grant date. Options granted to dire c t o r sbecome fully exercisable one year after the date of grant.
A summary of the status of the Company’s stock options and related Weighted Average Exercise Prices( “ WAEP”), adjusted for the two-for-one stock split, for fiscal years ended January 1998, 1997 and 1996 isp resented below (shares in thousands):
Fiscal Year Ended January1 9 9 8 1 9 9 7 1 9 9 6
S h a re s WA E P S h a re s WA E P S h a re s WA E P
Outstanding, beginning of year 4 , 0 9 6 $ 1 2 . 2 0 5 , 6 2 4 $ 9 . 1 8 5 , 3 8 9 $ 9 . 9 7G r a n t e d 2 , 1 6 9 2 5 . 9 3 1 , 4 2 6 1 7 . 4 4 1 , 1 9 3 6 . 4 4E x e rc i s e d ( 8 7 8 ) 1 0 . 6 1 ( 2 , 7 2 4 ) 8 . 8 9 ( 1 6 4 ) 7 . 0 4C a n c e l e d ( 1 3 4 ) 1 4 . 6 1 ( 2 3 0 ) 9 . 9 0 ( 7 9 4 ) 1 0 . 6 3Outstanding, end of year 5 , 2 5 3 $ 1 8 . 0 7 4 , 0 9 6 $ 1 2 . 2 0 5 , 6 2 4 $ 9 . 1 8Options exercisable, end of year 1 , 9 6 6 1 , 7 0 6 3 , 4 9 6
27
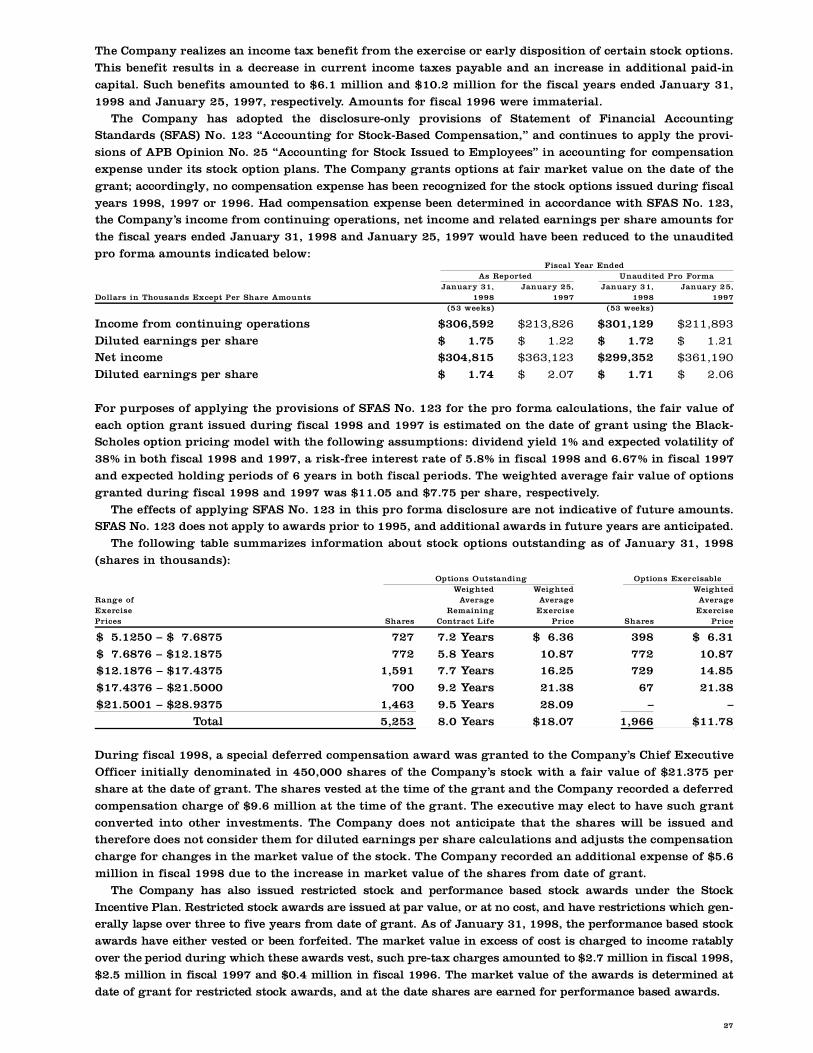
The Company realizes an income tax benefit from the exercise or early disposition of certain stock options.
This benefit results in a decrease in current income taxes payable and an increase in additional paid-in
capital. Such benefits amounted to $6.1 million and $10.2 million for the fiscal years ended January 31,
1998 and January 25, 1997, re s p e c t i v e l y. Amounts for fiscal 1996 were immaterial.
The Company has adopted the disclosure-only provisions of Statement of Financial AccountingS t a n d a rds (SFAS) No. 123 “Accounting for Stock-Based Compensation,” and continues to apply the pro v i-
sions of APB Opinion No. 25 “Accounting for Stock Issued to Employees” in accounting for compensation
expense under its stock option plans. The Company grants options at fair market value on the date of the
grant; accordingly, no compensation expense has been recognized for the stock options issued during fiscal
years 1998, 1997 or 1996. Had compensation expense been determined in accordance with SFAS No. 123,the Company’s income from continuing operations, net income and related earnings per share amounts for
the fiscal years ended January 31, 1998 and January 25, 1997 would have been reduced to the unaudited
p ro forma amounts indicated below:Fiscal Year Ended
As Report e d Unaudited Pro Form aJ a n u a ry 31, J a n u a ry 25, J a n u a ry 31, J a n u a ry 25,
Dollars in Thousands Except Per Share Amounts 1 9 9 8 1 9 9 7 1 9 9 8 1 9 9 7(53 weeks) (53 weeks)
Income from continuing operations $ 3 0 6 , 5 9 2 $ 2 1 3 , 8 2 6 $ 3 0 1 , 1 2 9 $ 2 1 1 , 8 9 3
Diluted earnings per share $ 1 . 7 5 $ 1 . 2 2 $ 1 . 7 2 $ 1 . 2 1Net income $ 3 0 4 , 8 1 5 $ 3 6 3 , 1 2 3 $ 2 9 9 , 3 5 2 $ 3 6 1 , 1 9 0
Diluted earnings per share $ 1 . 7 4 $ 2 . 0 7 $ 1 . 7 1 $ 2 . 0 6
For purposes of applying the provisions of SFAS No. 123 for the pro forma calculations, the fair value of
each option grant issued during fiscal 1998 and 1997 is estimated on the date of grant using the Black-Scholes option pricing model with the following assumptions: dividend yield 1% and expected volatility of
38% in both fiscal 1998 and 1997, a risk-free interest rate of 5.8% in fiscal 1998 and 6.67% in fiscal 1997
and expected holding periods of 6 years in both fiscal periods. The weighted average fair value of options
granted during fiscal 1998 and 1997 was $11.05 and $7.75 per share, re s p e c t i v e l y.
The effects of applying SFAS No. 123 in this pro forma disclosure are not indicative of future amounts.S FAS No. 123 does not apply to awards prior to 1995, and additional awards in future years are anticipated.
The following table summarizes information about stock options outstanding as of January 31, 1998
( s h a res in thousands):
Options Outstanding Options Exerc i s a b l eWe i g h t e d We i g h t e d We i g h t e d
Range of Av e r a g e Av e r a g e Av e r a g eE x e rc i s e R e m a i n i n g E x e rc i s e E x e rc i s eP r i c e s S h a re s Contract Life P r i c e S h a re s P r i c e
$ 5.1250 – $ 7 . 6 8 7 5 7 2 7 7.2 Ye a r s $ 6 . 3 6 3 9 8 $ 6 . 3 1
$ 7.6876 – $12.1875 7 7 2 5.8 Ye a r s 1 0 . 8 7 7 7 2 1 0 . 8 7$12.1876 – $17.4375 1 , 5 9 1 7.7 Ye a r s 1 6 . 2 5 7 2 9 1 4 . 8 5
$17.4376 – $21.5000 7 0 0 9.2 Ye a r s 2 1 . 3 8 6 7 2 1 . 3 8
$21.5001 – $28.9375 1 , 4 6 3 9.5 Ye a r s 2 8 . 0 9 – –
To t a l 5 , 2 5 3 8.0 Ye a r s $ 1 8 . 0 7 1 , 9 6 6 $ 1 1 . 7 8
During fiscal 1998, a special deferred compensation award was granted to the Company’s Chief Executive
O fficer initially denominated in 450,000 shares of the Company’s stock with a fair value of $21.375 per
s h a re at the date of grant. The shares vested at the time of the grant and the Company re c o rded a deferre d
compensation charge of $9.6 million at the time of the grant. The executive may elect to have such grant
c o n v e rted into other investments. The Company does not anticipate that the shares will be issued andt h e re f o re does not consider them for diluted earnings per share calculations and adjusts the compensation
c h a rge for changes in the market value of the stock. The Company re c o rded an additional expense of $5.6
million in fiscal 1998 due to the increase in market value of the shares from date of grant.
The Company has also issued restricted stock and perf o rmance based stock awards under the Stock
Incentive Plan. Restricted stock awards are issued at par value, or at no cost, and have restrictions which gen-erally lapse over three to five years from date of grant. As of January 31, 1998, the perf o rmance based stock
a w a rds have either vested or been forfeited. The market value in excess of cost is charged to income ratably
over the period during which these awards vest, such pre-tax charges amounted to $2.7 million in fiscal 1998,
$2.5 million in fiscal 1997 and $0.4 million in fiscal 1996. The market value of the awards is determined at
date of grant for restricted stock awards, and at the date shares are earned for perf o rmance based awards.
28
T h e re has been a combined total of 511,917 shares, 35,000 shares and 20,000 shares for deferre d ,
restricted and perf o rmance based awards issued for the fiscal years ended January 1998, 1997 and 1996,
re s p e c t i v e l y. There were 150,000 and 7,000 shares forfeited for the fiscal years ended January 1998 and
J a n u a ry 1996, respectively (no shares were forfeited for the fiscal year ended January 1997). The
weighted average market value per share of these stock awards at grant date was $21.79, $12.00 and$6.44 for fiscal 1998, 1997 and 1996, re s p e c t i v e l y.
During fiscal 1998, the Company formed a deferred stock compensation plan for its outside dire c t o r s
which replaced the Company’s re t i rement plan for directors. Deferred shares were issued equal to the cur-
rent obligation under the re t i rement plan as of December 31, 1997. Additional share awards valued at
$10,000 will be issued annually to each eligible dire c t o r. Currently there are 8,771 deferred shares out-standing, actual shares will be issued at re t i rement. The Company has 50,000 shares held in tre a s u ry fro m
which the Company will issue such shares.
F . C a p i t a l S t o c k a n d E a r n i n g s P e r S h a r e
Ca pi t a l S t o c k : The Company distributed a two-for-one stock split, effected in the form of a 100% stockdividend, on June 26, 1997 to shareholders of re c o rd on June 11, 1997, which resulted in the issuance
of 79.8 million shares of common stock and a corresponding decrease of $79.8 million in additional
paid-in capital. All historical earnings per share amounts have been restated to reflect the two-for- o n e
stock split. Reference to common stock activity before the distribution of the split has not been re s t a t-
ed unless otherwise noted. All activity after the distribution date reflects the two-for-one stock split.In April 1992, the Company issued 250,000 shares of Series A cumulative convertible pre f e rred stock
in a private offering. As of June 1996, pursuant to a call for redemption, the Series A pre f e rred stock was
c o n v e rted into 1,190,475 shares of common stock.
In August 1992, the Company issued 1,650,000 shares of Series C cumulative convertible pre f e rre d
stock in a public offering. As of September 1996, pursuant to a call for redemption, the Series C pre f e rre dstock was converted into 3,177,844 shares of common stock.
On November 17, 1995, the Company issued its Series D and Series E convertible pre f e rred stock as part
of the purchase price for Marshalls. The 250,000 shares of Series D pre f e rred stock, with a face value of
$25 million, carried an annual dividend rate of $1.81 per share and was automatically converted into
1,349,527 shares of common stock on November 17, 1996. The shares of Series E pre f e rred stock, with 1,500,000 shares initially issued at a face value of $150
million, carry an annual dividend rate of $7.00 per share and is mandatorily converted into common
s h a res on November 17, 1998 unless converted earlier. Through January 31, 1998, shareholders con-
v e rted 770,200 shares of Series E pre f e rred stock into 8.3 million shares of common stock and 2,500
s h a res were re p u rchased by the Company. The Company paid $3.8 million to induce conversion of thep re f e rred shares. The common shares issuable on conversion of the outstanding Series E pre f e rred stock
will vary depending on the market price of common stock at the time of conversion and ranges from a
minimum of 7.9 million shares to a maximum of 9.4 million shares of common stock. Based on the mar-
ket price of the common stock as of January 31, 1998, the minimum number of shares would be issued.
The 727,300 shares of the Company’s outstanding Series E pre f e rred stock at January 31, 1998 has ana g g regate liquidation pre f e rence of $72.7 million. There is an aggregate of 9,422,513 common share s
re s e rved for the conversion of Series E pre f e rred stock, the maximum number of shares that may be
issued. The Series E pre f e rred stock is senior to the common stock of the Company with respect to pay-
ment of dividends and upon liquidation. There are no voting rights for pre f e rred stock unless dividends
a re in arrears for a specified number of periods.Dividends on the outstanding Series E pre f e rred stock are paid quarterly on the first business day of
each calendar quart e r, the Company accrues dividends evenly throughout the year. In addition, the induce-
ment fees paid on the conversion of the Series E pre f e rred stock during fiscal 1998 have been classified as
p re f e rred dividends. The Company re c o rded aggregate dividends on its pre f e rred stock of $11.7 million in
fiscal 1998, $13.7 million in fiscal 1997 and $9.4 million in fiscal 1996. The pre f e rred dividends re d u c enet income in computing net income available to common share h o l d e r s .
During fiscal 1997, the Company replaced the June 1995 shelf registration statement with another
shelf registration statement which currently provides for the issuance of up to $600 million of debt, com-
mon stock or pre f e rred stock.
29
On June 25, 1997, the Company authorized the re p u rchase of up to $250 million of the Company’s
common shares and common equivalent shares. During fiscal 1998, the Company re p u rchased 8.5 million
s h a res of its stock, totaling $245.2 million, re p resenting approximately 5% of the Company’s outstanding
common shares. In Febru a ry 1998, the Company completed this buy back program with a total of 8.7 mil-
lion shares having been re p u rchased. At the same time, the Company announced its intent to re p u rc h a s ean additional $250 million of the Company’s common stock.
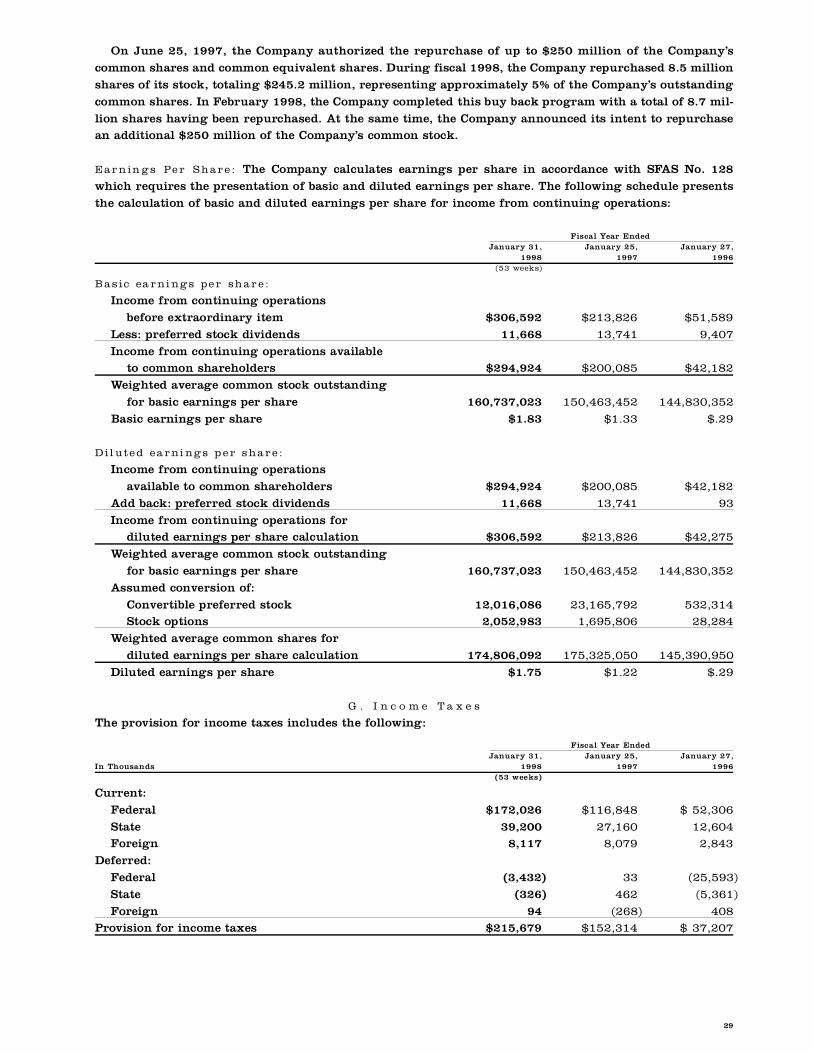
E a r n in g s Pe r S h a r e : The Company calculates earnings per share in accordance with SFAS No. 128
which re q u i res the presentation of basic and diluted earnings per share. The following schedule pre s e n t s
the calculation of basic and diluted earnings per share for income from continuing operations:
Fiscal Year EndedJ a n u a ry 31, J a n u a ry 25, J a n u a ry 27,
1 9 9 8 1 9 9 7 1 9 9 6(53 weeks)
B a s ic ea r ni ng s pe r sh a r e :
Income from continuing operations
b e f o re extraord i n a ry item $ 3 0 6 , 5 9 2 $ 2 1 3 , 8 2 6 $ 5 1 , 5 8 9
Less: pre f e rred stock dividends 1 1 , 6 6 8 1 3 , 7 4 1 9 , 4 0 7
Income from continuing operations available to common share h o l d e r s $ 2 9 4 , 9 2 4 $ 2 0 0 , 0 8 5 $ 4 2 , 1 8 2
Weighted average common stock outstanding
for basic earnings per share 1 6 0 , 7 3 7 , 0 2 3 1 5 0 , 4 6 3 , 4 5 2 1 4 4 , 8 3 0 , 3 5 2
Basic earnings per share $ 1 . 8 3 $ 1 . 3 3 $ . 2 9
D il ut e d e a r ni ng s p e r s h a r e :
Income from continuing operations
available to common share h o l d e r s $ 2 9 4 , 9 2 4 $ 2 0 0 , 0 8 5 $ 4 2 , 1 8 2
Add back: pre f e rred stock dividends 1 1 , 6 6 8 13,741 9 3
Income from continuing operations fordiluted earnings per share calculation $ 3 0 6 , 5 9 2 $213,826 $ 4 2 , 2 7 5
Weighted average common stock outstanding
for basic earnings per share 160,737,023 150,463,452 1 4 4 , 8 3 0 , 3 5 2
Assumed conversion of:
C o n v e rtible pre f e rred stock 12,016,086 23,165,792 532,314 Stock options 2,052,983 1,695,806 2 8 , 2 8 4
Weighted average common shares for
diluted earnings per share calculation 174,806,092 175,325,050 1 4 5 , 3 9 0 , 9 5 0
Diluted earnings per share $ 1 . 7 5 $ 1 . 2 2 $ . 2 9
G . I n c o m e T a x e s
The provision for income taxes includes the following:
Fiscal Year EndedJ a n u a ry 31, J a n u a ry 25, J a n u a ry 27,
In Thousands 1 9 9 8 1 9 9 7 1 9 9 6(53 weeks)
C u rre n t :
F e d e r a l $ 1 7 2 , 0 2 6 $ 1 1 6 , 8 4 8 $ 5 2 , 3 0 6
S t a t e 3 9 , 2 0 0 2 7 , 1 6 0 1 2 , 6 0 4F o re i g n 8 , 1 1 7 8 , 0 7 9 2 , 8 4 3
D e f e rre d :
F e d e r a l ( 3 , 4 3 2 ) 3 3 ( 2 5 , 5 9 3 )
S t a t e ( 3 2 6 ) 4 6 2 ( 5 , 3 6 1 )
F o re i g n 9 4 ( 2 6 8 ) 4 0 8P rovision for income taxes $ 2 1 5 , 6 7 9 $ 1 5 2 , 3 1 4 $ 3 7 , 2 0 7
30
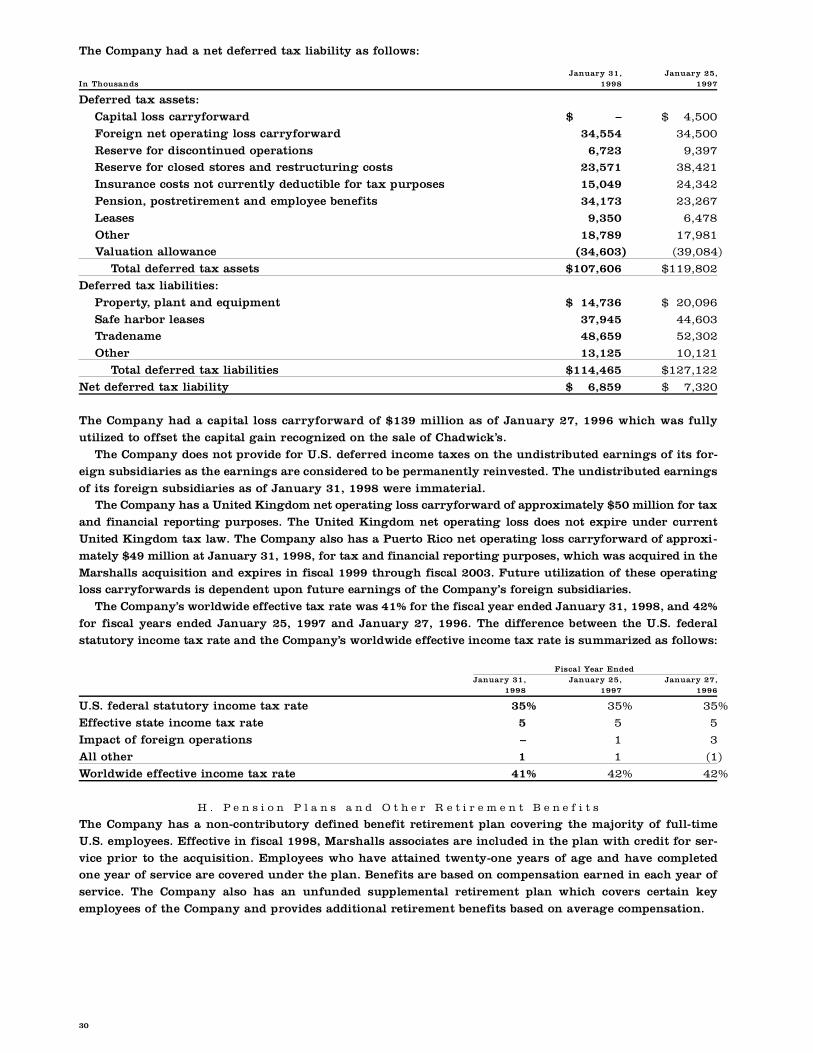
The Company had a net deferred tax liability as follows:
J a n u a ry 31, J a n u a ry 25,In Thousands 1 9 9 8 1 9 9 7
D e f e rred tax assets:
Capital loss carry f o rw a rd $ – $ 4 , 5 0 0
F o reign net operating loss carry f o rw a rd 3 4 , 5 5 4 3 4 , 5 0 0
R e s e rve for discontinued operations 6 , 7 2 3 9 , 3 9 7R e s e rve for closed stores and re s t ructuring costs 2 3 , 5 7 1 3 8 , 4 2 1
Insurance costs not currently deductible for tax purposes 1 5 , 0 4 9 2 4 , 3 4 2
Pension, postre t i rement and employee benefits 3 4 , 1 7 3 2 3 , 2 6 7
L e a s e s 9 , 3 5 0 6 , 4 7 8
O t h e r 1 8 , 7 8 9 1 7 , 9 8 1Valuation allowance ( 3 4 , 6 0 3 ) ( 3 9 , 0 8 4 )
Total deferred tax assets $ 1 0 7 , 6 0 6 $ 1 1 9 , 8 0 2
D e f e rred tax liabilities:
P ro p e rt y, plant and equipment $ 1 4 , 7 3 6 $ 2 0 , 0 9 6
Safe harbor leases 3 7 , 9 4 5 4 4 , 6 0 3Tr a d e n a m e 4 8 , 6 5 9 5 2 , 3 0 2
O t h e r 1 3 , 1 2 5 1 0 , 1 2 1
Total deferred tax liabilities $ 1 1 4 , 4 6 5 $ 1 2 7 , 1 2 2
Net deferred tax liability $ 6 , 8 5 9 $ 7 , 3 2 0
The Company had a capital loss carry f o rw a rd of $139 million as of January 27, 1996 which was fully
utilized to offset the capital gain recognized on the sale of Chadwick’s.
The Company does not provide for U.S. deferred income taxes on the undistributed earnings of its for-
eign subsidiaries as the earnings are considered to be permanently reinvested. The undistributed earn i n g s
of its foreign subsidiaries as of January 31, 1998 were immaterial.The Company has a United Kingdom net operating loss carryforward of approximately $50 million for tax
and financial reporting purposes. The United Kingdom net operating loss does not expire under current
United Kingdom tax law. The Company also has a Puerto Rico net operating loss carryforward of approxi-
mately $49 million at January 31, 1998, for tax and financial reporting purposes, which was acquired in the
Marshalls acquisition and expires in fiscal 1999 through fiscal 2003. Future utilization of these operatingloss carryforwards is dependent upon future earnings of the Company’s foreign subsidiaries.
The Company’s worldwide effective tax rate was 41% for the fiscal year ended January 31, 1998, and 42%
for fiscal years ended January 25, 1997 and January 27, 1996. The diff e rence between the U.S. federal
s t a t u t o ry income tax rate and the Company’s worldwide effective income tax rate is summarized as follows:
Fiscal Year EndedJ a n u a ry 31, J a n u a ry 25, J a n u a ry 27,
1 9 9 8 1 9 9 7 1 9 9 6
U.S. federal statutory income tax rate 3 5 % 3 5 % 3 5 %
E ffective state income tax rate 5 5 5
Impact of foreign operations – 1 3
All other 1 1 ( 1 )
Worldwide effective income tax rate 4 1 % 4 2 % 4 2 %
H . P e n s i o n P l a n s a n d O t h e r R e t i r e m e n t B e n e f i t s
The Company has a non-contributory defined benefit re t i rement plan covering the majority of full-time
U.S. employees. Effective in fiscal 1998, Marshalls associates are included in the plan with credit for ser-
vice prior to the acquisition. Employees who have attained twenty-one years of age and have completedone year of service are covered under the plan. Benefits are based on compensation earned in each year of
s e rvice. The Company also has an unfunded supplemental re t i rement plan which covers certain key
employees of the Company and provides additional re t i rement benefits based on average compensation.
31
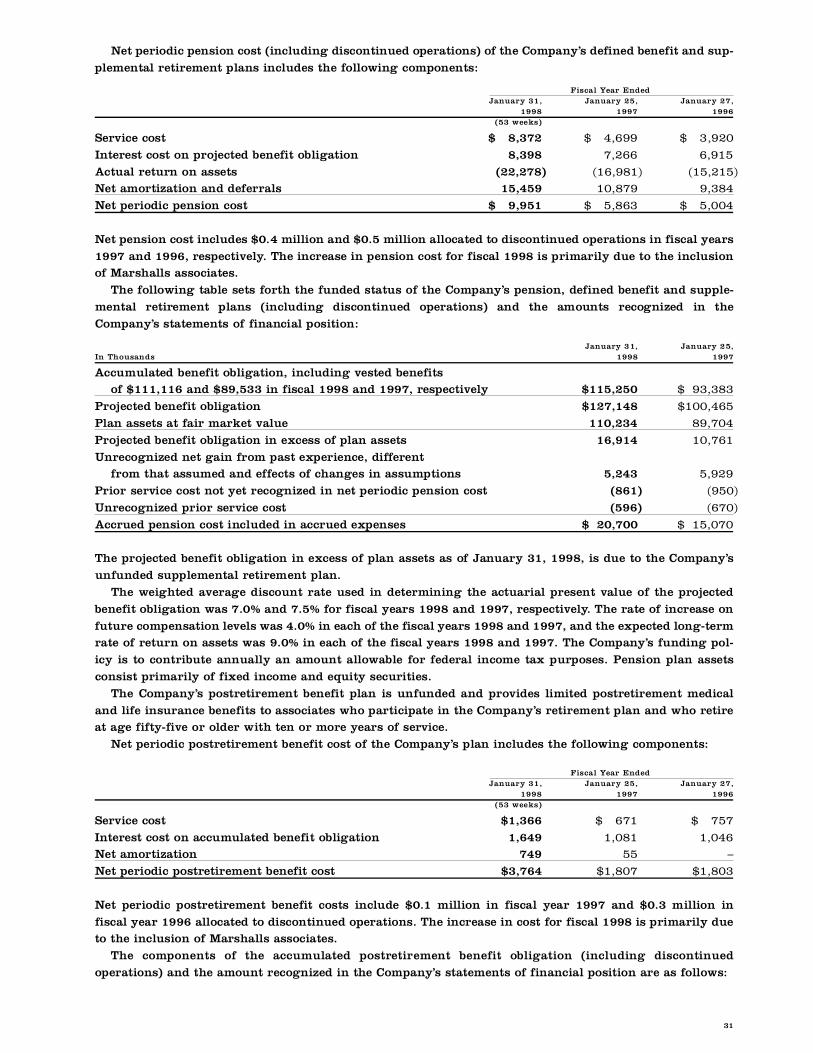
Net periodic pension cost (including discontinued operations) of the Company’s defined benefit and sup-
plemental re t i rement plans includes the following components:
Fiscal Year EndedJ a n u a ry 31, J a n u a ry 25, J a n u a ry 27,
1 9 9 8 1 9 9 7 1 9 9 6(53 weeks)
S e rvice cost $ 8,372 $ 4,699 $ 3,920
I n t e rest cost on projected benefit obligation 8 , 3 9 8 7 , 2 6 6 6 , 9 1 5
Actual re t u rn on assets ( 2 2 , 2 7 8 ) ( 1 6 , 9 8 1 ) ( 1 5 , 2 1 5 )Net amortization and deferr a l s 1 5 , 4 5 9 1 0 , 8 7 9 9 , 3 8 4
Net periodic pension cost $ 9,951 $ 5,863 $ 5,004
Net pension cost includes $0.4 million and $0.5 million allocated to discontinued operations in fiscal years
1997 and 1996, re s p e c t i v e l y. The increase in pension cost for fiscal 1998 is primarily due to the inclusionof Marshalls associates.
The following table sets forth the funded status of the Company’s pension, defined benefit and supple-
mental re t i rement plans (including discontinued operations) and the amounts recognized in the
C o m p a n y ’s statements of financial position:
J a n u a ry 31, J a n u a ry 25,In Thousands 1 9 9 8 1 9 9 7
Accumulated benefit obligation, including vested benefits of $111,116 and $89,533 in fiscal 1998 and 1997, re s p e c t i v e l y $ 1 1 5 , 2 5 0 $ 9 3 , 3 8 3
P rojected benefit obligation $ 1 2 7 , 1 4 8 $ 1 0 0 , 4 6 5
Plan assets at fair market value 1 1 0 , 2 3 4 8 9 , 7 0 4
P rojected benefit obligation in excess of plan assets 1 6 , 9 1 4 1 0 , 7 6 1
U n recognized net gain from past experience, diff e rent f rom that assumed and effects of changes in assumptions 5 , 2 4 3 5 , 9 2 9
Prior service cost not yet recognized in net periodic pension cost ( 8 6 1 ) ( 9 5 0 )
U n recognized prior service cost ( 5 9 6 ) ( 6 7 0 )
A c c rued pension cost included in accrued expenses $ 2 0 , 7 0 0 $ 1 5 , 0 7 0
The projected benefit obligation in excess of plan assets as of January 31, 1998, is due to the Company’s
unfunded supplemental re t i rement plan.
The weighted average discount rate used in determining the actuarial present value of the pro j e c t e d
benefit obligation was 7.0% and 7.5% for fiscal years 1998 and 1997, re s p e c t i v e l y. The rate of increase on
f u t u re compensation levels was 4.0% in each of the fiscal years 1998 and 1997, and the expected long-termrate of re t u rn on assets was 9.0% in each of the fiscal years 1998 and 1997. The Company’s funding pol-
icy is to contribute annually an amount allowable for federal income tax purposes. Pension plan assets
consist primarily of fixed income and equity securities.
The Company’s postre t i rement benefit plan is unfunded and provides limited postre t i rement medical
and life insurance benefits to associates who participate in the Company’s re t i rement plan and who re t i reat age fifty-five or older with ten or more years of serv i c e .
Net periodic postre t i rement benefit cost of the Company’s plan includes the following components:
Fiscal Year EndedJ a n u a ry 31, J a n u a ry 25, J a n u a ry 27,
1 9 9 8 1 9 9 7 1 9 9 6(53 weeks)
S e rvice cost $ 1 , 3 6 6 $ 671 $ 757
I n t e rest cost on accumulated benefit obligation 1 , 6 4 9 1 , 0 8 1 1 , 0 4 6Net amort i z a t i o n 7 4 9 5 5 –
Net periodic postre t i rement benefit cost $ 3 , 7 6 4 $ 1 , 8 0 7 $ 1 , 8 0 3
Net periodic postre t i rement benefit costs include $0.1 million in fiscal year 1997 and $0.3 million in
fiscal year 1996 allocated to discontinued operations. The increase in cost for fiscal 1998 is primarily dueto the inclusion of Marshalls associates.
The components of the accumulated postre t i rement benefit obligation (including discontinued
operations) and the amount recognized in the Company’s statements of financial position are as follows:
32
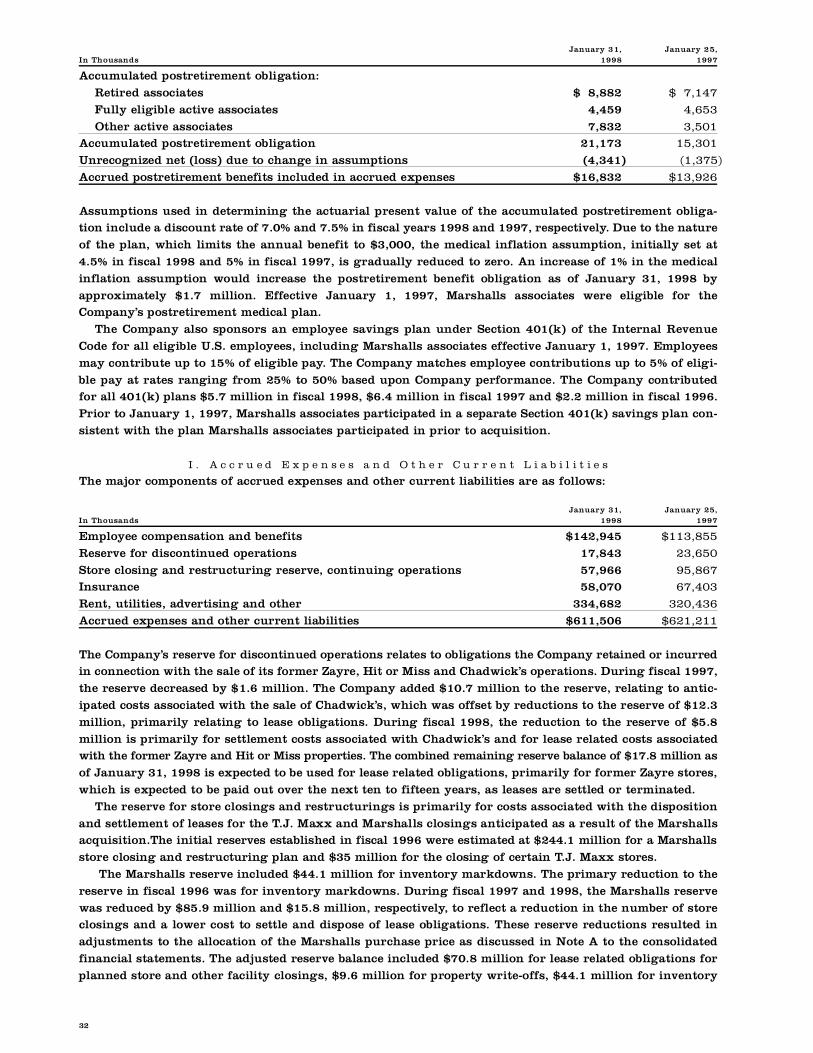
J a n u a ry 31, J a n u a ry 25,In Thousands 1 9 9 8 1 9 9 7
Accumulated postre t i rement obligation:
R e t i red associates $ 8 , 8 8 2 $ 7 , 1 4 7
Fully eligible active associates 4 , 4 5 9 4 , 6 5 3
Other active associates 7 , 8 3 2 3 , 5 0 1Accumulated postre t i rement obligation 2 1 , 1 7 3 1 5 , 3 0 1
U n recognized net (loss) due to change in assumptions ( 4 , 3 4 1 ) ( 1 , 3 7 5 )
A c c rued postre t i rement benefits included in accrued expenses $ 1 6 , 8 3 2 $ 1 3 , 9 2 6
Assumptions used in determining the actuarial present value of the accumulated postre t i rement obliga-tion include a discount rate of 7.0% and 7.5% in fiscal years 1998 and 1997, re s p e c t i v e l y. Due to the nature
of the plan, which limits the annual benefit to $3,000, the medical inflation assumption, initially set at
4.5% in fiscal 1998 and 5% in fiscal 1997, is gradually reduced to zero. An increase of 1% in the medical
inflation assumption would increase the postre t i rement benefit obligation as of January 31, 1998 by
a p p roximately $1.7 million. Effective January 1, 1997, Marshalls associates were eligible for theC o m p a n y ’s postre t i rement medical plan.
The Company also sponsors an employee savings plan under Section 401(k) of the Internal Revenue
Code for all eligible U.S. employees, including Marshalls associates effective January 1, 1997. Employees
may contribute up to 15% of eligible pay. The Company matches employee contributions up to 5% of eligi-
ble pay at rates ranging from 25% to 50% based upon Company perf o rmance. The Company contributedfor all 401(k) plans $5.7 million in fiscal 1998, $6.4 million in fiscal 1997 and $2.2 million in fiscal 1996.
Prior to January 1, 1997, Marshalls associates participated in a separate Section 401(k) savings plan con-
sistent with the plan Marshalls associates participated in prior to acquisition.
I . A c c r u e d E x p e n s e s a n d O t h e r C u r r e n t L i a b i l i t i e s
The major components of accrued expenses and other current liabilities are as follows:
J a n u a ry 31, J a n u a ry 25,In Thousands 1 9 9 8 1 9 9 7
Employee compensation and benefits $ 1 4 2 , 9 4 5 $ 1 1 3 , 8 5 5
R e s e rve for discontinued operations 1 7 , 8 4 3 2 3 , 6 5 0
S t o re closing and re s t ructuring re s e rve, continuing operations 5 7 , 9 6 6 9 5 , 8 6 7I n s u r a n c e 5 8 , 0 7 0 6 7 , 4 0 3
Rent, utilities, advertising and other 3 3 4 , 6 8 2 3 2 0 , 4 3 6
A c c rued expenses and other current liabilities $ 6 1 1 , 5 0 6 $ 6 2 1 , 2 1 1
The Company’s re s e rve for discontinued operations relates to obligations the Company retained or incurre din connection with the sale of its former Zayre, Hit or Miss and Chadwick’s operations. During fiscal 1997,
the re s e rve decreased by $1.6 million. The Company added $10.7 million to the re s e rve, relating to antic-
ipated costs associated with the sale of Chadwick’s, which was offset by reductions to the re s e rve of $12.3
million, primarily relating to lease obligations. During fiscal 1998, the reduction to the re s e rve of $5.8
million is primarily for settlement costs associated with Chadwick’s and for lease related costs associatedwith the former Zayre and Hit or Miss pro p e rties. The combined remaining re s e rve balance of $17.8 million as
of January 31, 1998 is expected to be used for lease related obligations, primarily for former Zayre store s ,
which is expected to be paid out over the next ten to fifteen years, as leases are settled or terminated.
The re s e rve for store closings and re s t ructurings is primarily for costs associated with the disposition
and settlement of leases for the T.J. Maxx and Marshalls closings anticipated as a result of the Marshallsa c q u i s i t i o n .The initial re s e rves established in fiscal 1996 were estimated at $244.1 million for a Marshalls
s t o re closing and re s t ructuring plan and $35 million for the closing of certain T.J. Maxx store s .
The Marshalls re s e rve included $44.1 million for inventory markdowns. The primary reduction to the
re s e rve in fiscal 1996 was for inventory markdowns. During fiscal 1997 and 1998, the Marshalls re s e rv e
was reduced by $85.9 million and $15.8 million, re s p e c t i v e l y, to reflect a reduction in the number of storeclosings and a lower cost to settle and dispose of lease obligations. These re s e rve reductions resulted in
adjustments to the allocation of the Marshalls purchase price as discussed in Note A to the consolidated
financial statements. The adjusted re s e rve balance included $70.8 million for lease related obligations for
planned store and other facility closings, $9.6 million for pro p e rty write-offs, $44.1 million for inventory
33
markdowns and $17.9 million for severance, professional fees and all other costs associated with the
re s t ructuring plan. The only non-cash charge portion of the re s e rve was for pro p e rty write-off s .
The Company also established a re s e rve for the closing of certain T.J. Maxx stores. The Company
re c o rded an initial charge to income from continuing operations of $35 million in fiscal 1996 and a cre d i t
to income from continuing operations of $8 million in fiscal 1997 to reflect a lower than anticipated costof the T.J. Maxx closings. The adjusted re s e rve balance includes $15.6 million for lease related obligations
of the closed stores, non-cash charges of $9.8 million for pro p e rty write-offs and $2.3 million for
severance, professional fees and all other costs associated with the closings.
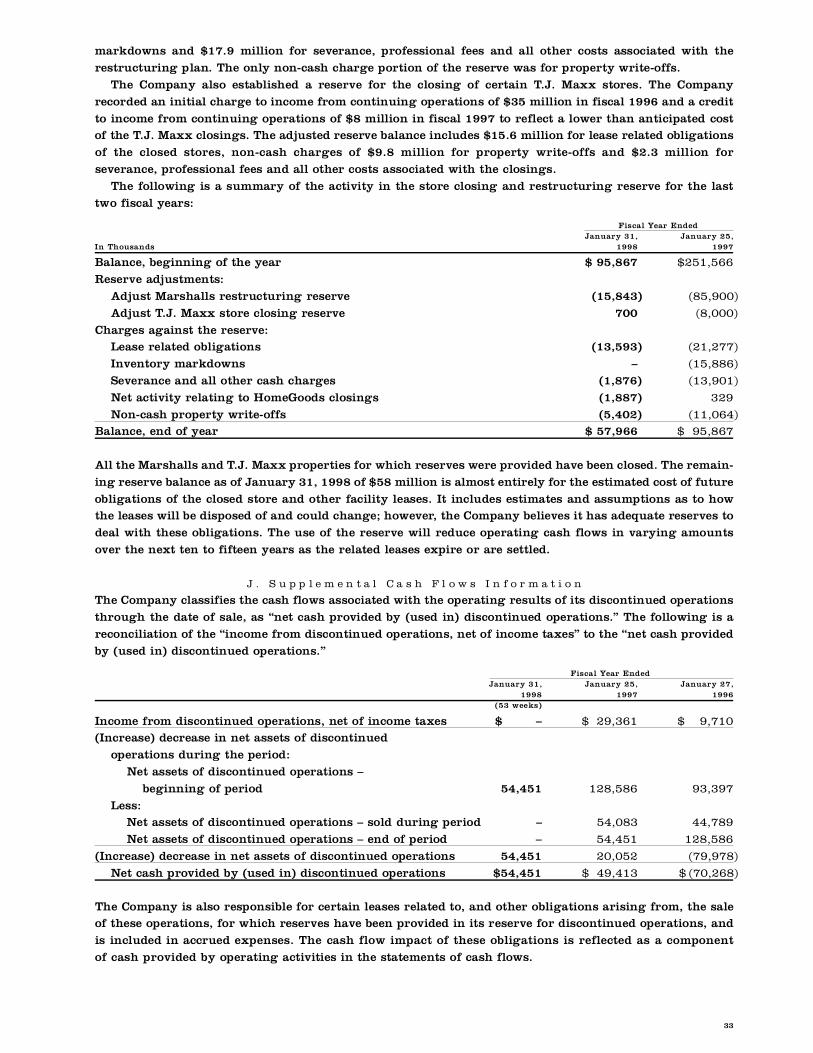
The following is a summary of the activity in the store closing and re s t ructuring re s e rve for the last
two fiscal years:
Fiscal Year EndedJ a n u a ry 31, J a n u a ry 25,
In Thousands 1 9 9 8 1 9 9 7
Balance, beginning of the year $ 95,867 $ 2 5 1 , 5 6 6
R e s e rve adjustments:
Adjust Marshalls re s t ructuring re s e rv e ( 1 5 , 8 4 3 ) ( 8 5 , 9 0 0 )
Adjust T.J. Maxx store closing re s e rv e 7 0 0 ( 8 , 0 0 0 )
C h a rges against the re s e rv e :Lease related obligations ( 1 3 , 5 9 3 ) ( 2 1 , 2 7 7 )
I n v e n t o ry markdowns – ( 1 5 , 8 8 6 )
Severance and all other cash charg e s ( 1 , 8 7 6 ) ( 1 3 , 9 0 1 )
Net activity relating to HomeGoods closings ( 1 , 8 8 7 ) 329
Non-cash pro p e rty write-off s ( 5 , 4 0 2 ) ( 1 1 , 0 6 4 )Balance, end of year $ 57,966 $ 95,867
All the Marshalls and T.J. Maxx pro p e rties for which re s e rves were provided have been closed. The re m a i n-
ing re s e rve balance as of January 31, 1998 of $58 million is almost entirely for the estimated cost of future
obligations of the closed store and other facility leases. It includes estimates and assumptions as to howthe leases will be disposed of and could change; however, the Company believes it has adequate re s e rves to
deal with these obligations. The use of the re s e rve will reduce operating cash flows in varying amounts
over the next ten to fifteen years as the related leases expire or are settled.
J . S u p p l e m e n t a l C a s h F l o w s I n f o r m a t i o n
The Company classifies the cash flows associated with the operating results of its discontinued operations
t h rough the date of sale, as “net cash provided by (used in) discontinued operations.” The following is a
reconciliation of the “income from discontinued operations, net of income taxes” to the “net cash pro v i d e d
by (used in) discontinued operations.”
Fiscal Year EndedJ a n u a ry 31, J a n u a ry 25, J a n u a ry 27,
1 9 9 8 1 9 9 7 1 9 9 6(53 weeks)
Income from discontinued operations, net of income taxes $ – $ 2 9 , 3 6 1 $ 9 , 7 1 0( I n c rease) decrease in net assets of discontinued
operations during the period:
Net assets of discontinued operations –
beginning of period 5 4 , 4 5 1 1 2 8 , 5 8 6 9 3 , 3 9 7
L e s s :Net assets of discontinued operations – sold during period – 5 4 , 0 8 3 4 4 , 7 8 9
Net assets of discontinued operations – end of period – 5 4 , 4 5 1 1 2 8 , 5 8 6
( I n c rease) decrease in net assets of discontinued operations 5 4 , 4 5 1 2 0 , 0 5 2 ( 7 9 , 9 7 8 )
Net cash provided by (used in) discontinued operations $ 5 4 , 4 5 1 $ 4 9 , 4 1 3 $ ( 7 0 , 2 6 8 )
The Company is also responsible for certain leases related to, and other obligations arising from, the saleof these operations, for which re s e rves have been provided in its re s e rve for discontinued operations, and
is included in accrued expenses. The cash flow impact of these obligations is reflected as a component
of cash provided by operating activities in the statements of cash flows.
34
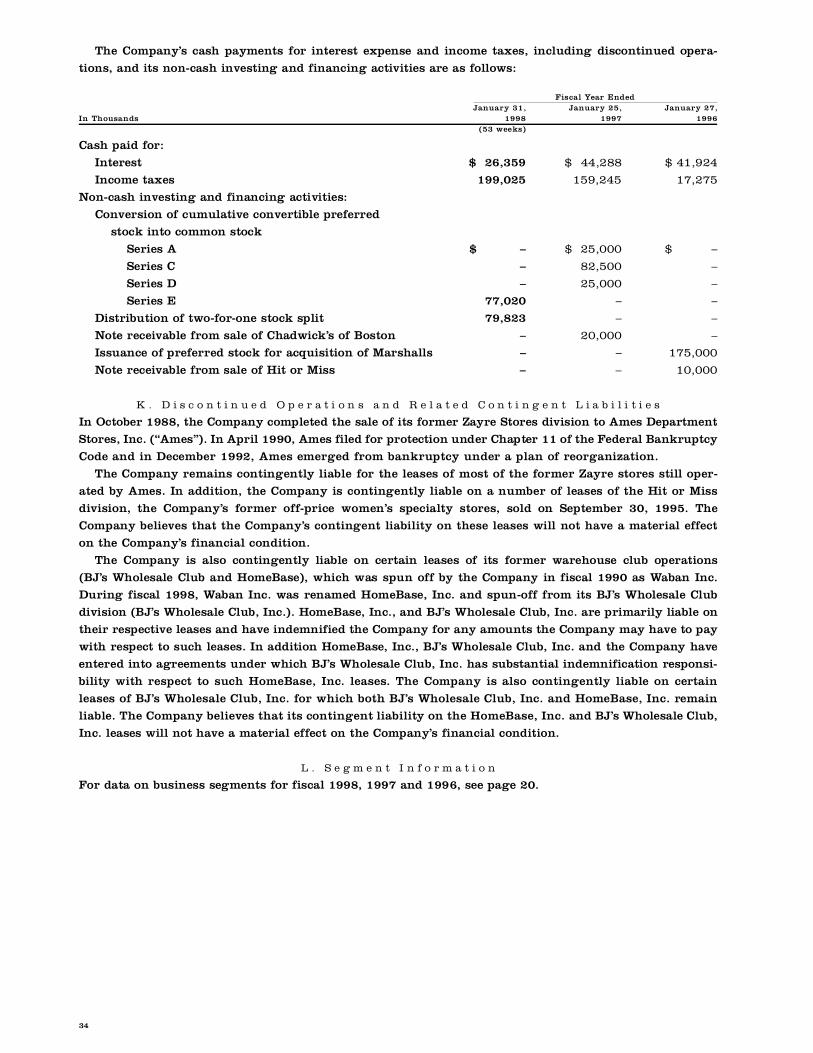
The Company’s cash payments for interest expense and income taxes, including discontinued opera-
tions, and its non-cash investing and financing activities are as follows:
Fiscal Year EndedJ a n u a ry 31, J a n u a ry 25, J a n u a ry 27,
In Thousands 1 9 9 8 1 9 9 7 1 9 9 6(53 weeks)
Cash paid for:
I n t e re s t $ 26,359 $ 44,288 $ 41,924
Income taxes 1 9 9 , 0 2 5 1 5 9 , 2 4 5 1 7 , 2 7 5
Non-cash investing and financing activities:
Conversion of cumulative convertible pre f e rre d
stock into common stock
Series A $ – $ 25,000 $ –
Series C – 8 2 , 5 0 0 –
Series D – 2 5 , 0 0 0 –
Series E 7 7 , 0 2 0 – –
Distribution of two-for-one stock split 7 9 , 8 2 3 – –
Note receivable from sale of Chadwick’s of Boston – 2 0 , 0 0 0 –
Issuance of pre f e rred stock for acquisition of Marshalls – – 1 7 5 , 0 0 0
Note receivable from sale of Hit or Miss – – 1 0 , 0 0 0
K . D i s c o n t i n u e d O p e r a t i o n s a n d R e l a t e d C o n t i n g e n t L i a b i l i t i e s
In October 1988, the Company completed the sale of its former Zayre Stores division to Ames Depart m e n t
S t o res, Inc. (“Ames”). In April 1990, Ames filed for protection under Chapter 11 of the Federal Bankru p t c y
Code and in December 1992, Ames emerged from bankruptcy under a plan of re o rganization.
The Company remains contingently liable for the leases of most of the former Zayre stores still oper-
ated by Ames. In addition, the Company is contingently liable on a number of leases of the Hit or Miss
division, the Company’s former off-price women’s specialty stores, sold on September 30, 1995. The
Company believes that the Company’s contingent liability on these leases will not have a material eff e c t
on the Company’s financial condition.
The Company is also contingently liable on certain leases of its former warehouse club operations
( B J ’s Wholesale Club and HomeBase), which was spun off by the Company in fiscal 1990 as Waban Inc.
During fiscal 1998, Waban Inc. was renamed HomeBase, Inc. and spun-off from its BJ’s Wholesale Club
division (BJ’s Wholesale Club, Inc.). HomeBase, Inc., and BJ’s Wholesale Club, Inc. are primarily liable on
their respective leases and have indemnified the Company for any amounts the Company may have to pay
with respect to such leases. In addition HomeBase, Inc., BJ’s Wholesale Club, Inc. and the Company have
e n t e red into agreements under which BJ’s Wholesale Club, Inc. has substantial indemnification re s p o n s i-
bility with respect to such HomeBase, Inc. leases. The Company is also contingently liable on cert a i n
leases of BJ’s Wholesale Club, Inc. for which both BJ’s Wholesale Club, Inc. and HomeBase, Inc. re m a i n
liable. The Company believes that its contingent liability on the HomeBase, Inc. and B J ’s Wholesale Club,
Inc. leases will not have a material effect on the Company’s financial condition.
L . S e g m e n t I n f o r m a t i o n
For data on business segments for fiscal 1998, 1997 and 1996, see page 20.
The TJ X Com pan ies , I nc .
35
R E P O R T O F I N D E P E N D E N T A C C O U N T A N T S
C o o p e rs&Lybrand
T o t h e B o a r d o f D i r e c t o r s o f T h e T J X C o m p a n i e s , I n c . :
We have audited the accompanying consolidated balance sheets of The TJX Companies, Inc. and sub-
sidiaries as of January 31, 1998 and January 25, 1997 and the related consolidated statements of income,
s h a reholders’ equity, and cash flows for each of the three fiscal years in the period ended January 31,
1998. These financial statements are the responsibility of the Company’s management. Our re s p o n s i b i l i t y
is to express an opinion on these financial statements based on our audits.
We conducted our audits in accordance with generally accepted auditing standards. Those standard s
re q u i re that we plan and perf o rm the audit to obtain reasonable assurance about whether the financial
statements are free of material misstatement. An audit includes examining, on a test basis, evidence sup-
p o rting the amounts and disclosures in the financial statements. An audit also includes assessing the
accounting principles used and significant estimates made by management, as well as evaluating the over-
all financial statement presentation. We believe that our audits provide a reasonable basis for our opinion.
In our opinion, the financial statements re f e rred to above present fairly, in all material respects, the consol-
idated financial position of The TJX Companies, Inc. and subsidiaries as of January 31, 1998 and January 25,
1997 and the consolidated results of their operations and their cash flows for each of the three fiscal years in
the period ended January 31, 1998 in conformity with generally accepted accounting principles.
Boston, Massachusetts
M a rch 3, 1998
R E P O R T O F M A N A G E M E N T
The financial statements and related financial information in this annual re p o rt have been pre p a red by
management which is responsible for their integrity, objectivity and consistency. The financial statements
w e re pre p a red in accordance with generally accepted accounting principles and necessarily include
amounts which are based upon judgments and estimates made by management.
The Company maintains a system of internal controls designed to provide, at appropriate cost, re a s o n-
able assurance that assets are safeguarded, transactions are executed in accordance with management’s
authorization and the accounting re c o rds may be relied upon for the preparation of financial statements.
The system of controls includes the careful selection and training of associates, and the communication
and application of formal policies and pro c e d u res that are consistent with high standards of accounting
and administrative practices. The accounting and control systems are continually reviewed, evaluated and
w h e re appropriate, modified to accommodate changing business conditions and the recommendations of
the Company’s internal auditors and the independent public accountants.
An Audit Committee, comprised of members of the Board of Directors who are neither officers nor employees
of the Company, meets periodically with management, internal auditors and the independent public accountants
to review matters relating to the Company’s financial re p o rting, the adequacy of internal accounting controls and
the scope and results of audit work. The Committee is responsible for re p o rting the results of its activities and
for recommending the selection of independent auditors to the full Board of Directors. The internal auditors and
the independent public accountants have free access to the Committee and the Board of Dire c t o r s .
The financial statements have been examined by Coopers & Lybrand L.L.P., whose re p o rt appears separately.
Their re p o rt expresses an opinion as to the fair presentation of the consolidated financial statements and is
based on an independent examination perf o rmed in accordance with generally accepted auditing standard s .
B e rn a rd Cammarata Donald G. Campbell
P resident and Chief Executive Off i c e r Executive Vice President – Finance and
Chief Financial Off i c e r
M a rch 3, 1998
C o o p e rs & Lybrand L.L.P.
a professional services firm
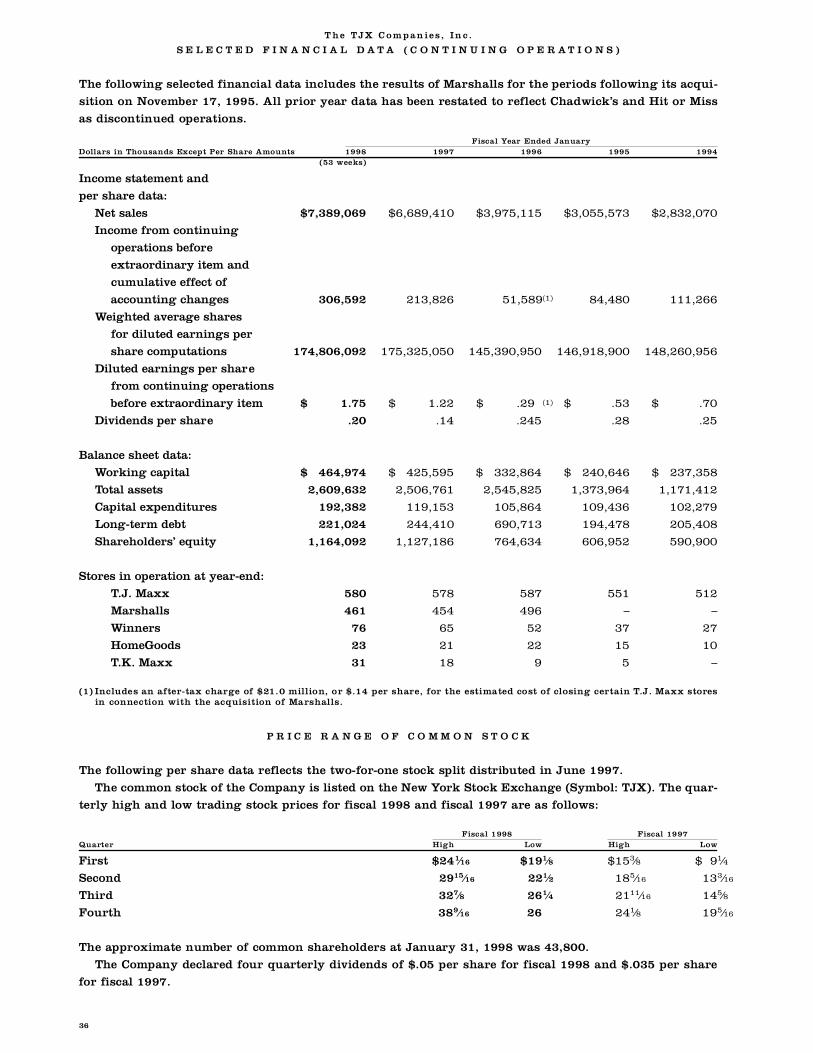
T he TJX C om pan ies , In c .
36
S E L E C T E D F I N A N C I A L D A T A ( C O N T I N U I N G O P E R A T I O N S )
The following selected financial data includes the results of Marshalls for the periods following its acqui-
sition on November 17, 1995. All prior year data has been restated to reflect Chadwick’s and Hit or Miss
as discontinued operations.
Fiscal Year Ended JanuaryDollars in Thousands Except Per Share Amounts 1 9 9 8 1 9 9 7 1 9 9 6 1 9 9 5 1 9 9 4
(53 weeks)
Income statement and
per share data:
Net sales $7,389,069 $6,689,410 $3,975,115 $3,055,573 $2,832,070
Income from continuing
operations before
extraordinary item and
cumulative effect of
accounting changes 306,592 213,826 51,589(1) 84,480 111,266
Weighted average shares
for diluted earnings per
share computations 174,806,092 175,325,050 145,390,950 146,918,900 148,260,956
Diluted earnings per share
from continuing operations
before extraordinary item $ 1.75 $ 1.22 $ .29 (1) $ .53 $ .70
Dividends per share .20 .14 .245 .28 .25
Balance sheet data:
Working capital $ 464,974 $ 425,595 $ 332,864 $ 240,646 $ 237,358
Total assets 2,609,632 2,506,761 2,545,825 1,373,964 1,171,412
Capital expenditures 192,382 119,153 105,864 109,436 102,279
Long-term debt 221,024 244,410 690,713 194,478 205,408
Shareholders’ equity 1,164,092 1,127,186 764,634 606,952 590,900
Stores in operation at year-end:
T.J. Maxx 580 578 587 551 512
Marshalls 461 454 496 – –
Winners 76 65 52 37 27
HomeGoods 23 21 22 15 10
T.K. Maxx 31 18 9 5 –
( 1 ) Includes an after-tax charge of $21.0 million, or $.14 per share, for the estimated cost of closing certain T.J. Maxx store sin connection with the acquisition of Marshalls.
P R I C E R A N G E O F C O M M O N S T O C K
The following per share data reflects the two-for-one stock split distributed in June 1997.
The common stock of the Company is listed on the New York Stock Exchange (Symbol: TJX). The quar-
terly high and low trading stock prices for fiscal 1998 and fiscal 1997 are as follows:
Fiscal 1998 Fiscal 1997Q u a rt e r H i g h L o w H i g h L o w
F i r s t $ 2 41⁄1 6 $ 1 91⁄8 $ 1 53⁄8 $ 91⁄4
S e c o n d 2 91 5⁄1 6 2 21⁄2 1 85⁄1 6 1 33⁄1 6
T h i rd 3 27⁄8 2 61⁄4 2 11 1⁄1 6 1 45⁄8
F o u rt h 3 89⁄1 6 2 6 2 41⁄8 1 95⁄1 6
The approximate number of common shareholders at January 31, 1998 was 43,800.
The Company declared four quarterly dividends of $.05 per share for fiscal 1998 and $.035 per share
for fiscal 1997.
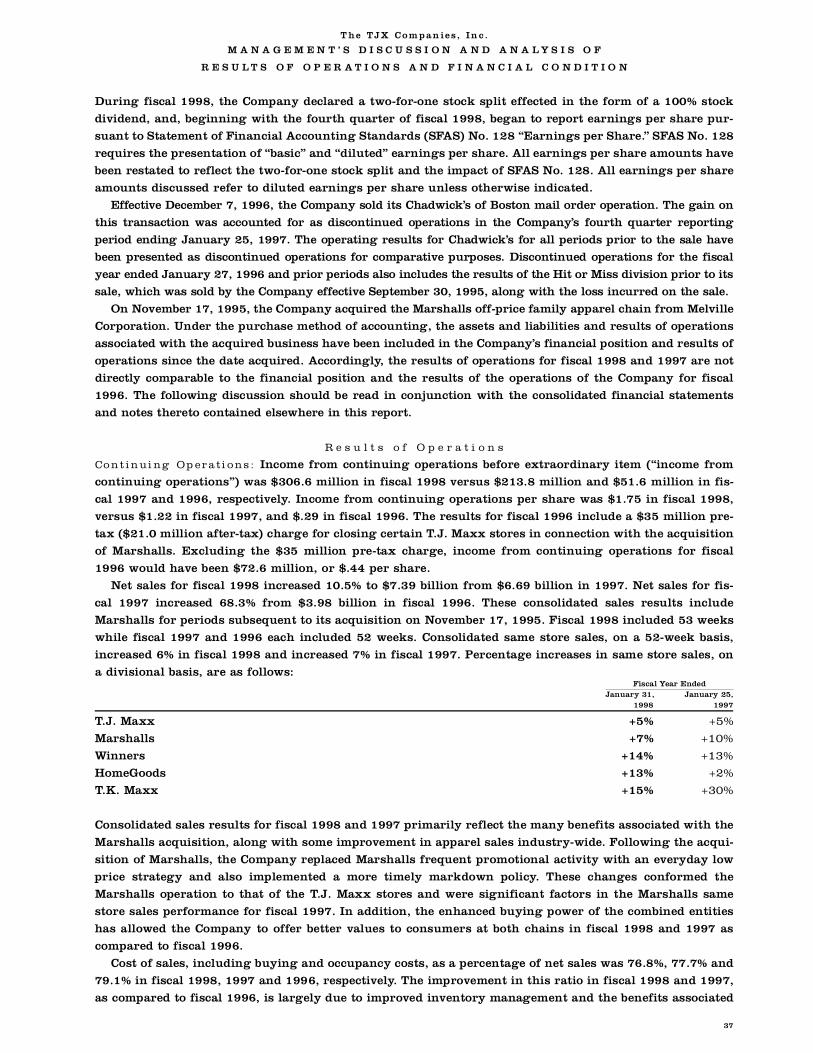
T he TJX Com pan ies , In c .
37
M A N A G E M E N T ’ S D I S C U S S I O N A N D A N A L Y S I S O F
R E S U L T S O F O P E R A T I O N S A N D F I N A N C I A L C O N D I T I O N
During fiscal 1998, the Company declared a two-for-one stock split effected in the form of a 100% stock
dividend, and, beginning with the fourth quarter of fiscal 1998, began to re p o rt earnings per share pur-
suant to Statement of Financial Accounting Standards (SFAS) No. 128 “Earnings per Share.” SFAS No. 128
re q u i res the presentation of “basic” and “diluted” earnings per share. All earnings per share amounts have
been restated to reflect the two-for-one stock split and the impact of SFAS No. 128. All earnings per share
amounts discussed refer to diluted earnings per share unless otherwise indicated.
E ffective December 7, 1996, the Company sold its Chadwick’s of Boston mail order operation. The gain on
this transaction was accounted for as discontinued operations in the Company’s fourth quarter re p o rt i n g
period ending January 25, 1997. The operating results for Chadwick’s for all periods prior to the sale have
been presented as discontinued operations for comparative purposes. Discontinued operations for the fiscal
year ended January 27, 1996 and prior periods also includes the results of the Hit or Miss division prior to its
sale, which was sold by the Company effective September 30, 1995, along with the loss incurred on the sale.
On November 17, 1995, the Company acquired the Marshalls off-price family apparel chain from Melville
Corporation. Under the purchase method of accounting, the assets and liabilities and results of operations
associated with the acquired business have been included in the Company’s financial position and results of
operations since the date acquired. Accord i n g l y, the results of operations for fiscal 1998 and 1997 are not
d i rectly comparable to the financial position and the results of the operations of the Company for fiscal
1996. The following discussion should be read in conjunction with the consolidated financial statements
and notes thereto contained elsewhere in this re p o rt.
R e s u l t s o f O p e r a t i o n s
Co n t i n ui ng O p er a t i o n s : Income from continuing operations before extraord i n a ry item (“income fro m
continuing operations”) was $306.6 million in fiscal 1998 versus $213.8 million and $51.6 million in fis-
cal 1997 and 1996, re s p e c t i v e l y. Income from continuing operations per share was $1.75 in fiscal 1998,
versus $1.22 in fiscal 1997, and $.29 in fiscal 1996. The results for fiscal 1996 include a $35 million pre -
tax ($21.0 million after-tax) charge for closing certain T.J. Maxx stores in connection with the acquisition
of Marshalls. Excluding the $35 million pre-tax charge, income from continuing operations for fiscal
1996 would have been $72.6 million, or $.44 per share.
Net sales for fiscal 1998 increased 10.5% to $7.39 billion from $6.69 billion in 1997. Net sales for fis-
cal 1997 increased 68.3% from $3.98 billion in fiscal 1996. These consolidated sales results include
Marshalls for periods subsequent to its acquisition on November 17, 1995. Fiscal 1998 included 53 weeks
while fiscal 1997 and 1996 each included 52 weeks. Consolidated same store sales, on a 52-week basis,
i n c reased 6% in fiscal 1998 and increased 7% in fiscal 1997. Percentage increases in same store sales, on
a divisional basis, are as follows:Fiscal Year Ended
J a n u a ry 31, J a n u a ry 25,1 9 9 8 1 9 9 7
T.J. Maxx + 5 % + 5 %
M a r s h a l l s + 7 % + 1 0 %
Wi n n e r s + 1 4 % + 1 3 %
H o m e G o o d s + 1 3 % + 2 %
T.K. Maxx + 1 5 % + 3 0 %
Consolidated sales results for fiscal 1998 and 1997 primarily reflect the many benefits associated with the
Marshalls acquisition, along with some improvement in apparel sales industry-wide. Following the acqui-
sition of Marshalls, the Company replaced Marshalls frequent promotional activity with an everyday low
price strategy and also implemented a more timely markdown policy. These changes conformed the
Marshalls operation to that of the T.J. Maxx stores and were significant factors in the Marshalls same
s t o re sales perf o rmance for fiscal 1997. In addition, the enhanced buying power of the combined entities
has allowed the Company to offer better values to consumers at both chains in fiscal 1998 and 1997 as
c o m p a red to fiscal 1996.
Cost of sales, including buying and occupancy costs, as a percentage of net sales was 76.8%, 77.7% and
79.1% in fiscal 1998, 1997 and 1996, re s p e c t i v e l y. The improvement in this ratio in fiscal 1998 and 1997,
as compared to fiscal 1996, is largely due to improved inventory management and the benefits associated
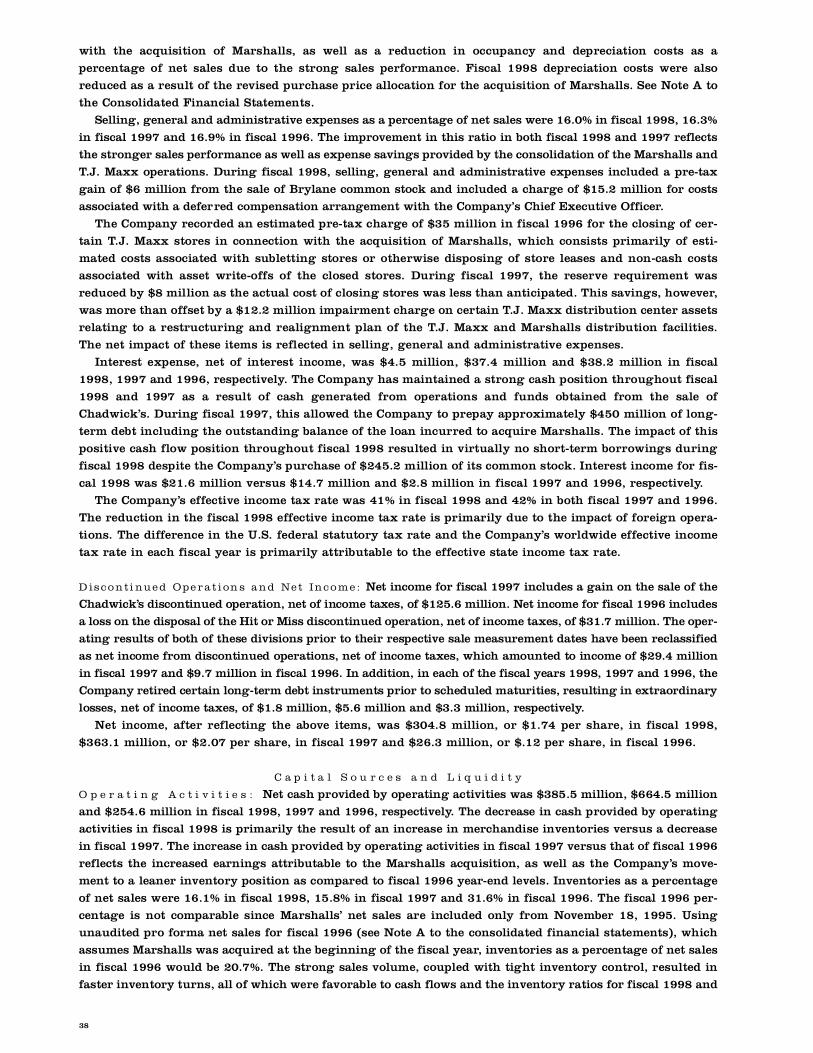
38
with the acquisition of Marshalls, as well as a reduction in occupancy and depreciation costs as a
p e rcentage of net sales due to the strong sales perf o rmance. Fiscal 1998 depreciation costs were also
reduced as a result of the revised purchase price allocation for the acquisition of Marshalls. See Note A to
the Consolidated Financial Statements.
Selling, general and administrative expenses as a percentage of net sales were 16.0% in fiscal 1998, 16.3%
in fiscal 1997 and 16.9% in fiscal 1996. The improvement in this ratio in both fiscal 1998 and 1997 reflects
the stronger sales performance as well as expense savings provided by the consolidation of the Marshalls and
T.J. Maxx operations. During fiscal 1998, selling, general and administrative expenses included a pre-tax
gain of $6 million from the sale of Brylane common stock and included a charge of $15.2 million for costs
associated with a deferred compensation arrangement with the Company’s Chief Executive Officer.
The Company re c o rded an estimated pre-tax charge of $35 million in fiscal 1996 for the closing of cer-
tain T.J. Maxx stores in connection with the acquisition of Marshalls, which consists primarily of esti-
mated costs associated with subletting stores or otherwise disposing of store leases and non-cash costs
associated with asset write-offs of the closed stores. During fiscal 1997, the re s e rve re q u i rement was
reduced by $8 million as the actual cost of closing stores was less than anticipated. This savings, however,
was more than offset by a $12.2 million impairment charge on certain T.J. Maxx distribution center assets
relating to a re s t ructuring and realignment plan of the T.J. Maxx and Marshalls distribution facilities.
The net impact of these items is reflected in selling, general and administrative expenses.
I n t e rest expense, net of interest income, was $4.5 million, $37.4 million and $38.2 million in fiscal
1998, 1997 and 1996, re s p e c t i v e l y. The Company has maintained a strong cash position throughout fiscal
1998 and 1997 as a result of cash generated from operations and funds obtained from the sale of
C h a d w i c k ’s. During fiscal 1997, this allowed the Company to prepay approximately $450 million of long-
t e rm debt including the outstanding balance of the loan incurred to acquire Marshalls. The impact of this
positive cash flow position throughout fiscal 1998 resulted in virtually no short - t e rm borrowings during
fiscal 1998 despite the Company’s purchase of $245.2 million of its common stock. Interest income for fis-
cal 1998 was $21.6 million versus $14.7 million and $2.8 million in fiscal 1997 and 1996, re s p e c t i v e l y.
The Company’s effective income tax rate was 41% in fiscal 1998 and 42% in both fiscal 1997 and 1996.
The reduction in the fiscal 1998 effective income tax rate is primarily due to the impact of foreign opera-
tions. The diff e rence in the U.S. federal statutory tax rate and the Company’s worldwide effective income
tax rate in each fiscal year is primarily attributable to the effective state income tax rate.
D is c o n t i nu e d O pe r a t i on s a n d Ne t In c o m e : Net income for fiscal 1997 includes a gain on the sale of the
C h a d w i c k ’s discontinued operation, net of income taxes, of $125.6 million. Net income for fiscal 1996 includes
a loss on the disposal of the Hit or Miss discontinued operation, net of income taxes, of $31.7 million. The oper-
ating results of both of these divisions prior to their respective sale measurement dates have been re c l a s s i f i e d
as net income from discontinued operations, net of income taxes, which amounted to income of $29.4 million
in fiscal 1997 and $9.7 million in fiscal 1996. In addition, in each of the fiscal years 1998, 1997 and 1996, the
Company re t i red certain long-term debt instruments prior to scheduled maturities, resulting in extraord i n a ry
losses, net of income taxes, of $1.8 million, $5.6 million and $3.3 million, re s p e c t i v e l y.
Net income, after reflecting the above items, was $304.8 million, or $1.74 per share, in fiscal 1998,
$363.1 million, or $2.07 per share, in fiscal 1997 and $26.3 million, or $.12 per share, in fiscal 1996.
C a p i t a l S o u r c e s a n d L i q u i d i t y
O p e r a t i n g A c t i v i t i e s : Net cash provided by operating activities was $385.5 million, $664.5 million
and $254.6 million in fiscal 1998, 1997 and 1996, re s p e c t i v e l y. The decrease in cash provided by operating
activities in fiscal 1998 is primarily the result of an increase in merchandise inventories versus a decre a s e
in fiscal 1997. The increase in cash provided by operating activities in fiscal 1997 versus that of fiscal 1996
reflects the increased earnings attributable to the Marshalls acquisition, as well as the Company’s move-
ment to a leaner inventory position as compared to fiscal 1996 year-end levels. Inventories as a perc e n t a g e
of net sales were 16.1% in fiscal 1998, 15.8% in fiscal 1997 and 31.6% in fiscal 1996. The fiscal 1996 per-
centage is not comparable since Marshalls’ net sales are included only from November 18, 1995. Using
unaudited pro forma net sales for fiscal 1996 (see Note A to the consolidated financial statements), which
assumes Marshalls was acquired at the beginning of the fiscal year, inventories as a percentage of net sales
in fiscal 1996 would be 20.7%. The strong sales volume, coupled with tight inventory control, resulted in
faster inventory turns, all of which were favorable to cash flows and the inventory ratios for fiscal 1998 and
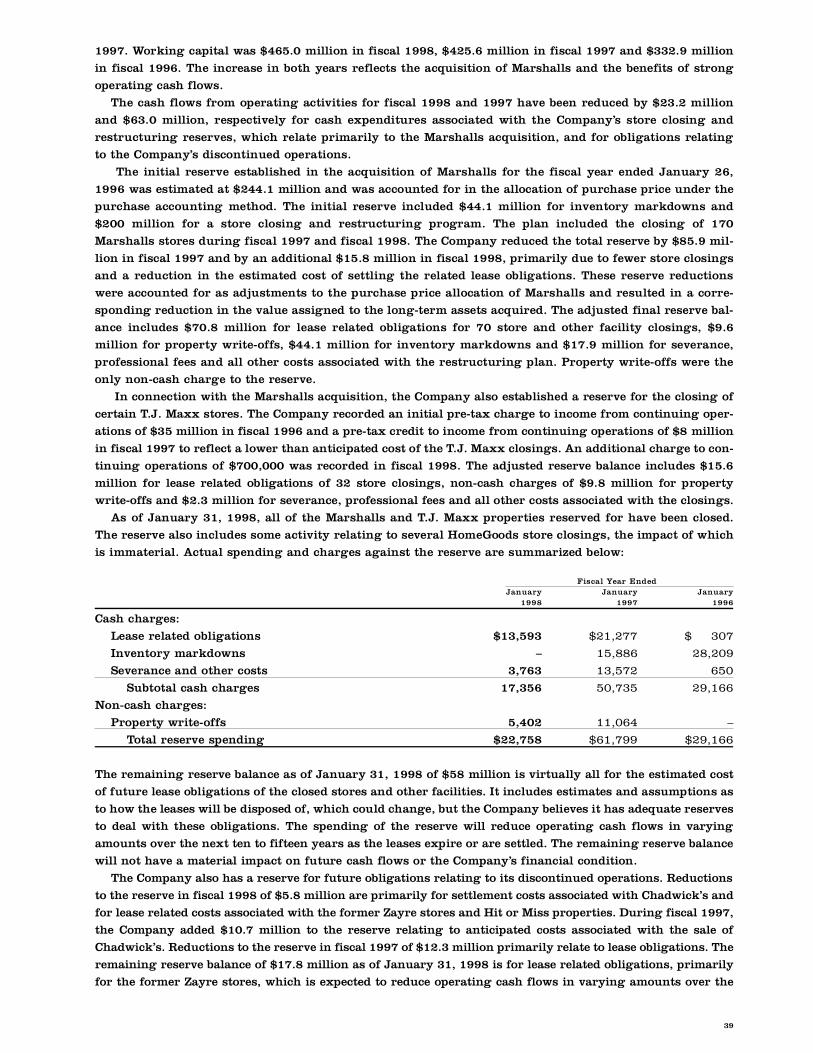
39
1997. Working capital was $465.0 million in fiscal 1998, $425.6 million in fiscal 1997 and $332.9 million
in fiscal 1996. The increase in both years reflects the acquisition of Marshalls and the benefits of stro n g
operating cash flows.
The cash flows from operating activities for fiscal 1998 and 1997 have been reduced by $23.2 million
and $63.0 million, respectively for cash expenditures associated with the Company’s store closing and
re s t ructuring re s e rves, which relate primarily to the Marshalls acquisition, and for obligations re l a t i n g
to the Company’s discontinued operations.
The initial re s e rve established in the acquisition of Marshalls for the fiscal year ended January 26,
1996 was estimated at $244.1 million and was accounted for in the allocation of purchase price under the
p u rchase accounting method. The initial re s e rve included $44.1 million for inventory markdowns and
$200 million for a store closing and re s t ructuring program. The plan included the closing of 170
Marshalls stores during fiscal 1997 and fiscal 1998. The Company reduced the total re s e rve by $85.9 mil-
lion in fiscal 1997 and by an additional $15.8 million in fiscal 1998, primarily due to fewer store closings
and a reduction in the estimated cost of settling the related lease obligations. These re s e rve re d u c t i o n s
w e re accounted for as adjustments to the purchase price allocation of Marshalls and resulted in a corre-
sponding reduction in the value assigned to the long-term assets acquired. The adjusted final re s e rve bal-
ance includes $70.8 million for lease related obligations for 70 store and other facility closings, $9.6
million for pro p e rty write-offs, $44.1 million for inventory markdowns and $17.9 million for severance,
p rofessional fees and all other costs associated with the re s t ructuring plan. Pro p e rty write-offs were the
only non-cash charge to the re s e rve.
In connection with the Marshalls acquisition, the Company also established a re s e rve for the closing of
c e rtain T.J. Maxx stores. The Company re c o rded an initial pre-tax charge to income from continuing oper-
ations of $35 million in fiscal 1996 and a pre-tax credit to income from continuing operations of $8 million
in fiscal 1997 to reflect a lower than anticipated cost of the T.J. Maxx closings. An additional charge to con-
tinuing operations of $700,000 was re c o rded in fiscal 1998. The adjusted re s e rve balance includes $15.6
million for lease related obligations of 32 store closings, non-cash charges of $9.8 million for pro p e rt y
w r i t e - o ffs and $2.3 million for severance, professional fees and all other costs associated with the closings.
As of January 31, 1998, all of the Marshalls and T.J. Maxx pro p e rties re s e rved for have been closed.
The re s e rve also includes some activity relating to several HomeGoods store closings, the impact of which
is immaterial. Actual spending and charges against the re s e rve are summarized below:
Fiscal Year EndedJ a n u a ry J a n u a ry J a n u a ry
1 9 9 8 1 9 9 7 1 9 9 6
Cash charg e s :
Lease related obligations $ 1 3 , 5 9 3 $ 2 1 , 2 7 7 $ 3 0 7
I n v e n t o ry markdowns – 1 5 , 8 8 6 2 8 , 2 0 9
Severance and other costs 3 , 7 6 3 1 3 , 5 7 2 6 5 0
Subtotal cash charg e s 1 7 , 3 5 6 5 0 , 7 3 5 2 9 , 1 6 6
Non-cash charg e s :
P ro p e rty write-off s 5 , 4 0 2 1 1 , 0 6 4 –
Total re s e rve spending $ 2 2 , 7 5 8 $ 6 1 , 7 9 9 $ 2 9 , 1 6 6
The remaining re s e rve balance as of January 31, 1998 of $58 million is virtually all for the estimated cost
of future lease obligations of the closed stores and other facilities. It includes estimates and assumptions as
to how the leases will be disposed of, which could change, but the Company believes it has adequate re s e rv e s
to deal with these obligations. The spending of the re s e rve will reduce operating cash flows in vary i n g
amounts over the next ten to fifteen years as the leases expire or are settled. The remaining re s e rve balance
will not have a material impact on future cash flows or the Company’s financial condition.
The Company also has a reserve for future obligations relating to its discontinued operations. Reductions
to the reserve in fiscal 1998 of $5.8 million are primarily for settlement costs associated with Chadwick’s and
for lease related costs associated with the former Zayre stores and Hit or Miss properties. During fiscal 1997,
the Company added $10.7 million to the reserve relating to anticipated costs associated with the sale of
Chadwick’s. Reductions to the reserve in fiscal 1997 of $12.3 million primarily relate to lease obligations. The
remaining reserve balance of $17.8 million as of January 31, 1998 is for lease related obligations, primarily
for the former Zayre stores, which is expected to reduce operating cash flows in varying amounts over the
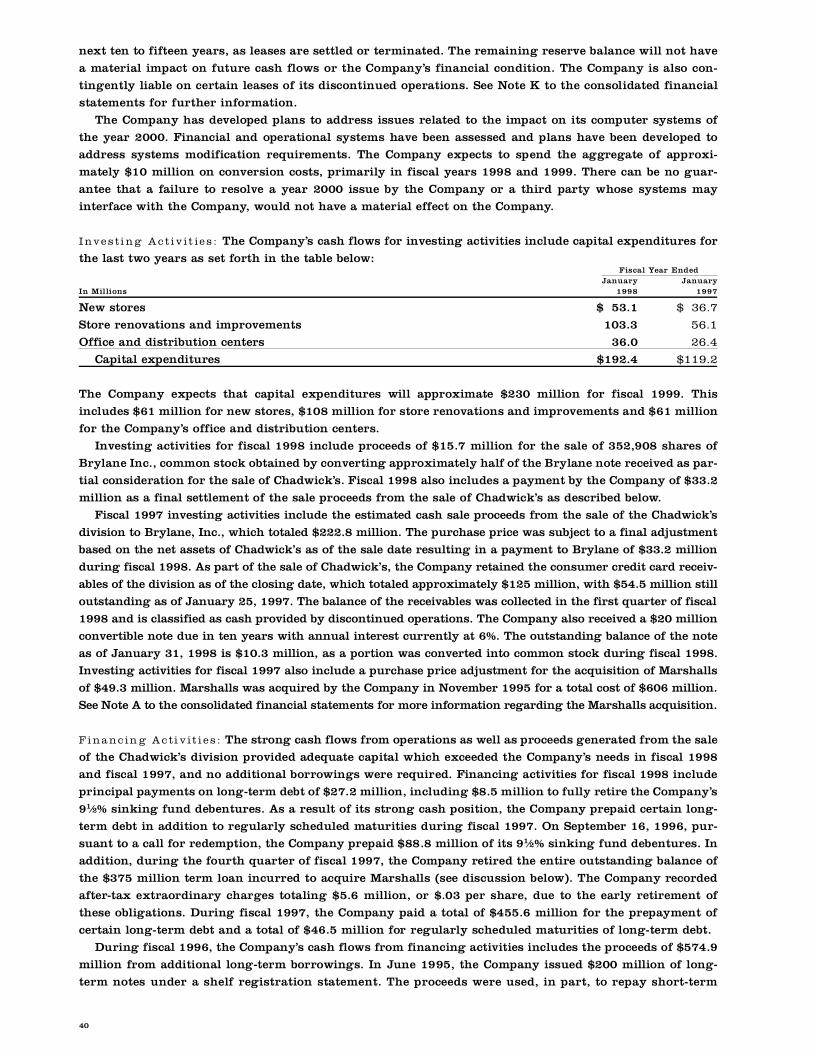
40
next ten to fifteen years, as leases are settled or terminated. The remaining re s e rve balance will not have
a material impact on future cash flows or the Company’s financial condition. The Company is also con-
tingently liable on certain leases of its discontinued operations. See Note K to the consolidated financial
statements for further inform a t i o n .
The Company has developed plans to address issues related to the impact on its computer systems of
the year 2000. Financial and operational systems have been assessed and plans have been developed to
a d d ress systems modification re q u i rements. The Company expects to spend the aggregate of appro x i-
mately $10 million on conversion costs, primarily in fiscal years 1998 and 1999. There can be no guar-
antee that a failure to resolve a year 2000 issue by the Company or a third party whose systems may
i n t e rface with the Company, would not have a material effect on the Company.
I n v e s t i n g A c t i v i t ie s : The Company’s cash flows for investing activities include capital expenditures for
the last two years as set forth in the table below:Fiscal Year Ended
J a n u a ry J a n u a ryIn Millions 1 9 9 8 1 9 9 7
New store s $ 5 3 . 1 $ 3 6 . 7
S t o re renovations and impro v e m e n t s 1 0 3 . 3 5 6 . 1
O ffice and distribution centers 3 6 . 0 2 6 . 4
Capital expenditure s $ 1 9 2 . 4 $ 1 1 9 . 2
The Company expects that capital expenditures will approximate $230 million for fiscal 1999. This
includes $61 million for new stores, $108 million for store renovations and improvements and $61 million
for the Company’s office and distribution centers.
Investing activities for fiscal 1998 include proceeds of $15.7 million for the sale of 352,908 shares of
B rylane Inc., common stock obtained by converting approximately half of the Brylane note received as par-
tial consideration for the sale of Chadwick’s. Fiscal 1998 also includes a payment by the Company of $33.2
million as a final settlement of the sale proceeds from the sale of Chadwick’s as described below.
Fiscal 1997 investing activities include the estimated cash sale proceeds from the sale of the Chadwick’s
division to Brylane, Inc., which totaled $222.8 million. The purchase price was subject to a final adjustment
based on the net assets of Chadwick’s as of the sale date resulting in a payment to Brylane of $33.2 million
during fiscal 1998. As part of the sale of Chadwick’s, the Company retained the consumer credit card receiv-
ables of the division as of the closing date, which totaled approximately $125 million, with $54.5 million still
outstanding as of January 25, 1997. The balance of the receivables was collected in the first quarter of fiscal
1998 and is classified as cash provided by discontinued operations. The Company also received a $20 million
convertible note due in ten years with annual interest currently at 6%. The outstanding balance of the note
as of January 31, 1998 is $10.3 million, as a portion was converted into common stock during fiscal 1998.
Investing activities for fiscal 1997 also include a purchase price adjustment for the acquisition of Marshalls
of $49.3 million. Marshalls was acquired by the Company in November 1995 for a total cost of $606 million.
See Note A to the consolidated financial statements for more information re g a rding the Marshalls acquisition.
F i n a n c in g A c t i v i t i e s : The strong cash flows from operations as well as proceeds generated from the sale
of the Chadwick’s division provided adequate capital which exceeded the Company’s needs in fiscal 1998
and fiscal 1997, and no additional borrowings were re q u i red. Financing activities for fiscal 1998 include
principal payments on long-term debt of $27.2 million, including $8.5 million to fully re t i re the Company’s
91⁄2% sinking fund debentures. As a result of its strong cash position, the Company prepaid certain long-
t e rm debt in addition to regularly scheduled maturities during fiscal 1997. On September 16, 1996, pur-
suant to a call for redemption, the Company prepaid $88.8 million of its 91⁄2% sinking fund debentures. In
addition, during the fourth quarter of fiscal 1997, the Company re t i red the entire outstanding balance of
the $375 million term loan incurred to acquire Marshalls (see discussion below). The Company re c o rd e d
a f t e r-tax extraord i n a ry charges totaling $5.6 million, or $.03 per share, due to the early re t i rement of
these obligations. During fiscal 1997, the Company paid a total of $455.6 million for the prepayment of
c e rtain long-term debt and a total of $46.5 million for regularly scheduled maturities of long-term debt.
During fiscal 1996, the Company’s cash flows from financing activities includes the proceeds of $574.9
million from additional long-term borrowings. In June 1995, the Company issued $200 million of long-
t e rm notes under a shelf registration statement. The proceeds were used, in part, to repay short - t e rm
41
b o rrowings and for general corporate purposes. The Company currently has a shelf registration statement
which provides for the issuance of up to $600 million of debt or equity. In connection with the purc h a s e
of Marshalls, the Company entered into an $875 million bank credit agreement under which the Company
b o rrowed $375 million on a long-term basis to fund the cash portion of the Marshalls purchase price.
The agreement also included a $500 million revolving loan capability which was terminated prior to its
m a t u r i t y, resulting in an after-tax extraord i n a ry charge of $1.8 million, or $.01 per share, in fiscal 1998.
The Company entered into a new revolving credit agreement in September 1997 as discussed below.
In June 1997, the Company announced a $250 million stock buyback program. During fiscal 1998, the Company
re p u rchased 8.5 million shares of common stock for a cost of $245.2 million. The program was completed in
F e b ru a ry 1998 at which time the Company announced a second $250 million stock re p u rchase pro g r a m .
The Company declared quarterly dividends on its common stock of $.05 per share in fiscal 1998 and $.035
per share in fiscal 1997. Annual dividends on common stock totaled $31.8 million in fiscal 1998 and $21.3
million in fiscal 1997. The Company also paid dividends on all of its outstanding preferred stock, which
totaled $11.7 million in fiscal 1998, $13.7 million in fiscal 1997 and $9.4 million in fiscal 1996. During fis-
cal 1998, 770,200 shares of the Series E preferred stock were converted into 8.3 million shares of common
stock and 2,500 shares were repurchased. Inducement fees of $3.8 million were paid on the Series E con-
versions, which are classified as preferred dividends for fiscal 1998. The 727,300 outstanding shares of the
Series E preferred stock as of January 31, 1998 will automatically convert into common stock on November
17, 1998. During fiscal 1997, both the Series A cumulative convertible preferred stock and the Series C cumu-
lative convertible preferred stock were converted into an aggregate of 4.4 million shares of common stock
pursuant to separate calls for redemption. Preferred dividends were paid through the respective conversion
dates. The Series D preferred stock automatically converted on November 17, 1996 into 1.3 million shares of
common stock. Financing activities for fiscal 1998 and 1997 also includes proceeds of $15.5 million and
$34.4 million, respectively, from the exercise of employee stock options. The proceeds include $6.1 million
and $10.2 million for related tax benefits in fiscal 1998 and fiscal 1997, respectively.
The Company has traditionally funded its seasonal merchandise re q u i rements through short - t e rm bank
b o rrowings and the issuance of short - t e rm commercial paper. The Company has the ability to borrow up
to $500 million under a revolving credit facility it entered into in September 1997. This agre e m e n t
replaced the agreement entered into at the time of the Marshalls acquisition and contains certain finan-
cial covenants which include a minimum net worth re q u i rement and certain leverage and fixed charg e
coverage ratios. The Company re c o rded an extraord i n a ry charge of $1.8 million, or $.01 per share, on the
w r i t e - o ff of deferred financing costs associated with the former agreement. As of January 31, 1998, the
e n t i re $500 million was available for use. The Company’s strong cash position throughout fiscal 1998 and
1997 re q u i red minimal short - t e rm borrowings. There were no U.S. short - t e rm borrowings outstanding
during fiscal 1998. The maximum amount of U.S. short - t e rm borrowings outstanding during fiscal 1997
and 1996 was $3 million and $200 million, re s p e c t i v e l y. The Company also has C$30 million of committed
lines for its Canadian operations, all of which were available for use as of January 31, 1998. The maxi-
mum amount outstanding under its Canadian credit line during fiscal 1998 and 1997 was C$12.1 million
and C$6 million, re s p e c t i v e l y. Management believes that its current credit facilities and availability under
its shelf registration statement are more than adequate to meet its needs. See Notes B and F to the con-
solidated financial statements for further information re g a rding the Company’s long-term debt, capital
stock transactions and available financing sourc e s .
The Company is exposed to foreign currency exchange rate risk on its investment in its Canadian
( Winners) and European (T.K. Maxx) operations. As more fully described in Note C to the consolidated
financial statements, the Company hedges a large portion of its net investment and certain merc h a n d i s e
commitments in these operations with derivative financial instruments. The Company utilizes curre n c y
f o rw a rds and swaps, designed to offset the gains or losses in the underlying exposures, most of which are
re c o rded directly in shareholders’ equity. The contracts are executed with cre d i t w o rthy banks and are
denominated in currencies of major industrial countries. The Company does not enter into derivatives for
speculative trading purposes.
The Company has perf o rmed a sensitivity analysis assuming a hypothetical 10% adverse movement in
f o reign exchange rates applied to the hedging contracts and the underlying exposures described above.
As of January 31, 1998, the analysis indicated that such market movements would not have a material
e ffect on the Company’s consolidated financial position, results of operations or cash flows.
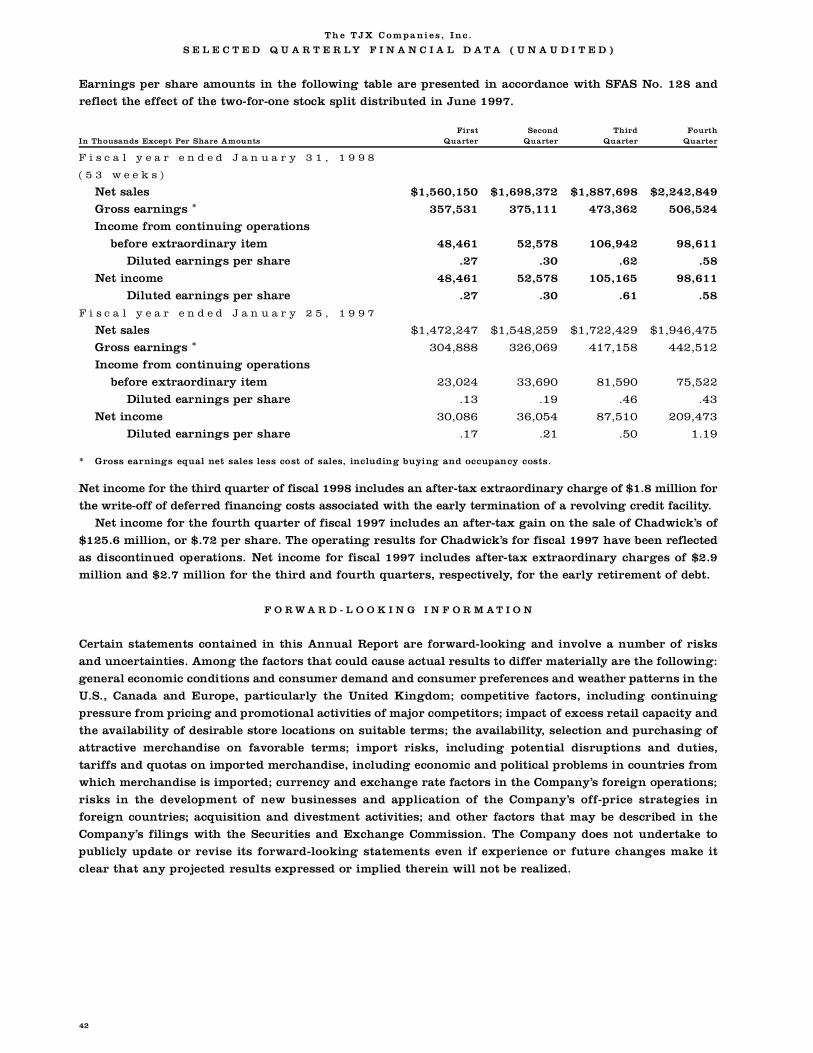
Th e T JX C om pa ni es , Inc .
42
S E L E C T E D Q U A R T E R L Y F I N A N C I A L D A T A ( U N A U D I T E D )
E a rnings per share amounts in the following table are presented in accordance with SFAS No. 128 and
reflect the effect of the two-for-one stock split distributed in June 1997.
F i r s t S e c o n d T h i rd F o u rt hIn Thousands Except Per Share Amounts Q u a rt e r Q u a rt e r Q u a rt e r Q u a rt e r
F i s c a l y e a r e n d e d J a n u a r y 3 1 , 1 9 9 8
( 5 3 w e e k s )
Net sales $ 1 , 5 6 0 , 1 5 0 $ 1 , 6 9 8 , 3 7 2 $ 1 , 8 8 7 , 6 9 8 $ 2 , 2 4 2 , 8 4 9
G ross earnings * 3 5 7 , 5 3 1 3 7 5 , 1 1 1 4 7 3 , 3 6 2 5 0 6 , 5 2 4
Income from continuing operations
b e f o re extraord i n a ry item 4 8 , 4 6 1 5 2 , 5 7 8 1 0 6 , 9 4 2 9 8 , 6 1 1
Diluted earnings per share . 2 7 . 3 0 . 6 2 . 5 8
Net income 4 8 , 4 6 1 5 2 , 5 7 8 1 0 5 , 1 6 5 9 8 , 6 1 1
Diluted earnings per share . 2 7 . 3 0 . 6 1 . 5 8
F i s c a l y e a r e n d e d J a n u a r y 2 5 , 1 9 9 7
Net sales $ 1 , 4 7 2 , 2 4 7 $ 1 , 5 4 8 , 2 5 9 $ 1 , 7 2 2 , 4 2 9 $ 1 , 9 4 6 , 4 7 5
G ross earnings * 3 0 4 , 8 8 8 3 2 6 , 0 6 9 4 1 7 , 1 5 8 4 4 2 , 5 1 2
Income from continuing operations
b e f o re extraord i n a ry item 2 3 , 0 2 4 3 3 , 6 9 0 8 1 , 5 9 0 7 5 , 5 2 2
Diluted earnings per share . 1 3 . 1 9 . 4 6 . 4 3
Net income 3 0 , 0 8 6 3 6 , 0 5 4 8 7 , 5 1 0 2 0 9 , 4 7 3
Diluted earnings per share . 1 7 . 2 1 . 5 0 1 . 1 9
* G ross earnings equal net sales less cost of sales, including buying and occupancy costs.
Net income for the third quarter of fiscal 1998 includes an after-tax extraordinary charge of $1.8 million for
the write-off of deferred financing costs associated with the early termination of a revolving credit facility.
Net income for the fourth quarter of fiscal 1997 includes an after-tax gain on the sale of Chadwick’s of
$125.6 million, or $.72 per share. The operating results for Chadwick’s for fiscal 1997 have been re f l e c t e d
as discontinued operations. Net income for fiscal 1997 includes after-tax extraord i n a ry charges of $2.9
million and $2.7 million for the third and fourth quarters, re s p e c t i v e l y, for the early re t i rement of debt.
F O R W A R D - L O O K I N G I N F O R M A T I O N
C e rtain statements contained in this Annual Report are forw a rd-looking and involve a number of risks
and uncertainties. Among the factors that could cause actual results to differ materially are the following:
general economic conditions and consumer demand and consumer pre f e rences and weather patterns in the
U.S., Canada and Europe, particularly the United Kingdom; competitive factors, including continuing
p re s s u re from pricing and promotional activities of major competitors; impact of excess retail capacity and
the availability of desirable store locations on suitable terms; the availability, selection and purchasing of
attractive merchandise on favorable terms; import risks, including potential disruptions and duties,
t a r i ffs and quotas on imported merchandise, including economic and political problems in countries fro m
which merchandise is imported; currency and exchange rate factors in the Company’s foreign operations;
risks in the development of new businesses and application of the Company’s off-price strategies in
f o reign countries; acquisition and divestment activities; and other factors that may be described in the
C o m p a n y ’s filings with the Securities and Exchange Commission. The Company does not undertake to
publicly update or revise its forw a rd-looking statements even if experience or future changes make it
clear that any p rojected results expressed or implied therein will not be re a l i z e d .