Embed Size (px)
Citation preview

28 March 2017
Visualising flooding: a view from the street
Flood & Coast 2017
David Ramsbottom and Gordon Glasgow
© HR Wallingford 2017
View from a tree?
28 March 2017
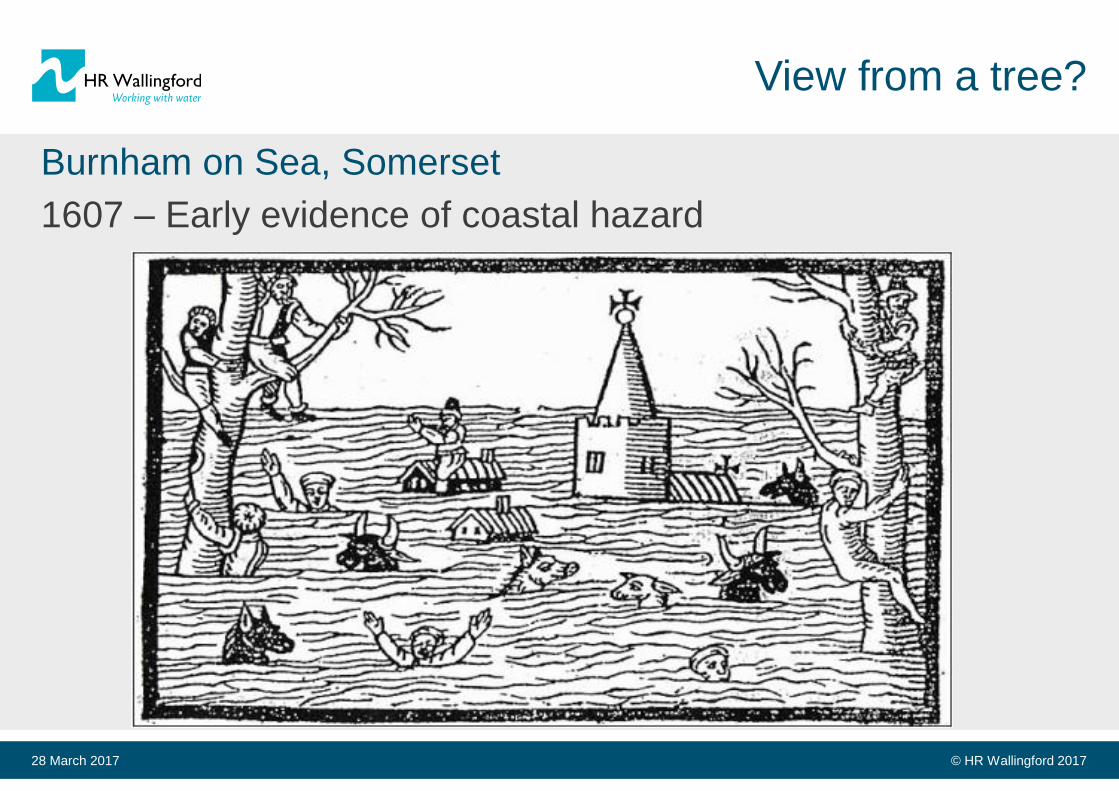
Burnham on Sea, Somerset
1607 – Early evidence of coastal hazard

© HR Wallingford 2017
Brisbane flood map
28 March 2017

© HR Wallingford 2017
Examples of 3D visualisations
28 March 2017
© HR Wallingford 2017
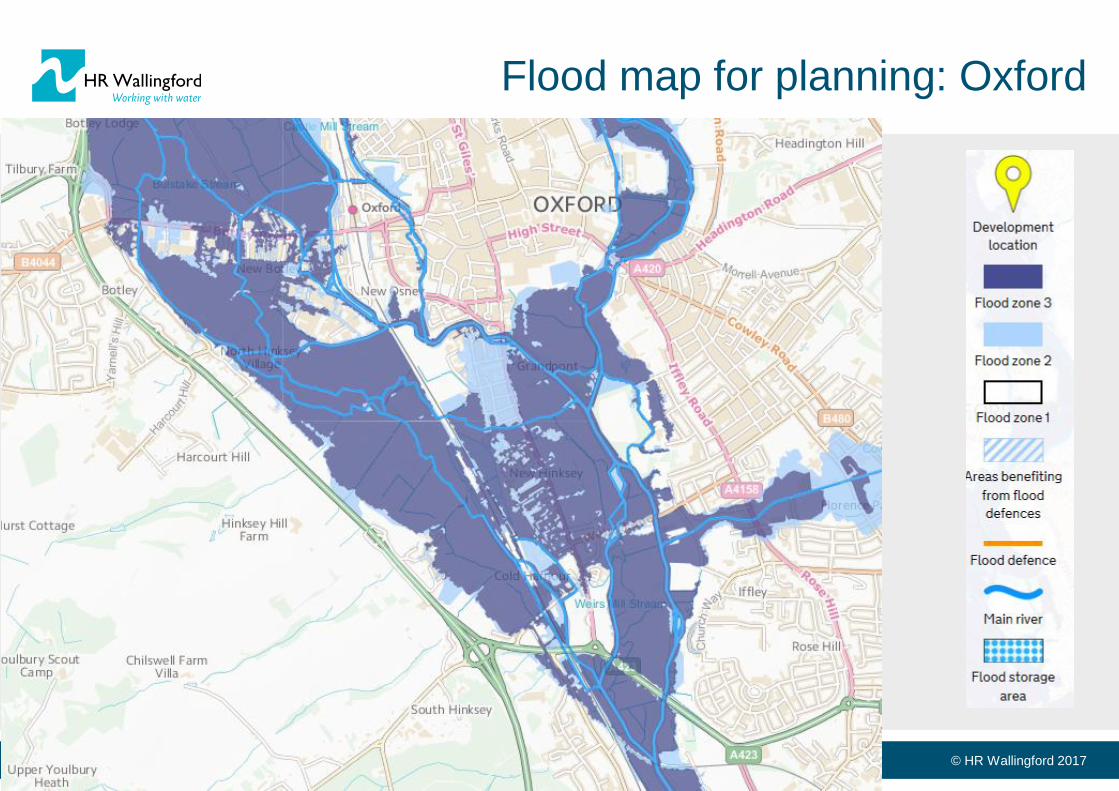
Flood map for planning: Oxford
28 March 2017

© HR Wallingford 2017
Current flood communication: Oxford
28 March 2017
© HR Wallingford 2017
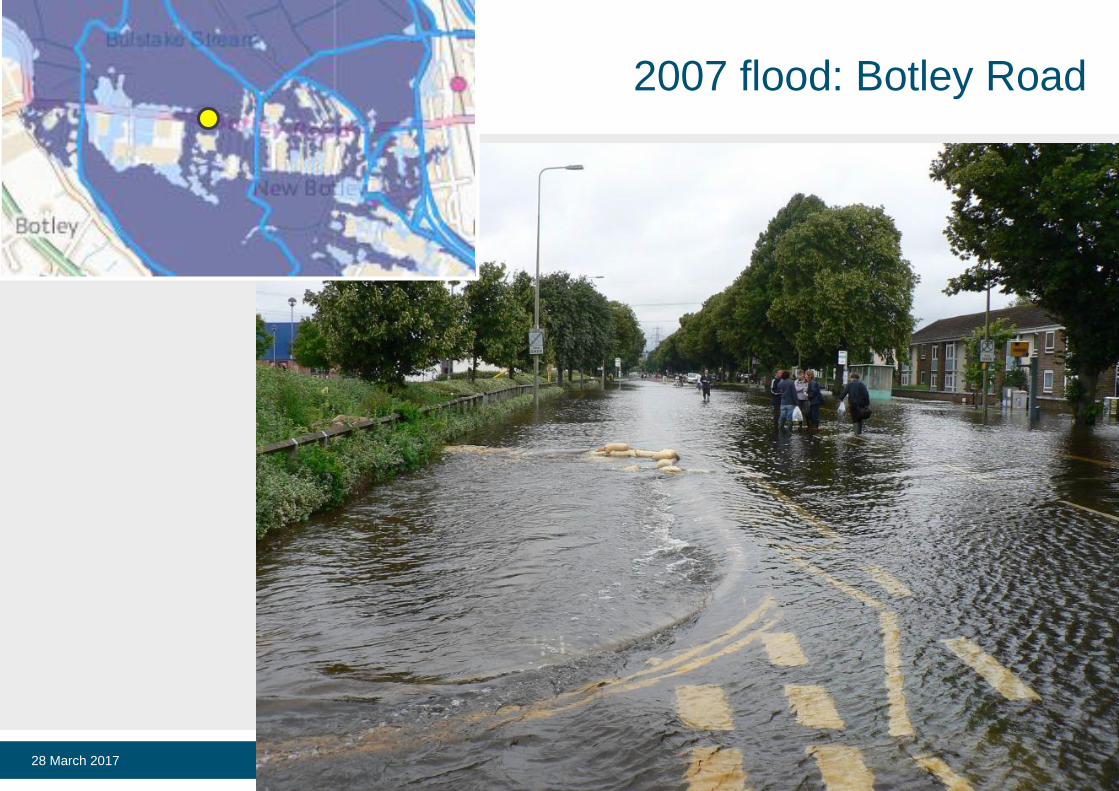
2007 flood: Botley Road
28 March 2017
© HR Wallingford 2017
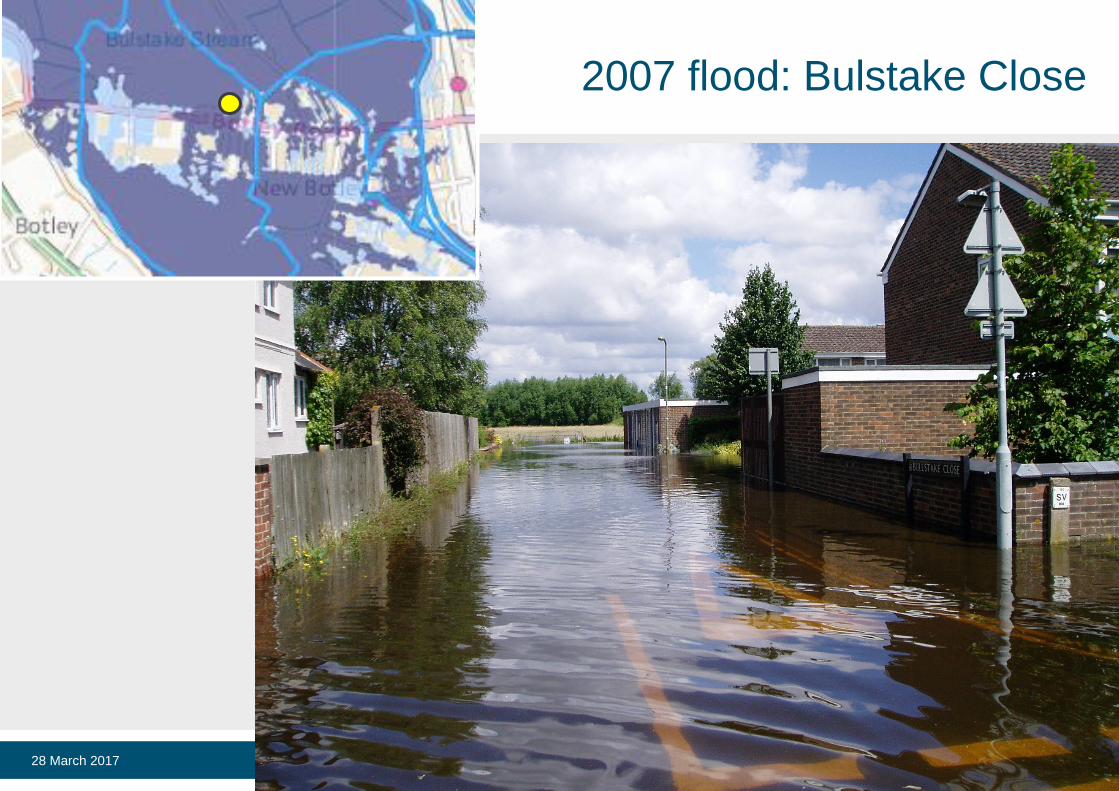
2007 flood: Bulstake Close
28 March 2017

© HR Wallingford 2017
2007 flood: Binsey Lane
28 March 2017
© HR Wallingford 2017
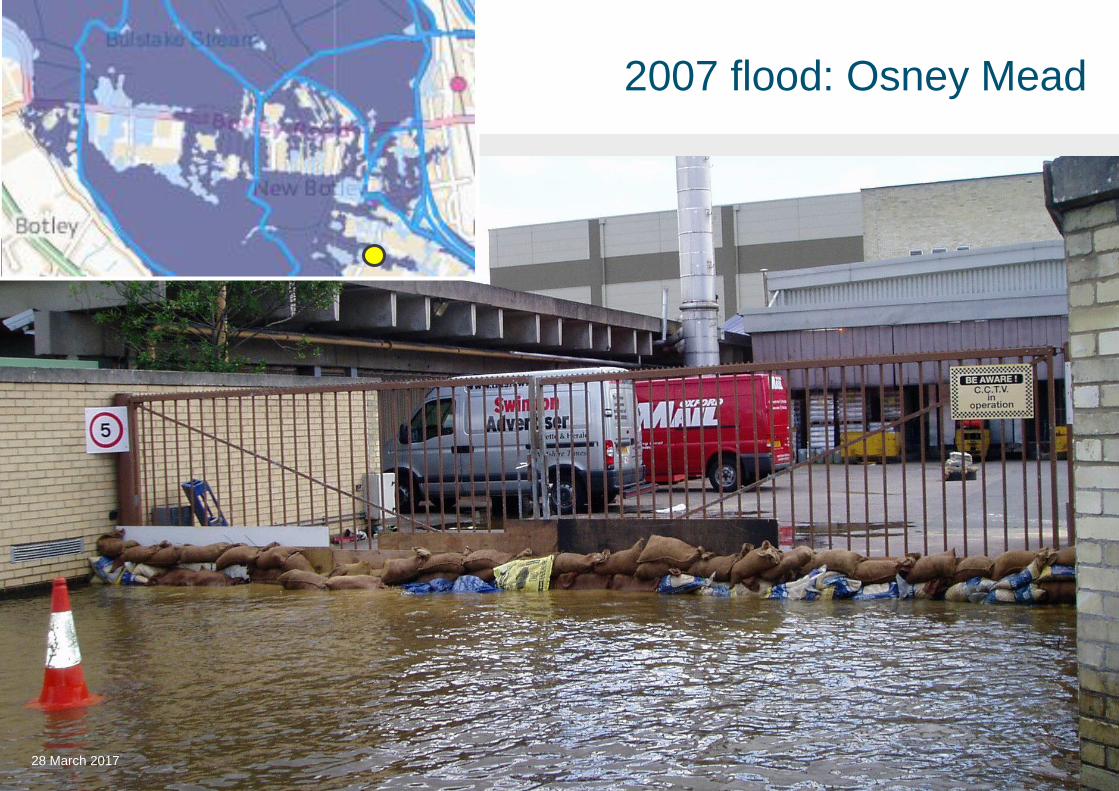
2007 flood: Osney Mead
28 March 2017
© HR Wallingford 2017
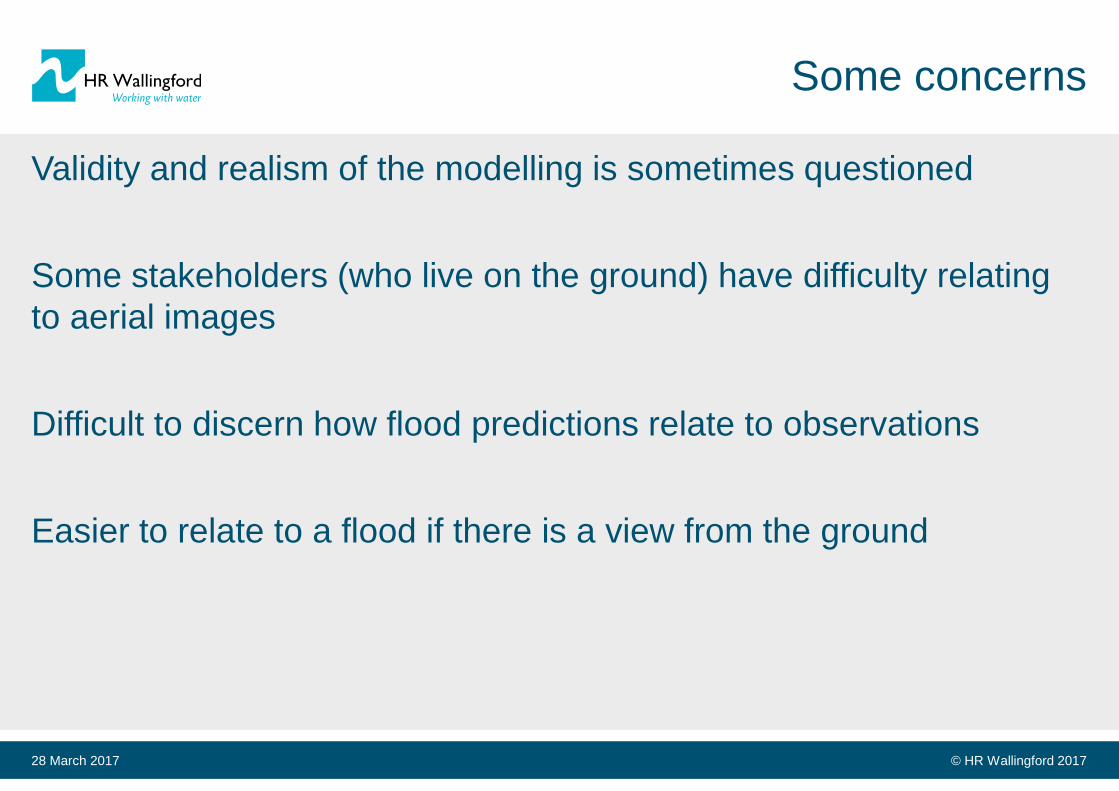
Some concerns
Validity and realism of the modelling is sometimes questioned
Some stakeholders (who live on the ground) have difficulty relating
to aerial images
Difficult to discern how flood predictions relate to observations
Easier to relate to a flood if there is a view from the ground
28 March 2017
© HR Wallingford 2017
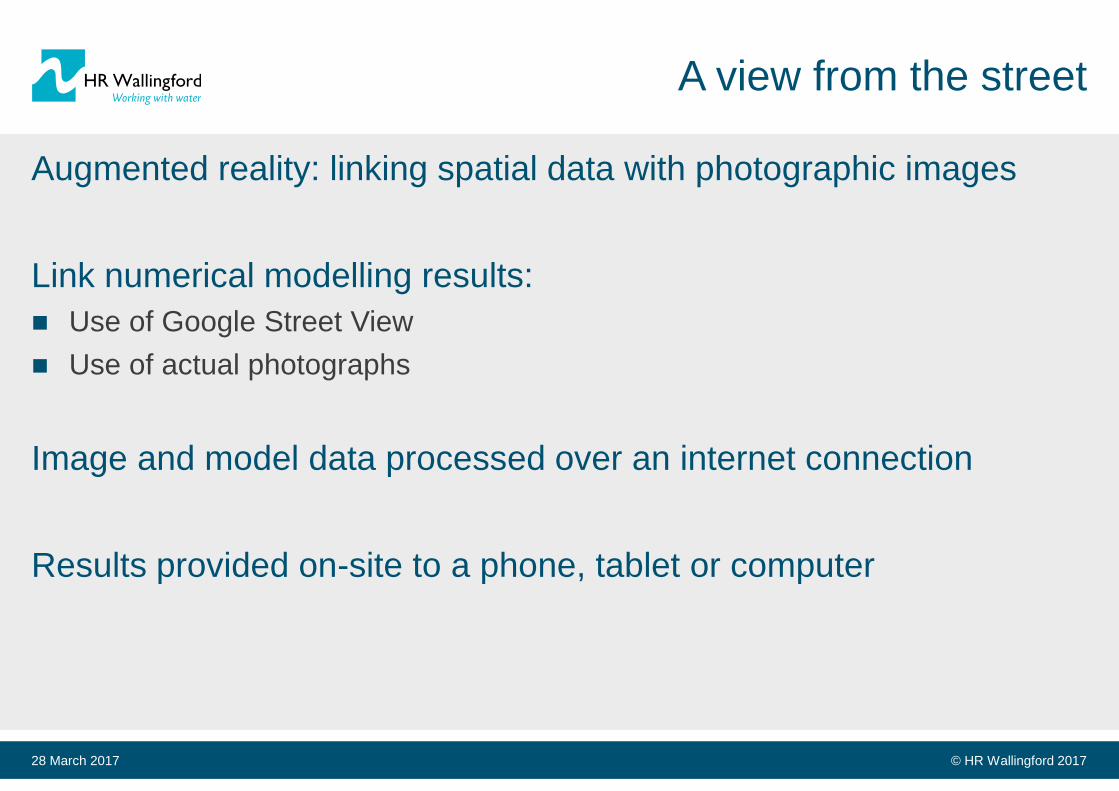
A view from the street
Augmented reality: linking spatial data with photographic images
Link numerical modelling results:
Use of Google Street View
Use of actual photographs
Image and model data processed over an internet connection
Results provided on-site to a phone, tablet or computer
28 March 2017
© HR Wallingford 2017
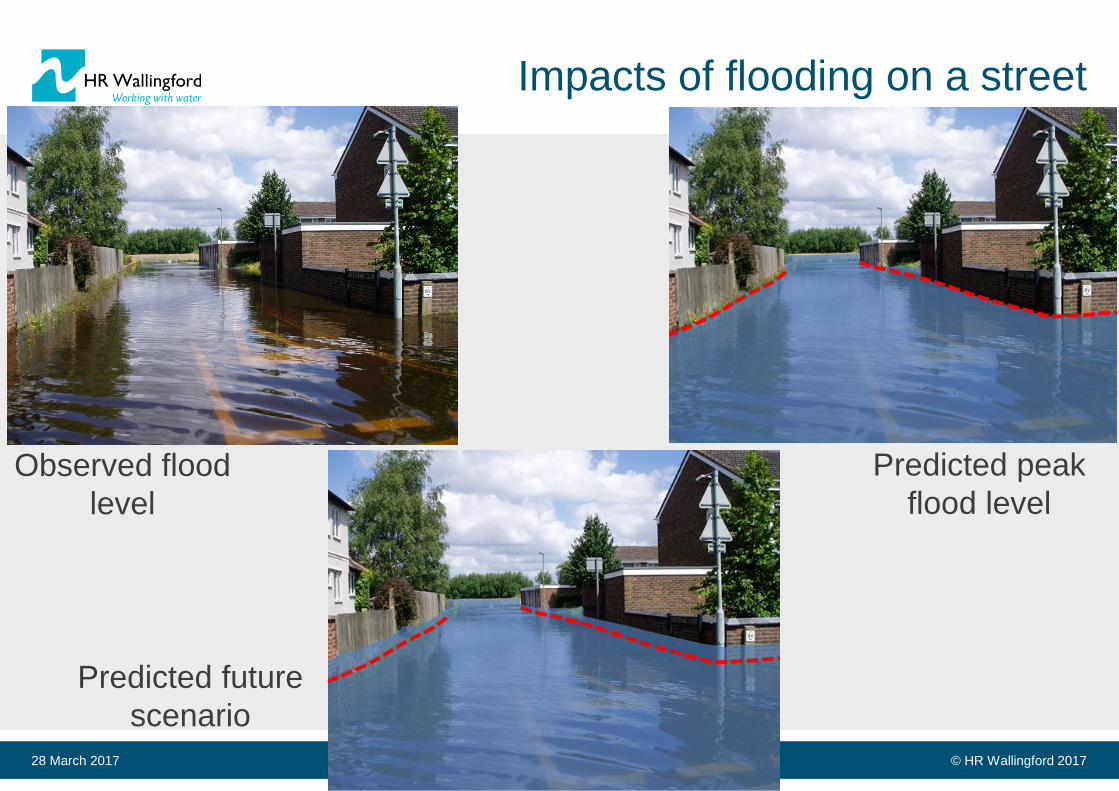
Impacts of flooding on a street
28 March 2017
Predicted peak
flood level
Predicted future
scenario
Observed flood
level
© HR Wallingford 2017
Impacts of flooding on properties
28 March 2017
Predicted peak
flood level
Predicted future
scenario
Observed flood
level

© HR Wallingford 201728 March 2017
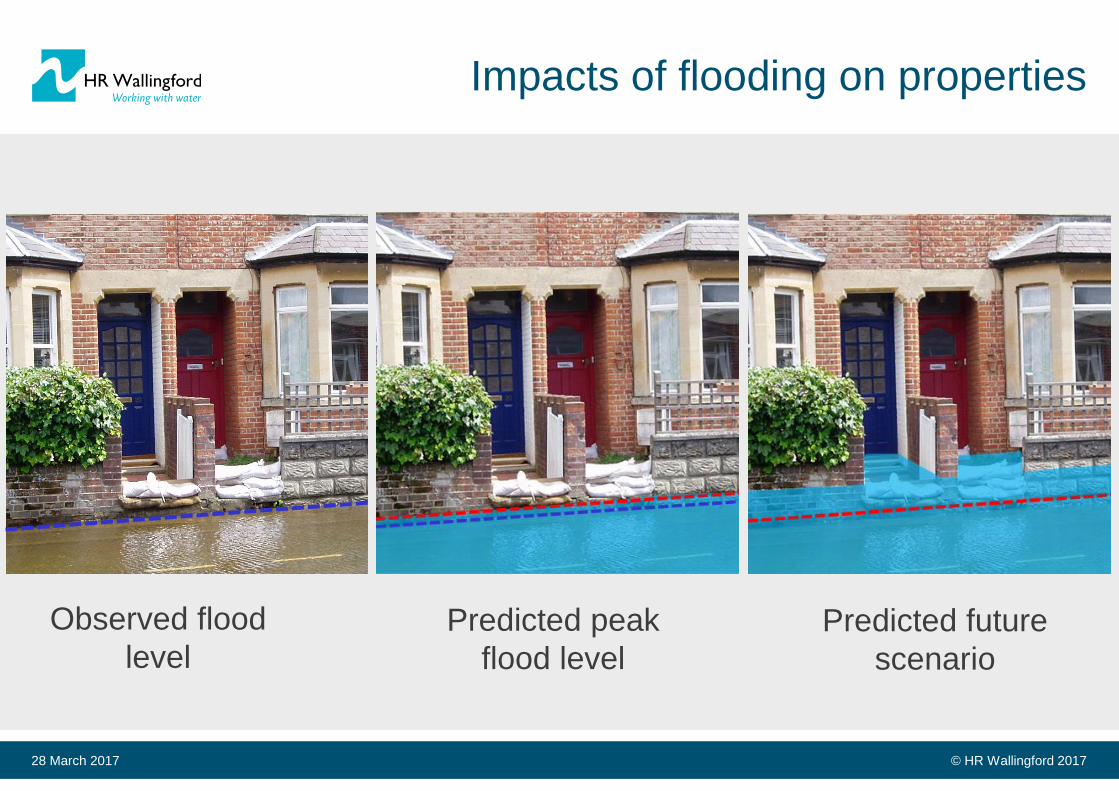
Impacts of flooding on properties
Observed flood
level
Predicted peak
flood level
Predicted future
scenario
© HR Wallingford 2017
Benefits
Adds credibility to model results for observed floods by showing
results at street level: improves confidence
Stakeholders can contribute to model calibration
Use to demonstrate impacts of scenarios:
Flood levels for events of different magnitudes
Reductions in water levels due to scheme
Impacts of climate change
Use to plan and design flood resistance measures
28 March 2017
28 March 2017
Thank you
David Ramsbottom and Gordon Glasgow