Embed Size (px)
Citation preview
NATIONAL CENTER FOR EDUCATION STATISTICS
E.D. Tabs February 2001
Degrees and Other AwardsConferred by Title IV Participating,Degree-granting Institutions: 1997-98
Frank B. Morgan
Postsecondary Studies Division
U.S. Department of Education
Office of Educational Research and Improvement NCES 2001-177
U.S. Department of Education Rod Paige Secretary Office of Educational Research and Improvement Sue Betka Deputy Assistant Secretary National Center for Education Statistics Gary W. Phillips Acting Commissioner The National Center for Education Statistics (NCES) is the primary federal entity for collecting,
analyzing, and reporting data related to education in the United States and other nations. It fulfills a congressional mandate to collect, collate, analyze, and report full and complete statistics on the condition of education in the United States; conduct and publish reports and specialized analyses of the meaning and significance of such statistics; assist state and local education agencies in improving their statistical systems; and review and report on education activities in foreign countries.
NCES activities are designed to address high priority education data needs; provide consistent,
reliable, complete, and accurate indicators of education status and trends; and report timely, useful, and high quality data to the U.S. Department of Education, the Congress, the states, other education policymakers, practitioners, data users, and the general public.
We strive to make our products available in a variety of formats and in languages that are appropriate
to a variety of audiences. You, as our customer, are the best judge of our success in communicating information effectively. If you have any comments or suggestions about this or any other NCES product or report, we would like to hear from you. Please direct your comments to:
National Center for Education Statistics Office of Educational Research and Improvement U.S. Department of Education 1990 K Street, N.W. Washington, DC 20006-5574 February 2001 The NCES World Wide Web Home Page address is http://nces.ed.gov/ Suggested Citation U.S. Department of Education, National Center for Education Statistics, [E.D. Tabs] Degrees and
Other Awards Conferred by Title IV Participating, Degree-granting Institutions: 1997-98, NCES 2001-177, by Frank B. Morgan, Washington, DC: 2000.
Content Contact: Frank B. Morgan (202) 502-7413 Copies of this publication are available on the NCES web site as an Adobe document and may be
either downloaded or printed directly. The URL for the publication is http://nces.ed.gov/pubsearch/pubsinfo.asp?pubid=2001177 .
iii
Acknowledgments
The information presented in this publication was provided by either state coordinators for the Integrated Postsecondary Education Data System (IPEDS) or officials at individual institutions. In addition, these persons provided much assistance in resolving questions on the data which resulted in more accurate information. Although it is not possible to list the names of all these people, their assistance was invaluable and is much appreciated. The Office for Civil Rights, U.S. Department of Education, and the National Center for Education Statistics (NCES), with the approval of the Office of Management and Budget, cooperate in the collection of racial/ethnic information from postsecondary education institutions. The author is grateful to Brenda Ashford, American Association of Collegiate Registrars and Admissions Officers; Kent Phillipe and Christopher Shults of American Association of Community Colleges; and Susan Broyles, Dennis Carroll, Charlene Hoffman, Frank Johnson, Paula Knepper, and Ralph Lee of the National Center for Education Statistics for their valuable comments during the review of this publication.
iv
Contents Acknowledgments ...........................................................................................................................iii Summary ..................................................................................................................................1 Degrees Awarded .....................................................................................................................1 Degree Fields ............................................................................................................................2 Compendium of Tables ...................................................................................................................11 Methodology ................................................................................................................................69 Overview ................................................................................................................................69 Universe, Institutions Surveyed, and Response Rates..............................................................69 Editing ................................................................................................................................71 Imputations .............................................................................................................................71 List of Tables Table A Number and percent distribution of degrees conferred by Title IV
participating, degree-granting institutions, by level of degree, control of institution, race/ethnicity and gender: 50 states and District of Columbia,
1997-98.....................................................................................................................4 Table B Degrees conferred by Title IV participating, degree-granting institutions, by
level of degree, control of institution, race/ethnicity and gender: 50 states and District of Columbia, 1996-97 and 1997-98........................................................5
Table C Number and percentage of associate’s degrees conferred by Title IV
participating, degree-granting institutions, by level of institution and field of study: 50 states and District of Columbia, 1997-98 ..................................................7
Table D Number and percentage of degrees conferred by Title IV participating,
degree-granting institutions, by level of degree and field of study: 50 states and District of Columbia, 1997-98............................................................................8
Table E Fields of study receiving the largest number of bachelor’s, master’s, and
doctor’s degrees conferred by Title IV participating, degree-granting institutions, by level of degree and gender: 50 states and District of Columbia, 1997-98 ...................................................................................................9
Table 1a Degrees conferred by Title IV participating, degree-granting institutions, by
control of institution, level of degree, and gender: 50 states and District of Columbia, 1997-98 .................................................................................................13
v
Table 1b First-professional degrees conferred by Title IV participating, degree-granting institutions, by control of institution, field of study, and gender: 50 states and District of Columbia, 1997-98 ................................................................14
Table 2a Degrees conferred by Title IV participating, degree-granting institutions, by
race/ethnicity, level of degree, and gender: 50 states and District of Columbia, 1997-98 .................................................................................................15
Table 2b Certificates and other awards conferred by Title IV participating, degree-
granting institutions, by race/ethnicity, level of award, and gender: 50 states and District of Columbia, 1997-98..........................................................................16
Table 3 Associate's degrees conferred by Title IV participating, degree-granting
institutions, by level and control of institution, and field of study: 50 states and District of Columbia, 1997-98..........................................................................17
Table 4 Associate's degrees conferred by Title IV participating, degree-granting
institutions, by race/ethnicity, field of study, and gender: 50 states and District of Columbia, 1997-98.................................................................................18
Table 4a Associate's degrees conferred by 2-year Title IV participating, degree-
granting institutions, by race/ethnicity, field of study, and gender: 50 states and District of Columbia, 1997-98..........................................................................21
Table 4b Associate's degrees conferred by 4-year Title IV participating, degree-
granting institutions, by race/ethnicity, field of study, and gender: 50 states and District of Columbia, 1997-98..........................................................................24
Table 5 Bachelor’s degrees conferred by Title IV participating, degree-granting
institutions, by race/ethnicity, field of study, and gender: 50 states and District of Columbia, 1997-98.................................................................................27
Table 6 Master's degrees conferred by Title IV participating, degree-granting
institutions, by race/ethnicity, field of study, and gender: 50 states and District of Columbia, 1997-98.................................................................................30
Table 7 Doctor's degrees conferred by Title IV participating, degree-granting
institutions, by race/ethnicity, field of study, and gender: 50 states and District of Columbia, 1997-98.................................................................................33
Table 8 First-professional degrees conferred by Title IV participating, degree-
granting institutions, by race/ethnicity, field of study, and gender: 50 states and District of Columbia, 1997-98..........................................................................36
vi
Table 9 Degrees conferred by Title IV participating, degree-granting institutions, by level of degree, gender, and state: 50 states and District of Columbia,
1997-98...................................................................................................................37 Table 9a Degrees conferred by public Title IV participating, degree-granting
institutions, by level of degree, gender, and state: 50 states and District of Columbia, 1997-98 .................................................................................................38
Table 9b Degrees conferred by private, not-for-profit Title IV participating, degree-
granting institutions, by level of degree, gender, and state: 50 states and District of Columbia, 1997-98.................................................................................39
Table 9c Degrees conferred by private, for-profit Title IV participating, degree-
granting institutions, by level of degree, gender, and state: 50 states and District of Columbia, 1997-98.................................................................................40
Table 9d First-professional degrees conferred by Title IV participating, degree-
granting institutions, by control of institution, gender, and state: 50 states and District of Columbia, 1997-98.........................................................................41
Table 10 Associate's degrees conferred by Title IV participating, degree-granting
institutions, by level and control of institution, and state: 50 states and District of Columbia, 1997-98.................................................................................42
Table 11 Associate's degrees conferred by Title IV participating, degree-granting
institutions, by race/ethnicity and state: 50 states and District of Columbia, 1997-98...................................................................................................................43
Table 12 Bachelor's degrees conferred by Title IV participating, degree-granting
institutions, by race/ethnicity and state: 50 states and District of Columbia, 1997-98...................................................................................................................44
Table 13 Master's degrees conferred by Title IV participating, degree-granting
institutions, by race/ethnicity and state: 50 states and District of Columbia, 1997-98...................................................................................................................45
Table 14 Doctor's degrees conferred by Title IV participating, degree-granting
institutions, by race/ethnicity and state: 50 states and District of Columbia, 1997-98...................................................................................................................46
Table 15 First-professional degrees conferred by Title IV participating, degree-
granting institutions, by race/ethnicity and state: 50 states and District of Columbia, 1997-98 .................................................................................................47
vii
Table 16 Degrees conferred by Title IV participating, degree-granting institutions, by control of institution, level of degree, and field of study: 50 states and District of Columbia, 1997-98.................................................................................48
Table 17 Number of Title IV participating, degree-granting institutions, by control of
institution, level of degree, and field of study: 50 states and District of Columbia, 1997-98 .................................................................................................50
Table 18 Degrees conferred by Title IV participating, degree-granting institutions, by
level of degree, and by discipline division and program specialty: 50 states and District of Columbia, 1997-98..........................................................................52
Table M-1 Number of postsecondary institutions in the 1997-98 Completions survey
and survey response rates, by survey form and sector of institution: 50 states, District of Columbia, and the outlying areas, 1997-98..................................70
Table M-2 Number and survey response rates of postsecondary institutions, by Title IV
participation, degree-granting status, and location and sector of institution: 50 states, District of Columbia, and the outlying areas, 1997-98.............................72
Table M-3 Number and percentage of all degrees and awards imputed for all
postsecondary institutions, by control of institution, level of award, and gender: 50 states, District of Columbia, and the outlying areas, 1997-98................74
List of Figures : Figure A Percentage of degrees awarded to women and minorit ies, by level of degree: 50 states and District of Columbia, 1997-98..............................................................3

1
Summary
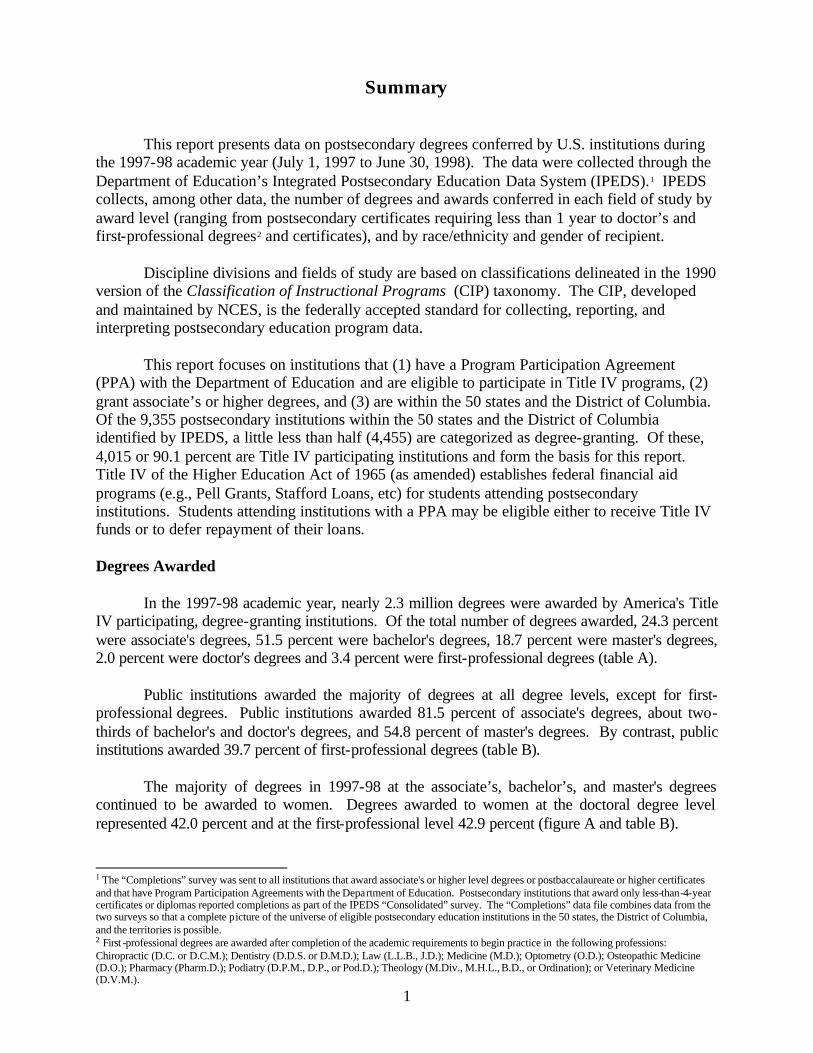
This report presents data on postsecondary degrees conferred by U.S. institutions during the 1997-98 academic year (July 1, 1997 to June 30, 1998). The data were collected through the Department of Education’s Integrated Postsecondary Education Data System (IPEDS).1 IPEDS collects, among other data, the number of degrees and awards conferred in each field of study by award level (ranging from postsecondary certificates requiring less than 1 year to doctor’s and first-professional degrees2 and certificates), and by race/ethnicity and gender of recipient.
Discipline divisions and fields of study are based on classifications delineated in the 1990 version of the Classification of Instructional Programs (CIP) taxonomy. The CIP, developed and maintained by NCES, is the federally accepted standard for collecting, reporting, and interpreting postsecondary education program data.
This report focuses on institutions that (1) have a Program Participation Agreement (PPA) with the Department of Education and are eligible to participate in Title IV programs, (2) grant associate’s or higher degrees, and (3) are within the 50 states and the District of Columbia. Of the 9,355 postsecondary institutions within the 50 states and the District of Columbia identified by IPEDS, a little less than half (4,455) are categorized as degree-granting. Of these, 4,015 or 90.1 percent are Title IV participating institutions and form the basis for this report. Title IV of the Higher Education Act of 1965 (as amended) establishes federal financial aid programs (e.g., Pell Grants, Stafford Loans, etc) for students attending postsecondary institutions. Students attending institutions with a PPA may be eligible either to receive Title IV funds or to defer repayment of their loans. Degrees Awarded In the 1997-98 academic year, nearly 2.3 million degrees were awarded by America's Title IV participating, degree-granting institutions. Of the total number of degrees awarded, 24.3 percent were associate's degrees, 51.5 percent were bachelor's degrees, 18.7 percent were master's degrees, 2.0 percent were doctor's degrees and 3.4 percent were first-professional degrees (table A). Public institutions awarded the majority of degrees at all degree levels, except for first-professional degrees. Public institutions awarded 81.5 percent of associate's degrees, about two-thirds of bachelor's and doctor's degrees, and 54.8 percent of master's degrees. By contrast, public institutions awarded 39.7 percent of first-professional degrees (table B). The majority of degrees in 1997-98 at the associate’s, bachelor’s, and master's degrees continued to be awarded to women. Degrees awarded to women at the doctoral degree level represented 42.0 percent and at the first-professional level 42.9 percent (figure A and table B). 1 The “Completions” survey was sent to all institutions that award associate's or higher level degrees or postbaccalaureate or higher certificates and that have Program Participation Agreements with the Department of Education. Postsecondary institutions that award only less-than-4-year certificates or diplomas reported completions as part of the IPEDS “Consolidated” survey. The “Completions” data file combines data from the two surveys so that a complete picture of the universe of eligible postsecondary education institutions in the 50 states, the District of Columbia, and the territories is possible. 2 First -professional degrees are awarded after completion of the academic requirements to begin practice in the following professions: Chiropractic (D.C. or D.C.M.); Dentistry (D.D.S. or D.M.D.); Law (L.L.B., J.D.); Medicine (M.D.); Optometry (O.D.); Osteopathic Medicine (D.O.); Pharmacy (Pharm.D.); Podiatry (D.P.M., D.P., or Pod.D.); Theology (M.Div., M.H.L., B.D., or Ordination); or Veterinary Medicine (D.V.M.).
2
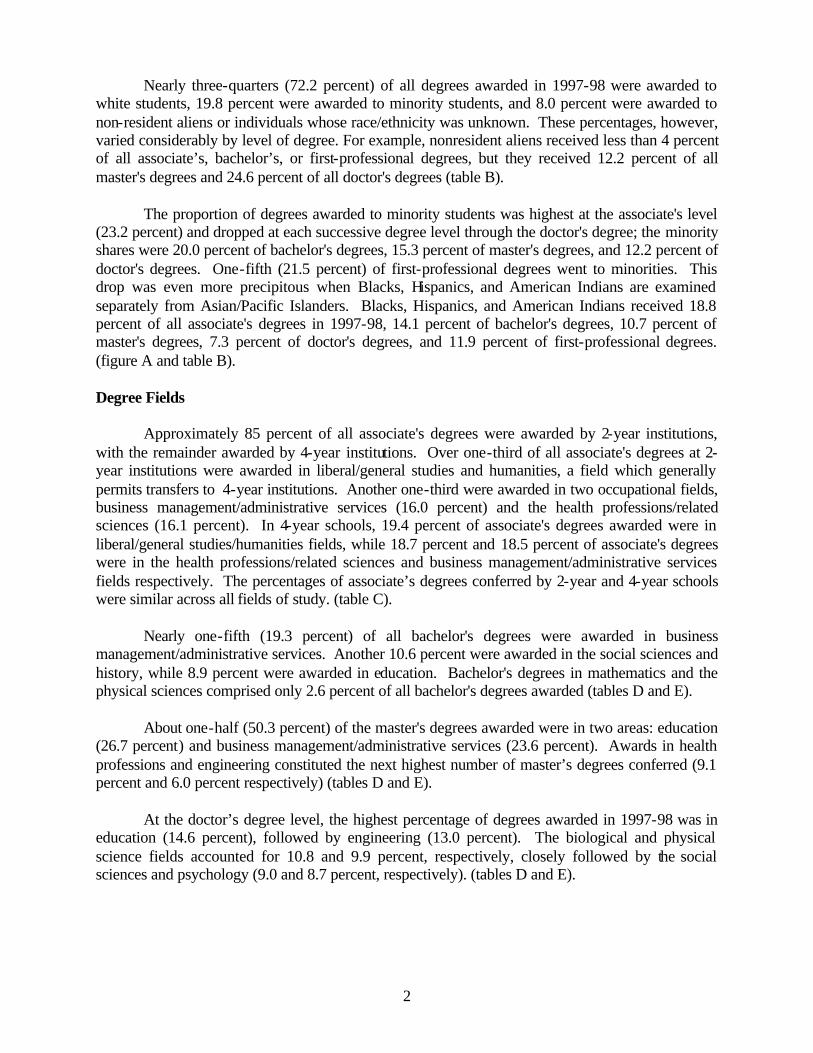
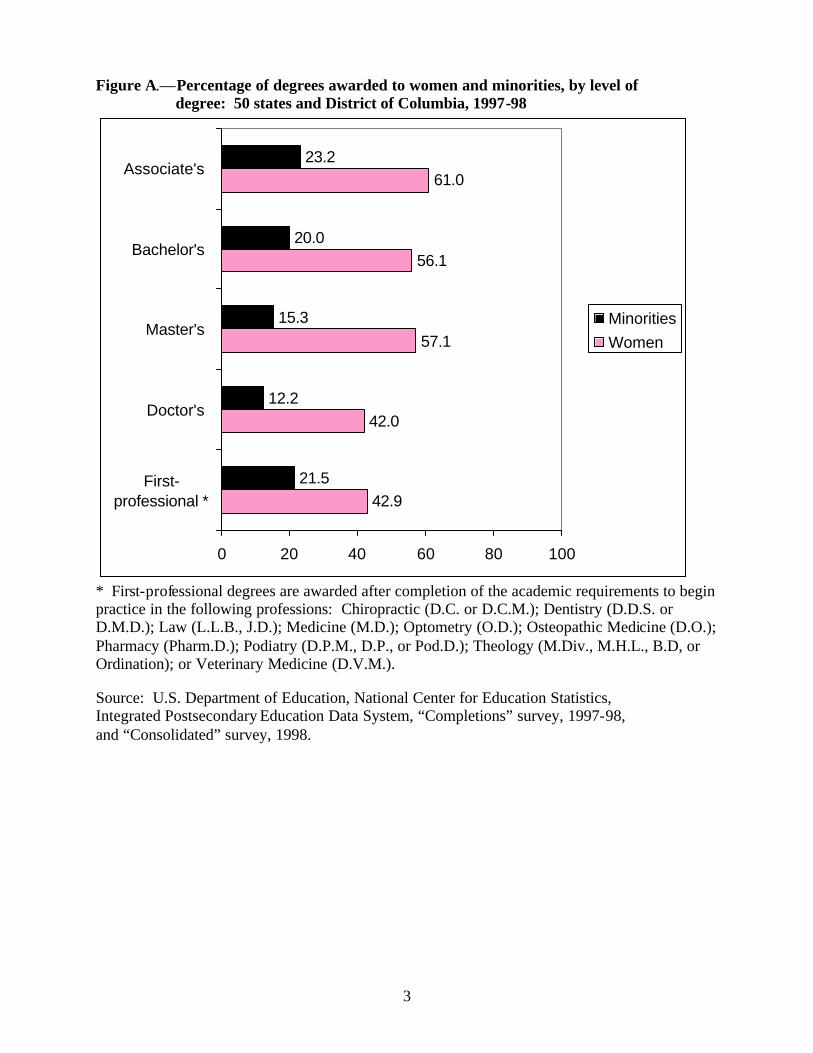
Nearly three-quarters (72.2 percent) of all degrees awarded in 1997-98 were awarded to white students, 19.8 percent were awarded to minority students, and 8.0 percent were awarded to non-resident aliens or individuals whose race/ethnicity was unknown. These percentages, however, varied considerably by level of degree. For example, nonresident aliens received less than 4 percent of all associate’s, bachelor’s, or first-professional degrees, but they received 12.2 percent of all master's degrees and 24.6 percent of all doctor's degrees (table B). The proportion of degrees awarded to minority students was highest at the associate's level (23.2 percent) and dropped at each successive degree level through the doctor's degree; the minority shares were 20.0 percent of bachelor's degrees, 15.3 percent of master's degrees, and 12.2 percent of doctor's degrees. One-fifth (21.5 percent) of first-professional degrees went to minorities. This drop was even more precipitous when Blacks, Hispanics, and American Indians are examined separately from Asian/Pacific Islanders. Blacks, Hispanics, and American Indians received 18.8 percent of all associate's degrees in 1997-98, 14.1 percent of bachelor's degrees, 10.7 percent of master's degrees, 7.3 percent of doctor's degrees, and 11.9 percent of first-professional degrees. (figure A and table B). Degree Fields Approximately 85 percent of all associate's degrees were awarded by 2-year institutions, with the remainder awarded by 4-year institutions. Over one-third of all associate's degrees at 2-year institutions were awarded in liberal/general studies and humanities, a field which generally permits transfers to 4-year institutions. Another one-third were awarded in two occupational fields, business management/administrative services (16.0 percent) and the health professions/related sciences (16.1 percent). In 4-year schools, 19.4 percent of associate's degrees awarded were in liberal/general studies/humanities fields, while 18.7 percent and 18.5 percent of associate's degrees were in the health professions/related sciences and business management/administrative services fields respectively. The percentages of associate’s degrees conferred by 2-year and 4-year schools were similar across all fields of study. (table C). Nearly one-fifth (19.3 percent) of all bachelor's degrees were awarded in business management/administrative services. Another 10.6 percent were awarded in the social sciences and history, while 8.9 percent were awarded in education. Bachelor's degrees in mathematics and the physical sciences comprised only 2.6 percent of all bachelor's degrees awarded (tables D and E). About one-half (50.3 percent) of the master's degrees awarded were in two areas: education (26.7 percent) and business management/administrative services (23.6 percent). Awards in health professions and engineering constituted the next highest number of master’s degrees conferred (9.1 percent and 6.0 percent respectively) (tables D and E). At the doctor’s degree level, the highest percentage of degrees awarded in 1997-98 was in education (14.6 percent), followed by engineering (13.0 percent). The biological and physical science fields accounted for 10.8 and 9.9 percent, respectively, closely followed by the social sciences and psychology (9.0 and 8.7 percent, respectively). (tables D and E).
3
Figure A.—Percentage of degrees awarded to women and minorities, by level of degree: 50 states and District of Columbia, 1997-98
* First-professional degrees are awarded after completion of the academic requirements to begin practice in the following professions: Chiropractic (D.C. or D.C.M.); Dentistry (D.D.S. or D.M.D.); Law (L.L.B., J.D.); Medicine (M.D.); Optometry (O.D.); Osteopathic Medicine (D.O.); Pharmacy (Pharm.D.); Podiatry (D.P.M., D.P., or Pod.D.); Theology (M.Div., M.H.L., B.D, or Ordination); or Veterinary Medicine (D.V.M.). Source: U.S. Department of Education, National Center for Education Statistics, Integrated Postsecondary Education Data System, “Completions” survey, 1997-98, and “Consolidated” survey, 1998.
42.9
42.0
57.1
56.1
61.0
21.5
12.2
15.3
20.0
23.2
0 20 40 60 80 100
First-professional *
Doctor's
Master's
Bachelor's
Associate's
MinoritiesWomen
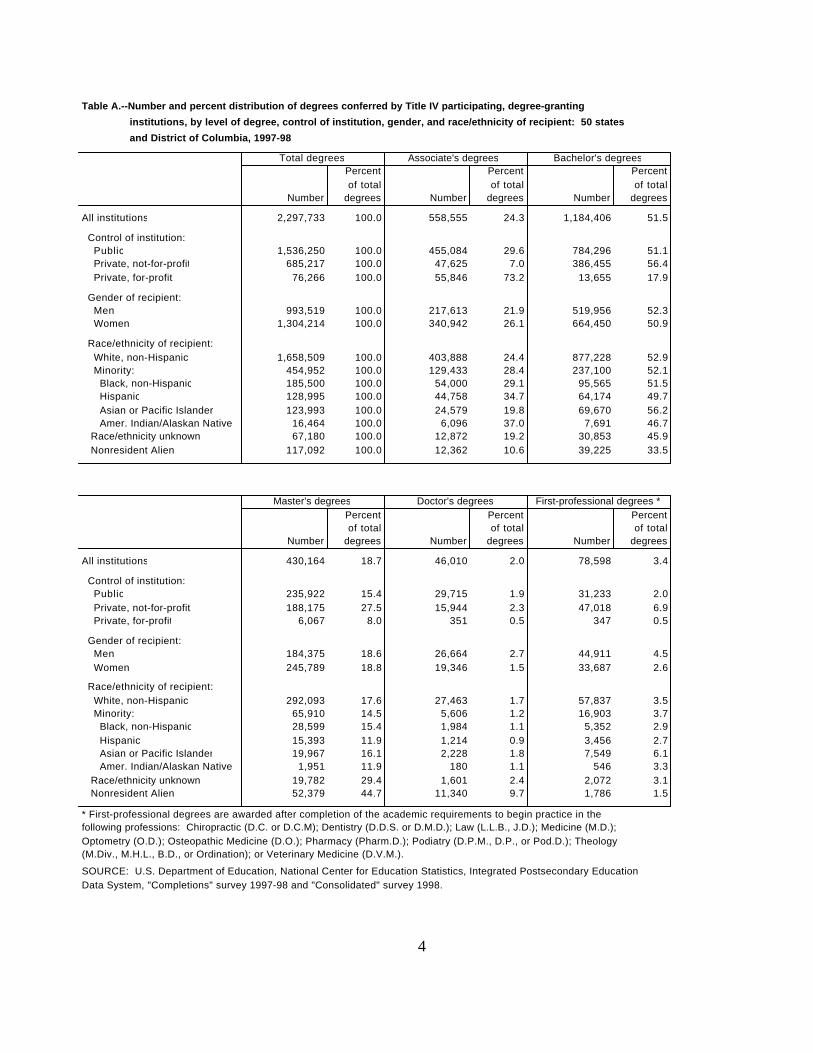
Table A.--Number and percent distribution of degrees conferred by Title IV participating, degree-granting
institutions, by level of degree, control of institution, gender, and race/ethnicity of recipient: 50 states
and District of Columbia, 1997-98
Total degrees Associate's degrees Bachelor's degreesPercent Percent Percent of total of total of total
Number degrees Number degrees Number degrees All institutions 2,297,733 100.0 558,555 24.3 1,184,406 51.5
Control of institution: Public 1,536,250 100.0 455,084 29.6 784,296 51.1 Private, not-for-profit 685,217 100.0 47,625 7.0 386,455 56.4 Private, for-profit 76,266 100.0 55,846 73.2 13,655 17.9 Gender of recipient: Men 993,519 100.0 217,613 21.9 519,956 52.3 Women 1,304,214 100.0 340,942 26.1 664,450 50.9
Race/ethnicity of recipient: White, non-Hispanic 1,658,509 100.0 403,888 24.4 877,228 52.9 Minority: 454,952 100.0 129,433 28.4 237,100 52.1 Black, non-Hispanic 185,500 100.0 54,000 29.1 95,565 51.5 Hispanic 128,995 100.0 44,758 34.7 64,174 49.7 Asian or Pacific Islander 123,993 100.0 24,579 19.8 69,670 56.2 Amer. Indian/Alaskan Native 16,464 100.0 6,096 37.0 7,691 46.7 Race/ethnicity unknown 67,180 100.0 12,872 19.2 30,853 45.9 Nonresident Alien 117,092 100.0 12,362 10.6 39,225 33.5
Master's degrees Doctor's degrees First-professional degrees *Percent Percent Percent of total of total of total
Number degrees Number degrees Number degrees
All institutions 430,164 18.7 46,010 2.0 78,598 3.4
Control of institution: Public 235,922 15.4 29,715 1.9 31,233 2.0 Private, not-for-profit 188,175 27.5 15,944 2.3 47,018 6.9 Private, for-profit 6,067 8.0 351 0.5 347 0.5
Gender of recipient: Men 184,375 18.6 26,664 2.7 44,911 4.5 Women 245,789 18.8 19,346 1.5 33,687 2.6 Race/ethnicity of recipient: White, non-Hispanic 292,093 17.6 27,463 1.7 57,837 3.5 Minority: 65,910 14.5 5,606 1.2 16,903 3.7 Black, non-Hispanic 28,599 15.4 1,984 1.1 5,352 2.9 Hispanic 15,393 11.9 1,214 0.9 3,456 2.7 Asian or Pacific Islander 19,967 16.1 2,228 1.8 7,549 6.1 Amer. Indian/Alaskan Native 1,951 11.9 180 1.1 546 3.3 Race/ethnicity unknown 19,782 29.4 1,601 2.4 2,072 3.1 Nonresident Alien 52,379 44.7 11,340 9.7 1,786 1.5
* First-professional degrees are awarded after completion of the academic requirements to begin practice in the following professions: Chiropractic (D.C. or D.C.M); Dentistry (D.D.S. or D.M.D.); Law (L.L.B., J.D.); Medicine (M.D.);Optometry (O.D.); Osteopathic Medicine (D.O.); Pharmacy (Pharm.D.); Podiatry (D.P.M., D.P., or Pod.D.); Theology(M.Div., M.H.L., B.D., or Ordination); or Veterinary Medicine (D.V.M.).
SOURCE: U.S. Department of Education, National Center for Education Statistics, Integrated Postsecondary EducationData System, "Completions" survey 1997-98 and "Consolidated" survey 1998.
4
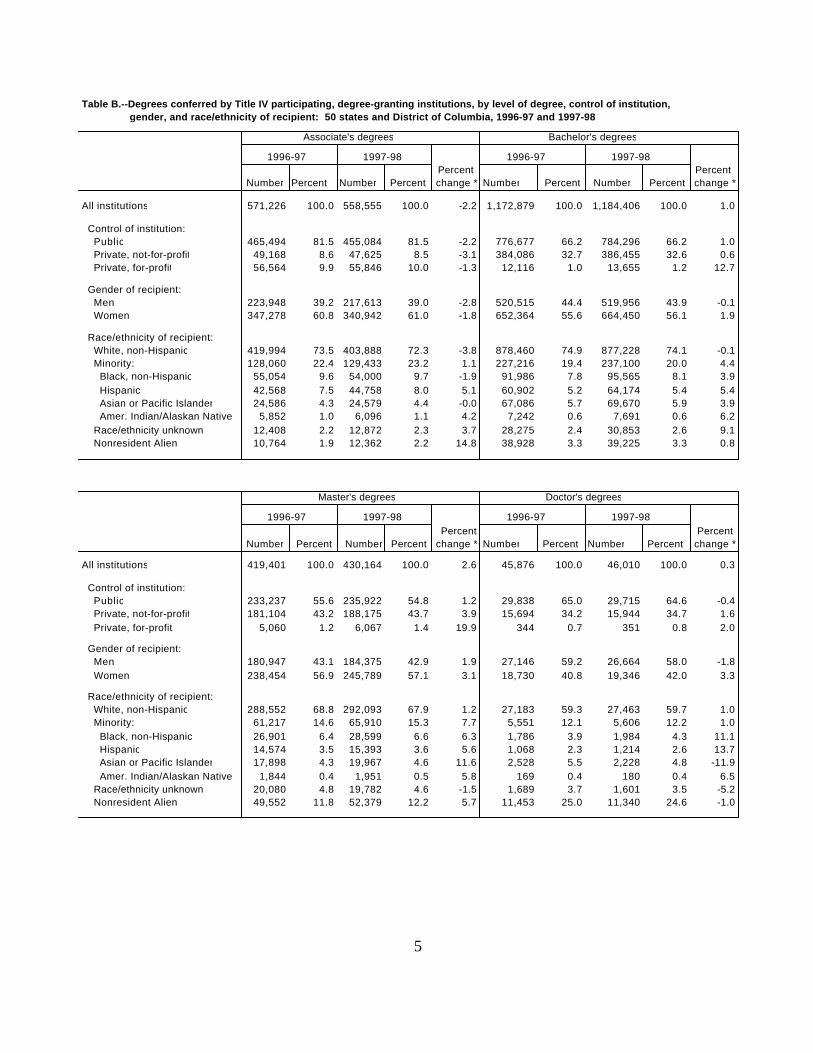
Table B.--Degrees conferred by Title IV participating, degree-granting institutions, by level of degree, control of institution, gender, and race/ethnicity of recipient: 50 states and District of Columbia, 1996-97 and 1997-98
Associate's degrees Bachelor's degrees
1996-97 1997-98 1996-97 1997-98 Percent Percent
Number Percent Number Percent change * Number Percent Number Percent change * All institutions 571,226 100.0 558,555 100.0 -2.2 1,172,879 100.0 1,184,406 100.0 1.0
Control of institution: Public 465,494 81.5 455,084 81.5 -2.2 776,677 66.2 784,296 66.2 1.0 Private, not-for-profit 49,168 8.6 47,625 8.5 -3.1 384,086 32.7 386,455 32.6 0.6 Private, for-profit 56,564 9.9 55,846 10.0 -1.3 12,116 1.0 13,655 1.2 12.7
Gender of recipient: Men 223,948 39.2 217,613 39.0 -2.8 520,515 44.4 519,956 43.9 -0.1 Women 347,278 60.8 340,942 61.0 -1.8 652,364 55.6 664,450 56.1 1.9
Race/ethnicity of recipient: White, non-Hispanic 419,994 73.5 403,888 72.3 -3.8 878,460 74.9 877,228 74.1 -0.1 Minority: 128,060 22.4 129,433 23.2 1.1 227,216 19.4 237,100 20.0 4.4 Black, non-Hispanic 55,054 9.6 54,000 9.7 -1.9 91,986 7.8 95,565 8.1 3.9 Hispanic 42,568 7.5 44,758 8.0 5.1 60,902 5.2 64,174 5.4 5.4 Asian or Pacific Islander 24,586 4.3 24,579 4.4 -0.0 67,086 5.7 69,670 5.9 3.9 Amer. Indian/Alaskan Native 5,852 1.0 6,096 1.1 4.2 7,242 0.6 7,691 0.6 6.2 Race/ethnicity unknown 12,408 2.2 12,872 2.3 3.7 28,275 2.4 30,853 2.6 9.1 Nonresident Alien 10,764 1.9 12,362 2.2 14.8 38,928 3.3 39,225 3.3 0.8
Master's degrees Doctor's degrees
1996-97 1997-98 1996-97 1997-98 Percent Percent
Number Percent Number Percent change * Number Percent Number Percent change *
All institutions 419,401 100.0 430,164 100.0 2.6 45,876 100.0 46,010 100.0 0.3
Control of institution: Public 233,237 55.6 235,922 54.8 1.2 29,838 65.0 29,715 64.6 -0.4 Private, not-for-profit 181,104 43.2 188,175 43.7 3.9 15,694 34.2 15,944 34.7 1.6 Private, for-profit 5,060 1.2 6,067 1.4 19.9 344 0.7 351 0.8 2.0
Gender of recipient: Men 180,947 43.1 184,375 42.9 1.9 27,146 59.2 26,664 58.0 -1.8 Women 238,454 56.9 245,789 57.1 3.1 18,730 40.8 19,346 42.0 3.3
Race/ethnicity of recipient: White, non-Hispanic 288,552 68.8 292,093 67.9 1.2 27,183 59.3 27,463 59.7 1.0 Minority: 61,217 14.6 65,910 15.3 7.7 5,551 12.1 5,606 12.2 1.0 Black, non-Hispanic 26,901 6.4 28,599 6.6 6.3 1,786 3.9 1,984 4.3 11.1 Hispanic 14,574 3.5 15,393 3.6 5.6 1,068 2.3 1,214 2.6 13.7 Asian or Pacific Islander 17,898 4.3 19,967 4.6 11.6 2,528 5.5 2,228 4.8 -11.9 Amer. Indian/Alaskan Native 1,844 0.4 1,951 0.5 5.8 169 0.4 180 0.4 6.5 Race/ethnicity unknown 20,080 4.8 19,782 4.6 -1.5 1,689 3.7 1,601 3.5 -5.2 Nonresident Alien 49,552 11.8 52,379 12.2 5.7 11,453 25.0 11,340 24.6 -1.0
5
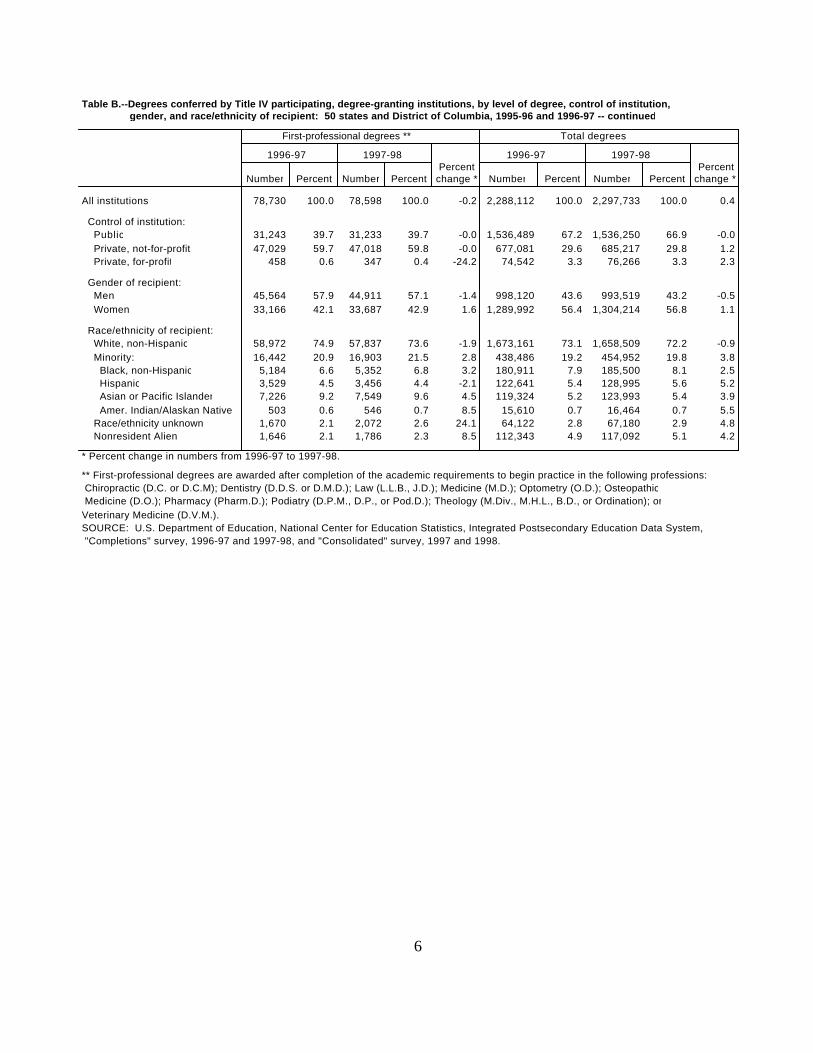
Table B.--Degrees conferred by Title IV participating, degree-granting institutions, by level of degree, control of institution, gender, and race/ethnicity of recipient: 50 states and District of Columbia, 1995-96 and 1996-97 -- continued
First-professional degrees ** Total degrees
1996-97 1997-98 1996-97 1997-98 Percent Percent
Number Percent Number Percent change * Number Percent Number Percent change *
All institutions 78,730 100.0 78,598 100.0 -0.2 2,288,112 100.0 2,297,733 100.0 0.4
Control of institution: Public 31,243 39.7 31,233 39.7 -0.0 1,536,489 67.2 1,536,250 66.9 -0.0 Private, not-for-profit 47,029 59.7 47,018 59.8 -0.0 677,081 29.6 685,217 29.8 1.2 Private, for-profit 458 0.6 347 0.4 -24.2 74,542 3.3 76,266 3.3 2.3
Gender of recipient: Men 45,564 57.9 44,911 57.1 -1.4 998,120 43.6 993,519 43.2 -0.5 Women 33,166 42.1 33,687 42.9 1.6 1,289,992 56.4 1,304,214 56.8 1.1
Race/ethnicity of recipient: White, non-Hispanic 58,972 74.9 57,837 73.6 -1.9 1,673,161 73.1 1,658,509 72.2 -0.9 Minority: 16,442 20.9 16,903 21.5 2.8 438,486 19.2 454,952 19.8 3.8 Black, non-Hispanic 5,184 6.6 5,352 6.8 3.2 180,911 7.9 185,500 8.1 2.5 Hispanic 3,529 4.5 3,456 4.4 -2.1 122,641 5.4 128,995 5.6 5.2 Asian or Pacific Islander 7,226 9.2 7,549 9.6 4.5 119,324 5.2 123,993 5.4 3.9 Amer. Indian/Alaskan Native 503 0.6 546 0.7 8.5 15,610 0.7 16,464 0.7 5.5 Race/ethnicity unknown 1,670 2.1 2,072 2.6 24.1 64,122 2.8 67,180 2.9 4.8 Nonresident Alien 1,646 2.1 1,786 2.3 8.5 112,343 4.9 117,092 5.1 4.2
* Percent change in numbers from 1996-97 to 1997-98.
** First-professional degrees are awarded after completion of the academic requirements to begin practice in the following professions: Chiropractic (D.C. or D.C.M); Dentistry (D.D.S. or D.M.D.); Law (L.L.B., J.D.); Medicine (M.D.); Optometry (O.D.); Osteopathic Medicine (D.O.); Pharmacy (Pharm.D.); Podiatry (D.P.M., D.P., or Pod.D.); Theology (M.Div., M.H.L., B.D., or Ordination); orVeterinary Medicine (D.V.M.).SOURCE: U.S. Department of Education, National Center for Education Statistics, Integrated Postsecondary Education Data System, "Completions" survey, 1996-97 and 1997-98, and "Consolidated" survey, 1997 and 1998.
6
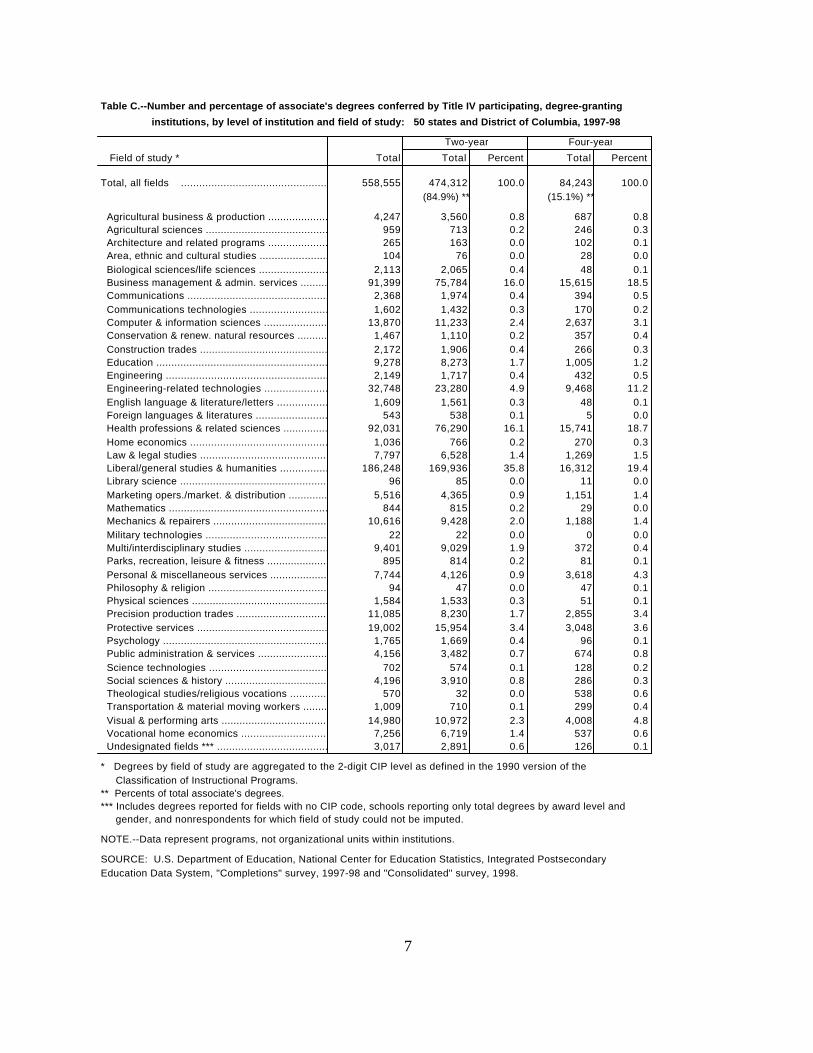
Table C.--Number and percentage of associate's degrees conferred by Title IV participating, degree-granting
institutions, by level of institution and field of study: 50 states and District of Columbia, 1997-98
Two-year Four-year
Field of study * Total Total Percent Total Percent
Total, all fields ........................................................ 558,555 474,312 100.0 84,243 100.0(84.9%) ** (15.1%) **
Agricultural business & production ............................... 4,247 3,560 0.8 687 0.8 Agricultural sciences ................................................... 959 713 0.2 246 0.3 Architecture and related programs .................................. 265 163 0.0 102 0.1 Area, ethnic and cultural studies ........................................ 104 76 0.0 28 0.0 Biological sciences/life sciences ..................................... 2,113 2,065 0.4 48 0.1 Business management & admin. services ...........................91,399 75,784 16.0 15,615 18.5 Communications ..............................................................2,368 1,974 0.4 394 0.5 Communications technologies ............................................1,602 1,432 0.3 170 0.2 Computer & information sciences .....................................13,870 11,233 2.4 2,637 3.1 Conservation & renew. natural resources ...........................1,467 1,110 0.2 357 0.4 Construction trades ........................................................ 2,172 1,906 0.4 266 0.3 Education ....................................................................... 9,278 8,273 1.7 1,005 1.2 Engineering ................................................................... 2,149 1,717 0.4 432 0.5 Engineering-related technologies .......................................32,748 23,280 4.9 9,468 11.2 English language & literature/letters ...................................1,609 1,561 0.3 48 0.1 Foreign languages & literatures ...................................... 543 538 0.1 5 0.0 Health professions & related sciences .............................92,031 76,290 16.1 15,741 18.7 Home economics ........................................................... 1,036 766 0.2 270 0.3 Law & legal studies ..........................................................7,797 6,528 1.4 1,269 1.5 Liberal/general studies & humanities ..............................186,248 169,936 35.8 16,312 19.4 Library science ......................................................... 96 85 0.0 11 0.0 Marketing opers./market. & distribution .......................... 5,516 4,365 0.9 1,151 1.4 Mathematics .................................................................... 844 815 0.2 29 0.0 Mechanics & repairers ......................................................10,616 9,428 2.0 1,188 1.4 Military technologies ........................................................ 22 22 0.0 0 0.0 Multi/interdisciplinary studies ...........................................9,401 9,029 1.9 372 0.4 Parks, recreation, leisure & fitness ................................... 895 814 0.2 81 0.1 Personal & miscellaneous services ................................. 7,744 4,126 0.9 3,618 4.3 Philosophy & religion ...................................................... 94 47 0.0 47 0.1 Physical sciences ............................................................ 1,584 1,533 0.3 51 0.1 Precision production trades ...............................................11,085 8,230 1.7 2,855 3.4 Protective services ........................................................ 19,002 15,954 3.4 3,048 3.6 Psychology .................................................................. 1,765 1,669 0.4 96 0.1 Public administration & services ........................................4,156 3,482 0.7 674 0.8 Science technologies ..................................................... 702 574 0.1 128 0.2 Social sciences & history ................................................ 4,196 3,910 0.8 286 0.3 Theological studies/religious vocations ................................570 32 0.0 538 0.6 Transportation & material moving workers ...........................1,009 710 0.1 299 0.4 Visual & performing arts .................................................14,980 10,972 2.3 4,008 4.8 Vocational home economics ..............................................7,256 6,719 1.4 537 0.6 Undesignated fields *** .........................................................3,017 2,891 0.6 126 0.1
* Degrees by field of study are aggregated to the 2-digit CIP level as defined in the 1990 version of the Classification of Instructional Programs.** Percents of total associate's degrees.*** Includes degrees reported for fields with no CIP code, schools reporting only total degrees by award level and gender, and nonrespondents for which field of study could not be imputed.
NOTE.--Data represent programs, not organizational units within institutions.
SOURCE: U.S. Department of Education, National Center for Education Statistics, Integrated PostsecondaryEducation Data System, "Completions" survey, 1997-98 and "Consolidated" survey, 1998.
7
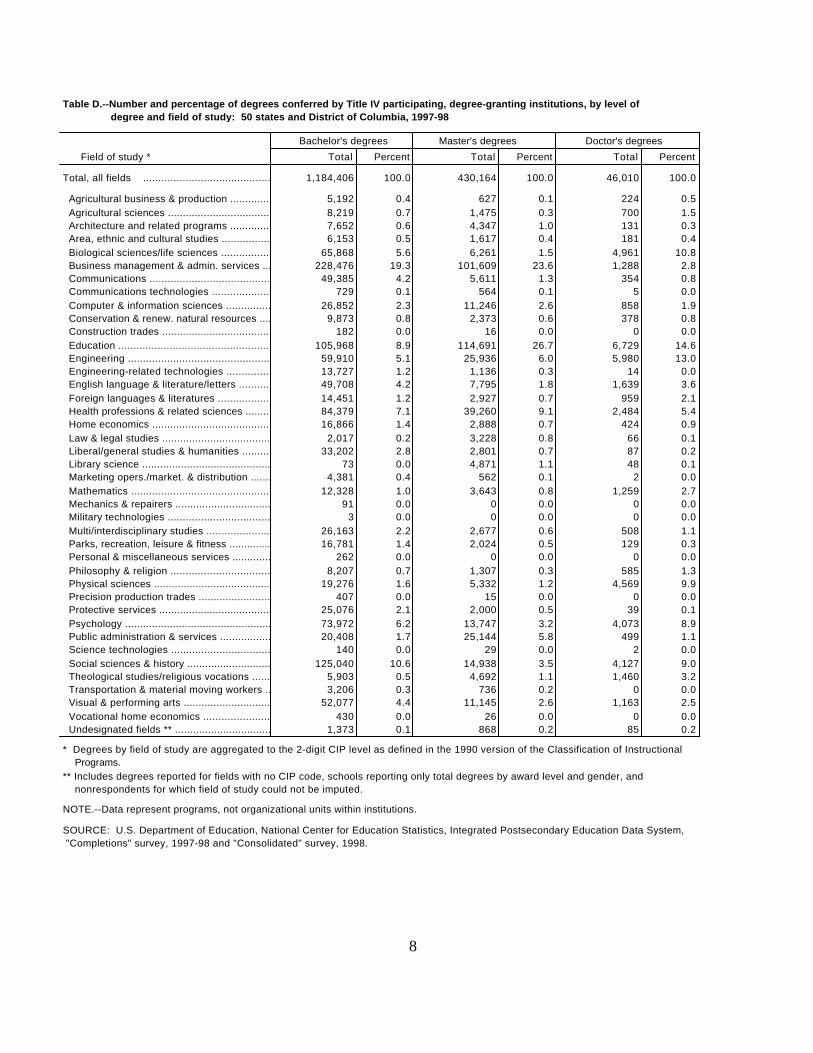
Table D.--Number and percentage of degrees conferred by Title IV participating, degree-granting institutions, by level of degree and field of study: 50 states and District of Columbia, 1997-98
Bachelor's degrees Master's degrees Doctor's degrees
Field of study * Total Percent Total Percent Total Percent
Total, all fields ........................................................1,184,406 100.0 430,164 100.0 46,010 100.0
Agricultural business & production ............................... 5,192 0.4 627 0.1 224 0.5 Agricultural sciences ................................................... 8,219 0.7 1,475 0.3 700 1.5 Architecture and related programs ..................................7,652 0.6 4,347 1.0 131 0.3 Area, ethnic and cultural studies ........................................6,153 0.5 1,617 0.4 181 0.4 Biological sciences/life sciences .....................................65,868 5.6 6,261 1.5 4,961 10.8 Business management & admin. services ...........................228,476 19.3 101,609 23.6 1,288 2.8 Communications ..............................................................49,385 4.2 5,611 1.3 354 0.8 Communications technologies ............................................729 0.1 564 0.1 5 0.0 Computer & information sciences .....................................26,852 2.3 11,246 2.6 858 1.9 Conservation & renew. natural resources ...........................9,873 0.8 2,373 0.6 378 0.8 Construction trades ........................................................ 182 0.0 16 0.0 0 0.0 Education .......................................................................105,968 8.9 114,691 26.7 6,729 14.6 Engineering ...................................................................59,910 5.1 25,936 6.0 5,980 13.0 Engineering-related technologies .......................................13,727 1.2 1,136 0.3 14 0.0 English language & literature/letters ...................................49,708 4.2 7,795 1.8 1,639 3.6 Foreign languages & literatures ......................................14,451 1.2 2,927 0.7 959 2.1 Health professions & related sciences .............................84,379 7.1 39,260 9.1 2,484 5.4 Home economics ...........................................................16,866 1.4 2,888 0.7 424 0.9 Law & legal studies ..........................................................2,017 0.2 3,228 0.8 66 0.1 Liberal/general studies & humanities ..............................33,202 2.8 2,801 0.7 87 0.2 Library science ......................................................... 73 0.0 4,871 1.1 48 0.1 Marketing opers./market. & distribution ..........................4,381 0.4 562 0.1 2 0.0 Mathematics ....................................................................12,328 1.0 3,643 0.8 1,259 2.7 Mechanics & repairers ...................................................... 91 0.0 0 0.0 0 0.0 Military technologies ........................................................ 3 0.0 0 0.0 0 0.0 Multi/interdisciplinary studies ...........................................26,163 2.2 2,677 0.6 508 1.1 Parks, recreation, leisure & fitness ...................................16,781 1.4 2,024 0.5 129 0.3 Personal & miscellaneous services ................................. 262 0.0 0 0.0 0 0.0 Philosophy & religion ......................................................8,207 0.7 1,307 0.3 585 1.3 Physical sciences ............................................................19,276 1.6 5,332 1.2 4,569 9.9 Precision production trades ...............................................407 0.0 15 0.0 0 0.0 Protective services ........................................................25,076 2.1 2,000 0.5 39 0.1 Psychology ..................................................................73,972 6.2 13,747 3.2 4,073 8.9 Public administration & services ........................................20,408 1.7 25,144 5.8 499 1.1 Science technologies ..................................................... 140 0.0 29 0.0 2 0.0 Social sciences & history ................................................125,040 10.6 14,938 3.5 4,127 9.0 Theological studies/religious vocations ................................5,903 0.5 4,692 1.1 1,460 3.2 Transportation & material moving workers ...........................3,206 0.3 736 0.2 0 0.0 Visual & performing arts .................................................52,077 4.4 11,145 2.6 1,163 2.5 Vocational home economics ..............................................430 0.0 26 0.0 0 0.0 Undesignated fields ** .........................................................1,373 0.1 868 0.2 85 0.2
* Degrees by field of study are aggregated to the 2-digit CIP level as defined in the 1990 version of the Classification of Instructional Programs.** Includes degrees reported for fields with no CIP code, schools reporting only total degrees by award level and gender, and nonrespondents for which field of study could not be imputed.
NOTE.--Data represent programs, not organizational units within institutions.
SOURCE: U.S. Department of Education, National Center for Education Statistics, Integrated Postsecondary Education Data System, "Completions" survey, 1997-98 and "Consolidated" survey, 1998.
8
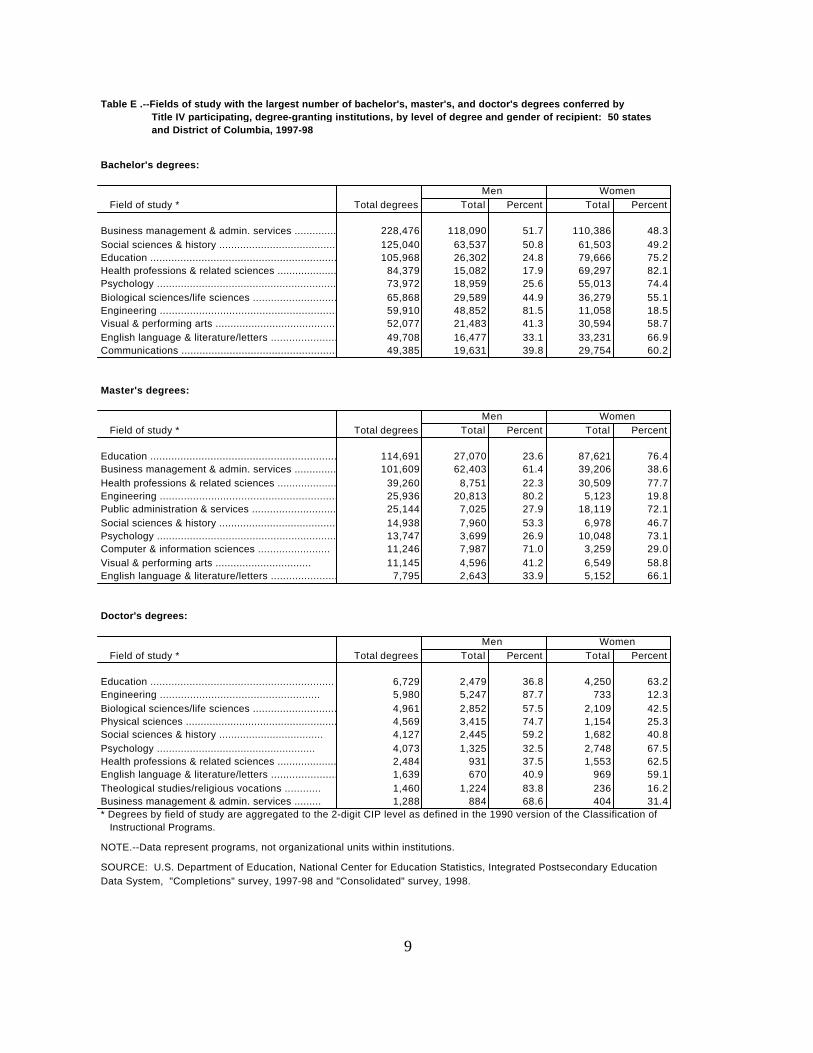
Table E .--Fields of study with the largest number of bachelor's, master's, and doctor's degrees conferred by Title IV participating, degree-granting institutions, by level of degree and gender of recipient: 50 states and District of Columbia, 1997-98
Bachelor's degrees:
Men Women Field of study * Total degrees Total Percent Total Percent
Business management & admin. services ........................... 228,476 118,090 51.7 110,386 48.3Social sciences & history ................................................ 125,040 63,537 50.8 61,503 49.2Education ....................................................................... 105,968 26,302 24.8 79,666 75.2Health professions & related sciences ............................. 84,379 15,082 17.9 69,297 82.1Psychology .................................................................. 73,972 18,959 25.6 55,013 74.4Biological sciences/life sciences ..................................... 65,868 29,589 44.9 36,279 55.1Engineering ................................................................... 59,910 48,852 81.5 11,058 18.5Visual & performing arts ................................................. 52,077 21,483 41.3 30,594 58.7English language & literature/letters ................................... 49,708 16,477 33.1 33,231 66.9Communications .............................................................. 49,385 19,631 39.8 29,754 60.2
Master's degrees:
Men Women Field of study * Total degrees Total Percent Total Percent
Education ....................................................................... 114,691 27,070 23.6 87,621 76.4Business management & admin. services ........................... 101,609 62,403 61.4 39,206 38.6Health professions & related sciences ............................. 39,260 8,751 22.3 30,509 77.7Engineering ................................................................... 25,936 20,813 80.2 5,123 19.8Public administration & services ........................................ 25,144 7,025 27.9 18,119 72.1Social sciences & history ................................................ 14,938 7,960 53.3 6,978 46.7Psychology .................................................................. 13,747 3,699 26.9 10,048 73.1Computer & information sciences ........................ 11,246 7,987 71.0 3,259 29.0Visual & performing arts ................................ 11,145 4,596 41.2 6,549 58.8English language & literature/letters ................................... 7,795 2,643 33.9 5,152 66.1
Doctor's degrees:
Men Women Field of study * Total degrees Total Percent Total Percent
Education ............................................................. 6,729 2,479 36.8 4,250 63.2Engineering ..................................................... 5,980 5,247 87.7 733 12.3Biological sciences/life sciences ..................................... 4,961 2,852 57.5 2,109 42.5Physical sciences .................................................... 4,569 3,415 74.7 1,154 25.3Social sciences & history ................................... 4,127 2,445 59.2 1,682 40.8Psychology ..................................................... 4,073 1,325 32.5 2,748 67.5Health professions & related sciences ............................. 2,484 931 37.5 1,553 62.5English language & literature/letters ............................. 1,639 670 40.9 969 59.1Theological studies/religious vocations ............ 1,460 1,224 83.8 236 16.2Business management & admin. services ......... 1,288 884 68.6 404 31.4* Degrees by field of study are aggregated to the 2-digit CIP level as defined in the 1990 version of the Classification of Instructional Programs.
NOTE.--Data represent programs, not organizational units within institutions.
SOURCE: U.S. Department of Education, National Center for Education Statistics, Integrated Postsecondary EducationData System, "Completions" survey, 1997-98 and "Consolidated" survey, 1998.
9


11
Compendium of Tables

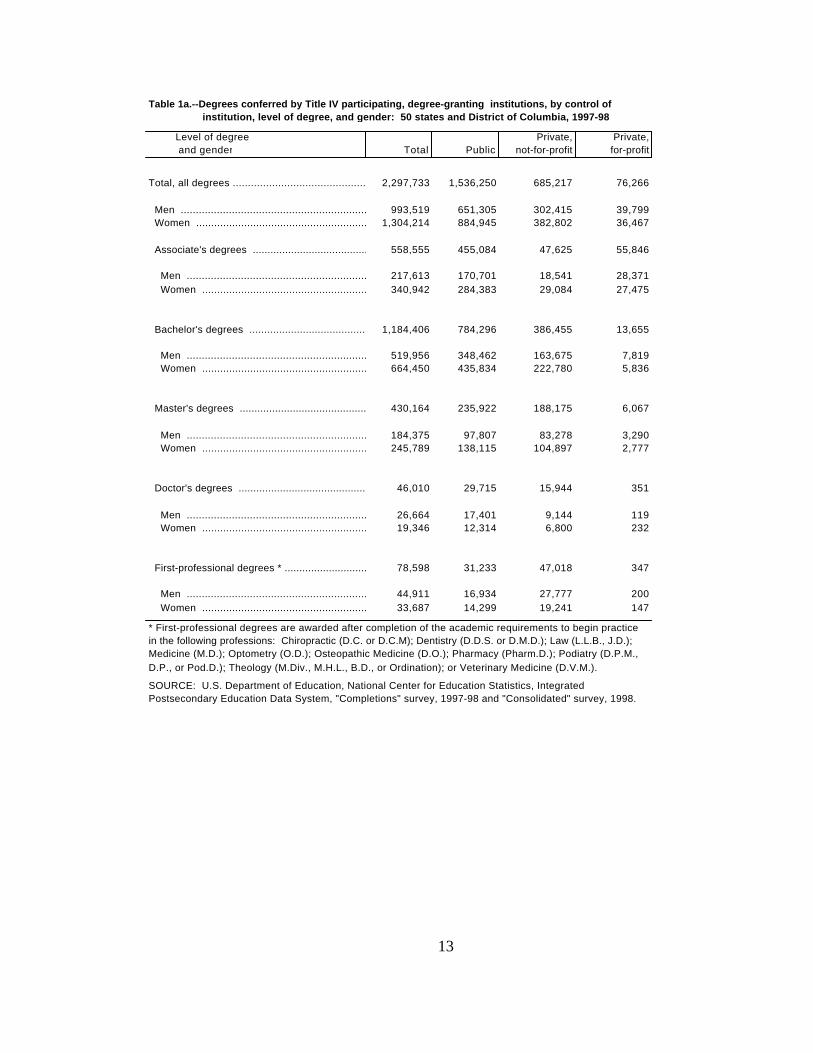
Table 1a.--Degrees conferred by Title IV participating, degree-granting institutions, by control of institution, level of degree, and gender: 50 states and District of Columbia, 1997-98
Level of degree Private, Private, and gender Total Public not-for-profit for-profit
Total, all degrees ................................................ 2,297,733 1,536,250 685,217 76,266
Men .............................................................. 993,519 651,305 302,415 39,799 Women ........................................................... 1,304,214 884,945 382,802 36,467
Associate's degrees .............................................. 558,555 455,084 47,625 55,846
Men .............................................................. 217,613 170,701 18,541 28,371 Women ........................................................... 340,942 284,383 29,084 27,475
Bachelor's degrees ........................................... 1,184,406 784,296 386,455 13,655
Men .............................................................. 519,956 348,462 163,675 7,819 Women ........................................................... 664,450 435,834 222,780 5,836
Master's degrees .................................................. 430,164 235,922 188,175 6,067
Men .............................................................. 184,375 97,807 83,278 3,290 Women ........................................................... 245,789 138,115 104,897 2,777
Doctor's degrees .................................................. 46,010 29,715 15,944 351
Men .............................................................. 26,664 17,401 9,144 119 Women ........................................................... 19,346 12,314 6,800 232
First-professional degrees * ..................................................78,598 31,233 47,018 347
Men .............................................................. 44,911 16,934 27,777 200 Women ........................................................... 33,687 14,299 19,241 147
* First-professional degrees are awarded after completion of the academic requirements to begin practicein the following professions: Chiropractic (D.C. or D.C.M); Dentistry (D.D.S. or D.M.D.); Law (L.L.B., J.D.);Medicine (M.D.); Optometry (O.D.); Osteopathic Medicine (D.O.); Pharmacy (Pharm.D.); Podiatry (D.P.M., D.P., or Pod.D.); Theology (M.Div., M.H.L., B.D., or Ordination); or Veterinary Medicine (D.V.M.).
SOURCE: U.S. Department of Education, National Center for Education Statistics, Integrated Postsecondary Education Data System, "Completions" survey, 1997-98 and "Consolidated" survey, 1998.
13
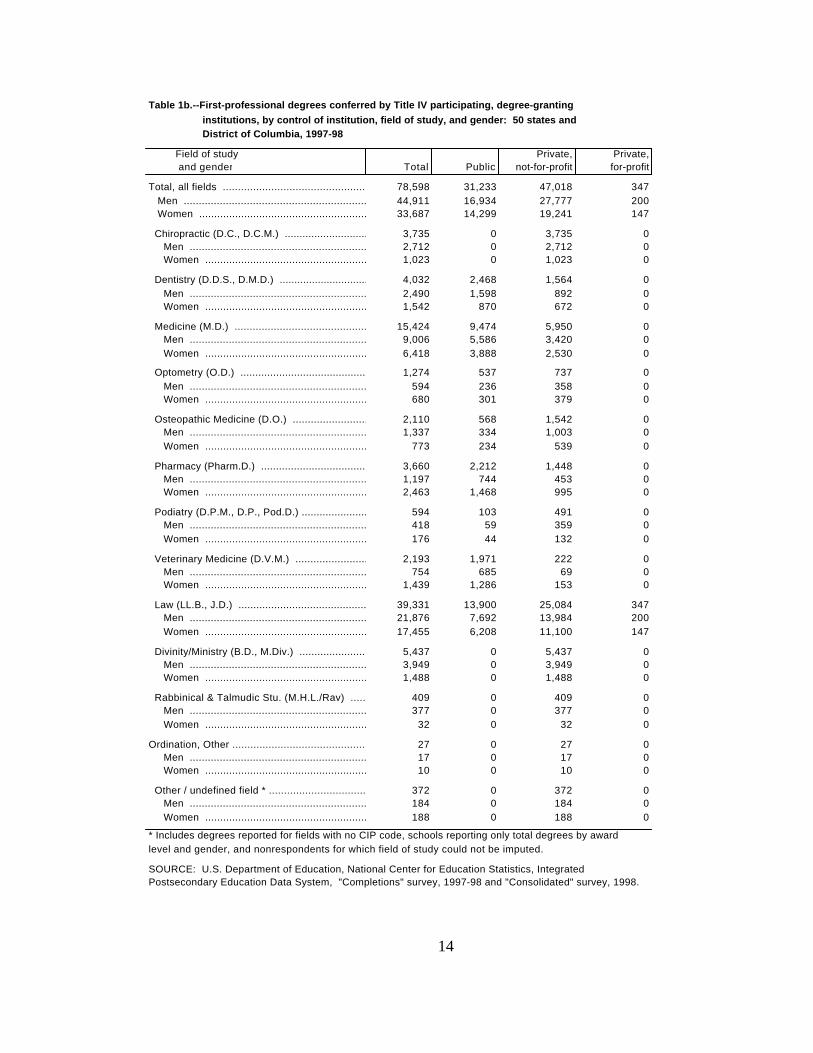
Table 1b.--First-professional degrees conferred by Title IV participating, degree-granting institutions, by control of institution, field of study, and gender: 50 states and District of Columbia, 1997-98
Field of study Private, Private, and gender Total Public not-for-profit for-profit
Total, all fields ...................................................................78,598 31,233 47,018 347 Men .....................................................................................44,911 16,934 27,777 200 Women ........................................................... 33,687 14,299 19,241 147
Chiropractic (D.C., D.C.M.) ..................................... 3,735 0 3,735 0 Men .....................................................................................2,712 0 2,712 0 Women ........................................................... 1,023 0 1,023 0
Dentistry (D.D.S., D.M.D.) ....................................... 4,032 2,468 1,564 0 Men .....................................................................................2,490 1,598 892 0 Women ........................................................... 1,542 870 672 0
Medicine (M.D.) .................................................. 15,424 9,474 5,950 0 Men .....................................................................................9,006 5,586 3,420 0 Women ........................................................... 6,418 3,888 2,530 0
Optometry (O.D.) ..................................................................1,274 537 737 0 Men .....................................................................................594 236 358 0 Women ........................................................... 680 301 379 0
Osteopathic Medicine (D.O.) ............................................2,110 568 1,542 0 Men .....................................................................................1,337 334 1,003 0 Women ........................................................... 773 234 539 0
Pharmacy (Pharm.D.) ........................................................3,660 2,212 1,448 0 Men .....................................................................................1,197 744 453 0 Women ........................................................... 2,463 1,468 995 0
Podiatry (D.P.M., D.P., Pod.D.) ..........................................594 103 491 0 Men .....................................................................................418 59 359 0 Women ........................................................... 176 44 132 0
Veterinary Medicine (D.V.M.) ..............................................2,193 1,971 222 0 Men .....................................................................................754 685 69 0 Women ........................................................... 1,439 1,286 153 0
Law (LL.B., J.D.) ...............................................................................39,331 13,900 25,084 347 Men .....................................................................................21,876 7,692 13,984 200 Women ........................................................... 17,455 6,208 11,100 147
Divinity/Ministry (B.D., M.Div.) .........................................5,437 0 5,437 0 Men .....................................................................................3,949 0 3,949 0 Women ........................................................... 1,488 0 1,488 0
Rabbinical & Talmudic Stu. (M.H.L./Rav) .........................409 0 409 0 Men .....................................................................................377 0 377 0 Women ........................................................... 32 0 32 0
Ordination, Other .............................................. 27 0 27 0 Men .....................................................................................17 0 17 0 Women ........................................................... 10 0 10 0
Other / undefined field * ...........................................................372 0 372 0 Men .....................................................................................184 0 184 0 Women ........................................................... 188 0 188 0
* Includes degrees reported for fields with no CIP code, schools reporting only total degrees by award level and gender, and nonrespondents for which field of study could not be imputed.
SOURCE: U.S. Department of Education, National Center for Education Statistics, Integrated Postsecondary Education Data System, "Completions" survey, 1997-98 and "Consolidated" survey, 1998.
14
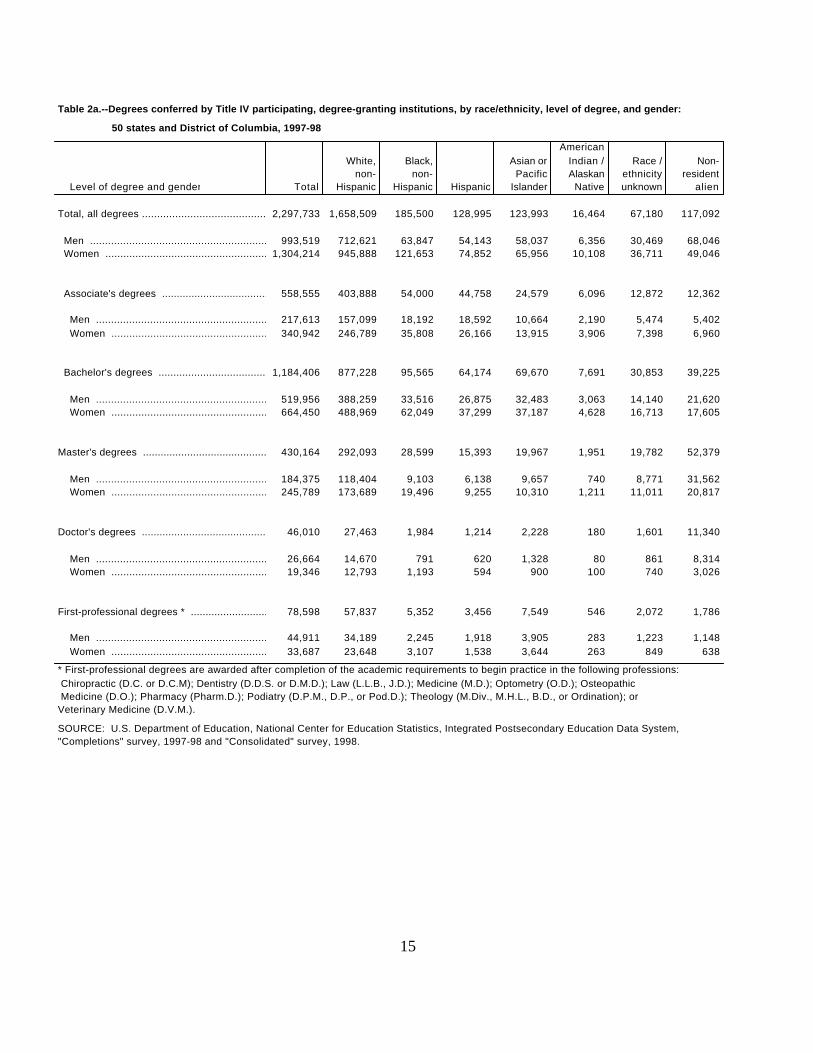
Table 2a.--Degrees conferred by Title IV participating, degree-granting institutions, by race/ethnicity, level of degree, and gender:
50 states and District of Columbia, 1997-98
American White, Black, Asian or Indian / Race / Non-
non- non- Pacific Alaskan ethnicity resident Level of degree and gender Total Hispanic Hispanic Hispanic Islander Native unknown alien
Total, all degrees .................................................2,297,733 1,658,509 185,500 128,995 123,993 16,464 67,180 117,092
Men .............................................................. 993,519 712,621 63,847 54,143 58,037 6,356 30,469 68,046 Women ...........................................................1,304,214 945,888 121,653 74,852 65,956 10,108 36,711 49,046
Associate's degrees ..............................................558,555 403,888 54,000 44,758 24,579 6,096 12,872 12,362
Men ..............................................................217,613 157,099 18,192 18,592 10,664 2,190 5,474 5,402 Women ...........................................................340,942 246,789 35,808 26,166 13,915 3,906 7,398 6,960
Bachelor's degrees ...........................................1,184,406 877,228 95,565 64,174 69,670 7,691 30,853 39,225
Men ..............................................................519,956 388,259 33,516 26,875 32,483 3,063 14,140 21,620 Women ...........................................................664,450 488,969 62,049 37,299 37,187 4,628 16,713 17,605
Master's degrees ..................................................430,164 292,093 28,599 15,393 19,967 1,951 19,782 52,379
Men ..............................................................184,375 118,404 9,103 6,138 9,657 740 8,771 31,562 Women ...........................................................245,789 173,689 19,496 9,255 10,310 1,211 11,011 20,817
Doctor's degrees ..................................................46,010 27,463 1,984 1,214 2,228 180 1,601 11,340
Men .............................................................. 26,664 14,670 791 620 1,328 80 861 8,314 Women ...........................................................19,346 12,793 1,193 594 900 100 740 3,026
First-professional degrees * ..................................................78,598 57,837 5,352 3,456 7,549 546 2,072 1,786
Men .............................................................. 44,911 34,189 2,245 1,918 3,905 283 1,223 1,148 Women ...........................................................33,687 23,648 3,107 1,538 3,644 263 849 638
* First-professional degrees are awarded after completion of the academic requirements to begin practice in the following professions: Chiropractic (D.C. or D.C.M); Dentistry (D.D.S. or D.M.D.); Law (L.L.B., J.D.); Medicine (M.D.); Optometry (O.D.); Osteopathic Medicine (D.O.); Pharmacy (Pharm.D.); Podiatry (D.P.M., D.P., or Pod.D.); Theology (M.Div., M.H.L., B.D., or Ordination); orVeterinary Medicine (D.V.M.).
SOURCE: U.S. Department of Education, National Center for Education Statistics, Integrated Postsecondary Education Data System,"Completions" survey, 1997-98 and "Consolidated" survey, 1998.
15
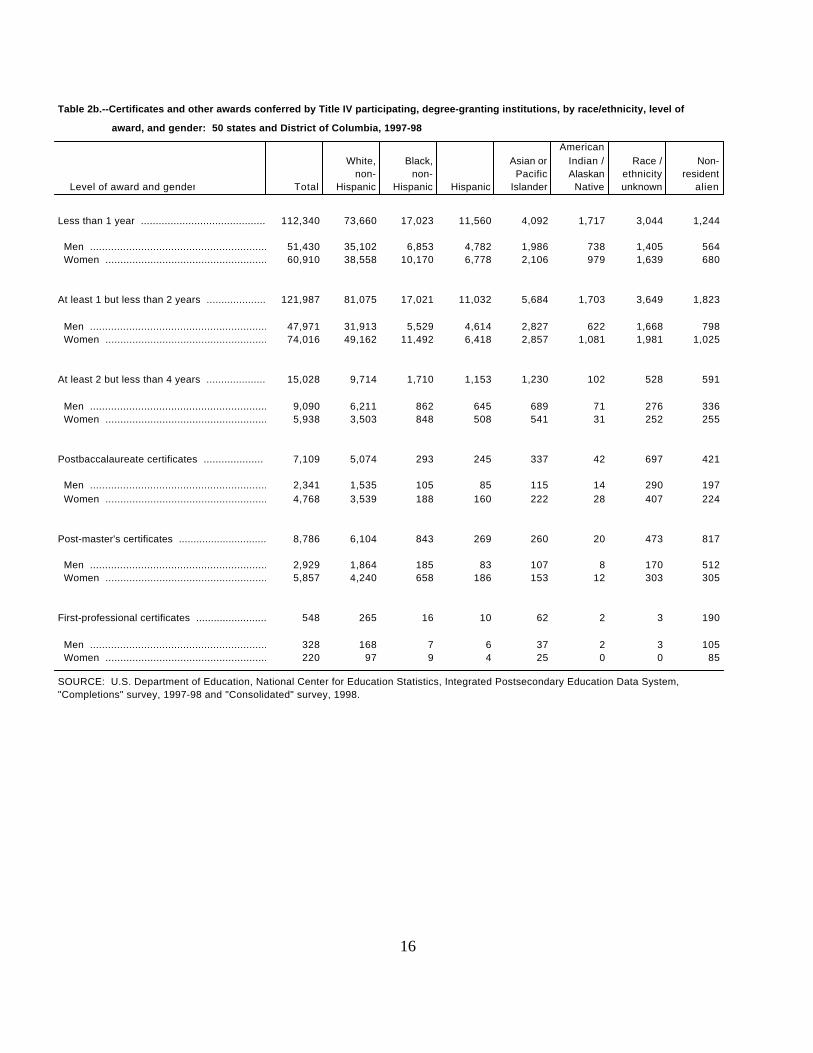
Table 2b.--Certificates and other awards conferred by Title IV participating, degree-granting institutions, by race/ethnicity, level of
award, and gender: 50 states and District of Columbia, 1997-98
American White, Black, Asian or Indian / Race / Non-
non- non- Pacific Alaskan ethnicity resident Level of award and gender Total Hispanic Hispanic Hispanic Islander Native unknown alien
Less than 1 year ................................................112,340 73,660 17,023 11,560 4,092 1,717 3,044 1,244
Men .............................................................. 51,430 35,102 6,853 4,782 1,986 738 1,405 564 Women ........................................................... 60,910 38,558 10,170 6,778 2,106 979 1,639 680
At least 1 but less than 2 years ....................................121,987 81,075 17,021 11,032 5,684 1,703 3,649 1,823
Men .............................................................. 47,971 31,913 5,529 4,614 2,827 622 1,668 798 Women ........................................................... 74,016 49,162 11,492 6,418 2,857 1,081 1,981 1,025
At least 2 but less than 4 years ....................... 15,028 9,714 1,710 1,153 1,230 102 528 591
Men .............................................................. 9,090 6,211 862 645 689 71 276 336 Women ........................................................... 5,938 3,503 848 508 541 31 252 255
Postbaccalaureate certificates .................... 7,109 5,074 293 245 337 42 697 421
Men .............................................................. 2,341 1,535 105 85 115 14 290 197 Women ........................................................... 4,768 3,539 188 160 222 28 407 224
Post-master's certificates ............................... 8,786 6,104 843 269 260 20 473 817
Men .............................................................. 2,929 1,864 185 83 107 8 170 512 Women ........................................................... 5,857 4,240 658 186 153 12 303 305
First-professional certificates ............................... 548 265 16 10 62 2 3 190
Men .............................................................. 328 168 7 6 37 2 3 105 Women ........................................................... 220 97 9 4 25 0 0 85
SOURCE: U.S. Department of Education, National Center for Education Statistics, Integrated Postsecondary Education Data System,"Completions" survey, 1997-98 and "Consolidated" survey, 1998.
16
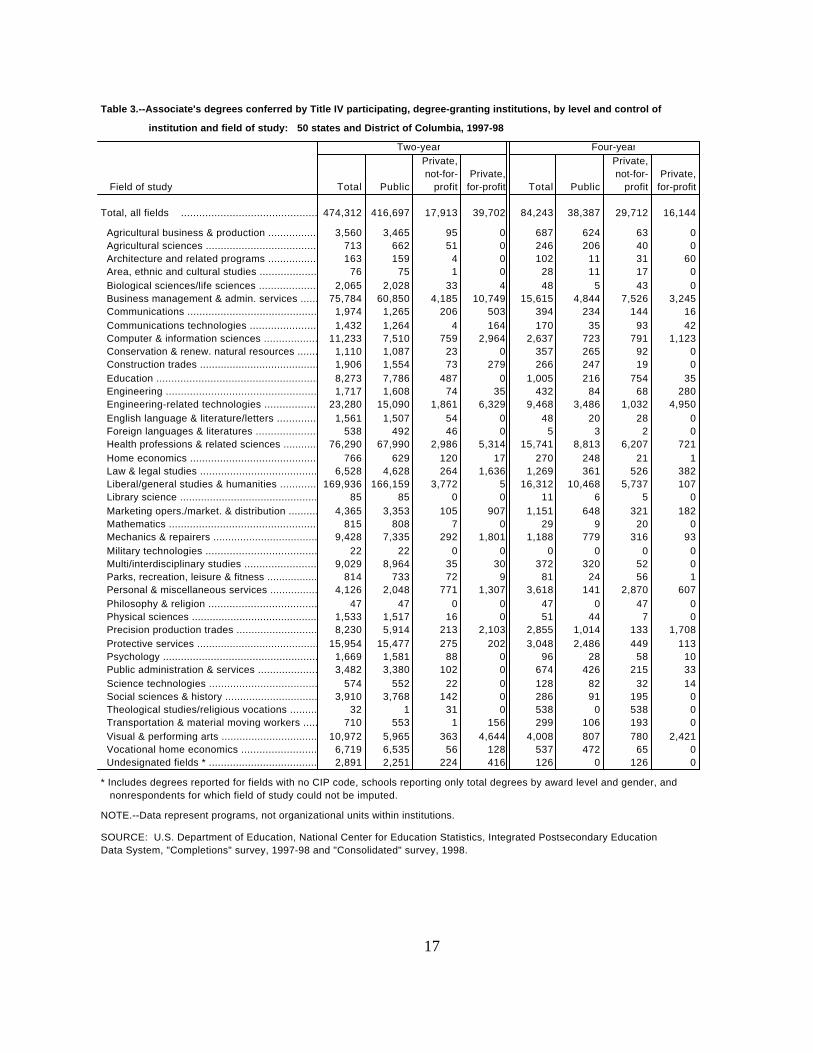
Table 3.--Associate's degrees conferred by Title IV participating, degree-granting institutions, by level and control of
institution and field of study: 50 states and District of Columbia, 1997-98
Two-year Four-yearPrivate, Private, not-for- Private, not-for- Private,
Field of study Total Public profit for-profit Total Public profit for-profit
Total, all fields ........................................................474,312 416,697 17,913 39,702 84,243 38,387 29,712 16,144
Agricultural business & production ...............................3,560 3,465 95 0 687 624 63 0 Agricultural sciences ...................................................713 662 51 0 246 206 40 0 Architecture and related programs ..................................163 159 4 0 102 11 31 60 Area, ethnic and cultural studies ........................................76 75 1 0 28 11 17 0 Biological sciences/life sciences .....................................2,065 2,028 33 4 48 5 43 0 Business management & admin. services ...........................75,784 60,850 4,185 10,749 15,615 4,844 7,526 3,245 Communications ..............................................................1,974 1,265 206 503 394 234 144 16 Communications technologies ............................................1,432 1,264 4 164 170 35 93 42 Computer & information sciences .....................................11,233 7,510 759 2,964 2,637 723 791 1,123 Conservation & renew. natural resources ...........................1,110 1,087 23 0 357 265 92 0 Construction trades ........................................................1,906 1,554 73 279 266 247 19 0 Education .......................................................................8,273 7,786 487 0 1,005 216 754 35 Engineering ...................................................................1,717 1,608 74 35 432 84 68 280 Engineering-related technologies .......................................23,280 15,090 1,861 6,329 9,468 3,486 1,032 4,950 English language & literature/letters ...................................1,561 1,507 54 0 48 20 28 0 Foreign languages & literatures ......................................538 492 46 0 5 3 2 0 Health professions & related sciences .............................76,290 67,990 2,986 5,314 15,741 8,813 6,207 721 Home economics ...........................................................766 629 120 17 270 248 21 1 Law & legal studies ..........................................................6,528 4,628 264 1,636 1,269 361 526 382 Liberal/general studies & humanities ..............................169,936 166,159 3,772 5 16,312 10,468 5,737 107 Library science .........................................................85 85 0 0 11 6 5 0 Marketing opers./market. & distribution ..........................4,365 3,353 105 907 1,151 648 321 182 Mathematics ....................................................................815 808 7 0 29 9 20 0 Mechanics & repairers ......................................................9,428 7,335 292 1,801 1,188 779 316 93 Military technologies ........................................................22 22 0 0 0 0 0 0 Multi/interdisciplinary studies ...........................................9,029 8,964 35 30 372 320 52 0 Parks, recreation, leisure & fitness ...................................814 733 72 9 81 24 56 1 Personal & miscellaneous services .................................4,126 2,048 771 1,307 3,618 141 2,870 607 Philosophy & religion ......................................................47 47 0 0 47 0 47 0 Physical sciences ............................................................1,533 1,517 16 0 51 44 7 0 Precision production trades ...............................................8,230 5,914 213 2,103 2,855 1,014 133 1,708 Protective services ........................................................15,954 15,477 275 202 3,048 2,486 449 113 Psychology ..................................................................1,669 1,581 88 0 96 28 58 10 Public administration & services ........................................3,482 3,380 102 0 674 426 215 33 Science technologies .....................................................574 552 22 0 128 82 32 14 Social sciences & history ................................................3,910 3,768 142 0 286 91 195 0 Theological studies/religious vocations ................................32 1 31 0 538 0 538 0 Transportation & material moving workers ...........................710 553 1 156 299 106 193 0 Visual & performing arts .................................................10,972 5,965 363 4,644 4,008 807 780 2,421 Vocational home economics ..............................................6,719 6,535 56 128 537 472 65 0 Undesignated fields * .........................................................2,891 2,251 224 416 126 0 126 0
* Includes degrees reported for fields with no CIP code, schools reporting only total degrees by award level and gender, and nonrespondents for which field of study could not be imputed.
NOTE.--Data represent programs, not organizational units within institutions.
SOURCE: U.S. Department of Education, National Center for Education Statistics, Integrated Postsecondary EducationData System, "Completions" survey, 1997-98 and "Consolidated" survey, 1998.
17

Table 4.--Associate's degrees conferred by Title IV participating, degree-granting institutions, by race/ethnicity, field of study, and
gender: 50 states and District of Columbia, 1997-98
American
White, Black, Asian or Indian / Race / Non-
non- non- Pacific Alaskan ethnicity resident
Field of study and gender Total Hispanic Hispanic Hispanic Islander Native unknown alien
All fields ........................................................ 558,555 403,888 54,000 44,758 24,579 6,096 12,872 12,362 Men .............................................................. 217,613 157,099 18,192 18,592 10,664 2,190 5,474 5,402 Women ...........................................................340,942 246,789 35,808 26,166 13,915 3,906 7,398 6,960
Agricultural business & production ................. 4,247 3,936 39 61 18 27 100 66 Men .............................................................. 2,836 2,635 34 38 11 17 66 35 Women ........................................................... 1,411 1,301 5 23 7 10 34 31
Agricultural sciences ......................................... 959 889 5 28 4 20 12 1 Men .............................................................. 488 452 3 17 1 11 4 0 Women ........................................................... 471 437 2 11 3 9 8 1
Architecture & related programs ....................... 265 212 5 24 10 0 2 12 Men .............................................................. 90 68 3 11 4 0 1 3 Women ........................................................... 175 144 2 13 6 0 1 9
Area, ethnic & cultural studies ......................... 104 25 9 11 4 42 3 10 Men .............................................................. 25 2 3 3 0 13 0 4 Women ........................................................... 79 23 6 8 4 29 3 6
Biological sciences/life sciences .....................................2,113 1,306 155 224 248 37 61 82 Men .............................................................. 782 482 60 74 94 17 23 32 Women ........................................................... 1,331 824 95 150 154 20 38 50
Business management & admin. services ......... 91,399 62,704 11,289 7,392 4,325 946 2,279 2,464 Men .............................................................. 24,637 16,813 2,665 2,070 1,309 181 697 902 Women ...........................................................66,762 45,891 8,624 5,322 3,016 765 1,582 1,562
Communications ..................................................2,368 1,665 200 171 95 23 150 64 Men .............................................................. 1,144 835 90 84 33 11 66 25 Women ........................................................... 1,224 830 110 87 62 12 84 39
Communications technologies ..............................1,602 1,132 193 133 53 8 28 55 Men .............................................................. 1,008 727 111 84 37 5 19 25 Women ........................................................... 594 405 82 49 16 3 9 30
Computer & information sciences ........................13,870 9,027 1,863 1,120 914 178 420 348 Men .............................................................. 7,627 5,105 817 640 546 69 255 195 Women ........................................................... 6,243 3,922 1,046 480 368 109 165 153
Conservation & renew. natural resources .......... 1,467 1,324 7 14 5 53 13 51 Men .............................................................. 1,135 1,052 7 9 5 26 11 25 Women ........................................................... 332 272 0 5 0 27 2 26
Construction trades ............................................ 2,172 1,786 115 78 106 44 37 6 Men .............................................................. 2,055 1,696 109 72 102 35 35 6 Women ........................................................... 117 90 6 6 4 9 2 0
Education .............................................................9,278 6,385 1,032 1,135 184 242 188 112 Men .............................................................. 2,174 1,436 219 284 63 71 63 38 Women ........................................................... 7,104 4,949 813 851 121 171 125 74
Engineering ..................................................... 2,149 1,482 119 184 163 22 46 133 Men .............................................................. 1,823 1,265 93 156 139 17 40 113 Women ........................................................... 326 217 26 28 24 5 6 20
Engineering-related technologies ................. 32,748 23,644 3,215 2,715 1,551 304 568 751 Men .............................................................. 28,533 20,673 2,651 2,416 1,391 239 503 660 Women ........................................................... 4,215 2,971 564 299 160 65 65 91
18
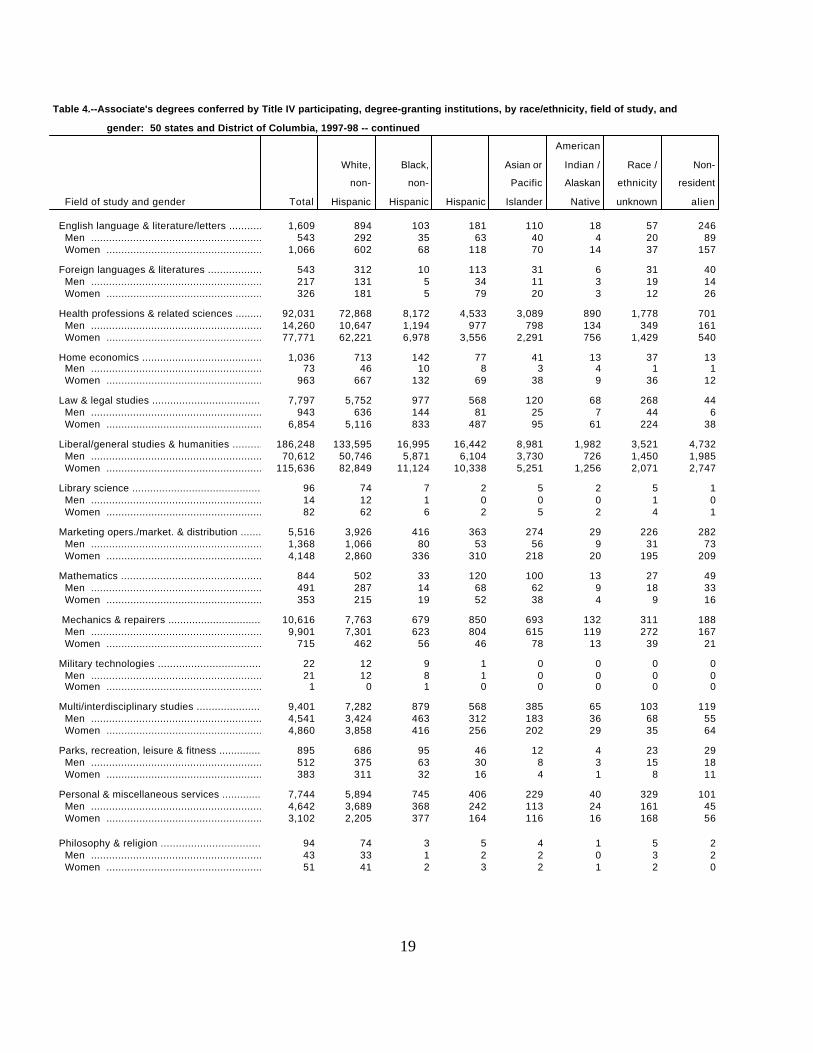
Table 4.--Associate's degrees conferred by Title IV participating, degree-granting institutions, by race/ethnicity, field of study, and
gender: 50 states and District of Columbia, 1997-98 -- continued
American
White, Black, Asian or Indian / Race / Non-
non- non- Pacific Alaskan ethnicity resident
Field of study and gender Total Hispanic Hispanic Hispanic Islander Native unknown alien
English language & literature/letters .............................1,609 894 103 181 110 18 57 246 Men .............................................................. 543 292 35 63 40 4 20 89 Women ........................................................... 1,066 602 68 118 70 14 37 157
Foreign languages & literatures ..............................543 312 10 113 31 6 31 40 Men .............................................................. 217 131 5 34 11 3 19 14 Women ........................................................... 326 181 5 79 20 3 12 26
Health professions & related sciences .............................92,031 72,868 8,172 4,533 3,089 890 1,778 701 Men .............................................................. 14,260 10,647 1,194 977 798 134 349 161 Women ...........................................................77,771 62,221 6,978 3,556 2,291 756 1,429 540
Home economics ..................................................1,036 713 142 77 41 13 37 13 Men .............................................................. 73 46 10 8 3 4 1 1 Women ........................................................... 963 667 132 69 38 9 36 12
Law & legal studies ......................................... 7,797 5,752 977 568 120 68 268 44 Men .............................................................. 943 636 144 81 25 7 44 6 Women ........................................................... 6,854 5,116 833 487 95 61 224 38
Liberal/general studies & humanities ...................186,248 133,595 16,995 16,442 8,981 1,982 3,521 4,732 Men .............................................................. 70,612 50,746 5,871 6,104 3,730 726 1,450 1,985 Women ...........................................................115,636 82,849 11,124 10,338 5,251 1,256 2,071 2,747
Library science .........................................................96 74 7 2 5 2 5 1 Men .............................................................. 14 12 1 0 0 0 1 0 Women ........................................................... 82 62 6 2 5 2 4 1
Marketing opers./market. & distribution ............ 5,516 3,926 416 363 274 29 226 282 Men .............................................................. 1,368 1,066 80 53 56 9 31 73 Women ........................................................... 4,148 2,860 336 310 218 20 195 209
Mathematics ....................................................................844 502 33 120 100 13 27 49 Men .............................................................. 491 287 14 68 62 9 18 33 Women ........................................................... 353 215 19 52 38 4 9 16
Mechanics & repairers ................................... 10,616 7,763 679 850 693 132 311 188 Men .............................................................. 9,901 7,301 623 804 615 119 272 167 Women ........................................................... 715 462 56 46 78 13 39 21
Military technologies ....................................... 22 12 9 1 0 0 0 0 Men .............................................................. 21 12 8 1 0 0 0 0 Women ........................................................... 1 0 1 0 0 0 0 0
Multi/interdisciplinary studies ...............................9,401 7,282 879 568 385 65 103 119 Men .............................................................. 4,541 3,424 463 312 183 36 68 55 Women ........................................................... 4,860 3,858 416 256 202 29 35 64
Parks, recreation, leisure & fitness ...............................895 686 95 46 12 4 23 29 Men .............................................................. 512 375 63 30 8 3 15 18 Women ........................................................... 383 311 32 16 4 1 8 11
Personal & miscellaneous services .......................7,744 5,894 745 406 229 40 329 101 Men .............................................................. 4,642 3,689 368 242 113 24 161 45 Women ........................................................... 3,102 2,205 377 164 116 16 168 56
Philosophy & religion .......................................... 94 74 3 5 4 1 5 2 Men .............................................................. 43 33 1 2 2 0 3 2 Women ........................................................... 51 41 2 3 2 1 2 0
19
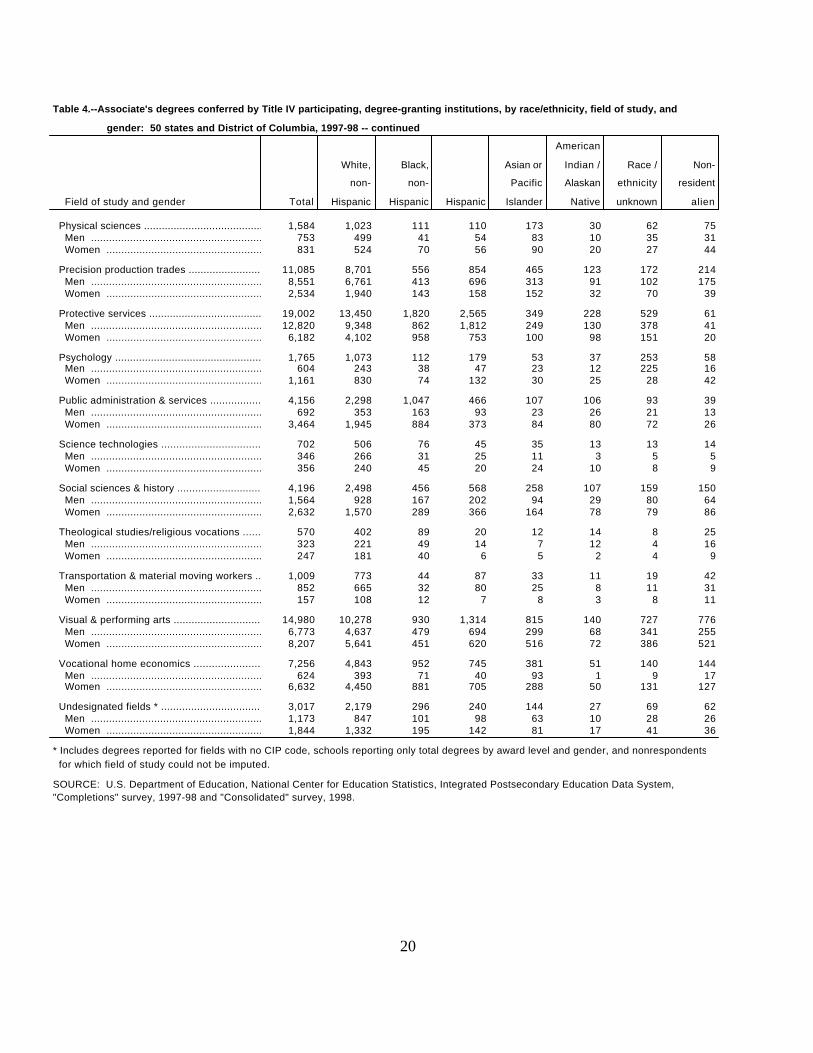
Table 4.--Associate's degrees conferred by Title IV participating, degree-granting institutions, by race/ethnicity, field of study, and
gender: 50 states and District of Columbia, 1997-98 -- continued
American
White, Black, Asian or Indian / Race / Non-
non- non- Pacific Alaskan ethnicity resident
Field of study and gender Total Hispanic Hispanic Hispanic Islander Native unknown alien
Physical sciences ....................................................1,584 1,023 111 110 173 30 62 75 Men .............................................................. 753 499 41 54 83 10 35 31 Women ........................................................... 831 524 70 56 90 20 27 44
Precision production trades .............................. 11,085 8,701 556 854 465 123 172 214 Men .............................................................. 8,551 6,761 413 696 313 91 102 175 Women ........................................................... 2,534 1,940 143 158 152 32 70 39
Protective services ......................................... 19,002 13,450 1,820 2,565 349 228 529 61 Men .............................................................. 12,820 9,348 862 1,812 249 130 378 41 Women ........................................................... 6,182 4,102 958 753 100 98 151 20
Psychology ..................................................... 1,765 1,073 112 179 53 37 253 58 Men .............................................................. 604 243 38 47 23 12 225 16 Women ........................................................... 1,161 830 74 132 30 25 28 42
Public administration & services .................................4,156 2,298 1,047 466 107 106 93 39 Men .............................................................. 692 353 163 93 23 26 21 13 Women ........................................................... 3,464 1,945 884 373 84 80 72 26
Science technologies ............................................ 702 506 76 45 35 13 13 14 Men .............................................................. 346 266 31 25 11 3 5 5 Women ........................................................... 356 240 45 20 24 10 8 9
Social sciences & history ................................... 4,196 2,498 456 568 258 107 159 150 Men .............................................................. 1,564 928 167 202 94 29 80 64 Women ........................................................... 2,632 1,570 289 366 164 78 79 86
Theological studies/religious vocations ............ 570 402 89 20 12 14 8 25 Men .............................................................. 323 221 49 14 7 12 4 16 Women ........................................................... 247 181 40 6 5 2 4 9
Transportation & material moving workers ................1,009 773 44 87 33 11 19 42 Men .............................................................. 852 665 32 80 25 8 11 31 Women ........................................................... 157 108 12 7 8 3 8 11
Visual & performing arts ................................ 14,980 10,278 930 1,314 815 140 727 776 Men .............................................................. 6,773 4,637 479 694 299 68 341 255 Women ........................................................... 8,207 5,641 451 620 516 72 386 521
Vocational home economics ...................................7,256 4,843 952 745 381 51 140 144 Men .............................................................. 624 393 71 40 93 1 9 17 Women ........................................................... 6,632 4,450 881 705 288 50 131 127
Undesignated fields * ...............................................3,017 2,179 296 240 144 27 69 62 Men .............................................................. 1,173 847 101 98 63 10 28 26 Women ........................................................... 1,844 1,332 195 142 81 17 41 36
* Includes degrees reported for fields with no CIP code, schools reporting only total degrees by award level and gender, and nonrespondents for which field of study could not be imputed.
SOURCE: U.S. Department of Education, National Center for Education Statistics, Integrated Postsecondary Education Data System, "Completions" survey, 1997-98 and "Consolidated" survey, 1998.
20
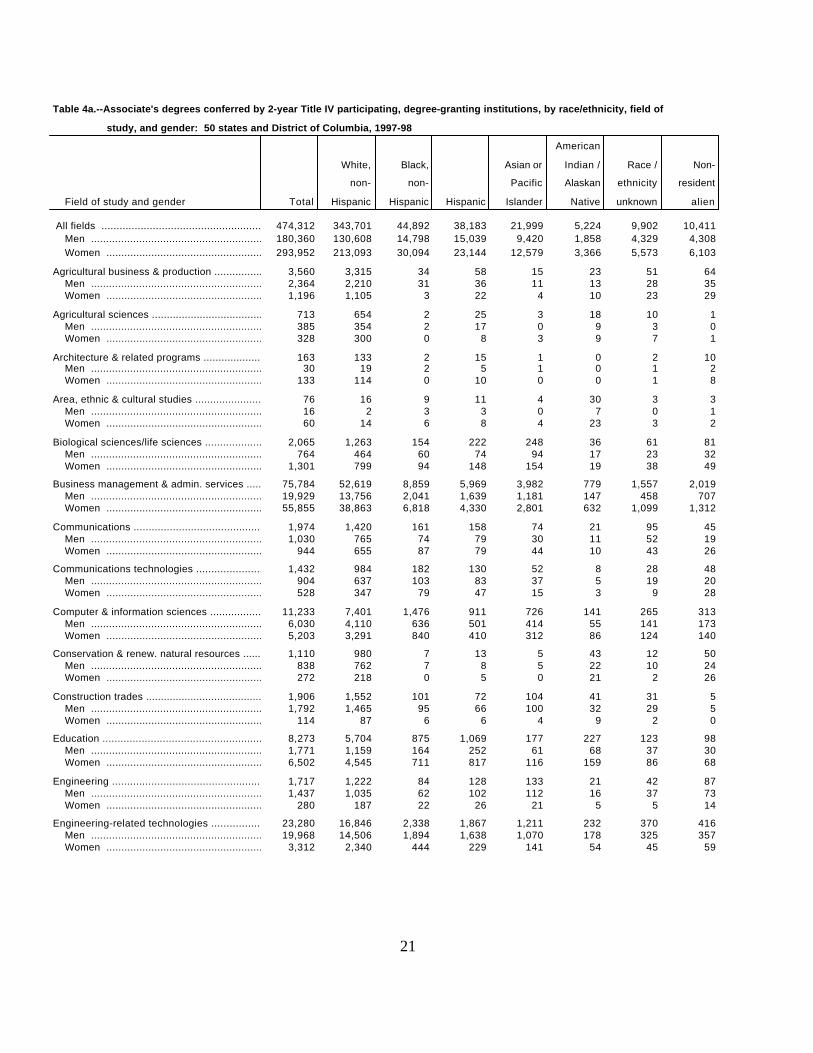
Table 4a.--Associate's degrees conferred by 2-year Title IV participating, degree-granting institutions, by race/ethnicity, field of
study, and gender: 50 states and District of Columbia, 1997-98
American
White, Black, Asian or Indian / Race / Non-
non- non- Pacific Alaskan ethnicity resident
Field of study and gender Total Hispanic Hispanic Hispanic Islander Native unknown alien
All fields ........................................................ 474,312 343,701 44,892 38,183 21,999 5,224 9,902 10,411 Men ..............................................................180,360 130,608 14,798 15,039 9,420 1,858 4,329 4,308 Women ...........................................................293,952 213,093 30,094 23,144 12,579 3,366 5,573 6,103
Agricultural business & production ................. 3,560 3,315 34 58 15 23 51 64 Men .............................................................. 2,364 2,210 31 36 11 13 28 35 Women ........................................................... 1,196 1,105 3 22 4 10 23 29
Agricultural sciences ......................................... 713 654 2 25 3 18 10 1 Men .............................................................. 385 354 2 17 0 9 3 0 Women ........................................................... 328 300 0 8 3 9 7 1
Architecture & related programs ....................... 163 133 2 15 1 0 2 10 Men .............................................................. 30 19 2 5 1 0 1 2 Women ........................................................... 133 114 0 10 0 0 1 8
Area, ethnic & cultural studies ......................... 76 16 9 11 4 30 3 3 Men .............................................................. 16 2 3 3 0 7 0 1 Women ........................................................... 60 14 6 8 4 23 3 2
Biological sciences/life sciences .....................................2,065 1,263 154 222 248 36 61 81 Men .............................................................. 764 464 60 74 94 17 23 32 Women ........................................................... 1,301 799 94 148 154 19 38 49
Business management & admin. services ......... 75,784 52,619 8,859 5,969 3,982 779 1,557 2,019 Men .............................................................. 19,929 13,756 2,041 1,639 1,181 147 458 707 Women ...........................................................55,855 38,863 6,818 4,330 2,801 632 1,099 1,312
Communications .................................................. 1,974 1,420 161 158 74 21 95 45 Men .............................................................. 1,030 765 74 79 30 11 52 19 Women ........................................................... 944 655 87 79 44 10 43 26
Communications technologies .............................. 1,432 984 182 130 52 8 28 48 Men .............................................................. 904 637 103 83 37 5 19 20 Women ........................................................... 528 347 79 47 15 3 9 28
Computer & information sciences ........................11,233 7,401 1,476 911 726 141 265 313 Men .............................................................. 6,030 4,110 636 501 414 55 141 173 Women ........................................................... 5,203 3,291 840 410 312 86 124 140
Conservation & renew. natural resources .......... 1,110 980 7 13 5 43 12 50 Men .............................................................. 838 762 7 8 5 22 10 24 Women ........................................................... 272 218 0 5 0 21 2 26
Construction trades ............................................ 1,906 1,552 101 72 104 41 31 5 Men .............................................................. 1,792 1,465 95 66 100 32 29 5 Women ........................................................... 114 87 6 6 4 9 2 0
Education ............................................................. 8,273 5,704 875 1,069 177 227 123 98 Men .............................................................. 1,771 1,159 164 252 61 68 37 30 Women ........................................................... 6,502 4,545 711 817 116 159 86 68
Engineering ..................................................... 1,717 1,222 84 128 133 21 42 87 Men .............................................................. 1,437 1,035 62 102 112 16 37 73 Women ........................................................... 280 187 22 26 21 5 5 14
Engineering-related technologies ................. 23,280 16,846 2,338 1,867 1,211 232 370 416 Men .............................................................. 19,968 14,506 1,894 1,638 1,070 178 325 357 Women ........................................................... 3,312 2,340 444 229 141 54 45 59
21
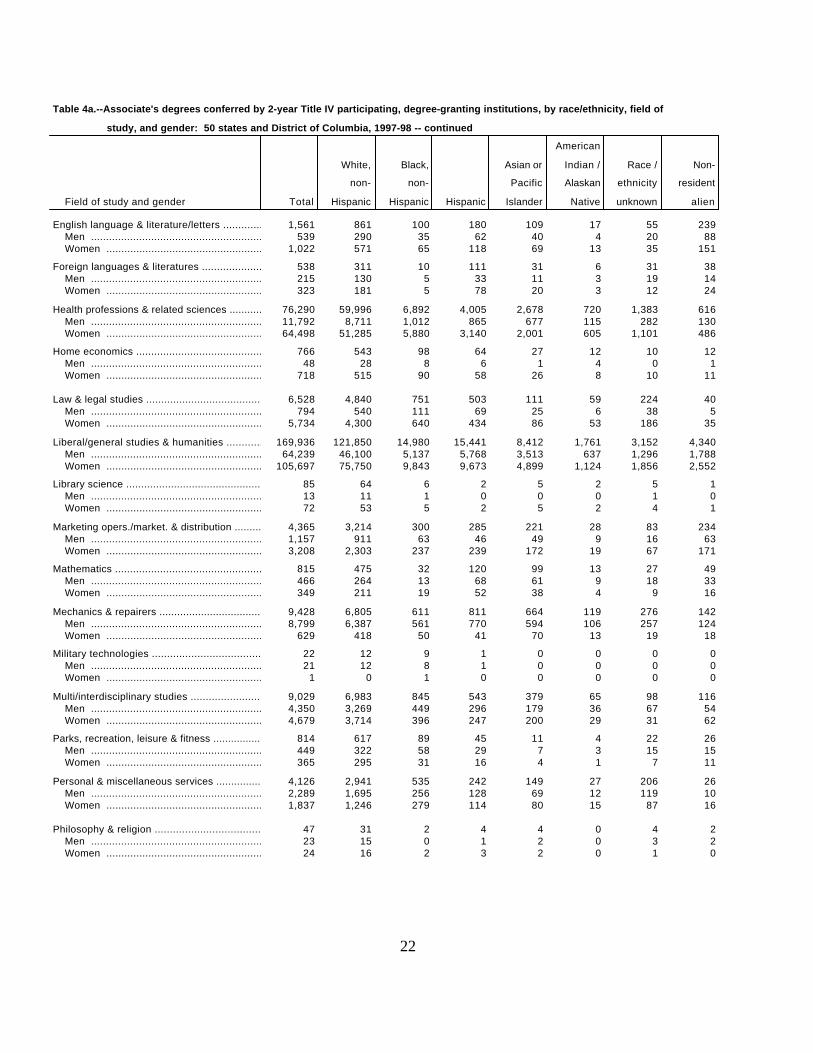
Table 4a.--Associate's degrees conferred by 2-year Title IV participating, degree-granting institutions, by race/ethnicity, field of
study, and gender: 50 states and District of Columbia, 1997-98 -- continued
American
White, Black, Asian or Indian / Race / Non-
non- non- Pacific Alaskan ethnicity resident
Field of study and gender Total Hispanic Hispanic Hispanic Islander Native unknown alien
English language & literature/letters .............................1,561 861 100 180 109 17 55 239 Men .............................................................. 539 290 35 62 40 4 20 88 Women ........................................................... 1,022 571 65 118 69 13 35 151
Foreign languages & literatures .............................. 538 311 10 111 31 6 31 38 Men .............................................................. 215 130 5 33 11 3 19 14 Women ........................................................... 323 181 5 78 20 3 12 24
Health professions & related sciences .............................76,290 59,996 6,892 4,005 2,678 720 1,383 616 Men .............................................................. 11,792 8,711 1,012 865 677 115 282 130 Women ...........................................................64,498 51,285 5,880 3,140 2,001 605 1,101 486
Home economics .................................................. 766 543 98 64 27 12 10 12 Men .............................................................. 48 28 8 6 1 4 0 1 Women ........................................................... 718 515 90 58 26 8 10 11
Law & legal studies ......................................... 6,528 4,840 751 503 111 59 224 40 Men .............................................................. 794 540 111 69 25 6 38 5 Women ........................................................... 5,734 4,300 640 434 86 53 186 35
Liberal/general studies & humanities ...................169,936 121,850 14,980 15,441 8,412 1,761 3,152 4,340 Men .............................................................. 64,239 46,100 5,137 5,768 3,513 637 1,296 1,788 Women ...........................................................105,697 75,750 9,843 9,673 4,899 1,124 1,856 2,552
Library science ......................................................... 85 64 6 2 5 2 5 1 Men .............................................................. 13 11 1 0 0 0 1 0 Women ........................................................... 72 53 5 2 5 2 4 1
Marketing opers./market. & distribution ............ 4,365 3,214 300 285 221 28 83 234 Men .............................................................. 1,157 911 63 46 49 9 16 63 Women ........................................................... 3,208 2,303 237 239 172 19 67 171
Mathematics ....................................................................815 475 32 120 99 13 27 49 Men .............................................................. 466 264 13 68 61 9 18 33 Women ........................................................... 349 211 19 52 38 4 9 16
Mechanics & repairers ................................... 9,428 6,805 611 811 664 119 276 142 Men .............................................................. 8,799 6,387 561 770 594 106 257 124 Women ........................................................... 629 418 50 41 70 13 19 18
Military technologies ....................................... 22 12 9 1 0 0 0 0 Men .............................................................. 21 12 8 1 0 0 0 0 Women ........................................................... 1 0 1 0 0 0 0 0
Multi/interdisciplinary studies ............................... 9,029 6,983 845 543 379 65 98 116 Men .............................................................. 4,350 3,269 449 296 179 36 67 54 Women ........................................................... 4,679 3,714 396 247 200 29 31 62
Parks, recreation, leisure & fitness ...............................814 617 89 45 11 4 22 26 Men .............................................................. 449 322 58 29 7 3 15 15 Women ........................................................... 365 295 31 16 4 1 7 11
Personal & miscellaneous services ....................... 4,126 2,941 535 242 149 27 206 26 Men .............................................................. 2,289 1,695 256 128 69 12 119 10 Women ........................................................... 1,837 1,246 279 114 80 15 87 16
Philosophy & religion .......................................... 47 31 2 4 4 0 4 2 Men .............................................................. 23 15 0 1 2 0 3 2 Women ........................................................... 24 16 2 3 2 0 1 0
22
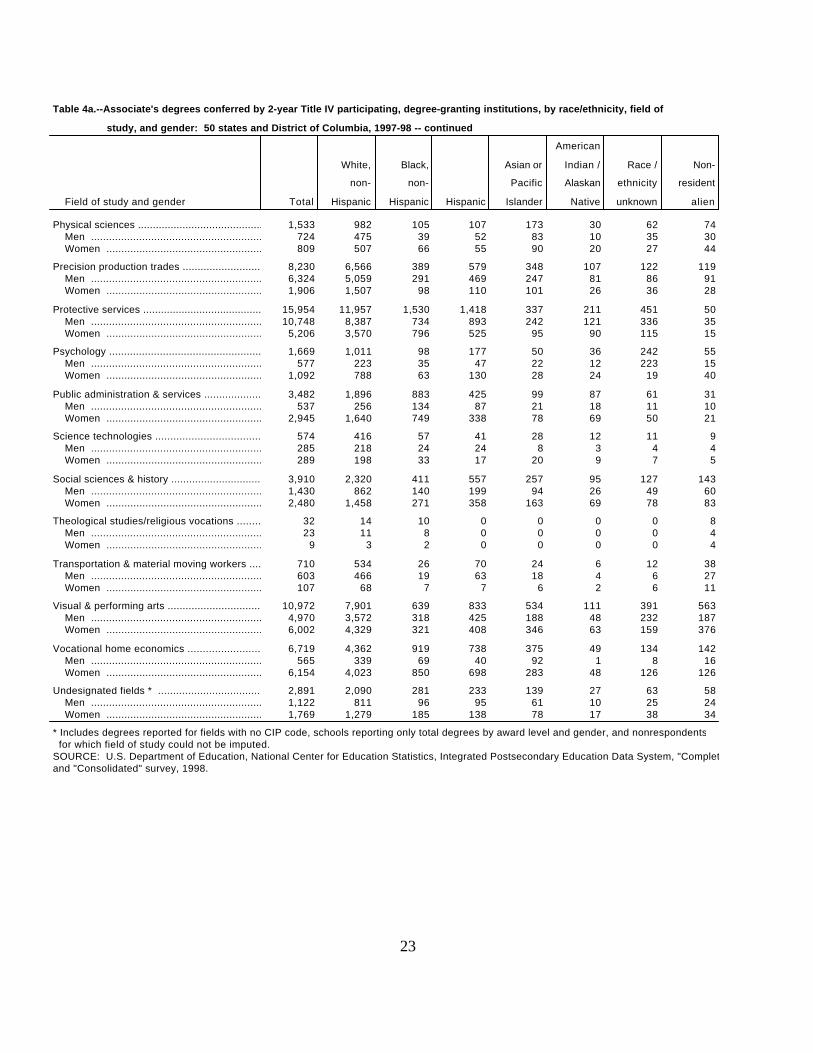
Table 4a.--Associate's degrees conferred by 2-year Title IV participating, degree-granting institutions, by race/ethnicity, field of
study, and gender: 50 states and District of Columbia, 1997-98 -- continued
American
White, Black, Asian or Indian / Race / Non-
non- non- Pacific Alaskan ethnicity resident
Field of study and gender Total Hispanic Hispanic Hispanic Islander Native unknown alien
Physical sciences ....................................................1,533 982 105 107 173 30 62 74 Men .............................................................. 724 475 39 52 83 10 35 30 Women ........................................................... 809 507 66 55 90 20 27 44
Precision production trades .............................. 8,230 6,566 389 579 348 107 122 119 Men .............................................................. 6,324 5,059 291 469 247 81 86 91 Women ........................................................... 1,906 1,507 98 110 101 26 36 28
Protective services ......................................... 15,954 11,957 1,530 1,418 337 211 451 50 Men .............................................................. 10,748 8,387 734 893 242 121 336 35 Women ........................................................... 5,206 3,570 796 525 95 90 115 15
Psychology ..................................................... 1,669 1,011 98 177 50 36 242 55 Men .............................................................. 577 223 35 47 22 12 223 15 Women ........................................................... 1,092 788 63 130 28 24 19 40
Public administration & services .................................3,482 1,896 883 425 99 87 61 31 Men .............................................................. 537 256 134 87 21 18 11 10 Women ........................................................... 2,945 1,640 749 338 78 69 50 21
Science technologies ............................................ 574 416 57 41 28 12 11 9 Men .............................................................. 285 218 24 24 8 3 4 4 Women ........................................................... 289 198 33 17 20 9 7 5
Social sciences & history ................................... 3,910 2,320 411 557 257 95 127 143 Men .............................................................. 1,430 862 140 199 94 26 49 60 Women ........................................................... 2,480 1,458 271 358 163 69 78 83
Theological studies/religious vocations ............ 32 14 10 0 0 0 0 8 Men .............................................................. 23 11 8 0 0 0 0 4 Women ........................................................... 9 3 2 0 0 0 0 4
Transportation & material moving workers ................710 534 26 70 24 6 12 38 Men .............................................................. 603 466 19 63 18 4 6 27 Women ........................................................... 107 68 7 7 6 2 6 11
Visual & performing arts ................................ 10,972 7,901 639 833 534 111 391 563 Men .............................................................. 4,970 3,572 318 425 188 48 232 187 Women ........................................................... 6,002 4,329 321 408 346 63 159 376
Vocational home economics ...................................6,719 4,362 919 738 375 49 134 142 Men .............................................................. 565 339 69 40 92 1 8 16 Women ........................................................... 6,154 4,023 850 698 283 48 126 126
Undesignated fields * ...............................................2,891 2,090 281 233 139 27 63 58 Men .............................................................. 1,122 811 96 95 61 10 25 24 Women ........................................................... 1,769 1,279 185 138 78 17 38 34
* Includes degrees reported for fields with no CIP code, schools reporting only total degrees by award level and gender, and nonrespondents for which field of study could not be imputed.SOURCE: U.S. Department of Education, National Center for Education Statistics, Integrated Postsecondary Education Data System, "Completions" survey, 1997-98and "Consolidated" survey, 1998.
23
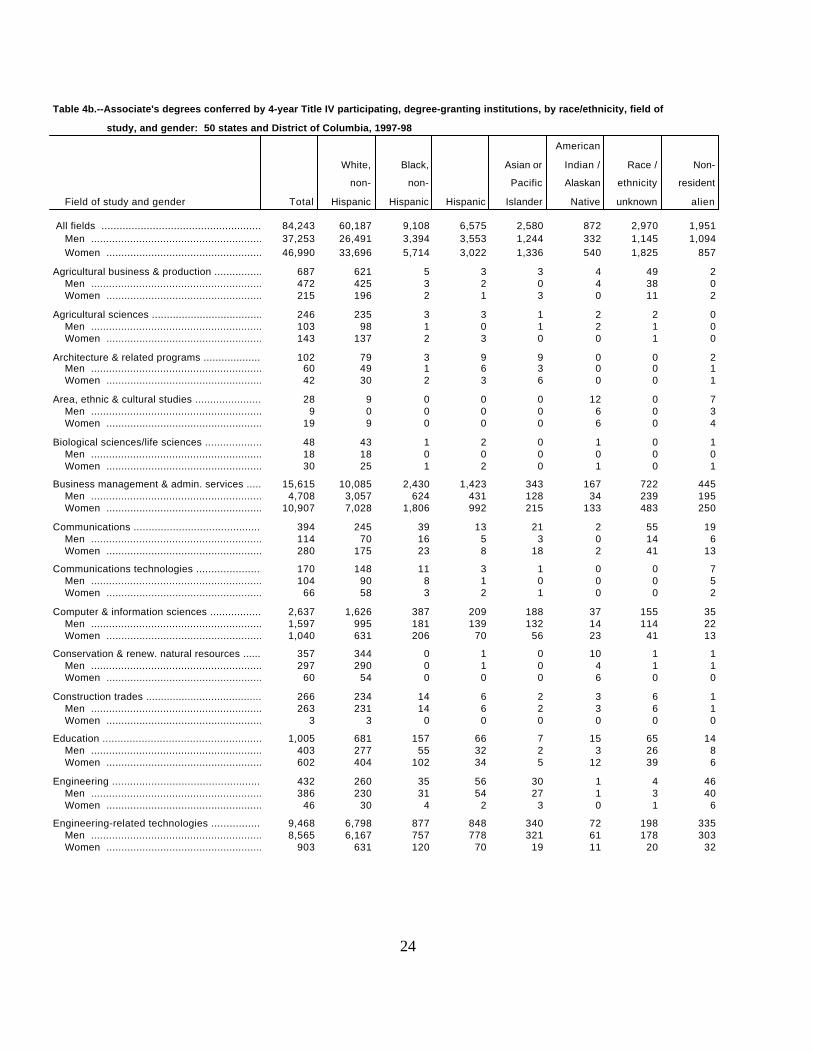
Table 4b.--Associate's degrees conferred by 4-year Title IV participating, degree-granting institutions, by race/ethnicity, field of
study, and gender: 50 states and District of Columbia, 1997-98
American
White, Black, Asian or Indian / Race / Non-
non- non- Pacific Alaskan ethnicity resident
Field of study and gender Total Hispanic Hispanic Hispanic Islander Native unknown alien
All fields ........................................................ 84,243 60,187 9,108 6,575 2,580 872 2,970 1,951 Men .............................................................. 37,253 26,491 3,394 3,553 1,244 332 1,145 1,094 Women ...........................................................46,990 33,696 5,714 3,022 1,336 540 1,825 857
Agricultural business & production ................. 687 621 5 3 3 4 49 2 Men .............................................................. 472 425 3 2 0 4 38 0 Women ........................................................... 215 196 2 1 3 0 11 2
Agricultural sciences ......................................... 246 235 3 3 1 2 2 0 Men .............................................................. 103 98 1 0 1 2 1 0 Women ........................................................... 143 137 2 3 0 0 1 0
Architecture & related programs ....................... 102 79 3 9 9 0 0 2 Men .............................................................. 60 49 1 6 3 0 0 1 Women ........................................................... 42 30 2 3 6 0 0 1
Area, ethnic & cultural studies ......................... 28 9 0 0 0 12 0 7 Men .............................................................. 9 0 0 0 0 6 0 3 Women ........................................................... 19 9 0 0 0 6 0 4
Biological sciences/life sciences .....................................48 43 1 2 0 1 0 1 Men .............................................................. 18 18 0 0 0 0 0 0 Women ........................................................... 30 25 1 2 0 1 0 1
Business management & admin. services ......... 15,615 10,085 2,430 1,423 343 167 722 445 Men .............................................................. 4,708 3,057 624 431 128 34 239 195 Women ...........................................................10,907 7,028 1,806 992 215 133 483 250
Communications .................................................. 394 245 39 13 21 2 55 19 Men .............................................................. 114 70 16 5 3 0 14 6 Women ........................................................... 280 175 23 8 18 2 41 13
Communications technologies .............................. 170 148 11 3 1 0 0 7 Men .............................................................. 104 90 8 1 0 0 0 5 Women ........................................................... 66 58 3 2 1 0 0 2
Computer & information sciences ........................ 2,637 1,626 387 209 188 37 155 35 Men .............................................................. 1,597 995 181 139 132 14 114 22 Women ........................................................... 1,040 631 206 70 56 23 41 13
Conservation & renew. natural resources .......... 357 344 0 1 0 10 1 1 Men .............................................................. 297 290 0 1 0 4 1 1 Women ........................................................... 60 54 0 0 0 6 0 0
Construction trades ............................................ 266 234 14 6 2 3 6 1 Men .............................................................. 263 231 14 6 2 3 6 1 Women ........................................................... 3 3 0 0 0 0 0 0
Education ............................................................. 1,005 681 157 66 7 15 65 14 Men .............................................................. 403 277 55 32 2 3 26 8 Women ........................................................... 602 404 102 34 5 12 39 6
Engineering ..................................................... 432 260 35 56 30 1 4 46 Men .............................................................. 386 230 31 54 27 1 3 40 Women ........................................................... 46 30 4 2 3 0 1 6
Engineering-related technologies ................. 9,468 6,798 877 848 340 72 198 335 Men .............................................................. 8,565 6,167 757 778 321 61 178 303 Women ........................................................... 903 631 120 70 19 11 20 32
24
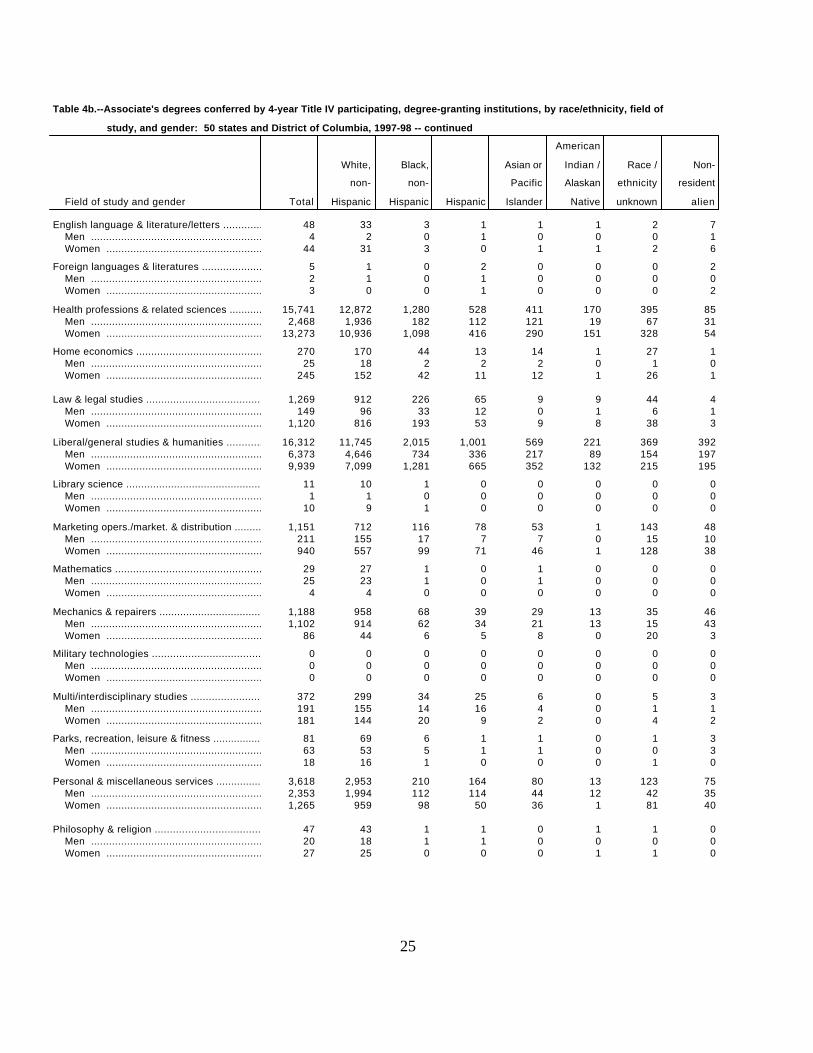
Table 4b.--Associate's degrees conferred by 4-year Title IV participating, degree-granting institutions, by race/ethnicity, field of
study, and gender: 50 states and District of Columbia, 1997-98 -- continued
American
White, Black, Asian or Indian / Race / Non-
non- non- Pacific Alaskan ethnicity resident
Field of study and gender Total Hispanic Hispanic Hispanic Islander Native unknown alien
English language & literature/letters .............................48 33 3 1 1 1 2 7 Men .............................................................. 4 2 0 1 0 0 0 1 Women ........................................................... 44 31 3 0 1 1 2 6
Foreign languages & literatures .............................. 5 1 0 2 0 0 0 2 Men .............................................................. 2 1 0 1 0 0 0 0 Women ........................................................... 3 0 0 1 0 0 0 2
Health professions & related sciences .............................15,741 12,872 1,280 528 411 170 395 85 Men .............................................................. 2,468 1,936 182 112 121 19 67 31 Women ...........................................................13,273 10,936 1,098 416 290 151 328 54
Home economics .................................................. 270 170 44 13 14 1 27 1 Men .............................................................. 25 18 2 2 2 0 1 0 Women ........................................................... 245 152 42 11 12 1 26 1
Law & legal studies ......................................... 1,269 912 226 65 9 9 44 4 Men .............................................................. 149 96 33 12 0 1 6 1 Women ........................................................... 1,120 816 193 53 9 8 38 3
Liberal/general studies & humanities ...................16,312 11,745 2,015 1,001 569 221 369 392 Men .............................................................. 6,373 4,646 734 336 217 89 154 197 Women ........................................................... 9,939 7,099 1,281 665 352 132 215 195
Library science ......................................................... 11 10 1 0 0 0 0 0 Men .............................................................. 1 1 0 0 0 0 0 0 Women ........................................................... 10 9 1 0 0 0 0 0
Marketing opers./market. & distribution ............ 1,151 712 116 78 53 1 143 48 Men .............................................................. 211 155 17 7 7 0 15 10 Women ........................................................... 940 557 99 71 46 1 128 38
Mathematics ....................................................................29 27 1 0 1 0 0 0 Men .............................................................. 25 23 1 0 1 0 0 0 Women ........................................................... 4 4 0 0 0 0 0 0
Mechanics & repairers ................................... 1,188 958 68 39 29 13 35 46 Men .............................................................. 1,102 914 62 34 21 13 15 43 Women ........................................................... 86 44 6 5 8 0 20 3
Military technologies ....................................... 0 0 0 0 0 0 0 0 Men .............................................................. 0 0 0 0 0 0 0 0 Women ........................................................... 0 0 0 0 0 0 0 0
Multi/interdisciplinary studies ............................... 372 299 34 25 6 0 5 3 Men .............................................................. 191 155 14 16 4 0 1 1 Women ........................................................... 181 144 20 9 2 0 4 2
Parks, recreation, leisure & fitness ...............................81 69 6 1 1 0 1 3 Men .............................................................. 63 53 5 1 1 0 0 3 Women ........................................................... 18 16 1 0 0 0 1 0
Personal & miscellaneous services ....................... 3,618 2,953 210 164 80 13 123 75 Men .............................................................. 2,353 1,994 112 114 44 12 42 35 Women ........................................................... 1,265 959 98 50 36 1 81 40
Philosophy & religion .......................................... 47 43 1 1 0 1 1 0 Men .............................................................. 20 18 1 1 0 0 0 0 Women ........................................................... 27 25 0 0 0 1 1 0
25
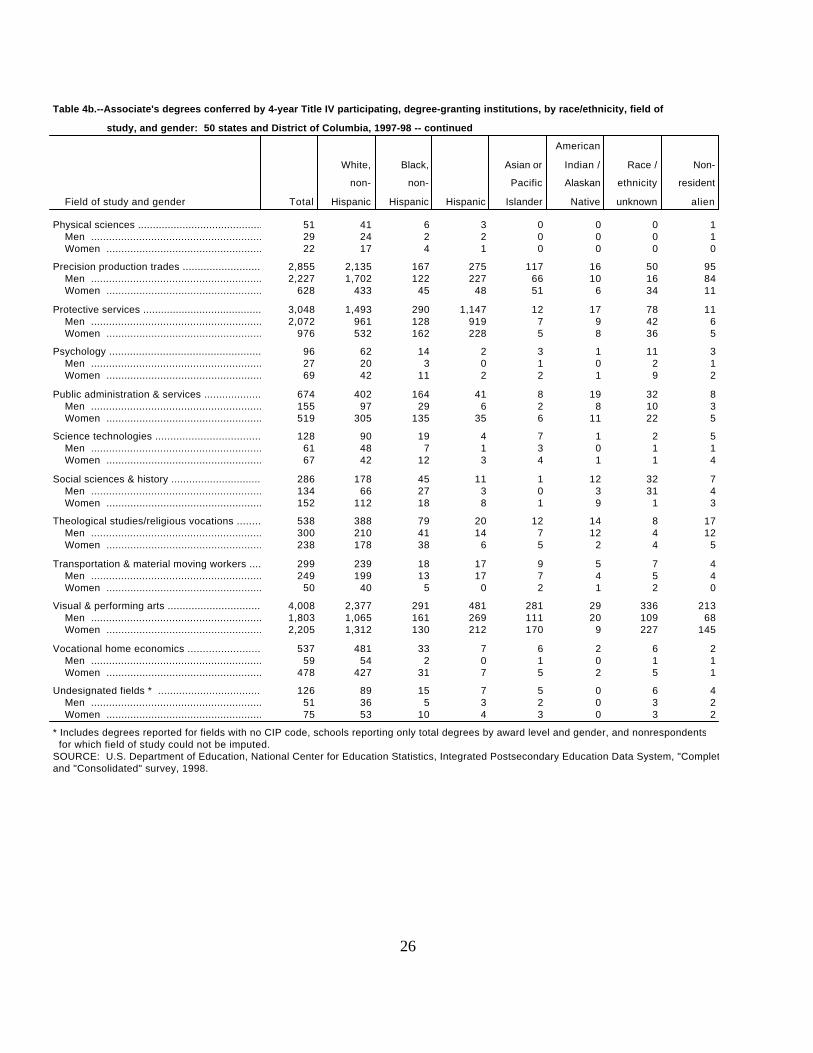
Table 4b.--Associate's degrees conferred by 4-year Title IV participating, degree-granting institutions, by race/ethnicity, field of
study, and gender: 50 states and District of Columbia, 1997-98 -- continued
American
White, Black, Asian or Indian / Race / Non-
non- non- Pacific Alaskan ethnicity resident
Field of study and gender Total Hispanic Hispanic Hispanic Islander Native unknown alien
Physical sciences .................................................... 51 41 6 3 0 0 0 1 Men .............................................................. 29 24 2 2 0 0 0 1 Women ........................................................... 22 17 4 1 0 0 0 0
Precision production trades .............................. 2,855 2,135 167 275 117 16 50 95 Men .............................................................. 2,227 1,702 122 227 66 10 16 84 Women ........................................................... 628 433 45 48 51 6 34 11
Protective services ......................................... 3,048 1,493 290 1,147 12 17 78 11 Men .............................................................. 2,072 961 128 919 7 9 42 6 Women ........................................................... 976 532 162 228 5 8 36 5
Psychology ..................................................... 96 62 14 2 3 1 11 3 Men .............................................................. 27 20 3 0 1 0 2 1 Women ........................................................... 69 42 11 2 2 1 9 2
Public administration & services .................................674 402 164 41 8 19 32 8 Men .............................................................. 155 97 29 6 2 8 10 3 Women ........................................................... 519 305 135 35 6 11 22 5
Science technologies ............................................ 128 90 19 4 7 1 2 5 Men .............................................................. 61 48 7 1 3 0 1 1 Women ........................................................... 67 42 12 3 4 1 1 4
Social sciences & history ................................... 286 178 45 11 1 12 32 7 Men .............................................................. 134 66 27 3 0 3 31 4 Women ........................................................... 152 112 18 8 1 9 1 3
Theological studies/religious vocations ............ 538 388 79 20 12 14 8 17 Men .............................................................. 300 210 41 14 7 12 4 12 Women ........................................................... 238 178 38 6 5 2 4 5
Transportation & material moving workers ................299 239 18 17 9 5 7 4 Men .............................................................. 249 199 13 17 7 4 5 4 Women ........................................................... 50 40 5 0 2 1 2 0
Visual & performing arts ................................ 4,008 2,377 291 481 281 29 336 213 Men .............................................................. 1,803 1,065 161 269 111 20 109 68 Women ........................................................... 2,205 1,312 130 212 170 9 227 145
Vocational home economics ................................... 537 481 33 7 6 2 6 2 Men .............................................................. 59 54 2 0 1 0 1 1 Women ........................................................... 478 427 31 7 5 2 5 1
Undesignated fields * ...............................................126 89 15 7 5 0 6 4 Men .............................................................. 51 36 5 3 2 0 3 2 Women ........................................................... 75 53 10 4 3 0 3 2
* Includes degrees reported for fields with no CIP code, schools reporting only total degrees by award level and gender, and nonrespondents for which field of study could not be imputed.SOURCE: U.S. Department of Education, National Center for Education Statistics, Integrated Postsecondary Education Data System, "Completions" survey, 1997-98and "Consolidated" survey, 1998.
26
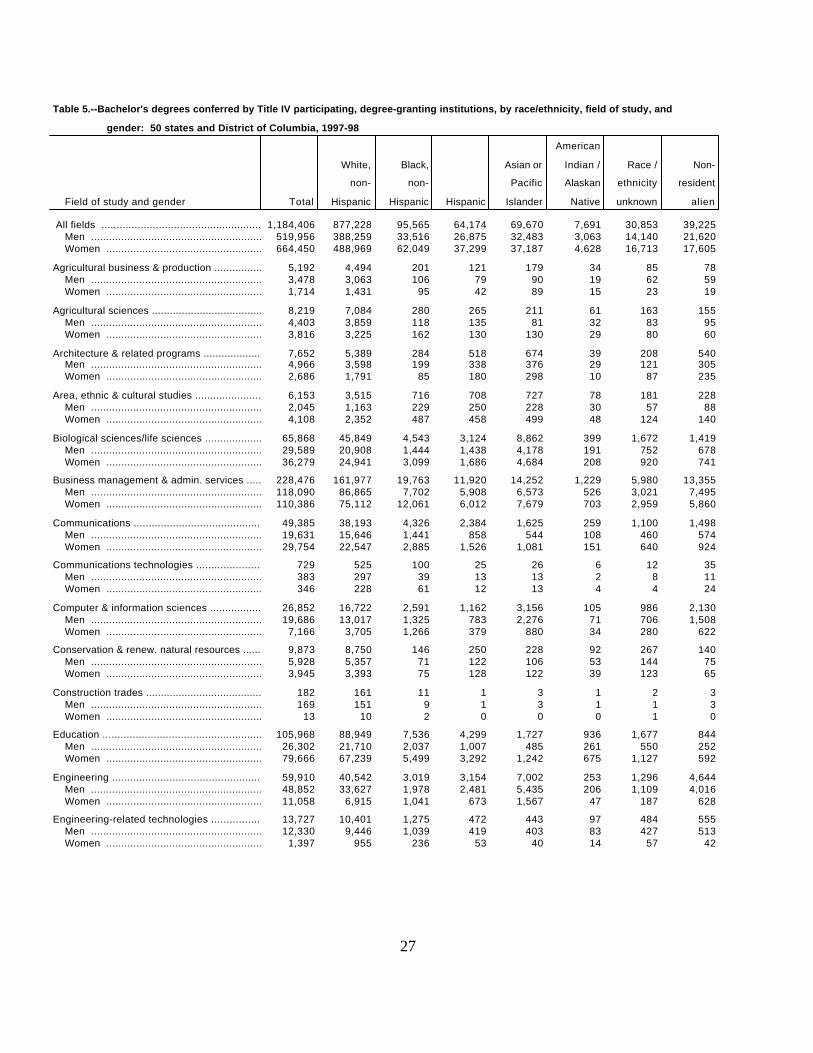
Table 5.--Bachelor's degrees conferred by Title IV participating, degree-granting institutions, by race/ethnicity, field of study, and
gender: 50 states and District of Columbia, 1997-98
American
White, Black, Asian or Indian / Race / Non-
non- non- Pacific Alaskan ethnicity resident
Field of study and gender Total Hispanic Hispanic Hispanic Islander Native unknown alien
All fields ........................................................1,184,406 877,228 95,565 64,174 69,670 7,691 30,853 39,225 Men ..............................................................519,956 388,259 33,516 26,875 32,483 3,063 14,140 21,620 Women ...........................................................664,450 488,969 62,049 37,299 37,187 4,628 16,713 17,605
Agricultural business & production ................. 5,192 4,494 201 121 179 34 85 78 Men .............................................................. 3,478 3,063 106 79 90 19 62 59 Women ........................................................... 1,714 1,431 95 42 89 15 23 19
Agricultural sciences ......................................... 8,219 7,084 280 265 211 61 163 155 Men .............................................................. 4,403 3,859 118 135 81 32 83 95 Women ........................................................... 3,816 3,225 162 130 130 29 80 60
Architecture & related programs ....................... 7,652 5,389 284 518 674 39 208 540 Men .............................................................. 4,966 3,598 199 338 376 29 121 305 Women ........................................................... 2,686 1,791 85 180 298 10 87 235
Area, ethnic & cultural studies ......................... 6,153 3,515 716 708 727 78 181 228 Men .............................................................. 2,045 1,163 229 250 228 30 57 88 Women ........................................................... 4,108 2,352 487 458 499 48 124 140
Biological sciences/life sciences .....................................65,868 45,849 4,543 3,124 8,862 399 1,672 1,419 Men .............................................................. 29,589 20,908 1,444 1,438 4,178 191 752 678 Women ...........................................................36,279 24,941 3,099 1,686 4,684 208 920 741
Business management & admin. services ......... 228,476 161,977 19,763 11,920 14,252 1,229 5,980 13,355 Men ..............................................................118,090 86,865 7,702 5,908 6,573 526 3,021 7,495 Women ...........................................................110,386 75,112 12,061 6,012 7,679 703 2,959 5,860
Communications ..................................................49,385 38,193 4,326 2,384 1,625 259 1,100 1,498 Men .............................................................. 19,631 15,646 1,441 858 544 108 460 574 Women ...........................................................29,754 22,547 2,885 1,526 1,081 151 640 924
Communications technologies .............................. 729 525 100 25 26 6 12 35 Men .............................................................. 383 297 39 13 13 2 8 11 Women ........................................................... 346 228 61 12 13 4 4 24
Computer & information sciences ........................26,852 16,722 2,591 1,162 3,156 105 986 2,130 Men .............................................................. 19,686 13,017 1,325 783 2,276 71 706 1,508 Women ........................................................... 7,166 3,705 1,266 379 880 34 280 622
Conservation & renew. natural resources .......... 9,873 8,750 146 250 228 92 267 140 Men .............................................................. 5,928 5,357 71 122 106 53 144 75 Women ........................................................... 3,945 3,393 75 128 122 39 123 65
Construction trades ............................................ 182 161 11 1 3 1 2 3 Men .............................................................. 169 151 9 1 3 1 1 3 Women ........................................................... 13 10 2 0 0 0 1 0
Education .............................................................105,968 88,949 7,536 4,299 1,727 936 1,677 844 Men .............................................................. 26,302 21,710 2,037 1,007 485 261 550 252 Women ...........................................................79,666 67,239 5,499 3,292 1,242 675 1,127 592
Engineering ..................................................... 59,910 40,542 3,019 3,154 7,002 253 1,296 4,644 Men .............................................................. 48,852 33,627 1,978 2,481 5,435 206 1,109 4,016 Women ...........................................................11,058 6,915 1,041 673 1,567 47 187 628
Engineering-related technologies ................. 13,727 10,401 1,275 472 443 97 484 555 Men .............................................................. 12,330 9,446 1,039 419 403 83 427 513 Women ........................................................... 1,397 955 236 53 40 14 57 42
27
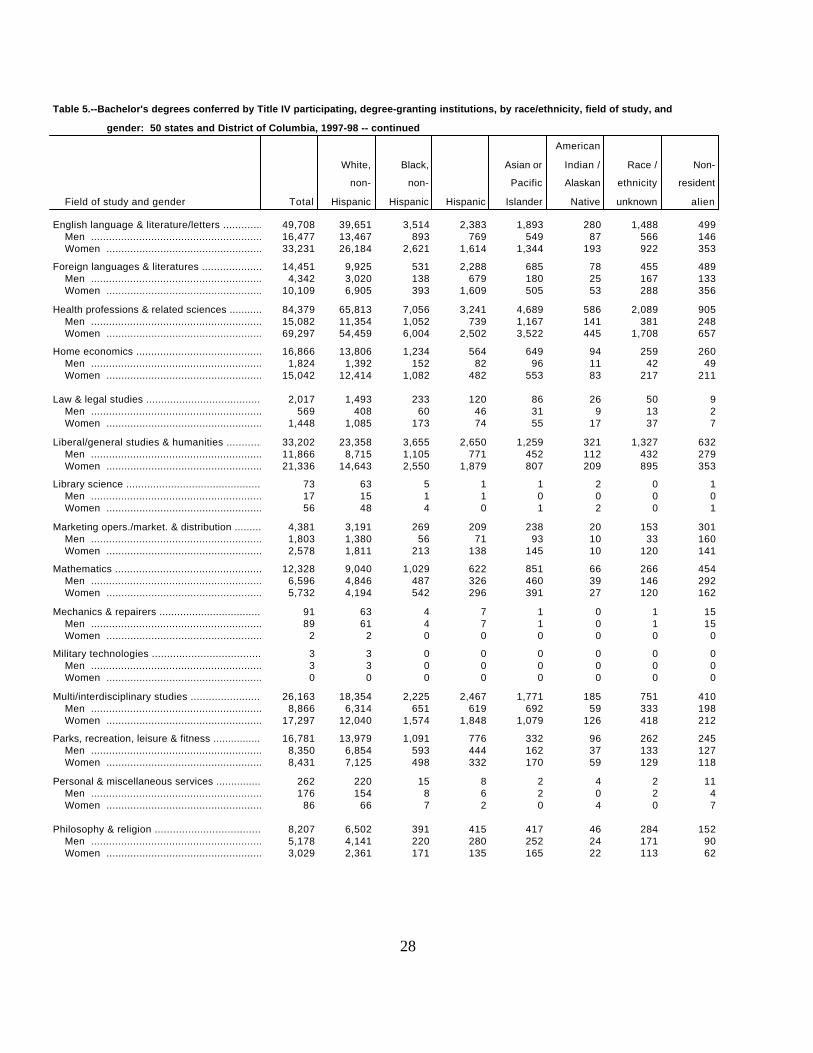
Table 5.--Bachelor's degrees conferred by Title IV participating, degree-granting institutions, by race/ethnicity, field of study, and
gender: 50 states and District of Columbia, 1997-98 -- continued
American
White, Black, Asian or Indian / Race / Non-
non- non- Pacific Alaskan ethnicity resident
Field of study and gender Total Hispanic Hispanic Hispanic Islander Native unknown alien
English language & literature/letters .............................49,708 39,651 3,514 2,383 1,893 280 1,488 499 Men .............................................................. 16,477 13,467 893 769 549 87 566 146 Women ...........................................................33,231 26,184 2,621 1,614 1,344 193 922 353
Foreign languages & literatures ..............................14,451 9,925 531 2,288 685 78 455 489 Men .............................................................. 4,342 3,020 138 679 180 25 167 133 Women ...........................................................10,109 6,905 393 1,609 505 53 288 356
Health professions & related sciences .............................84,379 65,813 7,056 3,241 4,689 586 2,089 905 Men .............................................................. 15,082 11,354 1,052 739 1,167 141 381 248 Women ...........................................................69,297 54,459 6,004 2,502 3,522 445 1,708 657
Home economics ..................................................16,866 13,806 1,234 564 649 94 259 260 Men .............................................................. 1,824 1,392 152 82 96 11 42 49 Women ...........................................................15,042 12,414 1,082 482 553 83 217 211
Law & legal studies ......................................... 2,017 1,493 233 120 86 26 50 9 Men .............................................................. 569 408 60 46 31 9 13 2 Women ........................................................... 1,448 1,085 173 74 55 17 37 7
Liberal/general studies & humanities ...................33,202 23,358 3,655 2,650 1,259 321 1,327 632 Men .............................................................. 11,866 8,715 1,105 771 452 112 432 279 Women ...........................................................21,336 14,643 2,550 1,879 807 209 895 353
Library science ......................................................... 73 63 5 1 1 2 0 1 Men .............................................................. 17 15 1 1 0 0 0 0 Women ........................................................... 56 48 4 0 1 2 0 1
Marketing opers./market. & distribution ............ 4,381 3,191 269 209 238 20 153 301 Men .............................................................. 1,803 1,380 56 71 93 10 33 160 Women ........................................................... 2,578 1,811 213 138 145 10 120 141
Mathematics ....................................................................12,328 9,040 1,029 622 851 66 266 454 Men .............................................................. 6,596 4,846 487 326 460 39 146 292 Women ........................................................... 5,732 4,194 542 296 391 27 120 162
Mechanics & repairers ................................... 91 63 4 7 1 0 1 15 Men .............................................................. 89 61 4 7 1 0 1 15 Women ........................................................... 2 2 0 0 0 0 0 0
Military technologies ....................................... 3 3 0 0 0 0 0 0 Men .............................................................. 3 3 0 0 0 0 0 0 Women ........................................................... 0 0 0 0 0 0 0 0
Multi/interdisciplinary studies ...............................26,163 18,354 2,225 2,467 1,771 185 751 410 Men .............................................................. 8,866 6,314 651 619 692 59 333 198 Women ...........................................................17,297 12,040 1,574 1,848 1,079 126 418 212
Parks, recreation, leisure & fitness ...............................16,781 13,979 1,091 776 332 96 262 245 Men .............................................................. 8,350 6,854 593 444 162 37 133 127 Women ........................................................... 8,431 7,125 498 332 170 59 129 118
Personal & miscellaneous services ....................... 262 220 15 8 2 4 2 11 Men .............................................................. 176 154 8 6 2 0 2 4 Women ........................................................... 86 66 7 2 0 4 0 7
Philosophy & religion .......................................... 8,207 6,502 391 415 417 46 284 152 Men .............................................................. 5,178 4,141 220 280 252 24 171 90 Women ........................................................... 3,029 2,361 171 135 165 22 113 62
28
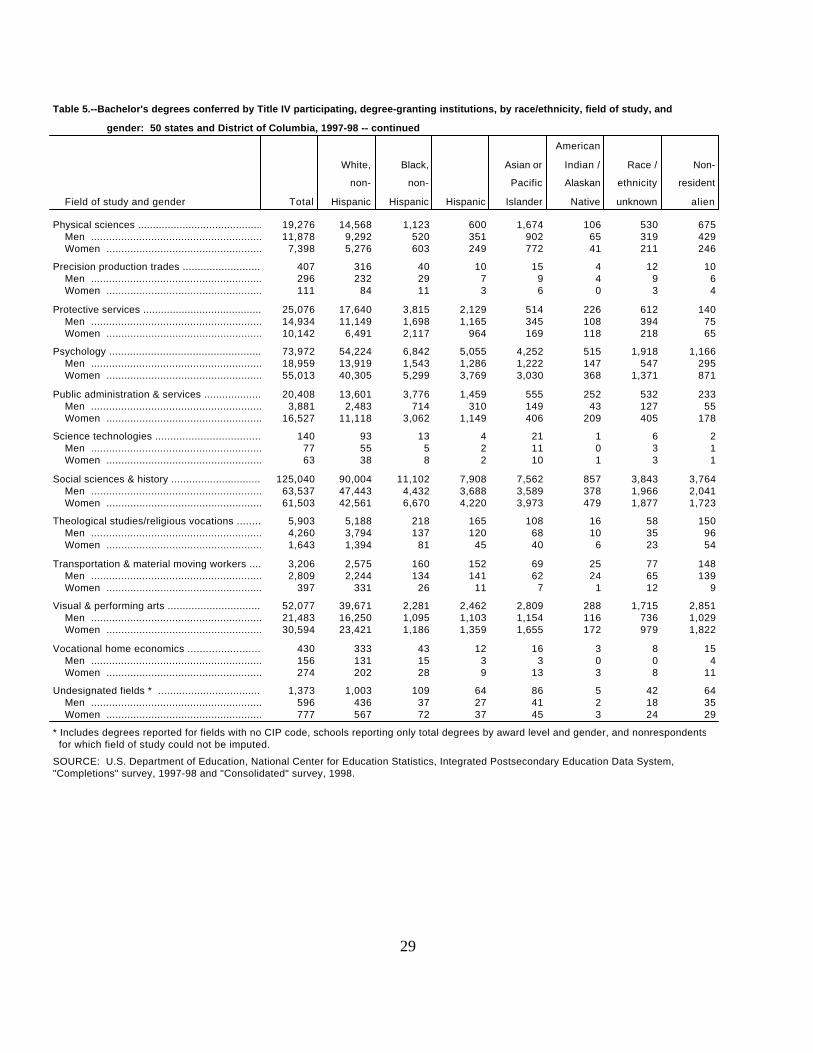
Table 5.--Bachelor's degrees conferred by Title IV participating, degree-granting institutions, by race/ethnicity, field of study, and
gender: 50 states and District of Columbia, 1997-98 -- continued
American
White, Black, Asian or Indian / Race / Non-
non- non- Pacific Alaskan ethnicity resident
Field of study and gender Total Hispanic Hispanic Hispanic Islander Native unknown alien
Physical sciences ....................................................19,276 14,568 1,123 600 1,674 106 530 675 Men .............................................................. 11,878 9,292 520 351 902 65 319 429 Women ........................................................... 7,398 5,276 603 249 772 41 211 246
Precision production trades .............................. 407 316 40 10 15 4 12 10 Men .............................................................. 296 232 29 7 9 4 9 6 Women ........................................................... 111 84 11 3 6 0 3 4
Protective services ......................................... 25,076 17,640 3,815 2,129 514 226 612 140 Men .............................................................. 14,934 11,149 1,698 1,165 345 108 394 75 Women ...........................................................10,142 6,491 2,117 964 169 118 218 65
Psychology ..................................................... 73,972 54,224 6,842 5,055 4,252 515 1,918 1,166 Men .............................................................. 18,959 13,919 1,543 1,286 1,222 147 547 295 Women ...........................................................55,013 40,305 5,299 3,769 3,030 368 1,371 871
Public administration & services .................................20,408 13,601 3,776 1,459 555 252 532 233 Men .............................................................. 3,881 2,483 714 310 149 43 127 55 Women ...........................................................16,527 11,118 3,062 1,149 406 209 405 178
Science technologies ............................................ 140 93 13 4 21 1 6 2 Men .............................................................. 77 55 5 2 11 0 3 1 Women ........................................................... 63 38 8 2 10 1 3 1
Social sciences & history ...................................125,040 90,004 11,102 7,908 7,562 857 3,843 3,764 Men .............................................................. 63,537 47,443 4,432 3,688 3,589 378 1,966 2,041 Women ...........................................................61,503 42,561 6,670 4,220 3,973 479 1,877 1,723
Theological studies/religious vocations ............ 5,903 5,188 218 165 108 16 58 150 Men .............................................................. 4,260 3,794 137 120 68 10 35 96 Women ........................................................... 1,643 1,394 81 45 40 6 23 54
Transportation & material moving workers ................3,206 2,575 160 152 69 25 77 148 Men .............................................................. 2,809 2,244 134 141 62 24 65 139 Women ........................................................... 397 331 26 11 7 1 12 9
Visual & performing arts ................................ 52,077 39,671 2,281 2,462 2,809 288 1,715 2,851 Men .............................................................. 21,483 16,250 1,095 1,103 1,154 116 736 1,029 Women ...........................................................30,594 23,421 1,186 1,359 1,655 172 979 1,822
Vocational home economics ................................... 430 333 43 12 16 3 8 15 Men .............................................................. 156 131 15 3 3 0 0 4 Women ........................................................... 274 202 28 9 13 3 8 11
Undesignated fields * ...............................................1,373 1,003 109 64 86 5 42 64 Men .............................................................. 596 436 37 27 41 2 18 35 Women ........................................................... 777 567 72 37 45 3 24 29
* Includes degrees reported for fields with no CIP code, schools reporting only total degrees by award level and gender, and nonrespondents for which field of study could not be imputed.
SOURCE: U.S. Department of Education, National Center for Education Statistics, Integrated Postsecondary Education Data System,"Completions" survey, 1997-98 and "Consolidated" survey, 1998.
29
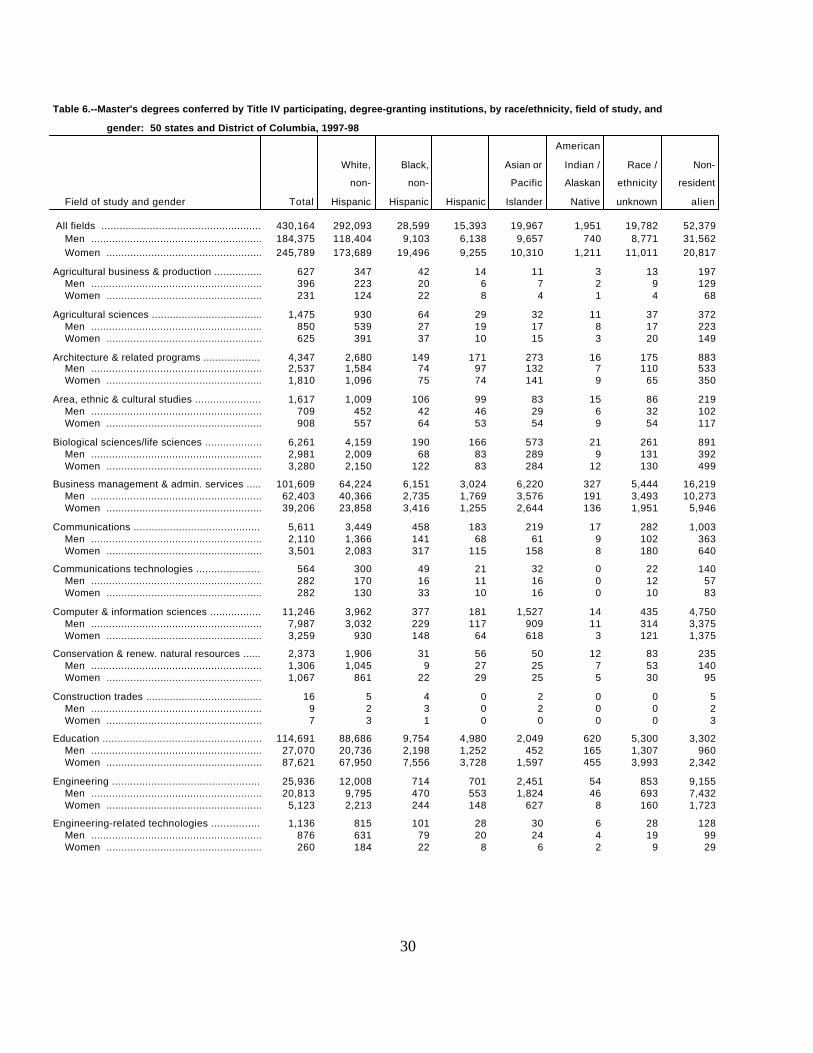
Table 6.--Master's degrees conferred by Title IV participating, degree-granting institutions, by race/ethnicity, field of study, and
gender: 50 states and District of Columbia, 1997-98
American
White, Black, Asian or Indian / Race / Non-
non- non- Pacific Alaskan ethnicity resident
Field of study and gender Total Hispanic Hispanic Hispanic Islander Native unknown alien
All fields ........................................................ 430,164 292,093 28,599 15,393 19,967 1,951 19,782 52,379 Men ..............................................................184,375 118,404 9,103 6,138 9,657 740 8,771 31,562 Women ...........................................................245,789 173,689 19,496 9,255 10,310 1,211 11,011 20,817
Agricultural business & production ................. 627 347 42 14 11 3 13 197 Men .............................................................. 396 223 20 6 7 2 9 129 Women ........................................................... 231 124 22 8 4 1 4 68
Agricultural sciences ......................................... 1,475 930 64 29 32 11 37 372 Men .............................................................. 850 539 27 19 17 8 17 223 Women ........................................................... 625 391 37 10 15 3 20 149
Architecture & related programs ....................... 4,347 2,680 149 171 273 16 175 883 Men .............................................................. 2,537 1,584 74 97 132 7 110 533 Women ........................................................... 1,810 1,096 75 74 141 9 65 350
Area, ethnic & cultural studies ......................... 1,617 1,009 106 99 83 15 86 219 Men .............................................................. 709 452 42 46 29 6 32 102 Women ........................................................... 908 557 64 53 54 9 54 117
Biological sciences/life sciences .....................................6,261 4,159 190 166 573 21 261 891 Men .............................................................. 2,981 2,009 68 83 289 9 131 392 Women ........................................................... 3,280 2,150 122 83 284 12 130 499
Business management & admin. services ......... 101,609 64,224 6,151 3,024 6,220 327 5,444 16,219 Men .............................................................. 62,403 40,366 2,735 1,769 3,576 191 3,493 10,273 Women ...........................................................39,206 23,858 3,416 1,255 2,644 136 1,951 5,946
Communications .................................................. 5,611 3,449 458 183 219 17 282 1,003 Men .............................................................. 2,110 1,366 141 68 61 9 102 363 Women ........................................................... 3,501 2,083 317 115 158 8 180 640
Communications technologies .............................. 564 300 49 21 32 0 22 140 Men .............................................................. 282 170 16 11 16 0 12 57 Women ........................................................... 282 130 33 10 16 0 10 83
Computer & information sciences ........................11,246 3,962 377 181 1,527 14 435 4,750 Men .............................................................. 7,987 3,032 229 117 909 11 314 3,375 Women ........................................................... 3,259 930 148 64 618 3 121 1,375
Conservation & renew. natural resources .......... 2,373 1,906 31 56 50 12 83 235 Men .............................................................. 1,306 1,045 9 27 25 7 53 140 Women ........................................................... 1,067 861 22 29 25 5 30 95
Construction trades ............................................ 16 5 4 0 2 0 0 5 Men .............................................................. 9 2 3 0 2 0 0 2 Women ........................................................... 7 3 1 0 0 0 0 3
Education .............................................................114,691 88,686 9,754 4,980 2,049 620 5,300 3,302 Men .............................................................. 27,070 20,736 2,198 1,252 452 165 1,307 960 Women ...........................................................87,621 67,950 7,556 3,728 1,597 455 3,993 2,342
Engineering ..................................................... 25,936 12,008 714 701 2,451 54 853 9,155 Men .............................................................. 20,813 9,795 470 553 1,824 46 693 7,432 Women ........................................................... 5,123 2,213 244 148 627 8 160 1,723
Engineering-related technologies ................. 1,136 815 101 28 30 6 28 128 Men .............................................................. 876 631 79 20 24 4 19 99 Women ........................................................... 260 184 22 8 6 2 9 29
30
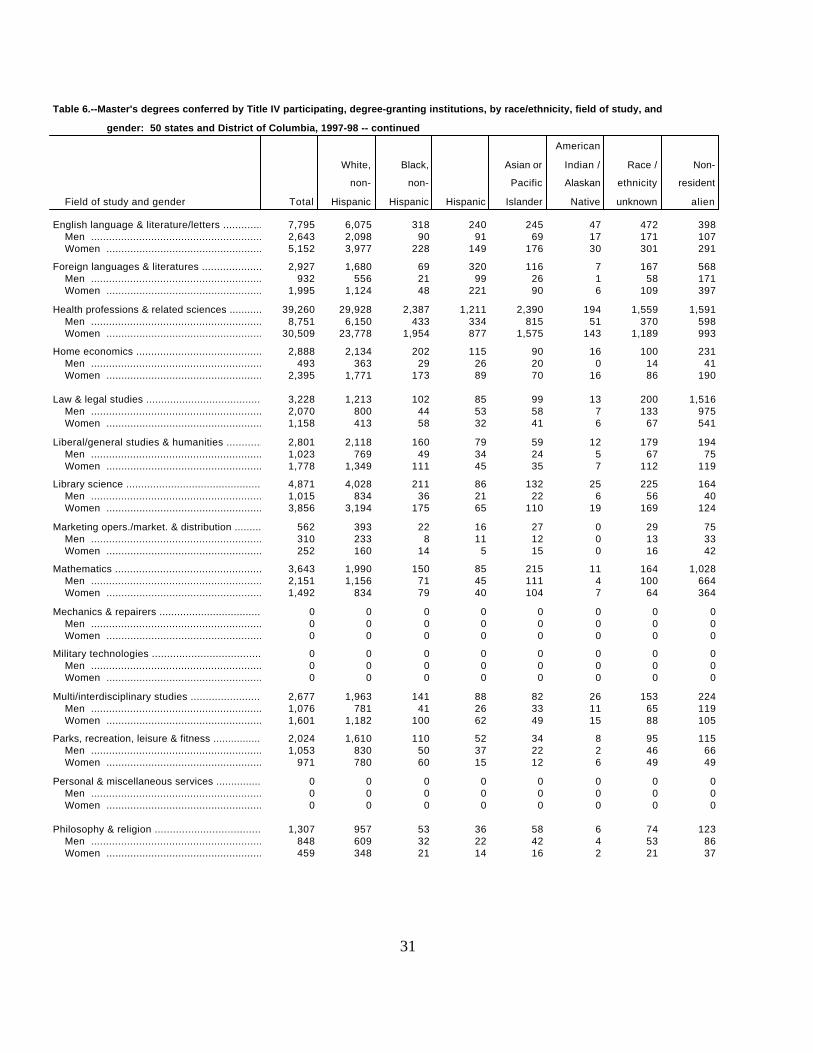
Table 6.--Master's degrees conferred by Title IV participating, degree-granting institutions, by race/ethnicity, field of study, and
gender: 50 states and District of Columbia, 1997-98 -- continued
American
White, Black, Asian or Indian / Race / Non-
non- non- Pacific Alaskan ethnicity resident
Field of study and gender Total Hispanic Hispanic Hispanic Islander Native unknown alien
English language & literature/letters .............................7,795 6,075 318 240 245 47 472 398 Men .............................................................. 2,643 2,098 90 91 69 17 171 107 Women ........................................................... 5,152 3,977 228 149 176 30 301 291
Foreign languages & literatures ..............................2,927 1,680 69 320 116 7 167 568 Men .............................................................. 932 556 21 99 26 1 58 171 Women ........................................................... 1,995 1,124 48 221 90 6 109 397
Health professions & related sciences .............................39,260 29,928 2,387 1,211 2,390 194 1,559 1,591 Men .............................................................. 8,751 6,150 433 334 815 51 370 598 Women ...........................................................30,509 23,778 1,954 877 1,575 143 1,189 993
Home economics .................................................. 2,888 2,134 202 115 90 16 100 231 Men .............................................................. 493 363 29 26 20 0 14 41 Women ........................................................... 2,395 1,771 173 89 70 16 86 190
Law & legal studies ......................................... 3,228 1,213 102 85 99 13 200 1,516 Men .............................................................. 2,070 800 44 53 58 7 133 975 Women ........................................................... 1,158 413 58 32 41 6 67 541
Liberal/general studies & humanities ................... 2,801 2,118 160 79 59 12 179 194 Men .............................................................. 1,023 769 49 34 24 5 67 75 Women ........................................................... 1,778 1,349 111 45 35 7 112 119
Library science .........................................................4,871 4,028 211 86 132 25 225 164 Men .............................................................. 1,015 834 36 21 22 6 56 40 Women ........................................................... 3,856 3,194 175 65 110 19 169 124
Marketing opers./market. & distribution ............ 562 393 22 16 27 0 29 75 Men .............................................................. 310 233 8 11 12 0 13 33 Women ........................................................... 252 160 14 5 15 0 16 42
Mathematics ....................................................................3,643 1,990 150 85 215 11 164 1,028 Men .............................................................. 2,151 1,156 71 45 111 4 100 664 Women ........................................................... 1,492 834 79 40 104 7 64 364
Mechanics & repairers ................................... 0 0 0 0 0 0 0 0 Men .............................................................. 0 0 0 0 0 0 0 0 Women ........................................................... 0 0 0 0 0 0 0 0
Military technologies ....................................... 0 0 0 0 0 0 0 0 Men .............................................................. 0 0 0 0 0 0 0 0 Women ........................................................... 0 0 0 0 0 0 0 0
Multi/interdisciplinary studies ............................... 2,677 1,963 141 88 82 26 153 224 Men .............................................................. 1,076 781 41 26 33 11 65 119 Women ........................................................... 1,601 1,182 100 62 49 15 88 105
Parks, recreation, leisure & fitness ...............................2,024 1,610 110 52 34 8 95 115 Men .............................................................. 1,053 830 50 37 22 2 46 66 Women ........................................................... 971 780 60 15 12 6 49 49
Personal & miscellaneous services ....................... 0 0 0 0 0 0 0 0 Men .............................................................. 0 0 0 0 0 0 0 0 Women ........................................................... 0 0 0 0 0 0 0 0
Philosophy & religion .......................................... 1,307 957 53 36 58 6 74 123 Men .............................................................. 848 609 32 22 42 4 53 86 Women ........................................................... 459 348 21 14 16 2 21 37
31
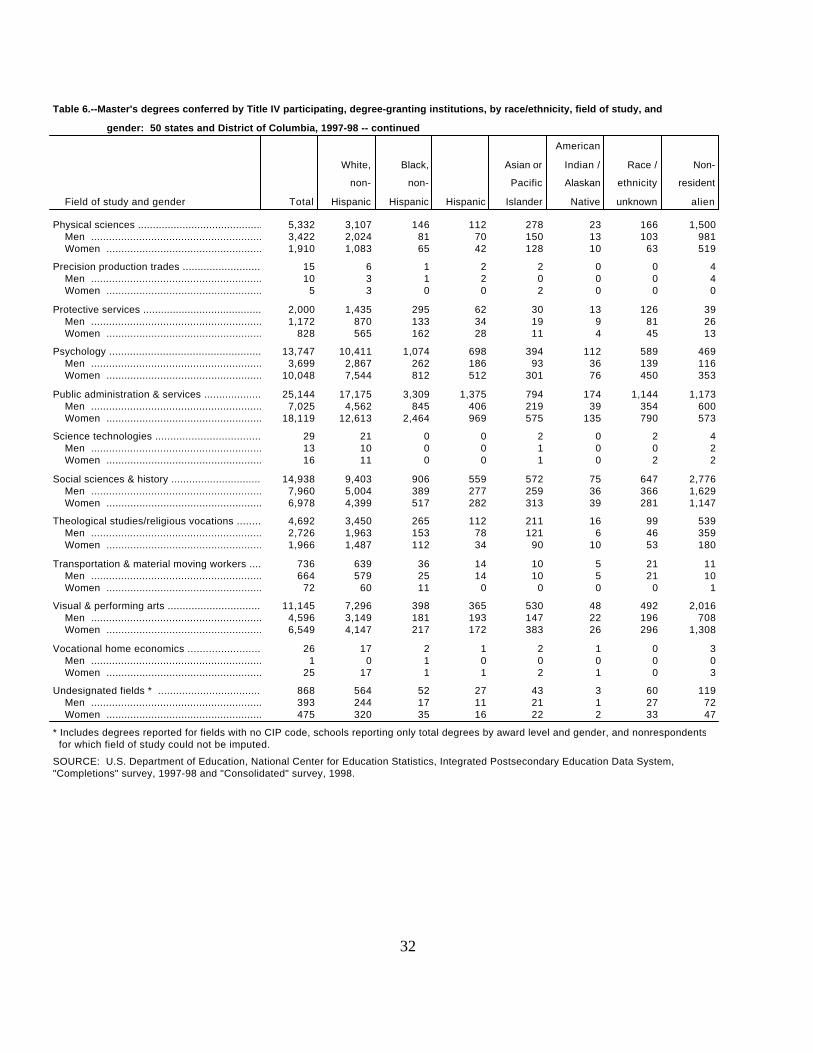
Table 6.--Master's degrees conferred by Title IV participating, degree-granting institutions, by race/ethnicity, field of study, and
gender: 50 states and District of Columbia, 1997-98 -- continued
American
White, Black, Asian or Indian / Race / Non-
non- non- Pacific Alaskan ethnicity resident
Field of study and gender Total Hispanic Hispanic Hispanic Islander Native unknown alien
Physical sciences ....................................................5,332 3,107 146 112 278 23 166 1,500 Men .............................................................. 3,422 2,024 81 70 150 13 103 981 Women ........................................................... 1,910 1,083 65 42 128 10 63 519
Precision production trades .............................. 15 6 1 2 2 0 0 4 Men .............................................................. 10 3 1 2 0 0 0 4 Women ........................................................... 5 3 0 0 2 0 0 0
Protective services ......................................... 2,000 1,435 295 62 30 13 126 39 Men .............................................................. 1,172 870 133 34 19 9 81 26 Women ........................................................... 828 565 162 28 11 4 45 13
Psychology ..................................................... 13,747 10,411 1,074 698 394 112 589 469 Men .............................................................. 3,699 2,867 262 186 93 36 139 116 Women ...........................................................10,048 7,544 812 512 301 76 450 353
Public administration & services .................................25,144 17,175 3,309 1,375 794 174 1,144 1,173 Men .............................................................. 7,025 4,562 845 406 219 39 354 600 Women ...........................................................18,119 12,613 2,464 969 575 135 790 573
Science technologies ............................................ 29 21 0 0 2 0 2 4 Men .............................................................. 13 10 0 0 1 0 0 2 Women ........................................................... 16 11 0 0 1 0 2 2
Social sciences & history ................................... 14,938 9,403 906 559 572 75 647 2,776 Men .............................................................. 7,960 5,004 389 277 259 36 366 1,629 Women ........................................................... 6,978 4,399 517 282 313 39 281 1,147
Theological studies/religious vocations ............ 4,692 3,450 265 112 211 16 99 539 Men .............................................................. 2,726 1,963 153 78 121 6 46 359 Women ........................................................... 1,966 1,487 112 34 90 10 53 180
Transportation & material moving workers ................736 639 36 14 10 5 21 11 Men .............................................................. 664 579 25 14 10 5 21 10 Women ........................................................... 72 60 11 0 0 0 0 1
Visual & performing arts ................................ 11,145 7,296 398 365 530 48 492 2,016 Men .............................................................. 4,596 3,149 181 193 147 22 196 708 Women ........................................................... 6,549 4,147 217 172 383 26 296 1,308
Vocational home economics ................................... 26 17 2 1 2 1 0 3 Men .............................................................. 1 0 1 0 0 0 0 0 Women ........................................................... 25 17 1 1 2 1 0 3
Undesignated fields * ...............................................868 564 52 27 43 3 60 119 Men .............................................................. 393 244 17 11 21 1 27 72 Women ........................................................... 475 320 35 16 22 2 33 47
* Includes degrees reported for fields with no CIP code, schools reporting only total degrees by award level and gender, and nonrespondents for which field of study could not be imputed.
SOURCE: U.S. Department of Education, National Center for Education Statistics, Integrated Postsecondary Education Data System,"Completions" survey, 1997-98 and "Consolidated" survey, 1998.
32
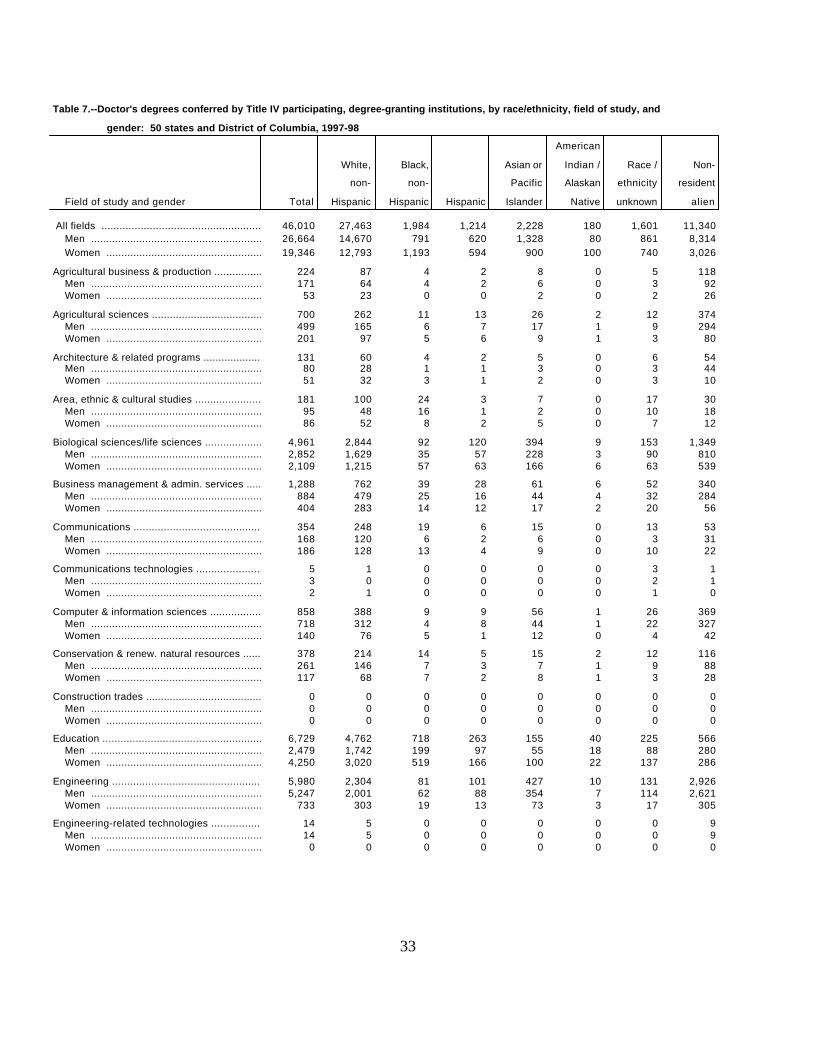
Table 7.--Doctor's degrees conferred by Title IV participating, degree-granting institutions, by race/ethnicity, field of study, and
gender: 50 states and District of Columbia, 1997-98
American
White, Black, Asian or Indian / Race / Non-
non- non- Pacific Alaskan ethnicity resident
Field of study and gender Total Hispanic Hispanic Hispanic Islander Native unknown alien
All fields ........................................................ 46,010 27,463 1,984 1,214 2,228 180 1,601 11,340 Men .............................................................. 26,664 14,670 791 620 1,328 80 861 8,314 Women ...........................................................19,346 12,793 1,193 594 900 100 740 3,026
Agricultural business & production ................. 224 87 4 2 8 0 5 118 Men .............................................................. 171 64 4 2 6 0 3 92 Women ........................................................... 53 23 0 0 2 0 2 26
Agricultural sciences ......................................... 700 262 11 13 26 2 12 374 Men .............................................................. 499 165 6 7 17 1 9 294 Women ........................................................... 201 97 5 6 9 1 3 80
Architecture & related programs ....................... 131 60 4 2 5 0 6 54 Men .............................................................. 80 28 1 1 3 0 3 44 Women ........................................................... 51 32 3 1 2 0 3 10
Area, ethnic & cultural studies ......................... 181 100 24 3 7 0 17 30 Men .............................................................. 95 48 16 1 2 0 10 18 Women ........................................................... 86 52 8 2 5 0 7 12
Biological sciences/life sciences .....................................4,961 2,844 92 120 394 9 153 1,349 Men .............................................................. 2,852 1,629 35 57 228 3 90 810 Women ........................................................... 2,109 1,215 57 63 166 6 63 539
Business management & admin. services ......... 1,288 762 39 28 61 6 52 340 Men .............................................................. 884 479 25 16 44 4 32 284 Women ........................................................... 404 283 14 12 17 2 20 56
Communications .................................................. 354 248 19 6 15 0 13 53 Men .............................................................. 168 120 6 2 6 0 3 31 Women ........................................................... 186 128 13 4 9 0 10 22
Communications technologies .............................. 5 1 0 0 0 0 3 1 Men .............................................................. 3 0 0 0 0 0 2 1 Women ........................................................... 2 1 0 0 0 0 1 0
Computer & information sciences ........................ 858 388 9 9 56 1 26 369 Men .............................................................. 718 312 4 8 44 1 22 327 Women ........................................................... 140 76 5 1 12 0 4 42
Conservation & renew. natural resources .......... 378 214 14 5 15 2 12 116 Men .............................................................. 261 146 7 3 7 1 9 88 Women ........................................................... 117 68 7 2 8 1 3 28
Construction trades ............................................ 0 0 0 0 0 0 0 0 Men .............................................................. 0 0 0 0 0 0 0 0 Women ........................................................... 0 0 0 0 0 0 0 0
Education ............................................................. 6,729 4,762 718 263 155 40 225 566 Men .............................................................. 2,479 1,742 199 97 55 18 88 280 Women ........................................................... 4,250 3,020 519 166 100 22 137 286
Engineering ..................................................... 5,980 2,304 81 101 427 10 131 2,926 Men .............................................................. 5,247 2,001 62 88 354 7 114 2,621 Women ........................................................... 733 303 19 13 73 3 17 305
Engineering-related technologies ................. 14 5 0 0 0 0 0 9 Men .............................................................. 14 5 0 0 0 0 0 9 Women ........................................................... 0 0 0 0 0 0 0 0
33
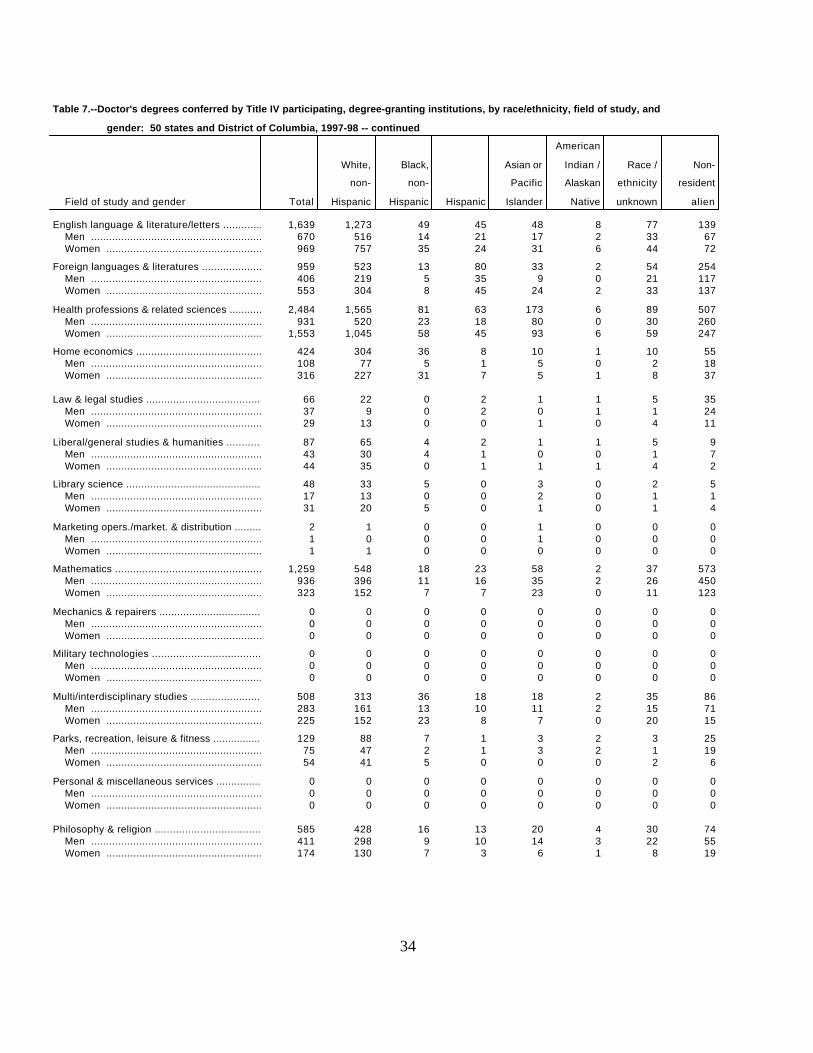
Table 7.--Doctor's degrees conferred by Title IV participating, degree-granting institutions, by race/ethnicity, field of study, and
gender: 50 states and District of Columbia, 1997-98 -- continued
American
White, Black, Asian or Indian / Race / Non-
non- non- Pacific Alaskan ethnicity resident
Field of study and gender Total Hispanic Hispanic Hispanic Islander Native unknown alien
English language & literature/letters .............................1,639 1,273 49 45 48 8 77 139 Men .............................................................. 670 516 14 21 17 2 33 67 Women ........................................................... 969 757 35 24 31 6 44 72
Foreign languages & literatures .............................. 959 523 13 80 33 2 54 254 Men .............................................................. 406 219 5 35 9 0 21 117 Women ........................................................... 553 304 8 45 24 2 33 137
Health professions & related sciences .............................2,484 1,565 81 63 173 6 89 507 Men .............................................................. 931 520 23 18 80 0 30 260 Women ........................................................... 1,553 1,045 58 45 93 6 59 247
Home economics .................................................. 424 304 36 8 10 1 10 55 Men .............................................................. 108 77 5 1 5 0 2 18 Women ........................................................... 316 227 31 7 5 1 8 37
Law & legal studies ......................................... 66 22 0 2 1 1 5 35 Men .............................................................. 37 9 0 2 0 1 1 24 Women ........................................................... 29 13 0 0 1 0 4 11
Liberal/general studies & humanities ................... 87 65 4 2 1 1 5 9 Men .............................................................. 43 30 4 1 0 0 1 7 Women ........................................................... 44 35 0 1 1 1 4 2
Library science ......................................................... 48 33 5 0 3 0 2 5 Men .............................................................. 17 13 0 0 2 0 1 1 Women ........................................................... 31 20 5 0 1 0 1 4
Marketing opers./market. & distribution ............ 2 1 0 0 1 0 0 0 Men .............................................................. 1 0 0 0 1 0 0 0 Women ........................................................... 1 1 0 0 0 0 0 0
Mathematics ....................................................................1,259 548 18 23 58 2 37 573 Men .............................................................. 936 396 11 16 35 2 26 450 Women ........................................................... 323 152 7 7 23 0 11 123
Mechanics & repairers ................................... 0 0 0 0 0 0 0 0 Men .............................................................. 0 0 0 0 0 0 0 0 Women ........................................................... 0 0 0 0 0 0 0 0
Military technologies ....................................... 0 0 0 0 0 0 0 0 Men .............................................................. 0 0 0 0 0 0 0 0 Women ........................................................... 0 0 0 0 0 0 0 0
Multi/interdisciplinary studies ............................... 508 313 36 18 18 2 35 86 Men .............................................................. 283 161 13 10 11 2 15 71 Women ........................................................... 225 152 23 8 7 0 20 15
Parks, recreation, leisure & fitness ...............................129 88 7 1 3 2 3 25 Men .............................................................. 75 47 2 1 3 2 1 19 Women ........................................................... 54 41 5 0 0 0 2 6
Personal & miscellaneous services ....................... 0 0 0 0 0 0 0 0 Men .............................................................. 0 0 0 0 0 0 0 0 Women ........................................................... 0 0 0 0 0 0 0 0
Philosophy & religion .......................................... 585 428 16 13 20 4 30 74 Men .............................................................. 411 298 9 10 14 3 22 55 Women ........................................................... 174 130 7 3 6 1 8 19
34
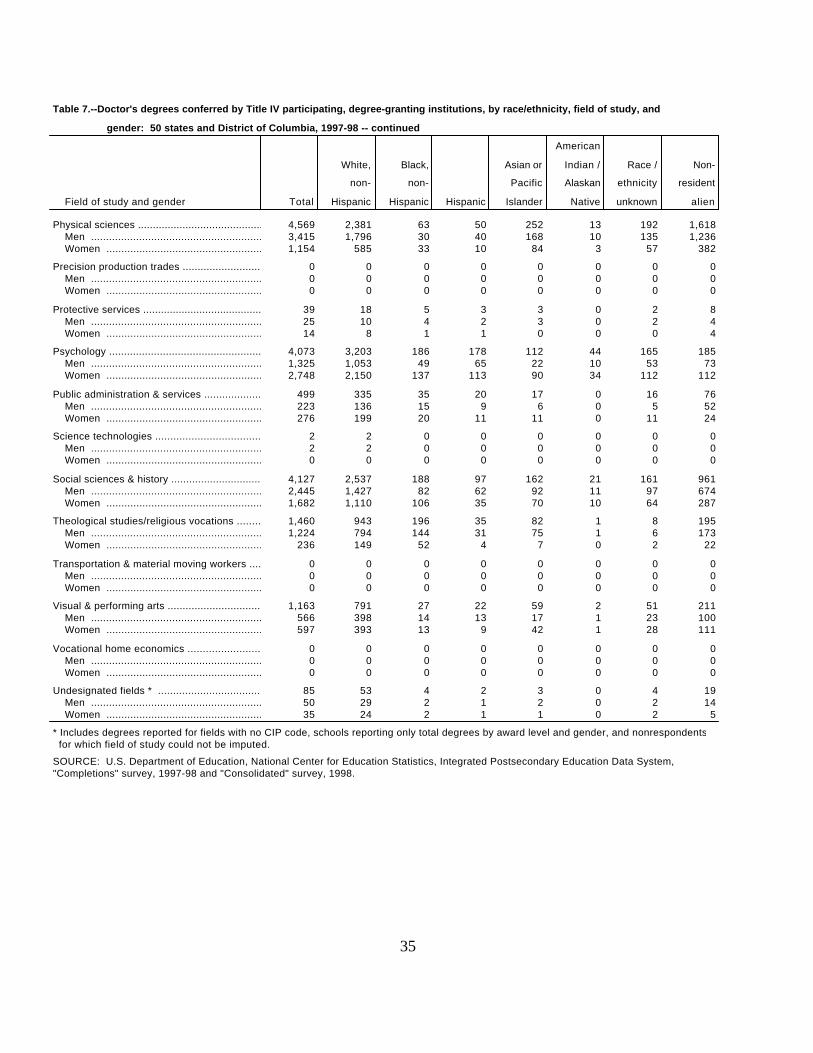
Table 7.--Doctor's degrees conferred by Title IV participating, degree-granting institutions, by race/ethnicity, field of study, and
gender: 50 states and District of Columbia, 1997-98 -- continued
American
White, Black, Asian or Indian / Race / Non-
non- non- Pacific Alaskan ethnicity resident
Field of study and gender Total Hispanic Hispanic Hispanic Islander Native unknown alien
Physical sciences ....................................................4,569 2,381 63 50 252 13 192 1,618 Men .............................................................. 3,415 1,796 30 40 168 10 135 1,236 Women ........................................................... 1,154 585 33 10 84 3 57 382
Precision production trades .............................. 0 0 0 0 0 0 0 0 Men .............................................................. 0 0 0 0 0 0 0 0 Women ........................................................... 0 0 0 0 0 0 0 0
Protective services ......................................... 39 18 5 3 3 0 2 8 Men .............................................................. 25 10 4 2 3 0 2 4 Women ........................................................... 14 8 1 1 0 0 0 4
Psychology ..................................................... 4,073 3,203 186 178 112 44 165 185 Men .............................................................. 1,325 1,053 49 65 22 10 53 73 Women ........................................................... 2,748 2,150 137 113 90 34 112 112
Public administration & services .................................499 335 35 20 17 0 16 76 Men .............................................................. 223 136 15 9 6 0 5 52 Women ........................................................... 276 199 20 11 11 0 11 24
Science technologies ............................................ 2 2 0 0 0 0 0 0 Men .............................................................. 2 2 0 0 0 0 0 0 Women ........................................................... 0 0 0 0 0 0 0 0
Social sciences & history ................................... 4,127 2,537 188 97 162 21 161 961 Men .............................................................. 2,445 1,427 82 62 92 11 97 674 Women ........................................................... 1,682 1,110 106 35 70 10 64 287
Theological studies/religious vocations ............ 1,460 943 196 35 82 1 8 195 Men .............................................................. 1,224 794 144 31 75 1 6 173 Women ........................................................... 236 149 52 4 7 0 2 22
Transportation & material moving workers ................ 0 0 0 0 0 0 0 0 Men .............................................................. 0 0 0 0 0 0 0 0 Women ........................................................... 0 0 0 0 0 0 0 0
Visual & performing arts ................................ 1,163 791 27 22 59 2 51 211 Men .............................................................. 566 398 14 13 17 1 23 100 Women ........................................................... 597 393 13 9 42 1 28 111
Vocational home economics ................................... 0 0 0 0 0 0 0 0 Men .............................................................. 0 0 0 0 0 0 0 0 Women ........................................................... 0 0 0 0 0 0 0 0
Undesignated fields * ............................................... 85 53 4 2 3 0 4 19 Men .............................................................. 50 29 2 1 2 0 2 14 Women ........................................................... 35 24 2 1 1 0 2 5
* Includes degrees reported for fields with no CIP code, schools reporting only total degrees by award level and gender, and nonrespondents for which field of study could not be imputed.
SOURCE: U.S. Department of Education, National Center for Education Statistics, Integrated Postsecondary Education Data System,"Completions" survey, 1997-98 and "Consolidated" survey, 1998.
35
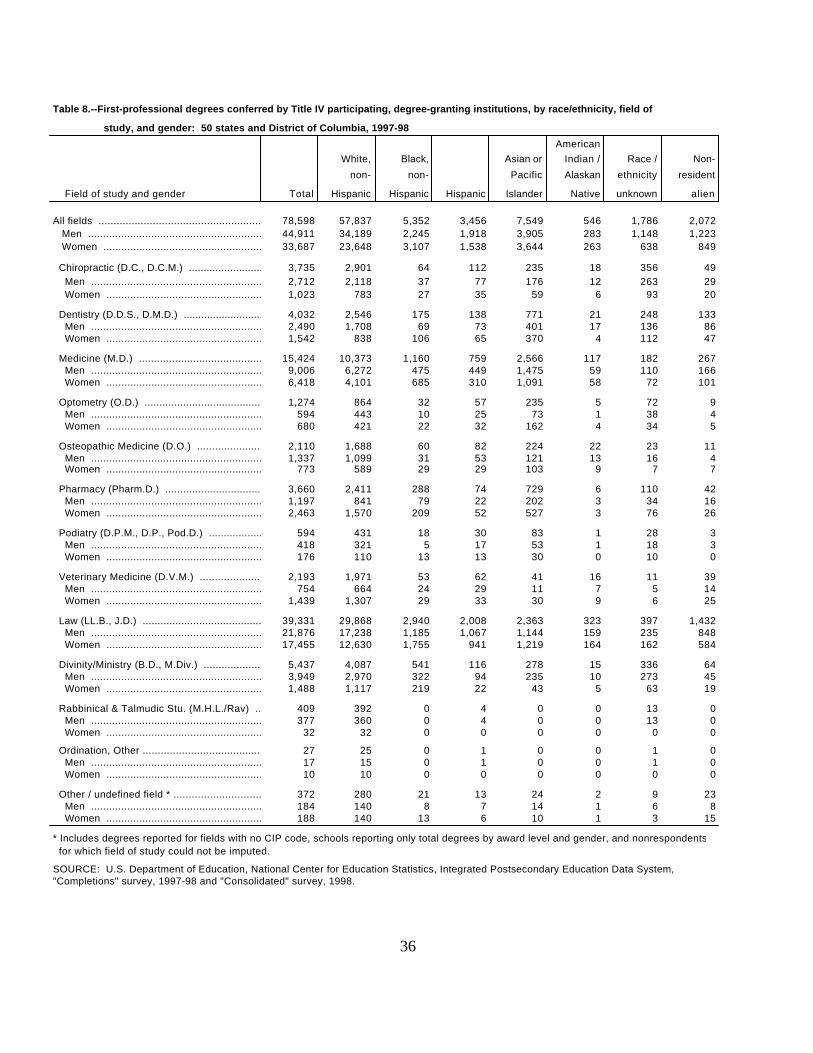
Table 8.--First-professional degrees conferred by Title IV participating, degree-granting institutions, by race/ethnicity, field of
study, and gender: 50 states and District of Columbia, 1997-98
American White, Black, Asian or Indian / Race / Non-
non- non- Pacific Alaskan ethnicity resident
Field of study and gender Total Hispanic Hispanic Hispanic Islander Native unknown alien
All fields ........................................................ 78,598 57,837 5,352 3,456 7,549 546 1,786 2,072 Men .............................................................. 44,911 34,189 2,245 1,918 3,905 283 1,148 1,223 Women ........................................................... 33,687 23,648 3,107 1,538 3,644 263 638 849
Chiropractic (D.C., D.C.M.) ............................. 3,735 2,901 64 112 235 18 356 49 Men .............................................................. 2,712 2,118 37 77 176 12 263 29 Women ........................................................... 1,023 783 27 35 59 6 93 20
Dentistry (D.D.S., D.M.D.) ............................... 4,032 2,546 175 138 771 21 248 133 Men .............................................................. 2,490 1,708 69 73 401 17 136 86 Women ........................................................... 1,542 838 106 65 370 4 112 47
Medicine (M.D.) ........................................... 15,424 10,373 1,160 759 2,566 117 182 267 Men .............................................................. 9,006 6,272 475 449 1,475 59 110 166 Women ........................................................... 6,418 4,101 685 310 1,091 58 72 101
Optometry (O.D.) .......................................... 1,274 864 32 57 235 5 72 9 Men .............................................................. 594 443 10 25 73 1 38 4 Women ........................................................... 680 421 22 32 162 4 34 5
Osteopathic Medicine (D.O.) ..........................................2,110 1,688 60 82 224 22 23 11 Men .............................................................. 1,337 1,099 31 53 121 13 16 4 Women ........................................................... 773 589 29 29 103 9 7 7
Pharmacy (Pharm.D.) ..........................................3,660 2,411 288 74 729 6 110 42 Men .............................................................. 1,197 841 79 22 202 3 34 16 Women ........................................................... 2,463 1,570 209 52 527 3 76 26
Podiatry (D.P.M., D.P., Pod.D.) .................... 594 431 18 30 83 1 28 3 Men .............................................................. 418 321 5 17 53 1 18 3 Women ........................................................... 176 110 13 13 30 0 10 0
Veterinary Medicine (D.V.M.) .................................2,193 1,971 53 62 41 16 11 39 Men .............................................................. 754 664 24 29 11 7 5 14 Women ........................................................... 1,439 1,307 29 33 30 9 6 25
Law (LL.B., J.D.) .....................................................39,331 29,868 2,940 2,008 2,363 323 397 1,432 Men .............................................................. 21,876 17,238 1,185 1,067 1,144 159 235 848 Women ...........................................................17,455 12,630 1,755 941 1,219 164 162 584
Divinity/Ministry (B.D., M.Div.) .......................... 5,437 4,087 541 116 278 15 336 64 Men .............................................................. 3,949 2,970 322 94 235 10 273 45 Women ........................................................... 1,488 1,117 219 22 43 5 63 19
Rabbinical & Talmudic Stu. (M.H.L./Rav) ..............409 392 0 4 0 0 13 0 Men .............................................................. 377 360 0 4 0 0 13 0 Women ........................................................... 32 32 0 0 0 0 0 0
Ordination, Other ......................................... 27 25 0 1 0 0 1 0 Men .............................................................. 17 15 0 1 0 0 1 0 Women ........................................................... 10 10 0 0 0 0 0 0
Other / undefined field * ...................................... 372 280 21 13 24 2 9 23 Men .............................................................. 184 140 8 7 14 1 6 8 Women ........................................................... 188 140 13 6 10 1 3 15
* Includes degrees reported for fields with no CIP code, schools reporting only total degrees by award level and gender, and nonrespondents for which field of study could not be imputed.
SOURCE: U.S. Department of Education, National Center for Education Statistics, Integrated Postsecondary Education Data System, "Completions" survey, 1997-98 and "Consolidated" survey, 1998.
36
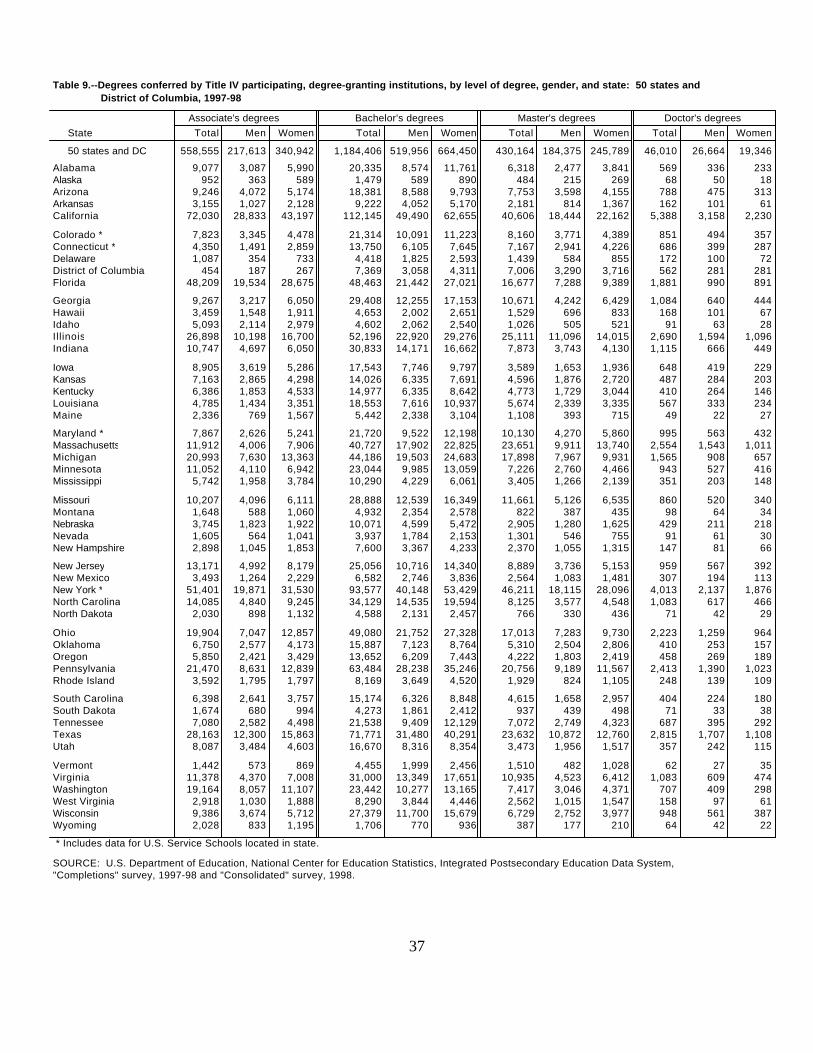
Table 9.--Degrees conferred by Title IV participating, degree-granting institutions, by level of degree, gender, and state: 50 states and District of Columbia, 1997-98
Associate's degrees Bachelor's degrees Master's degrees Doctor's degrees State Total Men Women Total Men Women Total Men Women Total Men Women
50 states and DC 558,555 217,613 340,942 1,184,406 519,956 664,450 430,164 184,375 245,789 46,010 26,664 19,346
Alabama 9,077 3,087 5,990 20,335 8,574 11,761 6,318 2,477 3,841 569 336 233Alaska 952 363 589 1,479 589 890 484 215 269 68 50 18Arizona 9,246 4,072 5,174 18,381 8,588 9,793 7,753 3,598 4,155 788 475 313Arkansas 3,155 1,027 2,128 9,222 4,052 5,170 2,181 814 1,367 162 101 61California 72,030 28,833 43,197 112,145 49,490 62,655 40,606 18,444 22,162 5,388 3,158 2,230
Colorado * 7,823 3,345 4,478 21,314 10,091 11,223 8,160 3,771 4,389 851 494 357Connecticut * 4,350 1,491 2,859 13,750 6,105 7,645 7,167 2,941 4,226 686 399 287Delaware 1,087 354 733 4,418 1,825 2,593 1,439 584 855 172 100 72District of Columbia 454 187 267 7,369 3,058 4,311 7,006 3,290 3,716 562 281 281Florida 48,209 19,534 28,675 48,463 21,442 27,021 16,677 7,288 9,389 1,881 990 891
Georgia 9,267 3,217 6,050 29,408 12,255 17,153 10,671 4,242 6,429 1,084 640 444Hawaii 3,459 1,548 1,911 4,653 2,002 2,651 1,529 696 833 168 101 67Idaho 5,093 2,114 2,979 4,602 2,062 2,540 1,026 505 521 91 63 28Illinois 26,898 10,198 16,700 52,196 22,920 29,276 25,111 11,096 14,015 2,690 1,594 1,096Indiana 10,747 4,697 6,050 30,833 14,171 16,662 7,873 3,743 4,130 1,115 666 449
Iowa 8,905 3,619 5,286 17,543 7,746 9,797 3,589 1,653 1,936 648 419 229Kansas 7,163 2,865 4,298 14,026 6,335 7,691 4,596 1,876 2,720 487 284 203Kentucky 6,386 1,853 4,533 14,977 6,335 8,642 4,773 1,729 3,044 410 264 146Louisiana 4,785 1,434 3,351 18,553 7,616 10,937 5,674 2,339 3,335 567 333 234Maine 2,336 769 1,567 5,442 2,338 3,104 1,108 393 715 49 22 27
Maryland * 7,867 2,626 5,241 21,720 9,522 12,198 10,130 4,270 5,860 995 563 432Massachusetts 11,912 4,006 7,906 40,727 17,902 22,825 23,651 9,911 13,740 2,554 1,543 1,011Michigan 20,993 7,630 13,363 44,186 19,503 24,683 17,898 7,967 9,931 1,565 908 657Minnesota 11,052 4,110 6,942 23,044 9,985 13,059 7,226 2,760 4,466 943 527 416Mississippi 5,742 1,958 3,784 10,290 4,229 6,061 3,405 1,266 2,139 351 203 148
Missouri 10,207 4,096 6,111 28,888 12,539 16,349 11,661 5,126 6,535 860 520 340Montana 1,648 588 1,060 4,932 2,354 2,578 822 387 435 98 64 34Nebraska 3,745 1,823 1,922 10,071 4,599 5,472 2,905 1,280 1,625 429 211 218Nevada 1,605 564 1,041 3,937 1,784 2,153 1,301 546 755 91 61 30New Hampshire 2,898 1,045 1,853 7,600 3,367 4,233 2,370 1,055 1,315 147 81 66
New Jersey 13,171 4,992 8,179 25,056 10,716 14,340 8,889 3,736 5,153 959 567 392New Mexico 3,493 1,264 2,229 6,582 2,746 3,836 2,564 1,083 1,481 307 194 113New York * 51,401 19,871 31,530 93,577 40,148 53,429 46,211 18,115 28,096 4,013 2,137 1,876North Carolina 14,085 4,840 9,245 34,129 14,535 19,594 8,125 3,577 4,548 1,083 617 466North Dakota 2,030 898 1,132 4,588 2,131 2,457 766 330 436 71 42 29
Ohio 19,904 7,047 12,857 49,080 21,752 27,328 17,013 7,283 9,730 2,223 1,259 964Oklahoma 6,750 2,577 4,173 15,887 7,123 8,764 5,310 2,504 2,806 410 253 157Oregon 5,850 2,421 3,429 13,652 6,209 7,443 4,222 1,803 2,419 458 269 189Pennsylvania 21,470 8,631 12,839 63,484 28,238 35,246 20,756 9,189 11,567 2,413 1,390 1,023Rhode Island 3,592 1,795 1,797 8,169 3,649 4,520 1,929 824 1,105 248 139 109
South Carolina 6,398 2,641 3,757 15,174 6,326 8,848 4,615 1,658 2,957 404 224 180South Dakota 1,674 680 994 4,273 1,861 2,412 937 439 498 71 33 38Tennessee 7,080 2,582 4,498 21,538 9,409 12,129 7,072 2,749 4,323 687 395 292Texas 28,163 12,300 15,863 71,771 31,480 40,291 23,632 10,872 12,760 2,815 1,707 1,108Utah 8,087 3,484 4,603 16,670 8,316 8,354 3,473 1,956 1,517 357 242 115
Vermont 1,442 573 869 4,455 1,999 2,456 1,510 482 1,028 62 27 35Virginia 11,378 4,370 7,008 31,000 13,349 17,651 10,935 4,523 6,412 1,083 609 474Washington 19,164 8,057 11,107 23,442 10,277 13,165 7,417 3,046 4,371 707 409 298West Virginia 2,918 1,030 1,888 8,290 3,844 4,446 2,562 1,015 1,547 158 97 61Wisconsin 9,386 3,674 5,712 27,379 11,700 15,679 6,729 2,752 3,977 948 561 387Wyoming 2,028 833 1,195 1,706 770 936 387 177 210 64 42 22
* Includes data for U.S. Service Schools located in state.
SOURCE: U.S. Department of Education, National Center for Education Statistics, Integrated Postsecondary Education Data System,"Completions" survey, 1997-98 and "Consolidated" survey, 1998.
37
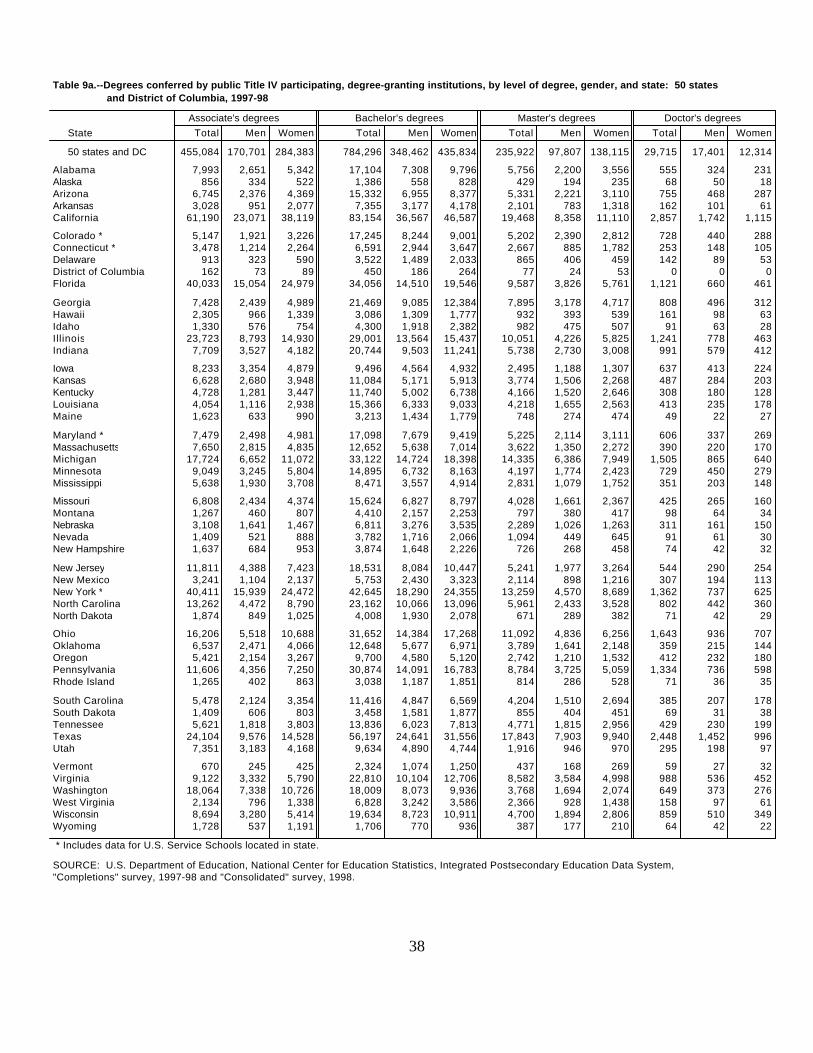
Table 9a.--Degrees conferred by public Title IV participating, degree-granting institutions, by level of degree, gender, and state: 50 states and District of Columbia, 1997-98
Associate's degrees Bachelor's degrees Master's degrees Doctor's degrees State Total Men Women Total Men Women Total Men Women Total Men Women
50 states and DC 455,084 170,701 284,383 784,296 348,462 435,834 235,922 97,807 138,115 29,715 17,401 12,314
Alabama 7,993 2,651 5,342 17,104 7,308 9,796 5,756 2,200 3,556 555 324 231Alaska 856 334 522 1,386 558 828 429 194 235 68 50 18Arizona 6,745 2,376 4,369 15,332 6,955 8,377 5,331 2,221 3,110 755 468 287Arkansas 3,028 951 2,077 7,355 3,177 4,178 2,101 783 1,318 162 101 61California 61,190 23,071 38,119 83,154 36,567 46,587 19,468 8,358 11,110 2,857 1,742 1,115
Colorado * 5,147 1,921 3,226 17,245 8,244 9,001 5,202 2,390 2,812 728 440 288Connecticut * 3,478 1,214 2,264 6,591 2,944 3,647 2,667 885 1,782 253 148 105Delaware 913 323 590 3,522 1,489 2,033 865 406 459 142 89 53District of Columbia 162 73 89 450 186 264 77 24 53 0 0 0Florida 40,033 15,054 24,979 34,056 14,510 19,546 9,587 3,826 5,761 1,121 660 461
Georgia 7,428 2,439 4,989 21,469 9,085 12,384 7,895 3,178 4,717 808 496 312Hawaii 2,305 966 1,339 3,086 1,309 1,777 932 393 539 161 98 63Idaho 1,330 576 754 4,300 1,918 2,382 982 475 507 91 63 28Illinois 23,723 8,793 14,930 29,001 13,564 15,437 10,051 4,226 5,825 1,241 778 463Indiana 7,709 3,527 4,182 20,744 9,503 11,241 5,738 2,730 3,008 991 579 412
Iowa 8,233 3,354 4,879 9,496 4,564 4,932 2,495 1,188 1,307 637 413 224Kansas 6,628 2,680 3,948 11,084 5,171 5,913 3,774 1,506 2,268 487 284 203Kentucky 4,728 1,281 3,447 11,740 5,002 6,738 4,166 1,520 2,646 308 180 128Louisiana 4,054 1,116 2,938 15,366 6,333 9,033 4,218 1,655 2,563 413 235 178Maine 1,623 633 990 3,213 1,434 1,779 748 274 474 49 22 27
Maryland * 7,479 2,498 4,981 17,098 7,679 9,419 5,225 2,114 3,111 606 337 269Massachusetts 7,650 2,815 4,835 12,652 5,638 7,014 3,622 1,350 2,272 390 220 170Michigan 17,724 6,652 11,072 33,122 14,724 18,398 14,335 6,386 7,949 1,505 865 640Minnesota 9,049 3,245 5,804 14,895 6,732 8,163 4,197 1,774 2,423 729 450 279Mississippi 5,638 1,930 3,708 8,471 3,557 4,914 2,831 1,079 1,752 351 203 148
Missouri 6,808 2,434 4,374 15,624 6,827 8,797 4,028 1,661 2,367 425 265 160Montana 1,267 460 807 4,410 2,157 2,253 797 380 417 98 64 34Nebraska 3,108 1,641 1,467 6,811 3,276 3,535 2,289 1,026 1,263 311 161 150Nevada 1,409 521 888 3,782 1,716 2,066 1,094 449 645 91 61 30New Hampshire 1,637 684 953 3,874 1,648 2,226 726 268 458 74 42 32
New Jersey 11,811 4,388 7,423 18,531 8,084 10,447 5,241 1,977 3,264 544 290 254New Mexico 3,241 1,104 2,137 5,753 2,430 3,323 2,114 898 1,216 307 194 113New York * 40,411 15,939 24,472 42,645 18,290 24,355 13,259 4,570 8,689 1,362 737 625North Carolina 13,262 4,472 8,790 23,162 10,066 13,096 5,961 2,433 3,528 802 442 360North Dakota 1,874 849 1,025 4,008 1,930 2,078 671 289 382 71 42 29
Ohio 16,206 5,518 10,688 31,652 14,384 17,268 11,092 4,836 6,256 1,643 936 707Oklahoma 6,537 2,471 4,066 12,648 5,677 6,971 3,789 1,641 2,148 359 215 144Oregon 5,421 2,154 3,267 9,700 4,580 5,120 2,742 1,210 1,532 412 232 180Pennsylvania 11,606 4,356 7,250 30,874 14,091 16,783 8,784 3,725 5,059 1,334 736 598Rhode Island 1,265 402 863 3,038 1,187 1,851 814 286 528 71 36 35
South Carolina 5,478 2,124 3,354 11,416 4,847 6,569 4,204 1,510 2,694 385 207 178South Dakota 1,409 606 803 3,458 1,581 1,877 855 404 451 69 31 38Tennessee 5,621 1,818 3,803 13,836 6,023 7,813 4,771 1,815 2,956 429 230 199Texas 24,104 9,576 14,528 56,197 24,641 31,556 17,843 7,903 9,940 2,448 1,452 996Utah 7,351 3,183 4,168 9,634 4,890 4,744 1,916 946 970 295 198 97
Vermont 670 245 425 2,324 1,074 1,250 437 168 269 59 27 32Virginia 9,122 3,332 5,790 22,810 10,104 12,706 8,582 3,584 4,998 988 536 452Washington 18,064 7,338 10,726 18,009 8,073 9,936 3,768 1,694 2,074 649 373 276West Virginia 2,134 796 1,338 6,828 3,242 3,586 2,366 928 1,438 158 97 61Wisconsin 8,694 3,280 5,414 19,634 8,723 10,911 4,700 1,894 2,806 859 510 349Wyoming 1,728 537 1,191 1,706 770 936 387 177 210 64 42 22
* Includes data for U.S. Service Schools located in state.
SOURCE: U.S. Department of Education, National Center for Education Statistics, Integrated Postsecondary Education Data System,"Completions" survey, 1997-98 and "Consolidated" survey, 1998.
38
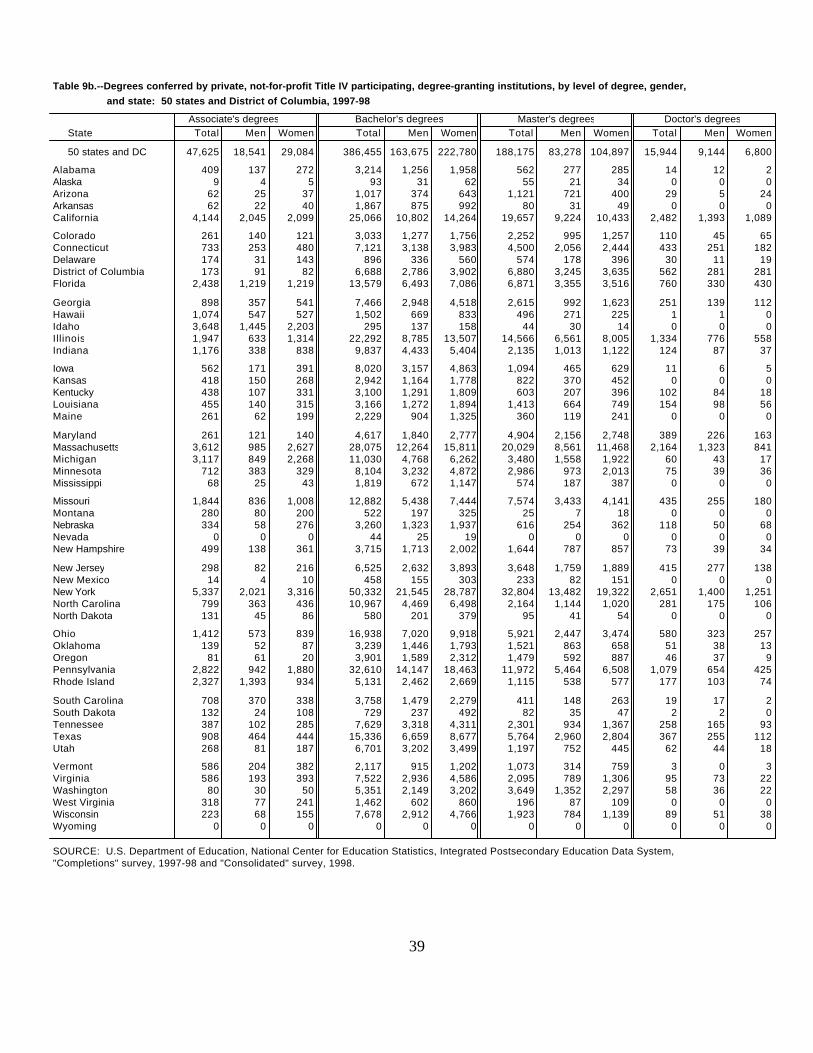
Table 9b.--Degrees conferred by private, not-for-profit Title IV participating, degree-granting institutions, by level of degree, gender, and state: 50 states and District of Columbia, 1997-98
Associate's degrees Bachelor's degrees Master's degrees Doctor's degrees State Total Men Women Total Men Women Total Men Women Total Men Women
50 states and DC 47,625 18,541 29,084 386,455 163,675 222,780 188,175 83,278 104,897 15,944 9,144 6,800
Alabama 409 137 272 3,214 1,256 1,958 562 277 285 14 12 2Alaska 9 4 5 93 31 62 55 21 34 0 0 0Arizona 62 25 37 1,017 374 643 1,121 721 400 29 5 24Arkansas 62 22 40 1,867 875 992 80 31 49 0 0 0California 4,144 2,045 2,099 25,066 10,802 14,264 19,657 9,224 10,433 2,482 1,393 1,089
Colorado 261 140 121 3,033 1,277 1,756 2,252 995 1,257 110 45 65Connecticut 733 253 480 7,121 3,138 3,983 4,500 2,056 2,444 433 251 182Delaware 174 31 143 896 336 560 574 178 396 30 11 19District of Columbia 173 91 82 6,688 2,786 3,902 6,880 3,245 3,635 562 281 281Florida 2,438 1,219 1,219 13,579 6,493 7,086 6,871 3,355 3,516 760 330 430
Georgia 898 357 541 7,466 2,948 4,518 2,615 992 1,623 251 139 112Hawaii 1,074 547 527 1,502 669 833 496 271 225 1 1 0Idaho 3,648 1,445 2,203 295 137 158 44 30 14 0 0 0Illinois 1,947 633 1,314 22,292 8,785 13,507 14,566 6,561 8,005 1,334 776 558Indiana 1,176 338 838 9,837 4,433 5,404 2,135 1,013 1,122 124 87 37
Iowa 562 171 391 8,020 3,157 4,863 1,094 465 629 11 6 5Kansas 418 150 268 2,942 1,164 1,778 822 370 452 0 0 0Kentucky 438 107 331 3,100 1,291 1,809 603 207 396 102 84 18Louisiana 455 140 315 3,166 1,272 1,894 1,413 664 749 154 98 56Maine 261 62 199 2,229 904 1,325 360 119 241 0 0 0
Maryland 261 121 140 4,617 1,840 2,777 4,904 2,156 2,748 389 226 163Massachusetts 3,612 985 2,627 28,075 12,264 15,811 20,029 8,561 11,468 2,164 1,323 841Michigan 3,117 849 2,268 11,030 4,768 6,262 3,480 1,558 1,922 60 43 17Minnesota 712 383 329 8,104 3,232 4,872 2,986 973 2,013 75 39 36Mississippi 68 25 43 1,819 672 1,147 574 187 387 0 0 0
Missouri 1,844 836 1,008 12,882 5,438 7,444 7,574 3,433 4,141 435 255 180Montana 280 80 200 522 197 325 25 7 18 0 0 0Nebraska 334 58 276 3,260 1,323 1,937 616 254 362 118 50 68Nevada 0 0 0 44 25 19 0 0 0 0 0 0New Hampshire 499 138 361 3,715 1,713 2,002 1,644 787 857 73 39 34
New Jersey 298 82 216 6,525 2,632 3,893 3,648 1,759 1,889 415 277 138New Mexico 14 4 10 458 155 303 233 82 151 0 0 0New York 5,337 2,021 3,316 50,332 21,545 28,787 32,804 13,482 19,322 2,651 1,400 1,251North Carolina 799 363 436 10,967 4,469 6,498 2,164 1,144 1,020 281 175 106North Dakota 131 45 86 580 201 379 95 41 54 0 0 0
Ohio 1,412 573 839 16,938 7,020 9,918 5,921 2,447 3,474 580 323 257Oklahoma 139 52 87 3,239 1,446 1,793 1,521 863 658 51 38 13Oregon 81 61 20 3,901 1,589 2,312 1,479 592 887 46 37 9Pennsylvania 2,822 942 1,880 32,610 14,147 18,463 11,972 5,464 6,508 1,079 654 425Rhode Island 2,327 1,393 934 5,131 2,462 2,669 1,115 538 577 177 103 74
South Carolina 708 370 338 3,758 1,479 2,279 411 148 263 19 17 2South Dakota 132 24 108 729 237 492 82 35 47 2 2 0Tennessee 387 102 285 7,629 3,318 4,311 2,301 934 1,367 258 165 93Texas 908 464 444 15,336 6,659 8,677 5,764 2,960 2,804 367 255 112Utah 268 81 187 6,701 3,202 3,499 1,197 752 445 62 44 18
Vermont 586 204 382 2,117 915 1,202 1,073 314 759 3 0 3Virginia 586 193 393 7,522 2,936 4,586 2,095 789 1,306 95 73 22Washington 80 30 50 5,351 2,149 3,202 3,649 1,352 2,297 58 36 22West Virginia 318 77 241 1,462 602 860 196 87 109 0 0 0Wisconsin 223 68 155 7,678 2,912 4,766 1,923 784 1,139 89 51 38Wyoming 0 0 0 0 0 0 0 0 0 0 0 0
SOURCE: U.S. Department of Education, National Center for Education Statistics, Integrated Postsecondary Education Data System,"Completions" survey, 1997-98 and "Consolidated" survey, 1998.
39
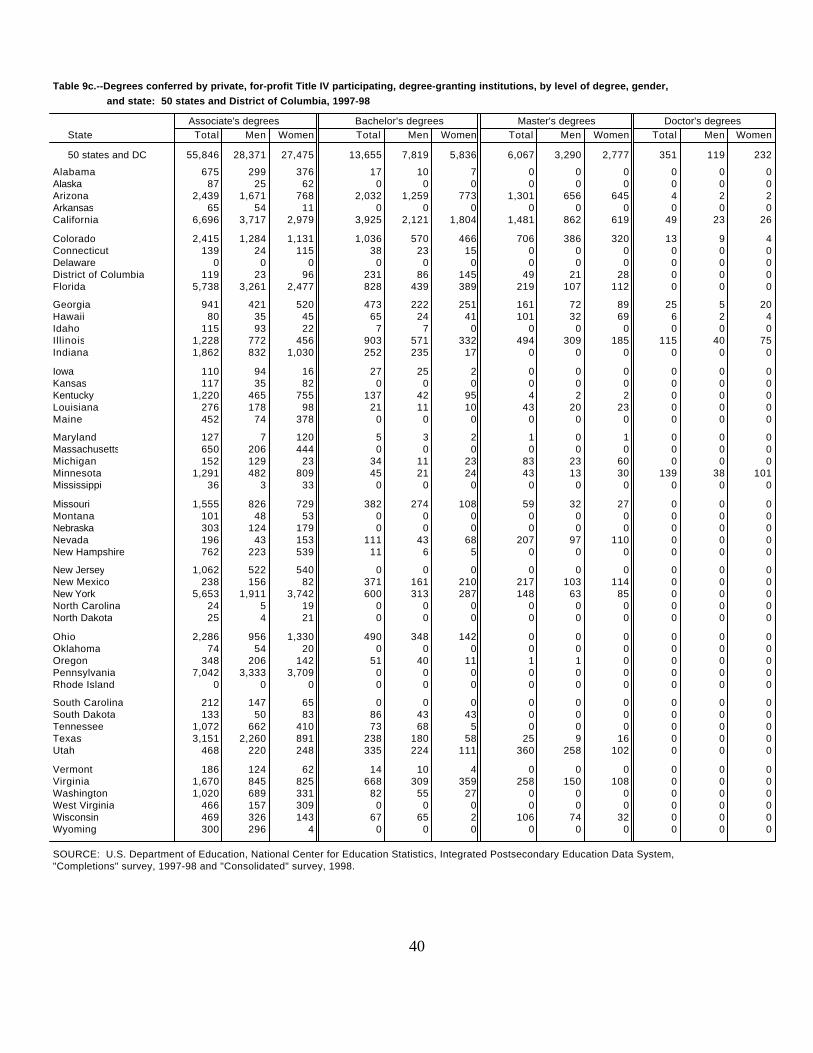
Table 9c.--Degrees conferred by private, for-profit Title IV participating, degree-granting institutions, by level of degree, gender, and state: 50 states and District of Columbia, 1997-98
Associate's degrees Bachelor's degrees Master's degrees Doctor's degrees State Total Men Women Total Men Women Total Men Women Total Men Women
50 states and DC 55,846 28,371 27,475 13,655 7,819 5,836 6,067 3,290 2,777 351 119 232
Alabama 675 299 376 17 10 7 0 0 0 0 0 0Alaska 87 25 62 0 0 0 0 0 0 0 0 0Arizona 2,439 1,671 768 2,032 1,259 773 1,301 656 645 4 2 2Arkansas 65 54 11 0 0 0 0 0 0 0 0 0California 6,696 3,717 2,979 3,925 2,121 1,804 1,481 862 619 49 23 26
Colorado 2,415 1,284 1,131 1,036 570 466 706 386 320 13 9 4Connecticut 139 24 115 38 23 15 0 0 0 0 0 0Delaware 0 0 0 0 0 0 0 0 0 0 0 0District of Columbia 119 23 96 231 86 145 49 21 28 0 0 0Florida 5,738 3,261 2,477 828 439 389 219 107 112 0 0 0
Georgia 941 421 520 473 222 251 161 72 89 25 5 20Hawaii 80 35 45 65 24 41 101 32 69 6 2 4Idaho 115 93 22 7 7 0 0 0 0 0 0 0Illinois 1,228 772 456 903 571 332 494 309 185 115 40 75Indiana 1,862 832 1,030 252 235 17 0 0 0 0 0 0
Iowa 110 94 16 27 25 2 0 0 0 0 0 0Kansas 117 35 82 0 0 0 0 0 0 0 0 0Kentucky 1,220 465 755 137 42 95 4 2 2 0 0 0Louisiana 276 178 98 21 11 10 43 20 23 0 0 0Maine 452 74 378 0 0 0 0 0 0 0 0 0
Maryland 127 7 120 5 3 2 1 0 1 0 0 0Massachusetts 650 206 444 0 0 0 0 0 0 0 0 0Michigan 152 129 23 34 11 23 83 23 60 0 0 0Minnesota 1,291 482 809 45 21 24 43 13 30 139 38 101Mississippi 36 3 33 0 0 0 0 0 0 0 0 0
Missouri 1,555 826 729 382 274 108 59 32 27 0 0 0Montana 101 48 53 0 0 0 0 0 0 0 0 0Nebraska 303 124 179 0 0 0 0 0 0 0 0 0Nevada 196 43 153 111 43 68 207 97 110 0 0 0New Hampshire 762 223 539 11 6 5 0 0 0 0 0 0
New Jersey 1,062 522 540 0 0 0 0 0 0 0 0 0New Mexico 238 156 82 371 161 210 217 103 114 0 0 0New York 5,653 1,911 3,742 600 313 287 148 63 85 0 0 0North Carolina 24 5 19 0 0 0 0 0 0 0 0 0North Dakota 25 4 21 0 0 0 0 0 0 0 0 0
Ohio 2,286 956 1,330 490 348 142 0 0 0 0 0 0Oklahoma 74 54 20 0 0 0 0 0 0 0 0 0Oregon 348 206 142 51 40 11 1 1 0 0 0 0Pennsylvania 7,042 3,333 3,709 0 0 0 0 0 0 0 0 0Rhode Island 0 0 0 0 0 0 0 0 0 0 0 0
South Carolina 212 147 65 0 0 0 0 0 0 0 0 0South Dakota 133 50 83 86 43 43 0 0 0 0 0 0Tennessee 1,072 662 410 73 68 5 0 0 0 0 0 0Texas 3,151 2,260 891 238 180 58 25 9 16 0 0 0Utah 468 220 248 335 224 111 360 258 102 0 0 0
Vermont 186 124 62 14 10 4 0 0 0 0 0 0Virginia 1,670 845 825 668 309 359 258 150 108 0 0 0Washington 1,020 689 331 82 55 27 0 0 0 0 0 0West Virginia 466 157 309 0 0 0 0 0 0 0 0 0Wisconsin 469 326 143 67 65 2 106 74 32 0 0 0Wyoming 300 296 4 0 0 0 0 0 0 0 0 0
SOURCE: U.S. Department of Education, National Center for Education Statistics, Integrated Postsecondary Education Data System,"Completions" survey, 1997-98 and "Consolidated" survey, 1998.
40
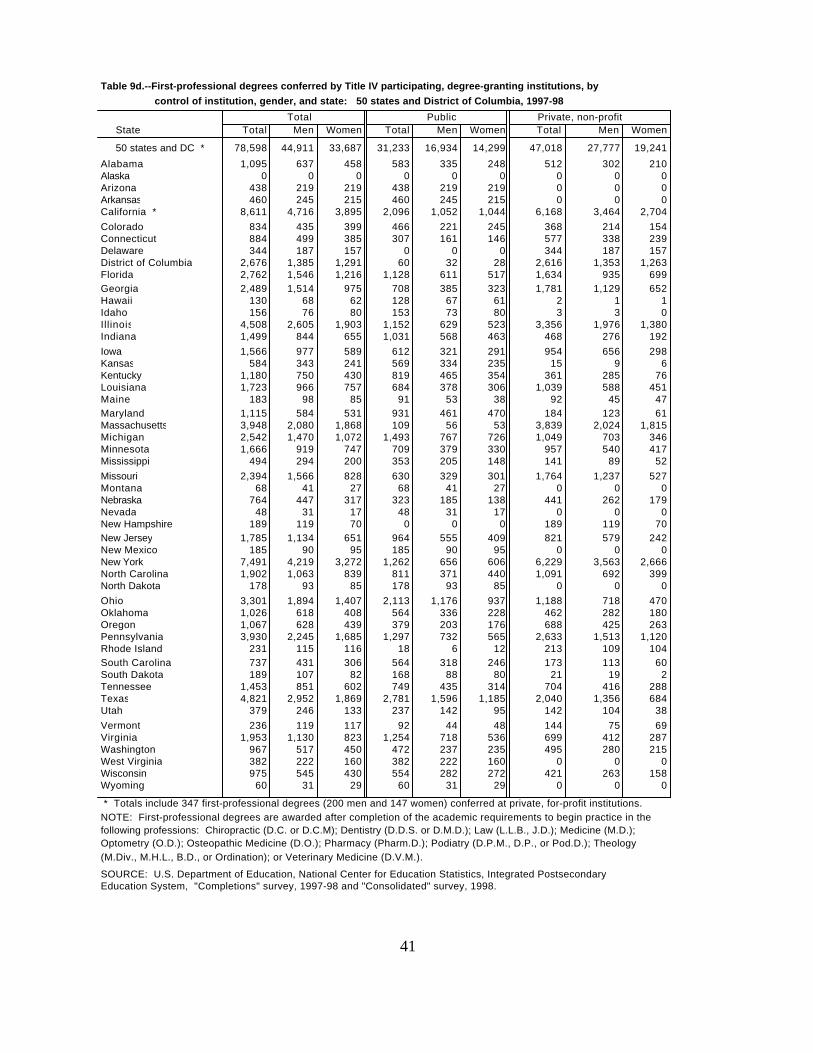
Table 9d.--First-professional degrees conferred by Title IV participating, degree-granting institutions, by control of institution, gender, and state: 50 states and District of Columbia, 1997-98
Total Public Private, non-profit State Total Men Women Total Men Women Total Men Women
50 states and DC * 78,598 44,911 33,687 31,233 16,934 14,299 47,018 27,777 19,241
Alabama 1,095 637 458 583 335 248 512 302 210Alaska 0 0 0 0 0 0 0 0 0Arizona 438 219 219 438 219 219 0 0 0Arkansas 460 245 215 460 245 215 0 0 0California * 8,611 4,716 3,895 2,096 1,052 1,044 6,168 3,464 2,704Colorado 834 435 399 466 221 245 368 214 154Connecticut 884 499 385 307 161 146 577 338 239Delaware 344 187 157 0 0 0 344 187 157District of Columbia 2,676 1,385 1,291 60 32 28 2,616 1,353 1,263Florida 2,762 1,546 1,216 1,128 611 517 1,634 935 699Georgia 2,489 1,514 975 708 385 323 1,781 1,129 652Hawaii 130 68 62 128 67 61 2 1 1Idaho 156 76 80 153 73 80 3 3 0Illinois 4,508 2,605 1,903 1,152 629 523 3,356 1,976 1,380Indiana 1,499 844 655 1,031 568 463 468 276 192Iowa 1,566 977 589 612 321 291 954 656 298Kansas 584 343 241 569 334 235 15 9 6Kentucky 1,180 750 430 819 465 354 361 285 76Louisiana 1,723 966 757 684 378 306 1,039 588 451Maine 183 98 85 91 53 38 92 45 47Maryland 1,115 584 531 931 461 470 184 123 61Massachusetts 3,948 2,080 1,868 109 56 53 3,839 2,024 1,815Michigan 2,542 1,470 1,072 1,493 767 726 1,049 703 346Minnesota 1,666 919 747 709 379 330 957 540 417Mississippi 494 294 200 353 205 148 141 89 52Missouri 2,394 1,566 828 630 329 301 1,764 1,237 527Montana 68 41 27 68 41 27 0 0 0Nebraska 764 447 317 323 185 138 441 262 179Nevada 48 31 17 48 31 17 0 0 0New Hampshire 189 119 70 0 0 0 189 119 70New Jersey 1,785 1,134 651 964 555 409 821 579 242New Mexico 185 90 95 185 90 95 0 0 0New York 7,491 4,219 3,272 1,262 656 606 6,229 3,563 2,666North Carolina 1,902 1,063 839 811 371 440 1,091 692 399North Dakota 178 93 85 178 93 85 0 0 0Ohio 3,301 1,894 1,407 2,113 1,176 937 1,188 718 470Oklahoma 1,026 618 408 564 336 228 462 282 180Oregon 1,067 628 439 379 203 176 688 425 263Pennsylvania 3,930 2,245 1,685 1,297 732 565 2,633 1,513 1,120Rhode Island 231 115 116 18 6 12 213 109 104South Carolina 737 431 306 564 318 246 173 113 60South Dakota 189 107 82 168 88 80 21 19 2Tennessee 1,453 851 602 749 435 314 704 416 288Texas 4,821 2,952 1,869 2,781 1,596 1,185 2,040 1,356 684Utah 379 246 133 237 142 95 142 104 38Vermont 236 119 117 92 44 48 144 75 69Virginia 1,953 1,130 823 1,254 718 536 699 412 287Washington 967 517 450 472 237 235 495 280 215West Virginia 382 222 160 382 222 160 0 0 0Wisconsin 975 545 430 554 282 272 421 263 158Wyoming 60 31 29 60 31 29 0 0 0
* Totals include 347 first-professional degrees (200 men and 147 women) conferred at private, for-profit institutions.NOTE: First-professional degrees are awarded after completion of the academic requirements to begin practice in thefollowing professions: Chiropractic (D.C. or D.C.M); Dentistry (D.D.S. or D.M.D.); Law (L.L.B., J.D.); Medicine (M.D.);Optometry (O.D.); Osteopathic Medicine (D.O.); Pharmacy (Pharm.D.); Podiatry (D.P.M., D.P., or Pod.D.); Theology (M.Div., M.H.L., B.D., or Ordination); or Veterinary Medicine (D.V.M.).
SOURCE: U.S. Department of Education, National Center for Education Statistics, Integrated PostsecondaryEducation System, "Completions" survey, 1997-98 and "Consolidated" survey, 1998.
41
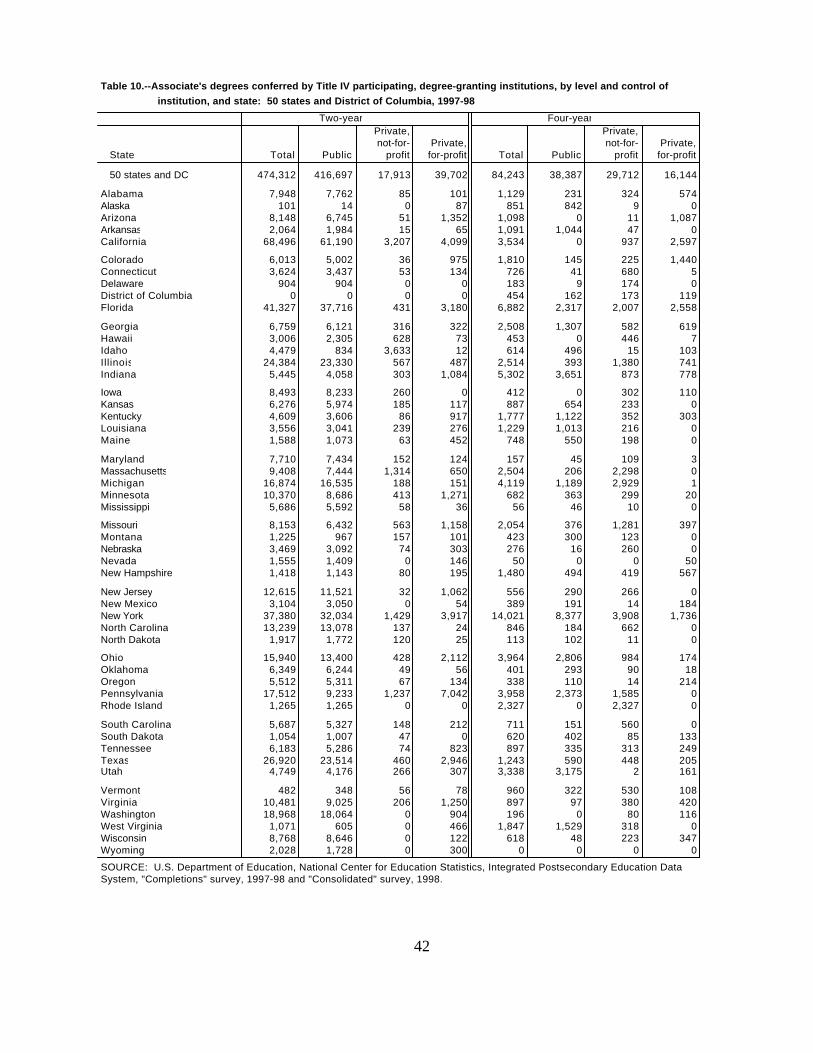
Table 10.--Associate's degrees conferred by Title IV participating, degree-granting institutions, by level and control of institution, and state: 50 states and District of Columbia, 1997-98
Two-year Four-yearPrivate, Private, not-for- Private, not-for- Private,
State Total Public profit for-profit Total Public profit for-profit
50 states and DC 474,312 416,697 17,913 39,702 84,243 38,387 29,712 16,144
Alabama 7,948 7,762 85 101 1,129 231 324 574Alaska 101 14 0 87 851 842 9 0Arizona 8,148 6,745 51 1,352 1,098 0 11 1,087Arkansas 2,064 1,984 15 65 1,091 1,044 47 0California 68,496 61,190 3,207 4,099 3,534 0 937 2,597
Colorado 6,013 5,002 36 975 1,810 145 225 1,440Connecticut 3,624 3,437 53 134 726 41 680 5Delaware 904 904 0 0 183 9 174 0District of Columbia 0 0 0 0 454 162 173 119Florida 41,327 37,716 431 3,180 6,882 2,317 2,007 2,558
Georgia 6,759 6,121 316 322 2,508 1,307 582 619Hawaii 3,006 2,305 628 73 453 0 446 7Idaho 4,479 834 3,633 12 614 496 15 103Illinois 24,384 23,330 567 487 2,514 393 1,380 741Indiana 5,445 4,058 303 1,084 5,302 3,651 873 778
Iowa 8,493 8,233 260 0 412 0 302 110Kansas 6,276 5,974 185 117 887 654 233 0Kentucky 4,609 3,606 86 917 1,777 1,122 352 303Louisiana 3,556 3,041 239 276 1,229 1,013 216 0Maine 1,588 1,073 63 452 748 550 198 0
Maryland 7,710 7,434 152 124 157 45 109 3Massachusetts 9,408 7,444 1,314 650 2,504 206 2,298 0Michigan 16,874 16,535 188 151 4,119 1,189 2,929 1Minnesota 10,370 8,686 413 1,271 682 363 299 20Mississippi 5,686 5,592 58 36 56 46 10 0
Missouri 8,153 6,432 563 1,158 2,054 376 1,281 397Montana 1,225 967 157 101 423 300 123 0Nebraska 3,469 3,092 74 303 276 16 260 0Nevada 1,555 1,409 0 146 50 0 0 50New Hampshire 1,418 1,143 80 195 1,480 494 419 567
New Jersey 12,615 11,521 32 1,062 556 290 266 0New Mexico 3,104 3,050 0 54 389 191 14 184New York 37,380 32,034 1,429 3,917 14,021 8,377 3,908 1,736North Carolina 13,239 13,078 137 24 846 184 662 0North Dakota 1,917 1,772 120 25 113 102 11 0
Ohio 15,940 13,400 428 2,112 3,964 2,806 984 174Oklahoma 6,349 6,244 49 56 401 293 90 18Oregon 5,512 5,311 67 134 338 110 14 214Pennsylvania 17,512 9,233 1,237 7,042 3,958 2,373 1,585 0Rhode Island 1,265 1,265 0 0 2,327 0 2,327 0
South Carolina 5,687 5,327 148 212 711 151 560 0South Dakota 1,054 1,007 47 0 620 402 85 133Tennessee 6,183 5,286 74 823 897 335 313 249Texas 26,920 23,514 460 2,946 1,243 590 448 205Utah 4,749 4,176 266 307 3,338 3,175 2 161
Vermont 482 348 56 78 960 322 530 108Virginia 10,481 9,025 206 1,250 897 97 380 420Washington 18,968 18,064 0 904 196 0 80 116West Virginia 1,071 605 0 466 1,847 1,529 318 0Wisconsin 8,768 8,646 0 122 618 48 223 347Wyoming 2,028 1,728 0 300 0 0 0 0
SOURCE: U.S. Department of Education, National Center for Education Statistics, Integrated Postsecondary Education DataSystem, "Completions" survey, 1997-98 and "Consolidated" survey, 1998.
42
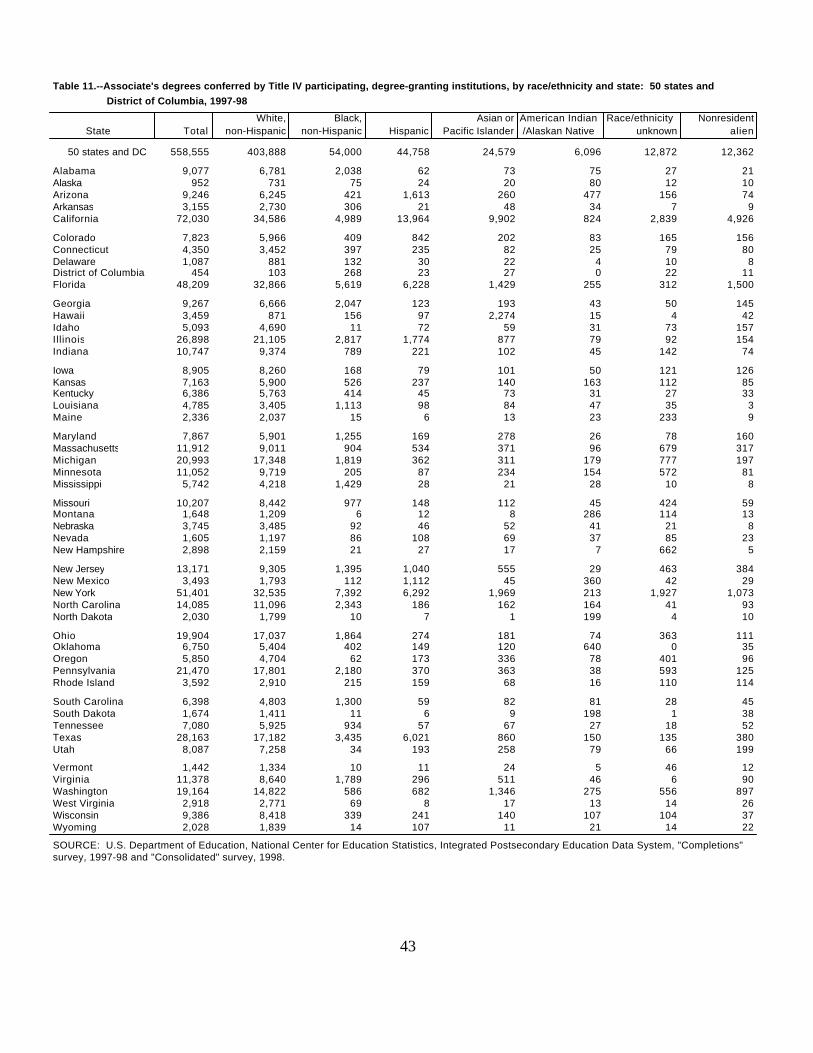
Table 11.--Associate's degrees conferred by Title IV participating, degree-granting institutions, by race/ethnicity and state: 50 states and District of Columbia, 1997-98
White, Black, Asian or American Indian Race/ethnicity Nonresident State Total non-Hispanic non-Hispanic Hispanic Pacific Islander /Alaskan Native unknown alien
50 states and DC 558,555 403,888 54,000 44,758 24,579 6,096 12,872 12,362
Alabama 9,077 6,781 2,038 62 73 75 27 21Alaska 952 731 75 24 20 80 12 10Arizona 9,246 6,245 421 1,613 260 477 156 74Arkansas 3,155 2,730 306 21 48 34 7 9California 72,030 34,586 4,989 13,964 9,902 824 2,839 4,926
Colorado 7,823 5,966 409 842 202 83 165 156Connecticut 4,350 3,452 397 235 82 25 79 80Delaware 1,087 881 132 30 22 4 10 8District of Columbia 454 103 268 23 27 0 22 11Florida 48,209 32,866 5,619 6,228 1,429 255 312 1,500
Georgia 9,267 6,666 2,047 123 193 43 50 145Hawaii 3,459 871 156 97 2,274 15 4 42Idaho 5,093 4,690 11 72 59 31 73 157Illinois 26,898 21,105 2,817 1,774 877 79 92 154Indiana 10,747 9,374 789 221 102 45 142 74
Iowa 8,905 8,260 168 79 101 50 121 126Kansas 7,163 5,900 526 237 140 163 112 85Kentucky 6,386 5,763 414 45 73 31 27 33Louisiana 4,785 3,405 1,113 98 84 47 35 3Maine 2,336 2,037 15 6 13 23 233 9
Maryland 7,867 5,901 1,255 169 278 26 78 160Massachusetts 11,912 9,011 904 534 371 96 679 317Michigan 20,993 17,348 1,819 362 311 179 777 197Minnesota 11,052 9,719 205 87 234 154 572 81Mississippi 5,742 4,218 1,429 28 21 28 10 8
Missouri 10,207 8,442 977 148 112 45 424 59Montana 1,648 1,209 6 12 8 286 114 13Nebraska 3,745 3,485 92 46 52 41 21 8Nevada 1,605 1,197 86 108 69 37 85 23New Hampshire 2,898 2,159 21 27 17 7 662 5
New Jersey 13,171 9,305 1,395 1,040 555 29 463 384New Mexico 3,493 1,793 112 1,112 45 360 42 29New York 51,401 32,535 7,392 6,292 1,969 213 1,927 1,073North Carolina 14,085 11,096 2,343 186 162 164 41 93North Dakota 2,030 1,799 10 7 1 199 4 10
Ohio 19,904 17,037 1,864 274 181 74 363 111Oklahoma 6,750 5,404 402 149 120 640 0 35Oregon 5,850 4,704 62 173 336 78 401 96Pennsylvania 21,470 17,801 2,180 370 363 38 593 125Rhode Island 3,592 2,910 215 159 68 16 110 114
South Carolina 6,398 4,803 1,300 59 82 81 28 45South Dakota 1,674 1,411 11 6 9 198 1 38Tennessee 7,080 5,925 934 57 67 27 18 52Texas 28,163 17,182 3,435 6,021 860 150 135 380Utah 8,087 7,258 34 193 258 79 66 199
Vermont 1,442 1,334 10 11 24 5 46 12Virginia 11,378 8,640 1,789 296 511 46 6 90Washington 19,164 14,822 586 682 1,346 275 556 897West Virginia 2,918 2,771 69 8 17 13 14 26Wisconsin 9,386 8,418 339 241 140 107 104 37Wyoming 2,028 1,839 14 107 11 21 14 22
SOURCE: U.S. Department of Education, National Center for Education Statistics, Integrated Postsecondary Education Data System, "Completions"survey, 1997-98 and "Consolidated" survey, 1998.
43
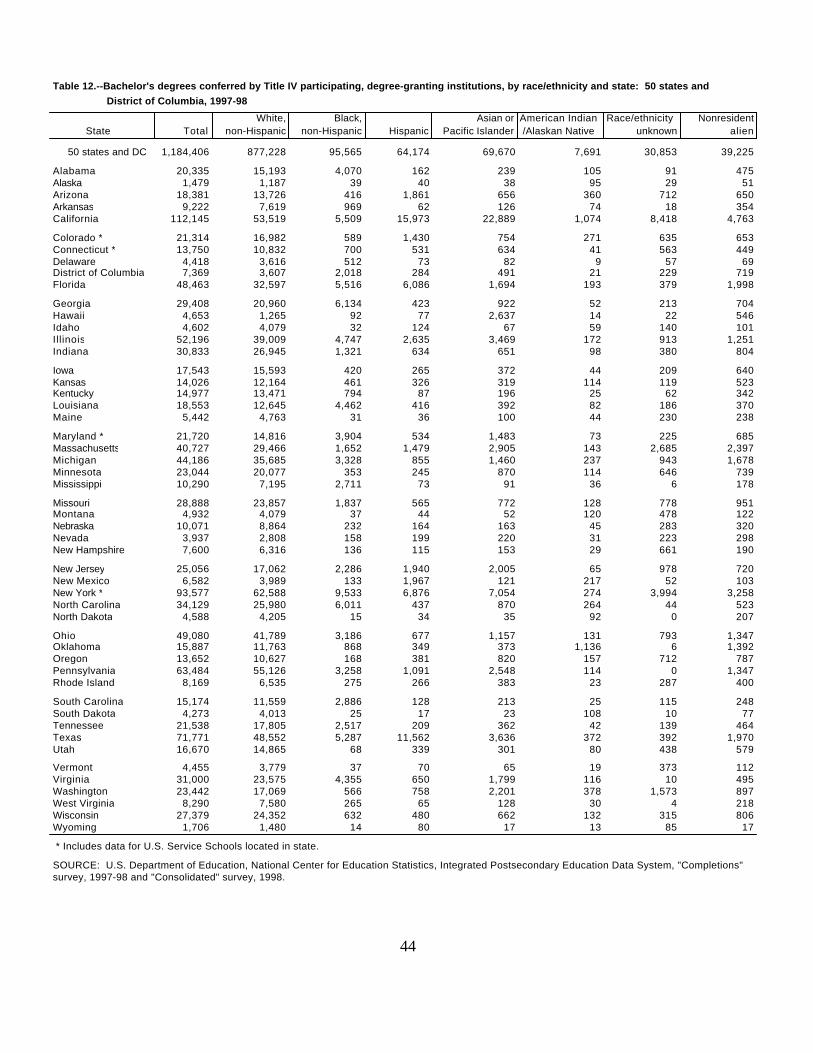
Table 12.--Bachelor's degrees conferred by Title IV participating, degree-granting institutions, by race/ethnicity and state: 50 states and District of Columbia, 1997-98
White, Black, Asian or American Indian Race/ethnicity Nonresident State Total non-Hispanic non-Hispanic Hispanic Pacific Islander /Alaskan Native unknown alien
50 states and DC 1,184,406 877,228 95,565 64,174 69,670 7,691 30,853 39,225
Alabama 20,335 15,193 4,070 162 239 105 91 475Alaska 1,479 1,187 39 40 38 95 29 51Arizona 18,381 13,726 416 1,861 656 360 712 650Arkansas 9,222 7,619 969 62 126 74 18 354California 112,145 53,519 5,509 15,973 22,889 1,074 8,418 4,763
Colorado * 21,314 16,982 589 1,430 754 271 635 653Connecticut * 13,750 10,832 700 531 634 41 563 449Delaware 4,418 3,616 512 73 82 9 57 69District of Columbia 7,369 3,607 2,018 284 491 21 229 719Florida 48,463 32,597 5,516 6,086 1,694 193 379 1,998
Georgia 29,408 20,960 6,134 423 922 52 213 704Hawaii 4,653 1,265 92 77 2,637 14 22 546Idaho 4,602 4,079 32 124 67 59 140 101Illinois 52,196 39,009 4,747 2,635 3,469 172 913 1,251Indiana 30,833 26,945 1,321 634 651 98 380 804
Iowa 17,543 15,593 420 265 372 44 209 640Kansas 14,026 12,164 461 326 319 114 119 523Kentucky 14,977 13,471 794 87 196 25 62 342Louisiana 18,553 12,645 4,462 416 392 82 186 370Maine 5,442 4,763 31 36 100 44 230 238
Maryland * 21,720 14,816 3,904 534 1,483 73 225 685Massachusetts 40,727 29,466 1,652 1,479 2,905 143 2,685 2,397Michigan 44,186 35,685 3,328 855 1,460 237 943 1,678Minnesota 23,044 20,077 353 245 870 114 646 739Mississippi 10,290 7,195 2,711 73 91 36 6 178
Missouri 28,888 23,857 1,837 565 772 128 778 951Montana 4,932 4,079 37 44 52 120 478 122Nebraska 10,071 8,864 232 164 163 45 283 320Nevada 3,937 2,808 158 199 220 31 223 298New Hampshire 7,600 6,316 136 115 153 29 661 190
New Jersey 25,056 17,062 2,286 1,940 2,005 65 978 720New Mexico 6,582 3,989 133 1,967 121 217 52 103New York * 93,577 62,588 9,533 6,876 7,054 274 3,994 3,258North Carolina 34,129 25,980 6,011 437 870 264 44 523North Dakota 4,588 4,205 15 34 35 92 0 207
Ohio 49,080 41,789 3,186 677 1,157 131 793 1,347Oklahoma 15,887 11,763 868 349 373 1,136 6 1,392Oregon 13,652 10,627 168 381 820 157 712 787Pennsylvania 63,484 55,126 3,258 1,091 2,548 114 0 1,347Rhode Island 8,169 6,535 275 266 383 23 287 400
South Carolina 15,174 11,559 2,886 128 213 25 115 248South Dakota 4,273 4,013 25 17 23 108 10 77Tennessee 21,538 17,805 2,517 209 362 42 139 464Texas 71,771 48,552 5,287 11,562 3,636 372 392 1,970Utah 16,670 14,865 68 339 301 80 438 579
Vermont 4,455 3,779 37 70 65 19 373 112Virginia 31,000 23,575 4,355 650 1,799 116 10 495Washington 23,442 17,069 566 758 2,201 378 1,573 897West Virginia 8,290 7,580 265 65 128 30 4 218Wisconsin 27,379 24,352 632 480 662 132 315 806Wyoming 1,706 1,480 14 80 17 13 85 17
* Includes data for U.S. Service Schools located in state.
SOURCE: U.S. Department of Education, National Center for Education Statistics, Integrated Postsecondary Education Data System, "Completions"survey, 1997-98 and "Consolidated" survey, 1998.
44
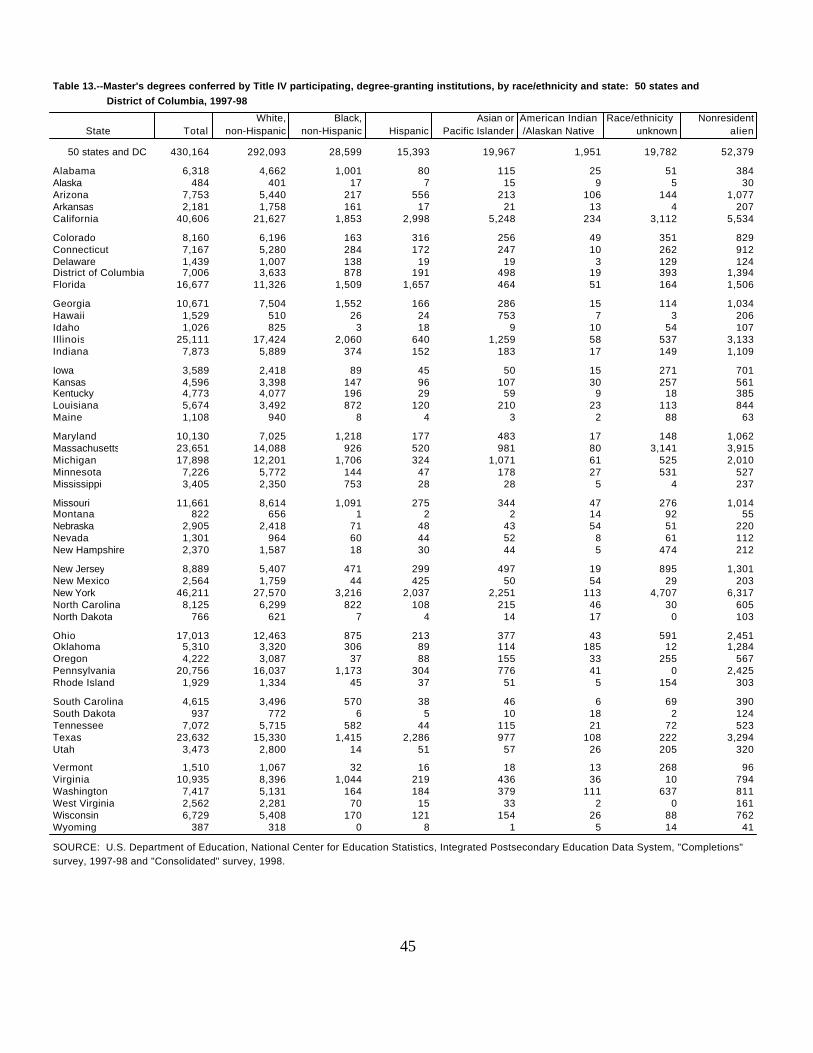
Table 13.--Master's degrees conferred by Title IV participating, degree-granting institutions, by race/ethnicity and state: 50 states and District of Columbia, 1997-98
White, Black, Asian or American Indian Race/ethnicity Nonresident State Total non-Hispanic non-Hispanic Hispanic Pacific Islander /Alaskan Native unknown alien
50 states and DC 430,164 292,093 28,599 15,393 19,967 1,951 19,782 52,379
Alabama 6,318 4,662 1,001 80 115 25 51 384Alaska 484 401 17 7 15 9 5 30Arizona 7,753 5,440 217 556 213 106 144 1,077Arkansas 2,181 1,758 161 17 21 13 4 207California 40,606 21,627 1,853 2,998 5,248 234 3,112 5,534
Colorado 8,160 6,196 163 316 256 49 351 829Connecticut 7,167 5,280 284 172 247 10 262 912Delaware 1,439 1,007 138 19 19 3 129 124District of Columbia 7,006 3,633 878 191 498 19 393 1,394Florida 16,677 11,326 1,509 1,657 464 51 164 1,506
Georgia 10,671 7,504 1,552 166 286 15 114 1,034Hawaii 1,529 510 26 24 753 7 3 206Idaho 1,026 825 3 18 9 10 54 107Illinois 25,111 17,424 2,060 640 1,259 58 537 3,133Indiana 7,873 5,889 374 152 183 17 149 1,109
Iowa 3,589 2,418 89 45 50 15 271 701Kansas 4,596 3,398 147 96 107 30 257 561Kentucky 4,773 4,077 196 29 59 9 18 385Louisiana 5,674 3,492 872 120 210 23 113 844Maine 1,108 940 8 4 3 2 88 63
Maryland 10,130 7,025 1,218 177 483 17 148 1,062Massachusetts 23,651 14,088 926 520 981 80 3,141 3,915Michigan 17,898 12,201 1,706 324 1,071 61 525 2,010Minnesota 7,226 5,772 144 47 178 27 531 527Mississippi 3,405 2,350 753 28 28 5 4 237
Missouri 11,661 8,614 1,091 275 344 47 276 1,014Montana 822 656 1 2 2 14 92 55Nebraska 2,905 2,418 71 48 43 54 51 220Nevada 1,301 964 60 44 52 8 61 112New Hampshire 2,370 1,587 18 30 44 5 474 212
New Jersey 8,889 5,407 471 299 497 19 895 1,301New Mexico 2,564 1,759 44 425 50 54 29 203New York 46,211 27,570 3,216 2,037 2,251 113 4,707 6,317North Carolina 8,125 6,299 822 108 215 46 30 605North Dakota 766 621 7 4 14 17 0 103
Ohio 17,013 12,463 875 213 377 43 591 2,451Oklahoma 5,310 3,320 306 89 114 185 12 1,284Oregon 4,222 3,087 37 88 155 33 255 567Pennsylvania 20,756 16,037 1,173 304 776 41 0 2,425Rhode Island 1,929 1,334 45 37 51 5 154 303
South Carolina 4,615 3,496 570 38 46 6 69 390South Dakota 937 772 6 5 10 18 2 124Tennessee 7,072 5,715 582 44 115 21 72 523Texas 23,632 15,330 1,415 2,286 977 108 222 3,294Utah 3,473 2,800 14 51 57 26 205 320
Vermont 1,510 1,067 32 16 18 13 268 96Virginia 10,935 8,396 1,044 219 436 36 10 794Washington 7,417 5,131 164 184 379 111 637 811West Virginia 2,562 2,281 70 15 33 2 0 161Wisconsin 6,729 5,408 170 121 154 26 88 762Wyoming 387 318 0 8 1 5 14 41
SOURCE: U.S. Department of Education, National Center for Education Statistics, Integrated Postsecondary Education Data System, "Completions"survey, 1997-98 and "Consolidated" survey, 1998.
45
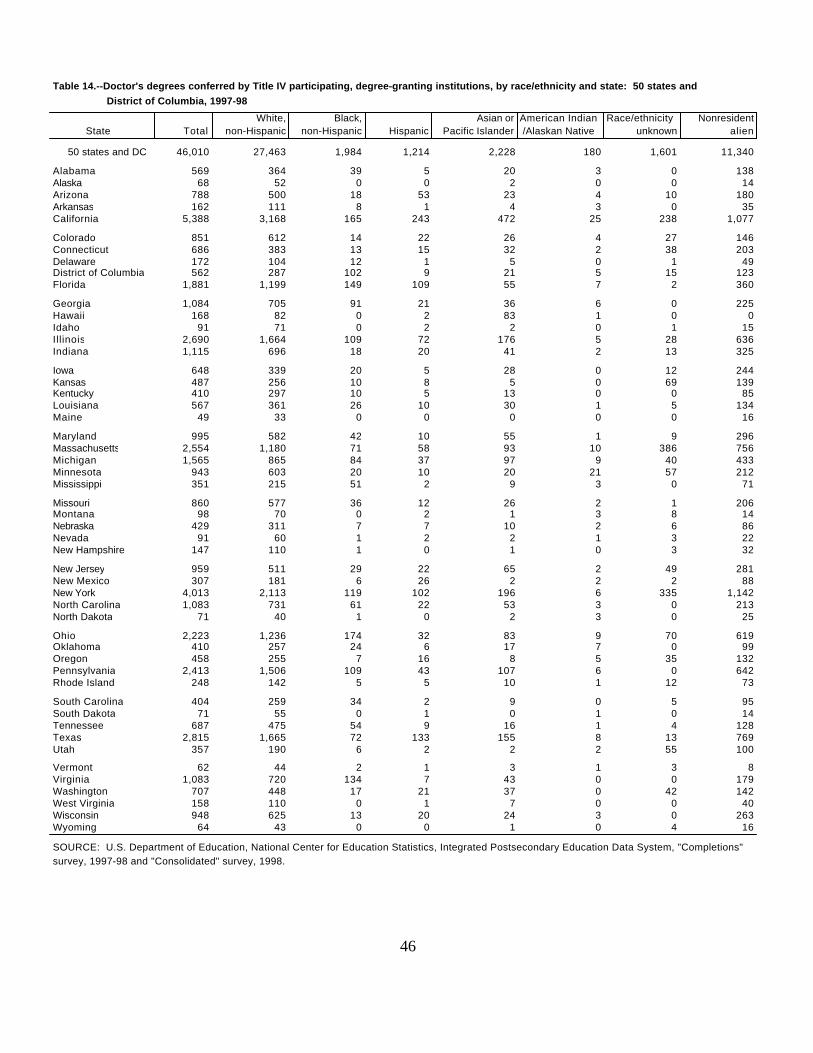
Table 14.--Doctor's degrees conferred by Title IV participating, degree-granting institutions, by race/ethnicity and state: 50 states and District of Columbia, 1997-98
White, Black, Asian or American Indian Race/ethnicity Nonresident State Total non-Hispanic non-Hispanic Hispanic Pacific Islander /Alaskan Native unknown alien
50 states and DC 46,010 27,463 1,984 1,214 2,228 180 1,601 11,340
Alabama 569 364 39 5 20 3 0 138Alaska 68 52 0 0 2 0 0 14Arizona 788 500 18 53 23 4 10 180Arkansas 162 111 8 1 4 3 0 35California 5,388 3,168 165 243 472 25 238 1,077
Colorado 851 612 14 22 26 4 27 146Connecticut 686 383 13 15 32 2 38 203Delaware 172 104 12 1 5 0 1 49District of Columbia 562 287 102 9 21 5 15 123Florida 1,881 1,199 149 109 55 7 2 360
Georgia 1,084 705 91 21 36 6 0 225Hawaii 168 82 0 2 83 1 0 0Idaho 91 71 0 2 2 0 1 15Illinois 2,690 1,664 109 72 176 5 28 636Indiana 1,115 696 18 20 41 2 13 325
Iowa 648 339 20 5 28 0 12 244Kansas 487 256 10 8 5 0 69 139Kentucky 410 297 10 5 13 0 0 85Louisiana 567 361 26 10 30 1 5 134Maine 49 33 0 0 0 0 0 16
Maryland 995 582 42 10 55 1 9 296Massachusetts 2,554 1,180 71 58 93 10 386 756Michigan 1,565 865 84 37 97 9 40 433Minnesota 943 603 20 10 20 21 57 212Mississippi 351 215 51 2 9 3 0 71
Missouri 860 577 36 12 26 2 1 206Montana 98 70 0 2 1 3 8 14Nebraska 429 311 7 7 10 2 6 86Nevada 91 60 1 2 2 1 3 22New Hampshire 147 110 1 0 1 0 3 32
New Jersey 959 511 29 22 65 2 49 281New Mexico 307 181 6 26 2 2 2 88New York 4,013 2,113 119 102 196 6 335 1,142North Carolina 1,083 731 61 22 53 3 0 213North Dakota 71 40 1 0 2 3 0 25
Ohio 2,223 1,236 174 32 83 9 70 619Oklahoma 410 257 24 6 17 7 0 99Oregon 458 255 7 16 8 5 35 132Pennsylvania 2,413 1,506 109 43 107 6 0 642Rhode Island 248 142 5 5 10 1 12 73
South Carolina 404 259 34 2 9 0 5 95South Dakota 71 55 0 1 0 1 0 14Tennessee 687 475 54 9 16 1 4 128Texas 2,815 1,665 72 133 155 8 13 769Utah 357 190 6 2 2 2 55 100
Vermont 62 44 2 1 3 1 3 8Virginia 1,083 720 134 7 43 0 0 179Washington 707 448 17 21 37 0 42 142West Virginia 158 110 0 1 7 0 0 40Wisconsin 948 625 13 20 24 3 0 263Wyoming 64 43 0 0 1 0 4 16
SOURCE: U.S. Department of Education, National Center for Education Statistics, Integrated Postsecondary Education Data System, "Completions"survey, 1997-98 and "Consolidated" survey, 1998.
46
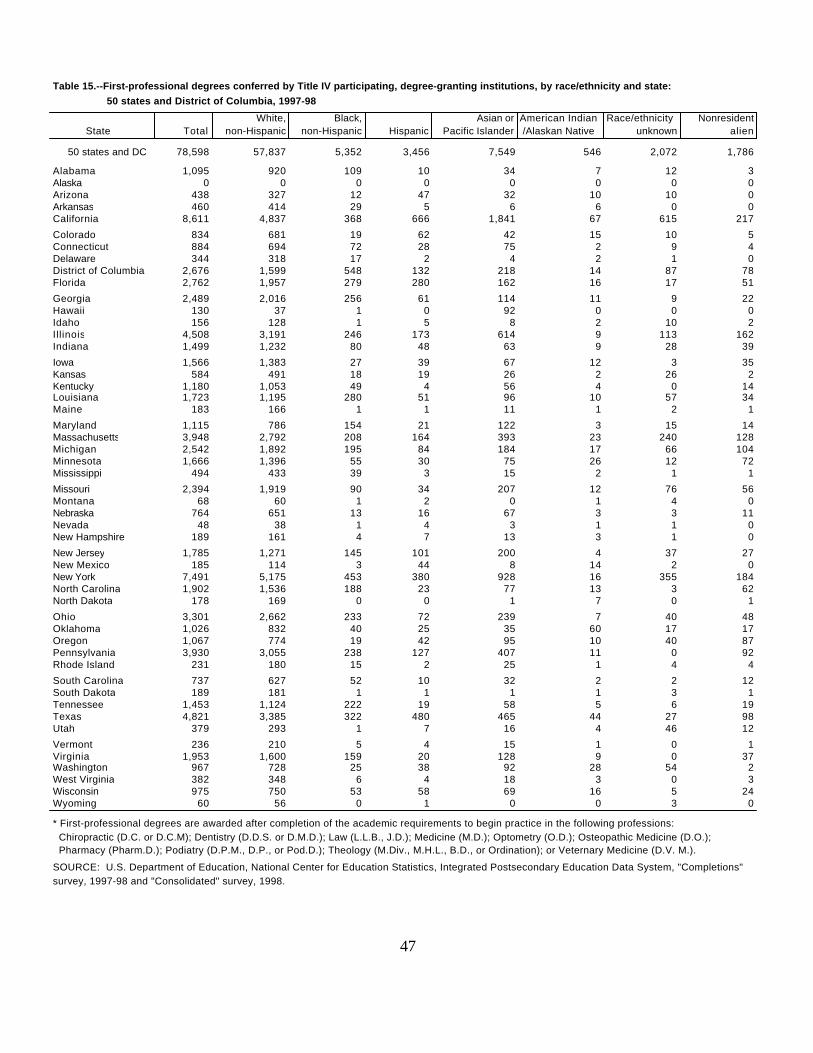
Table 15.--First-professional degrees conferred by Title IV participating, degree-granting institutions, by race/ethnicity and state: 50 states and District of Columbia, 1997-98
White, Black, Asian or American Indian Race/ethnicity Nonresident State Total non-Hispanic non-Hispanic Hispanic Pacific Islander /Alaskan Native unknown alien
50 states and DC 78,598 57,837 5,352 3,456 7,549 546 2,072 1,786
Alabama 1,095 920 109 10 34 7 12 3Alaska 0 0 0 0 0 0 0 0Arizona 438 327 12 47 32 10 10 0Arkansas 460 414 29 5 6 6 0 0California 8,611 4,837 368 666 1,841 67 615 217
Colorado 834 681 19 62 42 15 10 5Connecticut 884 694 72 28 75 2 9 4Delaware 344 318 17 2 4 2 1 0District of Columbia 2,676 1,599 548 132 218 14 87 78Florida 2,762 1,957 279 280 162 16 17 51
Georgia 2,489 2,016 256 61 114 11 9 22Hawaii 130 37 1 0 92 0 0 0Idaho 156 128 1 5 8 2 10 2Illinois 4,508 3,191 246 173 614 9 113 162Indiana 1,499 1,232 80 48 63 9 28 39
Iowa 1,566 1,383 27 39 67 12 3 35Kansas 584 491 18 19 26 2 26 2Kentucky 1,180 1,053 49 4 56 4 0 14Louisiana 1,723 1,195 280 51 96 10 57 34Maine 183 166 1 1 11 1 2 1
Maryland 1,115 786 154 21 122 3 15 14Massachusetts 3,948 2,792 208 164 393 23 240 128Michigan 2,542 1,892 195 84 184 17 66 104Minnesota 1,666 1,396 55 30 75 26 12 72Mississippi 494 433 39 3 15 2 1 1
Missouri 2,394 1,919 90 34 207 12 76 56Montana 68 60 1 2 0 1 4 0Nebraska 764 651 13 16 67 3 3 11Nevada 48 38 1 4 3 1 1 0New Hampshire 189 161 4 7 13 3 1 0
New Jersey 1,785 1,271 145 101 200 4 37 27New Mexico 185 114 3 44 8 14 2 0New York 7,491 5,175 453 380 928 16 355 184North Carolina 1,902 1,536 188 23 77 13 3 62North Dakota 178 169 0 0 1 7 0 1
Ohio 3,301 2,662 233 72 239 7 40 48Oklahoma 1,026 832 40 25 35 60 17 17Oregon 1,067 774 19 42 95 10 40 87Pennsylvania 3,930 3,055 238 127 407 11 0 92Rhode Island 231 180 15 2 25 1 4 4
South Carolina 737 627 52 10 32 2 2 12South Dakota 189 181 1 1 1 1 3 1Tennessee 1,453 1,124 222 19 58 5 6 19Texas 4,821 3,385 322 480 465 44 27 98Utah 379 293 1 7 16 4 46 12
Vermont 236 210 5 4 15 1 0 1Virginia 1,953 1,600 159 20 128 9 0 37Washington 967 728 25 38 92 28 54 2West Virginia 382 348 6 4 18 3 0 3Wisconsin 975 750 53 58 69 16 5 24Wyoming 60 56 0 1 0 0 3 0
* First-professional degrees are awarded after completion of the academic requirements to begin practice in the following professions: Chiropractic (D.C. or D.C.M); Dentistry (D.D.S. or D.M.D.); Law (L.L.B., J.D.); Medicine (M.D.); Optometry (O.D.); Osteopathic Medicine (D.O.); Pharmacy (Pharm.D.); Podiatry (D.P.M., D.P., or Pod.D.); Theology (M.Div., M.H.L., B.D., or Ordination); or Veternary Medicine (D.V. M.).
SOURCE: U.S. Department of Education, National Center for Education Statistics, Integrated Postsecondary Education Data System, "Completions"survey, 1997-98 and "Consolidated" survey, 1998.
47
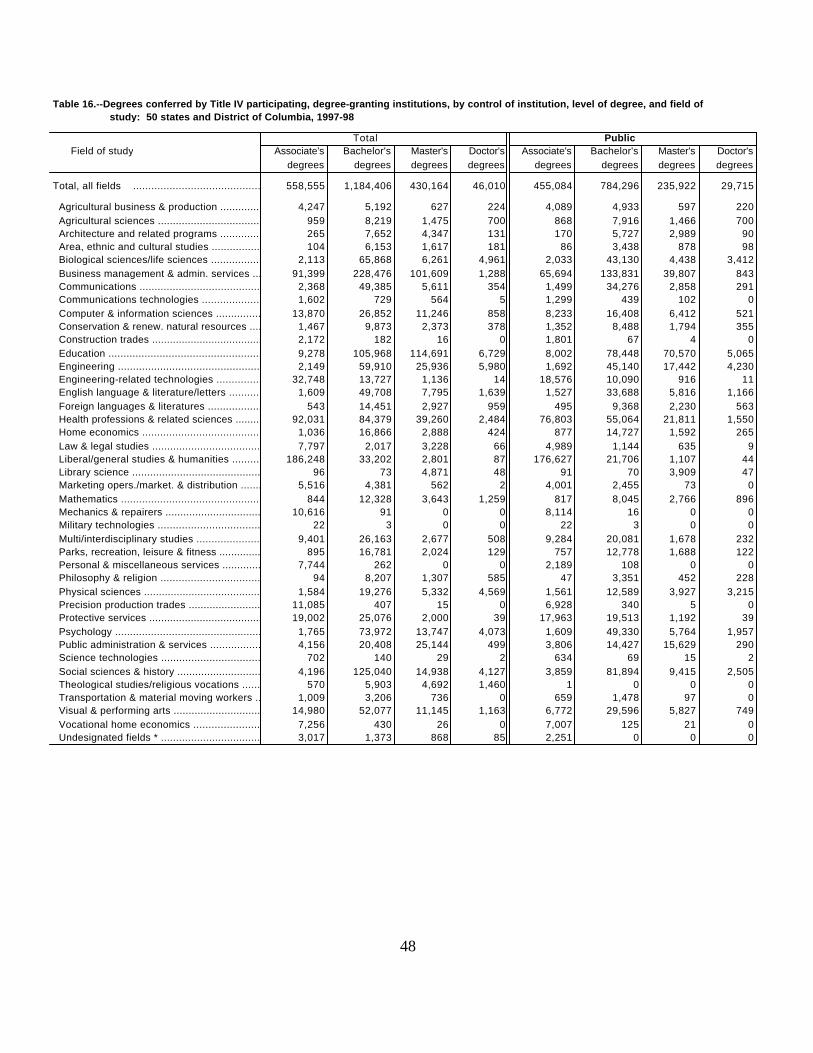
Table 16.--Degrees conferred by Title IV participating, degree-granting institutions, by control of institution, level of degree, and field of study: 50 states and District of Columbia, 1997-98
Total Public Field of study Associate's Bachelor's Master's Doctor's Associate's Bachelor's Master's Doctor's
degrees degrees degrees degrees degrees degrees degrees degrees
Total, all fields ........................................................558,555 1,184,406 430,164 46,010 455,084 784,296 235,922 29,715
Agricultural business & production ...............................4,247 5,192 627 224 4,089 4,933 597 220 Agricultural sciences ...................................................959 8,219 1,475 700 868 7,916 1,466 700 Architecture and related programs ..................................265 7,652 4,347 131 170 5,727 2,989 90 Area, ethnic and cultural studies ........................................104 6,153 1,617 181 86 3,438 878 98 Biological sciences/life sciences .....................................2,113 65,868 6,261 4,961 2,033 43,130 4,438 3,412 Business management & admin. services ...........................91,399 228,476 101,609 1,288 65,694 133,831 39,807 843 Communications ..............................................................2,368 49,385 5,611 354 1,499 34,276 2,858 291 Communications technologies ............................................1,602 729 564 5 1,299 439 102 0 Computer & information sciences .....................................13,870 26,852 11,246 858 8,233 16,408 6,412 521 Conservation & renew. natural resources ...........................1,467 9,873 2,373 378 1,352 8,488 1,794 355 Construction trades ........................................................2,172 182 16 0 1,801 67 4 0 Education .......................................................................9,278 105,968 114,691 6,729 8,002 78,448 70,570 5,065 Engineering ...................................................................2,149 59,910 25,936 5,980 1,692 45,140 17,442 4,230 Engineering-related technologies .......................................32,748 13,727 1,136 14 18,576 10,090 916 11 English language & literature/letters ...................................1,609 49,708 7,795 1,639 1,527 33,688 5,816 1,166 Foreign languages & literatures ......................................543 14,451 2,927 959 495 9,368 2,230 563 Health professions & related sciences .............................92,031 84,379 39,260 2,484 76,803 55,064 21,811 1,550 Home economics ...........................................................1,036 16,866 2,888 424 877 14,727 1,592 265 Law & legal studies ..........................................................7,797 2,017 3,228 66 4,989 1,144 635 9 Liberal/general studies & humanities ..............................186,248 33,202 2,801 87 176,627 21,706 1,107 44 Library science ......................................................... 96 73 4,871 48 91 70 3,909 47 Marketing opers./market. & distribution ..........................5,516 4,381 562 2 4,001 2,455 73 0 Mathematics ....................................................................844 12,328 3,643 1,259 817 8,045 2,766 896 Mechanics & repairers ......................................................10,616 91 0 0 8,114 16 0 0 Military technologies ........................................................22 3 0 0 22 3 0 0 Multi/interdisciplinary studies ...........................................9,401 26,163 2,677 508 9,284 20,081 1,678 232 Parks, recreation, leisure & fitness ...................................895 16,781 2,024 129 757 12,778 1,688 122 Personal & miscellaneous services .................................7,744 262 0 0 2,189 108 0 0 Philosophy & religion ......................................................94 8,207 1,307 585 47 3,351 452 228 Physical sciences ............................................................1,584 19,276 5,332 4,569 1,561 12,589 3,927 3,215 Precision production trades ...............................................11,085 407 15 0 6,928 340 5 0 Protective services ........................................................19,002 25,076 2,000 39 17,963 19,513 1,192 39 Psychology ..................................................................1,765 73,972 13,747 4,073 1,609 49,330 5,764 1,957 Public administration & services ........................................4,156 20,408 25,144 499 3,806 14,427 15,629 290 Science technologies .....................................................702 140 29 2 634 69 15 2 Social sciences & history ................................................4,196 125,040 14,938 4,127 3,859 81,894 9,415 2,505 Theological studies/religious vocations ................................570 5,903 4,692 1,460 1 0 0 0 Transportation & material moving workers ...........................1,009 3,206 736 0 659 1,478 97 0 Visual & performing arts .................................................14,980 52,077 11,145 1,163 6,772 29,596 5,827 749 Vocational home economics ..............................................7,256 430 26 0 7,007 125 21 0 Undesignated fields * .........................................................3,017 1,373 868 85 2,251 0 0 0
48
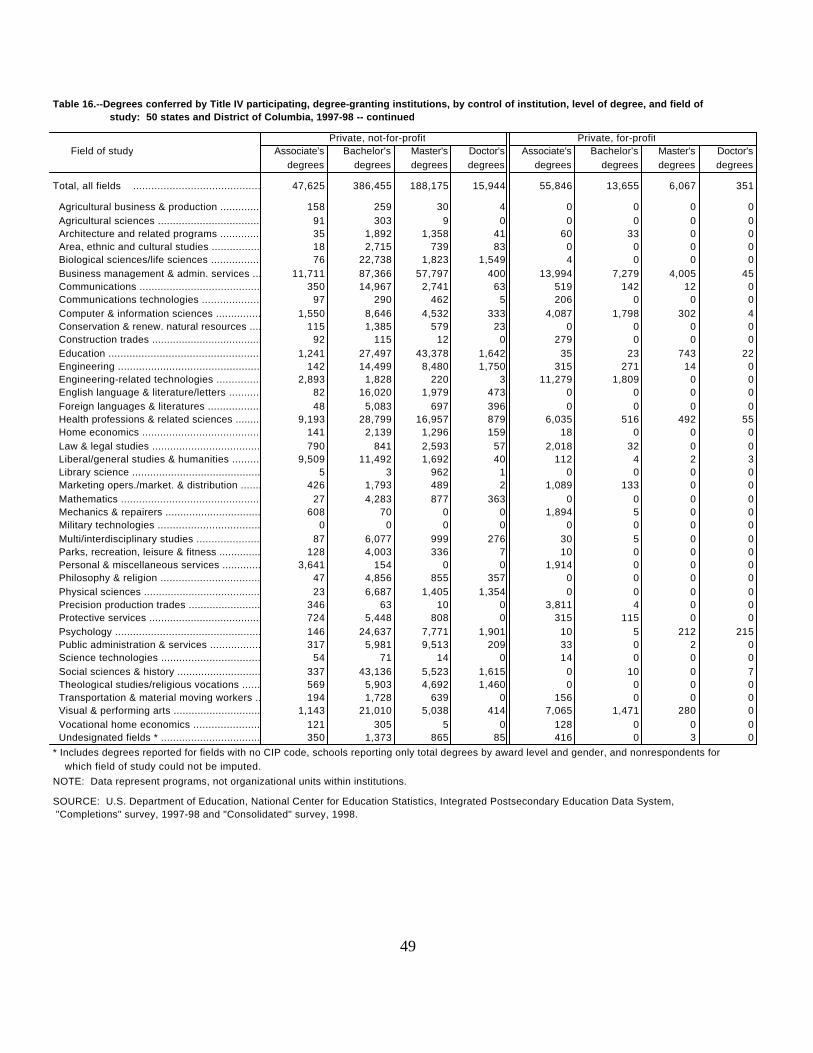
Table 16.--Degrees conferred by Title IV participating, degree-granting institutions, by control of institution, level of degree, and field of study: 50 states and District of Columbia, 1997-98 -- continued
Private, not-for-profit Private, for-profit Field of study Associate's Bachelor's Master's Doctor's Associate's Bachelor's Master's Doctor's
degrees degrees degrees degrees degrees degrees degrees degrees
Total, all fields ........................................................47,625 386,455 188,175 15,944 55,846 13,655 6,067 351
Agricultural business & production ...............................158 259 30 4 0 0 0 0 Agricultural sciences ................................................... 91 303 9 0 0 0 0 0 Architecture and related programs ..................................35 1,892 1,358 41 60 33 0 0 Area, ethnic and cultural studies ........................................18 2,715 739 83 0 0 0 0 Biological sciences/life sciences .....................................76 22,738 1,823 1,549 4 0 0 0 Business management & admin. services ...........................11,711 87,366 57,797 400 13,994 7,279 4,005 45 Communications ..............................................................350 14,967 2,741 63 519 142 12 0 Communications technologies ............................................97 290 462 5 206 0 0 0 Computer & information sciences .....................................1,550 8,646 4,532 333 4,087 1,798 302 4 Conservation & renew. natural resources ...........................115 1,385 579 23 0 0 0 0 Construction trades ........................................................92 115 12 0 279 0 0 0 Education .......................................................................1,241 27,497 43,378 1,642 35 23 743 22 Engineering ...................................................................142 14,499 8,480 1,750 315 271 14 0 Engineering-related technologies .......................................2,893 1,828 220 3 11,279 1,809 0 0 English language & literature/letters ...................................82 16,020 1,979 473 0 0 0 0 Foreign languages & literatures ......................................48 5,083 697 396 0 0 0 0 Health professions & related sciences .............................9,193 28,799 16,957 879 6,035 516 492 55 Home economics ...........................................................141 2,139 1,296 159 18 0 0 0 Law & legal studies ..........................................................790 841 2,593 57 2,018 32 0 0 Liberal/general studies & humanities ..............................9,509 11,492 1,692 40 112 4 2 3 Library science ......................................................... 5 3 962 1 0 0 0 0 Marketing opers./market. & distribution ..........................426 1,793 489 2 1,089 133 0 0 Mathematics ....................................................................27 4,283 877 363 0 0 0 0 Mechanics & repairers ......................................................608 70 0 0 1,894 5 0 0 Military technologies ........................................................0 0 0 0 0 0 0 0 Multi/interdisciplinary studies ...........................................87 6,077 999 276 30 5 0 0 Parks, recreation, leisure & fitness ...................................128 4,003 336 7 10 0 0 0 Personal & miscellaneous services .................................3,641 154 0 0 1,914 0 0 0 Philosophy & religion ......................................................47 4,856 855 357 0 0 0 0 Physical sciences ............................................................23 6,687 1,405 1,354 0 0 0 0 Precision production trades ...............................................346 63 10 0 3,811 4 0 0 Protective services ........................................................724 5,448 808 0 315 115 0 0 Psychology ..................................................................146 24,637 7,771 1,901 10 5 212 215 Public administration & services ........................................317 5,981 9,513 209 33 0 2 0 Science technologies .....................................................54 71 14 0 14 0 0 0 Social sciences & history ................................................337 43,136 5,523 1,615 0 10 0 7 Theological studies/religious vocations ................................569 5,903 4,692 1,460 0 0 0 0 Transportation & material moving workers ...........................194 1,728 639 0 156 0 0 0 Visual & performing arts .................................................1,143 21,010 5,038 414 7,065 1,471 280 0 Vocational home economics ..............................................121 305 5 0 128 0 0 0 Undesignated fields * .........................................................350 1,373 865 85 416 0 3 0* Includes degrees reported for fields with no CIP code, schools reporting only total degrees by award level and gender, and nonrespondents for which field of study could not be imputed.NOTE: Data represent programs, not organizational units within institutions.
SOURCE: U.S. Department of Education, National Center for Education Statistics, Integrated Postsecondary Education Data System, "Completions" survey, 1997-98 and "Consolidated" survey, 1998.
49
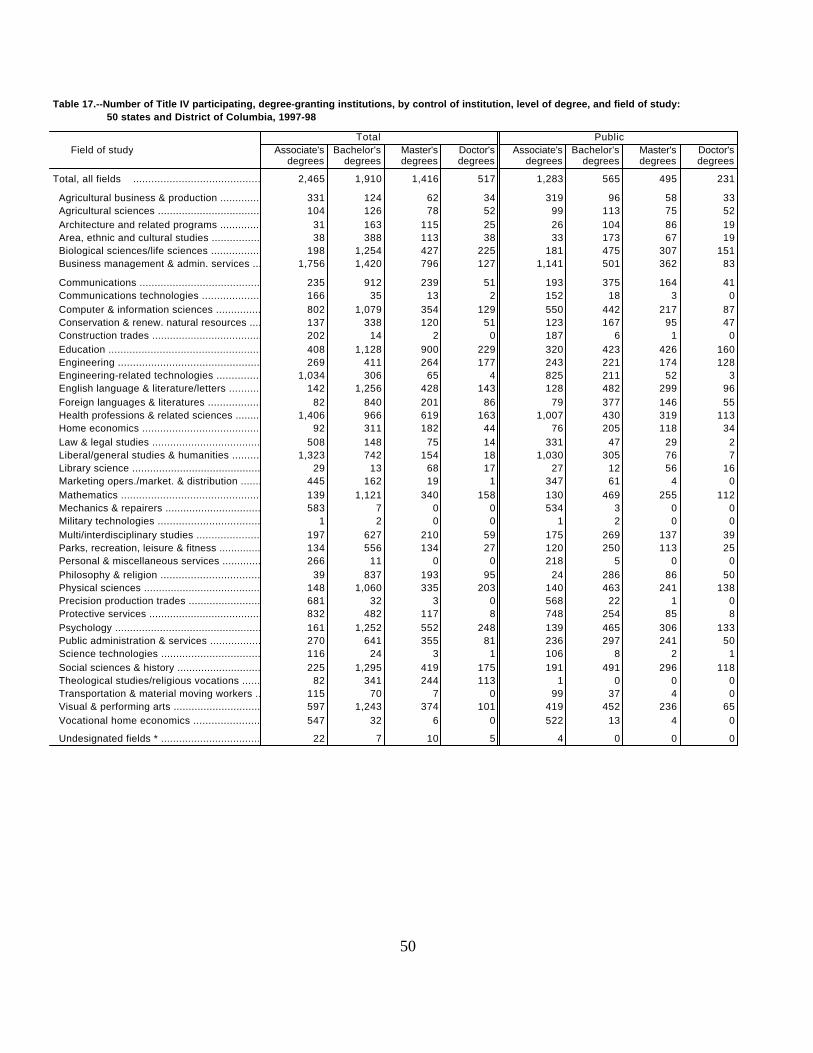
Table 17.--Number of Title IV participating, degree-granting institutions, by control of institution, level of degree, and field of study: 50 states and District of Columbia, 1997-98
Total Public Field of study Associate's Bachelor's Master's Doctor's Associate's Bachelor's Master's Doctor's
degrees degrees degrees degrees degrees degrees degrees degrees
Total, all fields ........................................................2,465 1,910 1,416 517 1,283 565 495 231
Agricultural business & production ...............................331 124 62 34 319 96 58 33 Agricultural sciences ...................................................104 126 78 52 99 113 75 52 Architecture and related programs ..................................31 163 115 25 26 104 86 19 Area, ethnic and cultural studies ........................................38 388 113 38 33 173 67 19 Biological sciences/life sciences .....................................198 1,254 427 225 181 475 307 151 Business management & admin. services ...........................1,756 1,420 796 127 1,141 501 362 83
Communications ..............................................................235 912 239 51 193 375 164 41 Communications technologies ............................................166 35 13 2 152 18 3 0 Computer & information sciences .....................................802 1,079 354 129 550 442 217 87 Conservation & renew. natural resources ...........................137 338 120 51 123 167 95 47 Construction trades ........................................................202 14 2 0 187 6 1 0 Education .......................................................................408 1,128 900 229 320 423 426 160 Engineering ...................................................................269 411 264 177 243 221 174 128 Engineering-related technologies .......................................1,034 306 65 4 825 211 52 3 English language & literature/letters ...................................142 1,256 428 143 128 482 299 96 Foreign languages & literatures ......................................82 840 201 86 79 377 146 55 Health professions & related sciences .............................1,406 966 619 163 1,007 430 319 113 Home economics ...........................................................92 311 182 44 76 205 118 34 Law & legal studies ..........................................................508 148 75 14 331 47 29 2 Liberal/general studies & humanities ..............................1,323 742 154 18 1,030 305 76 7 Library science ......................................................... 29 13 68 17 27 12 56 16 Marketing opers./market. & distribution ..........................445 162 19 1 347 61 4 0 Mathematics ....................................................................139 1,121 340 158 130 469 255 112 Mechanics & repairers ......................................................583 7 0 0 534 3 0 0 Military technologies ........................................................1 2 0 0 1 2 0 0 Multi/interdisciplinary studies ...........................................197 627 210 59 175 269 137 39 Parks, recreation, leisure & fitness ...................................134 556 134 27 120 250 113 25 Personal & miscellaneous services .................................266 11 0 0 218 5 0 0 Philosophy & religion ......................................................39 837 193 95 24 286 86 50 Physical sciences ............................................................148 1,060 335 203 140 463 241 138 Precision production trades ...............................................681 32 3 0 568 22 1 0 Protective services ........................................................832 482 117 8 748 254 85 8 Psychology ..................................................................161 1,252 552 248 139 465 306 133 Public administration & services ........................................270 641 355 81 236 297 241 50 Science technologies .....................................................116 24 3 1 106 8 2 1 Social sciences & history ................................................225 1,295 419 175 191 491 296 118 Theological studies/religious vocations ................................82 341 244 113 1 0 0 0 Transportation & material moving workers ...........................115 70 7 0 99 37 4 0 Visual & performing arts .................................................597 1,243 374 101 419 452 236 65 Vocational home economics ..............................................547 32 6 0 522 13 4 0
Undesignated fields * .........................................................22 7 10 5 4 0 0 0
50
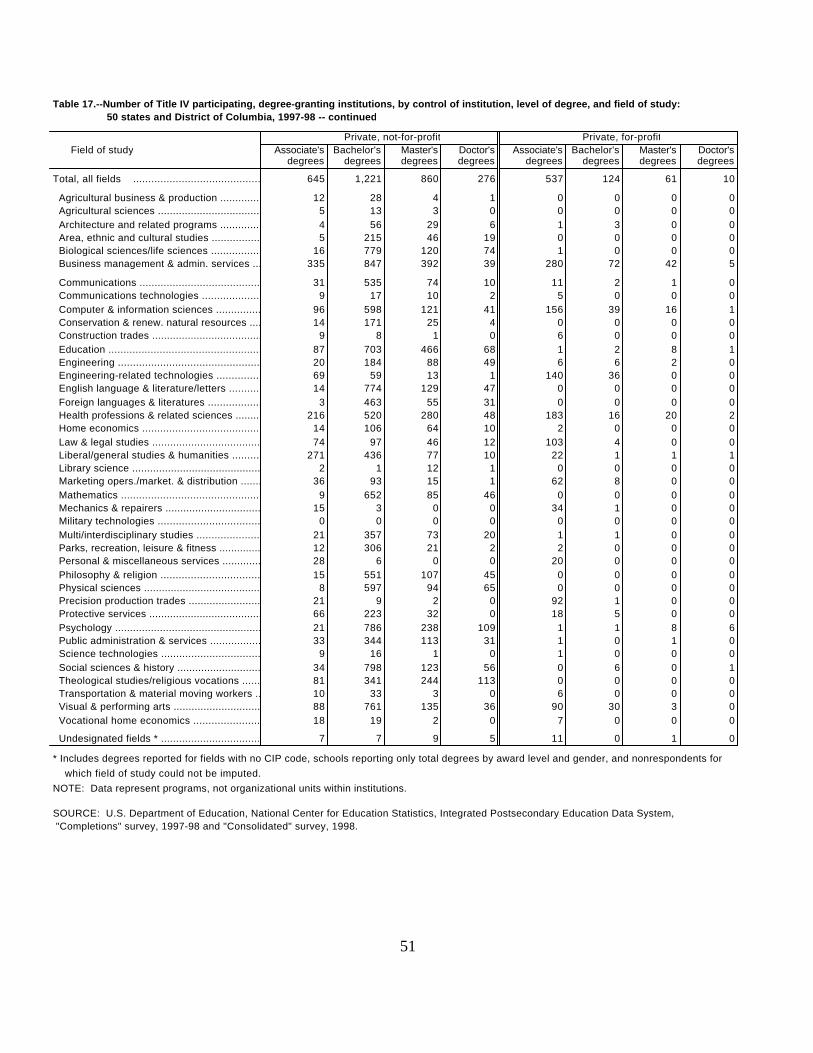
Table 17.--Number of Title IV participating, degree-granting institutions, by control of institution, level of degree, and field of study: 50 states and District of Columbia, 1997-98 -- continued
Private, not-for-profit Private, for-profit Field of study Associate's Bachelor's Master's Doctor's Associate's Bachelor's Master's Doctor's
degrees degrees degrees degrees degrees degrees degrees degrees
Total, all fields ........................................................ 645 1,221 860 276 537 124 61 10
Agricultural business & production ...............................12 28 4 1 0 0 0 0 Agricultural sciences ................................................... 5 13 3 0 0 0 0 0 Architecture and related programs ..................................4 56 29 6 1 3 0 0 Area, ethnic and cultural studies ........................................5 215 46 19 0 0 0 0 Biological sciences/life sciences .....................................16 779 120 74 1 0 0 0 Business management & admin. services ...........................335 847 392 39 280 72 42 5
Communications ..............................................................31 535 74 10 11 2 1 0 Communications technologies ............................................9 17 10 2 5 0 0 0 Computer & information sciences .....................................96 598 121 41 156 39 16 1 Conservation & renew. natural resources ...........................14 171 25 4 0 0 0 0 Construction trades ........................................................9 8 1 0 6 0 0 0 Education .......................................................................87 703 466 68 1 2 8 1 Engineering ...................................................................20 184 88 49 6 6 2 0 Engineering-related technologies .......................................69 59 13 1 140 36 0 0 English language & literature/letters ...................................14 774 129 47 0 0 0 0 Foreign languages & literatures ......................................3 463 55 31 0 0 0 0 Health professions & related sciences .............................216 520 280 48 183 16 20 2 Home economics ...........................................................14 106 64 10 2 0 0 0 Law & legal studies ..........................................................74 97 46 12 103 4 0 0 Liberal/general studies & humanities ..............................271 436 77 10 22 1 1 1 Library science ......................................................... 2 1 12 1 0 0 0 0 Marketing opers./market. & distribution ..........................36 93 15 1 62 8 0 0 Mathematics ....................................................................9 652 85 46 0 0 0 0 Mechanics & repairers ......................................................15 3 0 0 34 1 0 0 Military technologies ........................................................0 0 0 0 0 0 0 0 Multi/interdisciplinary studies ...........................................21 357 73 20 1 1 0 0 Parks, recreation, leisure & fitness ...................................12 306 21 2 2 0 0 0 Personal & miscellaneous services .................................28 6 0 0 20 0 0 0 Philosophy & religion ......................................................15 551 107 45 0 0 0 0 Physical sciences ............................................................8 597 94 65 0 0 0 0 Precision production trades ...............................................21 9 2 0 92 1 0 0 Protective services ........................................................66 223 32 0 18 5 0 0 Psychology ..................................................................21 786 238 109 1 1 8 6 Public administration & services ........................................33 344 113 31 1 0 1 0 Science technologies .....................................................9 16 1 0 1 0 0 0 Social sciences & history ................................................34 798 123 56 0 6 0 1 Theological studies/religious vocations ................................81 341 244 113 0 0 0 0 Transportation & material moving workers ...........................10 33 3 0 6 0 0 0 Visual & performing arts .................................................88 761 135 36 90 30 3 0 Vocational home economics ..............................................18 19 2 0 7 0 0 0
Undesignated fields * .........................................................7 7 9 5 11 0 1 0
* Includes degrees reported for fields with no CIP code, schools reporting only total degrees by award level and gender, and nonrespondents for which field of study could not be imputed.NOTE: Data represent programs, not organizational units within institutions.
SOURCE: U.S. Department of Education, National Center for Education Statistics, Integrated Postsecondary Education Data System, "Completions" survey, 1997-98 and "Consolidated" survey, 1998.
51
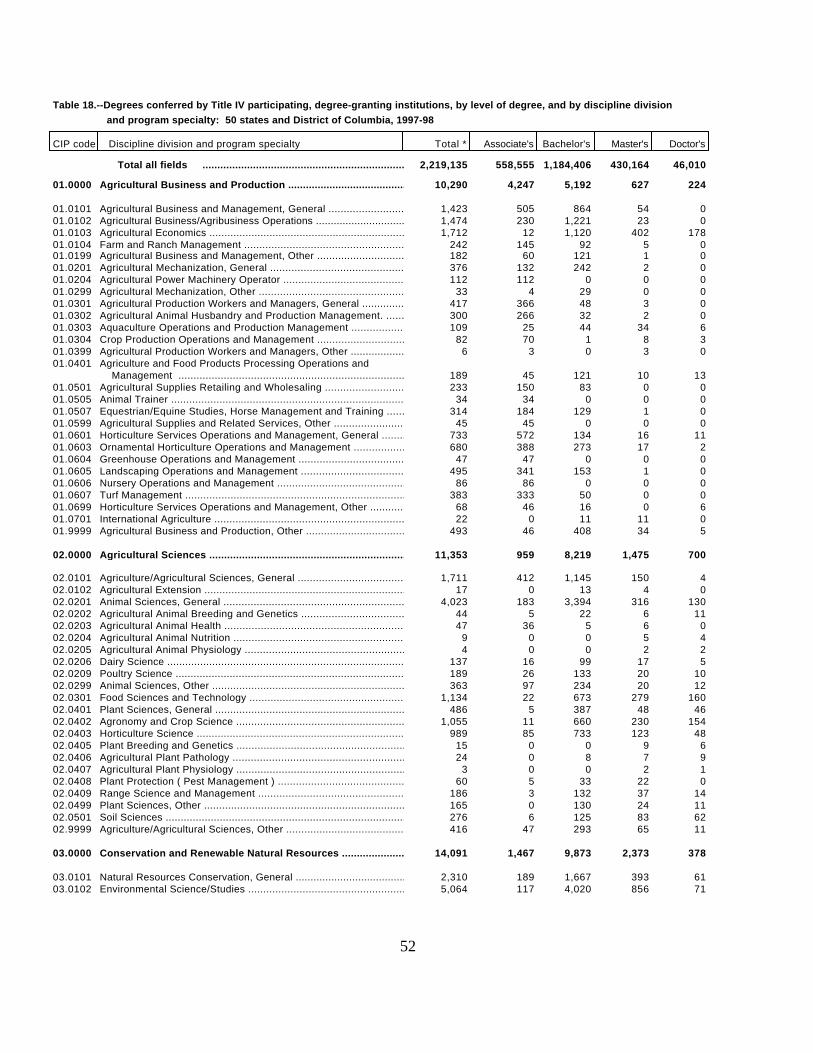
Table 18.--Degrees conferred by Title IV participating, degree-granting institutions, by level of degree, and by discipline division and program specialty: 50 states and District of Columbia, 1997-98
CIP code Discipline division and program specialty Total * Associate's Bachelor's Master's Doctor's
Total all fields .......................................................................................................2,219,135 558,555 1,184,406 430,164 46,010
01.0000 Agricultural Business and Production ...............................................................10,290 4,247 5,192 627 224
01.0101 Agricultural Business and Management, General ......................................................1,423 505 864 54 001.0102 Agricultural Business/Agribusiness Operations ......................................................1,474 230 1,221 23 001.0103 Agricultural Economics .............................................................................1,712 12 1,120 402 17801.0104 Farm and Ranch Management ..........................................................................242 145 92 5 001.0199 Agricultural Business and Management, Other ........................................................182 60 121 1 001.0201 Agricultural Mechanization, General ................................................................376 132 242 2 001.0204 Agricultural Power Machinery Operator ..............................................................112 112 0 0 001.0299 Agricultural Mechanization, Other ..................................................................33 4 29 0 001.0301 Agricultural Production Workers and Managers, General ..............................................417 366 48 3 001.0302 Agricultural Animal Husbandry and Production Management. ...........................................300 266 32 2 001.0303 Aquaculture Operations and Production Management ...................................................109 25 44 34 601.0304 Crop Production Operations and Management ..........................................................82 70 1 8 301.0399 Agricultural Production Workers and Managers, Other ................................................6 3 0 3 001.0401 Agriculture and Food Products Processing Operations and
Management .................................................................................... 189 45 121 10 1301.0501 Agricultural Supplies Retailing and Wholesaling ....................................................233 150 83 0 001.0505 Animal Trainer ..................................................................................... 34 34 0 0 001.0507 Equestrian/Equine Studies, Horse Management and Training ...........................................314 184 129 1 001.0599 Agricultural Supplies and Related Services, Other ..................................................45 45 0 0 001.0601 Horticulture Services Operations and Management, General ...........................................733 572 134 16 1101.0603 Ornamental Horticulture Operations and Management ..................................................680 388 273 17 201.0604 Greenhouse Operations and Management ...............................................................47 47 0 0 001.0605 Landscaping Operations and Management ..............................................................495 341 153 1 001.0606 Nursery Operations and Management ..................................................................86 86 0 0 001.0607 Turf Management .................................................................................... 383 333 50 0 001.0699 Horticulture Services Operations and Management, Other .............................................68 46 16 0 601.0701 International Agriculture .......................................................................... 22 0 11 11 001.9999 Agricultural Business and Production, Other ........................................................493 46 408 34 5
02.0000 Agricultural Sciences ..............................................................................11,353 959 8,219 1,475 700
02.0101 Agriculture/Agricultural Sciences, General .........................................................1,711 412 1,145 150 402.0102 Agricultural Extension ............................................................................. 17 0 13 4 002.0201 Animal Sciences, General ...........................................................................4,023 183 3,394 316 13002.0202 Agricultural Animal Breeding and Genetics ..........................................................44 5 22 6 1102.0203 Agricultural Animal Health ......................................................................... 47 36 5 6 002.0204 Agricultural Animal Nutrition ...................................................................... 9 0 0 5 402.0205 Agricultural Animal Physiology ..................................................................... 4 0 0 2 202.0206 Dairy Science ...................................................................................... 137 16 99 17 502.0209 Poultry Science .................................................................................... 189 26 133 20 1002.0299 Animal Sciences, Other ............................................................................. 363 97 234 20 1202.0301 Food Sciences and Technology .......................................................................1,134 22 673 279 16002.0401 Plant Sciences, General ............................................................................ 486 5 387 48 4602.0402 Agronomy and Crop Science ..........................................................................1,055 11 660 230 15402.0403 Horticulture Science ............................................................................... 989 85 733 123 4802.0405 Plant Breeding and Genetics ........................................................................ 15 0 0 9 602.0406 Agricultural Plant Pathology ....................................................................... 24 0 8 7 902.0407 Agricultural Plant Physiology ...................................................................... 3 0 0 2 102.0408 Plant Protection ( Pest Management ) ...............................................................60 5 33 22 002.0409 Range Science and Management .......................................................................186 3 132 37 1402.0499 Plant Sciences, Other .............................................................................. 165 0 130 24 1102.0501 Soil Sciences ...................................................................................... 276 6 125 83 6202.9999 Agriculture/Agricultural Sciences, Other ...........................................................416 47 293 65 11
03.0000 Conservation and Renewable Natural Resources .......................................................14,091 1,467 9,873 2,373 378
03.0101 Natural Resources Conservation, General ............................................................2,310 189 1,667 393 6103.0102 Environmental Science/Studies ......................................................................5,064 117 4,020 856 71
52
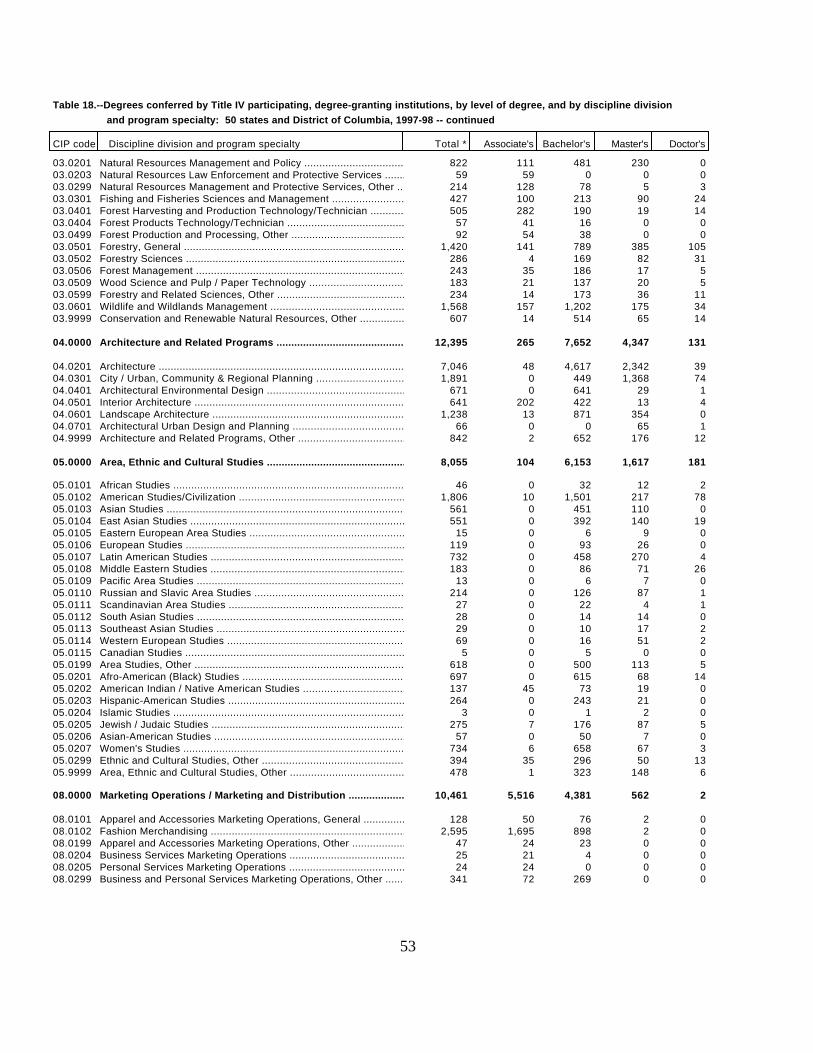
Table 18.--Degrees conferred by Title IV participating, degree-granting institutions, by level of degree, and by discipline division and program specialty: 50 states and District of Columbia, 1997-98 -- continued
CIP code Discipline division and program specialty Total * Associate's Bachelor's Master's Doctor's
03.0201 Natural Resources Management and Policy ............................................................822 111 481 230 003.0203 Natural Resources Law Enforcement and Protective Services ..........................................59 59 0 0 003.0299 Natural Resources Management and Protective Services, Other ........................................214 128 78 5 303.0301 Fishing and Fisheries Sciences and Management ......................................................427 100 213 90 2403.0401 Forest Harvesting and Production Technology/Technician .............................................505 282 190 19 1403.0404 Forest Products Technology/Technician ..............................................................57 41 16 0 003.0499 Forest Production and Processing, Other ............................................................92 54 38 0 003.0501 Forestry, General .................................................................................. 1,420 141 789 385 10503.0502 Forestry Sciences .................................................................................. 286 4 169 82 3103.0506 Forest Management .................................................................................. 243 35 186 17 503.0509 Wood Science and Pulp / Paper Technology ...........................................................183 21 137 20 503.0599 Forestry and Related Sciences, Other ...............................................................234 14 173 36 1103.0601 Wildlife and Wildlands Management ..................................................................1,568 157 1,202 175 3403.9999 Conservation and Renewable Natural Resources, Other ................................................607 14 514 65 14
04.0000 Architecture and Related Programs ..................................................................12,395 265 7,652 4,347 131
04.0201 Architecture ....................................................................................... 7,046 48 4,617 2,342 3904.0301 City / Urban, Community & Regional Planning ........................................................1,891 0 449 1,368 7404.0401 Architectural Environmental Design .................................................................671 0 641 29 104.0501 Interior Architecture .............................................................................. 641 202 422 13 404.0601 Landscape Architecture .............................................................................1,238 13 871 354 004.0701 Architectural Urban Design and Planning ............................................................66 0 0 65 104.9999 Architecture and Related Programs, Other ...........................................................842 2 652 176 12
05.0000 Area, Ethnic and Cultural Studies ..................................................................8,055 104 6,153 1,617 181
05.0101 African Studies .................................................................................... 46 0 32 12 205.0102 American Studies/Civilization ......................................................................1,806 10 1,501 217 7805.0103 Asian Studies ...................................................................................... 561 0 451 110 005.0104 East Asian Studies ................................................................................. 551 0 392 140 1905.0105 Eastern European Area Studies ......................................................................15 0 6 9 005.0106 European Studies ................................................................................... 119 0 93 26 005.0107 Latin American Studies ............................................................................. 732 0 458 270 405.0108 Middle Eastern Studies ............................................................................. 183 0 86 71 2605.0109 Pacific Area Studies ............................................................................... 13 0 6 7 005.0110 Russian and Slavic Area Studies ....................................................................214 0 126 87 105.0111 Scandinavian Area Studies .......................................................................... 27 0 22 4 105.0112 South Asian Studies ................................................................................ 28 0 14 14 005.0113 Southeast Asian Studies ............................................................................ 29 0 10 17 205.0114 Western European Studies ........................................................................... 69 0 16 51 205.0115 Canadian Studies ................................................................................... 5 0 5 0 005.0199 Area Studies, Other ................................................................................ 618 0 500 113 505.0201 Afro-American (Black) Studies ......................................................................697 0 615 68 1405.0202 American Indian / Native American Studies ..........................................................137 45 73 19 005.0203 Hispanic-American Studies ..........................................................................264 0 243 21 005.0204 Islamic Studies .................................................................................... 3 0 1 2 005.0205 Jewish / Judaic Studies ............................................................................ 275 7 176 87 505.0206 Asian-American Studies ............................................................................. 57 0 50 7 005.0207 Women's Studies .................................................................................... 734 6 658 67 305.0299 Ethnic and Cultural Studies, Other .................................................................394 35 296 50 1305.9999 Area, Ethnic and Cultural Studies, Other ...........................................................478 1 323 148 6
08.0000 Marketing Operations / Marketing and Distribution ..................................................10,461 5,516 4,381 562 2
08.0101 Apparel and Accessories Marketing Operations, General ..............................................128 50 76 2 008.0102 Fashion Merchandising ..............................................................................2,595 1,695 898 2 008.0199 Apparel and Accessories Marketing Operations, Other ................................................47 24 23 0 008.0204 Business Services Marketing Operations .............................................................25 21 4 0 008.0205 Personal Services Marketing Operations .......................................... 24 24 0 0 008.0299 Business and Personal Services Marketing Operations, Other .........................................341 72 269 0 0
53
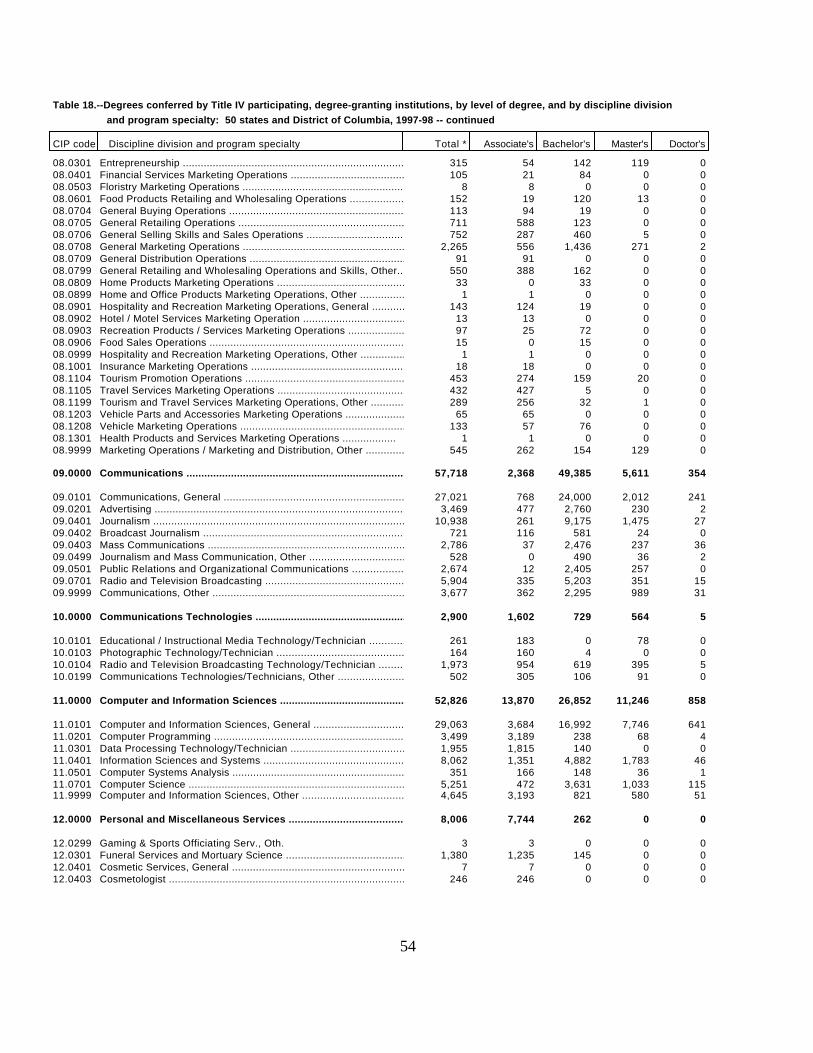
Table 18.--Degrees conferred by Title IV participating, degree-granting institutions, by level of degree, and by discipline division and program specialty: 50 states and District of Columbia, 1997-98 -- continued
CIP code Discipline division and program specialty Total * Associate's Bachelor's Master's Doctor's
08.0301 Entrepreneurship ................................................................................... 315 54 142 119 008.0401 Financial Services Marketing Operations ............................................................105 21 84 0 008.0503 Floristry Marketing Operations ..................................................................... 8 8 0 0 008.0601 Food Products Retailing and Wholesaling Operations .................................................152 19 120 13 008.0704 General Buying Operations ..........................................................................113 94 19 0 008.0705 General Retailing Operations .......................................................................711 588 123 0 008.0706 General Selling Skills and Sales Operations ........................................................752 287 460 5 008.0708 General Marketing Operations .......................................................................2,265 556 1,436 271 208.0709 General Distribution Operations .................................................................... 91 91 0 0 008.0799 General Retailing and Wholesaling Operations and Skills, Other......................................550 388 162 0 008.0809 Home Products Marketing Operations .................................................................33 0 33 0 008.0899 Home and Office Products Marketing Operations, Other ...............................................1 1 0 0 008.0901 Hospitality and Recreation Marketing Operations, General ...........................................143 124 19 0 008.0902 Hotel / Motel Services Marketing Operation .........................................................13 13 0 0 008.0903 Recreation Products / Services Marketing Operations ................................................97 25 72 0 008.0906 Food Sales Operations .............................................................................. 15 0 15 0 008.0999 Hospitality and Recreation Marketing Operations, Other .............................................1 1 0 0 008.1001 Insurance Marketing Operations .....................................................................18 18 0 0 008.1104 Tourism Promotion Operations .......................................................................453 274 159 20 008.1105 Travel Services Marketing Operations ...............................................................432 427 5 0 008.1199 Tourism and Travel Services Marketing Operations, Other ............................................289 256 32 1 008.1203 Vehicle Parts and Accessories Marketing Operations .................................................65 65 0 0 008.1208 Vehicle Marketing Operations .......................................................................133 57 76 0 008.1301 Health Products and Services Marketing Operations .................. 1 1 0 0 008.9999 Marketing Operations / Marketing and Distribution, Other ...........................................545 262 154 129 0
09.0000 Communications .....................................................................................57,718 2,368 49,385 5,611 354
09.0101 Communications, General ............................................................................27,021 768 24,000 2,012 24109.0201 Advertising ........................................................................................ 3,469 477 2,760 230 209.0401 Journalism ......................................................................................... 10,938 261 9,175 1,475 2709.0402 Broadcast Journalism ............................................................................... 721 116 581 24 009.0403 Mass Communications ................................................................................2,786 37 2,476 237 3609.0499 Journalism and Mass Communication, Other ...........................................................528 0 490 36 209.0501 Public Relations and Organizational Communications .................................................2,674 12 2,405 257 009.0701 Radio and Television Broadcasting ..................................................................5,904 335 5,203 351 1509.9999 Communications, Other ..............................................................................3,677 362 2,295 989 31
10.0000 Communications Technologies ........................................................................2,900 1,602 729 564 5
10.0101 Educational / Instructional Media Technology/Technician ............................................261 183 0 78 010.0103 Photographic Technology/Technician .................................................................164 160 4 0 010.0104 Radio and Television Broadcasting Technology/Technician ............................................1,973 954 619 395 510.0199 Communications Technologies/Technicians, Other .....................................................502 305 106 91 0
11.0000 Computer and Information Sciences ..................................................................52,826 13,870 26,852 11,246 858
11.0101 Computer and Information Sciences, General .........................................................29,063 3,684 16,992 7,746 64111.0201 Computer Programming ...............................................................................3,499 3,189 238 68 411.0301 Data Processing Technology/Technician ..............................................................1,955 1,815 140 0 011.0401 Information Sciences and Systems ...................................................................8,062 1,351 4,882 1,783 4611.0501 Computer Systems Analysis ..........................................................................351 166 148 36 111.0701 Computer Science ................................................................................... 5,251 472 3,631 1,033 11511.9999 Computer and Information Sciences, Other ...........................................................4,645 3,193 821 580 51
12.0000 Personal and Miscellaneous Services ................................................................8,006 7,744 262 0 0
12.0299 Gaming & Sports Officiating Serv., Oth. 3 3 0 0 012.0301 Funeral Services and Mortuary Science ..............................................................1,380 1,235 145 0 012.0401 Cosmetic Services, General ......................................................................... 7 7 0 0 012.0403 Cosmetologist ...................................................................................... 246 246 0 0 0
54
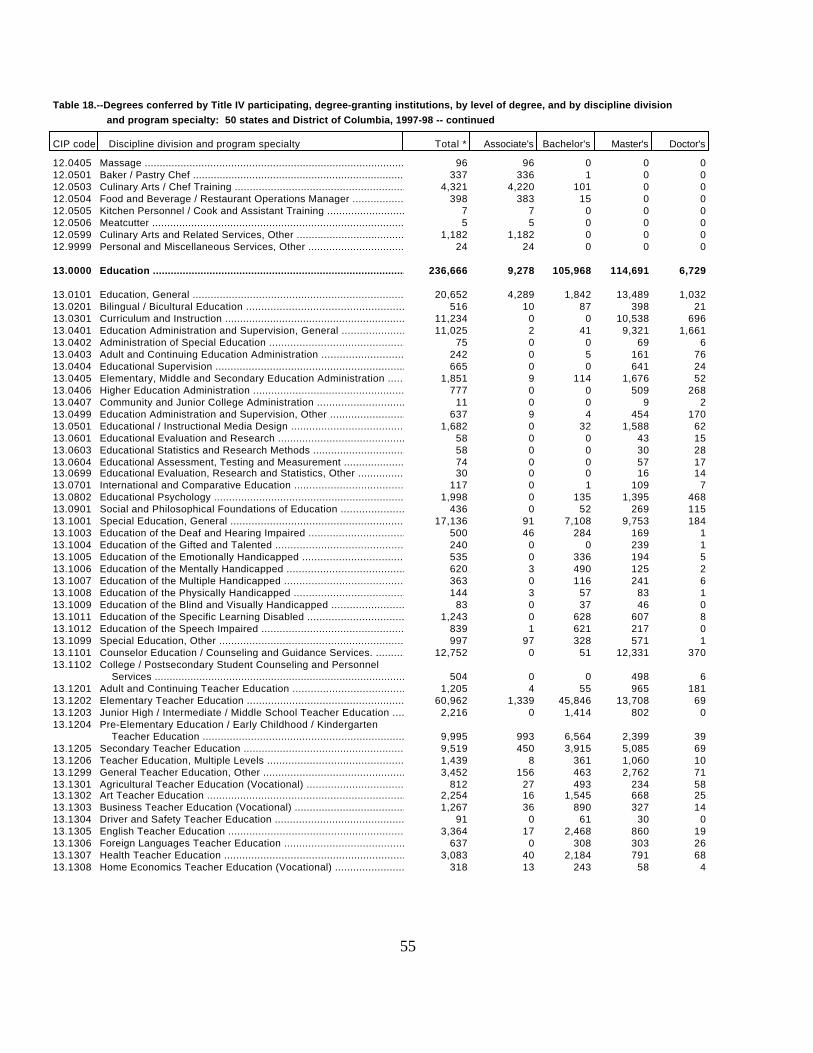
Table 18.--Degrees conferred by Title IV participating, degree-granting institutions, by level of degree, and by discipline division and program specialty: 50 states and District of Columbia, 1997-98 -- continued
CIP code Discipline division and program specialty Total * Associate's Bachelor's Master's Doctor's
12.0405 Massage ............................................................................................ 96 96 0 0 012.0501 Baker / Pastry Chef ................................................................................ 337 336 1 0 012.0503 Culinary Arts / Chef Training ......................................................................4,321 4,220 101 0 012.0504 Food and Beverage / Restaurant Operations Manager ..................................................398 383 15 0 012.0505 Kitchen Personnel / Cook and Assistant Training ....................................................7 7 0 0 012.0506 Meatcutter ......................................................................................... 5 5 0 0 012.0599 Culinary Arts and Related Services, Other ..........................................................1,182 1,182 0 0 012.9999 Personal and Miscellaneous Services, Other .........................................................24 24 0 0 0
13.0000 Education .......................................................................................... 236,666 9,278 105,968 114,691 6,729
13.0101 Education, General .................................................................................20,652 4,289 1,842 13,489 1,03213.0201 Bilingual / Bicultural Education ...................................................................516 10 87 398 2113.0301 Curriculum and Instruction .........................................................................11,234 0 0 10,538 69613.0401 Education Administration and Supervision, General ..................................................11,025 2 41 9,321 1,66113.0402 Administration of Special Education ................................................................75 0 0 69 613.0403 Adult and Continuing Education Administration ......................................................242 0 5 161 7613.0404 Educational Supervision ............................................................................ 665 0 0 641 2413.0405 Elementary, Middle and Secondary Education Administration ..........................................1,851 9 114 1,676 5213.0406 Higher Education Administration ....................................................................777 0 0 509 26813.0407 Community and Junior College Administration ........................................................11 0 0 9 213.0499 Education Administration and Supervision, Other ....................................................637 9 4 454 17013.0501 Educational / Instructional Media Design ...........................................................1,682 0 32 1,588 6213.0601 Educational Evaluation and Research ................................................................58 0 0 43 1513.0603 Educational Statistics and Research Methods ........................................................58 0 0 30 2813.0604 Educational Assessment, Testing and Measurement ....................................................74 0 0 57 1713.0699 Educational Evaluation, Research and Statistics, Other .............................................30 0 0 16 1413.0701 International and Comparative Education ............................................................117 0 1 109 713.0802 Educational Psychology .............................................................................1,998 0 135 1,395 46813.0901 Social and Philosophical Foundations of Education ..................................................436 0 52 269 11513.1001 Special Education, General .........................................................................17,136 91 7,108 9,753 18413.1003 Education of the Deaf and Hearing Impaired .........................................................500 46 284 169 113.1004 Education of the Gifted and Talented ...............................................................240 0 0 239 113.1005 Education of the Emotionally Handicapped ...........................................................535 0 336 194 513.1006 Education of the Mentally Handicapped ..............................................................620 3 490 125 213.1007 Education of the Multiple Handicapped ..............................................................363 0 116 241 613.1008 Education of the Physically Handicapped ............................................................144 3 57 83 113.1009 Education of the Blind and Visually Handicapped ....................................................83 0 37 46 013.1011 Education of the Specific Learning Disabled ........................................................1,243 0 628 607 813.1012 Education of the Speech Impaired ...................................................................839 1 621 217 013.1099 Special Education, Other ........................................................................... 997 97 328 571 113.1101 Counselor Education / Counseling and Guidance Services. ............................................12,752 0 51 12,331 37013.1102 College / Postsecondary Student Counseling and Personnel
Services ....................................................................................... 504 0 0 498 613.1201 Adult and Continuing Teacher Education .............................................................1,205 4 55 965 18113.1202 Elementary Teacher Education .......................................................................60,962 1,339 45,846 13,708 6913.1203 Junior High / Intermediate / Middle School Teacher Education .......................................2,216 0 1,414 802 013.1204 Pre-Elementary Education / Early Childhood / Kindergarten
Teacher Education .............................................................................. 9,995 993 6,564 2,399 3913.1205 Secondary Teacher Education ........................................................................9,519 450 3,915 5,085 6913.1206 Teacher Education, Multiple Levels .................................................................1,439 8 361 1,060 1013.1299 General Teacher Education, Other ...................................................................3,452 156 463 2,762 7113.1301 Agricultural Teacher Education (Vocational) ........................................................812 27 493 234 5813.1302 Art Teacher Education ..............................................................................2,254 16 1,545 668 2513.1303 Business Teacher Education (Vocational) ............................................................1,267 36 890 327 1413.1304 Driver and Safety Teacher Education ................................................................91 0 61 30 013.1305 English Teacher Education ..........................................................................3,364 17 2,468 860 1913.1306 Foreign Languages Teacher Education ................................................................637 0 308 303 2613.1307 Health Teacher Education ...........................................................................3,083 40 2,184 791 6813.1308 Home Economics Teacher Education (Vocational) ......................................................318 13 243 58 4
55
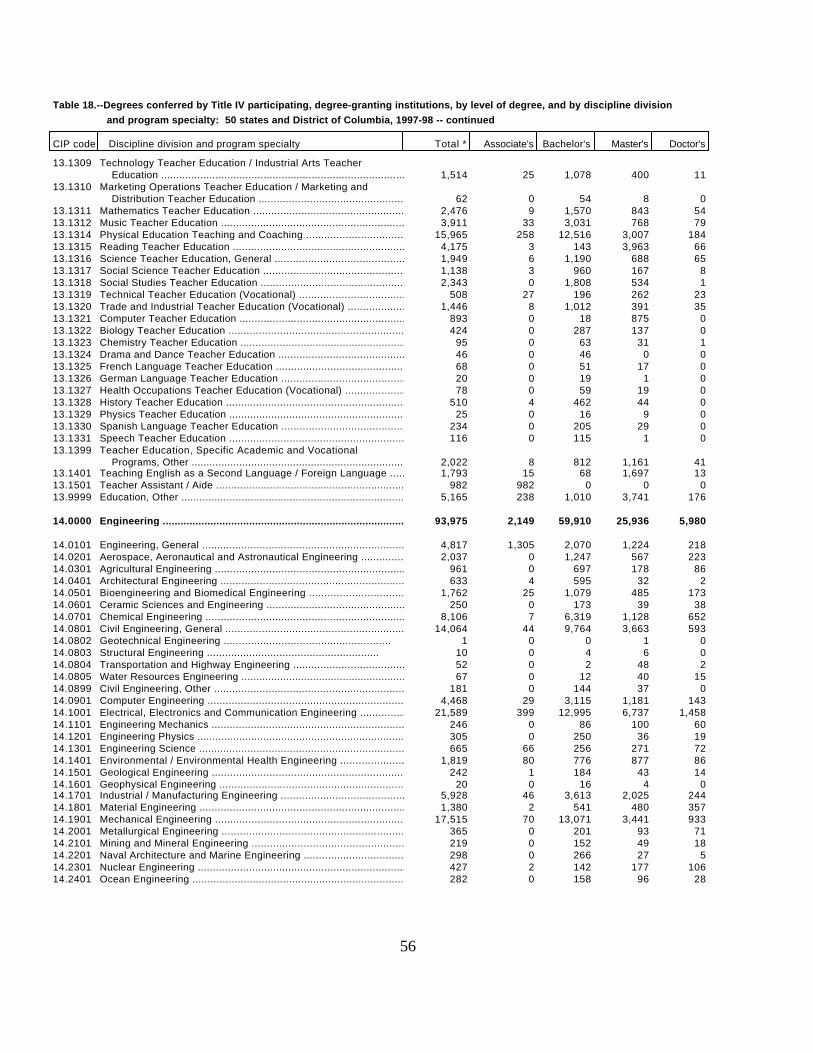
Table 18.--Degrees conferred by Title IV participating, degree-granting institutions, by level of degree, and by discipline division and program specialty: 50 states and District of Columbia, 1997-98 -- continued
CIP code Discipline division and program specialty Total * Associate's Bachelor's Master's Doctor's
13.1309 Technology Teacher Education / Industrial Arts Teacher Education ...................................................................................... 1,514 25 1,078 400 11
13.1310 Marketing Operations Teacher Education / Marketing and Distribution Teacher Education .................................................................62 0 54 8 0
13.1311 Mathematics Teacher Education ......................................................................2,476 9 1,570 843 5413.1312 Music Teacher Education ............................................................................3,911 33 3,031 768 7913.1314 Physical Education Teaching and Coaching ...........................................................15,965 258 12,516 3,007 18413.1315 Reading Teacher Education ..........................................................................4,175 3 143 3,963 6613.1316 Science Teacher Education, General .................................................................1,949 6 1,190 688 6513.1317 Social Science Teacher Education ...................................................................1,138 3 960 167 813.1318 Social Studies Teacher Education ...................................................................2,343 0 1,808 534 113.1319 Technical Teacher Education (Vocational) ...........................................................508 27 196 262 2313.1320 Trade and Industrial Teacher Education (Vocational) ................................................1,446 8 1,012 391 3513.1321 Computer Teacher Education .........................................................................893 0 18 875 013.1322 Biology Teacher Education ..........................................................................424 0 287 137 013.1323 Chemistry Teacher Education ........................................................................95 0 63 31 113.1324 Drama and Dance Teacher Education ..................................................................46 0 46 0 013.1325 French Language Teacher Education ..................................................................68 0 51 17 013.1326 German Language Teacher Education ..................................................................20 0 19 1 013.1327 Health Occupations Teacher Education (Vocational) ..................................................78 0 59 19 013.1328 History Teacher Education .......................................................................... 510 4 462 44 013.1329 Physics Teacher Education .......................................................................... 25 0 16 9 013.1330 Spanish Language Teacher Education .................................................................234 0 205 29 013.1331 Speech Teacher Education ...........................................................................116 0 115 1 013.1399 Teacher Education, Specific Academic and Vocational
Programs, Other ................................................................................ 2,022 8 812 1,161 4113.1401 Teaching English as a Second Language / Foreign Language ...........................................1,793 15 68 1,697 1313.1501 Teacher Assistant / Aide ........................................................................... 982 982 0 0 013.9999 Education, Other ................................................................................... 5,165 238 1,010 3,741 176
14.0000 Engineering ........................................................................................ 93,975 2,149 59,910 25,936 5,980
14.0101 Engineering, General ...............................................................................4,817 1,305 2,070 1,224 21814.0201 Aerospace, Aeronautical and Astronautical Engineering ..............................................2,037 0 1,247 567 22314.0301 Agricultural Engineering ........................................................................... 961 0 697 178 8614.0401 Architectural Engineering .......................................................................... 633 4 595 32 214.0501 Bioengineering and Biomedical Engineering ..........................................................1,762 25 1,079 485 17314.0601 Ceramic Sciences and Engineering ...................................................................250 0 173 39 3814.0701 Chemical Engineering ...............................................................................8,106 7 6,319 1,128 65214.0801 Civil Engineering, General .........................................................................14,064 44 9,764 3,663 59314.0802 Geotechnical Engineering ....................................................... 1 0 0 1 014.0803 Structural Engineering ......................................................... 10 0 4 6 014.0804 Transportation and Highway Engineering .............................................................52 0 2 48 214.0805 Water Resources Engineering ........................................................................67 0 12 40 1514.0899 Civil Engineering, Other ........................................................................... 181 0 144 37 014.0901 Computer Engineering ...............................................................................4,468 29 3,115 1,181 14314.1001 Electrical, Electronics and Communication Engineering ..............................................21,589 399 12,995 6,737 1,45814.1101 Engineering Mechanics .............................................................................. 246 0 86 100 6014.1201 Engineering Physics ................................................................................ 305 0 250 36 1914.1301 Engineering Science ................................................................................ 665 66 256 271 7214.1401 Environmental / Environmental Health Engineering ...................................................1,819 80 776 877 8614.1501 Geological Engineering ............................................................................. 242 1 184 43 1414.1601 Geophysical Engineering ............................................................................ 20 0 16 4 014.1701 Industrial / Manufacturing Engineering .............................................................5,928 46 3,613 2,025 24414.1801 Material Engineering ............................................................................... 1,380 2 541 480 35714.1901 Mechanical Engineering .............................................................................17,515 70 13,071 3,441 93314.2001 Metallurgical Engineering .......................................................................... 365 0 201 93 7114.2101 Mining and Mineral Engineering .....................................................................219 0 152 49 1814.2201 Naval Architecture and Marine Engineering ..........................................................298 0 266 27 514.2301 Nuclear Engineering ................................................................................ 427 2 142 177 10614.2401 Ocean Engineering .................................................................................. 282 0 158 96 28
56
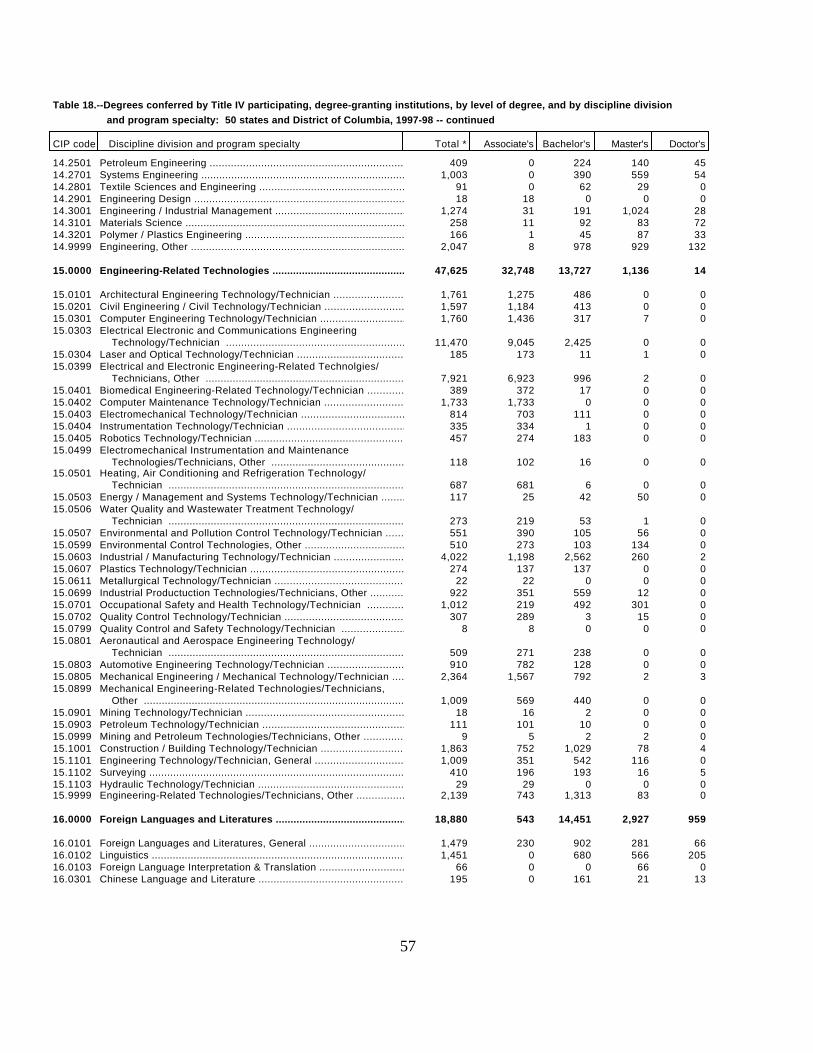
Table 18.--Degrees conferred by Title IV participating, degree-granting institutions, by level of degree, and by discipline division and program specialty: 50 states and District of Columbia, 1997-98 -- continued
CIP code Discipline division and program specialty Total * Associate's Bachelor's Master's Doctor's
14.2501 Petroleum Engineering .............................................................................. 409 0 224 140 4514.2701 Systems Engineering ................................................................................1,003 0 390 559 5414.2801 Textile Sciences and Engineering ...................................................................91 0 62 29 014.2901 Engineering Design ................................................................................. 18 18 0 0 014.3001 Engineering / Industrial Management ................................................................1,274 31 191 1,024 2814.3101 Materials Science .................................................................................. 258 11 92 83 7214.3201 Polymer / Plastics Engineering .....................................................................166 1 45 87 3314.9999 Engineering, Other ................................................................................. 2,047 8 978 929 132
15.0000 Engineering-Related Technologies ...................................................................47,625 32,748 13,727 1,136 14
15.0101 Architectural Engineering Technology/Technician ....................................................1,761 1,275 486 0 015.0201 Civil Engineering / Civil Technology/Technician ....................................................1,597 1,184 413 0 015.0301 Computer Engineering Technology/Technician .........................................................1,760 1,436 317 7 015.0303 Electrical Electronic and Communications Engineering
Technology/Technician .........................................................................11,470 9,045 2,425 0 015.0304 Laser and Optical Technology/Technician ............................................................185 173 11 1 015.0399 Electrical and Electronic Engineering-Related Technolgies/
Technicians, Other ............................................................................ 7,921 6,923 996 2 015.0401 Biomedical Engineering-Related Technology/Technician ...............................................389 372 17 0 015.0402 Computer Maintenance Technology/Technician .........................................................1,733 1,733 0 0 015.0403 Electromechanical Technology/Technician ............................................................814 703 111 0 015.0404 Instrumentation Technology/Technician ..............................................................335 334 1 0 015.0405 Robotics Technology/Technician .....................................................................457 274 183 0 015.0499 Electromechanical Instrumentation and Maintenance
Technologies/Technicians, Other ...............................................................118 102 16 0 015.0501 Heating, Air Conditioning and Refrigeration Technology/
Technician .................................................................................... 687 681 6 0 015.0503 Energy / Management and Systems Technology/Technician ..............................................117 25 42 50 015.0506 Water Quality and Wastewater Treatment Technology/
Technician .................................................................................... 273 219 53 1 015.0507 Environmental and Pollution Control Technology/Technician ..........................................551 390 105 56 015.0599 Environmental Control Technologies, Other ..........................................................510 273 103 134 015.0603 Industrial / Manufacturing Technology/Technician ...................................................4,022 1,198 2,562 260 215.0607 Plastics Technology/Technician .....................................................................274 137 137 0 015.0611 Metallurgical Technology/Technician ................................................................22 22 0 0 015.0699 Industrial Productuction Technologies/Technicians, Other ...........................................922 351 559 12 015.0701 Occupational Safety and Health Technology/Technician ..............................................1,012 219 492 301 015.0702 Quality Control Technology/Technician ..............................................................307 289 3 15 015.0799 Quality Control and Safety Technology/Technician ..................................................8 8 0 0 015.0801 Aeronautical and Aerospace Engineering Technology/
Technician .................................................................................... 509 271 238 0 015.0803 Automotive Engineering Technology/Technician .......................................................910 782 128 0 015.0805 Mechanical Engineering / Mechanical Technology/Technician ..........................................2,364 1,567 792 2 315.0899 Mechanical Engineering-Related Technologies/Technicians,
Other ......................................................................................... 1,009 569 440 0 015.0901 Mining Technology/Technician .......................................................................18 16 2 0 015.0903 Petroleum Technology/Technician ....................................................................111 101 10 0 015.0999 Mining and Petroleum Technologies/Technicians, Other ...............................................9 5 2 2 015.1001 Construction / Building Technology/Technician ......................................................1,863 752 1,029 78 415.1101 Engineering Technology/Technician, General .........................................................1,009 351 542 116 015.1102 Surveying .......................................................................................... 410 196 193 16 515.1103 Hydraulic Technology/Technician ....................................................................29 29 0 0 015.9999 Engineering-Related Technologies/Technicians, Other ................................................2,139 743 1,313 83 0
16.0000 Foreign Languages and Literatures ..................................................................18,880 543 14,451 2,927 959
16.0101 Foreign Languages and Literatures, General .........................................................1,479 230 902 281 6616.0102 Linguistics ........................................................................................ 1,451 0 680 566 20516.0103 Foreign Language Interpretation & Translation ............................. 66 0 0 66 016.0301 Chinese Language and Literature ....................................................................195 0 161 21 13
57
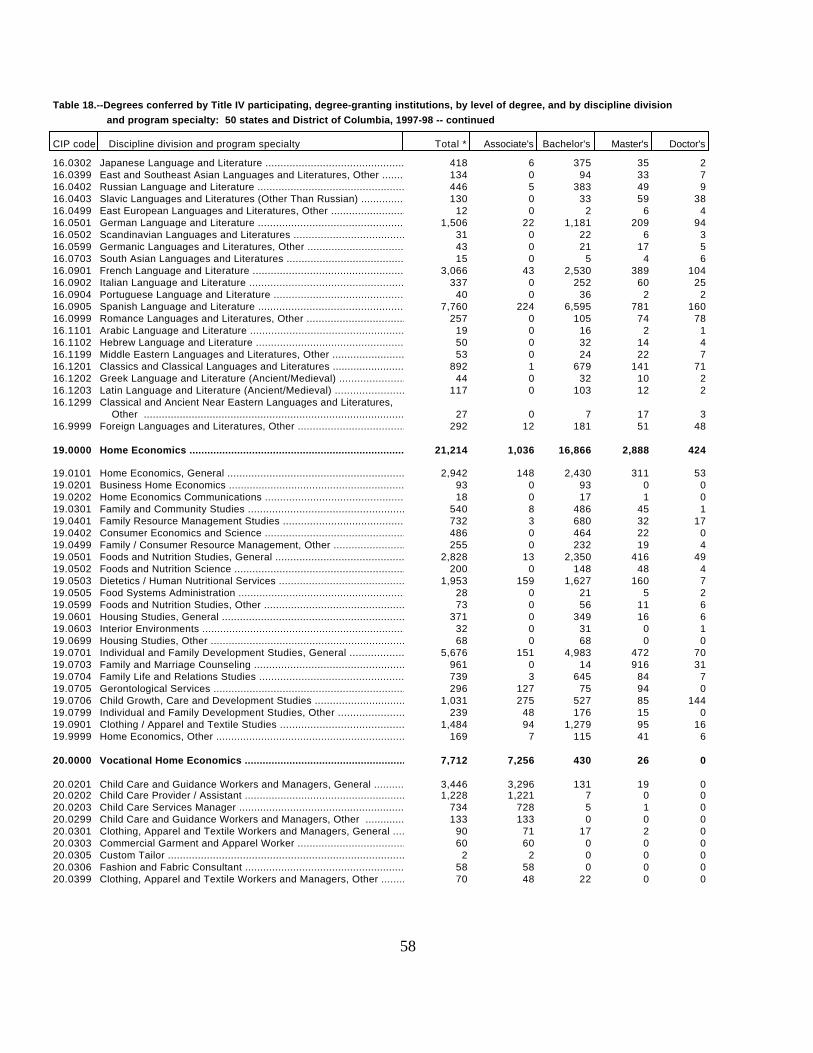
Table 18.--Degrees conferred by Title IV participating, degree-granting institutions, by level of degree, and by discipline division and program specialty: 50 states and District of Columbia, 1997-98 -- continued
CIP code Discipline division and program specialty Total * Associate's Bachelor's Master's Doctor's
16.0302 Japanese Language and Literature ...................................................................418 6 375 35 216.0399 East and Southeast Asian Languages and Literatures, Other ..........................................134 0 94 33 716.0402 Russian Language and Literature ....................................................................446 5 383 49 916.0403 Slavic Languages and Literatures (Other Than Russian) ..............................................130 0 33 59 3816.0499 East European Languages and Literatures, Other .....................................................12 0 2 6 416.0501 German Language and Literature .....................................................................1,506 22 1,181 209 9416.0502 Scandinavian Languages and Literatures .............................................................31 0 22 6 316.0599 Germanic Languages and Literatures, Other ..........................................................43 0 21 17 516.0703 South Asian Languages and Literatures ..............................................................15 0 5 4 616.0901 French Language and Literature .....................................................................3,066 43 2,530 389 10416.0902 Italian Language and Literature ....................................................................337 0 252 60 2516.0904 Portuguese Language and Literature .................................................................40 0 36 2 216.0905 Spanish Language and Literature ....................................................................7,760 224 6,595 781 16016.0999 Romance Languages and Literatures, Other ...........................................................257 0 105 74 7816.1101 Arabic Language and Literature .....................................................................19 0 16 2 116.1102 Hebrew Language and Literature .....................................................................50 0 32 14 416.1199 Middle Eastern Languages and Literatures, Other ....................................................53 0 24 22 716.1201 Classics and Classical Languages and Literatures ...................................................892 1 679 141 7116.1202 Greek Language and Literature (Ancient/Medieval) ...................................................44 0 32 10 216.1203 Latin Language and Literature (Ancient/Medieval) ...................................................117 0 103 12 216.1299 Classical and Ancient Near Eastern Languages and Literatures,
Other ......................................................................................... 27 0 7 17 316.9999 Foreign Languages and Literatures, Other ...........................................................292 12 181 51 48
19.0000 Home Economics .....................................................................................21,214 1,036 16,866 2,888 424
19.0101 Home Economics, General ............................................................................2,942 148 2,430 311 5319.0201 Business Home Economics ............................................................................93 0 93 0 019.0202 Home Economics Communications ......................................................................18 0 17 1 019.0301 Family and Community Studies .......................................................................540 8 486 45 119.0401 Family Resource Management Studies .................................................................732 3 680 32 1719.0402 Consumer Economics and Science .....................................................................486 0 464 22 019.0499 Family / Consumer Resource Management, Other .......................................................255 0 232 19 419.0501 Foods and Nutrition Studies, General ...............................................................2,828 13 2,350 416 4919.0502 Foods and Nutrition Science ........................................................................200 0 148 48 419.0503 Dietetics / Human Nutritional Services .............................................................1,953 159 1,627 160 719.0505 Food Systems Administration ........................................................................ 28 0 21 5 219.0599 Foods and Nutrition Studies, Other .................................................................73 0 56 11 619.0601 Housing Studies, General ........................................................................... 371 0 349 16 619.0603 Interior Environments .............................................................................. 32 0 31 0 119.0699 Housing Studies, Other ............................................................................. 68 0 68 0 019.0701 Individual and Family Development Studies, General .................................................5,676 151 4,983 472 7019.0703 Family and Marriage Counseling .....................................................................961 0 14 916 3119.0704 Family Life and Relations Studies ..................................................................739 3 645 84 719.0705 Gerontological Services ............................................................................ 296 127 75 94 019.0706 Child Growth, Care and Development Studies .........................................................1,031 275 527 85 14419.0799 Individual and Family Development Studies, Other ...................................................239 48 176 15 019.0901 Clothing / Apparel and Textile Studies .............................................................1,484 94 1,279 95 1619.9999 Home Economics, Other ..............................................................................169 7 115 41 6
20.0000 Vocational Home Economics ..........................................................................7,712 7,256 430 26 0
20.0201 Child Care and Guidance Workers and Managers, General ..............................................3,446 3,296 131 19 020.0202 Child Care Provider / Assistant ....................................................................1,228 1,221 7 0 020.0203 Child Care Services Manager ........................................................................734 728 5 1 020.0299 Child Care and Guidance Workers and Managers, Other ...............................................133 133 0 0 020.0301 Clothing, Apparel and Textile Workers and Managers, General ........................................90 71 17 2 020.0303 Commercial Garment and Apparel Worker ..............................................................60 60 0 0 020.0305 Custom Tailor ...................................................................................... 2 2 0 0 020.0306 Fashion and Fabric Consultant ......................................................................58 58 0 0 020.0399 Clothing, Apparel and Textile Workers and Managers, Other ..........................................70 48 22 0 0
58
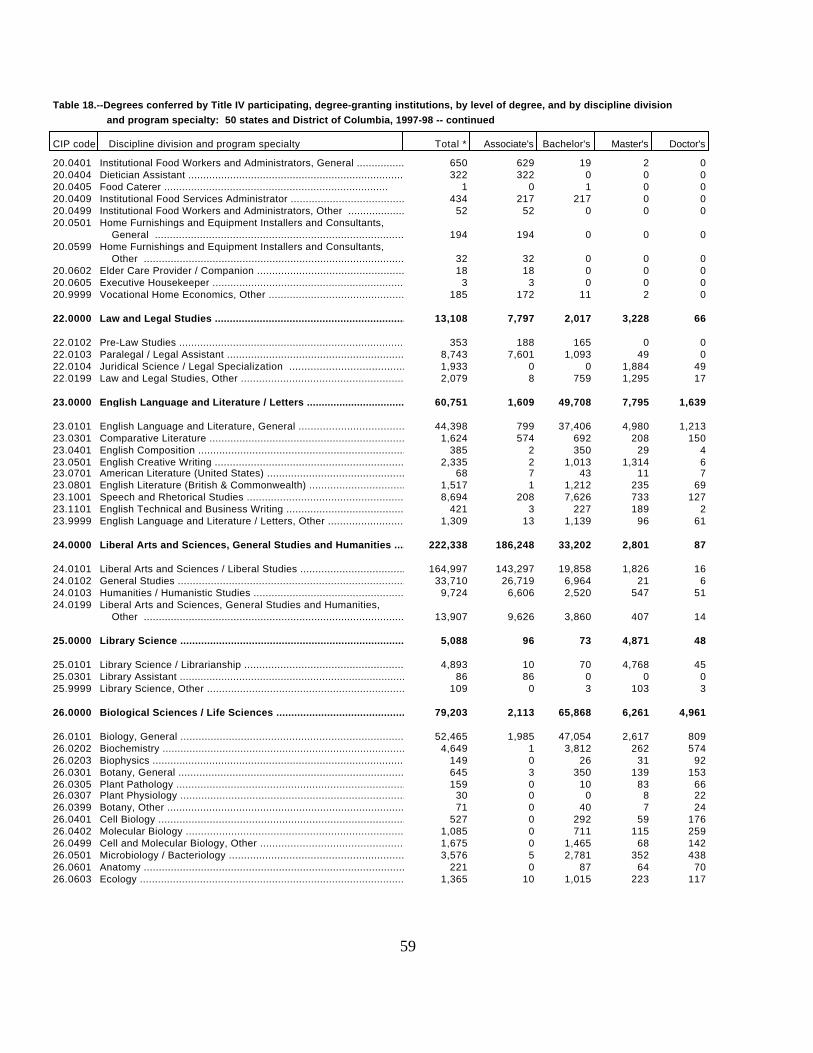
Table 18.--Degrees conferred by Title IV participating, degree-granting institutions, by level of degree, and by discipline division and program specialty: 50 states and District of Columbia, 1997-98 -- continued
CIP code Discipline division and program specialty Total * Associate's Bachelor's Master's Doctor's
20.0401 Institutional Food Workers and Administrators, General .............................................650 629 19 2 020.0404 Dietician Assistant ................................................................................ 322 322 0 0 020.0405 Food Caterer ........................................................................... 1 0 1 0 020.0409 Institutional Food Services Administrator ..........................................................434 217 217 0 020.0499 Institutional Food Workers and Administrators, Other ..............................................52 52 0 0 020.0501 Home Furnishings and Equipment Installers and Consultants,
General ....................................................................................... 194 194 0 0 020.0599 Home Furnishings and Equipment Installers and Consultants,
Other ......................................................................................... 32 32 0 0 020.0602 Elder Care Provider / Companion ....................................................................18 18 0 0 020.0605 Executive Housekeeper .............................................................................. 3 3 0 0 020.9999 Vocational Home Economics, Other ...................................................................185 172 11 2 0
22.0000 Law and Legal Studies ..............................................................................13,108 7,797 2,017 3,228 66
22.0102 Pre-Law Studies .................................................................................... 353 188 165 0 022.0103 Paralegal / Legal Assistant ........................................................................8,743 7,601 1,093 49 022.0104 Juridical Science / Legal Specialization ..........................................................1,933 0 0 1,884 4922.0199 Law and Legal Studies, Other .......................................................................2,079 8 759 1,295 17
23.0000 English Language and Literature / Letters ..........................................................60,751 1,609 49,708 7,795 1,639
23.0101 English Language and Literature, General ...........................................................44,398 799 37,406 4,980 1,21323.0301 Comparative Literature .............................................................................1,624 574 692 208 15023.0401 English Composition ................................................................................ 385 2 350 29 423.0501 English Creative Writing ...........................................................................2,335 2 1,013 1,314 623.0701 American Literature (United States) ................................................................68 7 43 11 723.0801 English Literature (British & Commonwealth) ........................................................1,517 1 1,212 235 6923.1001 Speech and Rhetorical Studies ......................................................................8,694 208 7,626 733 12723.1101 English Technical and Business Writing .............................................................421 3 227 189 223.9999 English Language and Literature / Letters, Other ...................................................1,309 13 1,139 96 61
24.0000 Liberal Arts and Sciences, General Studies and Humanities ..........................................222,338 186,248 33,202 2,801 87
24.0101 Liberal Arts and Sciences / Liberal Studies ........................................................164,997 143,297 19,858 1,826 1624.0102 General Studies .................................................................................... 33,710 26,719 6,964 21 624.0103 Humanities / Humanistic Studies ....................................................................9,724 6,606 2,520 547 5124.0199 Liberal Arts and Sciences, General Studies and Humanities,
Other ......................................................................................... 13,907 9,626 3,860 407 14
25.0000 Library Science .................................................................................... 5,088 96 73 4,871 48
25.0101 Library Science / Librarianship ....................................................................4,893 10 70 4,768 4525.0301 Library Assistant .................................................................................. 86 86 0 0 025.9999 Library Science, Other ............................................................................. 109 0 3 103 3
26.0000 Biological Sciences / Life Sciences ................................................................79,203 2,113 65,868 6,261 4,961
26.0101 Biology, General ................................................................................... 52,465 1,985 47,054 2,617 80926.0202 Biochemistry ....................................................................................... 4,649 1 3,812 262 57426.0203 Biophysics ......................................................................................... 149 0 26 31 9226.0301 Botany, General .................................................................................... 645 3 350 139 15326.0305 Plant Pathology .................................................................................... 159 0 10 83 6626.0307 Plant Physiology ................................................................................... 30 0 0 8 2226.0399 Botany, Other ...................................................................................... 71 0 40 7 2426.0401 Cell Biology ....................................................................................... 527 0 292 59 17626.0402 Molecular Biology .................................................................................. 1,085 0 711 115 25926.0499 Cell and Molecular Biology, Other ..................................................................1,675 0 1,465 68 14226.0501 Microbiology / Bacteriology ........................................................................3,576 5 2,781 352 43826.0601 Anatomy ............................................................................................ 221 0 87 64 7026.0603 Ecology ............................................................................................ 1,365 10 1,015 223 117
59
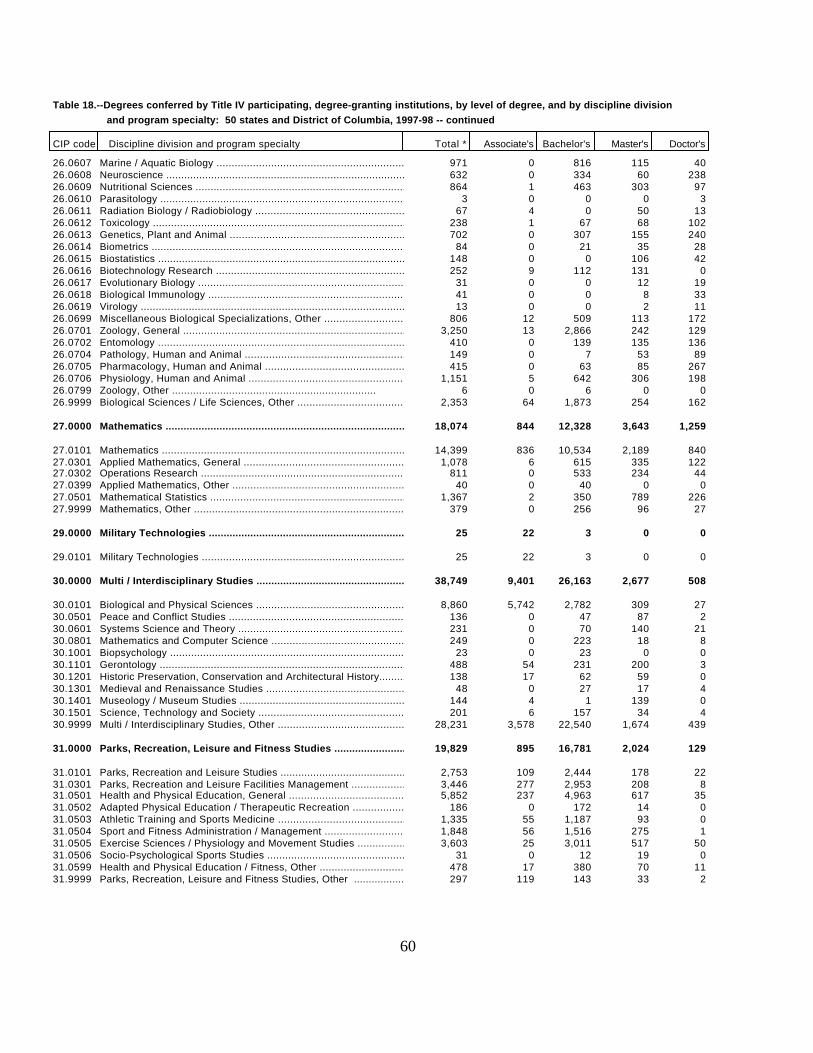
Table 18.--Degrees conferred by Title IV participating, degree-granting institutions, by level of degree, and by discipline division and program specialty: 50 states and District of Columbia, 1997-98 -- continued
CIP code Discipline division and program specialty Total * Associate's Bachelor's Master's Doctor's
26.0607 Marine / Aquatic Biology ........................................................................... 971 0 816 115 4026.0608 Neuroscience ....................................................................................... 632 0 334 60 23826.0609 Nutritional Sciences ............................................................................... 864 1 463 303 9726.0610 Parasitology ....................................................................................... 3 0 0 0 326.0611 Radiation Biology / Radiobiology ...................................................................67 4 0 50 1326.0612 Toxicology ......................................................................................... 238 1 67 68 10226.0613 Genetics, Plant and Animal .........................................................................702 0 307 155 24026.0614 Biometrics ......................................................................................... 84 0 21 35 2826.0615 Biostatistics ...................................................................................... 148 0 0 106 4226.0616 Biotechnology Research ............................................................................. 252 9 112 131 026.0617 Evolutionary Biology ............................................................................... 31 0 0 12 1926.0618 Biological Immunology .............................................................................. 41 0 0 8 3326.0619 Virology ........................................................................................... 13 0 0 2 1126.0699 Miscellaneous Biological Specializations, Other ....................................................806 12 509 113 17226.0701 Zoology, General ................................................................................... 3,250 13 2,866 242 12926.0702 Entomology ......................................................................................... 410 0 139 135 13626.0704 Pathology, Human and Animal ........................................................................149 0 7 53 8926.0705 Pharmacology, Human and Animal .....................................................................415 0 63 85 26726.0706 Physiology, Human and Animal .......................................................................1,151 5 642 306 19826.0799 Zoology, Other .................................................................... 6 0 6 0 026.9999 Biological Sciences / Life Sciences, Other .........................................................2,353 64 1,873 254 162
27.0000 Mathematics ........................................................................................ 18,074 844 12,328 3,643 1,259
27.0101 Mathematics ........................................................................................ 14,399 836 10,534 2,189 84027.0301 Applied Mathematics, General .......................................................................1,078 6 615 335 12227.0302 Operations Research ................................................................................ 811 0 533 234 4427.0399 Applied Mathematics, Other ......................................................................... 40 0 40 0 027.0501 Mathematical Statistics ............................................................................ 1,367 2 350 789 22627.9999 Mathematics, Other ................................................................................. 379 0 256 96 27
29.0000 Military Technologies .............................................................................. 25 22 3 0 0
29.0101 Military Technologies .............................................................................. 25 22 3 0 0
30.0000 Multi / Interdisciplinary Studies ..................................................................38,749 9,401 26,163 2,677 508
30.0101 Biological and Physical Sciences ...................................................................8,860 5,742 2,782 309 2730.0501 Peace and Conflict Studies .........................................................................136 0 47 87 230.0601 Systems Science and Theory .........................................................................231 0 70 140 2130.0801 Mathematics and Computer Science ...................................................................249 0 223 18 830.1001 Biopsychology ...................................................................................... 23 0 23 0 030.1101 Gerontology ........................................................................................ 488 54 231 200 330.1201 Historic Preservation, Conservation and Architectural History.......................................138 17 62 59 030.1301 Medieval and Renaissance Studies ...................................................................48 0 27 17 430.1401 Museology / Museum Studies .........................................................................144 4 1 139 030.1501 Science, Technology and Society ....................................................................201 6 157 34 430.9999 Multi / Interdisciplinary Studies, Other ...........................................................28,231 3,578 22,540 1,674 439
31.0000 Parks, Recreation, Leisure and Fitness Studies .....................................................19,829 895 16,781 2,024 129
31.0101 Parks, Recreation and Leisure Studies ..............................................................2,753 109 2,444 178 2231.0301 Parks, Recreation and Leisure Facilities Management ................................................3,446 277 2,953 208 831.0501 Health and Physical Education, General .............................................................5,852 237 4,963 617 3531.0502 Adapted Physical Education / Therapeutic Recreation ................................................186 0 172 14 031.0503 Athletic Training and Sports Medicine ..............................................................1,335 55 1,187 93 031.0504 Sport and Fitness Administration / Management ......................................................1,848 56 1,516 275 131.0505 Exercise Sciences / Physiology and Movement Studies ................................................3,603 25 3,011 517 5031.0506 Socio-Psychological Sports Studies .................................................................31 0 12 19 031.0599 Health and Physical Education / Fitness, Other .....................................................478 17 380 70 1131.9999 Parks, Recreation, Leisure and Fitness Studies, Other .............................................297 119 143 33 2
60
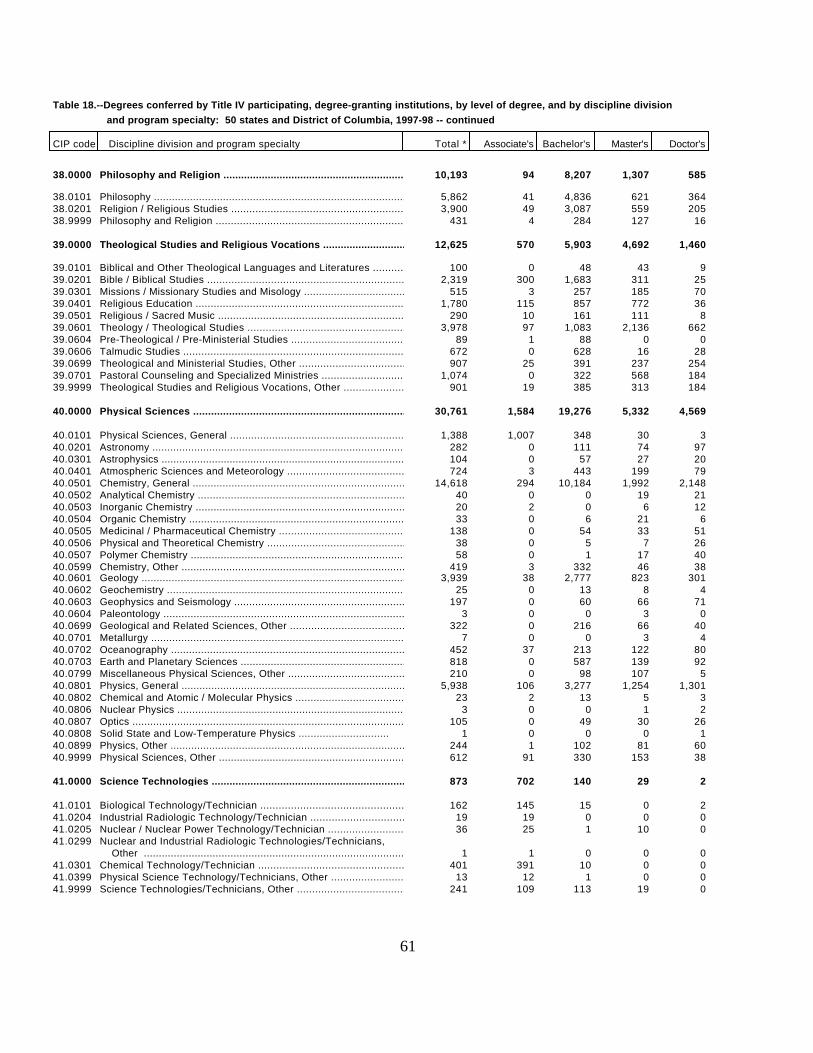
Table 18.--Degrees conferred by Title IV participating, degree-granting institutions, by level of degree, and by discipline division and program specialty: 50 states and District of Columbia, 1997-98 -- continued
CIP code Discipline division and program specialty Total * Associate's Bachelor's Master's Doctor's
38.0000 Philosophy and Religion ............................................................................10,193 94 8,207 1,307 585
38.0101 Philosophy ......................................................................................... 5,862 41 4,836 621 36438.0201 Religion / Religious Studies .......................................................................3,900 49 3,087 559 20538.9999 Philosophy and Religion ............................................................................ 431 4 284 127 16
39.0000 Theological Studies and Religious Vocations ........................................................12,625 570 5,903 4,692 1,460
39.0101 Biblical and Other Theological Languages and Literatures ...........................................100 0 48 43 939.0201 Bible / Biblical Studies ........................................................................... 2,319 300 1,683 311 2539.0301 Missions / Missionary Studies and Misology .........................................................515 3 257 185 7039.0401 Religious Education ................................................................................ 1,780 115 857 772 3639.0501 Religious / Sacred Music ........................................................................... 290 10 161 111 839.0601 Theology / Theological Studies .....................................................................3,978 97 1,083 2,136 66239.0604 Pre-Theological / Pre-Ministerial Studies ..........................................................89 1 88 0 039.0606 Talmudic Studies ................................................................................... 672 0 628 16 2839.0699 Theological and Ministerial Studies, Other .........................................................907 25 391 237 25439.0701 Pastoral Counseling and Specialized Ministries .....................................................1,074 0 322 568 18439.9999 Theological Studies and Religious Vocations, Other .................................................901 19 385 313 184
40.0000 Physical Sciences ..................................................................................30,761 1,584 19,276 5,332 4,569
40.0101 Physical Sciences, General .........................................................................1,388 1,007 348 30 340.0201 Astronomy .......................................................................................... 282 0 111 74 9740.0301 Astrophysics ....................................................................................... 104 0 57 27 2040.0401 Atmospheric Sciences and Meteorology ...............................................................724 3 443 199 7940.0501 Chemistry, General .................................................................................14,618 294 10,184 1,992 2,14840.0502 Analytical Chemistry ............................................................................... 40 0 0 19 2140.0503 Inorganic Chemistry ................................................................................ 20 2 0 6 1240.0504 Organic Chemistry .................................................................................. 33 0 6 21 640.0505 Medicinal / Pharmaceutical Chemistry ...............................................................138 0 54 33 5140.0506 Physical and Theoretical Chemistry .................................................................38 0 5 7 2640.0507 Polymer Chemistry .................................................................................. 58 0 1 17 4040.0599 Chemistry, Other ................................................................................... 419 3 332 46 3840.0601 Geology ............................................................................................ 3,939 38 2,777 823 30140.0602 Geochemistry ....................................................................................... 25 0 13 8 440.0603 Geophysics and Seismology ..........................................................................197 0 60 66 7140.0604 Paleontology ....................................................................................... 3 0 0 3 040.0699 Geological and Related Sciences, Other .............................................................322 0 216 66 4040.0701 Metallurgy ......................................................................................... 7 0 0 3 440.0702 Oceanography ....................................................................................... 452 37 213 122 8040.0703 Earth and Planetary Sciences .......................................................................818 0 587 139 9240.0799 Miscellaneous Physical Sciences, Other .............................................................210 0 98 107 540.0801 Physics, General ................................................................................... 5,938 106 3,277 1,254 1,30140.0802 Chemical and Atomic / Molecular Physics ............................................................23 2 13 5 340.0806 Nuclear Physics .................................................................................... 3 0 0 1 240.0807 Optics ............................................................................................. 105 0 49 30 2640.0808 Solid State and Low-Temperature Physics .............................. 1 0 0 0 140.0899 Physics, Other ..................................................................................... 244 1 102 81 6040.9999 Physical Sciences, Other ........................................................................... 612 91 330 153 38
41.0000 Science Technologies ............................................................................... 873 702 140 29 2
41.0101 Biological Technology/Technician ...................................................................162 145 15 0 241.0204 Industrial Radiologic Technology/Technician ........................................................19 19 0 0 041.0205 Nuclear / Nuclear Power Technology/Technician ......................................................36 25 1 10 041.0299 Nuclear and Industrial Radiologic Technologies/Technicians,
Other ......................................................................................... 1 1 0 0 041.0301 Chemical Technology/Technician .....................................................................401 391 10 0 041.0399 Physical Science Technology/Technicians, Other .....................................................13 12 1 0 041.9999 Science Technologies/Technicians, Other ............................................................241 109 113 19 0
61
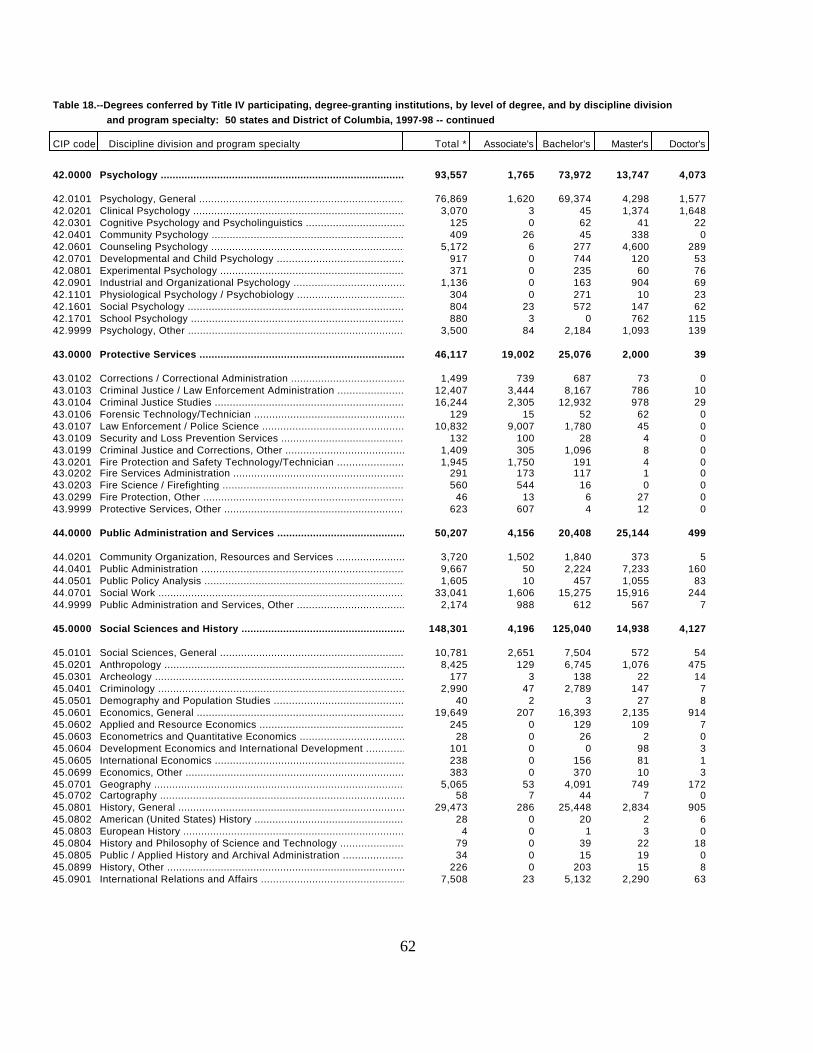
Table 18.--Degrees conferred by Title IV participating, degree-granting institutions, by level of degree, and by discipline division and program specialty: 50 states and District of Columbia, 1997-98 -- continued
CIP code Discipline division and program specialty Total * Associate's Bachelor's Master's Doctor's
42.0000 Psychology ......................................................................................... 93,557 1,765 73,972 13,747 4,073
42.0101 Psychology, General ................................................................................76,869 1,620 69,374 4,298 1,57742.0201 Clinical Psychology ................................................................................ 3,070 3 45 1,374 1,64842.0301 Cognitive Psychology and Psycholinguistics .........................................................125 0 62 41 2242.0401 Community Psychology ...............................................................................409 26 45 338 042.0601 Counseling Psychology ..............................................................................5,172 6 277 4,600 28942.0701 Developmental and Child Psychology .................................................................917 0 744 120 5342.0801 Experimental Psychology ............................................................................371 0 235 60 7642.0901 Industrial and Organizational Psychology ...........................................................1,136 0 163 904 6942.1101 Physiological Psychology / Psychobiology ...........................................................304 0 271 10 2342.1601 Social Psychology .................................................................................. 804 23 572 147 6242.1701 School Psychology .................................................................................. 880 3 0 762 11542.9999 Psychology, Other .................................................................................. 3,500 84 2,184 1,093 139
43.0000 Protective Services ................................................................................46,117 19,002 25,076 2,000 39
43.0102 Corrections / Correctional Administration ..........................................................1,499 739 687 73 043.0103 Criminal Justice / Law Enforcement Administration ..................................................12,407 3,444 8,167 786 1043.0104 Criminal Justice Studies ...........................................................................16,244 2,305 12,932 978 2943.0106 Forensic Technology/Technician .....................................................................129 15 52 62 043.0107 Law Enforcement / Police Science ...................................................................10,832 9,007 1,780 45 043.0109 Security and Loss Prevention Services ..............................................................132 100 28 4 043.0199 Criminal Justice and Corrections, Other ............................................................1,409 305 1,096 8 043.0201 Fire Protection and Safety Technology/Technician ...................................................1,945 1,750 191 4 043.0202 Fire Services Administration ....................................................................... 291 173 117 1 043.0203 Fire Science / Firefighting ........................................................................ 560 544 16 0 043.0299 Fire Protection, Other ............................................................................. 46 13 6 27 043.9999 Protective Services, Other ......................................................................... 623 607 4 12 0
44.0000 Public Administration and Services .................................................................50,207 4,156 20,408 25,144 499
44.0201 Community Organization, Resources and Services .....................................................3,720 1,502 1,840 373 544.0401 Public Administration .............................................................................. 9,667 50 2,224 7,233 16044.0501 Public Policy Analysis ............................................................................. 1,605 10 457 1,055 8344.0701 Social Work ........................................................................................ 33,041 1,606 15,275 15,916 24444.9999 Public Administration and Services, Other ..........................................................2,174 988 612 567 7
45.0000 Social Sciences and History ........................................................................148,301 4,196 125,040 14,938 4,127
45.0101 Social Sciences, General ...........................................................................10,781 2,651 7,504 572 5445.0201 Anthropology ....................................................................................... 8,425 129 6,745 1,076 47545.0301 Archeology ......................................................................................... 177 3 138 22 1445.0401 Criminology ........................................................................................ 2,990 47 2,789 147 745.0501 Demography and Population Studies ..................................................................40 2 3 27 845.0601 Economics, General .................................................................................19,649 207 16,393 2,135 91445.0602 Applied and Resource Economics .....................................................................245 0 129 109 745.0603 Econometrics and Quantitative Economics ............................................................28 0 26 2 045.0604 Development Economics and International Development ................................................101 0 0 98 345.0605 International Economics ............................................................................ 238 0 156 81 145.0699 Economics, Other ................................................................................... 383 0 370 10 345.0701 Geography .......................................................................................... 5,065 53 4,091 749 17245.0702 Cartography ........................................................................................ 58 7 44 7 045.0801 History, General ................................................................................... 29,473 286 25,448 2,834 90545.0802 American (United States) History ................................................................... 28 0 20 2 645.0803 European History ................................................................................... 4 0 1 3 045.0804 History and Philosophy of Science and Technology ...................................................79 0 39 22 1845.0805 Public / Applied History and Archival Administration ...............................................34 0 15 19 045.0899 History, Other ..................................................................................... 226 0 203 15 845.0901 International Relations and Affairs ................................................................7,508 23 5,132 2,290 63
62
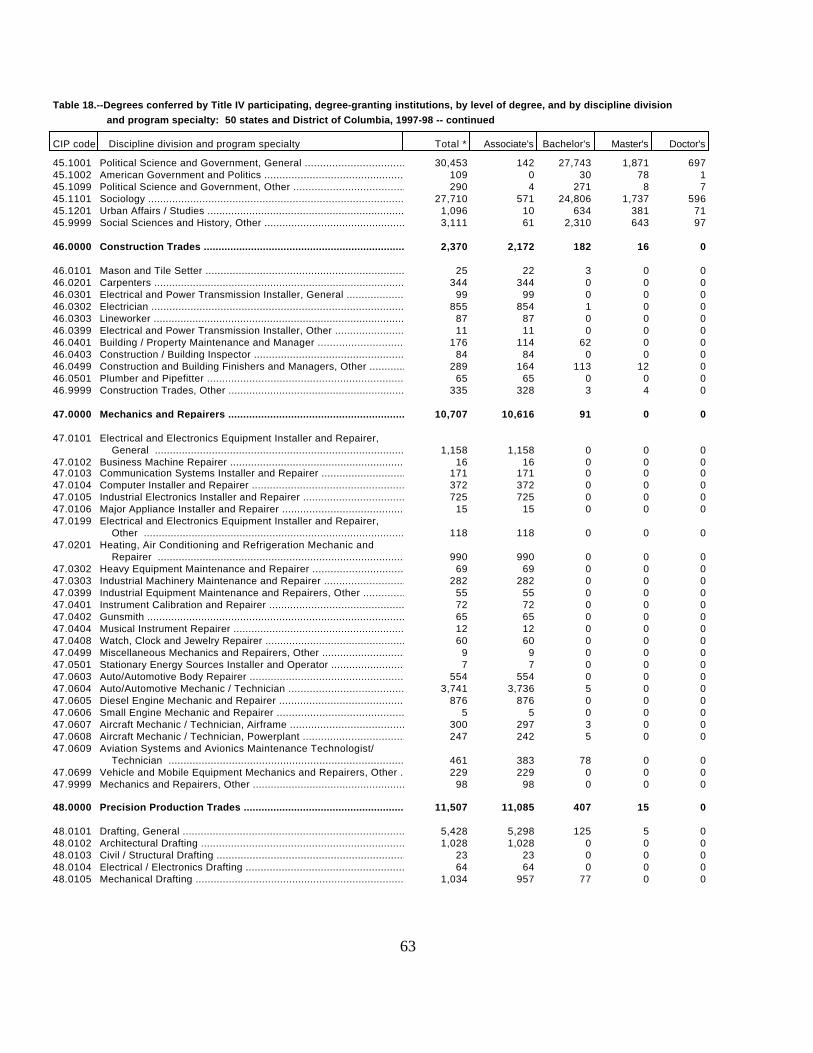
Table 18.--Degrees conferred by Title IV participating, degree-granting institutions, by level of degree, and by discipline division and program specialty: 50 states and District of Columbia, 1997-98 -- continued
CIP code Discipline division and program specialty Total * Associate's Bachelor's Master's Doctor's
45.1001 Political Science and Government, General ..........................................................30,453 142 27,743 1,871 69745.1002 American Government and Politics ...................................................................109 0 30 78 145.1099 Political Science and Government, Other ............................................................290 4 271 8 745.1101 Sociology .......................................................................................... 27,710 571 24,806 1,737 59645.1201 Urban Affairs / Studies ............................................................................ 1,096 10 634 381 7145.9999 Social Sciences and History, Other .................................................................3,111 61 2,310 643 97
46.0000 Construction Trades ................................................................................2,370 2,172 182 16 0
46.0101 Mason and Tile Setter .............................................................................. 25 22 3 0 046.0201 Carpenters ......................................................................................... 344 344 0 0 046.0301 Electrical and Power Transmission Installer, General ...............................................99 99 0 0 046.0302 Electrician ........................................................................................ 855 854 1 0 046.0303 Lineworker ......................................................................................... 87 87 0 0 046.0399 Electrical and Power Transmission Installer, Other .................................................11 11 0 0 046.0401 Building / Property Maintenance and Manager ........................................................176 114 62 0 046.0403 Construction / Building Inspector .................................................................. 84 84 0 0 046.0499 Construction and Building Finishers and Managers, Other ............................................289 164 113 12 046.0501 Plumber and Pipefitter ............................................................................. 65 65 0 0 046.9999 Construction Trades, Other ......................................................................... 335 328 3 4 0
47.0000 Mechanics and Repairers ............................................................................10,707 10,616 91 0 0
47.0101 Electrical and Electronics Equipment Installer and Repairer, General ....................................................................................... 1,158 1,158 0 0 0
47.0102 Business Machine Repairer .......................................................................... 16 16 0 0 047.0103 Communication Systems Installer and Repairer .......................................................171 171 0 0 047.0104 Computer Installer and Repairer ....................................................................372 372 0 0 047.0105 Industrial Electronics Installer and Repairer ......................................................725 725 0 0 047.0106 Major Appliance Installer and Repairer .............................................................15 15 0 0 047.0199 Electrical and Electronics Equipment Installer and Repairer,
Other ......................................................................................... 118 118 0 0 047.0201 Heating, Air Conditioning and Refrigeration Mechanic and
Repairer ...................................................................................... 990 990 0 0 047.0302 Heavy Equipment Maintenance and Repairer ...........................................................69 69 0 0 047.0303 Industrial Machinery Maintenance and Repairer ......................................................282 282 0 0 047.0399 Industrial Equipment Maintenance and Repairers, Other ..............................................55 55 0 0 047.0401 Instrument Calibration and Repairer ................................................................72 72 0 0 047.0402 Gunsmith ........................................................................................... 65 65 0 0 047.0404 Musical Instrument Repairer ........................................................................ 12 12 0 0 047.0408 Watch, Clock and Jewelry Repairer ..................................................................60 60 0 0 047.0499 Miscellaneous Mechanics and Repairers, Other .......................................................9 9 0 0 047.0501 Stationary Energy Sources Installer and Operator ...................................................7 7 0 0 047.0603 Auto/Automotive Body Repairer ......................................................................554 554 0 0 047.0604 Auto/Automotive Mechanic / Technician ..............................................................3,741 3,736 5 0 047.0605 Diesel Engine Mechanic and Repairer ................................................................876 876 0 0 047.0606 Small Engine Mechanic and Repairer .................................................................5 5 0 0 047.0607 Aircraft Mechanic / Technician, Airframe ...........................................................300 297 3 0 047.0608 Aircraft Mechanic / Technician, Powerplant .........................................................247 242 5 0 047.0609 Aviation Systems and Avionics Maintenance Technologist/
Technician .................................................................................... 461 383 78 0 047.0699 Vehicle and Mobile Equipment Mechanics and Repairers, Other ........................................229 229 0 0 047.9999 Mechanics and Repairers, Other .....................................................................98 98 0 0 0
48.0000 Precision Production Trades ........................................................................11,507 11,085 407 15 0
48.0101 Drafting, General .................................................................................. 5,428 5,298 125 5 048.0102 Architectural Drafting ............................................................................. 1,028 1,028 0 0 048.0103 Civil / Structural Drafting ........................................................................ 23 23 0 0 048.0104 Electrical / Electronics Drafting .................................................................. 64 64 0 0 048.0105 Mechanical Drafting ................................................................................ 1,034 957 77 0 0
63
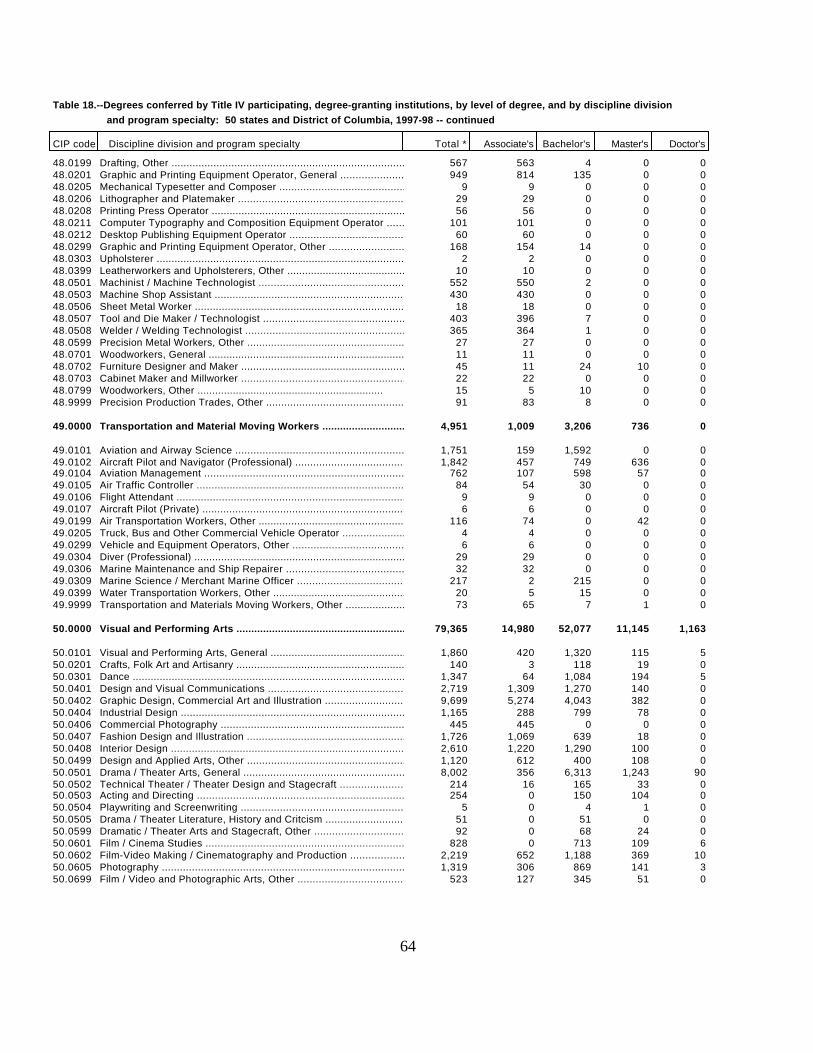
Table 18.--Degrees conferred by Title IV participating, degree-granting institutions, by level of degree, and by discipline division and program specialty: 50 states and District of Columbia, 1997-98 -- continued
CIP code Discipline division and program specialty Total * Associate's Bachelor's Master's Doctor's
48.0199 Drafting, Other .................................................................................... 567 563 4 0 048.0201 Graphic and Printing Equipment Operator, General ...................................................949 814 135 0 048.0205 Mechanical Typesetter and Composer .................................................................9 9 0 0 048.0206 Lithographer and Platemaker ........................................................................29 29 0 0 048.0208 Printing Press Operator ............................................................................ 56 56 0 0 048.0211 Computer Typography and Composition Equipment Operator .............................................101 101 0 0 048.0212 Desktop Publishing Equipment Operator ..............................................................60 60 0 0 048.0299 Graphic and Printing Equipment Operator, Other .....................................................168 154 14 0 048.0303 Upholsterer ........................................................................................ 2 2 0 0 048.0399 Leatherworkers and Upholsterers, Other .............................................................10 10 0 0 048.0501 Machinist / Machine Technologist ...................................................................552 550 2 0 048.0503 Machine Shop Assistant ............................................................................. 430 430 0 0 048.0506 Sheet Metal Worker ................................................................................. 18 18 0 0 048.0507 Tool and Die Maker / Technologist ..................................................................403 396 7 0 048.0508 Welder / Welding Technologist ......................................................................365 364 1 0 048.0599 Precision Metal Workers, Other ..................................................................... 27 27 0 0 048.0701 Woodworkers, General ............................................................................... 11 11 0 0 048.0702 Furniture Designer and Maker ....................................................................... 45 11 24 10 048.0703 Cabinet Maker and Millworker ....................................................................... 22 22 0 0 048.0799 Woodworkers, Other ............................................................... 15 5 10 0 048.9999 Precision Production Trades, Other .................................................................91 83 8 0 0
49.0000 Transportation and Material Moving Workers .........................................................4,951 1,009 3,206 736 0
49.0101 Aviation and Airway Science ........................................................................1,751 159 1,592 0 049.0102 Aircraft Pilot and Navigator (Professional) ........................................................1,842 457 749 636 049.0104 Aviation Management ................................................................................ 762 107 598 57 049.0105 Air Traffic Controller ............................................................................. 84 54 30 0 049.0106 Flight Attendant ................................................................................... 9 9 0 0 049.0107 Aircraft Pilot (Private) ........................................................................... 6 6 0 0 049.0199 Air Transportation Workers, Other ..................................................................116 74 0 42 049.0205 Truck, Bus and Other Commercial Vehicle Operator ...................................................4 4 0 0 049.0299 Vehicle and Equipment Operators, Other .............................................................6 6 0 0 049.0304 Diver (Professional) ............................................................................... 29 29 0 0 049.0306 Marine Maintenance and Ship Repairer ...............................................................32 32 0 0 049.0309 Marine Science / Merchant Marine Officer ...........................................................217 2 215 0 049.0399 Water Transportation Workers, Other ................................................................20 5 15 0 049.9999 Transportation and Materials Moving Workers, Other .................................................73 65 7 1 0
50.0000 Visual and Performing Arts .........................................................................79,365 14,980 52,077 11,145 1,163
50.0101 Visual and Performing Arts, General ................................................................1,860 420 1,320 115 550.0201 Crafts, Folk Art and Artisanry ..................................................................... 140 3 118 19 050.0301 Dance .............................................................................................. 1,347 64 1,084 194 550.0401 Design and Visual Communications ...................................................................2,719 1,309 1,270 140 050.0402 Graphic Design, Commercial Art and Illustration ....................................................9,699 5,274 4,043 382 050.0404 Industrial Design .................................................................................. 1,165 288 799 78 050.0406 Commercial Photography .............................................................................445 445 0 0 050.0407 Fashion Design and Illustration ....................................................................1,726 1,069 639 18 050.0408 Interior Design .................................................................................... 2,610 1,220 1,290 100 050.0499 Design and Applied Arts, Other .....................................................................1,120 612 400 108 050.0501 Drama / Theater Arts, General ......................................................................8,002 356 6,313 1,243 9050.0502 Technical Theater / Theater Design and Stagecraft ..................................................214 16 165 33 050.0503 Acting and Directing ............................................................................... 254 0 150 104 050.0504 Playwriting and Screenwriting ...................................................................... 5 0 4 1 050.0505 Drama / Theater Literature, History and Critcism ...................................................51 0 51 0 050.0599 Dramatic / Theater Arts and Stagecraft, Other ......................................................92 0 68 24 050.0601 Film / Cinema Studies .............................................................................. 828 0 713 109 650.0602 Film-Video Making / Cinematography and Production ..................................................2,219 652 1,188 369 1050.0605 Photography ........................................................................................ 1,319 306 869 141 350.0699 Film / Video and Photographic Arts, Other ..........................................................523 127 345 51 0
64
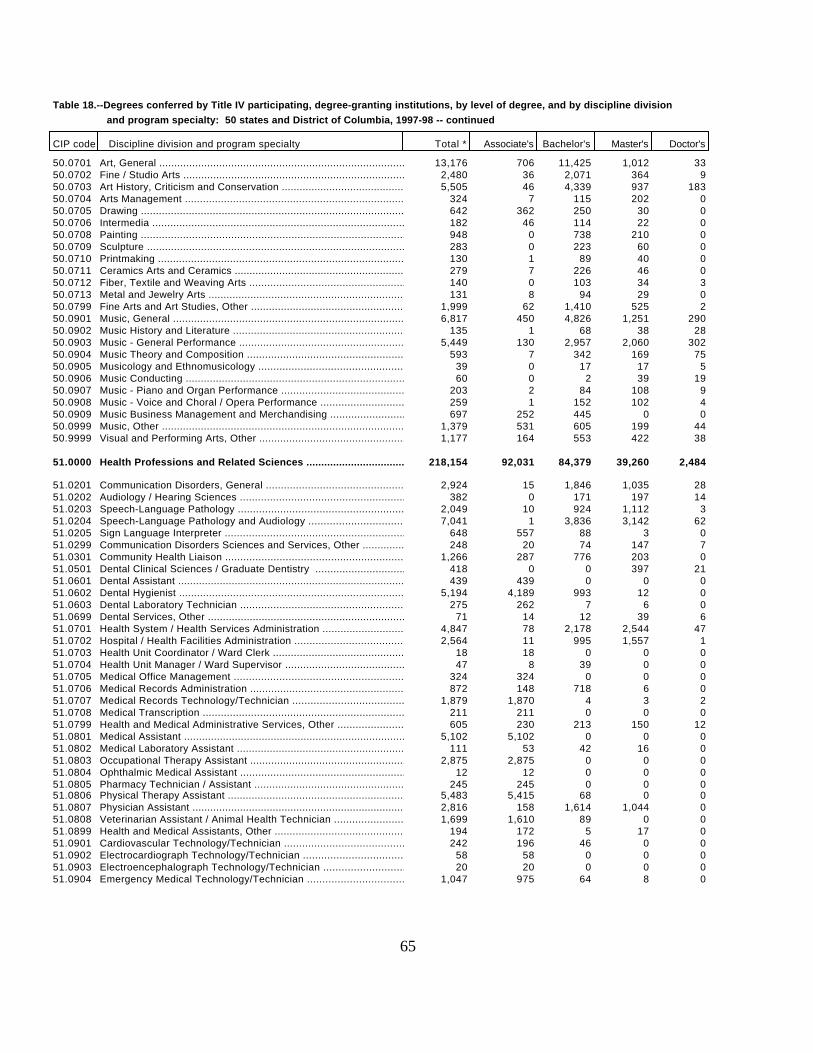
Table 18.--Degrees conferred by Title IV participating, degree-granting institutions, by level of degree, and by discipline division and program specialty: 50 states and District of Columbia, 1997-98 -- continued
CIP code Discipline division and program specialty Total * Associate's Bachelor's Master's Doctor's
50.0701 Art, General ....................................................................................... 13,176 706 11,425 1,012 3350.0702 Fine / Studio Arts ................................................................................. 2,480 36 2,071 364 950.0703 Art History, Criticism and Conservation ............................................................5,505 46 4,339 937 18350.0704 Arts Management .................................................................................... 324 7 115 202 050.0705 Drawing ............................................................................................ 642 362 250 30 050.0706 Intermedia ......................................................................................... 182 46 114 22 050.0708 Painting ........................................................................................... 948 0 738 210 050.0709 Sculpture .......................................................................................... 283 0 223 60 050.0710 Printmaking ........................................................................................ 130 1 89 40 050.0711 Ceramics Arts and Ceramics .........................................................................279 7 226 46 050.0712 Fiber, Textile and Weaving Arts ....................................................................140 0 103 34 350.0713 Metal and Jewelry Arts ............................................................................. 131 8 94 29 050.0799 Fine Arts and Art Studies, Other ...................................................................1,999 62 1,410 525 250.0901 Music, General ..................................................................................... 6,817 450 4,826 1,251 29050.0902 Music History and Literature ....................................................................... 135 1 68 38 2850.0903 Music - General Performance ........................................................................5,449 130 2,957 2,060 30250.0904 Music Theory and Composition .......................................................................593 7 342 169 7550.0905 Musicology and Ethnomusicology .....................................................................39 0 17 17 550.0906 Music Conducting ................................................................................... 60 0 2 39 1950.0907 Music - Piano and Organ Performance ................................................................203 2 84 108 950.0908 Music - Voice and Choral / Opera Performance .......................................................259 1 152 102 450.0909 Music Business Management and Merchandising ........................................................697 252 445 0 050.0999 Music, Other ....................................................................................... 1,379 531 605 199 4450.9999 Visual and Performing Arts, Other ..................................................................1,177 164 553 422 38
51.0000 Health Professions and Related Sciences ............................................................218,154 92,031 84,379 39,260 2,484
51.0201 Communication Disorders, General ...................................................................2,924 15 1,846 1,035 2851.0202 Audiology / Hearing Sciences .......................................................................382 0 171 197 1451.0203 Speech-Language Pathology ..........................................................................2,049 10 924 1,112 351.0204 Speech-Language Pathology and Audiology ............................................................7,041 1 3,836 3,142 6251.0205 Sign Language Interpreter .......................................................................... 648 557 88 3 051.0299 Communication Disorders Sciences and Services, Other ...............................................248 20 74 147 751.0301 Community Health Liaison ...........................................................................1,266 287 776 203 051.0501 Dental Clinical Sciences / Graduate Dentistry .....................................................418 0 0 397 2151.0601 Dental Assistant ................................................................................... 439 439 0 0 051.0602 Dental Hygienist ................................................................................... 5,194 4,189 993 12 051.0603 Dental Laboratory Technician .......................................................................275 262 7 6 051.0699 Dental Services, Other ............................................................................. 71 14 12 39 651.0701 Health System / Health Services Administration .....................................................4,847 78 2,178 2,544 4751.0702 Hospital / Health Facilities Administration ........................................................2,564 11 995 1,557 151.0703 Health Unit Coordinator / Ward Clerk ...............................................................18 18 0 0 051.0704 Health Unit Manager / Ward Supervisor ..............................................................47 8 39 0 051.0705 Medical Office Management ..........................................................................324 324 0 0 051.0706 Medical Records Administration .....................................................................872 148 718 6 051.0707 Medical Records Technology/Technician ..............................................................1,879 1,870 4 3 251.0708 Medical Transcription .............................................................................. 211 211 0 0 051.0799 Health and Medical Administrative Services, Other ..................................................605 230 213 150 1251.0801 Medical Assistant .................................................................................. 5,102 5,102 0 0 051.0802 Medical Laboratory Assistant .......................................................................111 53 42 16 051.0803 Occupational Therapy Assistant .....................................................................2,875 2,875 0 0 051.0804 Ophthalmic Medical Assistant ....................................................................... 12 12 0 0 051.0805 Pharmacy Technician / Assistant ....................................................................245 245 0 0 051.0806 Physical Therapy Assistant .........................................................................5,483 5,415 68 0 051.0807 Physician Assistant ................................................................................ 2,816 158 1,614 1,044 051.0808 Veterinarian Assistant / Animal Health Technician ..................................................1,699 1,610 89 0 051.0899 Health and Medical Assistants, Other ...............................................................194 172 5 17 051.0901 Cardiovascular Technology/Technician ...............................................................242 196 46 0 051.0902 Electrocardiograph Technology/Technician ...........................................................58 58 0 0 051.0903 Electroencephalograph Technology/Technician ........................................................20 20 0 0 051.0904 Emergency Medical Technology/Technician ............................................................1,047 975 64 8 0
65
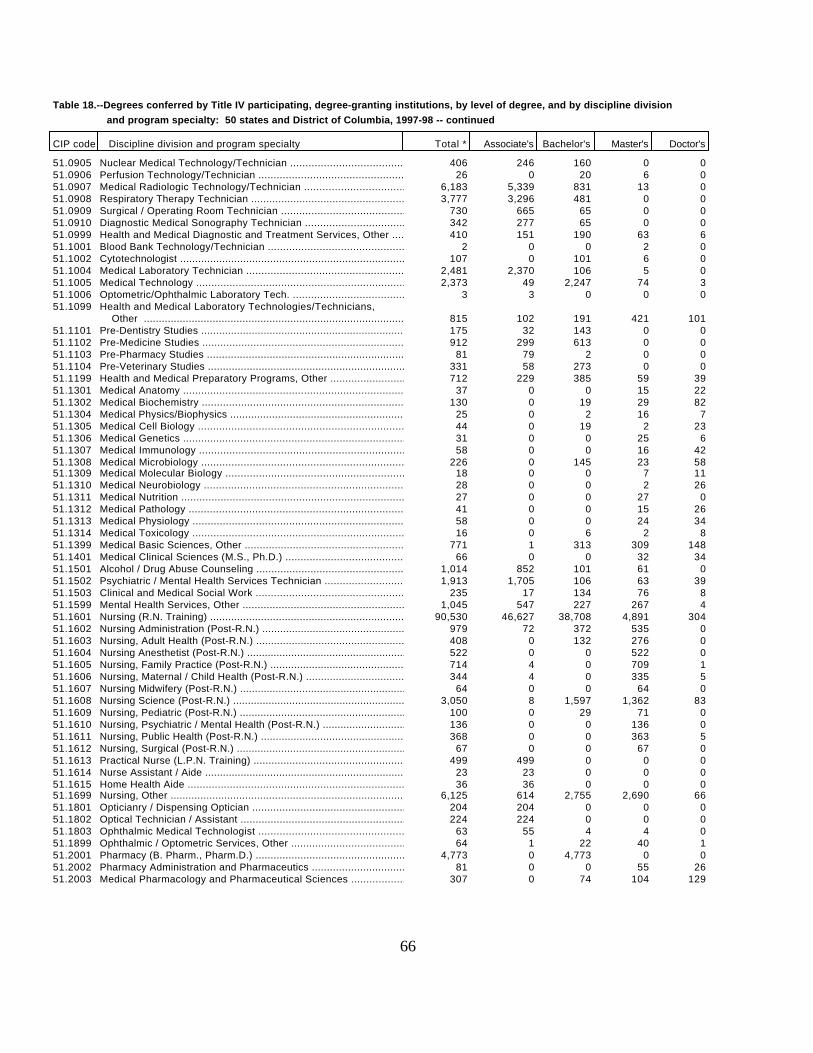
Table 18.--Degrees conferred by Title IV participating, degree-granting institutions, by level of degree, and by discipline division and program specialty: 50 states and District of Columbia, 1997-98 -- continued
CIP code Discipline division and program specialty Total * Associate's Bachelor's Master's Doctor's
51.0905 Nuclear Medical Technology/Technician ..............................................................406 246 160 0 051.0906 Perfusion Technology/Technician ....................................................................26 0 20 6 051.0907 Medical Radiologic Technology/Technician ...........................................................6,183 5,339 831 13 051.0908 Respiratory Therapy Technician .....................................................................3,777 3,296 481 0 051.0909 Surgical / Operating Room Technician ...............................................................730 665 65 0 051.0910 Diagnostic Medical Sonography Technician ...........................................................342 277 65 0 051.0999 Health and Medical Diagnostic and Treatment Services, Other ........................................410 151 190 63 651.1001 Blood Bank Technology/Technician ...................................................................2 0 0 2 051.1002 Cytotechnologist ................................................................................... 107 0 101 6 051.1004 Medical Laboratory Technician ......................................................................2,481 2,370 106 5 051.1005 Medical Technology .................................................................................2,373 49 2,247 74 351.1006 Optometric/Ophthalmic Laboratory Tech. .............................................................3 3 0 0 051.1099 Health and Medical Laboratory Technologies/Technicians,
Other ......................................................................................... 815 102 191 421 10151.1101 Pre-Dentistry Studies .............................................................................. 175 32 143 0 051.1102 Pre-Medicine Studies ............................................................................... 912 299 613 0 051.1103 Pre-Pharmacy Studies ............................................................................... 81 79 2 0 051.1104 Pre-Veterinary Studies ............................................................................. 331 58 273 0 051.1199 Health and Medical Preparatory Programs, Other .....................................................712 229 385 59 3951.1301 Medical Anatomy .................................................................................... 37 0 0 15 2251.1302 Medical Biochemistry ............................................................................... 130 0 19 29 8251.1304 Medical Physics/Biophysics ......................................................................... 25 0 2 16 751.1305 Medical Cell Biology ............................................................................... 44 0 19 2 2351.1306 Medical Genetics ................................................................................... 31 0 0 25 651.1307 Medical Immunology ................................................................................. 58 0 0 16 4251.1308 Medical Microbiology ............................................................................... 226 0 145 23 5851.1309 Medical Molecular Biology .......................................................................... 18 0 0 7 1151.1310 Medical Neurobiology ............................................................................... 28 0 0 2 2651.1311 Medical Nutrition .................................................................................. 27 0 0 27 051.1312 Medical Pathology .................................................................................. 41 0 0 15 2651.1313 Medical Physiology ................................................................................. 58 0 0 24 3451.1314 Medical Toxicology ................................................................................. 16 0 6 2 851.1399 Medical Basic Sciences, Other ......................................................................771 1 313 309 14851.1401 Medical Clinical Sciences (M.S., Ph.D.) ............................................................66 0 0 32 3451.1501 Alcohol / Drug Abuse Counseling ....................................................................1,014 852 101 61 051.1502 Psychiatric / Mental Health Services Technician ....................................................1,913 1,705 106 63 3951.1503 Clinical and Medical Social Work ...................................................................235 17 134 76 851.1599 Mental Health Services, Other ......................................................................1,045 547 227 267 451.1601 Nursing (R.N. Training) ............................................................................90,530 46,627 38,708 4,891 30451.1602 Nursing Administration (Post-R.N.) .................................................................979 72 372 535 051.1603 Nursing, Adult Health (Post-R.N.) ..................................................................408 0 132 276 051.1604 Nursing Anesthetist (Post-R.N.) .................................................................... 522 0 0 522 051.1605 Nursing, Family Practice (Post-R.N.) ...............................................................714 4 0 709 151.1606 Nursing, Maternal / Child Health (Post-R.N.) .......................................................344 4 0 335 551.1607 Nursing Midwifery (Post-R.N.) ...................................................................... 64 0 0 64 051.1608 Nursing Science (Post-R.N.) ........................................................................3,050 8 1,597 1,362 8351.1609 Nursing, Pediatric (Post-R.N.) ..................................................................... 100 0 29 71 051.1610 Nursing, Psychiatric / Mental Health (Post-R.N.) ...................................................136 0 0 136 051.1611 Nursing, Public Health (Post-R.N.) .................................................................368 0 0 363 551.1612 Nursing, Surgical (Post-R.N.) ...................................................................... 67 0 0 67 051.1613 Practical Nurse (L.P.N. Training) ..................................................................499 499 0 0 051.1614 Nurse Assistant / Aide ............................................................................. 23 23 0 0 051.1615 Home Health Aide ................................................................................... 36 36 0 0 051.1699 Nursing, Other ..................................................................................... 6,125 614 2,755 2,690 6651.1801 Opticianry / Dispensing Optician ...................................................................204 204 0 0 051.1802 Optical Technician / Assistant ..................................................................... 224 224 0 0 051.1803 Ophthalmic Medical Technologist ....................................................................63 55 4 4 051.1899 Ophthalmic / Optometric Services, Other ............................................................64 1 22 40 151.2001 Pharmacy (B. Pharm., Pharm.D.) .....................................................................4,773 0 4,773 0 051.2002 Pharmacy Administration and Pharmaceutics ..........................................................81 0 0 55 2651.2003 Medical Pharmacology and Pharmaceutical Sciences ...................................................307 0 74 104 129
66
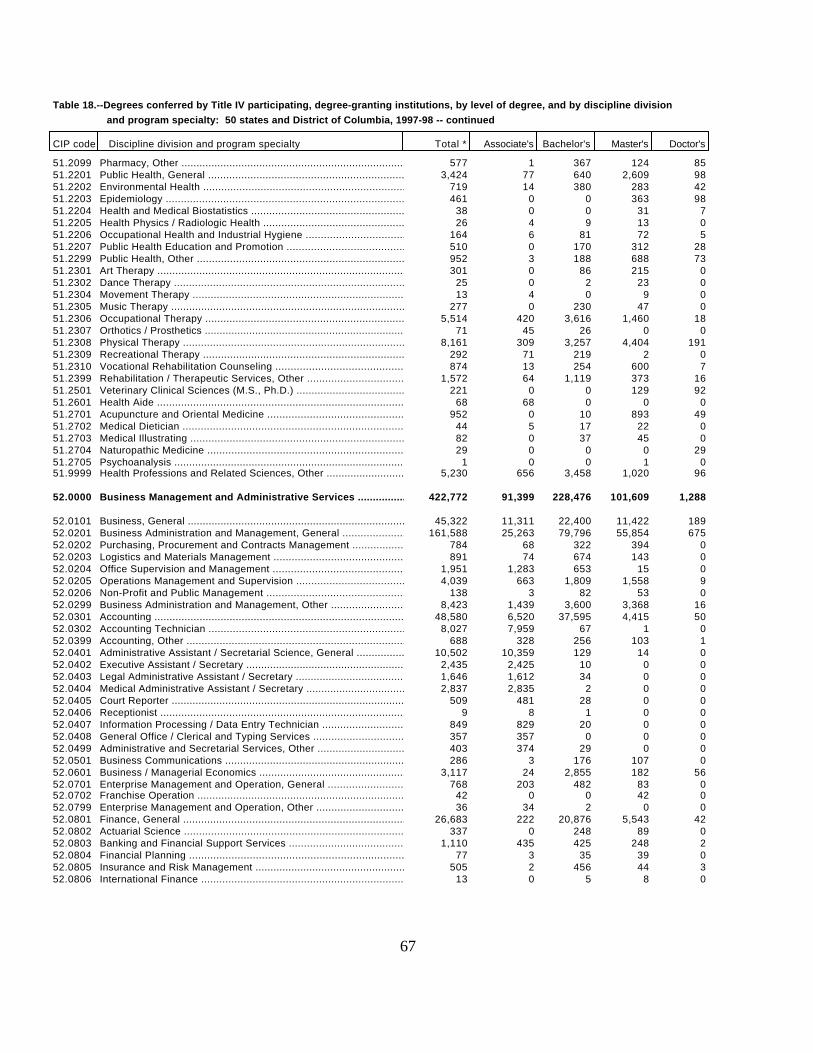
Table 18.--Degrees conferred by Title IV participating, degree-granting institutions, by level of degree, and by discipline division and program specialty: 50 states and District of Columbia, 1997-98 -- continued
CIP code Discipline division and program specialty Total * Associate's Bachelor's Master's Doctor's
51.2099 Pharmacy, Other .................................................................................... 577 1 367 124 8551.2201 Public Health, General .............................................................................3,424 77 640 2,609 9851.2202 Environmental Health ............................................................................... 719 14 380 283 4251.2203 Epidemiology ....................................................................................... 461 0 0 363 9851.2204 Health and Medical Biostatistics ................................................................... 38 0 0 31 751.2205 Health Physics / Radiologic Health .................................................................26 4 9 13 051.2206 Occupational Health and Industrial Hygiene .........................................................164 6 81 72 551.2207 Public Health Education and Promotion ..............................................................510 0 170 312 2851.2299 Public Health, Other ............................................................................... 952 3 188 688 7351.2301 Art Therapy ........................................................................................ 301 0 86 215 051.2302 Dance Therapy ...................................................................................... 25 0 2 23 051.2304 Movement Therapy ................................................................................... 13 4 0 9 051.2305 Music Therapy ...................................................................................... 277 0 230 47 051.2306 Occupational Therapy ...............................................................................5,514 420 3,616 1,460 1851.2307 Orthotics / Prosthetics ............................................................................ 71 45 26 0 051.2308 Physical Therapy ................................................................................... 8,161 309 3,257 4,404 19151.2309 Recreational Therapy ............................................................................... 292 71 219 2 051.2310 Vocational Rehabilitation Counseling ...............................................................874 13 254 600 751.2399 Rehabilitation / Therapeutic Services, Other .......................................................1,572 64 1,119 373 1651.2501 Veterinary Clinical Sciences (M.S., Ph.D.) .........................................................221 0 0 129 9251.2601 Health Aide ........................................................................................ 68 68 0 0 051.2701 Acupuncture and Oriental Medicine ..................................................................952 0 10 893 4951.2702 Medical Dietician .................................................................................. 44 5 17 22 051.2703 Medical Illustrating ............................................................................... 82 0 37 45 051.2704 Naturopathic Medicine .............................................................................. 29 0 0 0 2951.2705 Psychoanalysis ..................................................................................... 1 0 0 1 051.9999 Health Professions and Related Sciences, Other .....................................................5,230 656 3,458 1,020 96
52.0000 Business Management and Administrative Services ....................................................422,772 91,399 228,476 101,609 1,288
52.0101 Business, General .................................................................................. 45,322 11,311 22,400 11,422 18952.0201 Business Administration and Management, General ....................................................161,588 25,263 79,796 55,854 67552.0202 Purchasing, Procurement and Contracts Management ...................................................784 68 322 394 052.0203 Logistics and Materials Management .................................................................891 74 674 143 052.0204 Office Supervision and Management ..................................................................1,951 1,283 653 15 052.0205 Operations Management and Supervision ..............................................................4,039 663 1,809 1,558 952.0206 Non-Profit and Public Management ...................................................................138 3 82 53 052.0299 Business Administration and Management, Other ......................................................8,423 1,439 3,600 3,368 1652.0301 Accounting ......................................................................................... 48,580 6,520 37,595 4,415 5052.0302 Accounting Technician ..............................................................................8,027 7,959 67 1 052.0399 Accounting, Other .................................................................................. 688 328 256 103 152.0401 Administrative Assistant / Secretarial Science, General ............................................10,502 10,359 129 14 052.0402 Executive Assistant / Secretary ....................................................................2,435 2,425 10 0 052.0403 Legal Administrative Assistant / Secretary .........................................................1,646 1,612 34 0 052.0404 Medical Administrative Assistant / Secretary .......................................................2,837 2,835 2 0 052.0405 Court Reporter ..................................................................................... 509 481 28 0 052.0406 Receptionist ....................................................................................... 9 8 1 0 052.0407 Information Processing / Data Entry Technician .....................................................849 829 20 0 052.0408 General Office / Clerical and Typing Services ......................................................357 357 0 0 052.0499 Administrative and Secretarial Services, Other .....................................................403 374 29 0 052.0501 Business Communications ............................................................................286 3 176 107 052.0601 Business / Managerial Economics ....................................................................3,117 24 2,855 182 5652.0701 Enterprise Management and Operation, General .......................................................768 203 482 83 052.0702 Franchise Operation ..................................................................... 42 0 0 42 052.0799 Enterprise Management and Operation, Other .........................................................36 34 2 0 052.0801 Finance, General ................................................................................... 26,683 222 20,876 5,543 4252.0802 Actuarial Science .................................................................................. 337 0 248 89 052.0803 Banking and Financial Support Services .............................................................1,110 435 425 248 252.0804 Financial Planning ................................................................................. 77 3 35 39 052.0805 Insurance and Risk Management ......................................................................505 2 456 44 352.0806 International Finance .............................................................................. 13 0 5 8 0
67
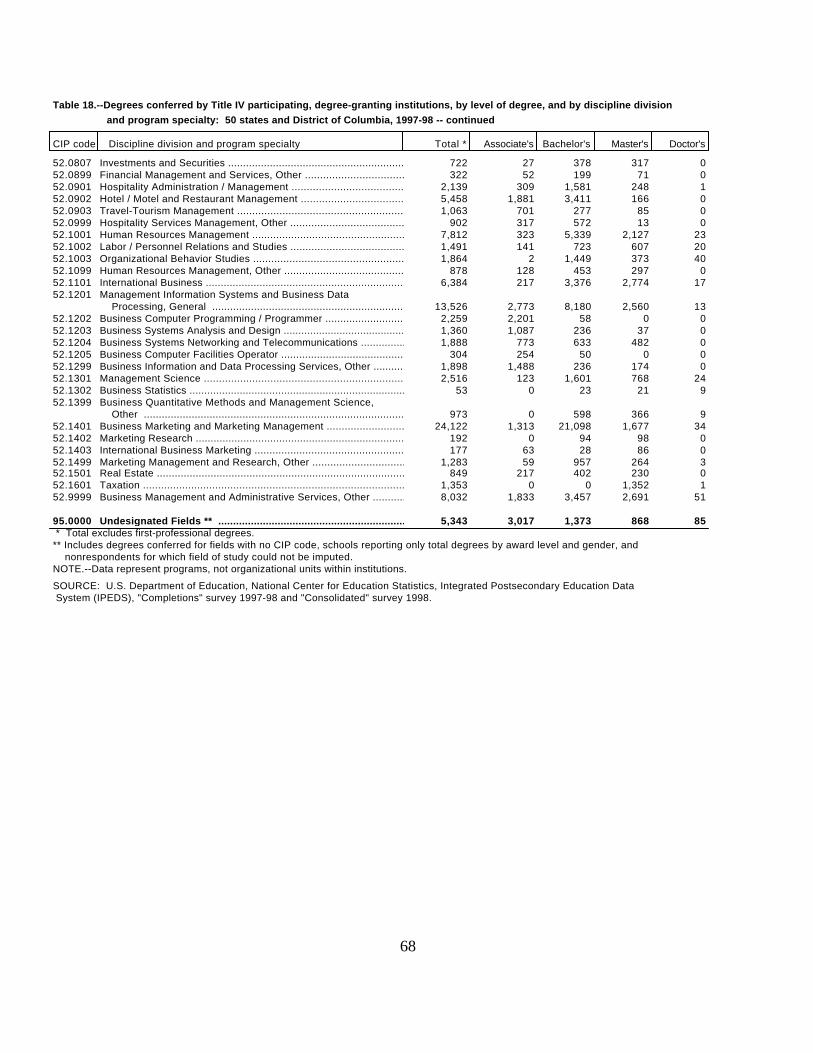
Table 18.--Degrees conferred by Title IV participating, degree-granting institutions, by level of degree, and by discipline division and program specialty: 50 states and District of Columbia, 1997-98 -- continued
CIP code Discipline division and program specialty Total * Associate's Bachelor's Master's Doctor's
52.0807 Investments and Securities ......................................................................... 722 27 378 317 052.0899 Financial Management and Services, Other ...........................................................322 52 199 71 052.0901 Hospitality Administration / Management ............................................................2,139 309 1,581 248 152.0902 Hotel / Motel and Restaurant Management ............................................................5,458 1,881 3,411 166 052.0903 Travel-Tourism Management ..........................................................................1,063 701 277 85 052.0999 Hospitality Services Management, Other .............................................................902 317 572 13 052.1001 Human Resources Management .........................................................................7,812 323 5,339 2,127 2352.1002 Labor / Personnel Relations and Studies ............................................................1,491 141 723 607 2052.1003 Organizational Behavior Studies ....................................................................1,864 2 1,449 373 4052.1099 Human Resources Management, Other ..................................................................878 128 453 297 052.1101 International Business ............................................................................. 6,384 217 3,376 2,774 1752.1201 Management Information Systems and Business Data
Processing, General ...........................................................................13,526 2,773 8,180 2,560 1352.1202 Business Computer Programming / Programmer .........................................................2,259 2,201 58 0 052.1203 Business Systems Analysis and Design ...............................................................1,360 1,087 236 37 052.1204 Business Systems Networking and Telecommunications .................................................1,888 773 633 482 052.1205 Business Computer Facilities Operator ..............................................................304 254 50 0 052.1299 Business Information and Data Processing Services, Other ...........................................1,898 1,488 236 174 052.1301 Management Science .................................................................................2,516 123 1,601 768 2452.1302 Business Statistics ................................................................................ 53 0 23 21 952.1399 Business Quantitative Methods and Management Science,
Other ......................................................................................... 973 0 598 366 952.1401 Business Marketing and Marketing Management ........................................................24,122 1,313 21,098 1,677 3452.1402 Marketing Research ................................................................................. 192 0 94 98 052.1403 International Business Marketing ...................................................................177 63 28 86 052.1499 Marketing Management and Research, Other ...........................................................1,283 59 957 264 352.1501 Real Estate ........................................................................................ 849 217 402 230 052.1601 Taxation ........................................................................................... 1,353 0 0 1,352 152.9999 Business Management and Administrative Services, Other .............................................8,032 1,833 3,457 2,691 51
95.0000 Undesignated Fields ** ...............................................................................5,343 3,017 1,373 868 85 * Total excludes first-professional degrees.** Includes degrees conferred for fields with no CIP code, schools reporting only total degrees by award level and gender, and nonrespondents for which field of study could not be imputed.NOTE.--Data represent programs, not organizational units within institutions.
SOURCE: U.S. Department of Education, National Center for Education Statistics, Integrated Postsecondary Education Data System (IPEDS), "Completions" survey 1997-98 and "Consolidated" survey 1998.
68
69
Methodology Overview The 1997-98 Completions ( C ) survey was mailed to 4,730 Title IV participating institutions of higher education in the 50 states, District of Columbia, and the outlying areas. In addition, the Consolidated (CN) survey form, which also requested completions data, was mailed to 4,985 other schools offering degrees or awards ranging from certificates of less-than-one-year to post-master's certificates. The completions data collected by the CN survey were extracted, reformatted, and incorporated into the file along with the C data. Universe, Institutions Surveyed and Response Rates A major subset of all postsecondary institutions are those institutions that have Program Participation Agreements (PPA) with the Department of Education and thus may participate in Title IV federal financial aid programs. It is this group of institutions that annually receives a Completions survey. Beginning in 1996, this subset of institutions was validated by matching the IPEDS universe with the Postsecondary Education Participation System (PEPS) file which is maintained by the Office of Postsecondary Education (OPE). This validation process determined that 6,897 institutions would receive one of the survey forms. The 1997-98 survey forms were mailed in July 1998 to a universe of all 4-year, 2-year, and less than 2-year schools. The survey results were collected from October 1998 through April 1999. During this time period institutions determined to be out-of-scope were deleted from the universe. These deletions resulted from formal notification by IPEDS state coordinators, validation against the PEPS file, and from followup telephone calls. Included in the deletions were schools that had closed, did not offer postsecondary programs, or that were identified as duplicates on the file. At the conclusion of this process, 9,519 institutions remained in-scope. Followup for nonresponse began in November 1998 and was conducted by letter and telephone. The Postsecondary Education Telephone System (PETS) was used to solicit data from the nonrespondents to the surveys in those institutions for which IPEDS state coordinators were not responsible for followup. Schools responding through PETS were asked to provide only the total number of completions, by award level and gender; racial/ethnic data were not requested. Table M-1 shows the number of institutions that were mailed the 1997-98 Completions survey (or Consolidated form) by level and control of institution (sector); the final in-scope universe of institutions receiving either survey form; the number of in-scope institutions that responded; and the response rates.
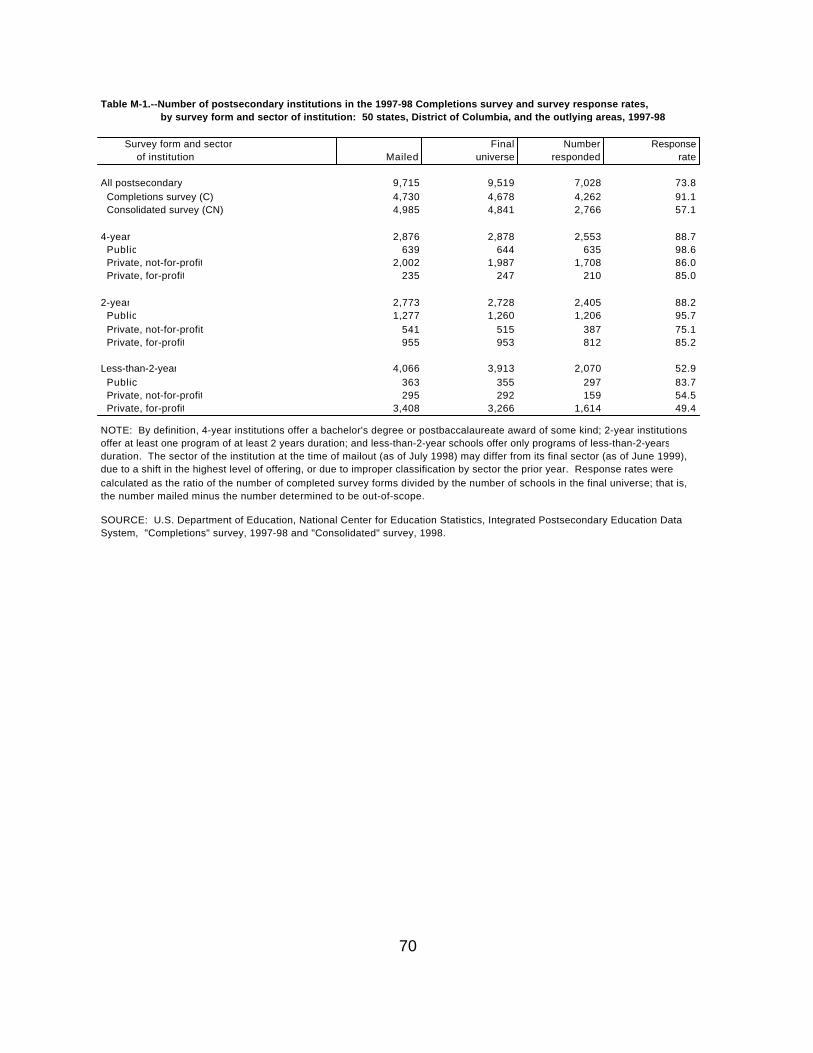
Table M-1.--Number of postsecondary institutions in the 1997-98 Completions survey and survey response rates, by survey form and sector of institution: 50 states, District of Columbia, and the outlying areas, 1997-98
Survey form and sector Final Number Response of institution Mailed universe responded rate
All postsecondary 9,715 9,519 7,028 73.8 Completions survey (C) 4,730 4,678 4,262 91.1 Consolidated survey (CN) 4,985 4,841 2,766 57.1
4-year 2,876 2,878 2,553 88.7 Public 639 644 635 98.6 Private, not-for-profit 2,002 1,987 1,708 86.0 Private, for-profit 235 247 210 85.0
2-year 2,773 2,728 2,405 88.2 Public 1,277 1,260 1,206 95.7 Private, not-for-profit 541 515 387 75.1 Private, for-profit 955 953 812 85.2
Less-than-2-year 4,066 3,913 2,070 52.9 Public 363 355 297 83.7 Private, not-for-profit 295 292 159 54.5 Private, for-profit 3,408 3,266 1,614 49.4
NOTE: By definition, 4-year institutions offer a bachelor's degree or postbaccalaureate award of some kind; 2-year institutionsoffer at least one program of at least 2 years duration; and less-than-2-year schools offer only programs of less-than-2-yearsduration. The sector of the institution at the time of mailout (as of July 1998) may differ from its final sector (as of June 1999),due to a shift in the highest level of offering, or due to improper classification by sector the prior year. Response rates were calculated as the ratio of the number of completed survey forms divided by the number of schools in the final universe; that is,the number mailed minus the number determined to be out-of-scope.
SOURCE: U.S. Department of Education, National Center for Education Statistics, Integrated Postsecondary Education Data System, "Completions" survey, 1997-98 and "Consolidated" survey, 1998.
70
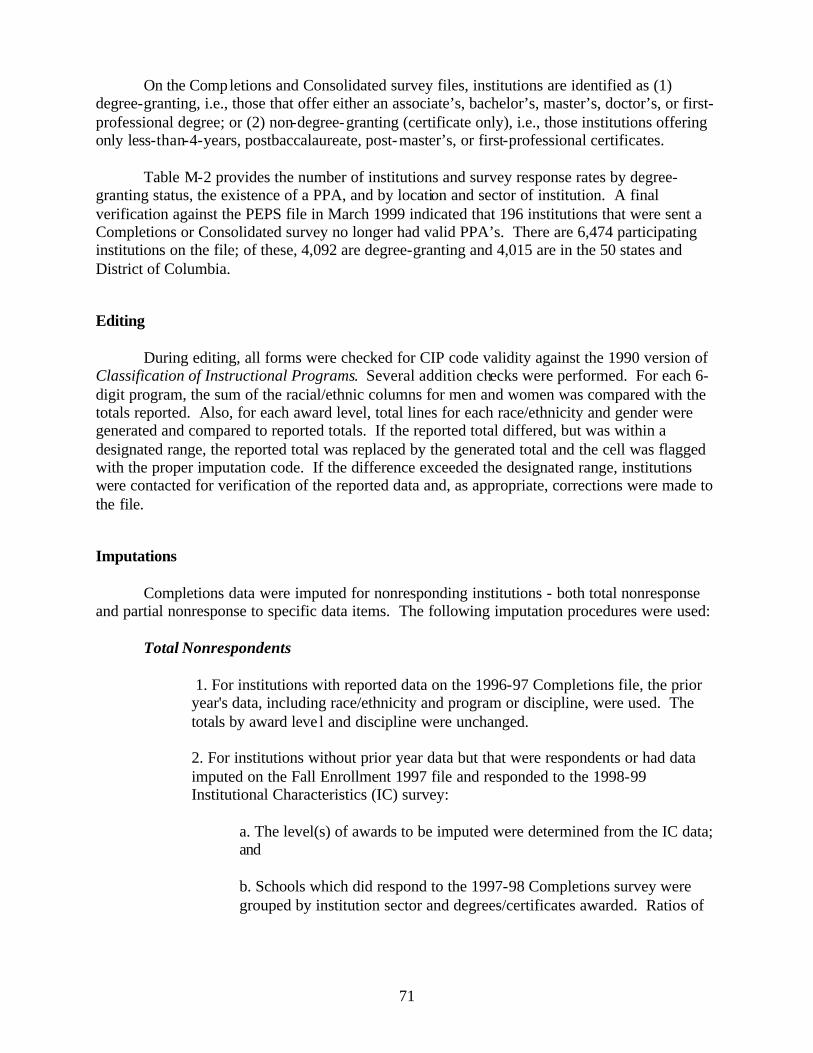
71
On the Completions and Consolidated survey files, institutions are identified as (1) degree-granting, i.e., those that offer either an associate’s, bachelor’s, master’s, doctor’s, or first-professional degree; or (2) non-degree-granting (certificate only), i.e., those institutions offering only less-than-4-years, postbaccalaureate, post-master’s, or first-professional certificates. Table M-2 provides the number of institutions and survey response rates by degree-granting status, the existence of a PPA, and by location and sector of institution. A final verification against the PEPS file in March 1999 indicated that 196 institutions that were sent a Completions or Consolidated survey no longer had valid PPA’s. There are 6,474 participating institutions on the file; of these, 4,092 are degree-granting and 4,015 are in the 50 states and District of Columbia. Editing During editing, all forms were checked for CIP code validity against the 1990 version of Classification of Instructional Programs. Several addition checks were performed. For each 6-digit program, the sum of the racial/ethnic columns for men and women was compared with the totals reported. Also, for each award level, total lines for each race/ethnicity and gender were generated and compared to reported totals. If the reported total differed, but was within a designated range, the reported total was replaced by the generated total and the cell was flagged with the proper imputation code. If the difference exceeded the designated range, institutions were contacted for verification of the reported data and, as appropriate, corrections were made to the file. Imputations Completions data were imputed for nonresponding institutions - both total nonresponse and partial nonresponse to specific data items. The following imputation procedures were used: Total Nonrespondents
1. For institutions with reported data on the 1996-97 Completions file, the prior year's data, including race/ethnicity and program or discipline, were used. The totals by award leve l and discipline were unchanged.
2. For institutions without prior year data but that were respondents or had data imputed on the Fall Enrollment 1997 file and responded to the 1998-99 Institutional Characteristics (IC) survey:
a. The level(s) of awards to be imputed were determined from the IC data; and
b. Schools which did respond to the 1997-98 Completions survey were grouped by institution sector and degrees/certificates awarded. Ratios of
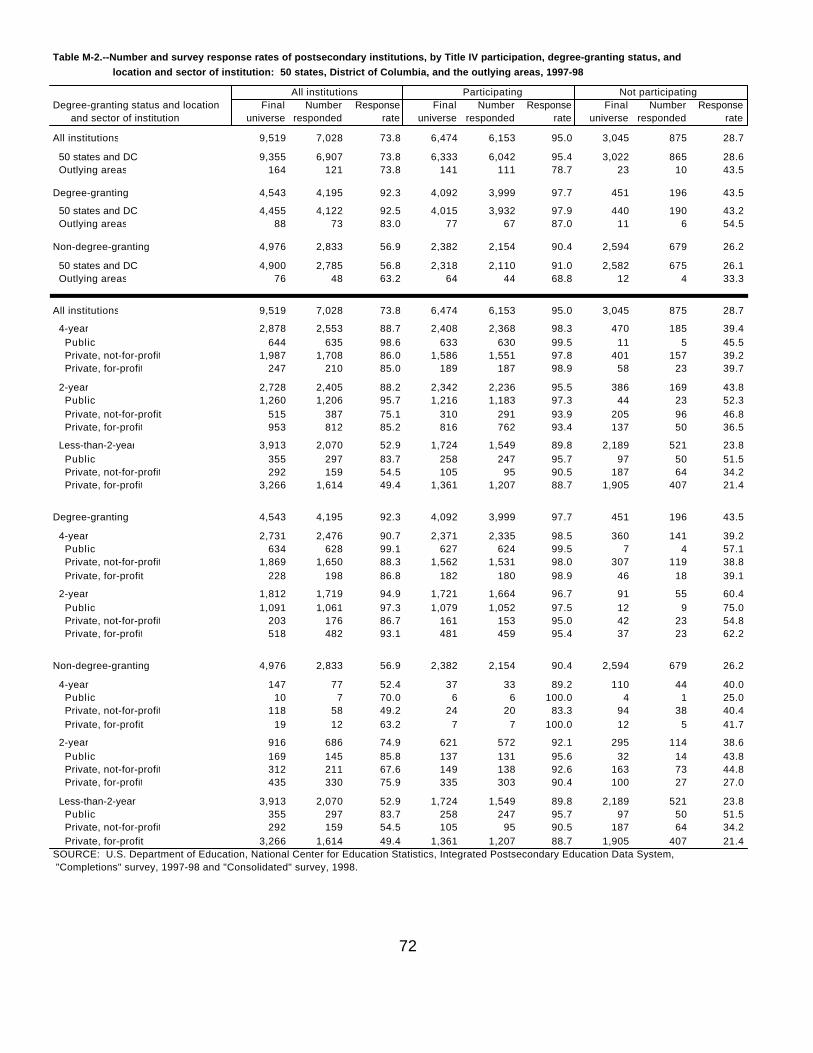
Table M-2.--Number and survey response rates of postsecondary institutions, by Title IV participation, degree-granting status, and location and sector of institution: 50 states, District of Columbia, and the outlying areas, 1997-98
All institutions Participating Not participatingDegree-granting status and location Final Number Response Final Number Response Final Number Response and sector of institution universe responded rate universe responded rate universe responded rate
All institutions 9,519 7,028 73.8 6,474 6,153 95.0 3,045 875 28.7
50 states and DC 9,355 6,907 73.8 6,333 6,042 95.4 3,022 865 28.6 Outlying areas 164 121 73.8 141 111 78.7 23 10 43.5
Degree-granting 4,543 4,195 92.3 4,092 3,999 97.7 451 196 43.5
50 states and DC 4,455 4,122 92.5 4,015 3,932 97.9 440 190 43.2 Outlying areas 88 73 83.0 77 67 87.0 11 6 54.5
Non-degree-granting 4,976 2,833 56.9 2,382 2,154 90.4 2,594 679 26.2
50 states and DC 4,900 2,785 56.8 2,318 2,110 91.0 2,582 675 26.1 Outlying areas 76 48 63.2 64 44 68.8 12 4 33.3
All institutions 9,519 7,028 73.8 6,474 6,153 95.0 3,045 875 28.7
4-year 2,878 2,553 88.7 2,408 2,368 98.3 470 185 39.4 Public 644 635 98.6 633 630 99.5 11 5 45.5 Private, not-for-profit 1,987 1,708 86.0 1,586 1,551 97.8 401 157 39.2 Private, for-profit 247 210 85.0 189 187 98.9 58 23 39.7
2-year 2,728 2,405 88.2 2,342 2,236 95.5 386 169 43.8 Public 1,260 1,206 95.7 1,216 1,183 97.3 44 23 52.3 Private, not-for-profit 515 387 75.1 310 291 93.9 205 96 46.8 Private, for-profit 953 812 85.2 816 762 93.4 137 50 36.5
Less-than-2-year 3,913 2,070 52.9 1,724 1,549 89.8 2,189 521 23.8 Public 355 297 83.7 258 247 95.7 97 50 51.5 Private, not-for-profit 292 159 54.5 105 95 90.5 187 64 34.2 Private, for-profit 3,266 1,614 49.4 1,361 1,207 88.7 1,905 407 21.4
Degree-granting 4,543 4,195 92.3 4,092 3,999 97.7 451 196 43.5
4-year 2,731 2,476 90.7 2,371 2,335 98.5 360 141 39.2 Public 634 628 99.1 627 624 99.5 7 4 57.1 Private, not-for-profit 1,869 1,650 88.3 1,562 1,531 98.0 307 119 38.8 Private, for-profit 228 198 86.8 182 180 98.9 46 18 39.1
2-year 1,812 1,719 94.9 1,721 1,664 96.7 91 55 60.4 Public 1,091 1,061 97.3 1,079 1,052 97.5 12 9 75.0 Private, not-for-profit 203 176 86.7 161 153 95.0 42 23 54.8 Private, for-profit 518 482 93.1 481 459 95.4 37 23 62.2
Non-degree-granting 4,976 2,833 56.9 2,382 2,154 90.4 2,594 679 26.2
4-year 147 77 52.4 37 33 89.2 110 44 40.0 Public 10 7 70.0 6 6 100.0 4 1 25.0 Private, not-for-profit 118 58 49.2 24 20 83.3 94 38 40.4 Private, for-profit 19 12 63.2 7 7 100.0 12 5 41.7
2-year 916 686 74.9 621 572 92.1 295 114 38.6 Public 169 145 85.8 137 131 95.6 32 14 43.8 Private, not-for-profit 312 211 67.6 149 138 92.6 163 73 44.8 Private, for-profit 435 330 75.9 335 303 90.4 100 27 27.0
Less-than-2-year 3,913 2,070 52.9 1,724 1,549 89.8 2,189 521 23.8 Public 355 297 83.7 258 247 95.7 97 50 51.5 Private, not-for-profit 292 159 54.5 105 95 90.5 187 64 34.2 Private, for-profit 3,266 1,614 49.4 1,361 1,207 88.7 1,905 407 21.4SOURCE: U.S. Department of Education, National Center for Education Statistics, Integrated Postsecondary Education Data System, "Completions" survey, 1997-98 and "Consolidated" survey, 1998.
72
73
the number of degrees by award level, race, and gender to enrollment by level, race, and gender were developed, and these ratios were applied to the nonresponding institution's enrollment data to compute estimated total completions by award level, race, and gender.
c. No imputations were made by program or discipline. (Note: These show as “undesignated” in the tables
3. For institutions with neither 1996-97 Completions data nor Fall Enrollment 1997 data, but which did have data on the 1998-99 IC file, the levels of awards to be imputed were again determined from the IC data and responding institutions were grouped by institution sector and degrees/certificates awarded. The mean numbers of degrees by award level, race, and gender from respondents in each group were used as the imputed values for nonresponding institutions within that same group.
Partial Nonrespondents
Partial imputations were performed for those institutions that failed to report race/ethnicity and/or data by program or discipline, but provided total awards by level of award and gender.
1. If prior year Completions data were available, the distributions for levels of awards, race/ethnicity and discipline reported in the prior year were applied to current year reported total awards.
2. If no prior year Completions data were available, the distributions of reported total awards by race/ethnicity within degree levels and gender were based on a group of similar institutions, as defined by institutional sector and degrees/certificates awarded.
Table M-3 provides the number and percentage of degrees imputed for each award level, by gender.
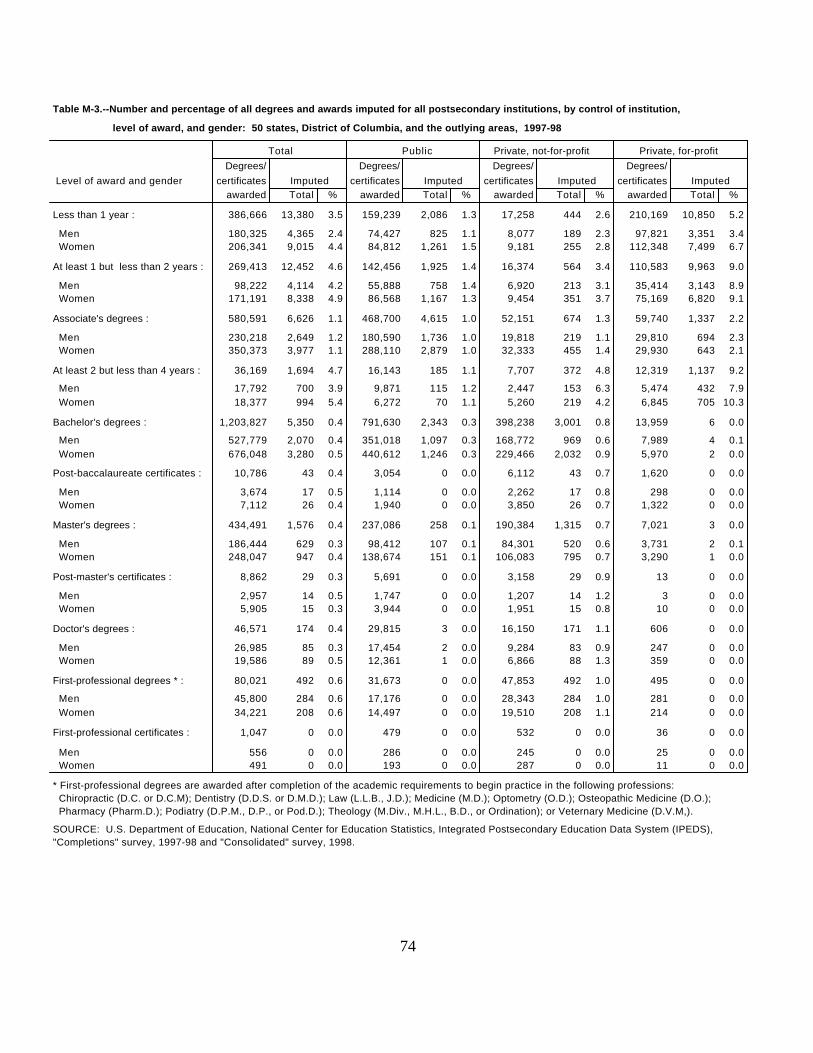
Table M-3.--Number and percentage of all degrees and awards imputed for all postsecondary institutions, by control of institution,
level of award, and gender: 50 states, District of Columbia, and the outlying areas, 1997-98
Total Public Private, not-for-profit Private, for-profitDegrees/ Degrees/ Degrees/ Degrees/
Level of award and gender certificates Imputed certificates Imputed certificates Imputed certificates Imputedawarded Total % awarded Total % awarded Total % awarded Total %
Less than 1 year : 386,666 13,380 3.5 159,239 2,086 1.3 17,258 444 2.6 210,169 10,850 5.2
Men 180,325 4,365 2.4 74,427 825 1.1 8,077 189 2.3 97,821 3,351 3.4 Women 206,341 9,015 4.4 84,812 1,261 1.5 9,181 255 2.8 112,348 7,499 6.7
At least 1 but less than 2 years : 269,413 12,452 4.6 142,456 1,925 1.4 16,374 564 3.4 110,583 9,963 9.0
Men 98,222 4,114 4.2 55,888 758 1.4 6,920 213 3.1 35,414 3,143 8.9 Women 171,191 8,338 4.9 86,568 1,167 1.3 9,454 351 3.7 75,169 6,820 9.1
Associate's degrees : 580,591 6,626 1.1 468,700 4,615 1.0 52,151 674 1.3 59,740 1,337 2.2
Men 230,218 2,649 1.2 180,590 1,736 1.0 19,818 219 1.1 29,810 694 2.3 Women 350,373 3,977 1.1 288,110 2,879 1.0 32,333 455 1.4 29,930 643 2.1
At least 2 but less than 4 years : 36,169 1,694 4.7 16,143 185 1.1 7,707 372 4.8 12,319 1,137 9.2
Men 17,792 700 3.9 9,871 115 1.2 2,447 153 6.3 5,474 432 7.9 Women 18,377 994 5.4 6,272 70 1.1 5,260 219 4.2 6,845 705 10.3
Bachelor's degrees : 1,203,827 5,350 0.4 791,630 2,343 0.3 398,238 3,001 0.8 13,959 6 0.0
Men 527,779 2,070 0.4 351,018 1,097 0.3 168,772 969 0.6 7,989 4 0.1 Women 676,048 3,280 0.5 440,612 1,246 0.3 229,466 2,032 0.9 5,970 2 0.0
Post-baccalaureate certificates : 10,786 43 0.4 3,054 0 0.0 6,112 43 0.7 1,620 0 0.0
Men 3,674 17 0.5 1,114 0 0.0 2,262 17 0.8 298 0 0.0 Women 7,112 26 0.4 1,940 0 0.0 3,850 26 0.7 1,322 0 0.0
Master's degrees : 434,491 1,576 0.4 237,086 258 0.1 190,384 1,315 0.7 7,021 3 0.0
Men 186,444 629 0.3 98,412 107 0.1 84,301 520 0.6 3,731 2 0.1 Women 248,047 947 0.4 138,674 151 0.1 106,083 795 0.7 3,290 1 0.0
Post-master's certificates : 8,862 29 0.3 5,691 0 0.0 3,158 29 0.9 13 0 0.0
Men 2,957 14 0.5 1,747 0 0.0 1,207 14 1.2 3 0 0.0 Women 5,905 15 0.3 3,944 0 0.0 1,951 15 0.8 10 0 0.0
Doctor's degrees : 46,571 174 0.4 29,815 3 0.0 16,150 171 1.1 606 0 0.0
Men 26,985 85 0.3 17,454 2 0.0 9,284 83 0.9 247 0 0.0 Women 19,586 89 0.5 12,361 1 0.0 6,866 88 1.3 359 0 0.0
First-professional degrees * : 80,021 492 0.6 31,673 0 0.0 47,853 492 1.0 495 0 0.0
Men 45,800 284 0.6 17,176 0 0.0 28,343 284 1.0 281 0 0.0 Women 34,221 208 0.6 14,497 0 0.0 19,510 208 1.1 214 0 0.0
First-professional certificates : 1,047 0 0.0 479 0 0.0 532 0 0.0 36 0 0.0
Men 556 0 0.0 286 0 0.0 245 0 0.0 25 0 0.0 Women 491 0 0.0 193 0 0.0 287 0 0.0 11 0 0.0
* First-professional degrees are awarded after completion of the academic requirements to begin practice in the following professions: Chiropractic (D.C. or D.C.M); Dentistry (D.D.S. or D.M.D.); Law (L.L.B., J.D.); Medicine (M.D.); Optometry (O.D.); Osteopathic Medicine (D.O.); Pharmacy (Pharm.D.); Podiatry (D.P.M., D.P., or Pod.D.); Theology (M.Div., M.H.L., B.D., or Ordination); or Veternary Medicine (D.V.M,).
SOURCE: U.S. Department of Education, National Center for Education Statistics, Integrated Postsecondary Education Data System (IPEDS),"Completions" survey, 1997-98 and "Consolidated" survey, 1998.
74