Embed Size (px)
Citation preview
Demographic Trendsin North Dakota
Ina CernuscaNorth Dakota CompassCenter for Social ResearchNorth Dakota State University
NO
RTH
DAK
OTA
CO
MP
ASS
North Dakota Compass providesand promotes the use of reliable, accurate, and unbiased demographic, economic, and socio-economic data to support informed decision making and community engagement in North Dakota.
By providing policymakers and citizens with benchmarks of child well-being, North Dakota KIDS COUNT seeks to enrich local and state discussions concerning ways to secure a better future for all children.
NO
RTH
DAK
OTA
KID
S CO
UN
T
DEMOGRAPHIC TRENDS
• Population Changes
• Age Distribution
• Gender Breakdown
• Racial & Ethnic Composition
POPULATION CHANGES
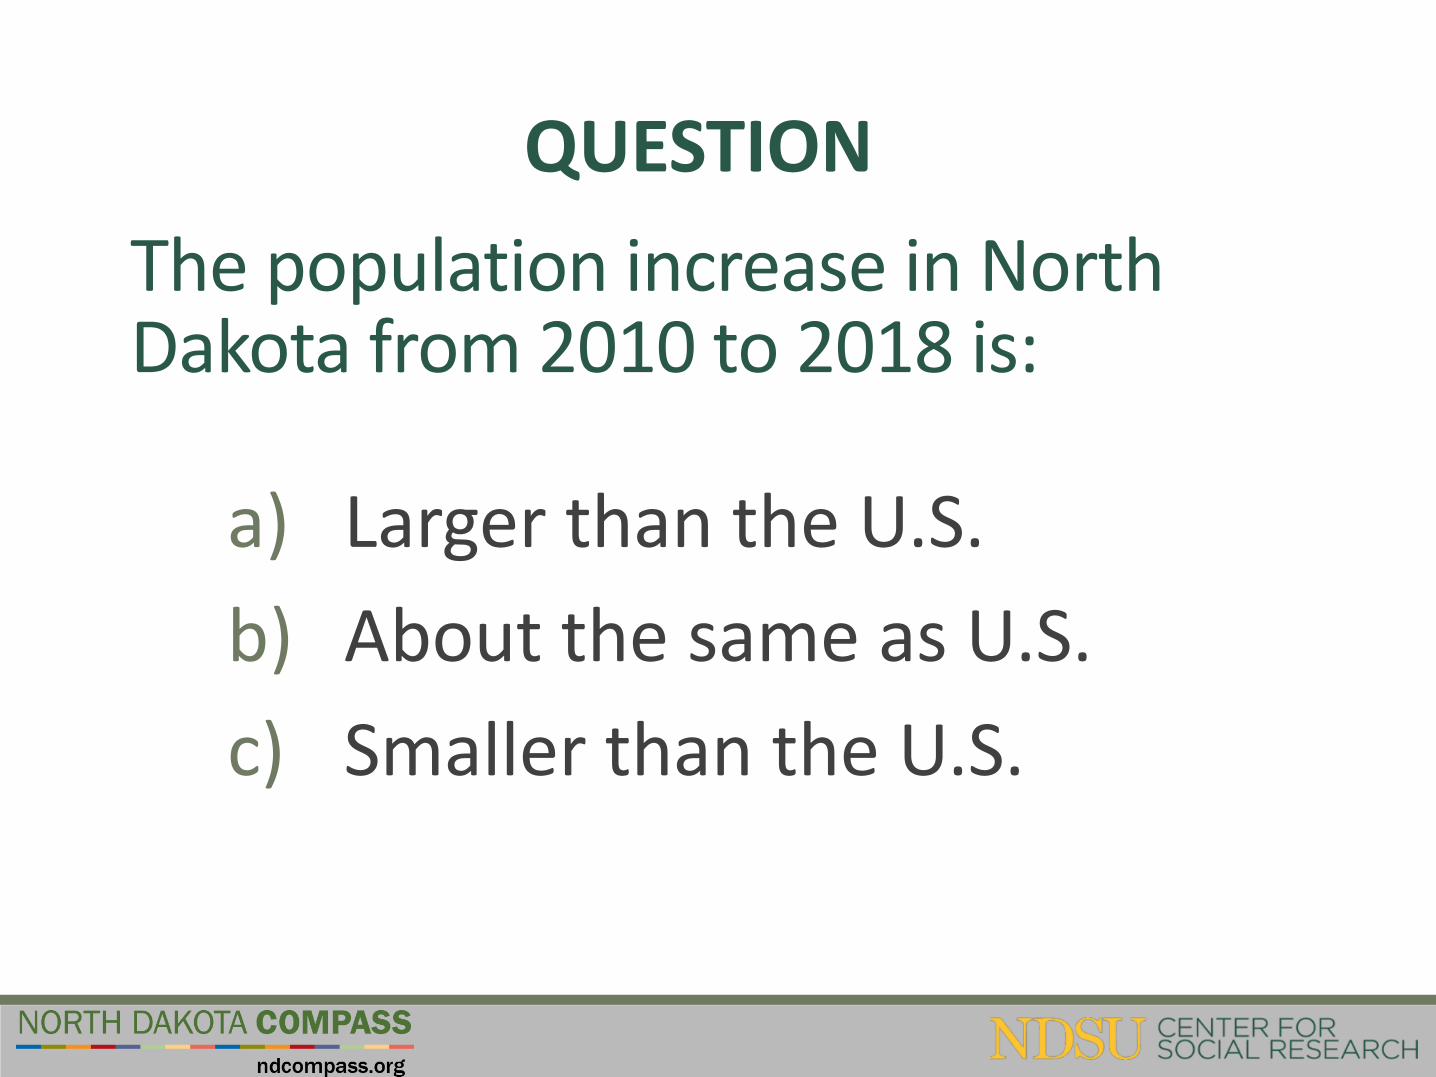
QUESTION
The population increase in North Dakota from 2010 to 2018 is:
a) Larger than the U.S.
b) About the same as U.S.
c) Smaller than the U.S.
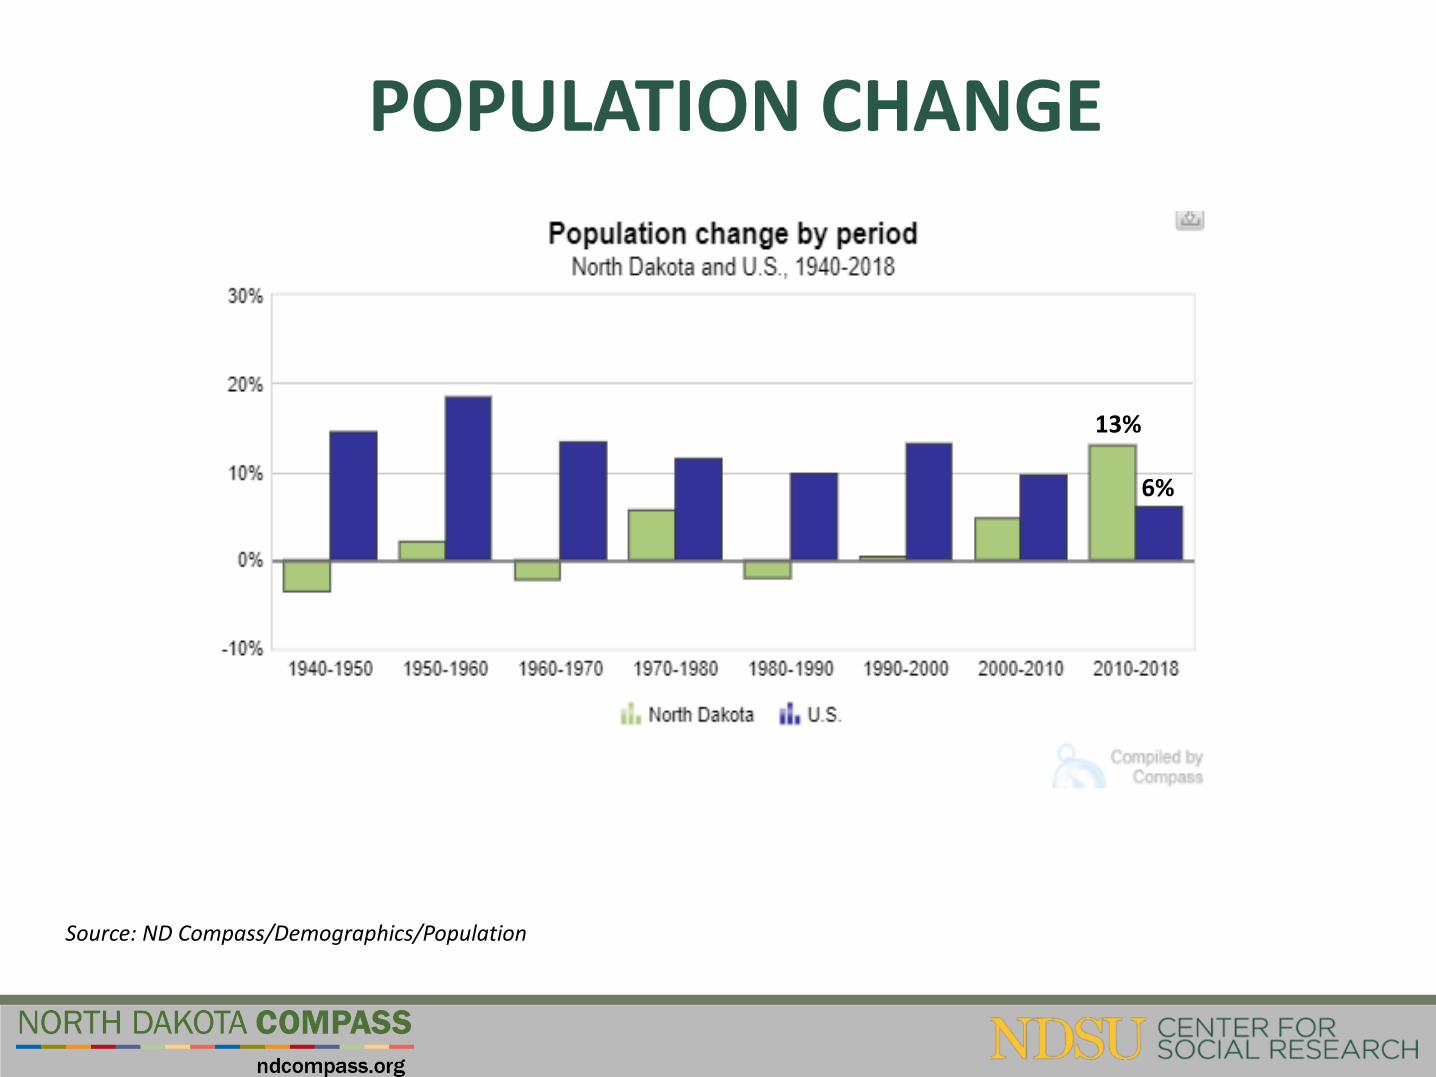
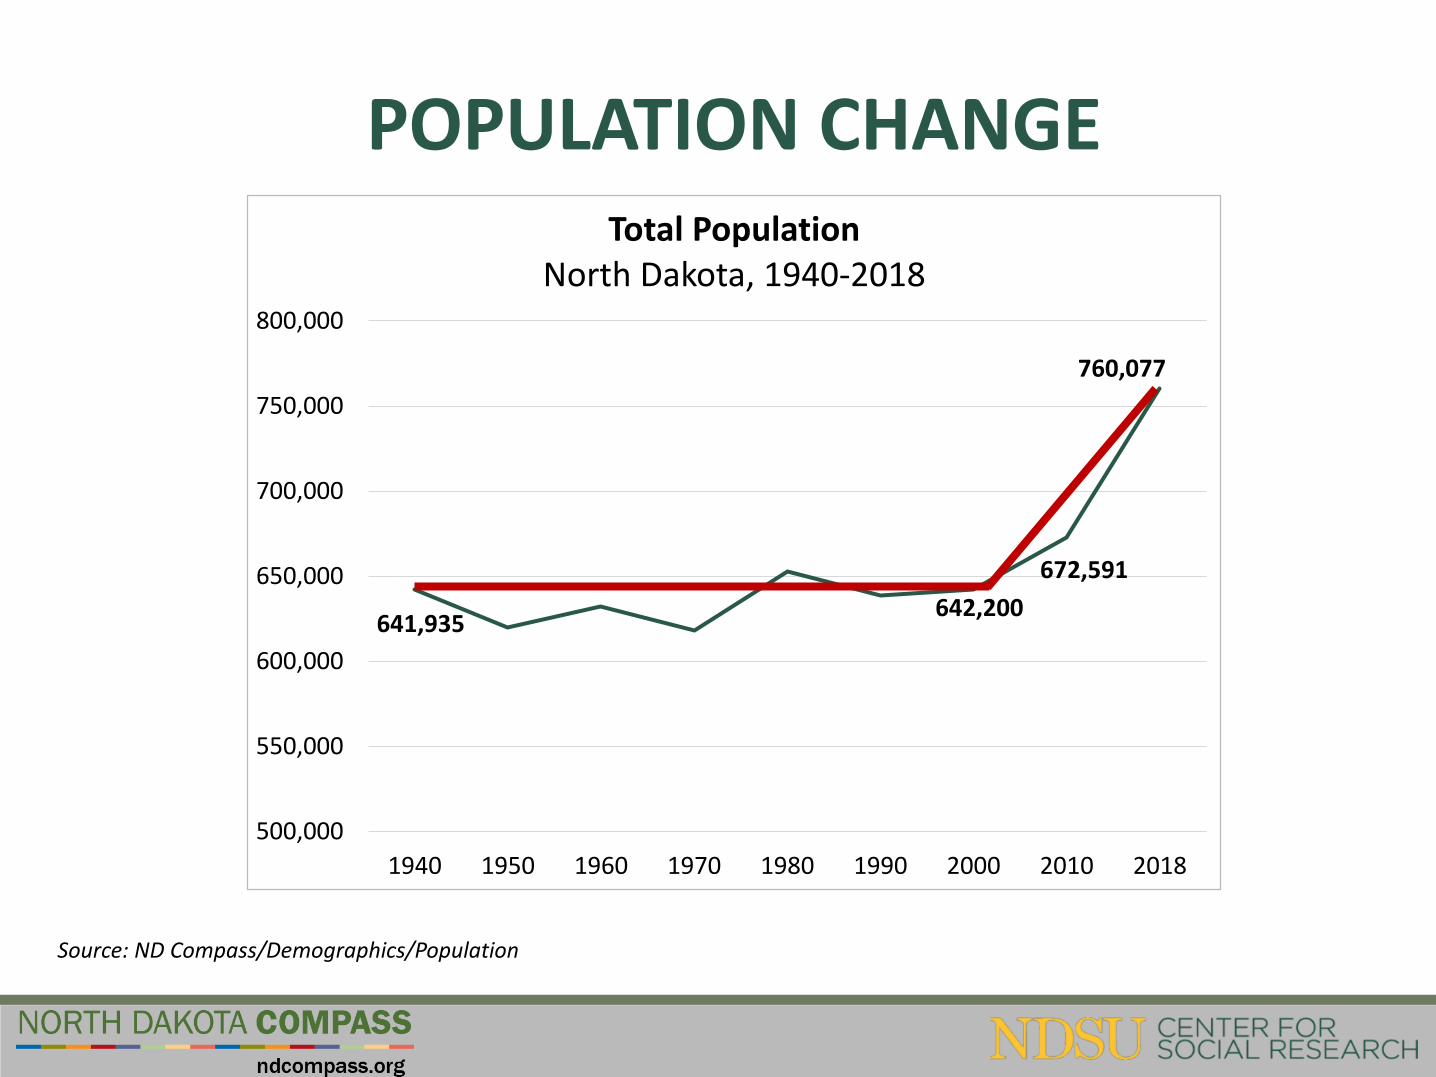
POPULATION CHANGE
Source: ND Compass/Demographics/Population
13%
6%
POPULATION CHANGE
500,000
550,000
600,000
650,000
700,000
750,000
800,000
1940 1950 1960 1970 1980 1990 2000 2010 2018
Total PopulationNorth Dakota, 1940-2018
641,935
760,077
672,591
642,200
Source: ND Compass/Demographics/Population
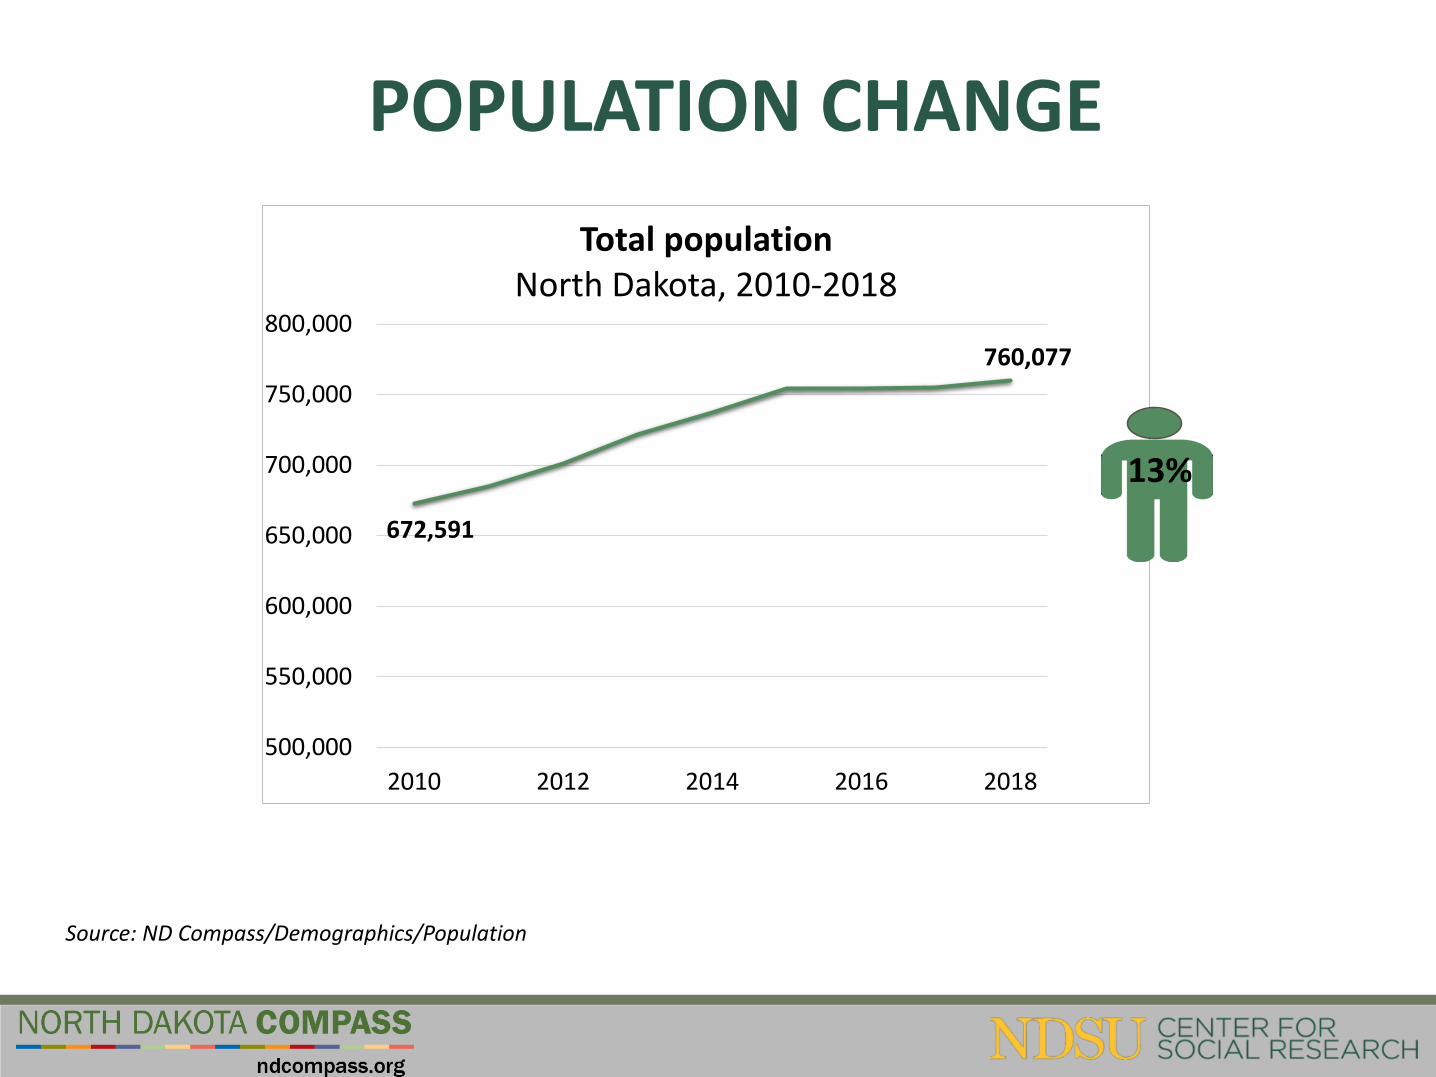
POPULATION CHANGE
500,000
550,000
600,000
650,000
700,000
750,000
800,000
2010 2012 2014 2016 2018
Total population North Dakota, 2010-2018
760,077
672,591
13%
Source: ND Compass/Demographics/Population
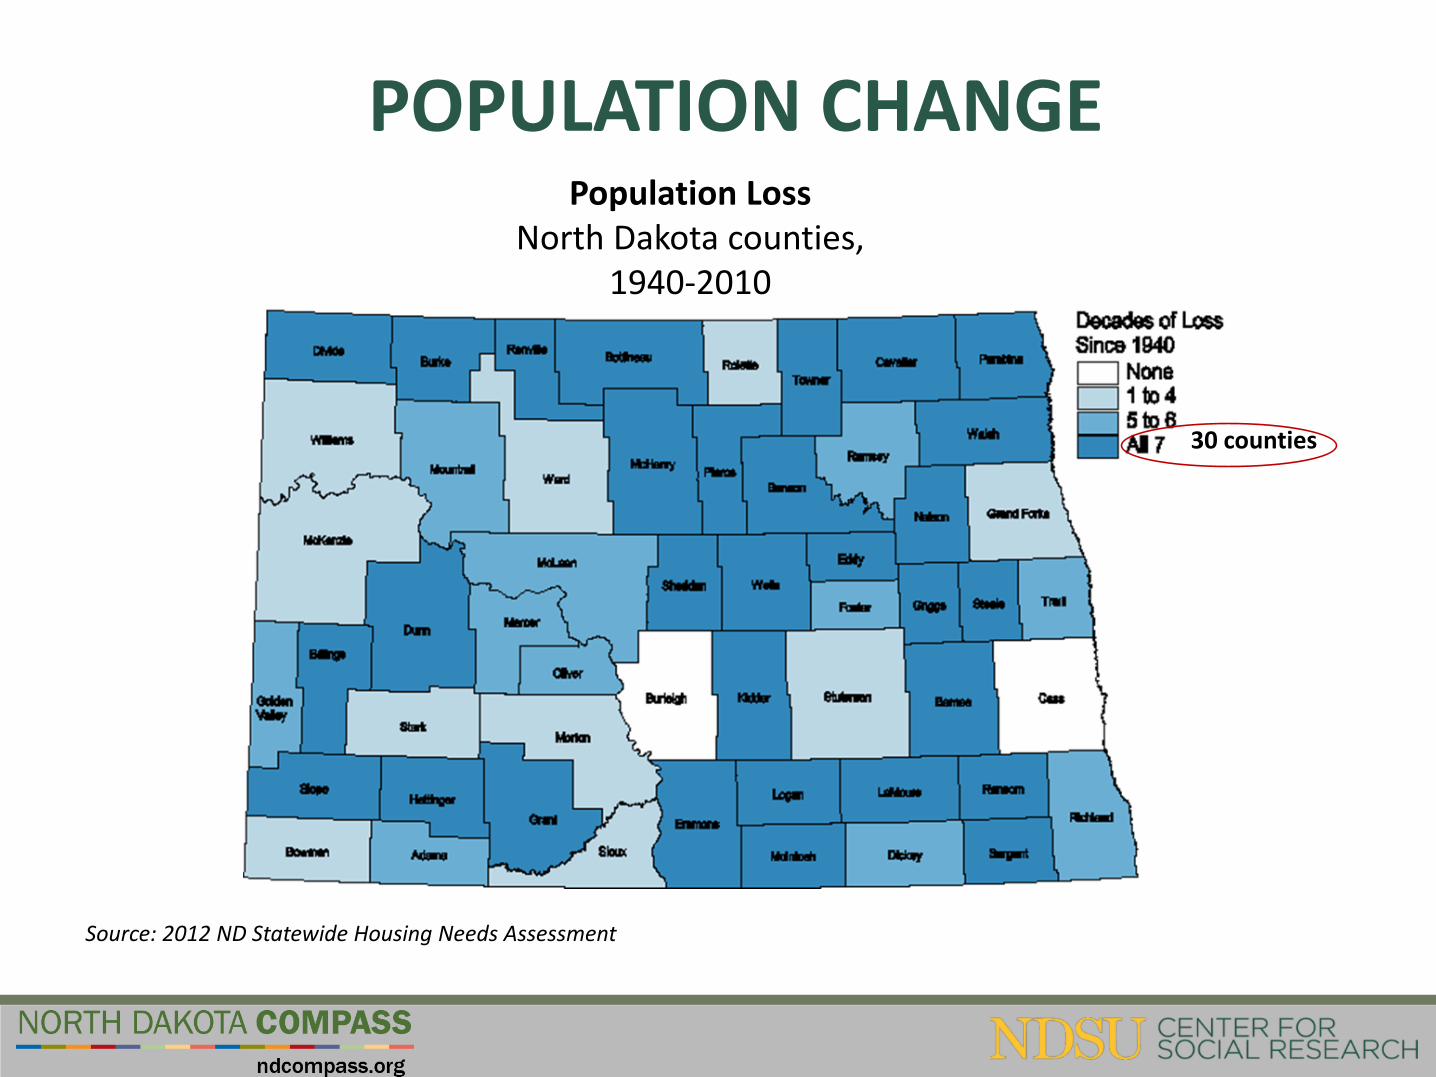
POPULATION CHANGEPopulation Loss
North Dakota counties, 1940-2010
Source: 2012 ND Statewide Housing Needs Assessment
30 counties
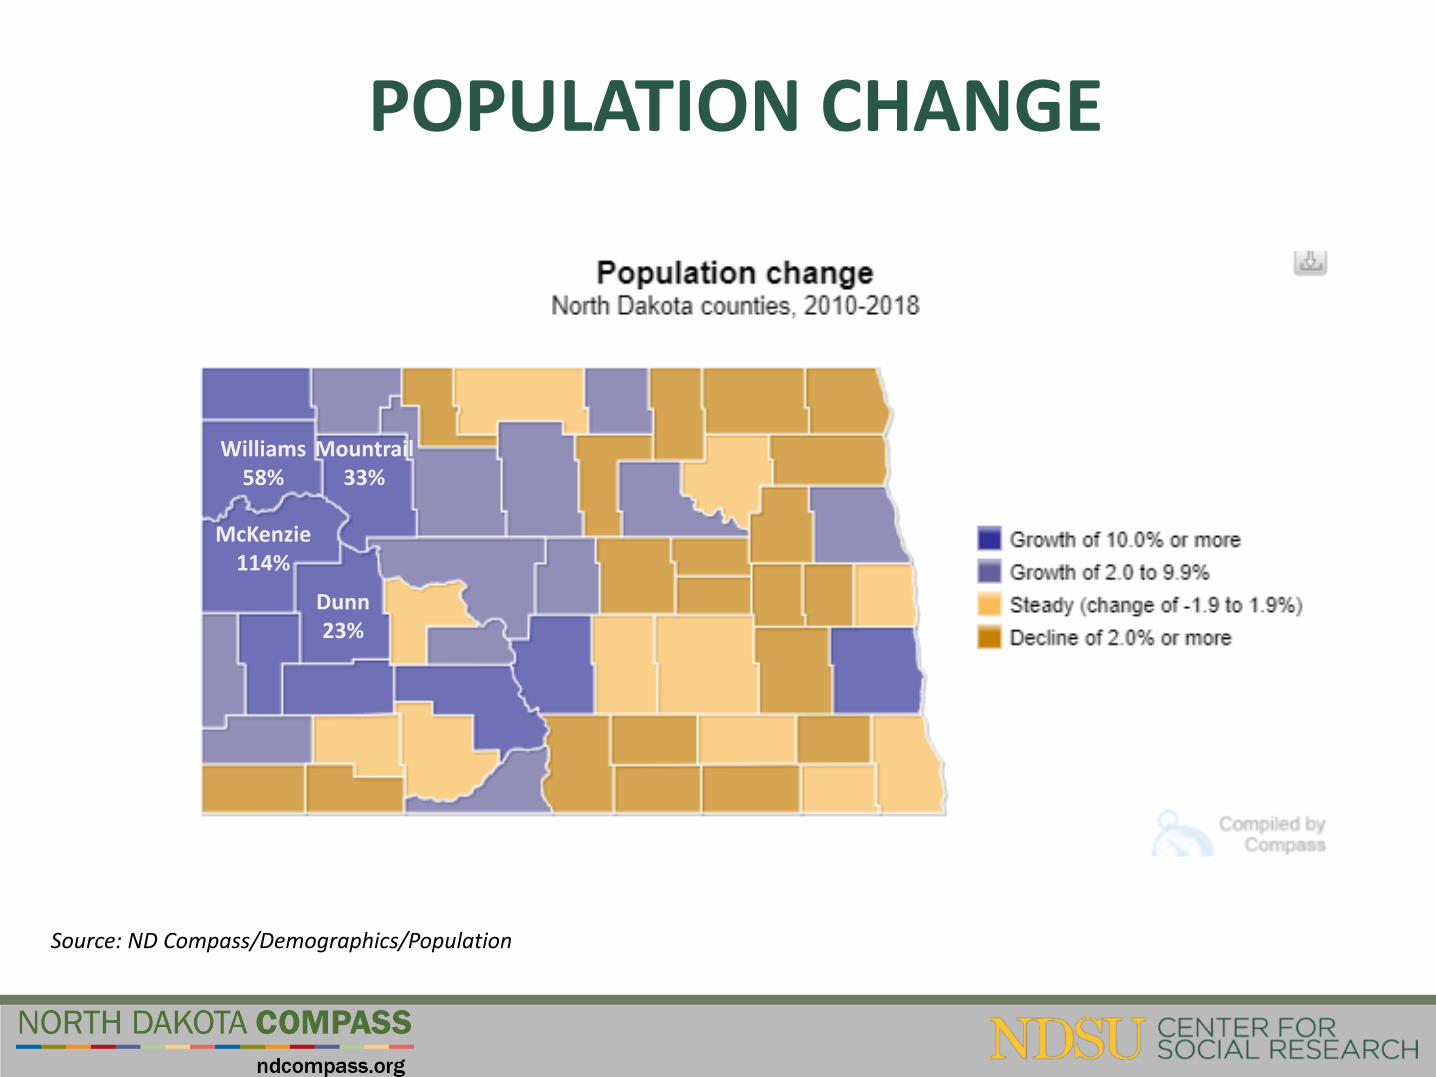
POPULATION CHANGE
McKenzie114%
Williams58%
Mountrail33%
Dunn23%
Source: ND Compass/Demographics/Population
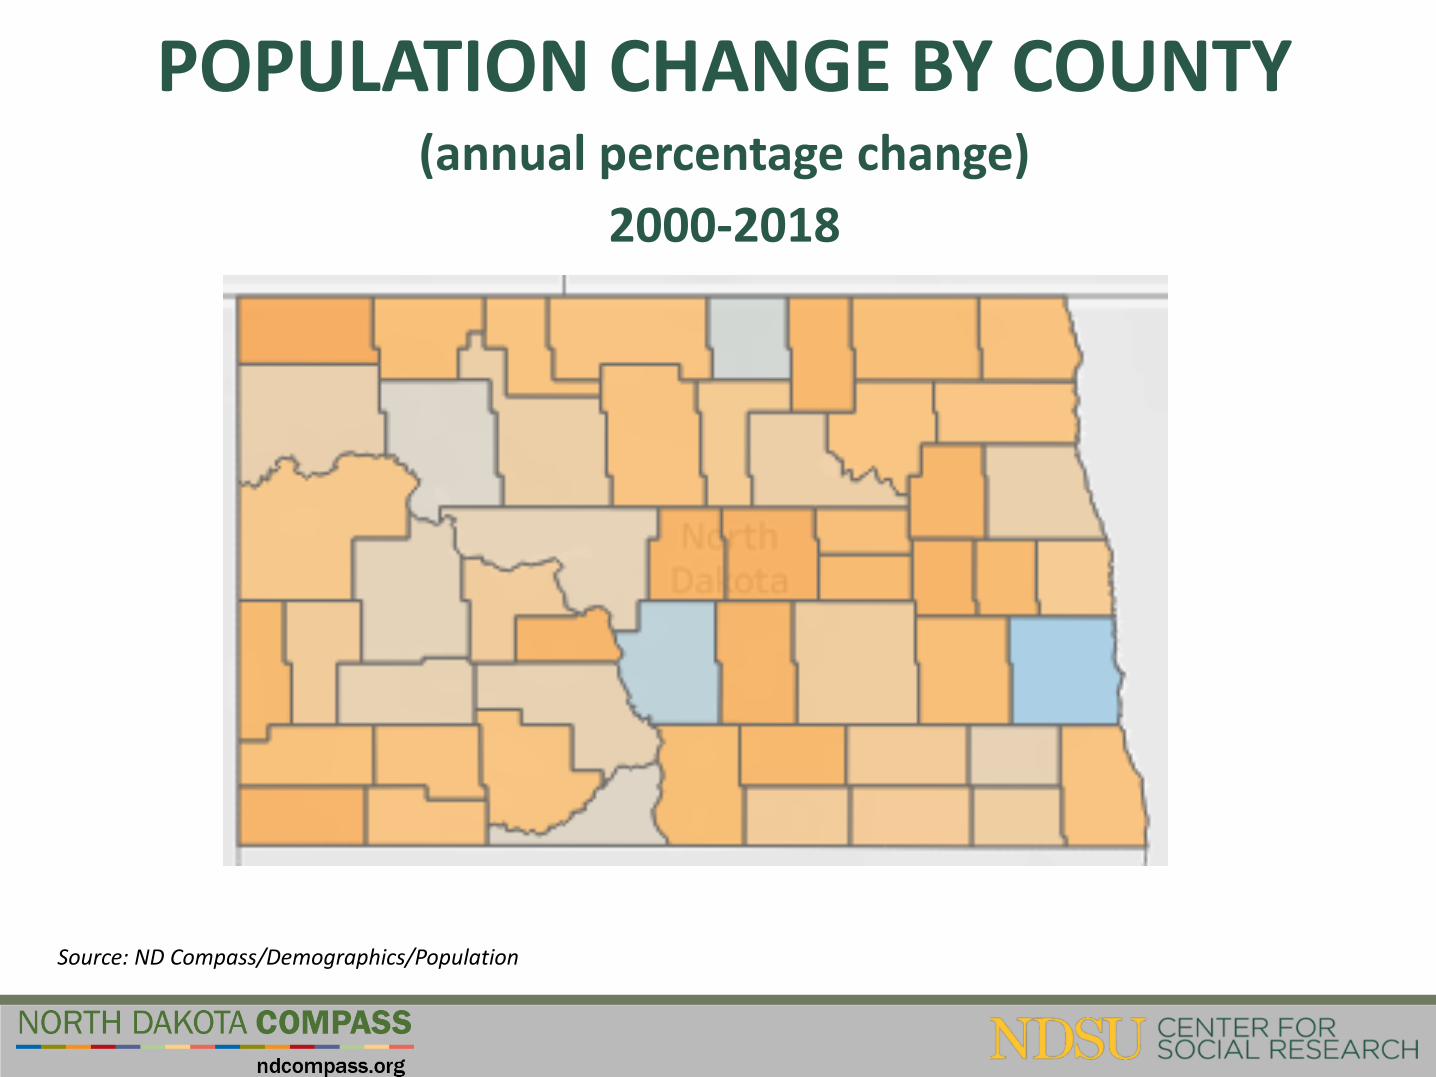
POPULATION CHANGE BY COUNTY(annual percentage change)
2000-2018
Source: ND Compass/Demographics/Population
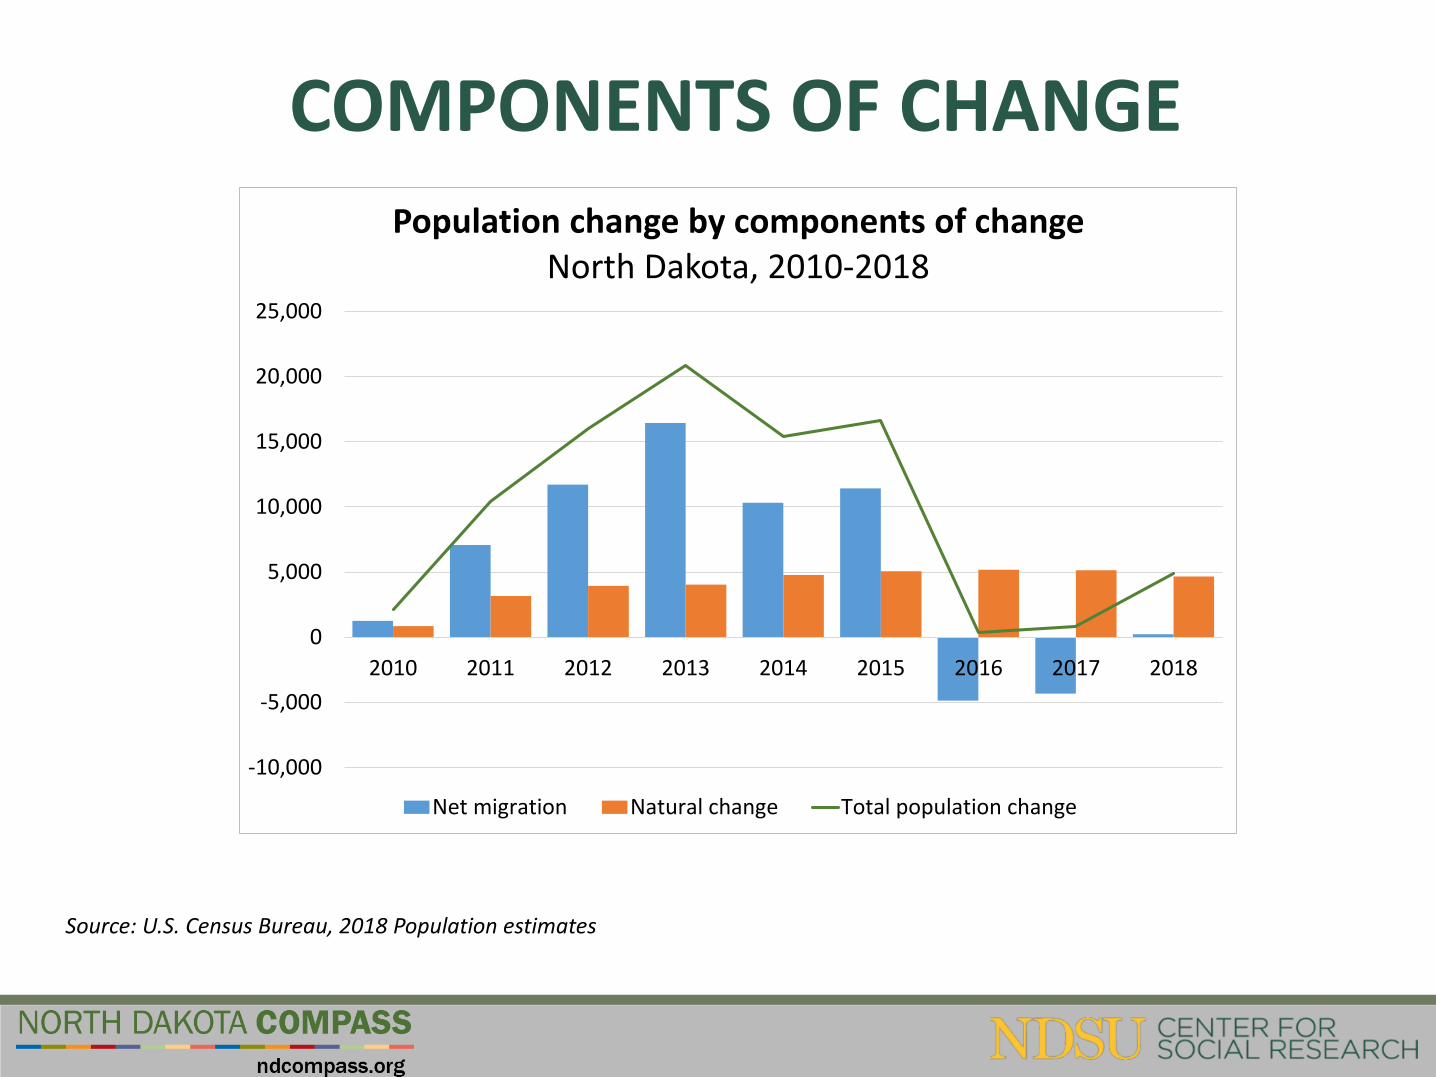
COMPONENTS OF CHANGE
-10,000
-5,000
0
5,000
10,000
15,000
20,000
25,000
2010 2011 2012 2013 2014 2015 2016 2017 2018
Population change by components of changeNorth Dakota, 2010-2018
Net migration Natural change Total population change
Source: U.S. Census Bureau, 2018 Population estimates
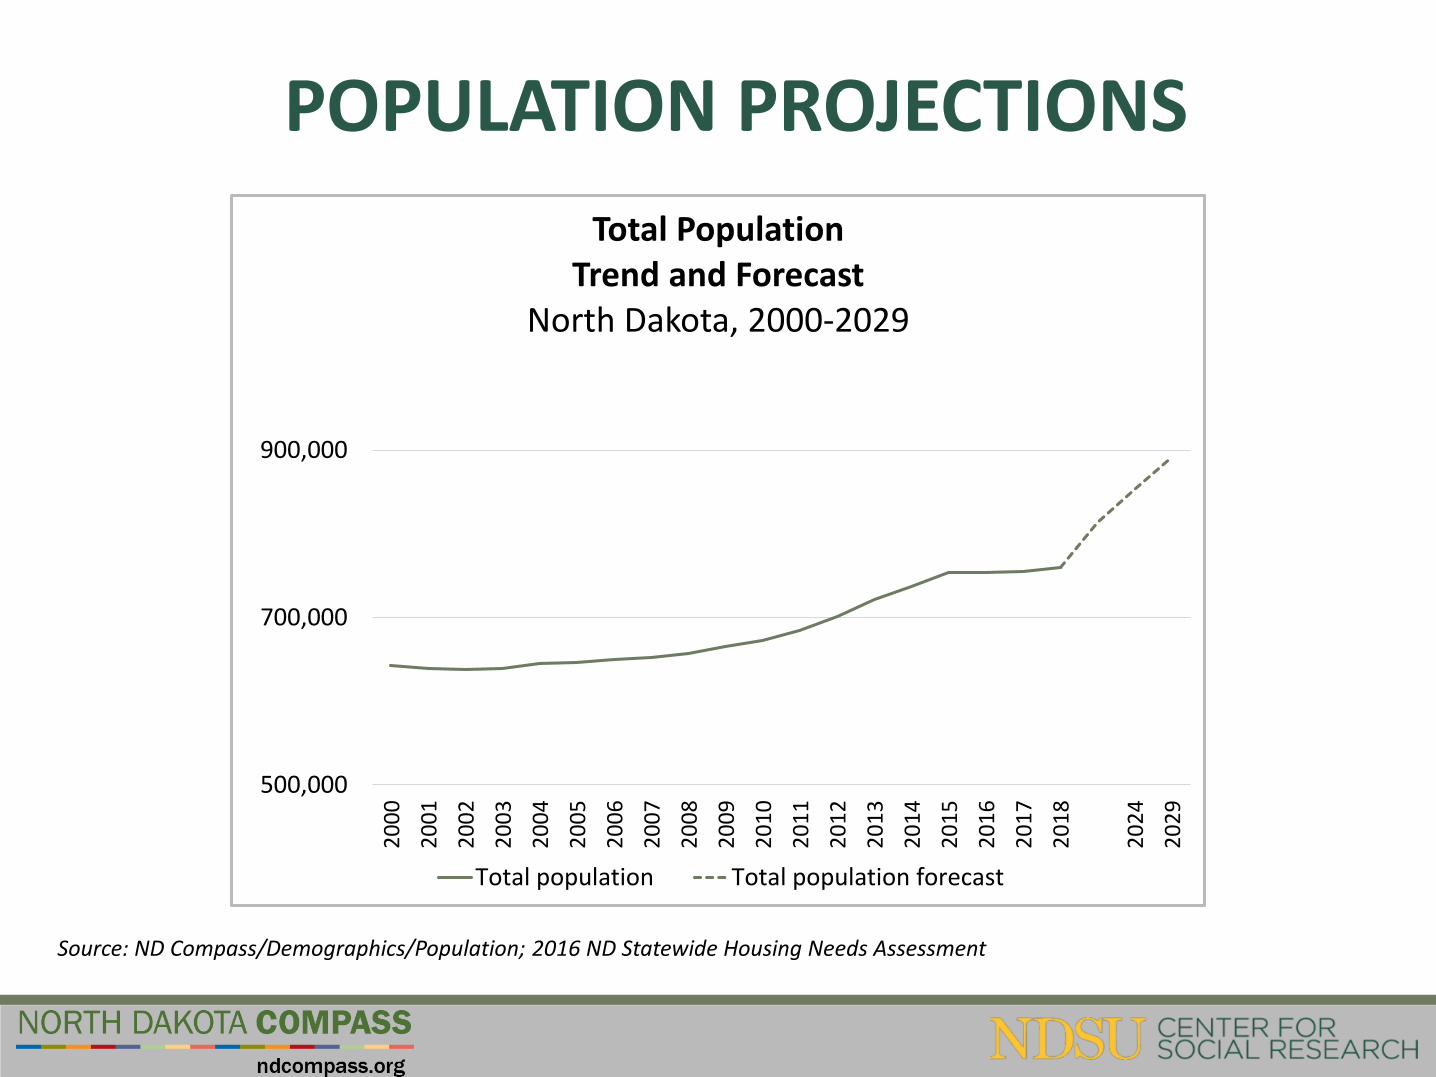
POPULATION PROJECTIONS
500,000
700,000
900,000
20
00
20
01
20
02
20
03
20
04
20
05
20
06
20
07
20
08
20
09
20
10
20
11
20
12
20
13
20
14
20
15
20
16
20
17
20
18
20
24
20
29
Total Population Trend and Forecast
North Dakota, 2000-2029
Total population Total population forecast
Source: ND Compass/Demographics/Population; 2016 ND Statewide Housing Needs Assessment
POPULATION TRENDS SUMMARY
• North Dakota experienced extraordinary growth from 2000 to 2018.
• The change has not been consistent across the state.
AGE
DISTRIBUTION
QUESTION
North Dakota’s median age is higher than the U.S.
a) True
b)False
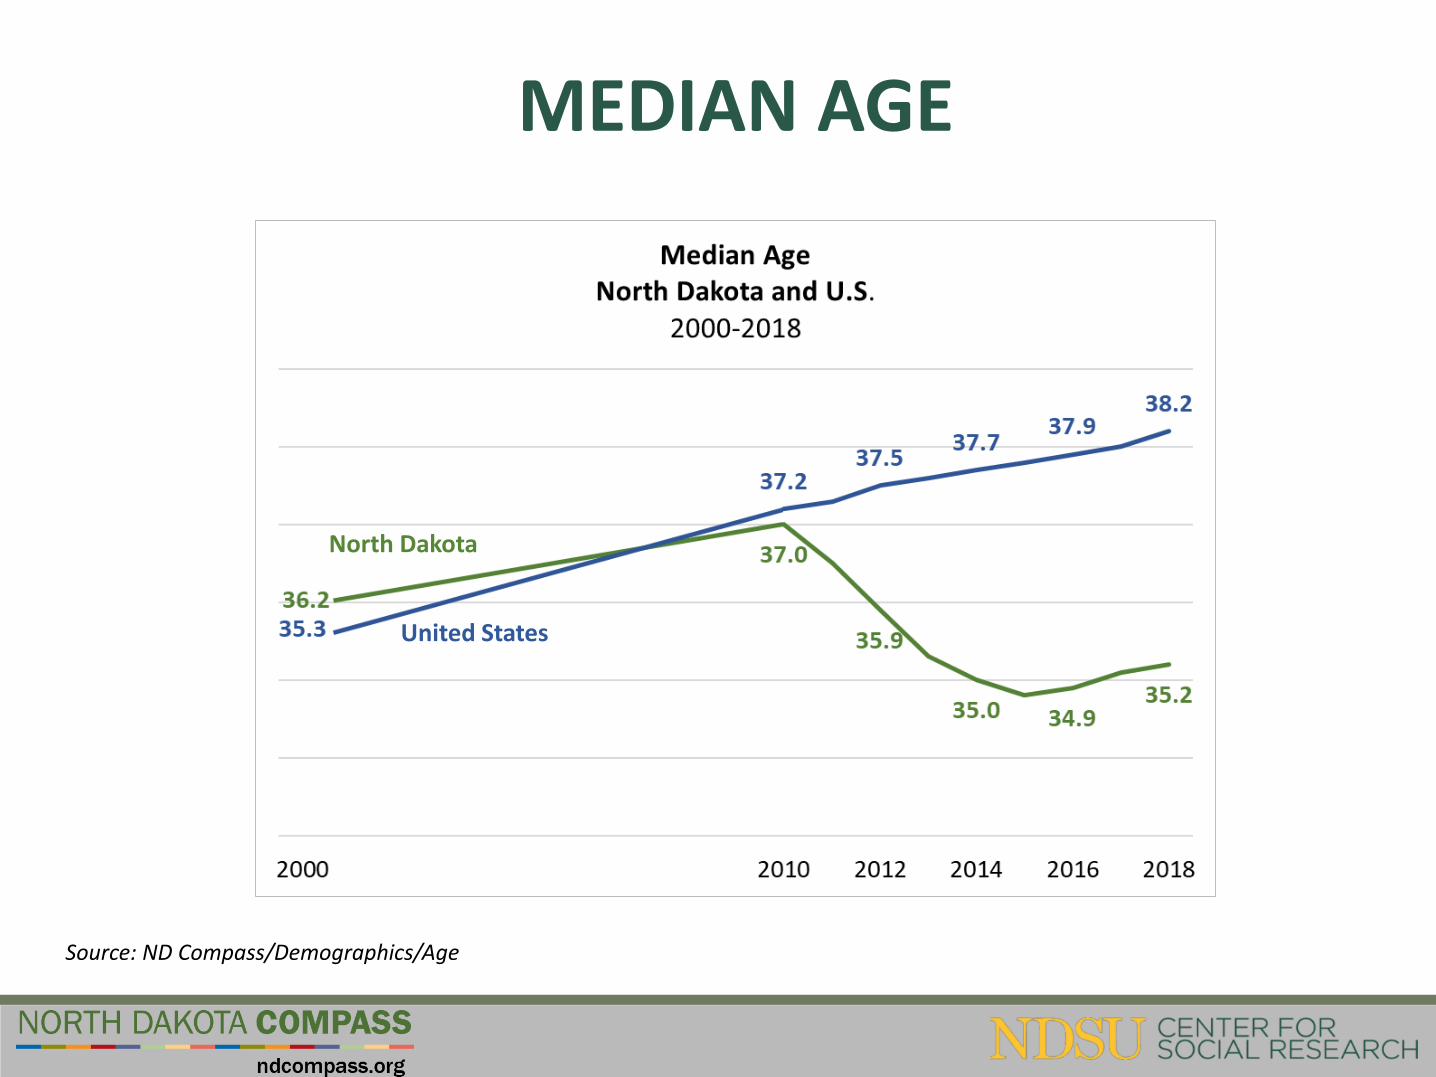
MEDIAN AGE
Source: ND Compass/Demographics/Age
North Dakota
United States
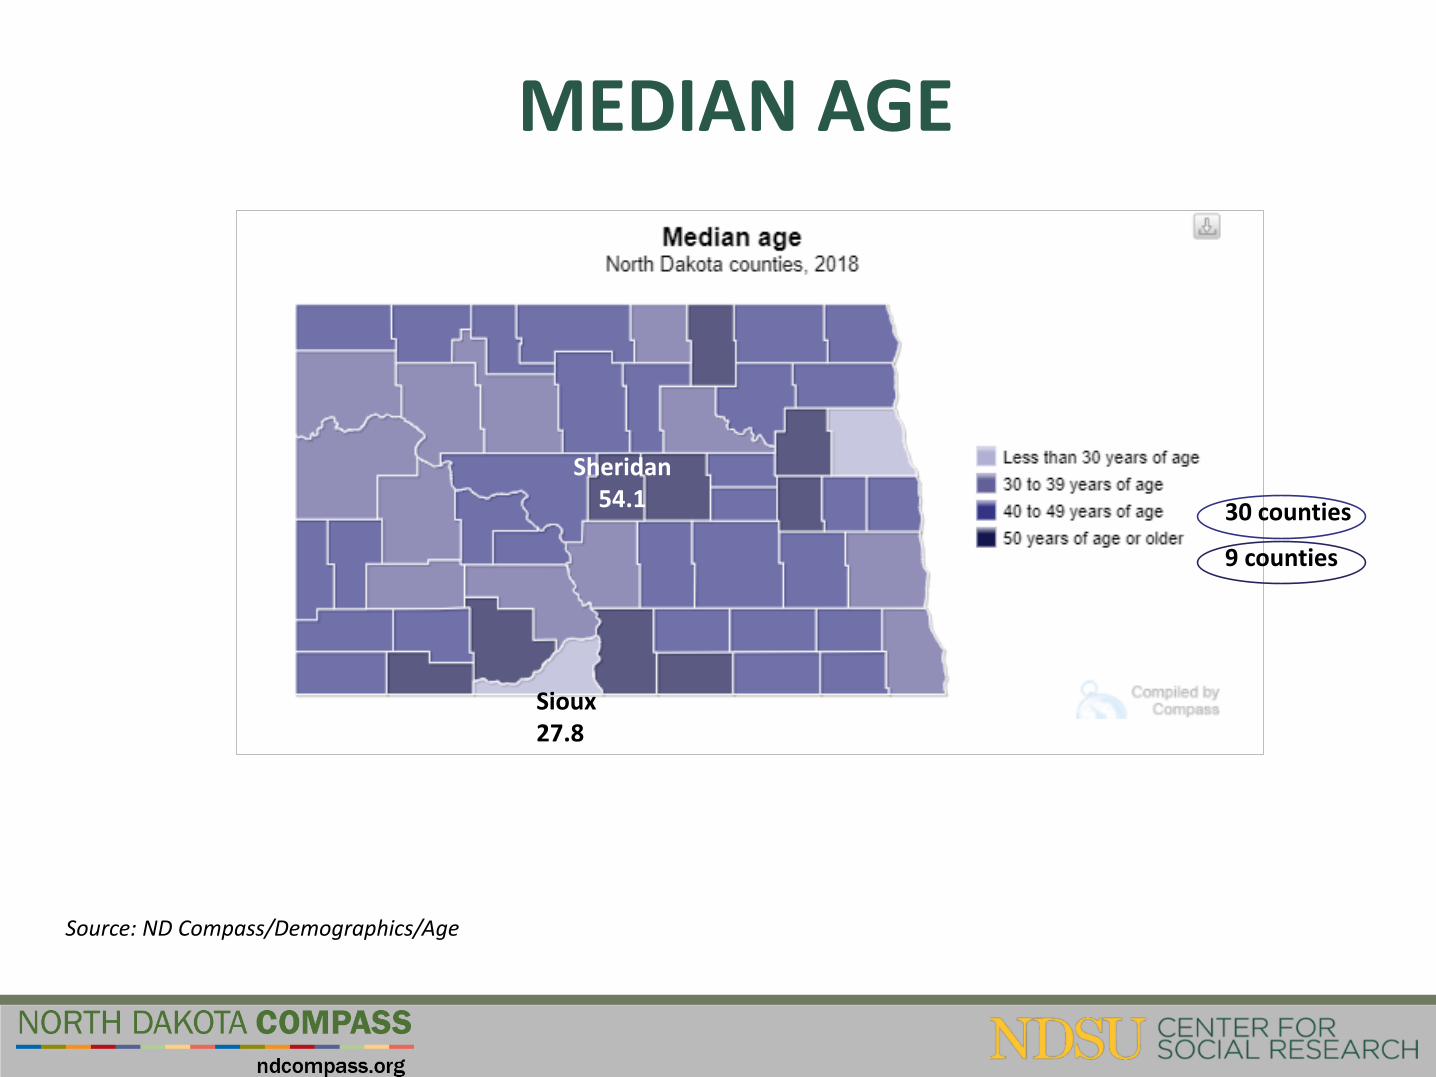
MEDIAN AGE
Sheridan54.1
Sioux27.8
Source: ND Compass/Demographics/Age
30 counties
9 counties
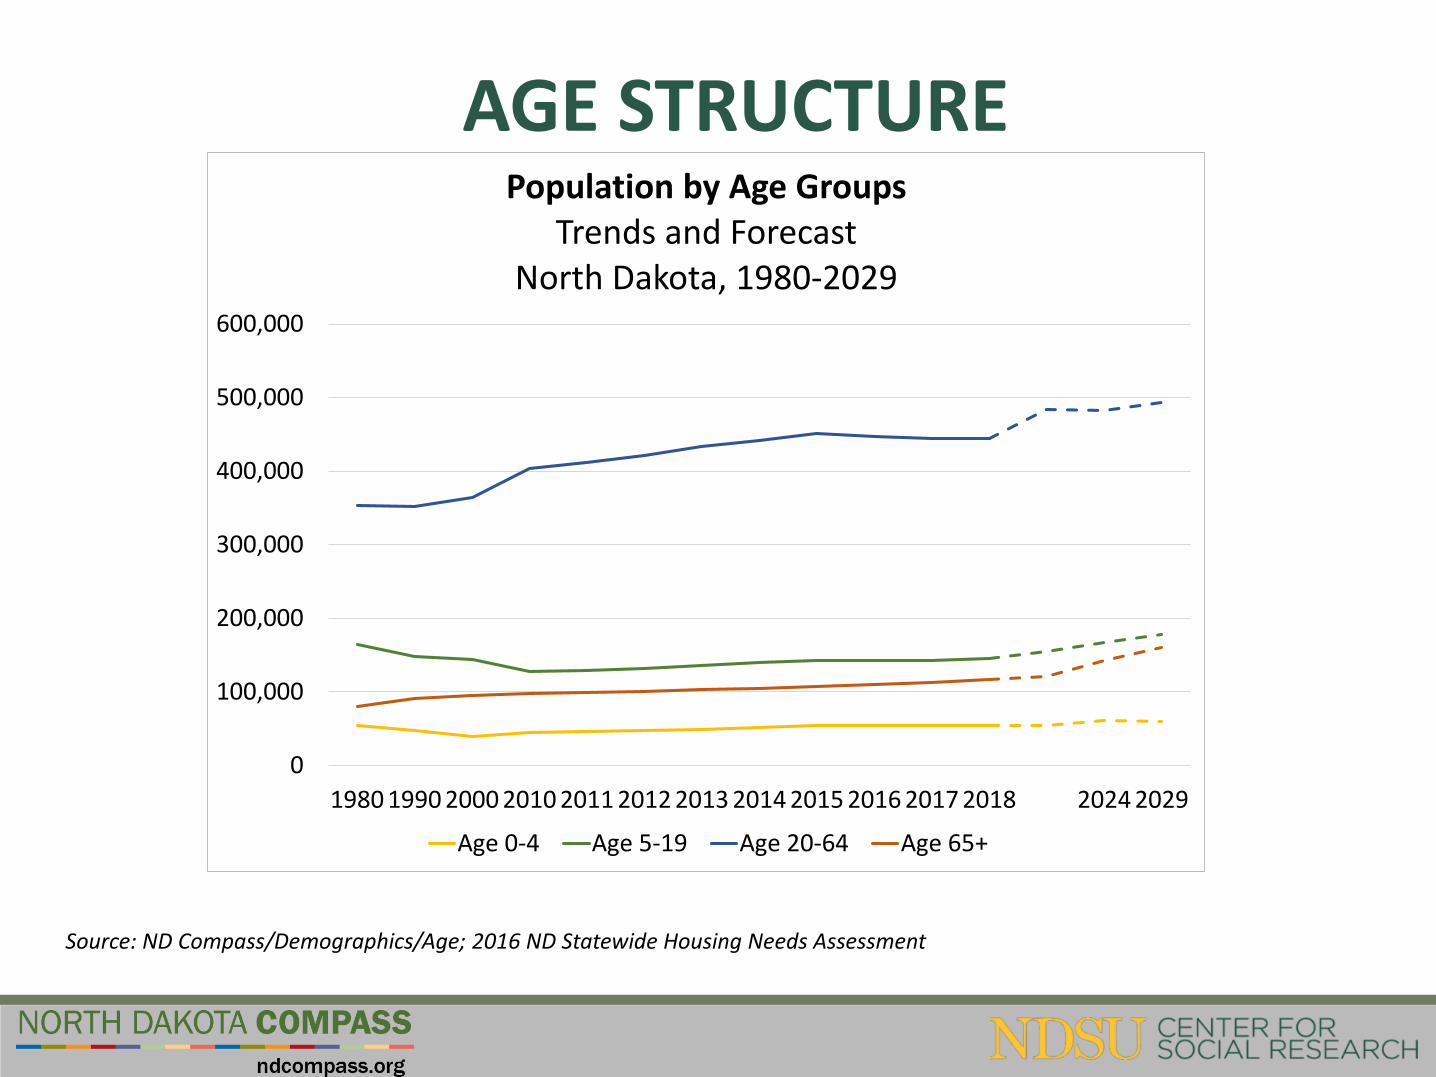
AGE STRUCTURE
Source: ND Compass/Demographics/Age; 2016 ND Statewide Housing Needs Assessment
0
100,000
200,000
300,000
400,000
500,000
600,000
1980 1990 2000 2010 2011 2012 2013 2014 2015 2016 2017 2018 2024 2029
Population by Age GroupsTrends and Forecast
North Dakota, 1980-2029
Age 0-4 Age 5-19 Age 20-64 Age 65+
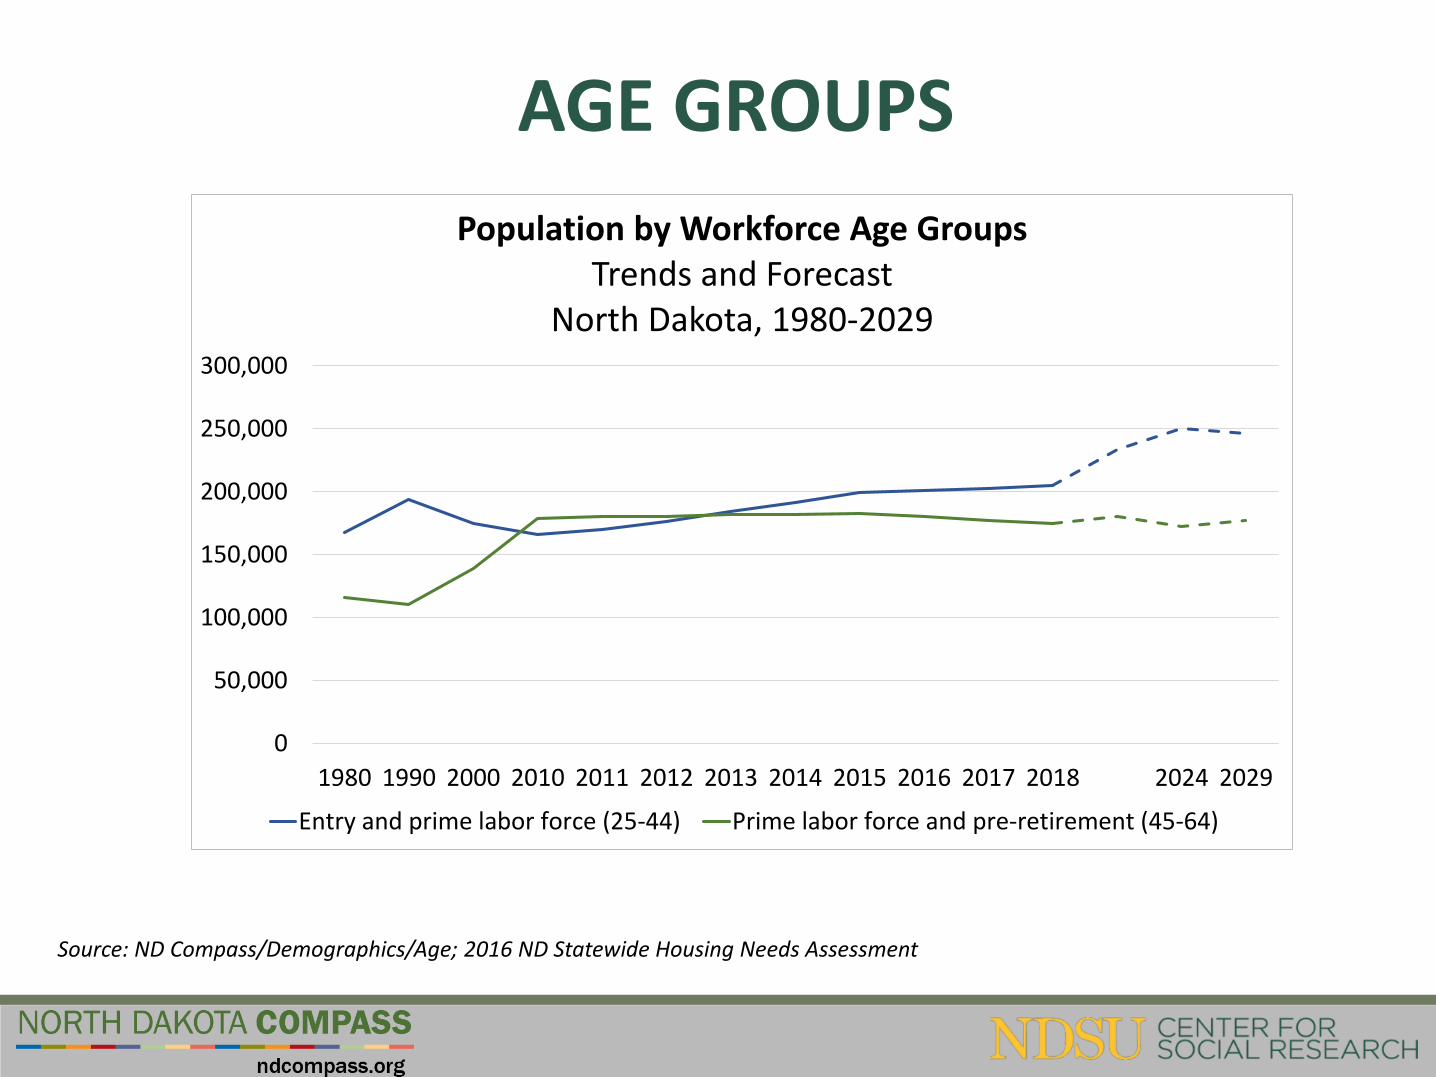
AGE GROUPS
Source: ND Compass/Demographics/Age; 2016 ND Statewide Housing Needs Assessment
0
50,000
100,000
150,000
200,000
250,000
300,000
1980 1990 2000 2010 2011 2012 2013 2014 2015 2016 2017 2018 2024 2029
Population by Workforce Age GroupsTrends and Forecast
North Dakota, 1980-2029
Entry and prime labor force (25-44) Prime labor force and pre-retirement (45-64)
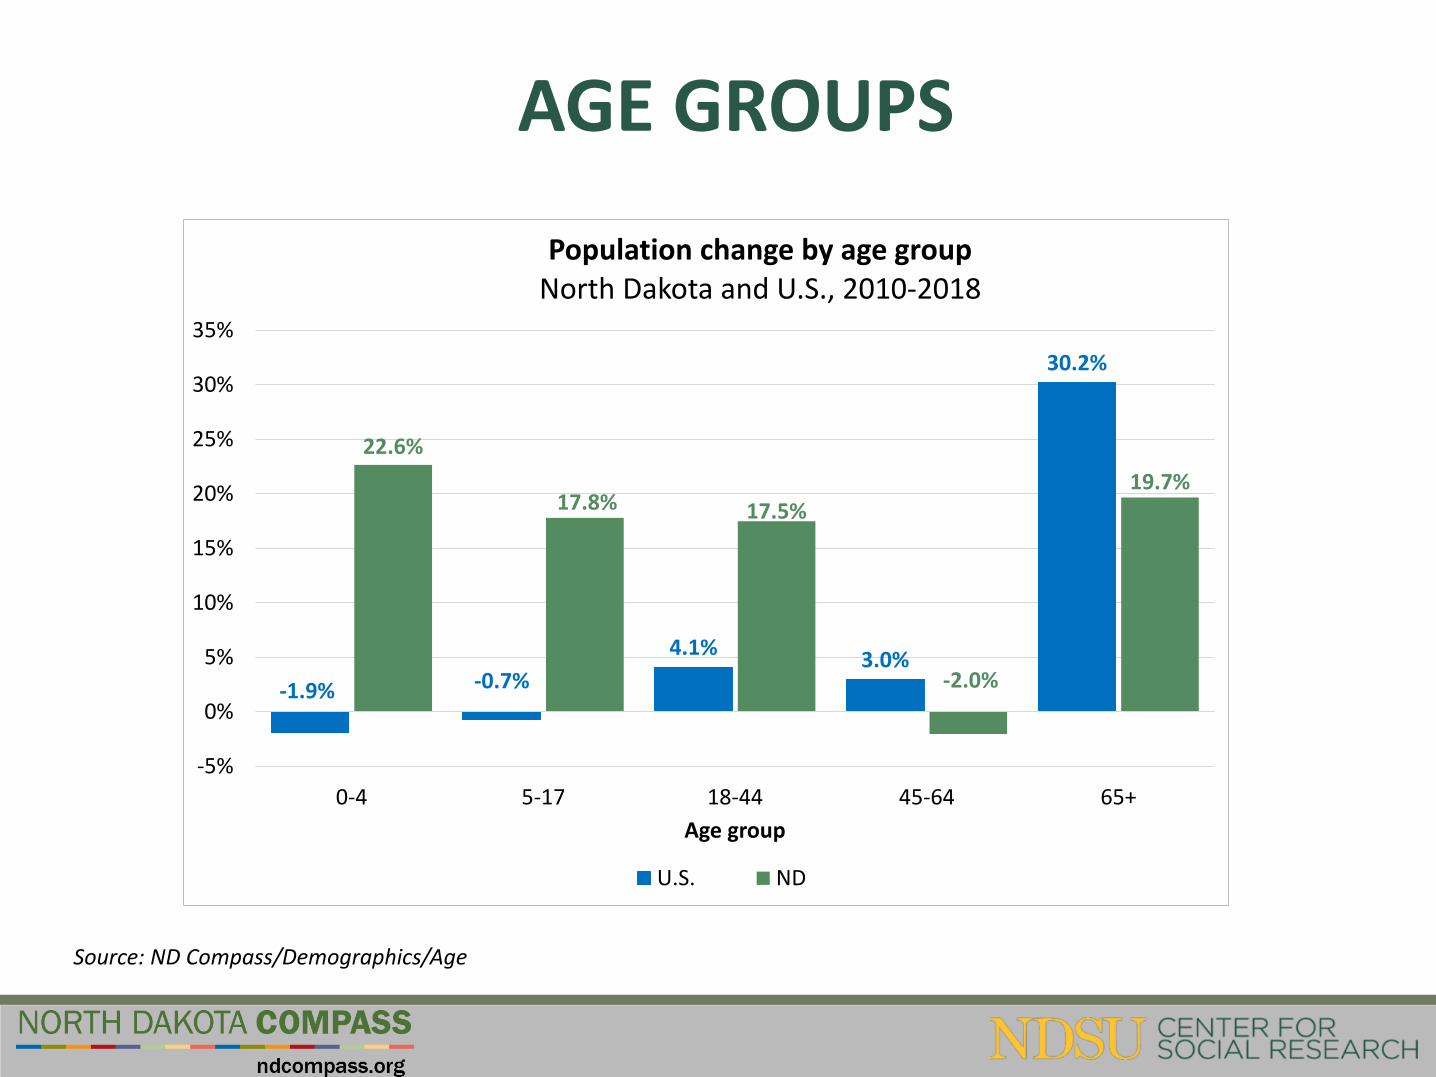
AGE GROUPS
-1.9% -0.7%
4.1%3.0%
30.2%
22.6%
17.8% 17.5%
-2.0%
19.7%
-5%
0%
5%
10%
15%
20%
25%
30%
35%
0-4 5-17 18-44 45-64 65+
Age group
Population change by age groupNorth Dakota and U.S., 2010-2018
U.S. ND
Source: ND Compass/Demographics/Age
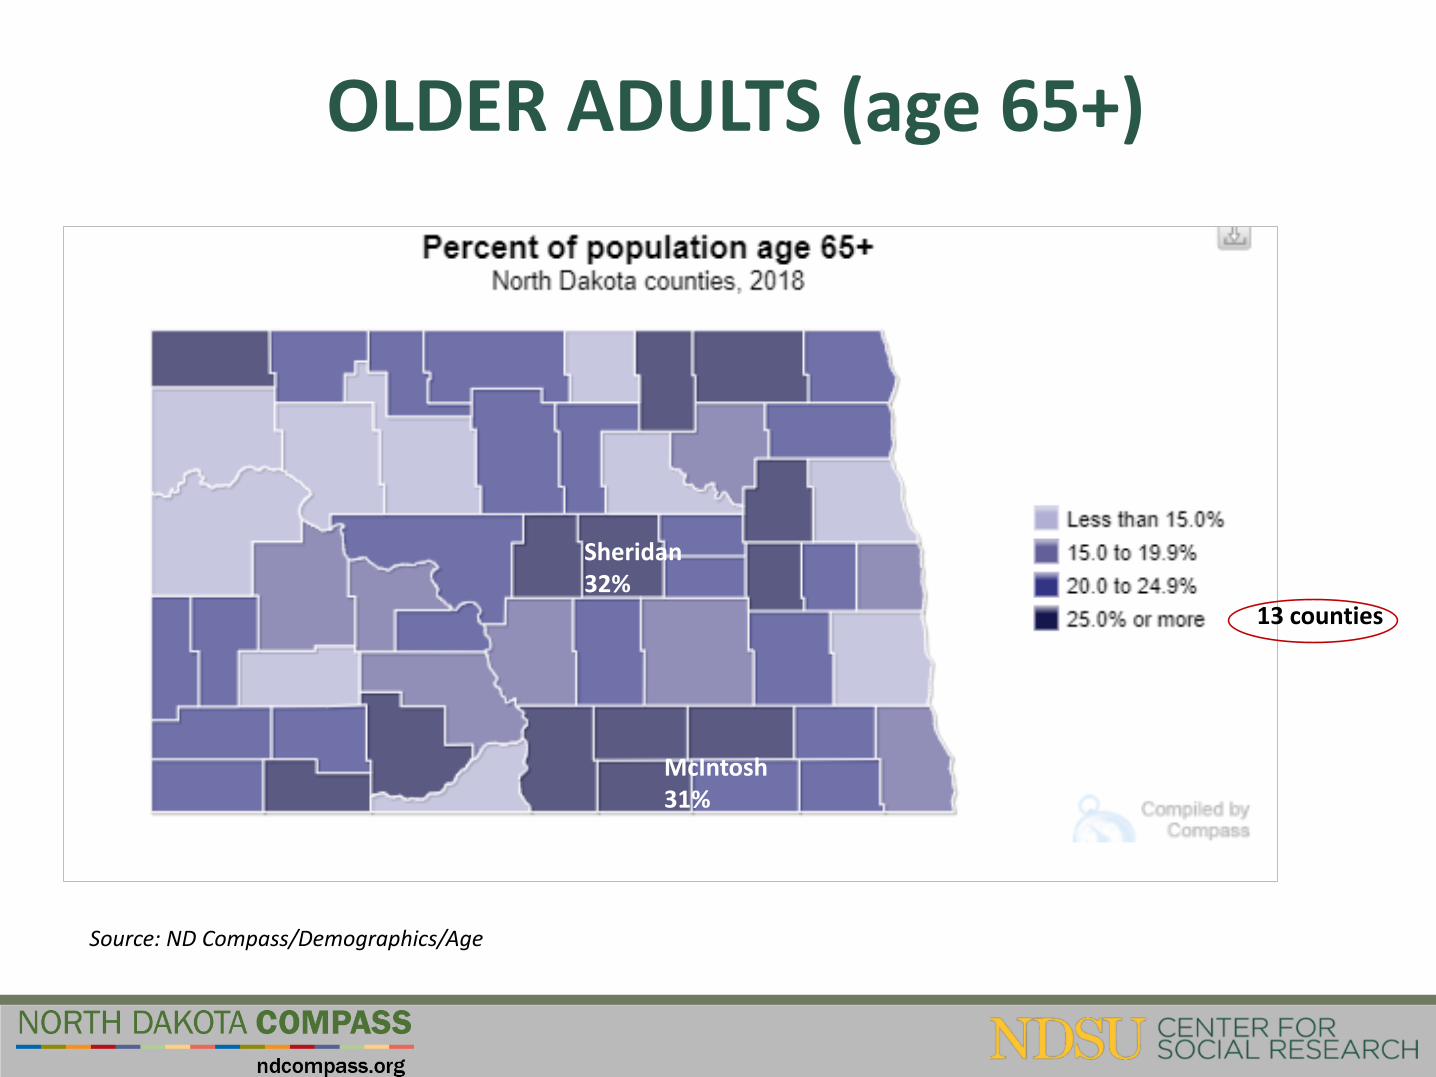
OLDER ADULTS (age 65+)
Source: ND Compass/Demographics/Age
Sheridan 32%
McIntosh 31%
13 counties
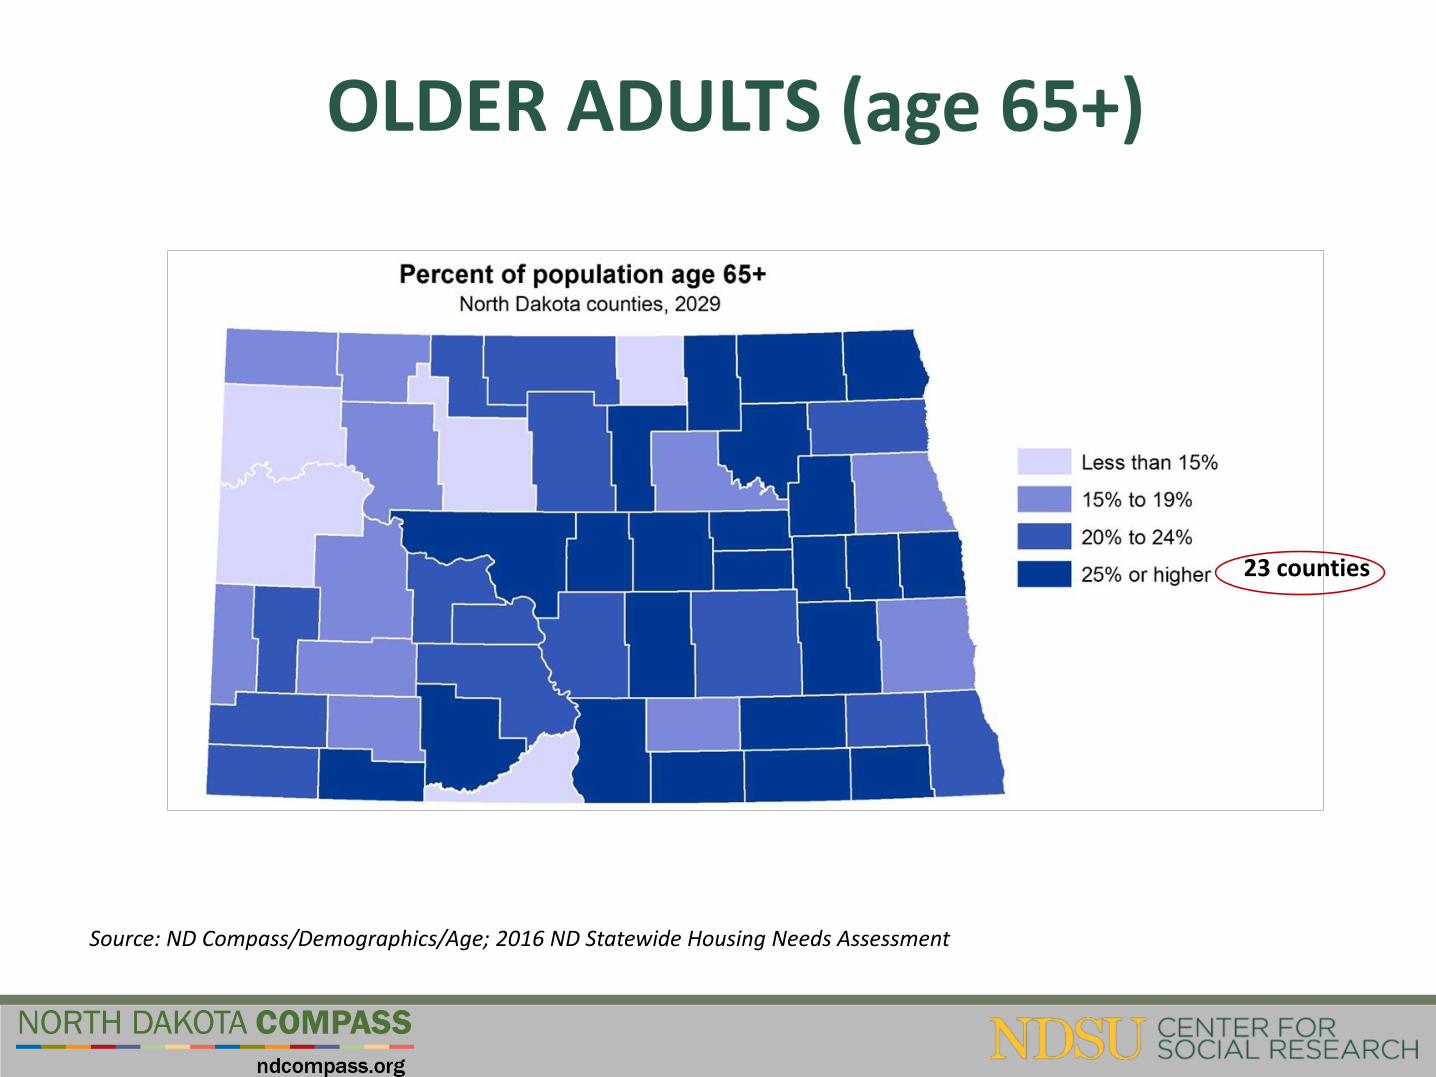
OLDER ADULTS (age 65+)
Source: ND Compass/Demographics/Age; 2016 ND Statewide Housing Needs Assessment
23 counties
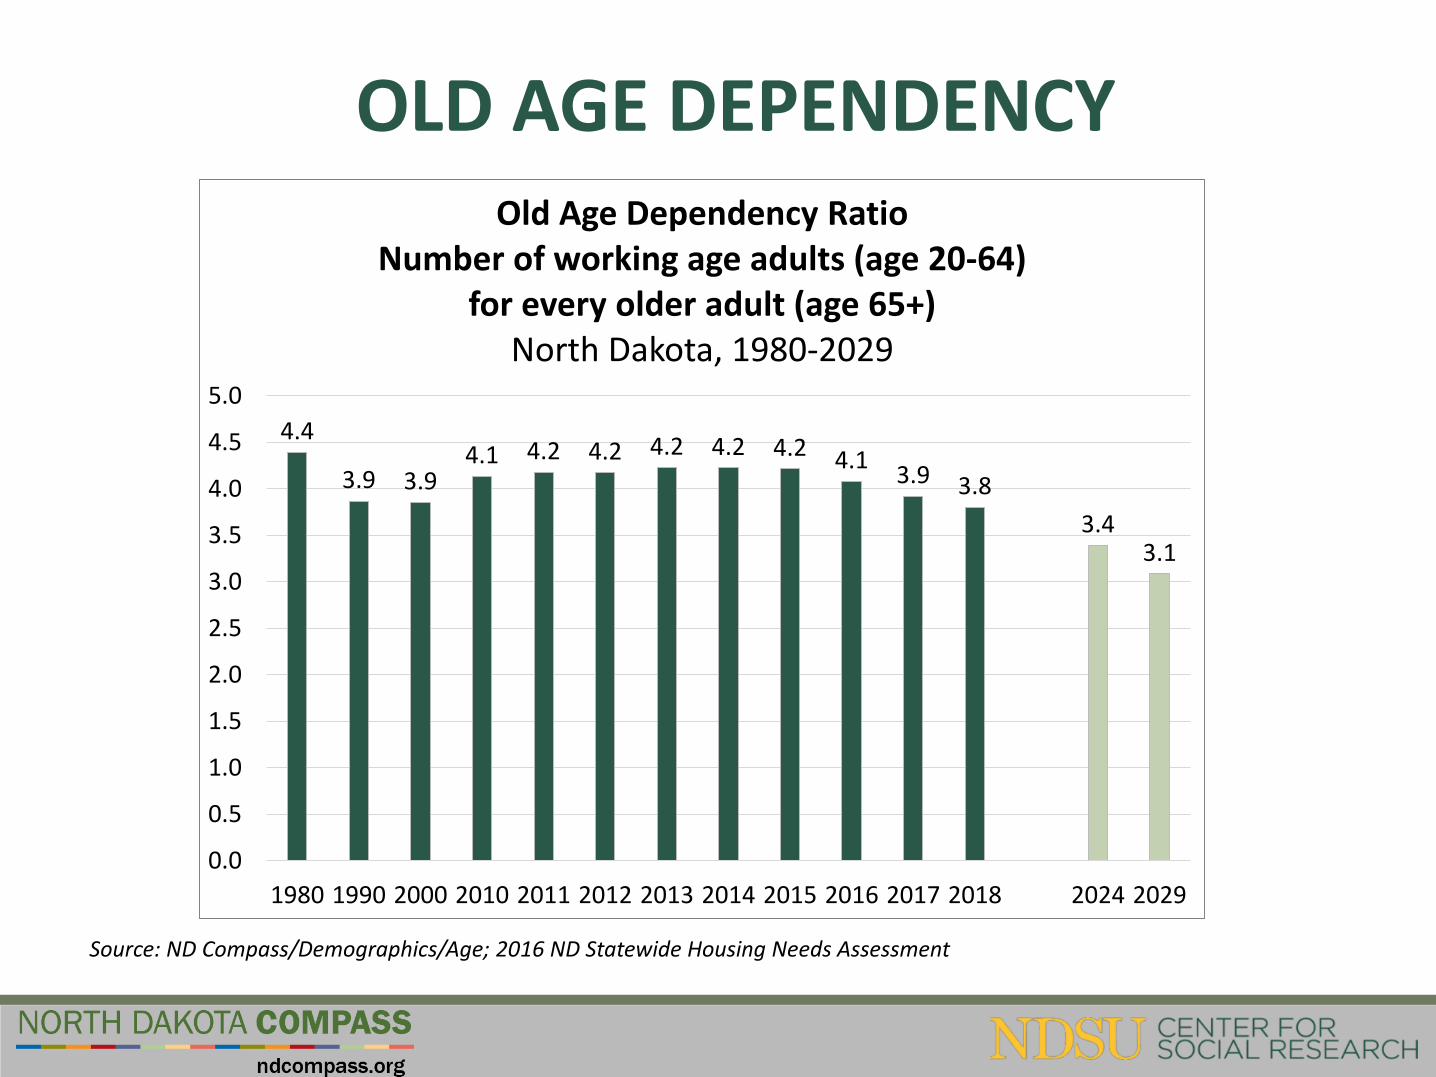
OLD AGE DEPENDENCY
4.4
3.9 3.94.1 4.2 4.2 4.2 4.2 4.2 4.1
3.9 3.8
3.43.1
0.0
0.5
1.0
1.5
2.0
2.5
3.0
3.5
4.0
4.5
5.0
1980 1990 2000 2010 2011 2012 2013 2014 2015 2016 2017 2018 2024 2029
Old Age Dependency RatioNumber of working age adults (age 20-64)
for every older adult (age 65+)North Dakota, 1980-2029
Source: ND Compass/Demographics/Age; 2016 ND Statewide Housing Needs Assessment
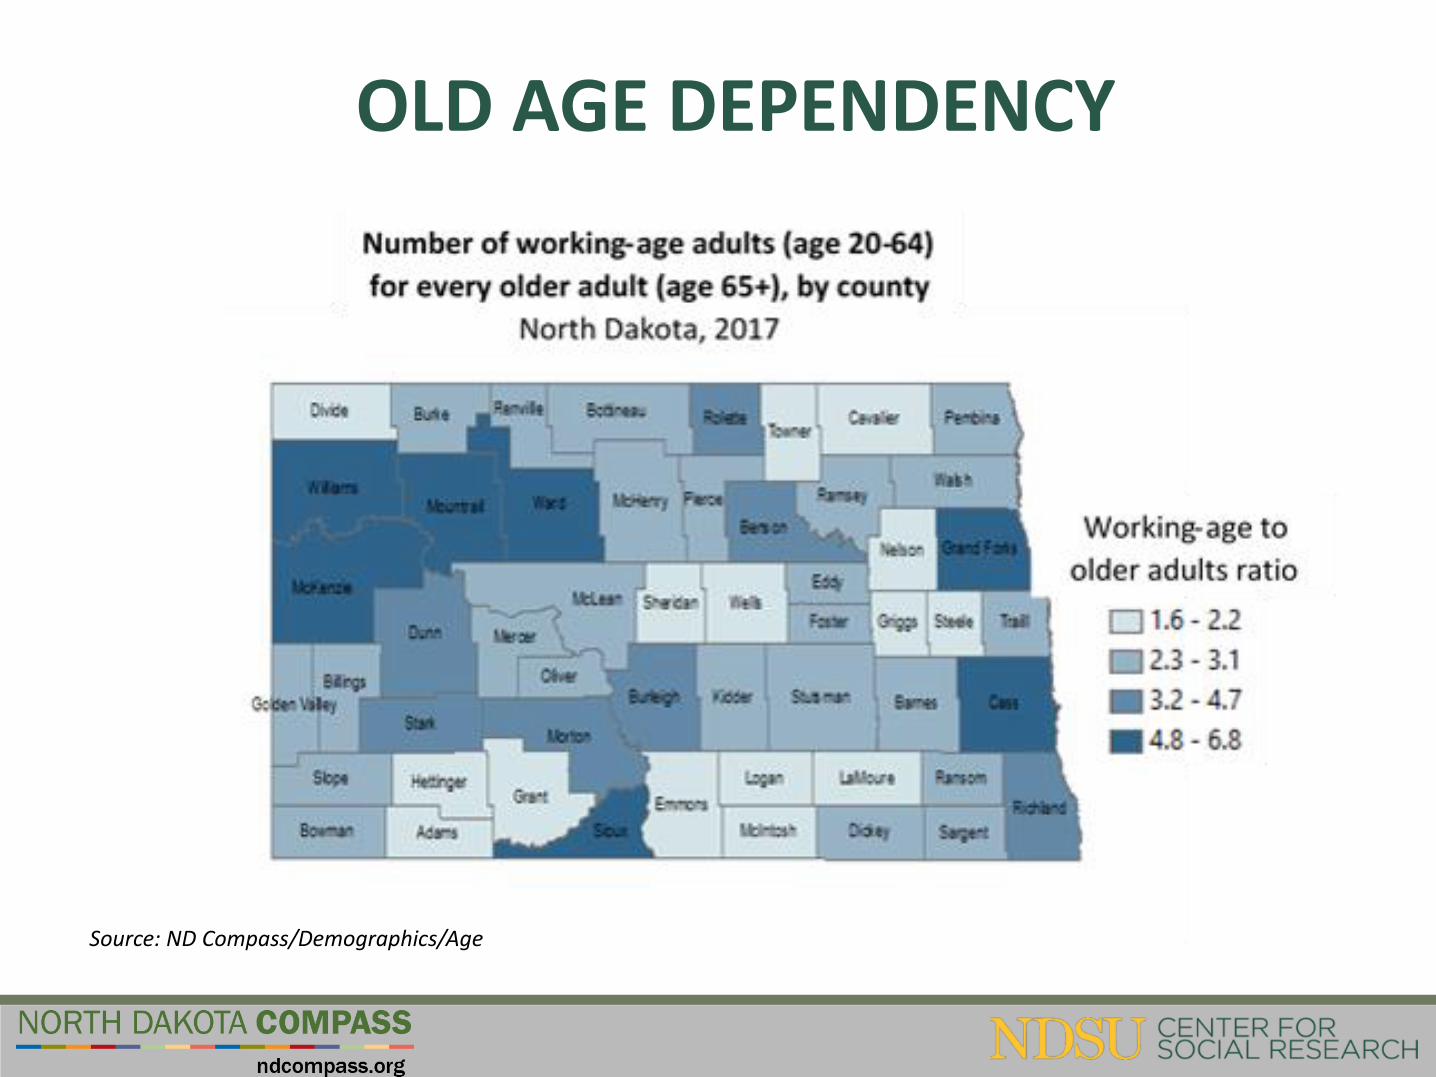
OLD AGE DEPENDENCY
Source: ND Compass/Demographics/Age
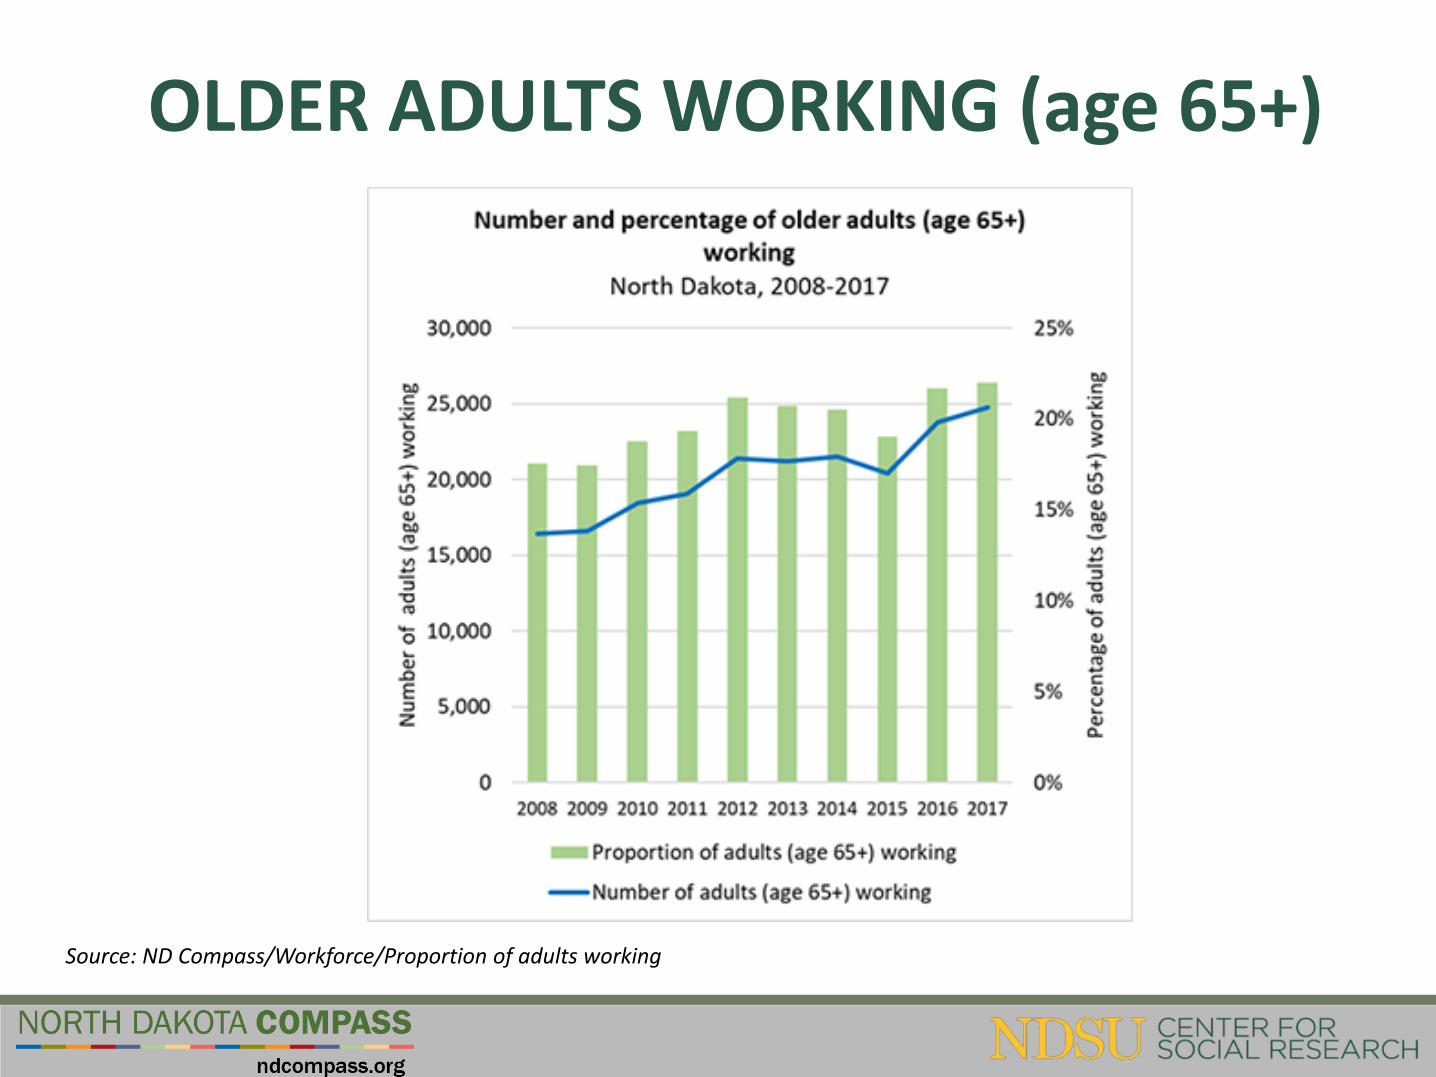
OLDER ADULTS WORKING (age 65+)
Source: ND Compass/Workforce/Proportion of adults working
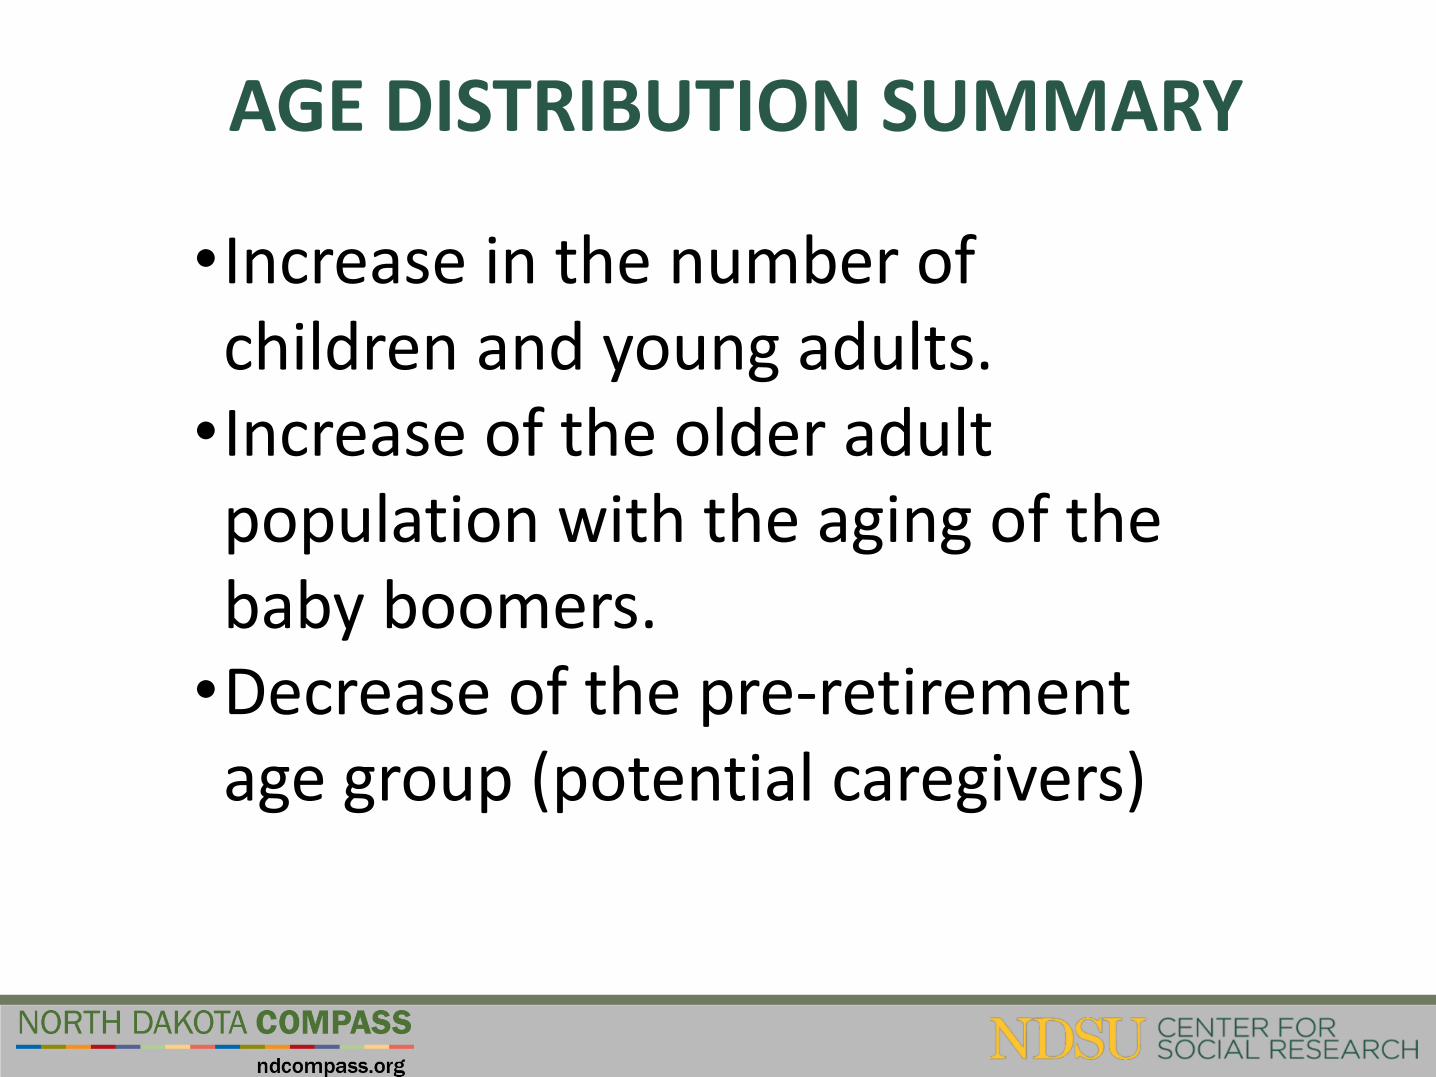
AGE DISTRIBUTION SUMMARY
•Increase in the number of children and young adults.•Increase of the older adult population with the aging of the baby boomers.•Decrease of the pre-retirement age group (potential caregivers)
GENDER BREAKDOWN
QUESTION
What is the gender breakdown in ND (total population)?
a) More males than females
b) Males and females are equal
c) More females than males
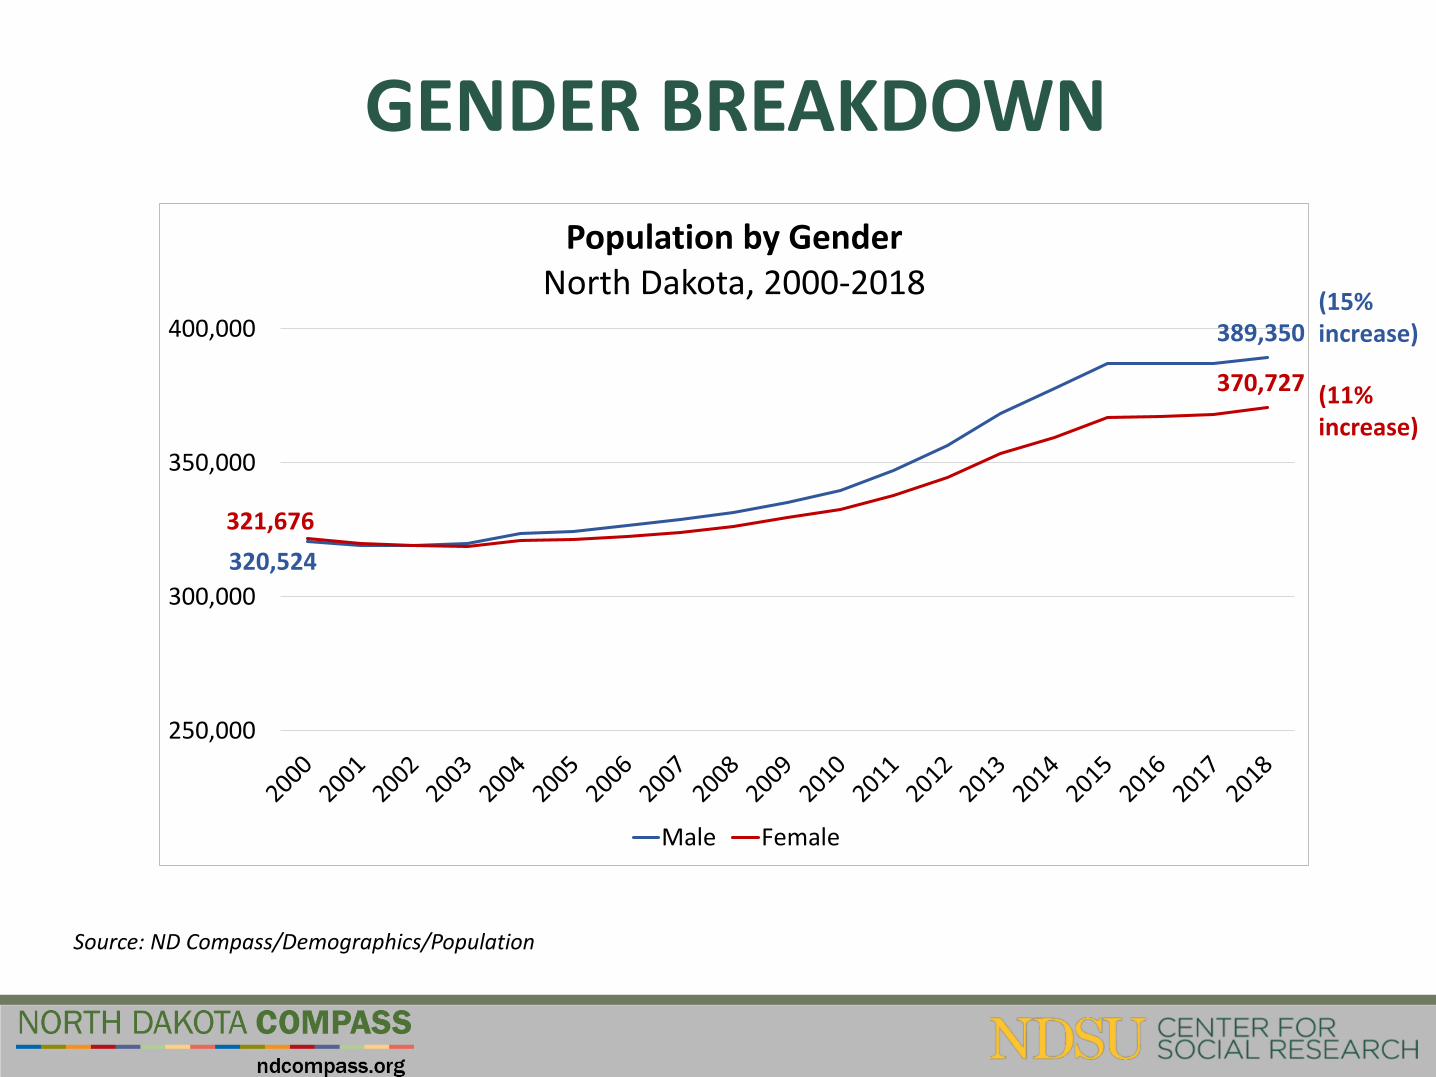
GENDER BREAKDOWN
320,524
389,350
321,676
370,727
250,000
300,000
350,000
400,000
Population by GenderNorth Dakota, 2000-2018
Male Female
Source: ND Compass/Demographics/Population
(15% increase)
(11% increase)
RACIAL & ETHNIC
COMPOSITION
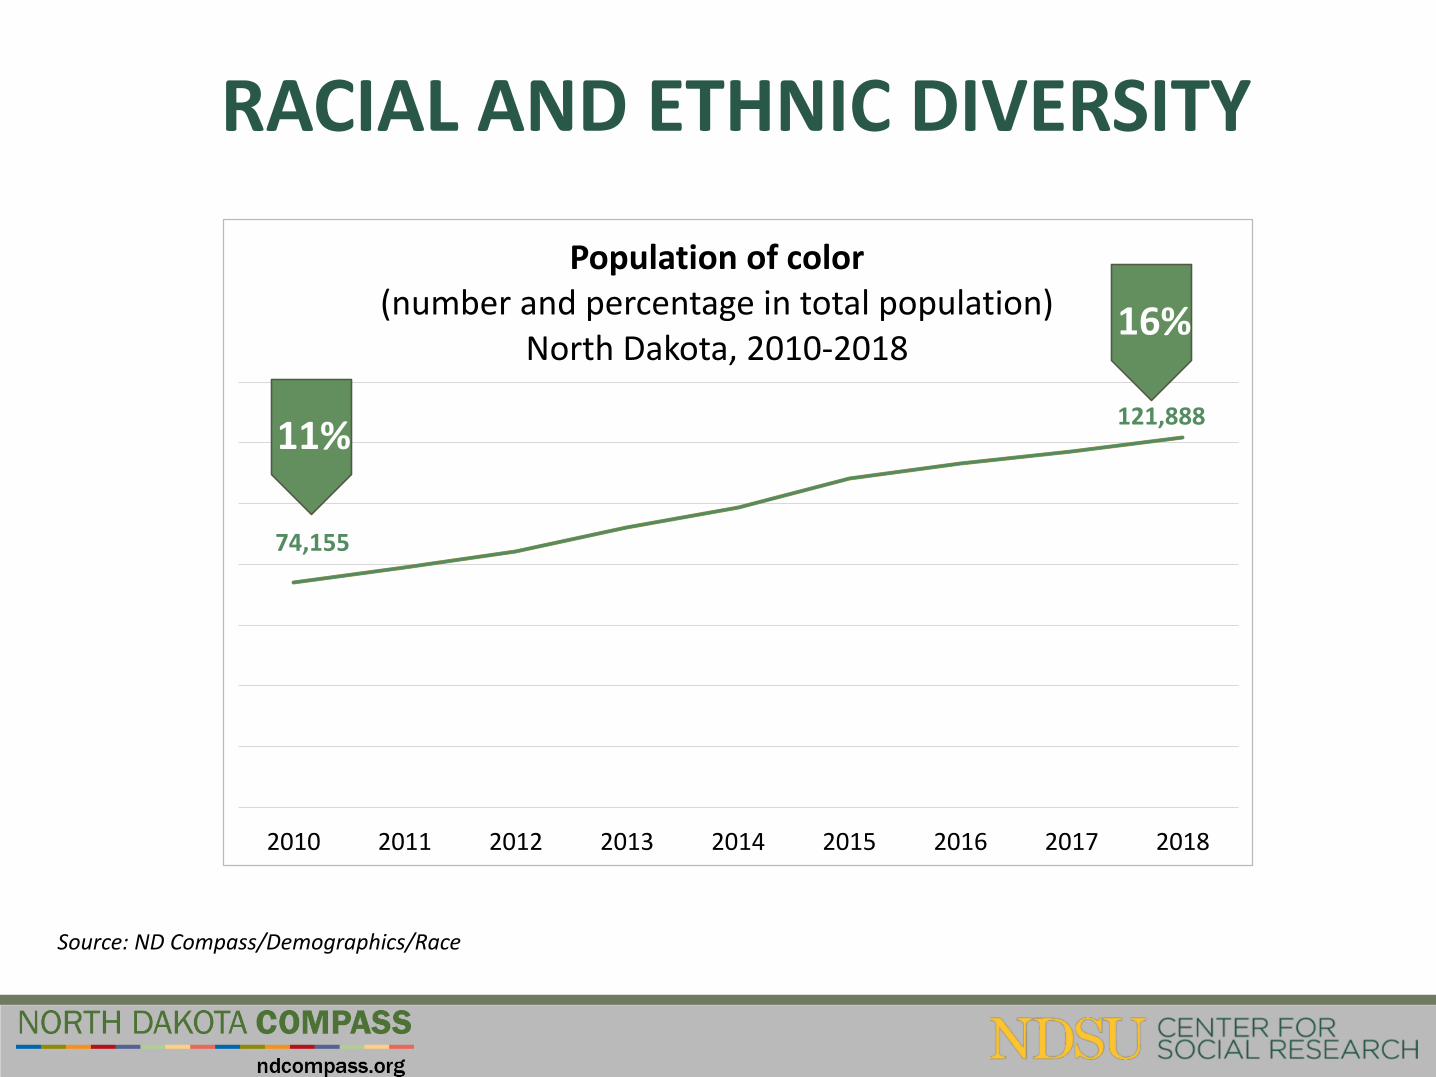
RACIAL AND ETHNIC DIVERSITY
2010 2011 2012 2013 2014 2015 2016 2017 2018
Population of color(number and percentage in total population)
North Dakota, 2010-2018
74,155
121,888
16%
Source: ND Compass/Demographics/Race
11%
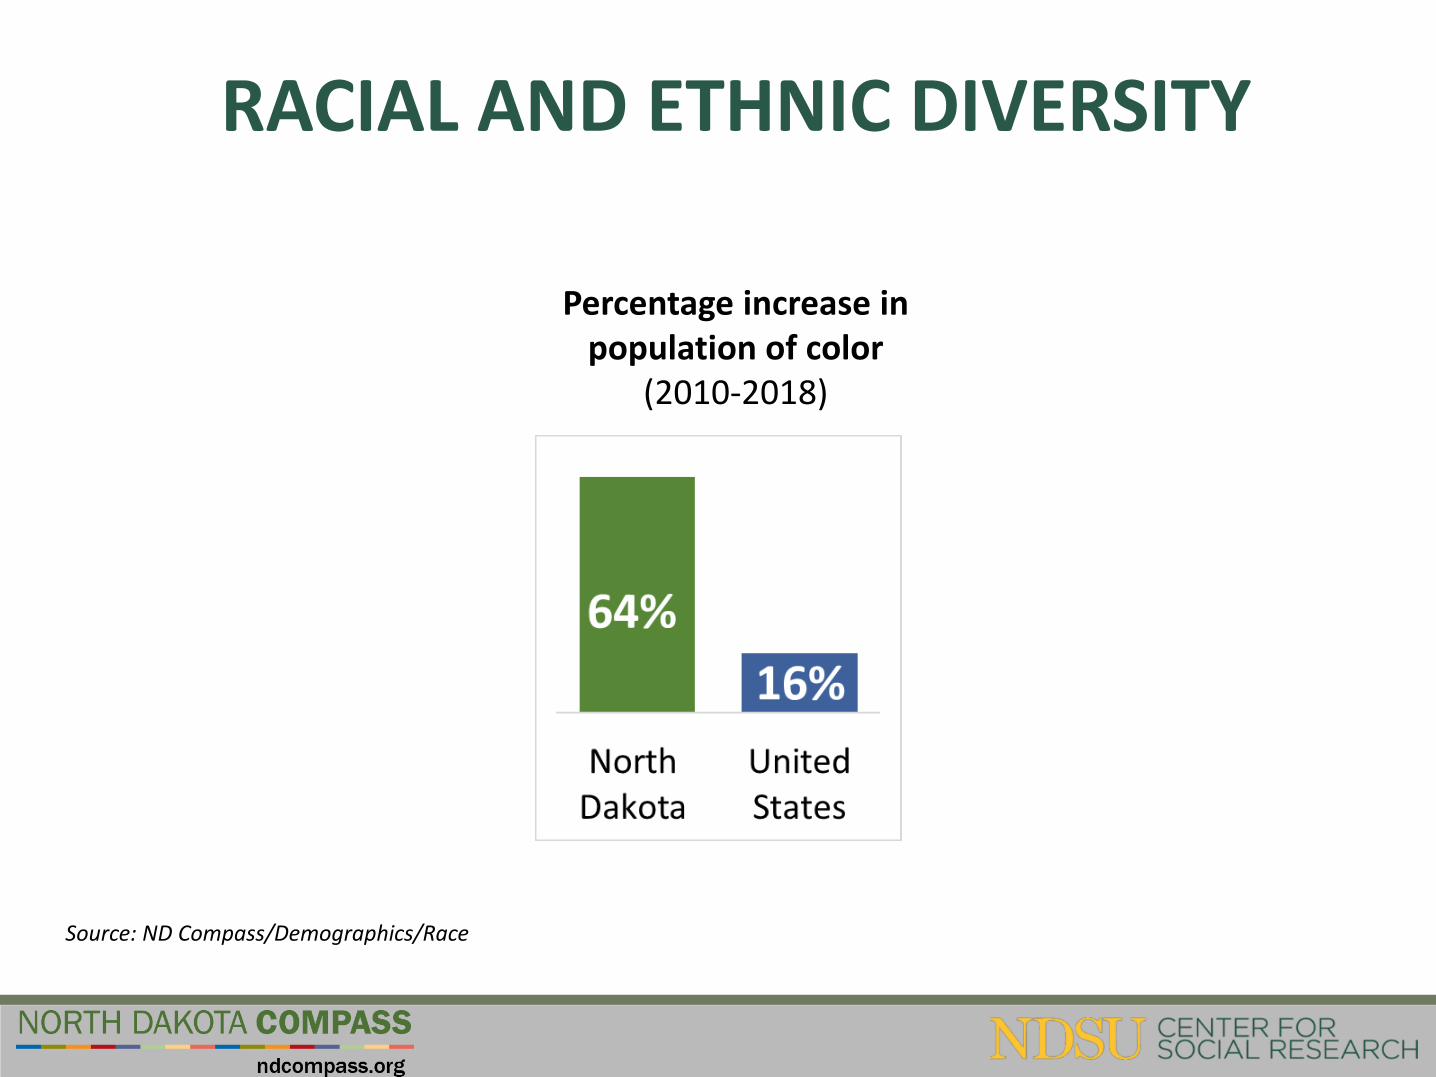
RACIAL AND ETHNIC DIVERSITY
Percentage increase in population of color
(2010-2018)
Source: ND Compass/Demographics/Race
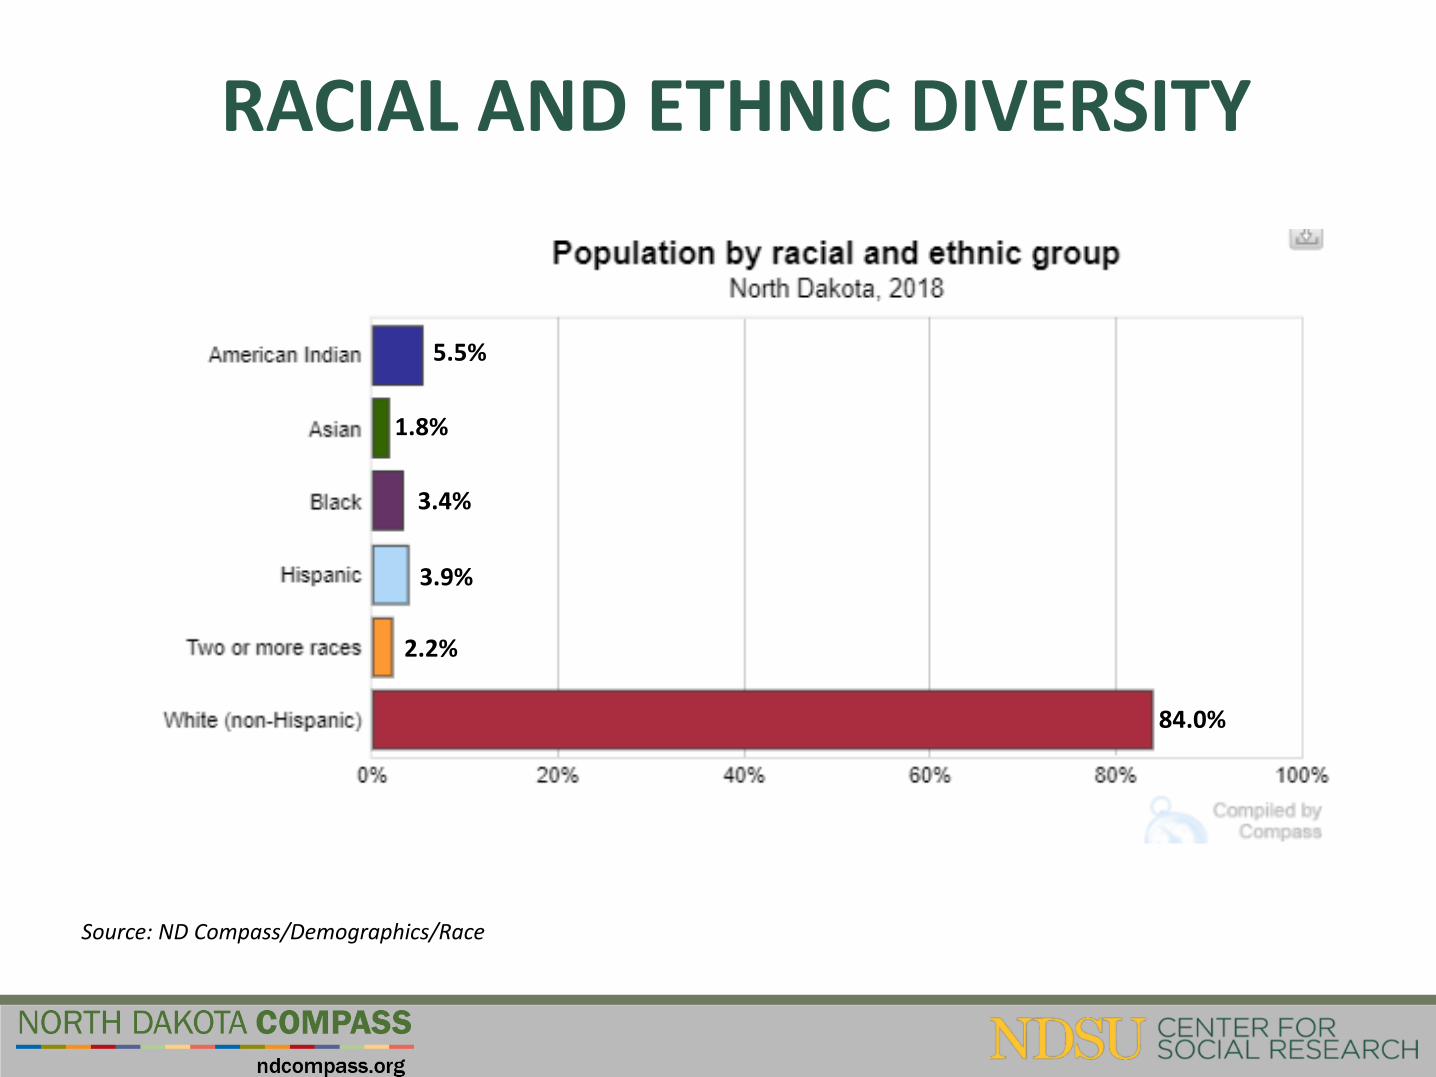
RACIAL AND ETHNIC DIVERSITY
Source: ND Compass/Demographics/Race
5.5%
1.8%
3.4%
3.9%
2.2%
84.0%
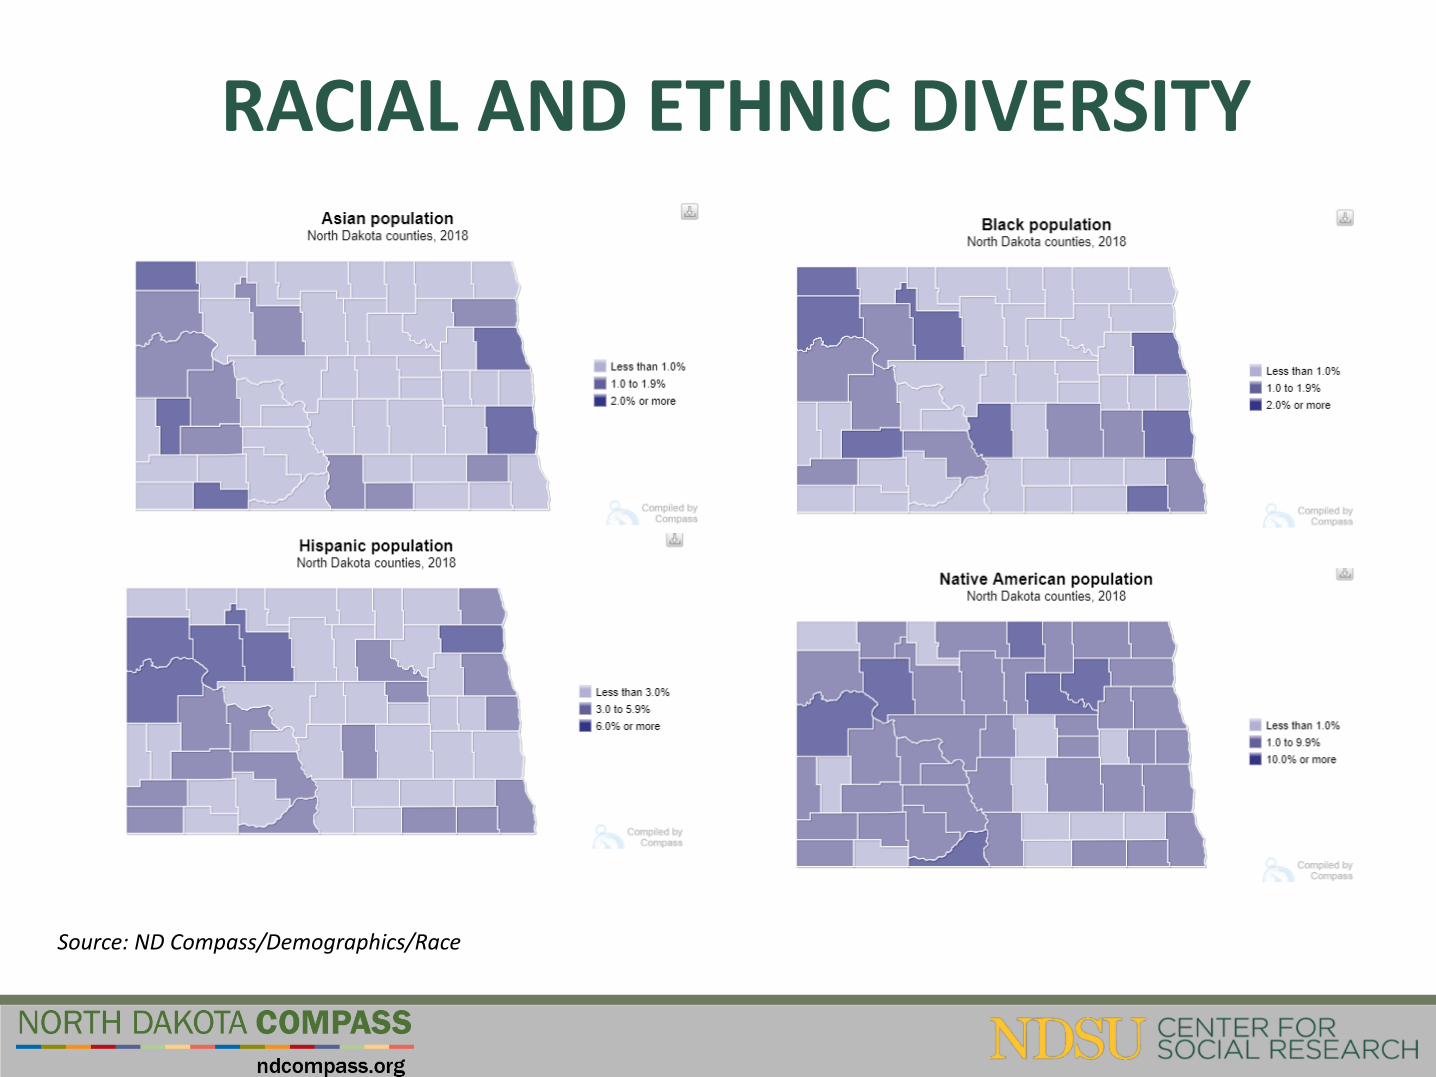
RACIAL AND ETHNIC DIVERSITY
Source: ND Compass/Demographics/Race
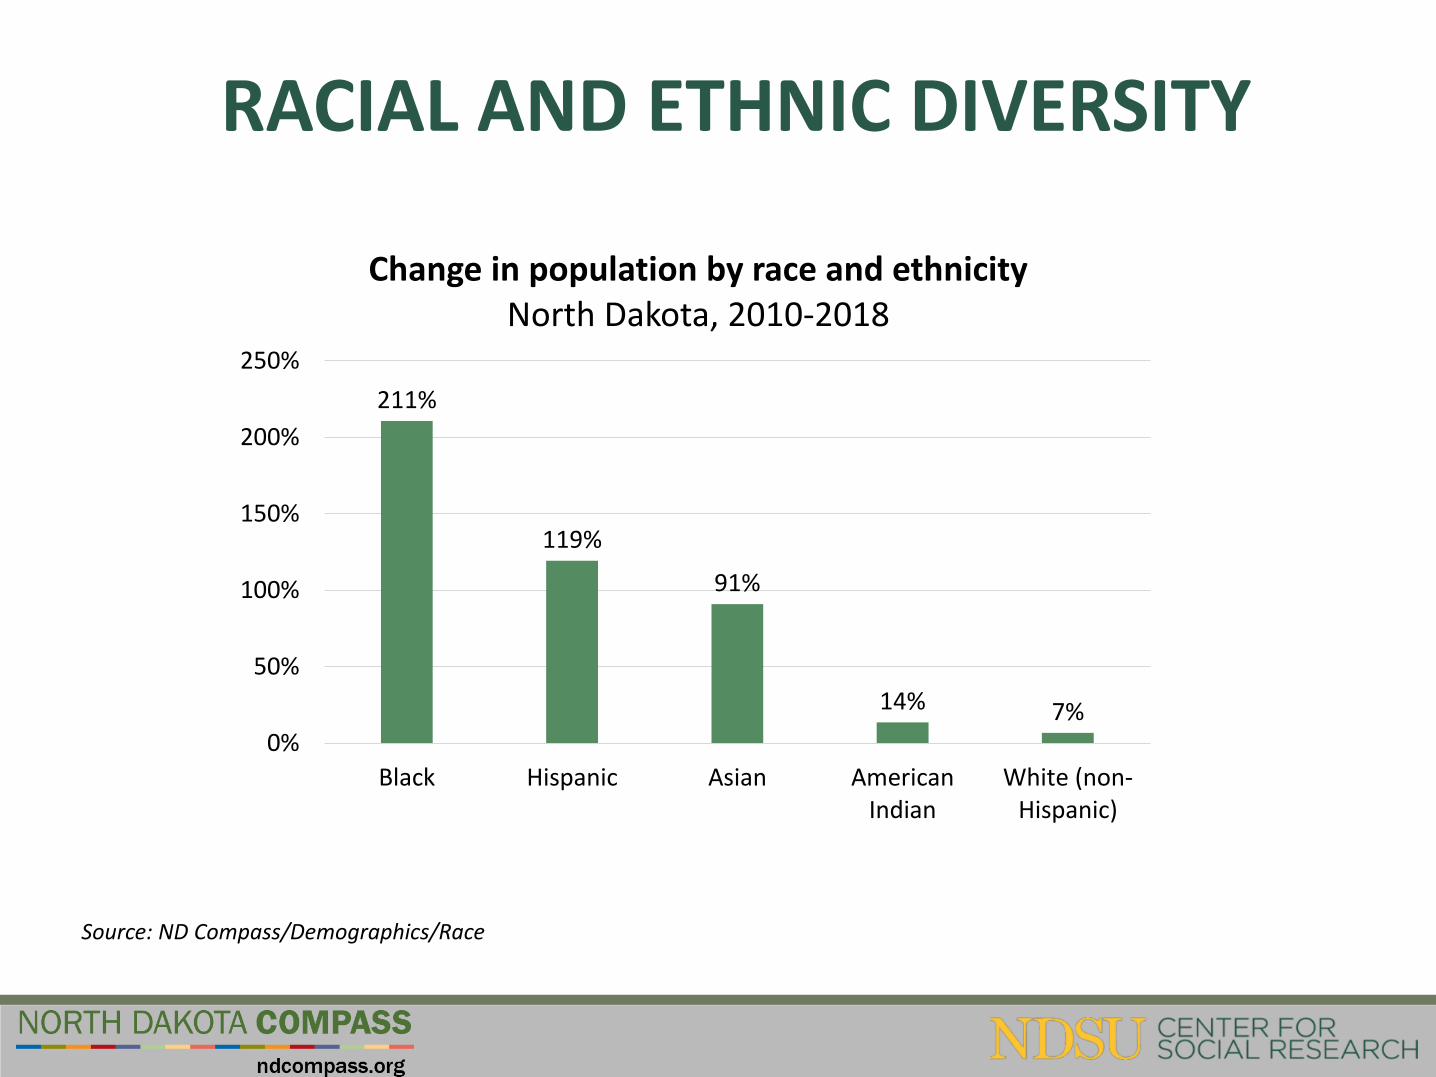
RACIAL AND ETHNIC DIVERSITY
211%
119%
91%
14% 7%0%
50%
100%
150%
200%
250%
Black Hispanic Asian AmericanIndian
White (non-Hispanic)
Change in population by race and ethnicityNorth Dakota, 2010-2018
Source: ND Compass/Demographics/Race
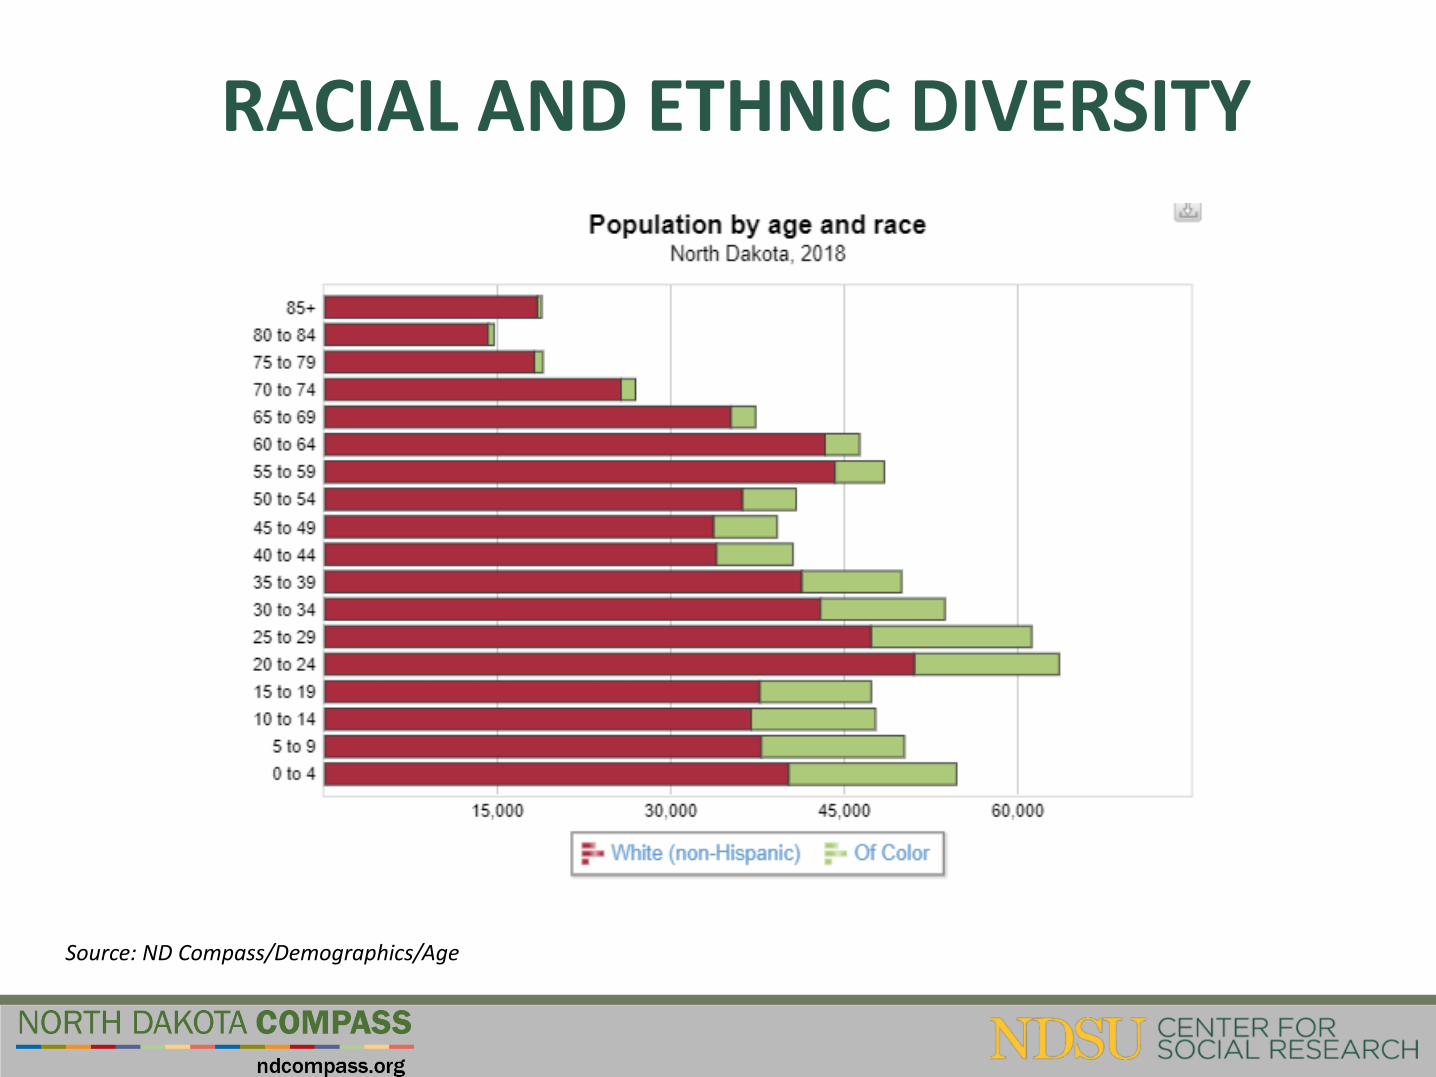
RACIAL AND ETHNIC DIVERSITY
Source: ND Compass/Demographics/Age
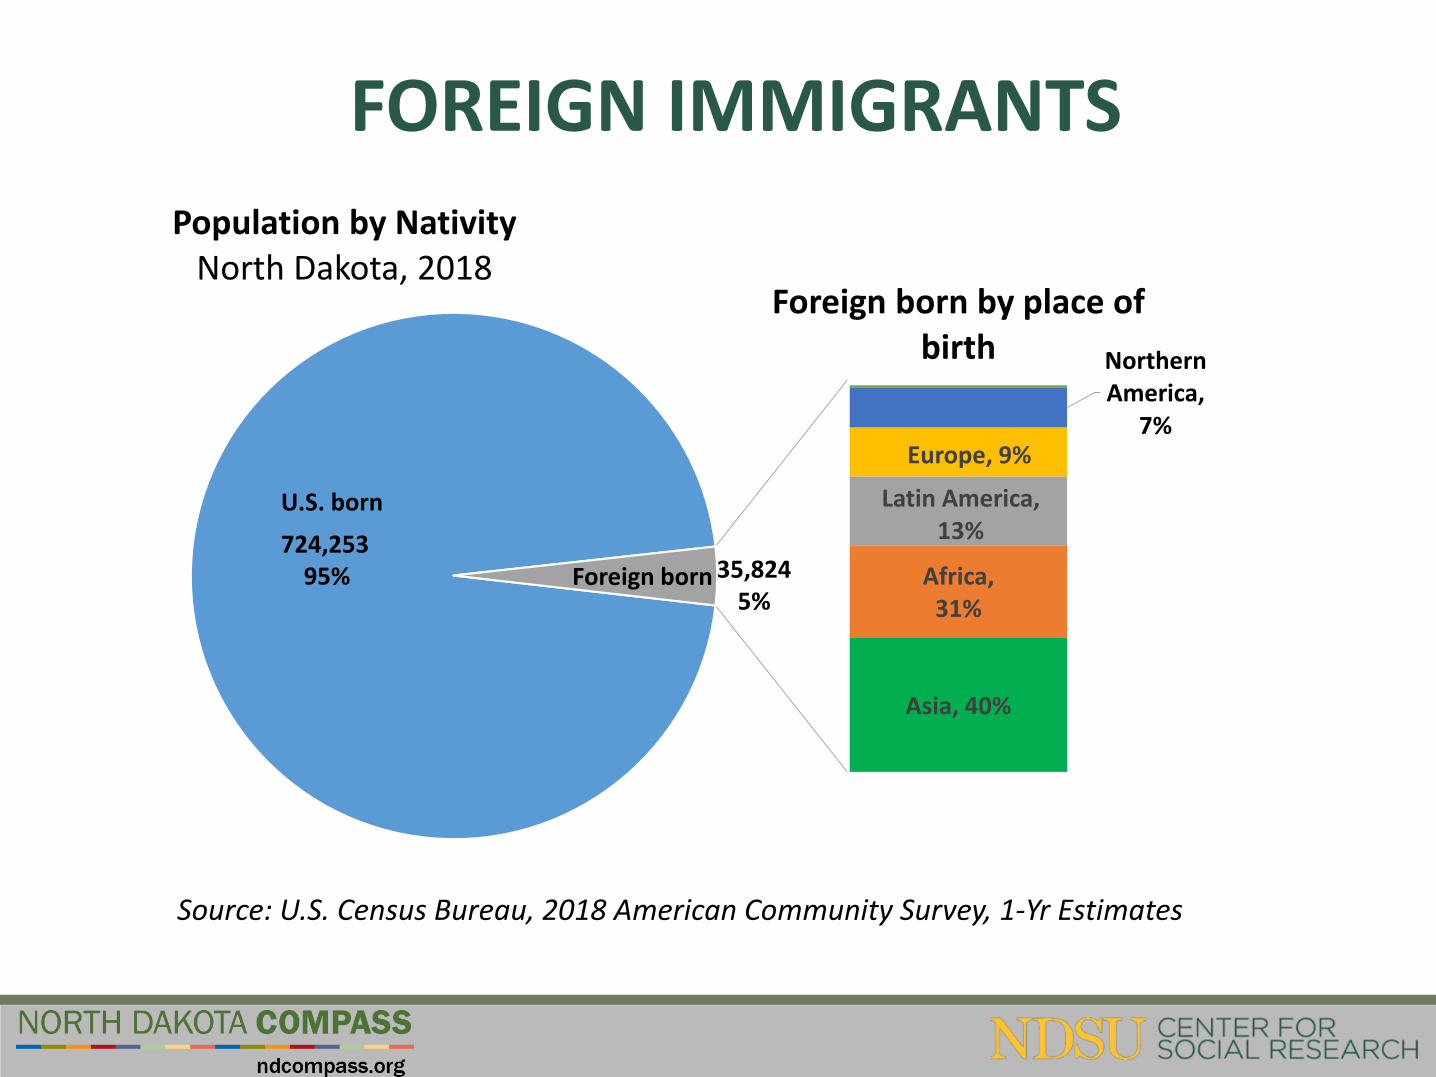
FOREIGN IMMIGRANTS
Population by NativityNorth Dakota, 2018
Asia, 40%
Africa, 31%
Latin America, 13%
Europe, 9%
Northern America,
7%
Foreign born by place of birth
724,25395% 35,824
5%
Source: U.S. Census Bureau, 2018 American Community Survey, 1-Yr Estimates
U.S. born
Foreign born
RACIAL AND ETHNIC DIVERSITY SUMMARY
• North Dakota is becoming increasingly diverse
• One of the least diverse states in the U.S.
CONCLUSION
• Dramatic population shifts, becoming younger while growing old, gender differences, and increased diversity
• Main trends inform sustainable and responsible planning
Thank You!
I n a C e r n u s c a , N o r t h D a k o t a C o m p a s sm i h a e l a . c e r n u s c a @ n d u s . e d u