Embed Size (px)
Citation preview

Depth sectioning with the aberration-correctedscanning transmission electron microscopeAlbina Y. Borisevich*, Andrew R. Lupini, and Stephen J. Pennycook
Condensed Matter Sciences Division, Oak Ridge National Laboratory, Oak Ridge, TN 37831
Edited by Frans Spaepen, Harvard University, Cambridge, MA, and accepted by the Editorial Board December 23, 2005 (received for review August 16, 2005)
The ability to correct the aberrations of the probe-forming lens inthe scanning transmission electron microscope provides not only asignificant improvement in transverse resolution but in additionbrings depth resolution at the nanometer scale. Aberration cor-rection therefore opens up the possibility of 3D imaging by opticalsectioning. Here we develop a definition for the depth resolutionfor scanning transmission electron microscope depth sectioningand present initial results from this method. Objects such ascatalytic metal clusters and single atoms on various support ma-terials are imaged in three dimensions with a resolution of severalnanometers. Effective focal depth is determined by statisticalanalysis and the contributing factors are discussed. Finally, currentchallenges and future capabilities available through new instru-ments are discussed.
aberration correction � electron microscopy � single-atom imaging
The successful implementation of spherical aberration cor-rection in the transmission electron microscope and scanning
transmission electron microscope (STEM) is undoubtedly one ofthe most exciting achievements in electron optics of the last fewdecades. Correction of magnetic lens aberrations to the thirdorder (1, 2) has led to revolutionary improvements in pointresolution and signal-to-noise ratio, expanding the range ofaccessible lattice spacings into the sub-Ångstrom regime (3) andenabling simultaneous detection of light and heavy elements (4).Before aberration correction, detection of a single atom was asignificant achievement (e.g., refs. 5–8), but now these obser-vations are possible and are even becoming routine for a muchwider range of materials (9–11). For a microscope equipped witha high-sensitivity aberration-corrected electron energy loss spec-trometer, analytical detection of single atoms within a bulk solidhas been reported (12).
However, in addition to improvements to existing techniques,aberration correction can enable completely new experiments tobe performed, especially when combined with other new devel-opments, such as environmental or in situ stages. In particular,the wider probe-forming aperture available after aberrationcorrection gives a reduced depth of focus. The STEM, largelydeveloped by Crewe and coworkers (13) provides the Z-contrastimage mode, which, to a good approximation, gives an incoher-ent image of the sample (14), making it possible to opticallysection through a sample in a way similar to confocal opticalmicroscopy (15). However, a significant difference from confo-cal microscopy is that the STEM technique does not use acollection pin-hole, which degrades the depth sensitivity but ismore convenient experimentally. The purpose of this paper is toexamine the resolution and contrast for the currently availablemicroscopes and demonstrate how 3D data sets can be collectedand analyzed for several test systems.
Results and DiscussionAberration Correction and Depth of Field. The aberration function� is defined as the deviation of the aberrated wavefront from anideal (unaberrated) wavefront such that the phase change acrossthe back focal plane of the objective lens is given by 2����, forwavelength �. In STEM field aberrations are normally ignored,
so this can be written as (omitting nonrotationally symmetricterms) (2)
���� �12
��2 �14
Cs�4 �
16
C5�6 �18
C7�8 � � � � , [1]
where � is the angle to the optical axis, � is defocus, and Cs, C5,and C7 are rotationally symmetric aberrations of the third, fifth,and seventh order, respectively. In an uncorrected microscope,which uses round magnetic lenses, Cs is always positive (16) andapproximately constant under standard conditions, whereasdefocus can be varied. Aberration correctors use nonroundlenses to enable variation of the aberration coefficients tominimize the aberration function and offset the effect of stillhigher-order terms. The second-generation aberration correc-tors installed at Oak Ridge National Laboratory (ORNL) canadjust aberrations up to the third order, whereas future correc-tors will correct aberrations up to the fifth order or higher (17).The lowest-order uncorrectable aberrations will ultimately de-termine the optimal aperture size � which in turn determines thebest achievable point resolution. For the case of incoherentimaging, the Rayleigh criterion for the diffraction limited casehas the form �r� � 0.61���, so the resolution scales inverselywith the aperture size. Furthermore, increasing the angle � alsoaffects the depth of field.
The depth of field �z can be defined numerically in a varietyof ways but in incoherent light optics is generally considered tobe a range of defocus within which the image contrast does notreduce significantly. Different definitions arise from the differ-ent quantitative assessments of what constitutes a significantchange of contrast. For example, Born and Wolf (18) suggest thedistance within which the intensity on the optic axis stays within20% of the maximum is a reasonable measure of the focaltolerance. By using the result that for systems with negligibleaberrations the intensity on the optic axis obeys the equation
I�z� � �sin� ��2
2�z�
��2
2�z �
2
I0, [2]
Born and Wolf (18) show that for this criterion the depth of field�z can be expressed as
�z ��
�2 . [3]
Conflict of interest statement: No conflicts declared.
This paper was submitted directly (Track II) to the PNAS office. F.S. is a guest editor invitedby the Editorial Board.
Freely available online through the PNAS open access option.
Abbreviations: BF, bright-field; HAADF, high-angle annular dark-field; ORNL, Oak RidgeNational Laboratory; STEM, scanning transmission electron microscopy.
*To whom correspondence should be addressed. E-mail: [email protected].
3044–3048 � PNAS � February 28, 2006 � vol. 103 � no. 9 www.pnas.org�cgi�doi�10.1073�pnas.0507105103
Dow
nloa
ded
by g
uest
on
June
15,
202
0 D
ownl
oade
d by
gue
st o
n Ju
ne 1
5, 2
020
Dow
nloa
ded
by g
uest
on
June
15,
202
0 D
ownl
oade
d by
gue
st o
n Ju
ne 1
5, 2
020

Thus, with increasing orders of aberration correction and theassociated increase in aperture size, the depth of field willdecrease very quickly. This change is visualized in Fig. 1, whichshows reconstructions of the probe shape in transverse andvertical directions for three microscopes, starting with those atORNL: the VG HB501UX microscope before correction (Fig.1a) and then the C3-corrected VG HB603U microscope (Fig. 1b)and, finally, a hypothetical future microscope with C5-corrector(Fig. 1c). For the uncorrected 100-kV instrument (Fig. 1a) withcold field emission gun (C3 � 1.3 mm, Cc � 1.3 mm, �E � 0.3eV, � � 10 mrad), the depth of field as defined by Eq. 3 is �45nm; indeed, over the range of �10 to 10 nm from the maximumintensity, the probe changes very little. For the C3-corrected,300-kV microscope (C3 � �40 �m, C5 � 10 cm, Cc � 1.6 mm,�E � 0.3 eV, � � 23 mrad), the predicted depth of field is 3.7nm, suggesting nanometer-scale depth sensitivity. For the hypo-thetical C3�C5-corrected STEM with a monochromator (C3 �2.3 �m, C5 � �2.1 mm, C7 � 50 cm, Cc � 1.6 mm, �E � 0.1 eV,� � 50 mrad), Eq. 3 gives a 1.0-nm focal tolerance. Changes arealso evident laterally: With aberration correction (Fig. 1 b andc), the probe rapidly becomes sub-Ångstrom. In addition, be-cause the correction is achieved via compensation of the aber-ration terms of different order, the probe acquires some asym-metry in the vertical direction, most evidently in Fig. 1b. On theoptic axis intensity decays monotonically in the overfocus region,whereas, in the underfocus region, it decays sharply and formssubsidiary maxima.
Another consequence of the aberration compensation is thatthe focal depth estimates from the more realistic probe profiles(Fig. 1) are somewhat larger than the estimates from Eq. 3, whichwas derived for the symmetric, aberration-free case. For the
vertical profile of Fig. 1b, the full width at 80% maximum(equivalent to Eq. 3) is �3.9 nm (vs. 3.7 nm), and, for the profileof the Fig. 1c, it is �1.05 nm (vs. 1.0 nm). These probe profilesincorporate chromatic aberration Cc and gun energy spread �E,which also contribute to the probe widening in the verticaldirection compared with the aberration-free case.
In the above discussion, the focal depth parameter was usedin the traditional sense, i.e., as a vertical range around a perfectdefocus value. However, nanometer-scale focal tolerance shouldenable us to get depth-sensitive information about our samples,enabling a 3D STEM imaging technique akin to confocal opticalmicroscopy. In this case there is no single optimal defocus value,and parameters such as vertical resolution, will be more appro-priate for the discussion of the technique’s prospects. Resolutioncan be difficult to define precisely, so we will use an analog ofthe Rayleigh criterion. In 1879, Rayleigh proposed that ‘‘twocomponents of equal intensity should be considered to be justresolved when the principal intensity maximum of one coincideswith the first intensity minimum of the other’’ (18). We cantherefore construct a vertical equivalent of Rayleigh’s criterion(in an aberration-free approximation) using Eq. 2 to calculatethe vertical distance �zR between the maximum and the first zeroof the intensity on the optic axis as
�zR � 2�
�2 . [4]
This criterion is illustrated in Fig. 2, which shows vertical profilesof the sum of the two probes focused at various distances fromeach other (parameterized by ���2). Thus, even currently avail-able microscopes are potentially capable of resolving objectsdirectly above one another just 7–8 nm apart, and, for futuregenerations of microscopes, this capability will improve. Thefollowing part of the paper will discuss how these approximatevalues translate into quantitative 3D information from samplessuch as catalytic nanoparticles.
First Experiments in 3D Imaging. The discussion above was based onthe estimates of the depth sensitivity parameters of the electronprobe. These estimates, however, do not translate directly intofocal depth and vertical resolution achievable for an arbitrarysample, because many sample-related effects can alter theobserved focal depth. At the same time, samples composed ofheavy atoms or particles randomly distributed in amorphous oroff-axis light matrices should provide the best vehicle for thedemonstration of depth-sensing abilities of STEM, because
Fig. 1. Probe intensity profiles as a function of defocus for microscopes ofthree generations; intensities are shown in logarithmic scale with 12 equallyspaced logarithmic contours. (a) Uncorrected VG501. (b) VG603 with a third-order corrector. (c) A hypothetical instrument with a C3�C5 corrector (seedetailed probe parameters in text). Note different scales vertically and later-ally. Profiles are shifted vertically so that intensity maxima are at zero defocus.
Fig. 2. Vertical profiles of the intensity on the optic axis for the sum of twoaberration-free probes with different vertical separations. Defocus z is scaledby ���2.
Borisevich et al. PNAS � February 28, 2006 � vol. 103 � no. 9 � 3045
PHYS
ICS
Dow
nloa
ded
by g
uest
on
June
15,
202
0
propagation of the beam through the sample results mainly in asimple broadening of the probe. It is therefore possible to treatthe 3D data array as a simple convolution of the 3D objectfunction and the 3D probe shape; in this regime, the verticalresolution can achieve its theoretical limit. For the VG HB603Umicroscope at ORNL, this limit is �8 nm (Fig. 1b), which iscomparable with the scale of many structural features in nano-materials. Several examples of depth-resolved studies of suchsamples are given below.
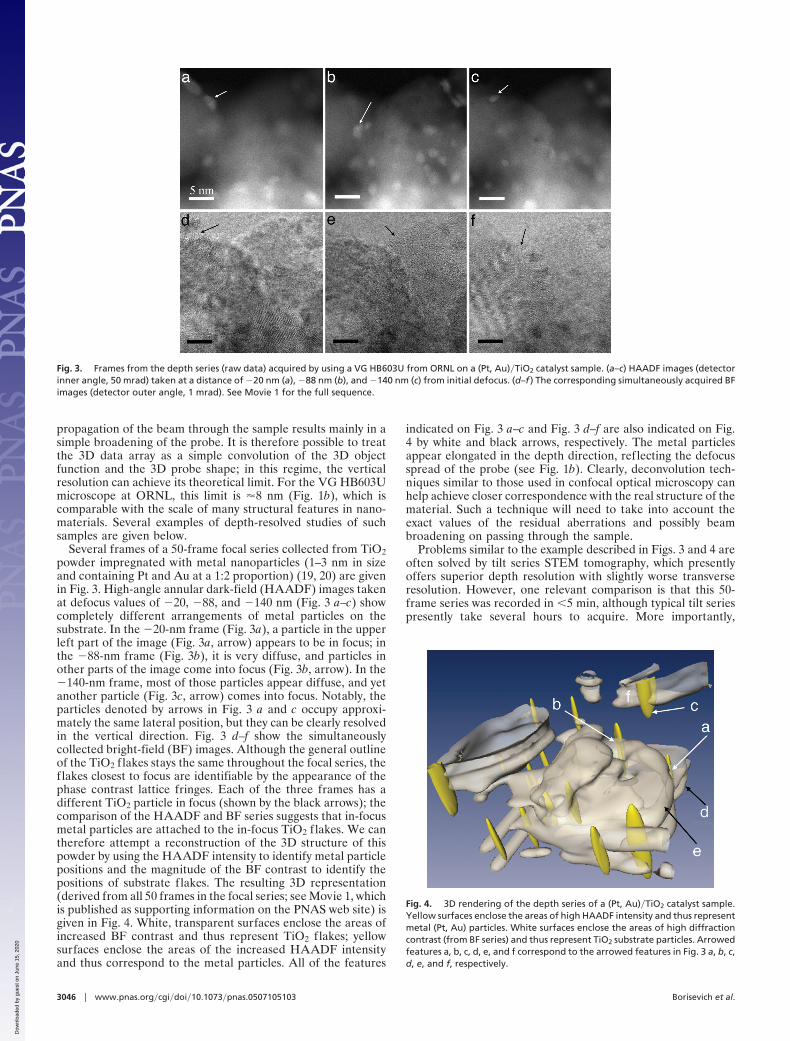
Several frames of a 50-frame focal series collected from TiO2powder impregnated with metal nanoparticles (1–3 nm in sizeand containing Pt and Au at a 1:2 proportion) (19, 20) are givenin Fig. 3. High-angle annular dark-field (HAADF) images takenat defocus values of �20, �88, and �140 nm (Fig. 3 a–c) showcompletely different arrangements of metal particles on thesubstrate. In the �20-nm frame (Fig. 3a), a particle in the upperleft part of the image (Fig. 3a, arrow) appears to be in focus; inthe �88-nm frame (Fig. 3b), it is very diffuse, and particles inother parts of the image come into focus (Fig. 3b, arrow). In the�140-nm frame, most of those particles appear diffuse, and yetanother particle (Fig. 3c, arrow) comes into focus. Notably, theparticles denoted by arrows in Fig. 3 a and c occupy approxi-mately the same lateral position, but they can be clearly resolvedin the vertical direction. Fig. 3 d–f show the simultaneouslycollected bright-field (BF) images. Although the general outlineof the TiO2 flakes stays the same throughout the focal series, theflakes closest to focus are identifiable by the appearance of thephase contrast lattice fringes. Each of the three frames has adifferent TiO2 particle in focus (shown by the black arrows); thecomparison of the HAADF and BF series suggests that in-focusmetal particles are attached to the in-focus TiO2 flakes. We cantherefore attempt a reconstruction of the 3D structure of thispowder by using the HAADF intensity to identify metal particlepositions and the magnitude of the BF contrast to identify thepositions of substrate flakes. The resulting 3D representation(derived from all 50 frames in the focal series; see Movie 1, whichis published as supporting information on the PNAS web site) isgiven in Fig. 4. White, transparent surfaces enclose the areas ofincreased BF contrast and thus represent TiO2 flakes; yellowsurfaces enclose the areas of the increased HAADF intensityand thus correspond to the metal particles. All of the features
indicated on Fig. 3 a–c and Fig. 3 d–f are also indicated on Fig.4 by white and black arrows, respectively. The metal particlesappear elongated in the depth direction, reflecting the defocusspread of the probe (see Fig. 1b). Clearly, deconvolution tech-niques similar to those used in confocal optical microscopy canhelp achieve closer correspondence with the real structure of thematerial. Such a technique will need to take into account theexact values of the residual aberrations and possibly beambroadening on passing through the sample.
Problems similar to the example described in Figs. 3 and 4 areoften solved by tilt series STEM tomography, which presentlyoffers superior depth resolution with slightly worse transverseresolution. However, one relevant comparison is that this 50-frame series was recorded in �5 min, although typical tilt seriespresently take several hours to acquire. More importantly,
Fig. 3. Frames from the depth series (raw data) acquired by using a VG HB603U from ORNL on a (Pt, Au)�TiO2 catalyst sample. (a–c) HAADF images (detectorinner angle, 50 mrad) taken at a distance of �20 nm (a), �88 nm (b), and �140 nm (c) from initial defocus. (d–f ) The corresponding simultaneously acquired BFimages (detector outer angle, 1 mrad). See Movie 1 for the full sequence.
Fig. 4. 3D rendering of the depth series of a (Pt, Au)�TiO2 catalyst sample.Yellow surfaces enclose the areas of high HAADF intensity and thus representmetal (Pt, Au) particles. White surfaces enclose the areas of high diffractioncontrast (from BF series) and thus represent TiO2 substrate particles. Arrowedfeatures a, b, c, d, e, and f correspond to the arrowed features in Fig. 3 a, b, c,d, e, and f, respectively.
3046 � www.pnas.org�cgi�doi�10.1073�pnas.0507105103 Borisevich et al.
Dow
nloa
ded
by g
uest
on
June
15,
202
0

tilt-series tomography depends on the validity of the projectionapproximation (by definition, the depth of field should begreater than the sample thickness) and is therefore constrainedto smaller convergence angles, necessarily reducing the pointresolution, or requiring extremely thin samples (21). Theseconstraints will become even more limiting for future probeswith higher convergence angles, such as the probe on Fig. 1c. Nothaving these limitations, depth slicing can be used for 3Dlocalization of objects as small as one atom and in objects thickerthan the depth of focus, producing models of the imaged sampleswith depth resolution on the order of several nanometers andatomic resolution laterally, as illustrated in the next example.
Fig. 5 shows several frames from a focal series of a sample of-Al2O3 powder impregnated with Pt2Ru4(CO)18 (22), dried,and mounted on carbon film. The -Al2O3 flake is off-axis andappears as a pale blur. In the frame taken at a defocus value of�12 nm (Fig. 5a), a thin metal particle (arrow) in the lower rightcorner appears to be in focus, whereas, in the next frame(defocus �16 nm) (Fig. 5b), it is already out of focus and athicker particle in the upper left corner (Fig. 5b, arrow) comesinto focus instead. Several steps later, at a defocus of �40 nm(Fig. 5c), the -Al2O3 flakes fade far out of focus, but a singlePt atom (Fig. 5c, arrow) is visible attached to the surface of theunderlying carbon film.
Single atoms are visible over several adjacent frames (notshown on Fig. 5; see Movie 2, which is published as supportinginformation on the PNAS web site), which can thus be used toquantitatively analyze the dependence of the incremental inten-sity on defocus. For the Pt atom on carbon, the incrementalintensity was computed from a 2D Gaussian fit of the 25 � 25pixel patches of the image containing the atom. The carbon film
background was assumed to be flat, and the Pt atom image wasassumed to be rotationally symmetric. The resulting dependenceis given in Fig. 6. The intensity peaks at approximately �40 nm,but the Pt atom is still quite visible 4 nm away from that defocus;the peak width calculated from Gaussian fit is larger thanprojected for the probe (full width at 80% maximum of 5.9 nmcompared with 3.9 nm; see Fig. 1b). This discrepancy could bedue to beam broadening upon passing through the carbon filmor just the sparse sampling in the depth direction (4-nm steps).Vertical movement of the sample is also a potential problem.Although it is routinely checked (and found negligible) byreproducing one or more of the initial frames after a series iscomplete, it cannot be monitored in real time.
Error bars on Fig. 6 are equal to the standard deviation of theintensity of the carbon film background away from the metalatoms. At its peak, the Pt atom in Fig. 5c is �7 above thebackground, which results in a wide range of visibility over thenoise and thus allows us to make a good estimate of the focaldepth. Clearly, the signal-to-noise parameters of images, as wellas the quantitative settings of acquisition, will play a major rolein the range of visibility of point defects and should be taken intoaccount in data analysis. Any experimental determination of thefocal depth should be conducted in such a way as to minimize thisinfluence to obtain a reliable result. The effect of the signal-to-noise ratio on the apparent focal depth was also suggested fromobservation of single Hf atoms within an amorphous SiO2layer (23).
It should however be noted that for an isolated object, such asa single heavy atom on a light support, the precision with whichthe vertical position could be determined is much better than thevertical resolution of the instrument. If there exists independentevidence that the source is a single atom (e.g., by comparisonwith other single atom intensities and agreement with totalconcentration) and sufficient quantitative data can be collectedto describe the depth dependence of the associated incrementalintensity, the vertical position (i.e., peak center) can be deter-mined by fitting with sub-nanometer accuracy. For example, thePt atom on carbon film in the series from Fig. 5 can be locatedat the height of �40.3 0.2 nm with 95% confidence.
It should again be emphasized that with currently availableinstruments these values of resolution and precision are onlyachievable for heavy atoms�particles on considerably lighteramorphous or nearly amorphous substrates. Superior depthresolution for similar systems will undoubtedly be achieved fornew C3�C5 corrected instruments with the predicted focal depthof �1 nm (Fig. 1c). Depth sectioning within aligned crystals iscurrently out of reach because of electron channeling phenom-ena (24), meaning the signal from an atom in such a structuredepends on the location in a more complicated manner. How-ever, additional simulations show that some depth sectioning insuch crystals may become possible in these future instruments,as predicted by Peng et al. (25). The simulation details and
Fig. 6. Variation of the incremental intensity of the single atom from thedepth series in Fig. 5 (■ ). The line is a Gaussian fit.
Fig. 5. Frames from the HAADF (detector inner angle, 50 mrad) depth series (smoothed raw data) acquired by using a VG HB603U microscope at ORNL on a(Pt, Ru)�-Al2O3 catalyst sample at �12 nm (a), �16 nm (b), and �40 nm (c) from initial defocus. See Movie 2 for the full sequence.
Borisevich et al. PNAS � February 28, 2006 � vol. 103 � no. 9 � 3047
PHYS
ICS
Dow
nloa
ded
by g
uest
on
June
15,
202
0

implications are discussed in ref. 26. Deconvolution is also alogical next step.
ConclusionsAberration correction improves the resolution of scanningtransmission electron microscopes by enabling higher conver-gence angles for the STEM probes. Probe simulations showthat the increased convergence angles result in a depth sen-sitivity of currently available aberration-corrected STEM in-struments on the nanometer scale; this sensitivity is expectedto improve when the next generation of instrumentation isavailable.
Initial experiments using a 300-kV VG HB603U with a23-mrad probe angle demonstrate nanometer-scale depth sen-sitivity on nanocatalyst samples. Nanometer-sized particles andeven single atoms can be localized in three dimensions. Statis-tical analysis of the data are used to quantify the effective focaldepth, which is determined by the probe but also affected bysample parameters, such as signal-to-noise ratios, and imageacquisition settings. New microscopes with C3�C5 correctors areexpected to significantly improve the depth resolution in amor-
phous and nanoparticulate materials and enable depth section-ing in aligned crystals.
Materials and MethodsSamples were prepared by dispersing catalytic powders ontoholey carbon grids. Before imaging, samples were annealed invacuum at 100°C for 15 min to reduce carbon contamination.STEM observations were made with VG HB603U microscopeoperated at 300 kV and equipped with Nion (Kirkland, WA)aberration corrector. The microscope parameters were as fol-lows: probe angle, 23 mrad; HAADF detector inner angle, 50mrad; BF detector outer angle, 1 mrad.
We thank M. Amiridis, R. Adams, O. Alexeev, and L. Ortiz-Soto (allfrom the University of South Carolina, Columbia) for the provision ofcatalyst samples. This work was supported by Laboratory DirectedResearch and Development Program Contract DE-AC05-00OR22725from the U.S. Department of Energy (managed by UT-Battelle)and by appointments to the Oak Ridge National Laboratory Post-doctoral Research Program administered jointly by the Oak RidgeNational Laboratory and the Oak Ridge Institute for Science andEducation.
1. Urban, K., Kabius, B., Haider, M. & Rose, H. (1999) J. Electron Microsc. 48,821–826.
2. Krivanek, O. L., Dellby, N. & Lupini, A. R. (1999) Ultramicroscopy 78, 1–11.3. Nellist, P. D., Chisholm, M. F., Dellby, N., Krivanek, O. L., Murfitt, M. F.,
Szilagyi, Z. S., Lupini, A. R., Borisevich, A., Sides, W. H. & Pennycook, S. J.(2004) Science 305, 1741.
4. Chisholm, M. F., Lupini, A. R., Pennycook, S. J., Ohkubo, I., Christen, H. M.,Findlay, S. D., Oxley, M. P. & Allen, L. J. (2004) Microsc. Microanal. 10, Suppl.2, 256–257.
5. Crewe, A. V., Wall, J. & Langmore, J. (1970) Science 168, 1338–1340.6. Nellist, P. D. & Pennycook, S. J. (1996) Science 274, 413–415.7. Suenaga, K., Tence, T., Mory, C., Colliex, C., Kato, H., Okazaki, T., Shinohara,
H., Hirahara, K., Bandow, S. & Iijima, S. (2000) Science 290, 2280–2282.8. Voyles, P. M., Muller, D. A., Grazul, J. L., Citrin, P. H. & Gossmann, H. J. L.
(2002) Nature 416, 826–829.9. Pennycook, S. J., Lupini, A. R., Kadavanich, A., McBride, J. R., Rosenthal,
S. J., Puetter, R. C., Yahil, A., Krivanek, O. L., Dellby, N., Nellist, P. D. L., etal. (2003) Z. Metallkd. 94, 350–357.
10. Varela, M., Lupini, A. R., vanBenthem, K., Borisevich, A. Y., Chisholm, M. F.,Shibata, N., Abe, E. & Pennycook, S. J. (2005) Annu. Rev. Mater. Res. 35,539–569.
11. Wang, S. W., Borisevich, A. Y., Rashkeev, S. N., Glazoff, M. V., Sohlberg, K.,Pennycook, S. J. & Pantelides, S. T. (2004) Nat. Mater. 3, 143–146.
12. Varela, M., Findlay, S. D., Lupini, A. R., Christen, H. M., Borisevich, A. Y.,
Dellby, N., Krivanek, O. L., Nellist, P. D., Oxley, M. P., Allen, L. J. &Pennycook, S. J. (2004) Phys. Rev. Lett. 92, 095502.
13. Crewe, A. V., Wall, J. & Welter, L. M. (1968) J. Appl. Phys. 39, 5861–5868.14. Pennycook, S. J. & Jesson, D. E. (1991) Ultramicroscopy 37, 14–38.15. Wilson, T. (1990) Confocal Microscopy (Academic, San Diego).16. Scherzer, O. (1936) Z. Phys. 101, 593–603.17. Krivanek, O. L., Nellist, P. D., Dellby, N., Murfitt, M. F. & Szilagyi, Z. (2003)
Ultramicroscopy 96, 229–237.18. Born, M. & Wolf, E. (1989) Principles of Optics: Electromagnetic Theory of
Propagation, Interference, and Diffraction of Light (Pergamon, New York).19. Mihut, C., Chandler, B. D. & Amiridis, M. D. (2002) Catal. Comm. 3, 91–97.20. Mihut, C., Descorme, C., Duprez, D. & Amiridis, M. D. (2002) J. Catal. 212,
125–135.21. Midgley, P. A. & Weyland, M. (2003) Ultramicroscopy 96, 413–431.22. Alexeev, O. S., Graham, G. W., Shelef, M., Adams, R. D. & Gates, B. C. (2002)
J. Phys. Chem. B 106, 4697–4704.23. vanBenthem, K., Lupini, A. R., Kim, M., Baik, H. S., Doh, S., Lee, J.-H., Oxley,
M. P., Findlay, S. D., Allen, L. J., Luck, J. T. & Pennycook, S. J. (2005) Appl.Phys. Lett. 87, 034104.
24. Fertig, J. & Rose, H. (1981) Optik 59, 407–429.25. Peng, Y. P., Nellist, P. D. & Pennycook, S. J. (2004) J. Electron Microsc. 53,
257–266.26. Borisevich, A. Y., Lupini, A. R., Travaglini, S. M. & Pennycook, S. J. (2006)
J. Electron Microsc., in press.
3048 � www.pnas.org�cgi�doi�10.1073�pnas.0507105103 Borisevich et al.
Dow
nloa
ded
by g
uest
on
June
15,
202
0

Corrections and Retraction
CORRECTIONS
PHYSICS. For the article ‘‘Depth sectioning with the aberration-corrected scanning transmission electron microscope,’’ by Al-bina Y. Borisevich, Andrew R. Lupini, and Stephen J. Penny-cook, which appeared in issue 9, February 28, 2006, of Proc NatlAcad Sci USA (103:3044–3048; first published February 21, 2006;
Fig. 3. Frames from the depth series (raw data) acquired by using a VG HB603U from ORNL on a (Pt, Au)/TiO2 catalyst sample. (a–c) HAADF images (detectorinner angle, 50 mrad) taken at a distance of �20 nm (a), �88 nm (b), and �140 nm (c) from initial defocus. (d–f ) The corresponding simultaneously acquired BFimages (detector outer angle, 1 mrad). See Movie 1 for the full sequence. (Scale bar, 5 nm.)
www.pnas.org�cgi�doi�10.1073�pnas.0609974103
MEDICAL SCIENCES. For the article ‘‘A functional SNP in thepromoter of the SERPINH1 gene increases risk of pretermpremature rupture of membranes in African Americans,’’ byHongyan Wang, Samuel Parry, George Macones, Mary D.Sammel, Helena Kuivaniemi, Gerard Tromp, George Argyro-poulos, Indrani Halder, Mark D. Shriver, Roberto Romero, andJerome F. Strauss III, which appeared in issue 36, September 5,2006, of Proc Natl Acad Sci USA (103:13463–13467; first pub-lished August 28, 2006; 10.1073�pnas.0603676103), the authorsnote that in the Abstract (line 9) and in the first paragraph ofResults (line 6), the –656 T allele carriage rate in AfricanAmericans (12.4%) was reported instead of the intended –656 Tallele frequency (7.4%). These errors do not affect the conclu-sions of the article.
www.pnas.org�cgi�doi�10.1073�pnas.0609705103
10.1073�pnas.0507105103), the authors note that, due to aprinter’s error, Fig. 3 appeared incorrectly. When the locantswere replaced to meet journal style, surrounding portions of theimage were inadvertently distorted. The corrected figure and itslegend appear below.
19212 � PNAS � December 12, 2006 � vol. 103 � no. 50 www.pnas.org

MEDICAL SCIENCES. For the article ‘‘Germ-line mutations inp27Kip1 cause a multiple endocrine neoplasia syndrome in ratsand humans,’’ by Natalia S. Pellegata, Leticia Quintanilla-Martinez, Heide Siggelkow, Elenore Samson, Karin Bink,Heinz Hof ler, Falko Fend, Jochen Graw, and Michael J.Atkinson, which appeared in issue 42, October 17, 2006, of
Proc Natl Acad Sci USA (103:15558–15563; first publishedOctober 9, 2006; 10.1073�pnas.0603877103), the authors notethat in Fig. 3B, patient II-1 was incorrectly identified as havingparathyroid cancer (PC). The corrected figure and legendappear below. These errors do not affect the conclusions of thearticle.
Fig. 3. Identification of a germ-line mutation in CDKN1B in a suspected MEN1 patient and segregation analyses. (A) A PCR fragment corresponding to partof the CDKN1B exon 1 was obtained from the proband and cloned, and both alleles were sequenced separately. (Upper) The germ-line of the proband showeda heterozygous nonsense mutation at codon 76 (c. 692G3A). (Lower) Shown is the position of the mutation in the CDKN1B gene and p27 protein. (B) Probandfamily pedigree. Generation numbers are represented by Roman numerals; individuals are represented by Arabic numerals. The proband is II-1, indicated by thearrow. Mut�, mutation-positive individual; AM, acromegaly; PT, pituitary adenoma; pHPT, primary hyperparathyroidism; RA, renal angiomyolipoma; HT,hypertension; TC, testicular cancer. Age of onset is given in parentheses. (C) Haplotype analysis. The microsatellite markers on chromosome 12, and their positions,are indicated on the right. The affected haplotype is indicated in black. (D) Analysis of the tumor tissue of individual II-4. (Left) Sequencing chromatogramsshowing the 692G3A mutation in both normal and tumor tissue DNA and RNA. (Right) Immunohistochemical staining with an anti-p27 antibody shows lackof p27 protein in the tumor tissue. The arrows indicate infiltrating lymphocytes used as positive control for p27 staining. (Immunoperoxidase originalmagnification: �640.)
www.pnas.org�cgi�doi�10.1073�pnas.0609565103
RETRACTION
CHEMISTRY. For the articles ‘‘Flexible bilayers with spontaneouscurvature lead to lamellar gels and spontaneous vesicles,’’ byBret A. Coldren, Heidi Warriner, Ryan van Zanten, Joseph A.Zasadzinski, and Eric B. Sirota, which appeared in issue 8,February 21, 2006, of Proc Natl Acad Sci USA (103:2524–2529;first published February 8, 2006; 10.1073�pnas.0507024103), and‘‘Lamellar gels and spontaneous vesicles in catanionic surfactantmixtures,’’ by Bret A. Coldren, Heidi Warriner, Ryan vanZanten, Joseph A. Zasadzinski, and Eric B. Sirota, whichappeared in issue 6, March 14, 2006, of Langmuir (22:2465–2473), the editors of both journals retract these papers becausethey constitute duplicate publication.
Solomon H. Snyder, Senior Editor, PNAS
David G. Whitten, Editor-in-Chief, Langmuir
www.pnas.org�cgi�doi�10.1073�pnas.0609486103
PNAS � December 12, 2006 � vol. 103 � no. 50 � 19213
CORR
ECTI
ON
SA
ND
RETR
ACT
ION