Embed Size (px)
Citation preview

RESEARCH Open Access
Development and validation of an earlychildhood development scale for use inlow-resourced settingsDana Charles McCoy1,2*, Christopher R. Sudfeld1, David C. Bellinger1,3, Alfa Muhihi4, Geofrey Ashery4,Taylor E. Weary1, Wafaie Fawzi1 and Günther Fink1
Abstract
Background: Low-cost, cross-culturally comparable measures of the motor, cognitive, and socioemotional skills ofchildren under 3 years remain scarce. In the present paper, we aim to develop a new caregiver-reported earlychildhood development (ECD) scale designed to be implemented as part of household surveys in low-resourcedsettings.
Methods: We evaluate the acceptability, test-retest reliability, internal consistency, and discriminant validity of thenew ECD items, subscales, and full scale in a sample of 2481 18- to 36-month-old children from peri-urban and ruralTanzania. We also compare total and subscale scores with performance on the Bayley Scales of Infant Development(BSID-III) in a subsample of 1036 children. Qualitative interviews from 10 mothers and 10 field workers are used to informquantitative data.
Results: Adequate levels of acceptability and internal consistency were found for the new scale and its motor, cognitive,and socioemotional subscales. Correlations between the new scale and the BSID-III were high (r > .50) for the motor andcognitive subscales, but low (r < .20) for the socioemotional subscale. The new scale discriminated between children’sskills based on age, stunting status, caregiver-reported disability, and adult stimulation. Test-retest reliability scores werevariable among a subset of items tested.
Conclusions: Results of this study provide empirical support from a low-income country setting for the acceptability,reliability, and validity of a new caregiver-reported ECD scale. Additional research is needed to test these and othercaregiver reported items in children in the full 0 to 3 year range across multiple cultural and linguistic settings.
Keywords: Early child development, Low-income countries, Measurement, Validation, 0–3
BackgroundMounting evidence suggests the importance of investingin early childhood development (ECD) for enhancing theeconomic, health, and educational status of individuals,communities, and nations [1–4]. Over the past severaldecades, a number of well-validated tools have beendeveloped for measuring individual children’s motor,cognitive, language, and social functioning during thefirst years of life (e.g., Griffiths Mental DevelopmentScales, Denver Developmental Screening Test, Bayley
Scales of Infant and Toddler Development). These directassessments are typically done by clinically trainedpersonnel and provide detailed information on individuals’developmental status that can be used for informing clin-ical decisions, understanding developmental processes, ortesting the efficacy of early interventions [5].Despite their utility in capturing rich data, individual-
level assessments are limited in their ability to provide esti-mates of population-level developmental status for severalreasons. First, many of these assessments are quitecostly in terms of their copyrights, the time they take toadminister, as well as the resources necessary to trainassessors, making them impractical for use at scale [6].Second, the majority of existing developmental assessments
* Correspondence: [email protected] T. H. Chan School of Public Health, Boston, MA, USA2Harvard Graduate School of Education, Cambridge, MA, USAFull list of author information is available at the end of the article
© The Author(s). 2017 Open Access This article is distributed under the terms of the Creative Commons Attribution 4.0International License (http://creativecommons.org/licenses/by/4.0/), which permits unrestricted use, distribution, andreproduction in any medium, provided you give appropriate credit to the original author(s) and the source, provide a link tothe Creative Commons license, and indicate if changes were made. The Creative Commons Public Domain Dedication waiver(http://creativecommons.org/publicdomain/zero/1.0/) applies to the data made available in this article, unless otherwise stated.
McCoy et al. Population Health Metrics (2017) 15:3 DOI 10.1186/s12963-017-0122-8

have been created with one particular—primarily high-resourced, Western—cultural context in mind. Althoughgreat advances have been made recently in developingnew tools for non-Western, low-resourced settings(e.g., the Malawi Developmental Assessment Tool, theInter-American Development Bank’s PRIDI tool, theDevelopmental Milestones Checklist, the East Asia andPacific Early Child Development Scales), the utility ofthese assessments for making generalizations outside ofthe context in which they were developed is unknown[7, 8]. Finally, many comprehensive developmental as-sessments have focused primarily on motor, cognitive,and language development, while neglecting to integrateearly manifestations of social, emotional, and regulatorycompetence. Although many socioemotional skills varyin importance and developmental determinants cross-culturally, research has increasingly shown the earlyemergence of a core, basic set of these capacities to bestrongly related to later-life outcomes in diverse partsof the world [6, 9–13].In recent years, several new tools have been developed
to address these limitations and provide comprehensivepopulation-level data in older children (e.g., UNICEF’sEarly Childhood Development Index for 3- and 4-year-olds, the Early Development Index for school-aged chil-dren) [14, 15]. Still, no such scale exists for the under-three age period, when children’s brains and bodies aredeveloping most rapidly and are most susceptible tointervention [16]. Given that target 4.2 of the SustainableDevelopment Goals aims to “ensure that all girls andboys have access to quality ECD,” measuring children’sdevelopmental status at the population level is of im-portant policy relevance [17]. Internationally validatedtools would provide a new opportunity for global ECDadvocates to quantify children’s needs across countriesand regions, to make more informed decisions regardingpolicies and resource allocation, and to monitor progressin achieving global goals congruent with the post-2015agenda [18].In this study, we describe the development of a set of
caregiver-reported items for quickly and easily measur-ing the motor, cognitive, and socioemotional skills ofchildren under three living in low-resourced settings,collectively known as the Caregiver-Reported EarlyDevelopment Index (CREDI). Our focus on a caregiverreport format allows us to address several practical andconceptual challenges of using direct assessment withlarge groups of infants and toddlers. Compared to directassessments, caregiver reports require limited training andimplementation time, provide a more generalizable per-spective on children’s skills and behaviors across time andsetting, are more appropriate for capturing socioemotionalskills, and are less likely to be biased against children whoare unfamiliar with clinical assessments, who are shy with
strangers, or who do not understand verbal instructions[5]. In particular, the CREDI is designed to be 1) simpleand clear enough to be answered by a caregiver withminimal formal education, 2) short enough to be feasiblyintegrated within large-sample household data collectionefforts, 3) sufficiently “culturally neutral” to allow forcross-context comparison, and 4) adequately aligned with“gold standard” direct assessment measures of provenclinical and developmental utility. In creating the CREDI,our ultimate aim is to generate a new tool that will serveto provide conceptually rich, developmentally informed,population-level data on global progress in alleviatingECD-related inequities and meeting target 4.2 of theSDGs. In the present paper, we detail the initial valid-ation of the CREDI using qualitative and quantitativedata among 18- to 36-month-old children in peri-urbanand rural Tanzania, including evidence of the individualitems’ and overall scale’s acceptability, reliability, andvalidity. We conclude by describing the implications ofthis generative work for future validation and expansionefforts.
MethodsStudy sampleThe sample for the present study was comprised of chil-dren 18 to 36 months who had previously participated ina neonatal vitamin A supplementation trial in the Moro-goro region of Tanzania (registered at anzctr.org.au asACTRN12610000636055) [19], as well as the person inthe household who reported to spend the most time car-ing for that child (i.e., his or her primary caregiver). Thisparticular area of Tanzania was selected over alternatestudy locations due to its 1) track record and infrastruc-ture for conducting high-quality early childhood research,and 2) similarity to the broader population of Tanzaniawith regard to its high prevalence of poverty and malnutri-tion, mix of peri-urban and rural settings, and cultural di-versity. Newborns were eligible for the original vitamin Astudy if they were able to feed orally, were born within thepast 72 h, were not already enrolled in other clinical trials,their family intended to reside in the study area for at least6 months post-delivery, and their caregivers providedwritten informed consent. Notably, results of the ori-ginal vitamin A trial revealed no detectable impacts onchildren’s developmental outcomes [19], suggesting thatrandomization in the original study should not have af-fected the results of the present analysis.For the original trial, a total of 20,104 randomly se-
lected children living in Morogoro region were enrolled.For the follow-up study, sampling was restricted to chil-dren from the original trial living within the IfakaraDemographic Surveillance Site (IHI DSS). No other ex-clusion criteria (e.g., based on disability or health status)
McCoy et al. Population Health Metrics (2017) 15:3 Page 2 of 18

were applied. Given this, the sample is representativeof the greater Ifakara area, with all eligible children inIfakara town and the surrounding villages being equallylikely to be selected for participation. In keeping with theaim of the study to validate the CREDI for children 18–36months, only those within this age range were selected,with the specific age of the child varying non-systematicallybased on the timing of initial recruitment to the vita-min A study and the timing of the CREDI assessment(38% 18–23mo, 25% 24–29mo, and 38% 30–36mo).Children in the present sample were found to be com-parable to those sampled from the 2015–2016 Tanza-nian national Demographic Health Survey (DHS) inrates of stunting (43.3% vs. 43.8%, respectively) [20].Compared to the Tanzanian average, mothers in thissample were more likely to have attended primaryschool than those in the DHS (87.9% vs. 61.9%, respect-ively), but less likely to have completed secondary schoolor higher (7.3% versus 23.4%).
EthicsAll study protocols were approved by institutional re-view boards (IRBs) at the Harvard T. H. Chan School ofPublic Health, the National Institute of Medical Re-search of Tanzania, and the Ifakara Health Institute.Caregivers provided written consent for their own par-ticipation and the participation of their children after afield worker read the consent out loud and answeredany questions. All study staff were trained and monitoredin IRB-approved procedures for identifying participantneeds and, as necessary, providing referrals to local physicaland mental health services.
Item development phaseMultiple steps were taken to develop the ECD items an-alyzed in this study. First, we reviewed the ECD meas-urement literature to help us to define 1) the purpose ofthe scale, 2) the age-appropriate developmental domainsand constructs to be covered by the scale, and 3) the val-idation plan. Second, and based on the literature review,we built an inventory of existing measurement toolsfrom high-, middle-, and low-income country contexts(see Table 5 in Appendix A), and identified gaps in theircoverage of our age-specific domains and constructs.Third, we selected, adapted, and/or created an initial setof items based on the following criteria:Each item must:
1) have evidence for face, construct, and/or criterionvalidity for representing one of the core ECDdomains1
2) be developmentally appropriate for children 18 to36 months2
3) be reportable by a primary caregiver on a yes/noresponse scale (i.e., the item cannot be task-based,cannot be rated on a continuous scale,3 and must besufficiently concrete that a caregiver would alreadybe familiar with the specified behavior/skill inthe child)
4) be simple in wording to allow for easy translationand comprehension by caregivers with minimalformal education
5) have the potential to discriminate betweenindividuals (i.e., indicate a high likelihood ofvariability in response)
6) not be subject to severe social desirability (i.e., acaregiver will not feel compelled to respond in aparticular way in order to please the assessor oravoid shame/embarrassment)
7) be culturally neutral (i.e., involve skills, behaviors,objects, ideas, or terminology that are commonacross contexts)
Each of these three phases was led by the study au-thors, with results reviewed by a group of advisory teammembers who represented multiple backgrounds (e.g.,research, practice, policy), fields (e.g., health, nutrition,psychology, education), and geographical contexts (e.g.,United States, sub-Saharan Africa, Asia, Latin America).Advisory group members provided oral and written feed-back on study procedures and materials via bi-monthlyconference calls, formal surveys, and informal communi-cations (e.g., emails, one-on-one meetings).Finally, all items were translated and back-translated
to/from Swahili by bilingual Tanzanian and Americanstudy staff. Discrepancies in translation were resolvedbased on the consensus of a committee comprised ofCREDI team members, local staff, and bilingual Tanzaniancommunity members.
Qualitative pilot phaseTo provide preliminary feedback on the initial set ofitems, we conducted a series of “cognitive” (qualitative)interviews in December of 2013 with 10 caregiver-childpairs in and around Ifakara, Tanzania (mean age of chil-dren = 28.2 months, range = 20–35 months). A local fe-male research scientist with a master’s degree in humandevelopment was recruited based on her previous ex-perience conducting qualitative research in the studycommunity. The interviewer conducted interviews one-on-one with caregivers in children’s homes using a semi-structured interview protocol designed to elaborate eachitem’s acceptability, clarity, and applicability, as well asthe comprehensiveness and redundancy of the scale as awhole [21, 22]. Specifically, the interviewer asked thecaregiver (all of whom happened to have been mothers)
McCoy et al. Population Health Metrics (2017) 15:3 Page 3 of 18

to respond to each item based on her child’s ability orbehavior. The interviewer then asked one or more in aseries of seven follow-up questions designed to elicit thecaregiver’s perceptions of the item, her thought processin responding to the item, and/or her suggestions forimproving the item. At the end of each interview, thecaregiver was also asked to give her general impressionsof what positive ECD means to her, the acceptability ofthe scale, and whether she had any suggestions for im-proving the scale. (For the full interview protocol, con-tact the first author.) The results of these interviewswere used to provide preliminary information regardingthe overall acceptability of the scale, as well as to identifyitems that required further adaptation or eliminationprior to larger-scale quantitative testing.
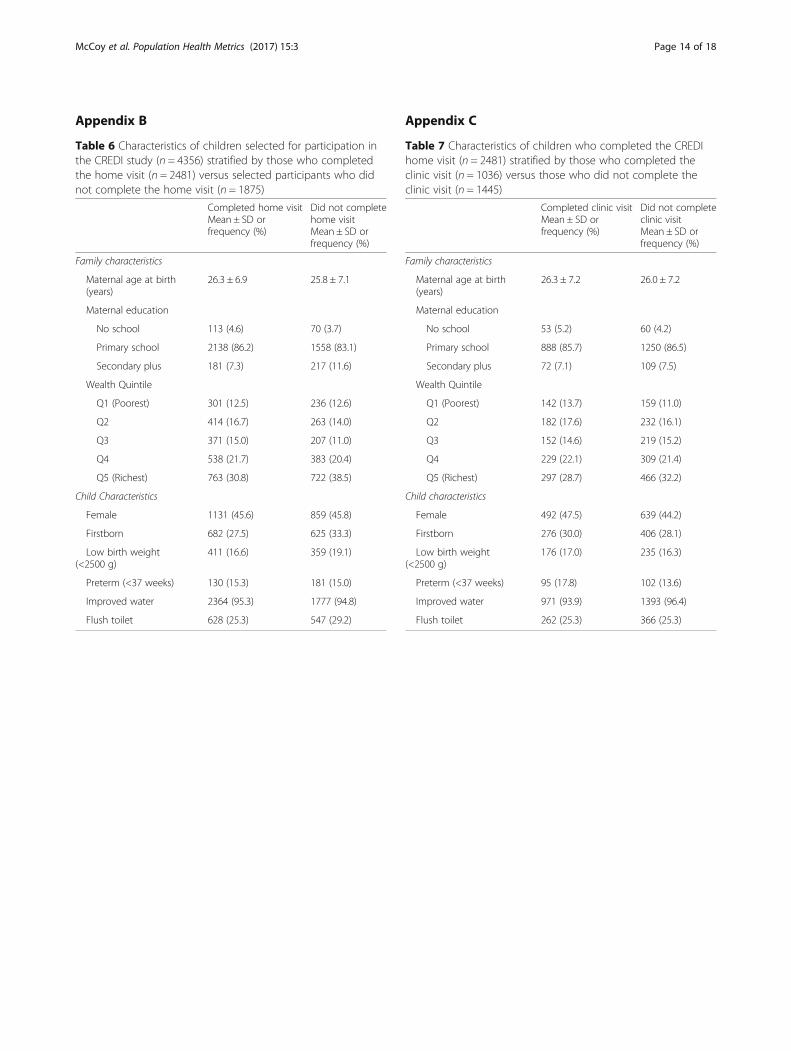
Quantitative pilot phaseFollowing the qualitative phase, we conducted a fullquantitative pilot from January to October of 2014 in2481 caregiver-child pairs, of which 2320 (93.5%) in-cluded mothers, 68 (2.7%) included fathers, and 93(3.8%) included other family members (e.g., grandpar-ents, aunts). Child-caregiver pairs who participated inthe qualitative pilot portion of the validation study wereexcluded from participation in the full quantitative pilotphase. Of the 4356 children randomly selected for a homevisit, 2481 (57.0%) completed the visit, 558 (12.8%) weretemporarily away, 1204 (27.6%) had permanently moved,60 (1.4%) had died, and 53 (1.2%) had caregivers who re-fused to participate. The characteristics of those who com-pleted the home visit versus those who were invited butdid not complete the home visit are shown in Table 6 inAppendix B and indicate relative similarity across thegroups. Each caregiver-child pair was visited in theirhome, invited and consented to participate, and inter-viewed using all items on the CREDI. Caregivers alsoreported on cognitive stimulation using six items fromUNICEF’s Multiple Indicator Cluster Survey ECD mod-ule capturing adult-child interactions [14] and chil-dren’s physical and mental disability using six itemsfrom the Ten Questions screener [23]. Stimulationitems reflected whether an adult household memberhad engaged the child in six different activities (e.g.,reading, counting, playing, singing) over the preceding3 days. Children were grouped into low (0–2 activities),moderate (3–4 activities), and high (5–6 activities)stimulation categories for analyses. Disability itemsreflected children’s difficulty with seeing, hearing, mov-ing, and learning. Children were considered to have adisability if their caregiver answered “yes” to any of thesix screening items.Home visits were completed by eight male, secondary
school-educated field workers with previous experienceconducting field-based research with families and
children in the local area. Field workers were selectedbased on their performance as data collectors in theoriginal vitamin A study and participated in a 2-daytraining on the CREDI and other study visit procedures.All workers were also monitored by the study coordinatorin the field on a bi-weekly basis to ensure continued ad-herence to study protocols. During the home visits, fieldworkers rated their perceptions of caregivers’ understand-ing of and honesty in responding to the CREDI items.They also recorded any questions or concerns stated bythe caregivers during the interview. At the end of the visit,field workers measured children’s height to the nearest0.1 cm. Children less than 24 months were measuredusing a Seca length board, whereas those 24 months orolder were measured using a portable Seca stadiometer.Field workers measured height twice in a row, and if thetwo values differed by more than 0.2 cm, they repeatedthe measurement a third time, taking an average of thetwo closest values. Table 1 shows descriptive statistics forthis sample.
Table 1 Descriptive characteristics of the quantitative pilotsample
N Mean/% SD Min Max
CREDIa
Total score (n = 44 items) 2481 0.64 0.17 0.07 0.98
Motor (n = 5 items) 2481 0.63 0.24 0.00 1.00
Cognitive (n = 19 items) 2481 0.64 0.29 0.00 1.00
Socioemotional (n = 20 items) 2481 0.64 0.15 0.10 1.00
Bayley Scales of Infant Development-III
BSID Cognitive 959 60.50 8.67 30 81
BSID Receptive Communication 950 25.78 7.00 5 42
BSID Expressive Communication 947 30.06 8.58 3 46
BSID Fine Motor 955 40.56 6.55 12 62
BSID Gross Motor 960 57.00 5.56 34 70
BSID BOI—Caregiver 1033 1.51 0.35 0 2
BSID BOI—Assessor 1033 1.56 0.25 0 2
Child and family characteristics
Child female 2481 45.6%
Child age (months) 2481 27.07 6.08 17.03 37.08
Child height-for-age z-score 2177 −1.82 1.28 −5.99 4.94
Child stunted (HAZ < −2) 2177 43.3%
Child any disability 2481 1.9%
Proportion of stimulationactivities conducted (out of 6)
2480 0.49 0.16 0.00 1.00
Maternal educ—No school 2481 4.6%
Maternal educ—Primary school 2481 86.2%
Maternal educ—Secondary school 2481 7.3%aCREDI mean scores represent proportion of correct responses on the scale orsub-scale. Scores calculated based on the final set of 44 items only
McCoy et al. Population Health Metrics (2017) 15:3 Page 4 of 18

Approximately 60% of caregiver-child pairs were se-lected by a computer-generated random number drawbefore their home visit to be invited to an additionalclinic visit, which occurred 1 to 6 days after the homevisit. Of the 1478 children randomly selected for a clinicvisit, 1037 (70.2%) completed the visit, 224 (15.2%)agreed to the visit but did not show up, 57 (3.9%) re-fused the visit, and the remainder (10.8%) were notscheduled due to logistical reasons (e.g., caregiver orchild was ill, no clinic appointments were available).The characteristics of home visit participants who com-pleted the clinic visit versus those who did not completethe clinic visit are shown in Table 7 in Appendix C andindicate relative similarity across the groups. Duringthe clinic visit, a female nurse with training in childdevelopment and research re-administered a subset of11 CREDI items (selected for their conceptual diver-sity) and conducted an adapted and translated versionof the Bayley Scales of Infant Development (BSID-III)[24] with the child, including all direct assessment sub-scales as well as the Behavior Observation Inventory(BOI). The BSID-III was chosen as the comparisonmetric for the present study due to its acceptance as a“gold standard” clinical assessment with strong reli-ability and validity, its complementary direct assessmentformat, and its previous use by our team in TanzanianECD research [25–27].Because the BSID-III was originally developed in the
United States, field and research staff completed a de-tailed adaptation process over a period of several weeksto improve its applicability within the Tanzanian context.Details of the training, adaptation, and psychometricproperties of the BSID-III can be found in Sudfeld et al.[28]. Briefly, six nurses were trained to administer theBSID-III by two American PhD-level psychologists overa 3-week period, after which four nurses were selectedas study staff based on quantitative ratings of their per-formance and knowledge. Study nurses were each moni-tored by the local study coordinator on a biweekly basisto ensure quality and to avoid assessor drift. To enhancecultural applicability, unfamiliar images and terminologywithin 13% of BSID-III items (n = 30) were replacedusing more culturally relevant stimuli (e.g., changing apicture of an apple to a banana) based on local expertconsensus. To maintain functional equivalence, replace-ment stimuli were selected to be of similar size, style,and complexity to original stimuli. Raw scores were usedfor analyses due to lack of Tanzania-specific age-norms.At the end of the clinic visit, nurses recorded mothers’questions and any problems that may have precludedfull completion of the visit (e.g., child was sick oruncooperative).Data from the quantitative pilot phase were used at the
item level to understand individual items’ distributional
properties, including pass/fail rates and levels of non-response (i.e., “don’t know” answers). Test-retest reliabilitywas assessed for the 11 CREDI items tested in both thehome and clinic visit. Additional tests of reliability andvalidity were performed for items that were identifiedto have sufficient variability (i.e., that did not show evi-dence for floor or ceiling effects). Specifically, internalconsistency was captured within each of the threeCREDI domains/subscales using Cronbach’s alpha. Dis-criminant validity was assessed by comparing CREDItotal and subscale scores across a set of child and familycharacteristics, including child age, gender, stunting status(height-for-age z-score of <2SDs below the WHO stand-ard) [29], caregiver-reported disability, caregiver-reportedcognitive stimulation in the home, and maternal education(which was collected at children’s births as part of the ori-ginal vitamin A study). Finally, concurrent validity wasassessed by correlating each CREDI subscale score withthe corresponding BSID-III raw score. Psychological fieldstandards (e.g., Cicchetti, [30]) were used as the basis fordetermining acceptability of the items’ and subscales’ reli-ability and validity.
Field staff interviewsAt the end of the quantitative pilot phase, 10 qualitative“exit” interviews were conducted with field staff (includ-ing six field workers, three nurses, and one field super-visor) to identify areas of confusion, difficulty, or lack ofclarity in the CREDI based on their experiences over9 months of data collection.
ResultsItem development & qualitative interviewsReview of the literature and consultation with ECD expertsresulted in the identification of three primary domains—-motor, cognitive/language, and socioemotional skills—and12 constructs or subdomains for inclusion in the CREDI(see Table 2). Based on a review of existing ECD measure-ment tools (see Table 5 in Appendix A) and the process ofidentifying conceptual gaps, an initial set of items was de-veloped by the core research team. Whereas many of these
Table 2 Domains and constructs of the CREDI
DOMAINS Motor Cognitive Socioemotional
CONSTRUCTS 1) Fine2) Gross
1) Expressivelanguage
2) Receptivelanguage
3) Preacademicskills/knowledge
4) Reasoning &problem solving
1) Early executive function& effortful control
2) Emotion regulation3) Externalizing symptoms4) Internalizing symptoms5) Reactivity & soothability6) Social competence
McCoy et al. Population Health Metrics (2017) 15:3 Page 5 of 18

items were highly similar to questions from existing ECDassessments, a substantial number—particularly from thesocioemotional domain, where the largest conceptual gapswere identified—were completely novel. Following around of revisions to the items by the ECD expert team, atotal of 92 items were submitted for initial qualitative pilottesting. Following qualitative interviews, 22 items (n = 7from motor, n = 8 from cognitive, and n = 7 from socioe-motional) were dropped from the CREDI for the followingreasons: the item was too easy/hard for children of thisage group (n = 10), the item was redundant with anotheritem (n = 8), the item was confusing and could not be easilyclarified (n = 3), and the item was culturally inappropriateand could not be easily adapted (n = 1). Of the remaining70 items, 15 (n = 1 for motor, n = 7 for cognitive, and n = 7for socioemotional) were adapted prior to the quantitativepilot based on suggestions from cognitive interview partici-pants and additional consultation with local experts. Theseadaptations primarily involved the addition of examples toimprove item clarity, such as changing “Does the childknow any numbers?” to “Does the child know any numbers(e.g., one, two, three)?” In several instances, words relatingto culturally specific objects (e.g., toys) were removed orreplaced.
AcceptabilityCognitive interviews revealed that 10/10 caregiverswere cooperative with and felt pleased by the items,and 9/10 felt that “there were no right or wrong an-swers.” (One mother of a 20-month-old child reported,“I was uncomfortable when you asked me things whichmy child cannot do, as she is too young.”) Fieldworkers’ average ratings of whether the caregiversunderstood the questions during the quantitative pilotwas 3.85 (SD = 0.28) and whether they appeared to an-swer truthfully was 3.77 (SD = 0.36) on a scale of 1 (No,not at all) to 4 (Yes, all questions). In addition, exit in-terviews of field staff identified no problems with items’demand characteristics, with the exception of a socioe-motional item capturing whether the child “gets alongwell with other children most of the time” that was re-ported by five of the 11 field workers as eliciting problemswith social desirability.
Item analysisResults of item analyses to understand the completeness,distribution, and relative difficulty of each item asmeasured during the quantitative pilot home visit canbe found in Table 8 in Appendix D. Results revealedthat 25 of the 70 items (n = 10 for motor, n = 8 forcognitive, n = 7 for socioemotional) showed evidenceof ceiling effects, with pass rates of >95%. In general,
these items tended to represent more basic develop-mental skills that may be more appropriate for children<18 months (e.g., walking, achieving object permanence,saying one word, showing affection). These items wereremoved from the final subscales used for reliabilityand validity analyses. Figure 1 summarizes the item se-lection process. Figures 2, 3 and 4 show score distribu-tions by age.“Don’t know” responses were infrequent across the
CREDI, with an average of 1.8% of the sample respond-ing “don’t know” for any given item during the homevisit. In comparison, among 1037 BSID-III assessments,9.9% were incomplete and an additional 10.1% wereflagged by nurses as challenging or unreliable due tochildren’s illness, injury, uncooperativeness, or distrac-tion. Of the items that were most frequently answered as“don’t know,” the majority were also acknowledged asunclear in the qualitative interviews due translation diffi-culties (e.g., inability to find an equivalent word or set ofwords for “distracted” in Swahili) or lack of a concretebehavioral marker (e.g., ambiguity of what it means toshow sympathy or concern).
ReliabilityA total of 26 items were excluded from the original70-item set due to ceiling effects (n = 25) and the lackof conceptual fit with a specific developmental domain
Fig. 1 Item selection tree
McCoy et al. Population Health Metrics (2017) 15:3 Page 6 of 18

(n = 1, “too sick to play”). Cronbach’s alpha coefficientscalculated in the final set of 44 items suggested ac-ceptable internal consistency/inter-item reliability formotor (α = .68), cognitive (α = .90), and socioemotional(α = .68) items. Kappa coefficients were used to cap-ture the reliability of responses from the same care-giver to 11 items administered at both the home andclinic visits (see Table 3). It should be highlighted thatthe Kappa statistic was originally developed as a meas-ure of inter-rater reliability, where two raters directlyobserve or assess the same individual at the sametime. In the case of the present study, our Kappas cap-ture both test-retest reliability (with an average timebetween study visits of 3.17 days [SD = 2.11]) andinter-rater reliability (between male home visitors andfemale clinic nurses). Given this, they represent bothtrue variation in children’s skills over time, as well asmultiple potential sources of measurement error. Assuch, we might expect our Kappas to be lower thanthose used simply to capture inter-rater reliability. In-deed, results indicate differential reliability, with twoitems showing moderate reliability (Kappa ≥ 0.40), sixitems showing fair reliability (Kappa ≥ 0.20), 2 itemsshowing slight reliability (Kappa ≥ 0.00), and one itemshowing poor reliability (Kappa < 0.00). Additionalanalyses revealed no consistent evidence for system-atic differences in mean scores across home and clinicvisits (see Table 3) or for substantial differences inKappa values based on the time delay between the
home and clinic visit (contact first author for detailedresults).
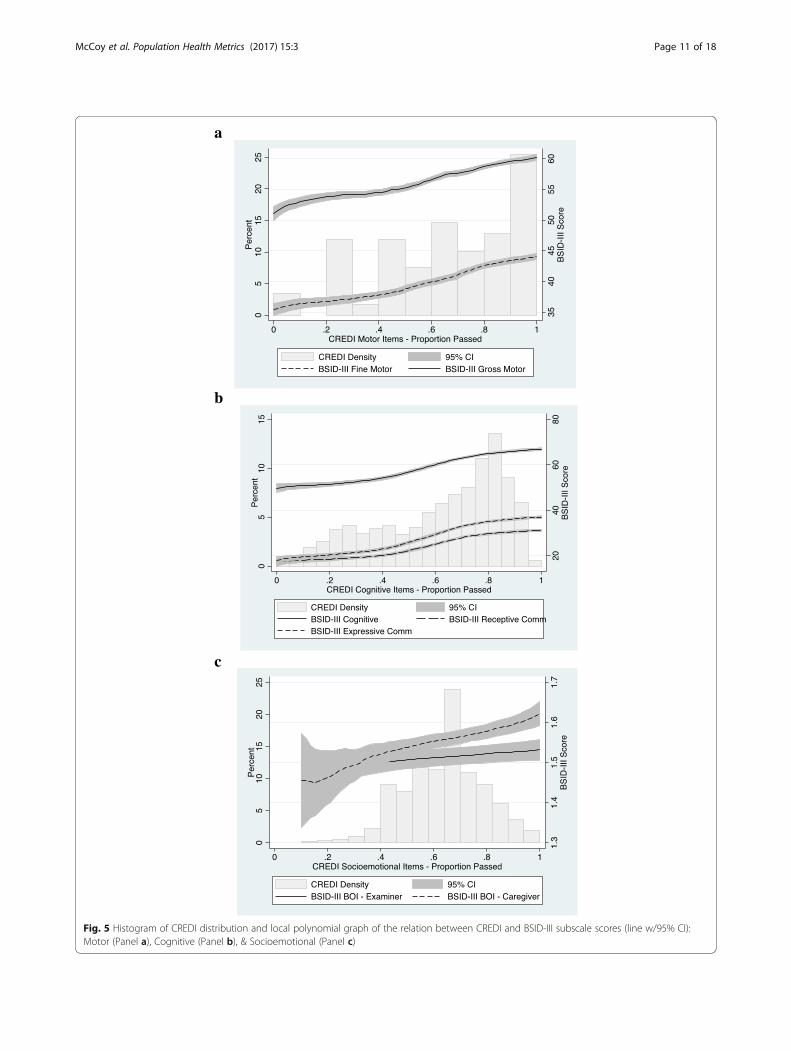
ValidityTable 4 shows the results of tests of discriminant validityfor CREDI scores based on child and family character-istics. These results show significantly higher totalCREDI scores for children who were older, non-stunted, non-disabled, and from high-stimulationhouseholds at the time of data collection. Effect sizesfor these differences ranged from small (d ≈ 0.20SD)for stunting, to large (d > 0.50SD) for age, disability,and stimulation. No significant (p < .05) differenceswere observed for CREDI scores across gender or ma-ternal education with the exception of socioemotionalscores, which were highest for children of non-educatedmothers (d ≈ 0.20SD).Figure 5 shows the correlations between the CREDI
and BSID-III subscales. Linear bivariate correlations be-tween the CREDI motor items and the BSID-III fine andgross motor subscales were r = .50 and r = .51, respect-ively. Correlations between the CREDI cognitive itemsand the BSID-III cognitive, receptive communication,and expressive communication subscales were r = .68,r = .69, and r = .73, respectively. All of these correla-tions were significant at the p < .001 level. Correlationsbetween the CREDI socioemotional items and the BSID-IIIBOI were much smaller, at r = .16 (p < .001) for the
Fig. 2 Proportion children passing each motor item, by age (n = 2481)
McCoy et al. Population Health Metrics (2017) 15:3 Page 7 of 18

caregiver-reported BOI and r = .09 (p < .01) for theexaminer-reported BOI.
DiscussionThe primary aim of the present study was to describeinitial evidence for the acceptability, reliability, and valid-ity of the newly developed CREDI as a measure of ECDdesigned for feasible use within standard householdsurveys in low-resourced settings. Results of our initialvalidation effort in Tanzania suggest that the CREDItool may provide a valid method for capturing youngchildren’s development across motor, cognitive, andsocioemotional domains. In particular, the CREDI wasable to clearly discriminate between the skills of youn-ger versus older children, children with adequate versuslow nutritional status, disabled versus non-disabledchildren, and children from more versus less cogni-tively stimulating households, while showing evidencefor equality across gender and maternal educationwithin a large quantitative sample. Collectively, theitems also showed adequate criterion validity with the
BSID-III motor, cognitive, and communication sub-scales, which are “gold standard” direct assessments ofchildren’s early developmental status often used in clin-ical settings by highly trained staff.In addition to showing positive evidence for validity,
the CREDI was found to be an acceptable tool for usein low-resourced settings. It was well understood byrespondents and quick to implement (taking an aver-age of 20 min to administer in total) by trained fieldstaff with the equivalent of a secondary education.Furthermore, initial findings suggest that the caregiverreport format may be advantageous for use with youngchildren in low-resourced settings in order to avoidproblems with non-compliance (e.g., due to unfamili-arity with testing situations, fear of unfamiliar adults,child illness, etc.) that were found to affect the qualityand completeness of nearly 20% of BSID-III directassessments.Although the CREDI as a whole shows promise as an
acceptable and valid measurement tool, test-retest reliabil-ity was low for many individual items, and particularly
Fig. 3 Proportion children passing each cognitive item, by age (n = 2481)
McCoy et al. Population Health Metrics (2017) 15:3 Page 8 of 18

Table 3 Test-retest reliability of 11 select items across data collection contexts with same caregiver reporter (n = 962)
Mean score Differencein means
% Agreement Kappa
Home interview Clinic interview
Does the child walk several steps without the support of aperson or object (e.g., wall or furniture)?
0.99 0.99 0.00 99.3% .663
Does the child know the names of at least two body parts(e.g., arm, eye, or nose)?
0.67 0.65 0.02 80.4% 0.563
Does the child say five or more words (e.g., names like Mamaor objects like cup)?
0.91 0.93 −0.02 90.4% 0.335
When asked what common objects (like a cup or a knife) are for,does the child explain correctly?
0.34 0.20 0.14 74.4% 0.363
Does the ever child kick, bite, or hit other children or adults?a 0.45 0.31 0.14 68.0% 0.333
Does the child pick up a small object like a rock with just his/herthumb and a finger?
0.78 0.84 −0.06 78.0% 0.276
Does the child get along well with other children most of the time? 0.92 0.97 −0.05 92.2% 0.241
When the child is upset, is he/she able to calm down by him/herself? 0.45 0.59 −0.14 60.0% 0.213
Does the child pay attention when someone is talking to him/her? 0.90 0.95 −0.05 87.8% 0.156
Does the child follow simple directions (e.g., “Stand up or Come here”)? 0.98 0.99 −0.01 97.7% 0.144
Is the child sometimes impatient or unwilling to wait or hold still whenyou ask him/her to?a
0.38 0.48 −0.10 49.4% −0.020
Average 0.71 0.72 −0.01 79.8% 0.297
CREDI mean scores represent proportion of correct responses on the itemaIndicates item that was reverse coded
Fig. 4 Proportion children passing each socioemotional item, by age (n = 2481)
McCoy et al. Population Health Metrics (2017) 15:3 Page 9 of 18

for those that qualitative interview respondents notedwere difficult to translate or lacking in examples, bench-marks, or behavioral markers. Given that no systematicdifferences were found based on the interviewer, setting,or time between visits, these results suggest that furtheradaptation is needed to make items as concrete as possibleand reduce respondent “guessing.” Additional reliabilitytesting, qualitative work, and empirical analysis (e.g.,
item response theory) are also warranted in futurework to ensure that items’ interpretation is occurringsimilarly across time, context, respondent, andassessor.In addition, these results revealed a relatively weak
correspondence between the socioemotional items andthe BSID-III BOI. This low correlation was not particularlysurprising given that 1) the BOI was not designed as a
Table 4 CREDI mean scores (SE) by subgroup (n = 2481)
Total Motor Cognitive Socioemotional
Child age
18–24 moa (n = 934) 0.50 (0.005) 0.45 (0.008) 0.44 (0.007) 0.57 (0.005)
> 24–30 mob (n = 614) 0.67 (0.005) 0.67 (0.010) 0.69 (0.008) 0.65 (0.005)
> 30–36 moc (n = 933) 0.76 (0.004) 0.82 (0.007) 0.79 (0.005) 0.71 (0.004)
dif F(2, 2478) = 965.00**a < b: d = 1.00**b < c: d = 0.51**a < c: d = 1.51**
F(2, 2478) = 560.63**a < b: d = 0.78**b < c: d = 0.50**a < c: d = 1.28**
F(2, 2478) = 860.93**a < b: d = 1.03**b < c: d = 0.41**a < c: d = 1.44**
F(2, 2478) = 234.26**a < b: d = 0.52**b < c: d = 0.39**a < c: d = 0.92**
Child gender
Male (n = 1349) 0.64 (0.005) 0.64 (0.008) 0.63 (0.007) 0.64 (0.004)
Female (n = 1132) 0.64 (0.005) 0.64 (0.009) 0.64 (0.007) 0.64 (0.004)
dif t(2479) = −0.70d = 0.03
t(2479) = 0.08d = −0.00
t(2479) = −1.34d = 0.06
t(2479) = 0.31d = −0.01
Child stunting
Non-stunted (n = 1222) 0.66 (0.005) 0.66 (0.008) 0.66 (0.007) 0.65 (0.004)
Stunted (n = 955) 0.62 (0.006) 0.62 (0.010) 0.60 (0.008) 0.65 (0.005)
dif t(2175) = 4.79**d = −0.19**
t(2175) = 3.46**d = −0.13**
t(2175) = 6.09**d = −0.25**
t(2175) = 0.86d = −0.04
Child disability
No disability (n = 2434) 0.64 (0.003) 0.65 (0.006) 0.64 (0.005) 0.64 (0.003)
Any disability (n = 47) 0.53 (0.032) 0.45 (0.050) 0.48 (0.047) 0.60 (0.025)
dif t(2479) = 4.43**d = −0.65**
t(2479) = 4.73**d = −0.69**
t(2479) = 4.45**d = −0.65**
t(2479) = 1.81+d = −0.27+
Stimulation
Low stimulationa (n = 847) 0.63 (0.005) 0.62 (0.10) 0.63 (0.008) 0.64 (0.005)
Mod stimulationb (n = 1498) 0.63 (0.005) 0.65 (0.08) 0.62 (0.006) 0.64 (0.004)
High stimulationc (n = 135) 0.75 (0.011) 0.77 (0.021) 0.81 (0.014) 0.68 (0.014)
dif F(2, 2477) = 29.57**a < b: d = 0.02b < c: d = 0.67**a < c: d = 0.68**
F(2, 2477) = 17.41**a < b: d = 0.09+b < c: d = 0.45**a < c: d = 0.54**
F(2, 2477) = 41.00**a < b: d = −0.02b < c: d = 0.80**a < c: d = 0.77**
F(2, 2477) = 3.65*a < b: d = 0.03b < c: d = 0.22*a < c: d = 0.25*
Maternal education
No educationa (n = 113) 0.63 (0.016) 0.61 (0.029) 0.61 (0.022) 0.67 (0.015)
Primary schoolb (n = 2138) 0.64 (0.004) 0.65 (0.026) 0.64 (0.005) 0.65 (0.003)
Secondary schoolc (n = 181) 0.61 (0.013) 0.63 (0.022) 0.61 (0.019) 0.62 (0.012)
dif F(2, 2429) = 2.63+a < b: d = 0.14b < c: d = −0.18+a < c: d = −0.04
F(2, 2429) = 1.36a < b: d = 0.20b < c: d = −0.08a < c: d = 0.12
F(2, 2429) = 2.29+a < b: d = 0.19b < c: d = −0.14a < c: d = 0.05
F(2, 2429) = 4.36**a < b: d = −0.04b < c: d = −0.19*a < c: d = −0.24*
**p < .01, *p < .05, +p < .10; CREDI mean scores represent proportion of correct responses on the scale or sub-scale; d indicates effect size of standardized meandifferences as represented by Cohen’s d
McCoy et al. Population Health Metrics (2017) 15:3 Page 10 of 18
a
b
c
Fig. 5 Histogram of CREDI distribution and local polynomial graph of the relation between CREDI and BSID-III subscale scores (line w/95% CI):Motor (Panel a), Cognitive (Panel b), & Socioemotional (Panel c)
McCoy et al. Population Health Metrics (2017) 15:3 Page 11 of 18

measure of socioemotional functioning, per se, and 2)our aim in developing the socioemotional items was tocapture a large breadth of important but potentiallynon-overlapping developmental constructs. Our reviewof the literature and consultation with ECD expertsrevealed that the vast majority of previous measure-ment tools (like the BSID-III) have focused on youngchildren’s motor and cognitive development, with farfewer options for capturing social, emotional, andhigher-order cognitive processes like self-regulationand executive function that are increasingly beingshown by the literature to predict later life outcomes[10, 12, 31–33]. Given that our socioemotional itemsshowed adequate reliability and validity in other ways (e.g.,internal consistency, discrimination by age, caregiver-reported stimulation, etc.), we are confident that theirinclusion represents an important advance over previ-ous work in this age group. At the same time, we ac-knowledge the need for further validation againstalternative socioemotional measurement approaches(e.g., the Ages and Stages personal-social and socio-emotional scales, observer ratings of child behaviorduring assessment) and clinical diagnoses, as well asexaminations of predictive validity over time in diversesettings, particularly given a lack of understanding ofthese early skills cross-culturally. Additional researchis also needed to explore the somewhat counterintui-tive finding that less educated caregivers report thehighest levels of socioemotional development for theirchildren.Despite the strengths of this study, the research pre-
sented also has several important limitations that mustbe addressed through future work. First, and most im-portantly, our focus on a single geographic contextsubstantially limits the generalizability of these results.Second, the number of qualitative interviews con-ducted in this study was quite small, and focused onlyon mothers. Third, as is noted previously, our lack ofa “gold standard” metric against which to compare oursocioemotional items limits our understanding of theirconcurrent validity. Fourth, our additional measures ofcontext and disability were limited and coarse, andmay not have been suitable for fully describing therisks and challenges faced by children. Finally, thecross-sectional nature of our data collection effortprecludes our ability to draw conclusions about theCREDI’s long-term predictive validity. To addressthese limitations, we plan to continue validation of theCREDI using 1) a large number of geographically, lin-guistically, and culturally diverse contexts, 2) differenttypes of caregivers, 3) a wider range of locally-generatedcomparison and diagnostic metrics, and 4) longitudinaldata. In particular, additional qualitative and quantita-tive work is currently underway in multiple countries
to improve the clarity and objectivity of items in anattempt to improve test-retest reliability. Based uponthe results of these ongoing and future efforts, wehope to finalize and disseminate the CREDI as anopen-source tool for governments, agencies, and organiza-tions to quantify developmental status at a populationlevel and track progress in alleviating ECD-related dispar-ities around the world.
ConclusionsGiven growing justification for and investment in thepromotion of positive development in the first 1000 daysof life, providing a tool for quantifying and monitoringearly developmental outcomes—particularly for the 89%of children under five globally who live in low- andmiddle-income country contexts—is critically important[34]. Designed as a comprehensive, caregiver-reportedassessment of ECD for children under three, the aimof the CREDI is to provide low-cost, large-scale datathat will facilitate decision making regarding inter-vention and resource allocation, and track global pro-gress in alleviating early developmental disparities.The results of the present study suggest that overall,the CREDI worked well for capturing ECD behaviorsand skills in 18- to 36-month-old children withinTanzania. Additional research in diverse linguisticand cultural contexts and younger age groups isneeded to ensure the CREDI’s utility prior to fulldissemination.
Endnotes1Although not representative of the core ECD do-
mains, one item—whether the child was frequentlytoo sick to play—was borrowed from the MICS ECDIand included alongside the motor items to test itsutility in the <3 age group. This health item wastested in the qualitative and quantitative pilots butnot included in reliability or validity analyses of thetotal CREDI scale.
2In several cases, items appropriate for youngerages (down to 12 months) were included to assesstheir suitability for older children living in an under-studied, at-risk sample.
3In the case of items of child behavior traditionallymeasured using Likert response scales (e.g., never/sometimes/often/always), we integrated “frequency an-chors” into the questions themselves to indicate theprevalence of behavior necessary to achieve a “yes”versus a “no” response (e.g., “Does the child get alongwell with other children most of the time?”). These fre-quency anchors were selected to discriminate betweenadaptive vs. non-adaptive behavior for each item.
McCoy et al. Population Health Metrics (2017) 15:3 Page 12 of 18

Appendix A
Table 5 List of measurement tools consulted in preparing the CREDI items
Name Citation
Developed in high-income countries
Ages & Stages Questionnaire Bricker, Diane D., Jane Squires, and Linda Mounts. Ages & stages questionnaires: A parent-completed, child-monitoring system. Baltimore (MD): Paul H. Brookes, 1999.
Bayley Scales of Infant and ToddlerDevelopment—III
Bayley, Nancy. Bayley Scales of Infant and Toddler Development: Bayley-III. Harcourt Assessment,Psych. Corporation, 2006.
Behavior Rating Inventory of Executive Function Gioia, G. A., Isquith, P. K., Guy, S. C., & Kenworthy, L. (2000). Test review Behavior RatingInventory of Executive Function. Child Neuropsychology, 6(3), 235–238.
Child Behavior Checklist Achenbach, Thomas M., and C. Edelbrock. Child Behavior Checklist. Burlington (Vt) 7 (1991).
Minnesota Child Development Inventory Ireton, Harry, and Edward Thwing. Minnesota Child Development Inventory. Minneapolis: BehaviorScience Systems, 1974.
Denver Developmental Screening Test Frankenburg, William K., and Josiah B. Dodds. The Denver developmental screening test.The Journal of Pediatrics 71.2 (1967): 181–191.
Early Childhood Longitudinal Study—BirthCohort, 9 and 24mo parent report
Andreassen, Carol, and Philip Fletcher. “Early Childhood Longitudinal Study, Birth Cohort(ECLS-B): Psychometric Report for the 2-Year Data Collection. Methodology Report.NCES 2007-084.” National Center for Education Statistics (2007).
Home Observation for Measurement of theEnvironment (HOME)
Caldwell, Bettye M., and Robert H. Bradley. Home Observation for Measurement of theEnvironment. Little Rock: University of Arkansas at Little Rock, 1984.
Infant Behavior Questionnaire Gartstein, Maria A., and Mary K. Rothbart. “Studying infant temperament via the revised InfantBehavior Questionnaire.” Infant Behavior and Development 26.1 (2003): 64–86.
Kaufman Assessment Battery for Children Kaufman, Alan S. K-ABC: Kaufman Assessment Battery for Children: Interpretive manual.Circle Pines, MN: American Guidance Service, 1983.
MacArthur-Bates Communicative DevelopmentInventory
Fenson, Larry, et al. MacArthur-Bates Communicative Development Inventories. 2007.
Parents’ Evaluation of Developmental Status Glascoe, Frances Page. Collaborating with parents: Using Parents’ Evaluation of DevelopmentalStatus to detect and address developmental and behavioral problems. Ellsworth & VandermeerPress, 1998.
Leiter International Performance Scale Roid, G., & Miller, L. (1997). Leiter International Performance Scale—Revised. Wood Dale,IL: Stoelting
Strengths & Difficulties Questionnaire Goodman, Robert. “The Strengths and Difficulties Questionnaire: A research note.” Journal ofChild Psychology and Psychiatry 38.5 (1997): 581–586.
Vineland Adaptive Behavior Questionnaire Sparrow, Sara S., David A. Balla, and Domenic V. Cicchetti. Vineland Adaptive Behavior Scales:Interview edition, survey form manual. Circle Pines, MN: American Guidance Service, 1984.
Developed in low- and middle-income countries
Kilifi Developmental Inventory Abubakar, A., et al. “Monitoring psychomotor development in a resource limited setting: anevaluation of the Kilifi Developmental Inventory.” Annals of Tropical Paediatrics: InternationalChild Health 28.3 (2008): 217–226.
Malawi Developmental Assessment Tool Gladstone, Melissa, et al. “The Malawi Developmental Assessment Tool (MDAT): the creation,validation, and reliability of a tool to assess child development in rural African settings.” PLoSmedicine 7.5 (2010): e1000273.
Early Childhood Development Index UNICEF. Multiple Indicator Cluster Surveys (MICS), 2009–2012.
Rapid Neurodevelopmental AssessmentInstrument
Khan, Naila Zaman, et al. “Validation of Rapid Neurodevelopmental Assessment Instrumentfor under-two-year-old children in Bangladesh.” Pediatrics 125.4 (2010): e755–e762.Khan, Naila Z., et al. “Validation of Rapid Neurodevelopmental Assessment for 2-to 5-year-oldchildren in Bangladesh.” Pediatrics 131.2 (2013): e486–e494.
World Health Organization Gross MotorMilestones
Onis, Mercedes. “WHO Motor Development Study: Windows of achievement for six grossmotor development milestones.” Acta Paediatrica 95.S450 (2006): 86–95.
McCoy et al. Population Health Metrics (2017) 15:3 Page 13 of 18
Appendix B Appendix C
Table 6 Characteristics of children selected for participation inthe CREDI study (n = 4356) stratified by those who completedthe home visit (n = 2481) versus selected participants who didnot complete the home visit (n = 1875)
Completed home visitMean ± SD orfrequency (%)
Did not completehome visitMean ± SD orfrequency (%)
Family characteristics
Maternal age at birth(years)
26.3 ± 6.9 25.8 ± 7.1
Maternal education
No school 113 (4.6) 70 (3.7)
Primary school 2138 (86.2) 1558 (83.1)
Secondary plus 181 (7.3) 217 (11.6)
Wealth Quintile
Q1 (Poorest) 301 (12.5) 236 (12.6)
Q2 414 (16.7) 263 (14.0)
Q3 371 (15.0) 207 (11.0)
Q4 538 (21.7) 383 (20.4)
Q5 (Richest) 763 (30.8) 722 (38.5)
Child Characteristics
Female 1131 (45.6) 859 (45.8)
Firstborn 682 (27.5) 625 (33.3)
Low birth weight(<2500 g)
411 (16.6) 359 (19.1)
Preterm (<37 weeks) 130 (15.3) 181 (15.0)
Improved water 2364 (95.3) 1777 (94.8)
Flush toilet 628 (25.3) 547 (29.2)
Table 7 Characteristics of children who completed the CREDIhome visit (n = 2481) stratified by those who completed theclinic visit (n = 1036) versus those who did not complete theclinic visit (n = 1445)
Completed clinic visitMean ± SD orfrequency (%)
Did not completeclinic visitMean ± SD orfrequency (%)
Family characteristics
Maternal age at birth(years)
26.3 ± 7.2 26.0 ± 7.2
Maternal education
No school 53 (5.2) 60 (4.2)
Primary school 888 (85.7) 1250 (86.5)
Secondary plus 72 (7.1) 109 (7.5)
Wealth Quintile
Q1 (Poorest) 142 (13.7) 159 (11.0)
Q2 182 (17.6) 232 (16.1)
Q3 152 (14.6) 219 (15.2)
Q4 229 (22.1) 309 (21.4)
Q5 (Richest) 297 (28.7) 466 (32.2)
Child characteristics
Female 492 (47.5) 639 (44.2)
Firstborn 276 (30.0) 406 (28.1)
Low birth weight(<2500 g)
176 (17.0) 235 (16.3)
Preterm (<37 weeks) 95 (17.8) 102 (13.6)
Improved water 971 (93.9) 1393 (96.4)
Flush toilet 262 (25.3) 366 (25.3)
McCoy et al. Population Health Metrics (2017) 15:3 Page 14 of 18

Appendix D
Table 8 Item-level summary of pass rates and missing data
Motor items % Don’t know Proportion passing
Is the child frequently too sick to play? b 0.04% 0.88
Does the child drink from a cup (without a lid) on his/her own? 0.00% 1.00
Does the child pick up and drop a small object (like a rock) into a bucket or bowl? 0.08% 1.00
Does the child throw a small ball or rock in a forward direction? 0.12% 0.99
Does the child walk several steps without the support of a person or object (e.g., wall or furniture)? 0.00% 0.99
Does the child bend down to the ground and stand up again without falling? 0.20% 0.99
Does the child climb onto an object such as a chair or stoop? 0.00% 0.99
Does the child run more than a few steps without falling or bumping into objects? 0.04% 0.98
Does the child kick a ball or other round object forward? 0.89% 0.96
Does the child make a mark on paper with a pen or pencil, or in the dirt with a stick? 0.93% 0.96
Does the child stack three or more small objects (e.g., blocks, cups, bottle caps) on top of each other? 5.48% 0.95aDoes the child walk backward? 6.53% 0.94aDoes the child pick up a small object like a rock with just his/her thumb and a finger? 10.72% 0.81aDoes the child jump with both feet leaving the ground? 8.14% 0.63aDoes the child stand on one foot for several seconds without the support of a person or object? 26.40% 0.50aDoes the child dress him/herself (e.g., put on his/her pants and shirt without help)? 0.16% 0.34
Cognitive items
Does the child recognize you or other family members (e.g., smile when they enter a room or movetoward them)?
0.00% 1.00
Does the child point or make sounds when he/she wants something? 0.00% 1.00
Does the child follow simple directions (e.g., “Stand up or Come here”)? 0.00% 0.99
Does the child look for an object when it falls on the ground or is taken away? 0.52% 0.99
Does the child say one or more words (e.g., names like Mama or objects like cup)? 0.04% 0.99
Does the child answer simple questions (e.g., “Do you want this?”) by saying yes or no, or noddinghis/her head?
0.12% 0.97
Does the child play by pretending objects are something else? 0.08% 0.97
Does the child pay attention when someone is talking to him/her? 0.12% 0.96aDoes the child say five or more words (e.g., names like Mama or objects like cup)? 0.00% 0.93aDoes the child follow complex directions with more than one step (e.g., “Stand up, go outside, andbring me…”)?
0.04% 0.93
aDoes the child turn a spoon or bottle right side up if you give it to him/her upside down? 1.05% 0.90aDoes the child explore new objects (like clothes or toys) by picking them up or putting them inhis/her mouth?
0.28% 0.90
aDoes the child ask for something (e.g., food, water) by name when he/she wants it? 0.04% 0.82aDoes the child speak using short sentences of two words (e.g., “Mama go” or “Dog eat”)? 0.12% 0.81aDoes the child say ten or more words (e.g., names like Mama or objects like cup)? 0.12% 0.78aCan the child correctly say the names of at least two family members (e.g., Mama, name for brother/sister)? 0.04% 0.77aDoes the child know the names of at least two body parts (e.g., arm, eye, or nose)? 2.58% 0.68aDoes the child ask questions using the words what, which, where, and who? 0.60% 0.66aDoes the child sing songs or repeat rhymes from memory? 4.19% 0.66aDoes the child know any numbers (e.g., one, two, three)? 0.60% 0.63aaDoes the child speak using longer sentences of more than 3 or 4 words? 0.08% 0.58aDoes the child correctly use the words I, you, or he? 0.81% 0.57aDoes the child know the difference between the words “big” and “small”? 3.26% 0.42
McCoy et al. Population Health Metrics (2017) 15:3 Page 15 of 18

AbbreviationsBOI: Behavior Observation Inventory; BSID-III: Bayley Scales of Infant Development(III); ECD: Early Childhood Development; CREDI: Caregiver-Reported EarlyDevelopment Index
AcknowledgmentsThe authors would also like to express gratitude to the field staff and studyparticipants who made this research possible.
FundingThe authors would like to acknowledge the funding and support provided by theSaving Brains Program from Grand Challenges Canada (Grant Number 0073–03).
Availability of data and materialsThe datasets generated and analyzed during the current study are notpublicly available due to their ongoing analysis but are available from thecorresponding author on reasonable request.
Table 8 Item-level summary of pass rates and missing data (Continued)aDoes the child get distracted easily? b 9.27% 0.35aDoes the child talk about or explain things that have happened in the past (e.g., what the child didyesterday)?
0.89% 0.25
aWhen asked what common objects (like a cup or a knife) are for, does the child explain correctly? 2.30% 0.24aDoes the child know the names of any letters (e.g., A, B, C)? 1.13% 0.07
Socioemotional items
Does the child smile when others smile at him/her? 0.00% 1.00
Does the child sit or play quietly on his/her own for at least several minutes? 0.00% 0.99
Does the child ask you for help when he/she cannot do something on his/her own (e.g., to reach anobject up high)?
0.00% 0.98
Does the child get along well with other children most of the time? 0.04% 0.98
Does the child share things (e.g., food, toys) with others? 0.04% 0.98
Does the child show affection toward others (e.g., hugging parents, brothers, or sisters)? 0.08% 0.98
Does the child wake up frequently at night? b 0.12% 0.96aIs the child frequently sad or upset? b 0.00% 0.95aDoes the child have trouble falling asleep on his/her own? b 0.00% 0.94aDoes the child stop immediately when told “no” or “stop that?” 0.08% 0.92aIs the child frequently irritable or fussy? b 0.24% 0.86aDoes the child show sympathy or look concerned when others are hurt or sad? 3.59% 0.85aDoes the child act differently (e.g., shy or afraid) with strangers than he/she does with you and otherfamiliar people?
0.24% 0.85
aIs the child able to focus on one task (e.g., playing with friends, eating meal) for more than a few minutes,ignoring other things around him/her?
0.20% 0.82
aDoes the child follow rules and obey adults? 0.36% 0.82aDoes the child have trouble sitting still when asked to by an adult (e.g., for two minutes)? b 0.20% 0.74aDoes the child become very upset by loud sounds (e.g., a loud bang, scream)? b 0.40% 0.62aDoes the child demand you to be with him/her constantly? b 0.00% 0.62aIs the child able to do two things at the same time (e.g., play a game and listen to you)? 0.81% 0.61aDoes the child greet neighbors or other people he/she knows without being told (e.g., by saying hello orgesturing hello)?
0.12% 0.54
aWhen the child is upset, is he/she able to calm down by him/herself? 0.08% 0.53aDoes the child put objects or toys back where they belong after using them? 0.36% 0.49aIs the child sometimes impatient or unwilling to wait or hold still when you ask him/her to? b 0.16% 0.44aDoes the child act impulsively or without thinking? b 2.46% 0.41aDoes the child sometimes save things like candy or new toys for the future? 0.32% 0.38aDoes the ever child kick, bite, or hit other children or adults? b 0.08% 0.31aDoes the child cry or complain when he/she is made to wait for something he/she wants (e.g., toy, food)? b 0.08% 0.18
Mean, all items (n = 70) 1.40% 0.76
Mean, final items (n = 44) 1.98% 0.64aindicates item that was included in the final reliability and validity analysesbindicates item that was reverse coded
McCoy et al. Population Health Metrics (2017) 15:3 Page 16 of 18

Authors’ contributionsDM conceptualized and designed the study, developed the data collectioninstruments, conducted the preliminary analyses, drafted the initialmanuscript, and approved the final manuscript as submitted. CS assisted inthe conceptualization and design of the study, developed portions of thedata collection instruments, reviewed and revised the manuscript, andapproved the final manuscript as submitted. DB led the cultural adaptationof the BSID-III and training of data collectors, reviewed and revised themanuscript, and approved the final manuscript as submitted. AM assisted inthe development of the data collection instruments, translated study materials,coordinated and supervised data collection, critically reviewed the manuscript,and approved the final manuscript as submitted. GA assisted in thedevelopment of the data collection instruments, translated study materials,coordinated and supervised data collection, critically reviewed the manuscript,and approved the final manuscript as submitted. TW conducted the interviewswith field staff, analyzed, translated and summarized the resulting qualitativedata, critically reviewed the manuscript, and approved the final manuscript assubmitted. WF oversaw the design and conceptualization of the study, reviewedand edited the data collection instruments, critically reviewed the manuscript,and approved the final manuscript as submitted. GF assisted in the design andconceptualization of the study, developed portions of the data collectioninstruments, led the study sampling, conducted the final analyses, reviewed andrevised the manuscript, and approved the final manuscript as submitted.
Competing interestsThe authors declare that they have no competing interests.
Consent for publicationNot applicable.
Ethics approval and consent to participatePrimary caregivers provided informed consent for their own participation, aswell as the participation of their children. All study protocols were approvedby institutional review boards (IRBs) at the Harvard School of Public Health,the National Institute of Medical Research of Tanzania, and the Ifakara HealthInstitute.
Author details1Harvard T. H. Chan School of Public Health, Boston, MA, USA. 2HarvardGraduate School of Education, Cambridge, MA, USA. 3Harvard MedicalSchool, Boston, MA, USA. 4Ifakara Health Institute, Ifakara, Tanzania.
Received: 12 October 2016 Accepted: 27 January 2017
References1. Fink G, Peet E, Andrews K, McCoy DC, Sudfeld CR, Danaei G, Ezzati M, Fawzi
WW. Schooling and wage income losses due to early childhooddevelopmental delays in low- and middle-income countries: National,regional and global estimates. Am J Clin Nutr. 2015;104:104–12.
2. Heckman JJ. Skill formation and the economics of investing indisadvantaged children. Science. 2006;312:1900–2.
3. Nores M, Barnett WS. Benefits of early childhood interventions across theworld: (Under) Investing in the very young. Econ Educ Rev. 2010;29:271–82.
4. Shonkoff JP. Building a new biodevelopmental framework to guide thefuture of early childhood policy. Child Dev. 2010;81:357–67.
5. Snow CE, Van Hemel SB. Early childhood assessment: Why, what, and how.Washington: The National Academies Press; 2008.
6. Fernald LC, Kariger P, Engle P, Raikes A. Examining Early Child Developmentin Low-Income Countries: A Toolkit for the Assessment of Children in theFirst Five Years of Life. In: The International Bank for Reconstruction andDevelopment/The World Bank. 2009. http://siteresources.worldbank.org/EXTAFRREGTOPEDUCATION/Resources/444707-1291071725351/ExaminingECDtoolkitFULL.pdf. Accessed 15 Nov 2016.
7. Hui CH, Triandis HC. Measurement in cross-cultural psychology a review andcomparison of strategies. J Cross-Cult Psychol. 1985;16:131–52.
8. Peña ED. Lost in translation: Methodological considerations in cross‐culturalresearch. Child Dev. 2007;78:1255–64.
9. Keller H, Yovsi R, Borke J, Kärtner J, Jensen H, Papaligoura Z. Developmentalconsequences of early parenting experiences: Self‐recognition and self‐regulation in three cultural communities. Child Dev. 2004;75:1745–60.
10. Mischel W, Ayduk O, Berman MG, Casey BJ, Gotlib IH, Jonides J, Shoda Y.‘Willpower’ over the life span: Decomposing self-regulation. Soc Cogn AffectNeurosci. 2010;6:252–6.
11. Molden DC, Dweck CS. Finding“meaning” in psychology: a lay theoriesapproach to self-regulation, social perception, and social development. AmPsychol. 2006;61:192.
12. Moffitt TE, Arseneault L, Belsky D, Dickson N, Hancox RJ, Harrington H, CaspiA. A gradient of childhood self-control predicts health, wealth, and publicsafety. Proc Natl Acad Sci U S A. 2011;108:2693–8.
13. Raver CC. Placing emotional self-regulation in sociocultural andsocioeconomic contexts. Child Dev. 2004;75:346–53.
14. Multiple Indicator Cluster Surveys (MICS). In: United Nations Children’s Fund(UNICEF). 2009–2012. http://mics.unicef.org/surveys. Accessed 15 Nov 2016.
15. Janus M, Offord DR. Development and psychometric properties of the EarlyDevelopment Instrument (EDI): A measure of children’s school readiness.Can J Behav Sci. 2007;39:1.
16. Shonkoff JP, Boyce WT, McEwen BS. Neuroscience, molecular biology, andthe childhood roots of health disparities: building a new framework forhealth promotion and disease prevention. JAMA. 2009;301:2252–9.
17. Yoshikawa H. Public Policy and Interventions Designed to Reduce Povertyand Inequality - Proposing and implementing a post-2015 global earlychildhood development goal with quality at scale. In: Workshop on Poverty,Inequality, and Education/Stanford Graduate School of Education. 2014.http://edpov.stanford.edu/events/hirokazu-yoshikawa-public-policy-and-interventions-designed-reduce-poverty-and-inequality. Accessed 15 Nov 2016.
18. Sabanathan S, Wills B, Gladstone M. Child development assessment tools inlow-income and middle-income countries: how can we use them moreappropriately? Arch Dis Child. 2015;100:482–8.
19. Masanja H, Smith ER, Muhihi A, Briegleb C, Mshamu S, Ruben J, NeovitaTanzania Study Group. Effect of neonatal vitamin A supplementation onmortality in infants in Tanzania (Neovita): A randomised, double-blind,placebo-controlled trial. Lancet. 2015;385:1324–32.
20. Ministry of Health, Community Development, Gender, Elderly and Children[Tanzania], Ministry of Health [Zanzibar], National Bureau of Statistics, Officeof the Chief Government Statistician, & ICF International. TanzaniaDemographic and Health Survey and Malaria Indicator Survey 2015–2016:Key Indicators. In: The Demographic and Health Surveys (DHS) Program.2016. https://www.dhsprogram.com/pubs/pdf/SR233/SR233.pdf . Accessed16 Nov 2016.
21. Bradburn NM, Sudman S, Wansink B. Asking questions: The definitive guideto questionnaire design–for market research, political polls, and social andhealth questionnaires. 1st ed. San Francisco: John Wiley & Sons; 2004.
22. Desimone LM, Le Floch KC. Are we asking the right questions? Usingcognitive interviews to improve surveys in education research. Educ EvalPolicy Anal. 2004;26:1–22.
23. Durkin MS, Davidson LL, Desai P, Hasan ZM, Khan N, Shrout PE, Zaman SS.Validity of the Ten Questions Screen for childhood disability: results frompopulation-based studies in Bangladesh, Jamaica, and Pakistan. Epidemiol.1994;5:283–9.
24. Bayley N. Bayley Scales of Infant and Toddler Development. San Antonio:The Psychological Corporation; 2006.
25. Albers CA, Grieve AJ. Review of Bayley Scales of infant and toddlerdevelopment—third edition. J Psychoeduc Assess. 2007;25:180–90.
26. McGrath N, Fawzi WW, Bellinger D, Robins J, Msamanga GI, Manji K, TronickE. The timing of mother-to-child transmission of human immunodeficiencyvirus infection and the neurodevelopment of children in Tanzania. PediatrInfect Dis J. 2006;25:47–52.
27. McDonald CM, Manji KP, Kupka R, Bellinger DC, Spiegelman D, Kisenge R,Duggan CP. Stunting and wasting are associated with poorer psychomotor andmental development in HIV-exposed Tanzanian infants. J Nutr. 2013;143:204–14.
28. Sudfeld CR, McCoy DC, Fink G, Muhihi A, Bellinger DC, Masanja H, FawziWW. Malnutrition and its determinants are associated with suboptimalcognitive, communication, and motor development among Tanzanianchildren. J Nutr. 2015;145:2705–14.
29. WHO child growth standards: length/height-for-age, weight-for-age,weight-for-length, weight-for-height and body mass index-for-age: Methodsand development. In: World Health Organization. 2006. http://www.who.int/childgrowth/standards/technical_report/en/. Accessed 15 Nov 2016.
30. Cicchetti DV. Guidelines, criteria, and rules of thumb for evaluating normedand standardized assessment instruments in psychology. Psychol Assess.1994;6:284.
McCoy et al. Population Health Metrics (2017) 15:3 Page 17 of 18

31. Blair C, Razza RP. Relating effortful control, executive function, and falsebelief understanding to emerging math and literacy ability in kindergarten.Child Dev. 2007;78:647–63.
32. Caspi A, Moffitt TE, Newman DL, Silva PA. Behavioral observations at age3 years predict adult psychiatric disorders: Longitudinal evidence from abirth cohort. Arch Gen Psychiatry. 1996;53:1033–9.
33. Diamond A. Executive functions. Annu Rev Psychol. 2013;64:135–68.34. State of the World’s Children 2014 In Numbers: Every Child Counts Revealing
disparities, advancing children’s rights. In: United Nations Children’s Fund(UNICEF). 2014. https://www.unicef.org/sowc2014/numbers/documents/english/SOWC2014_In%20Numbers_28%20Jan.pdf. Accessed 15 Nov 2016.
• We accept pre-submission inquiries
• Our selector tool helps you to find the most relevant journal
• We provide round the clock customer support
• Convenient online submission
• Thorough peer review
• Inclusion in PubMed and all major indexing services
• Maximum visibility for your research
Submit your manuscript atwww.biomedcentral.com/submit
Submit your next manuscript to BioMed Central and we will help you at every step:
McCoy et al. Population Health Metrics (2017) 15:3 Page 18 of 18