Embed Size (px)
Citation preview
DEVELOPMENT OF A RATIONAL AND
PRACTICAL MIX DESIGN SYSTEM FOR FULL DEPTH RECLAIMED (FDR) MIXES
Rajib B. Mallick Assistant Professor, CEE Department, Worcester Polytechnic Institute (WPI)
100 Institute Road, MA 01609 Phone: (508) 831 5289, Fax: (508) 831 5808, e-mail: [email protected]
Prithvi S. Kandhal
Associate Director, National Center for Asphalt Technology 211 Ramsay Hall, Auburn University, AL 36849
Phone: (334) 844 6242, Fax: (334) 844 6248, e-mail: [email protected]
Elton Ray Brown Director, National Center for Asphalt Technology 211 Ramsay Hall, Auburn University, AL 36849
Phone: (334) 844 6244, Fax: (334) 844 6248, e-mail: [email protected]
Richard L. Bradbury Engineer, Research and Construction, Maine Department of Transportation
219 Hogan Road, PO Box 1208, Bangor, ME 04402-1208 Phone: (207) 941 4597, Fax: (207) 287 3392, e-mail: [email protected]
and
Edward J. Kearney
Chief Engineer, Gorman Brothers Inc., Church St.-Port of Albany, Albany, NY 12202 Phone: 518 462 5401, Fax: 518 462 1296, e-mail: [email protected]
Final Report for a Project (Subcontract No. 00-373) Funded by The Recycled Materials Resource Center (RMRC) at the University of New Hampshire
November 22, 2002
1
SUMMARY
This report presents the findings of a research study carried out for the development of a rational
and practical mix design system for Full Depth Reclaimed (FDR) mixes. This research project
involved selecting project locations, obtaining samples from selected FDR sections, and detailed
laboratory testing for evaluation. Planned work involved determination of effect of moisture
content, compactive effort and additive content on volumetric and mechanical properties of FDR
mixes. The overall work plan consisted of selection of test sections, sampling of materials from
test sections, development of a mix design method using the Superpave gyratory compactor,
construction of test section, evaluation of in-place materials, refinement of mix design and
testing of in-place materials after construction of test sections. Work also included development
of a rapid design procedure using the gyratory compactor only, and determination of resilient
modulus of subgrade soils.
The criteria used for determination of optimum total fluid content are based on the
determination of dry density and resilient modulus. Adequate resistance to moisture damage is a
significant factor in obtaining good performance from stabilized base course mixes, and
departments of transportation (DOT s) should consider any good test that they are comfortable
with, to evaluate resistance of designed FDR mixes to moisture damage. Three different types of
tests methods have been discussed.
Based on the research conducted in this study, it is concluded that the Superpave gyratory
compactor can be used successfully for compacting full depth reclamation mixes. Use of a
slotted mold is recommended to allow squeezing out of water during compaction of full depth
reclamation mixes. Use of samples in sealed bags is recommended for determination of bulk
specific gravity in the laboratory. A dry density versus total fluid content criteria can be used to

2
determine the optimum total fluid content. If an asphalt emulsion is used, then the total fluid
consists of preexisting water in the material plus the emulsion. Any one of the additives
considered in this study improves resistance of FDR against moisture damage. Cement and
emulsion plus lime mixes show very high resistance to moisture damage compared to the other
mixes. However, on the basis of wet tensile strength, emulsion plus lime is better than any other
additive considered in this study. Therefore, use of emulsion and lime, and cement in low
percentage, for full depth reclamation of materials similar to the materials studied in this project
is recommended.
FDR samples for mix design should be compacted to 50 gyrations during mix design, and
a minimum of 95 % of density of in-place loose mix samples, compacted to 50 gyration, is
recommended to be achieved in a control strip in the field. Compaction in actual project must
achieve at least 98 percent of the control strip density. Increase in structural numbers for FDR
layers should be considered for designing binder and surface layers.

3
ACKNOWLEDGEMENTS
This material is based on work supported by the Federal Highway Administration under
Cooperative Agreement No. DTFH61-98-X00095 through the Recycled Materials Resource
Center at the University of New Hampshire, Durham, New Hampshire.
4
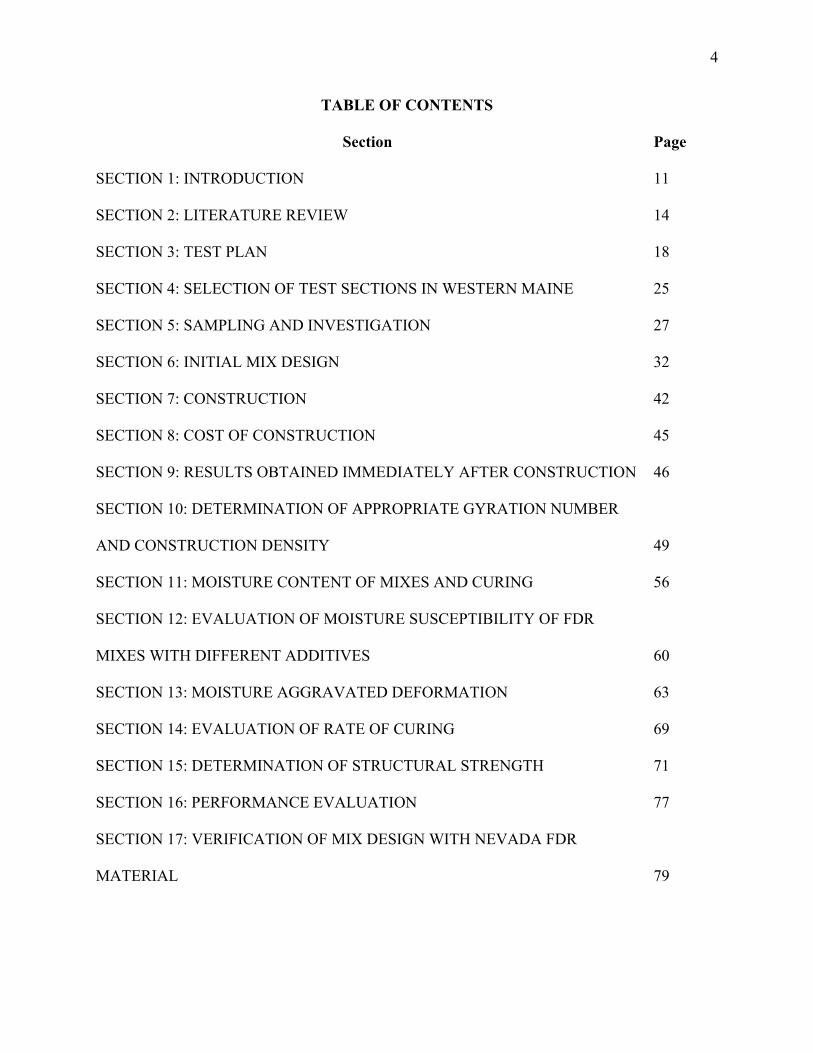
TABLE OF CONTENTS
Section Page
SECTION 1: INTRODUCTION
SECTION 2: LITERATURE REVIEW
SECTION 3: TEST PLAN
SECTION 4: SELECTION OF TEST SECTIONS IN WESTERN MAINE
SECTION 5: SAMPLING AND INVESTIGATION
SECTION 6: INITIAL MIX DESIGN
SECTION 7: CONSTRUCTION
SECTION 8: COST OF CONSTRUCTION
SECTION 9: RESULTS OBTAINED IMMEDIATELY AFTER CONSTRUCTION
SECTION 10: DETERMINATION OF APPROPRIATE GYRATION NUMBER
AND CONSTRUCTION DENSITY
SECTION 11: MOISTURE CONTENT OF MIXES AND CURING
SECTION 12: EVALUATION OF MOISTURE SUSCEPTIBILITY OF FDR
MIXES WITH DIFFERENT ADDITIVES
SECTION 13: MOISTURE AGGRAVATED DEFORMATION
SECTION 14: EVALUATION OF RATE OF CURING
SECTION 15: DETERMINATION OF STRUCTURAL STRENGTH
SECTION 16: PERFORMANCE EVALUATION
SECTION 17: VERIFICATION OF MIX DESIGN WITH NEVADA FDR
MATERIAL
11
14
18
25
27
32
42
45
46
49
56
60
63
69
71
77
79
5
TABLE OF CONTENTS
Section Page
SECTION 18: APPLICATION OF LATERAL PRESSURE INDICATOR (LPI)
SECTION 19: DETERMINATION OF LABORATORY RESILIENT MODULUS
OF SUBGRADE SOILS
SECTION 20: DISCUSSION
SECTION 21: CONCLUSIONS AND RECOMMENDATIONS
SECTION 22: REFERENCES
85
88
94
98
101
6
LIST OF FIGURES
Figure Page
FIGURE 3.1 Overall work plan
FIGURE 4.1 Photo of typical section
FIGURE 4.2 Photo of typical section
FIGURE 5.1 Sampling
FIGURE 6.1 a) Slotted mold, b) cloth around slotted mold, c) extrusion
device used for taking samples out, d) transferring sample with extrusion device.
FIGURE 6.2 Plot of dry density and resilient modulus versus total fluid content
(water mixes)
FIGURE 6.3 Plot of dry density and resilient modulus versus total fluid content
FIGURE 6.4 Plot of dry density and indirect tensile strength versus total fluid
content (emulsion mixes)
FIGURE 6.5 Gradation of compacted and uncompacted mix
FIGURE 6.6 Plot of air voids and resilient modulus versus total fluid content
(emulsion mixes)
FIGURE 6.7 Use of CoreLokTM (a) sample in bag, (b) CoreLokTM device, (c) sample
in sealed bag, (d) sample in water inside the sealed bag
FIGURE 7 (a) Reclaimer, (b) Padfoot and (c) Vibratory roller
FIGURE 10.1a Density of Laboratory Compacted Loose Mixes and In-Place
Density
19
25
26
29
33
35
37
37
39
39
41
43
52
7
LIST OF FIGURES
Figure Page
FIGURE 10.1b Comparison of In-Place Density with Density of Samples
Compacted to 50 Gyrations
FIGURE 10.2a Plot of water content versus properties for water samples
compacted at 50 gyrations
FIGURE 10.2 b Plot of water content versus properties for emulsion
samples compacted at 50 gyrations
FIGURE 11.1 Moisture content of mixes
FIGURE 11.2 Moisture content of water mix samples from initial mix design
FIGURE 13.1 Plot of rutting versus cycles for different mixes
FIGURE 13.2. Photos of rutted samples of different mixes
TABLE 13.2 Results of statistical analysis with rut depths at 500 cycles
FIGURE 14.1 Plot of resilient modulus versus time after compaction for different
mixes
FIGURE 16.1 Photos of recycled sections after one year of construction
FIGURE 17.1 Mix design results for Nevada I-80 FDR mix
FIGURE 17.2 Mix in the mold
FIGURE 17.3 Compacting with vibratory roller
FIGURE 18.1 Exploded view of instrumented mold
52
55
55
57
59
64
67
70
78
81
83
83
85
87
8
LIST OF FIGURES
Figure Page
FIGURE 18.2 Gyration versus lateral pressure for mixes with different emulsion
content (average from two samples)
FIGURE 18.3 Relationship between Ko (coefficient of earth pressure) and ϕ. (16)
FIGURE 19.1 Test plan
87
87
89
9
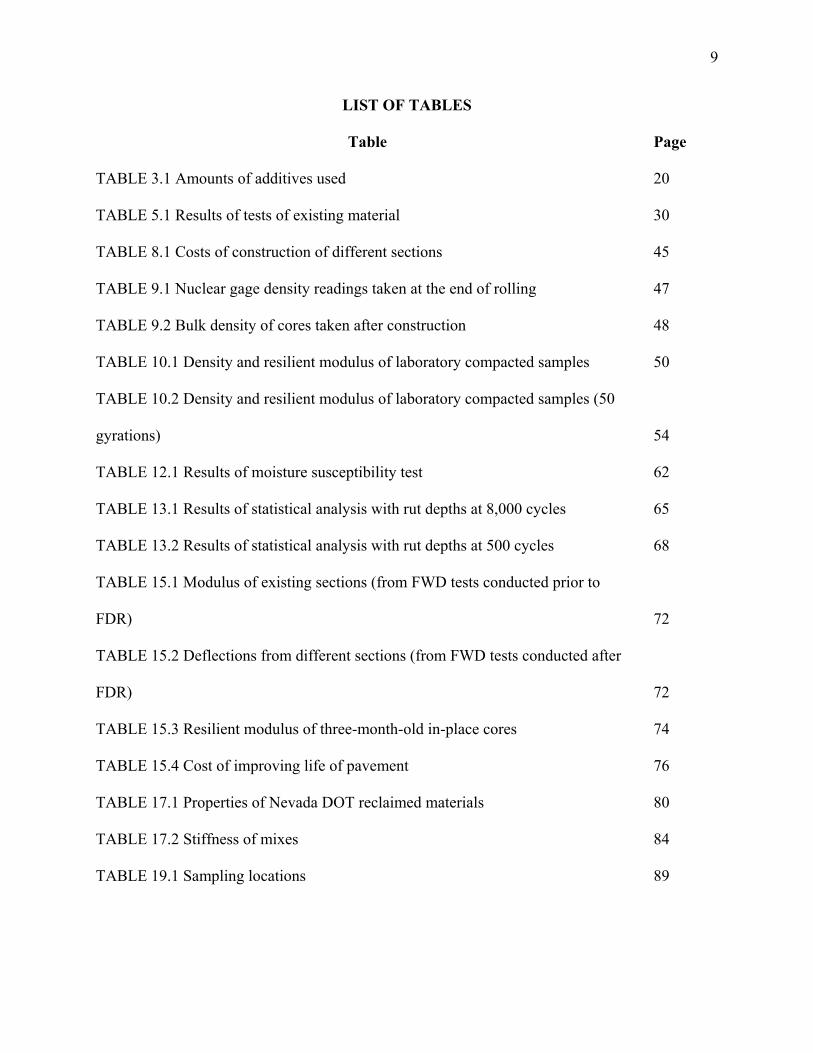
LIST OF TABLES
Table Page
TABLE 3.1 Amounts of additives used
TABLE 5.1 Results of tests of existing material
TABLE 8.1 Costs of construction of different sections
TABLE 9.1 Nuclear gage density readings taken at the end of rolling
TABLE 9.2 Bulk density of cores taken after construction
TABLE 10.1 Density and resilient modulus of laboratory compacted samples
TABLE 10.2 Density and resilient modulus of laboratory compacted samples (50
gyrations)
TABLE 12.1 Results of moisture susceptibility test
TABLE 13.1 Results of statistical analysis with rut depths at 8,000 cycles
TABLE 13.2 Results of statistical analysis with rut depths at 500 cycles
TABLE 15.1 Modulus of existing sections (from FWD tests conducted prior to
FDR)
TABLE 15.2 Deflections from different sections (from FWD tests conducted after
FDR)
TABLE 15.3 Resilient modulus of three-month-old in-place cores
TABLE 15.4 Cost of improving life of pavement
TABLE 17.1 Properties of Nevada DOT reclaimed materials
TABLE 17.2 Stiffness of mixes
TABLE 19.1 Sampling locations
20
30
45
47
48
50
54
62
65
68
72
72
74
76
80
84
89
10
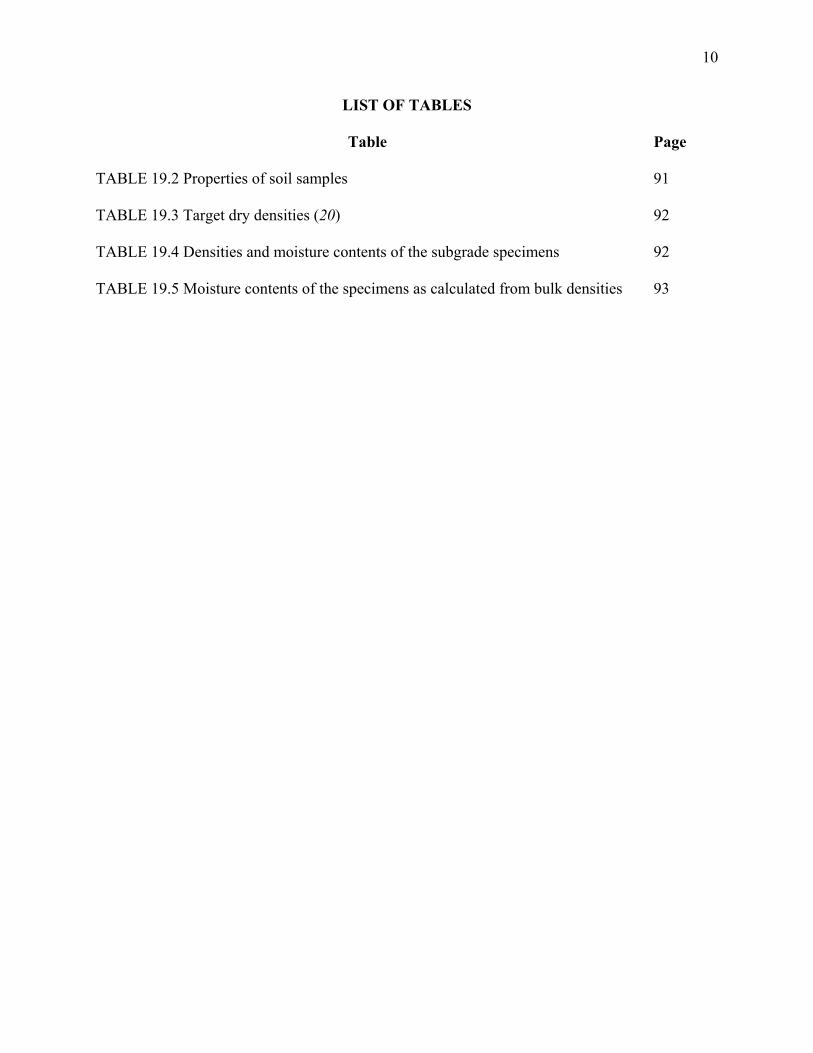
LIST OF TABLES
Table Page
TABLE 19.2 Properties of soil samples
TABLE 19.3 Target dry densities (20)
TABLE 19.4 Densities and moisture contents of the subgrade specimens
TABLE 19.5 Moisture contents of the specimens as calculated from bulk densities
91
92
92
93
11
SECTION 1: INTRODUCTION
Full depth reclamation (FDR) is a recycling technique in which the entire existing asphalt
pavement, along with part of the underlying unbound base material, is recycled in-place to
produce a stabilized base course. This technique has shown tremendous potential in saving
material and money, providing a convenient way of restoring proper cross slope and grade to
highway, and providing crack resistant base course. However, currently the selection of amount
and type of additive used in FDR is based on experience or outdated techniques. To utilize its
potential fully, there is a need to develop a rational and practical mix design system for selecting
the correct amount of additive for FDR. There is also a need to evaluate the effectiveness of
different types of additives on the basis of field performance.
The advantages of FDR make it an attractive option not only in the New England region,
but also all over the United States. Many states are eager to adapt a rational and practical mix
design system for FDR. The absence of such a system hinders the full cost-effective use of this
technique, and hence prevents the savings, which can be attained through this procedure.
This project intends to address the problem of lack of a proper mix design procedure for
selection of amount of additive for FDR, and the problem of determining a suitable type of
additive for specific location in the state of Maine.
Objective
The objectives of this project were to develop a rational mix design system for FDR, and
evaluate different additives used in FDR. Specifically, the objectives were:
1. Develop mix design method using the Superpave gyratory compactor
a) Develop guidelines for the use of Superpave gyratory compactor for preparation of
samples for mix design

12
b) Determine proper compactive effort in terms of gyration number for selection of optimum
additive content.
2. Determine proper curing procedure
3. Evaluate the in-place performance of four different types of additive used in FDR.
4. Recommend proper structural numbers for full depth reclaimed base material.
The additional objectives were:
1. Validate the mix design procedure by designing and testing mixes from a different state.
2. Develop a procedure for selection of optimum fluid content for FDR mixes, using the gyratory
compactor only.
3. Determine resilient modulus of subgrade soils from Maine
Scope
This research project involved selecting project locations, obtaining samples from selected FDR
sections, and detailed laboratory testing for evaluation. Planned work involved determination of
effect of moisture content, compactive effort and additive content on volumetric and mechanical
properties of FDR mixes. These properties include density and resilient modulus. A mixture
design procedure, specifically for determining the amount of curing and number of gyrations
with the Superpave gyratory compactor, has been developed. Test sections were constructed with
different additives, at contents determined from laboratory testing. In-place materials during and
after construction were sampled and tested for refining the laboratory mix design procedure.
Nondestructive testing of in-place material was conducted immediately after construction and
one year after construction to evaluate the performance and structural strength of the sections
with different additives. Samples were compacted with materials from the pavement using
several different types of additives and contents. Resilient modulus and bulk specific gravity
13
tests were conducted to determine the optimum content of each additive. Once each optimum
additive content was determined, wet rutting tests were performed to compare the strength and
durability of mixes with different types of additives. The scope of work also consisted of
determination of resilient modulus of in-place cores and analyzing the data for determination of
improvement in life of the pavement and structural numbers. A FDR mix design for reclaimed
materials obtained from Nevada DOT was developed, and the density and stiffness of mixes with
optimum, optimum minus and optimum plus additive content were determined. A method for
rapid determination of optimum additive content using the Superpave gyratory compactor only
was developed. Resilient modulus of subgrade materials obtained from three different counties
(in Maine) were determined, and regression equations relating resilient modulus to bulk and
deviator stress were developed.
14
SECTION 2: LITERATURE REVIEW
Roads are very important for our everyday life, economic prosperity, and defense of the nation.
In the United States, more than 94 percent of the 2.3 million miles of roadways are paved with
Hot Mix Asphalt (HMA). HMA is a mixture of mineral aggregates and asphalt binder, prepared
and laid down at a high temperature in the range of 130-150oC.
In the last few decades there have been tremendous developments in the field of HMA
pavement recycling, specifically because of dwindling natural resources and landfill space and
the simultaneous development of sophisticated plants and in-place recycling equipment. Full
Depth Reclamation (FDR), even though recognized as a process with tremendous potential, has
not been researched on the basis of any long-term study. While other cold recycling methods can
alleviate problems related only to upper layers of a pavement, FDR is the only cold in-place
recycling technique that can be used to treat a wide range of problems, particularly problems
related to deeper layers, such as problems associated with weak base courses or pavements with
insufficient structural capacity. FDR is capable of rectifying deep rutting problems, reflective
fatigue and thermal cracking, deterioration of pavements due to maintenance patching and
deterioration of ride quality caused by depressions and heaving (1). This technique, if performed
properly, can save as much as 50 percent of the cost compared with conventional reconstruction
methods (2). Additionally, since it is a cold recycling technique, it uses significantly less energy,
results in less pollution, and helps avoid filling up landfill spaces.
Known by several names, such as deep cold recycling in Europe where the process was
first used, and full depth reclamation when it was first adopted in United States, this energy
saving and economical process has become generally known by its initials FDR. FDR was
developed as a process for solving pavement problems that are associated with layers below the
15
surface that form the base and subgrade. Very common problems are caused because of
structurally weak base, poor base or subgrade material, and deterioration of base through the
effect of environment. If a pavement shows distress due to deterioration of layers below the
surface layer, such as base layer materials, the most common option is to mill the entire
pavement structure and reconstruct the pavement by building it up from the base. This process
involves a significant amount of expense because of the need to mill off the existing pavement,
transport and deposit the old material in landfills, bring in new materials, and construct the
different pavement layers. FDR provides the significantly better option of reusing existing
materials to obtain a better performing base, on which a relatively thin and, hence, less costly
surface layer can be used to obtain an equivalent pavement structure. The process of FDR
consists of in-place cold grinding of the existing asphalt mix layer as well as the use of a
predetermined amount of unbound granular base material, stabilizing the material with an
additive, and compacting the layer to a proper density level. The mixing of asphalt mix and the
additive with the base material provides a far superior base than the original unbound base
material, avoids the problem of transporting existing material and bringing in new materials,
saves energy by not using high temperature for heating asphalt mixes, and reduces the need for
virgin natural resources such as mineral aggregates and asphalt binder (3, 4).
Since, in most cases, no new material (except stabilizer) is added during FDR, the
challenges include determining the optimum thickness of base material that is to be recycled and
the correct (optimum) amount of stabilizer that is to be added, to ensure that the recycled
materials are properly coated with the additive (stabilizer), and compacting the mix sufficiently.
The mix must then be given enough time for curing before the surface layer is applied. Currently,
the process of FDR is more of an art than it is a science. In most cases, a specific percentage – a
16
percentage that has been used before in the region for a commonly used additive – is used for
recycling. The coating is checked by scooping some material by hand, making a ball out of the
material, releasing the material, and looking at the uniformity of the marks on the palm of the
hand (5). In many cases, the compaction is checked by a procedure in which the sample is taken
after application of certain amount of fluid in a mold, compacting the mix with a hammer, and
noting if any fluid is squeezed out of the mold. The curing time, in most cases, is based on an
arbitrary number of days for which the recycled base should be left open before surfacing and is
not related to any criteria or test that measures the development of strength with curing (6).
Needless to say, all of these techniques are based on empirical methods and experience.
In most cases, contractors rely heavily on guidelines from equipment manufacturers. Hence,
there is always an unknown element in the design and construction process with different
contractors having their own methods of design and construction. Some contractors and states
have developed their own specifications. However, contractors from different states and different
state departments of transportation (DOT) will not necessarily tell the designer what tests need to
be done or how to complete the mix design. Good results are not necessarily guaranteed when
different materials at different climatic zones are used and when some of the criteria developed
somewhere else are sacrificed for economy or convenience of construction or for a different test
procedure. Still, there is a remarkably good record of FDR in the United States and it is regarded
as a very economical and environmentally friendly process that can produce a good quality
pavement if done properly. It has been discussed as one of the four major types of recycling in
the Federal Highway Administration (FHWA) pavement recycling reference book for state and
local departments of transportation (7).
17
A review of existing information on mix design and performance of FDR mixes indicate the
following: 1. Coating of additives such as asphalt emulsion has a significant effect on durability
(8), 2. Gradation of mixes, particularly percentage passing the 0.075 mm sieve has the most
significant effect on the stiffness of the mix (9), 3. The total fluid content has a significant effect
on the stiffness (8) of the mix, 4. Long-term performance of mixes should be studied to
determine the relationship between short-term and long-term performance (8), 5. The
effectiveness of additives for FDR is affected significantly by the plasticity of soil (10),
6. Maximum aggregate size has a significant effect on compactibility of mixes (9, 11), 7. FDR
mixes constructed in different climates need different curing periods to develop sufficient
strength (12, 13).
The major conclusions from the literature review are:
1. The full depth reclamation process provides an attractive option in rehabilitation of
pavements, particularly those with base related problems.
2. Asphalt emulsions, alone or in combination with other additives such as lime and/or cement
are commonly used for FDR.
3. Coating of recycled materials is an important concern for proper construction of FDR mixes
4. Currently, there is no widely accepted mix design system, specially one using the Superpave
gyratory compactor, for FDR
5. Several key issue such as curing time and temperature and structural strength of FDR mixes,
need to be investigated.
18
SECTION 3: TEST PLAN
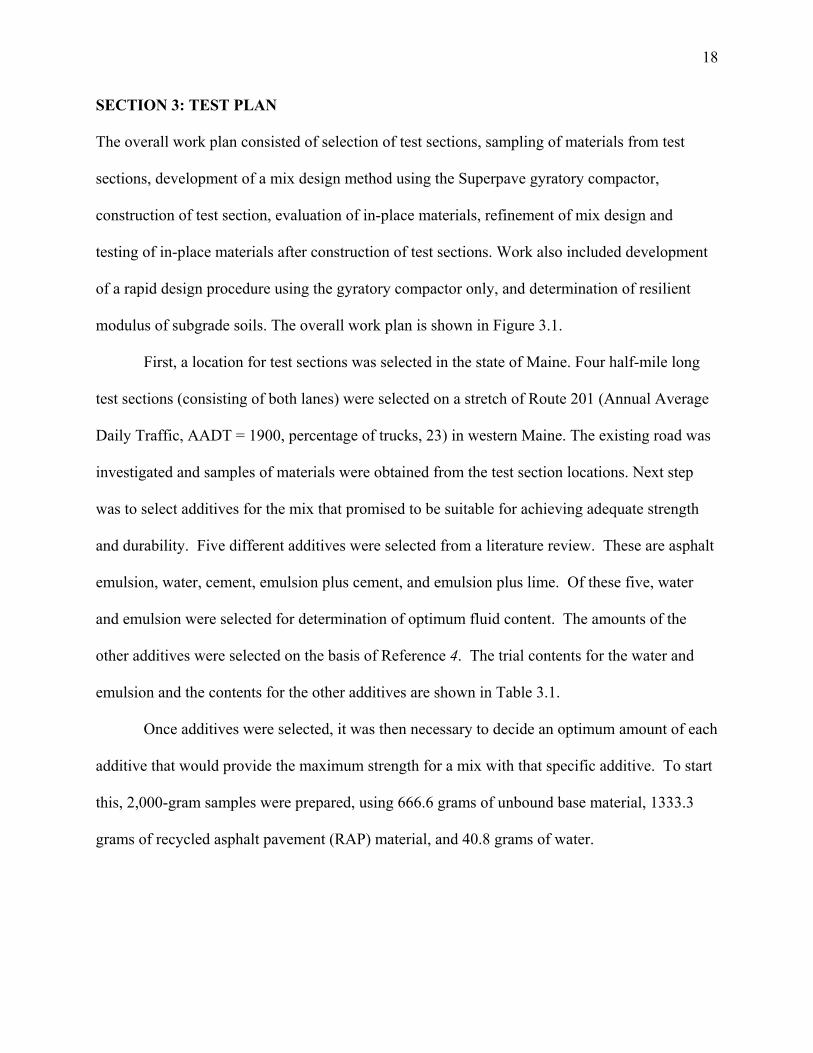
The overall work plan consisted of selection of test sections, sampling of materials from test
sections, development of a mix design method using the Superpave gyratory compactor,
construction of test section, evaluation of in-place materials, refinement of mix design and
testing of in-place materials after construction of test sections. Work also included development
of a rapid design procedure using the gyratory compactor only, and determination of resilient
modulus of subgrade soils. The overall work plan is shown in Figure 3.1.
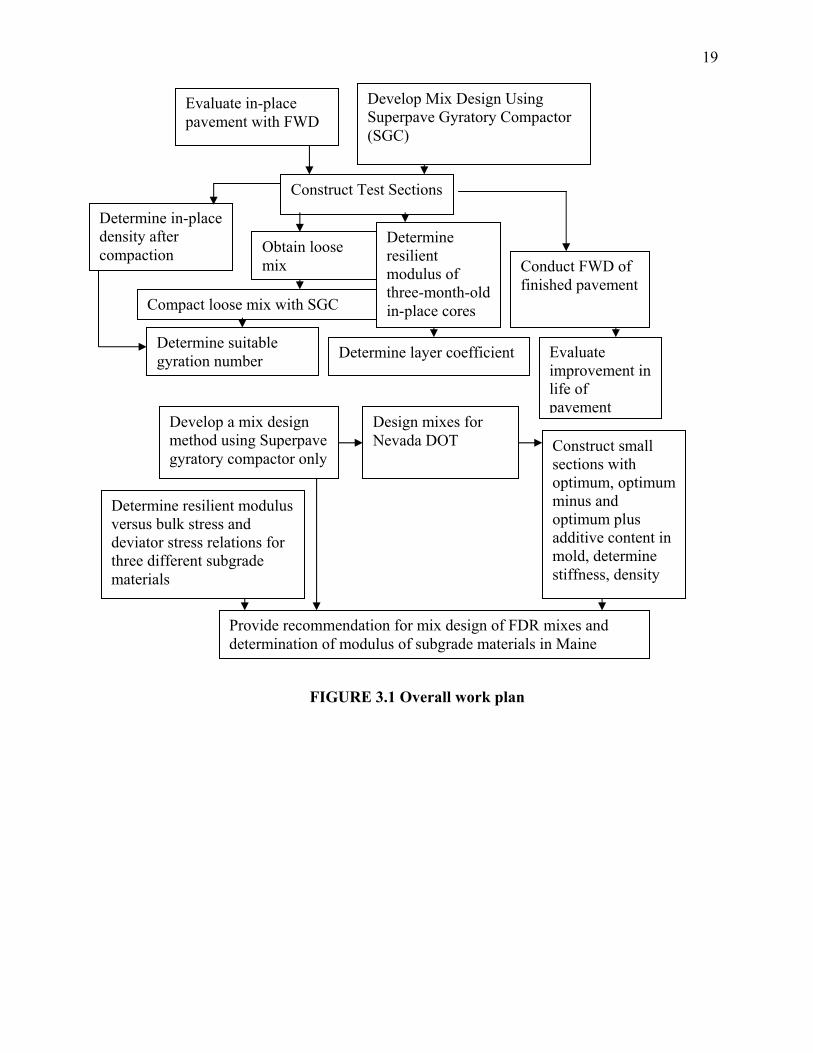
First, a location for test sections was selected in the state of Maine. Four half-mile long
test sections (consisting of both lanes) were selected on a stretch of Route 201 (Annual Average
Daily Traffic, AADT = 1900, percentage of trucks, 23) in western Maine. The existing road was
investigated and samples of materials were obtained from the test section locations. Next step
was to select additives for the mix that promised to be suitable for achieving adequate strength
and durability. Five different additives were selected from a literature review. These are asphalt
emulsion, water, cement, emulsion plus cement, and emulsion plus lime. Of these five, water
and emulsion were selected for determination of optimum fluid content. The amounts of the
other additives were selected on the basis of Reference 4. The trial contents for the water and
emulsion and the contents for the other additives are shown in Table 3.1.
Once additives were selected, it was then necessary to decide an optimum amount of each
additive that would provide the maximum strength for a mix with that specific additive. To start
this, 2,000-gram samples were prepared, using 666.6 grams of unbound base material, 1333.3
grams of recycled asphalt pavement (RAP) material, and 40.8 grams of water.
19
Determine resilient modulus versus bulk stress and deviator stress relations for three different subgrade materials
Provide recommendation for mix design of FDR mixes and determination of modulus of subgrade materials in Maine
Construct small sections with optimum, optimum minus and optimum plus additive content in mold, determine stiffness, density
Design mixes for Nevada DOT
Develop a mix design method using Superpave gyratory compactor only
Evaluate improvement in life of pavement
Conduct FWD of finished pavement
Determine layer coefficient
Determine resilient modulus of three-month-old in-place cores
Determine suitable gyration number
Evaluate in-place pavement with FWD
Determine in-place density after compaction
Compact loose mix with SGC
Obtain loose mix
Construct Test Sections
Develop Mix Design Using Superpave Gyratory Compactor (SGC)
FIGURE 3.1 Overall work plan
20
TABLE 3.1 Amounts of additives used Additive Contents Water 2%, 4%, 6%, 8%, and 10% Emulsion 1%, 3%, 5%, and 7% Cement 5% Emulsion and Cement 3% Emulsion and 2% Cement Emulsion and Lime 3% Emulsion and 2% Lime Note: 2% pre-mix water was added to each mix
The amounts were determined on the basis of the 2:1 proportion used in the FDR mixture for the
candidate pavement, and water was added to obtain the same water content as the in-place water
content of the soil. Once these batch amounts were prepared in canisters and allowed to sit for
24 hours, the additives were then added in varying amounts, and for each content six batches
were prepared. Each batch was then compacted using the Superpave gyratory compactor (SGC),
with 75 gyrations. The compacted samples were then tested for bulk specific gravity, tensile
strength and resilient modulus. From plots of dry density, indirect tensile strength and resilient
modulus versus total fluid content, the optimum emulsion and water content were determined.
These contents were then recommended for construction of the test sections.
Next, four sections were reclaimed at the selected location - each section with a different
additive: MS-2 emulsion, water (some agencies use only water), cement (Type II), and a
combination of MS-2 emulsion and lime. A visual examination of the existing pavement showed
minor rutting but extensive fatigue cracking along wheel path. Immediately prior to recycling,
FWD testing was conducted on the existing pavement. The decision to use lime and cement, in
addition to the originally planned water and emulsion, was taken to evaluate their effect on early
gain in strength and water resistance. In the emulsion section, two different contents were used in
two different lanes – 2.2 % in the north-bound lane and 3.4 % in the south bound lane. In the
21
emulsion plus lime sections (north and south bound) 3.4 % emulsion was used. Water and
cement were added at 7 and 5 %, respectively, in the water and cement sections.
During FDR, samples of loose mix were obtained from the sections and transported to the
laboratory in sealed bags. These mixes were compacted with a Superpave gyratory compactor
(SGC) to 150 gyrations, and the densities of the compacted samples were determined using the
vacuum seal method (4). Immediately after compaction rolling, the densities of the in-place
mixes were determined using a nuclear density gauge. Densities of cores obtained after curing
were compared to densities obtained at different gyrations during laboratory compaction of loose
mix. This comparison was used for determination of appropriate gyration numbers.
A binder and a surface layer were constructed on the FDR base after ten days of curing.
FWD test was conducted on the finished pavement after three months of construction. Full-
depth in-place cores were also obtained at this time. These cores were tested for resilient
modulus in the laboratory. The FWD data from before and after construction and the resilient
modulus values were used for determination of improvement in pavement life and determination
of structural numbers (respectively).
In the second phase, samples with different additives were compacted in the laboratory,
using 50 gyrations with the Superpave gyratory compactor. This compactive effort was selected
on the basis of comparison of densities of laboratory compacted samples and in-place cores
obtained after curing. Immediately after each sample was compacted resilient modulus testing
was conducted. Each sample’s resilient modulus was recorded at time zero (that is immediately
after compaction) and their bulk specific gravity (BSG) was determined using the vacuum seal
(6) method.
22
Once this was done, the bulk specific gravity was recorded for time zero (that is
immediately after compaction), and placed in the oven at 40° C for curing. This curing was done
to imitate the curing of the FDR mix in the field. During the curing period the samples were
tested again for resilient modulus at two hours, four hours, six hours, eight hours, and 24 hours.
This was done to evaluate the gain in strength with time for different mixes. Once the samples
were tested for the last time at 24 hours, their bulk specific gravity was again found. One
exception to this procedure was samples where additional water was the only additive. It was
found that these samples lacked the strength necessary for testing at an early age. Due to this
problem water samples were only tested for resilient modulus and bulk specific gravity after
being cured for a full 24 hours.
In the next step, mixes with different additives at the selected content were tested for
durability. For this task, samples were prepared from 2,700-gram samples (one-third unbound
base material and two thirds RAP, including 2% water). Once the water was added the samples
were mixed and allowed to set for 24 hours as before. The additives were then added at the
selected contents and the samples were compacted. Six samples were compacted for each
additive. Upon being compacted the samples were cured for 24 hours in the oven at 40° C.
Once the samples were cured, all the samples were tested in the Asphalt Pavement Analyzer
(APA). The test consists of running loaded wheels over the mix samples under water and
determining the damage to the mixes.
Next, samples of FDR mixes with water, emulsion, emulsion and lime, cement and
emulsion and cement were tested for indirect tensile strength, under dry and wet conditions, and
tensile strength ratios (between wet and dry) were determined.
23
The conditioning process was done in accordance with AASHTO T283. The samples
were vacuum saturated to 50-80% saturation. They were then wrapped and placed in a self-
sealing bag with 10 ml of water, and put into a -18°C freezer. After approximately 16 hours in
the freezer, the samples were placed in a 60°C water bath. They were then transferred into a
25°C water bath and kept for a period of 2 hours before testing.
Next, a mix design was conducted for reclaimed materials obtained from Nevada DOT.
The reclaimed materials were first tested for gradation and asphalt content. An optimum
emulsion content was determined from the mix design. In the next step, three sections were
constructed in an accelerated loading and testing facility mold. Each section was approximately
450 mm in length and 900 mm in width (150 mm thick). The first section was made at minus one
percent of the optimum emulsion content, the second sections was at the optimum emulsion
content and the third section was at plus one percent of the optimum emulsion content. The
sections were compacted with a roller (vibratory) to refusal density and then left to cure for ten
days. At the end of ten days, attempts were made to take cores for testing, but the material was
not stiff enough to allow proper coring. In-place stiffness of the threes sections were determined,
using a Humboldt Stiffness Gauge, an equipment that uses deflection under a dynamic load to
measure stiffness of geo-materials. The stiffness data were analyzed.
The Nevada DOT material was used for development of a rapid mix design procedure for
determination of optimum emulsion content. Mixes were prepared with different emulsion
content and compacted in an instrumented mold in the Superpave gyratory compactor. The data
from the instrumented mold were analyzed and a procedure for determination of optimum
emulsion content as developed.

24
Subgrade soils from three counties in Maine were characterized (according to AASHTO
classification system) and then tested for resilient modulus, using a range of deviator stress. The
test results were analyzed and regression equations were developed for relating resilient modulus
to deviator stress and bulk stress.
25
SECTION 4: SELECTION OF TEST SECTIONS IN WESTERN MAINE
Test sections for full depth reclamation (FDR) were selected and marked on U.S. Route 201, in
the town of Caratunk in western Maine. The project begins at Station 2+115 metric, which is at
the Caratunk-The Forks Twp. Town line and extends south ending at Station 8+019. Total length
of the project was 5.9 km. Full depth reclamation for this research project was done at two
locations. Stationing for FDR locations were from Station 2+650 to 3+800 and from 4+800 to
7+720. There was one 800 m test section in the first location, and three 800 m test sections in the
second location. These sections were selected on the basis of the criteria that were set forth in the
original test plan, and the additional criteria recommended by Expert Task Group (ETG) for the
project.
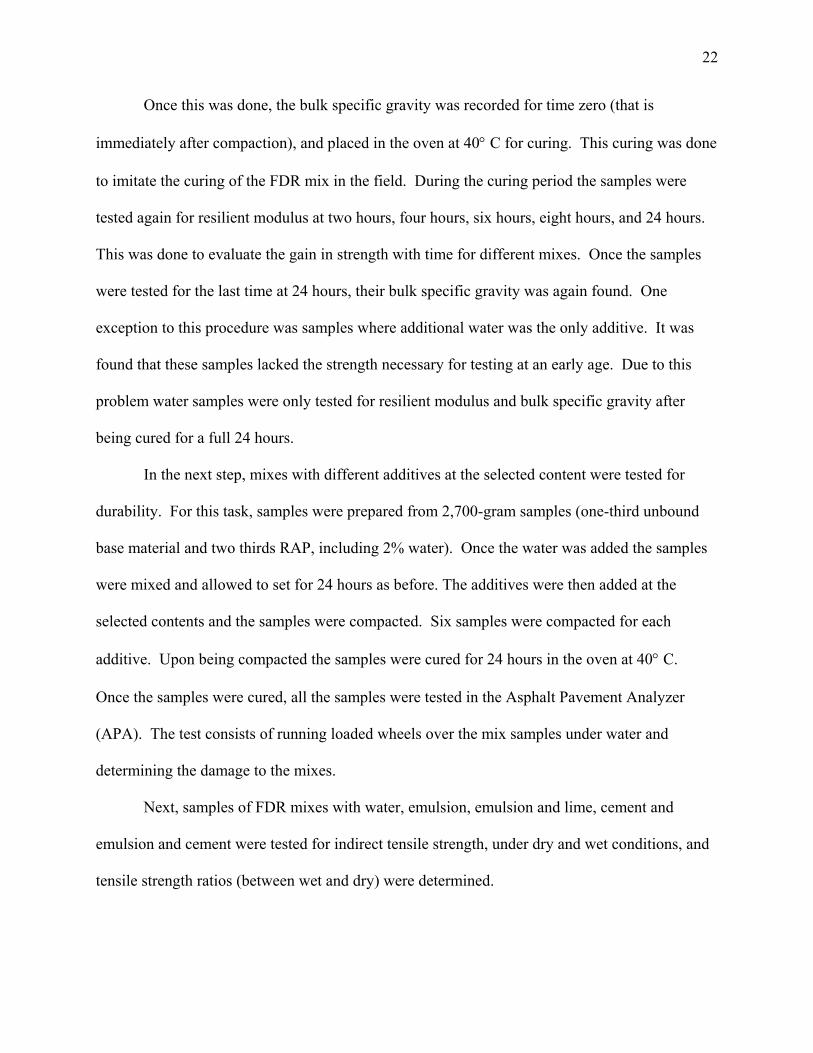
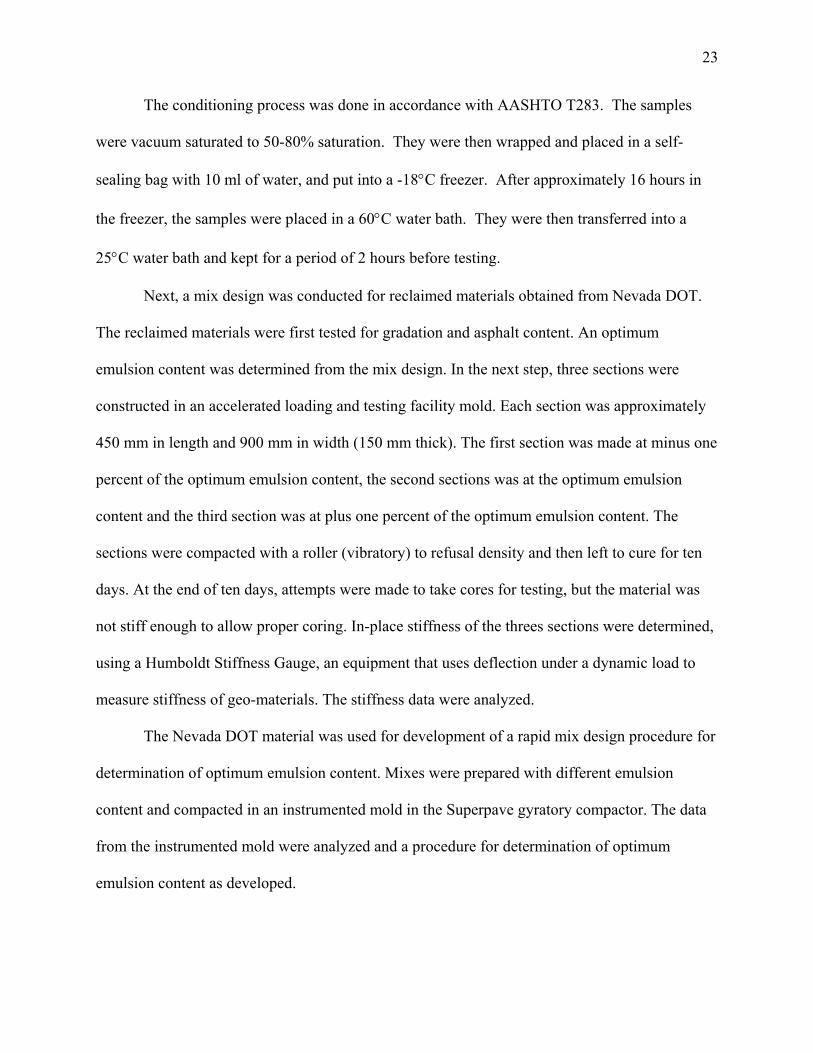
The selected sections had general distress conditions of longitudinal, fatigue and thermal
cracking, and maintenance patches. Photos of typical sections are shown in Figure 4.1 and 4.2.
Rutting appeared to be minimal throughout the two-mile section (no actual measurements were
taken), although fatigue cracking was quite evident.
FIGURE 4.1 Photo of typical section
26
FIGURE 4.2 Photo of typical section
27
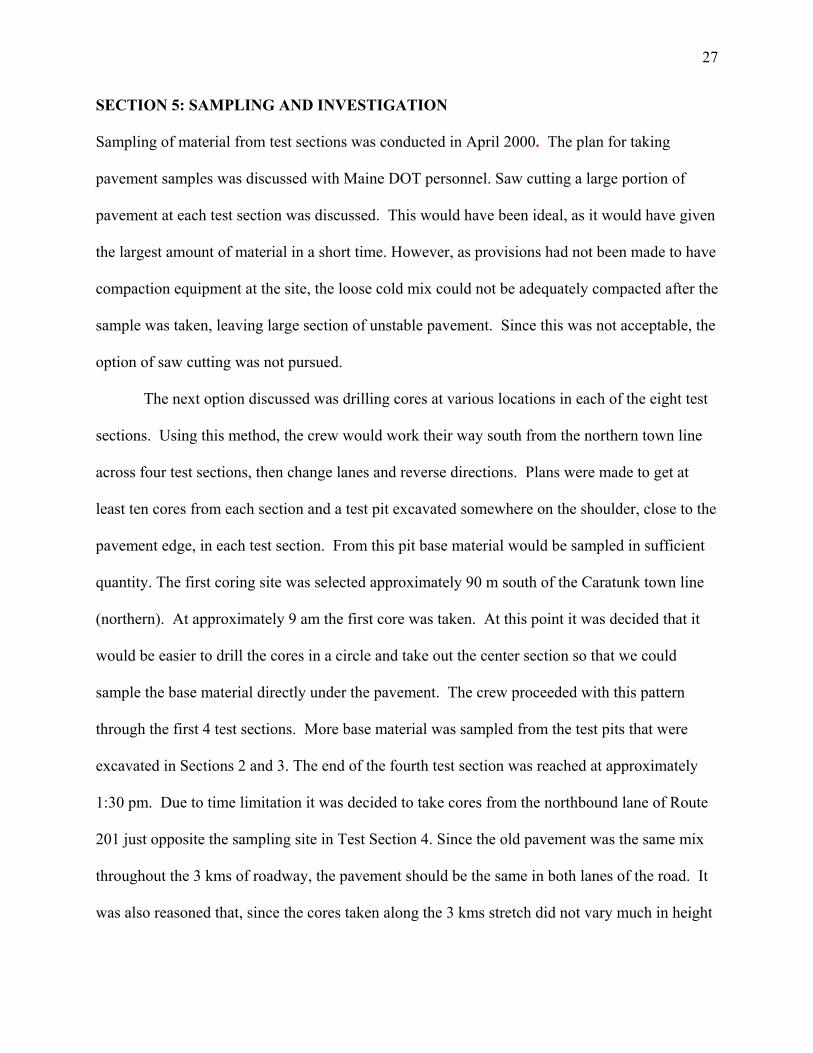
SECTION 5: SAMPLING AND INVESTIGATION
Sampling of material from test sections was conducted in April 2000. The plan for taking
pavement samples was discussed with Maine DOT personnel. Saw cutting a large portion of
pavement at each test section was discussed. This would have been ideal, as it would have given
the largest amount of material in a short time. However, as provisions had not been made to have
compaction equipment at the site, the loose cold mix could not be adequately compacted after the
sample was taken, leaving large section of unstable pavement. Since this was not acceptable, the
option of saw cutting was not pursued.
The next option discussed was drilling cores at various locations in each of the eight test
sections. Using this method, the crew would work their way south from the northern town line
across four test sections, then change lanes and reverse directions. Plans were made to get at
least ten cores from each section and a test pit excavated somewhere on the shoulder, close to the
pavement edge, in each test section. From this pit base material would be sampled in sufficient
quantity. The first coring site was selected approximately 90 m south of the Caratunk town line
(northern). At approximately 9 am the first core was taken. At this point it was decided that it
would be easier to drill the cores in a circle and take out the center section so that we could
sample the base material directly under the pavement. The crew proceeded with this pattern
through the first 4 test sections. More base material was sampled from the test pits that were
excavated in Sections 2 and 3. The end of the fourth test section was reached at approximately
1:30 pm. Due to time limitation it was decided to take cores from the northbound lane of Route
201 just opposite the sampling site in Test Section 4. Since the old pavement was the same mix
throughout the 3 kms of roadway, the pavement should be the same in both lanes of the road. It
was also reasoned that, since the cores taken along the 3 kms stretch did not vary much in height
28
(most of the samples were approximately 110-115 mm tall, and the top 25mm or so being a layer
of “maintenance mix”) that it would make sense to take the remaining samples from one
location.
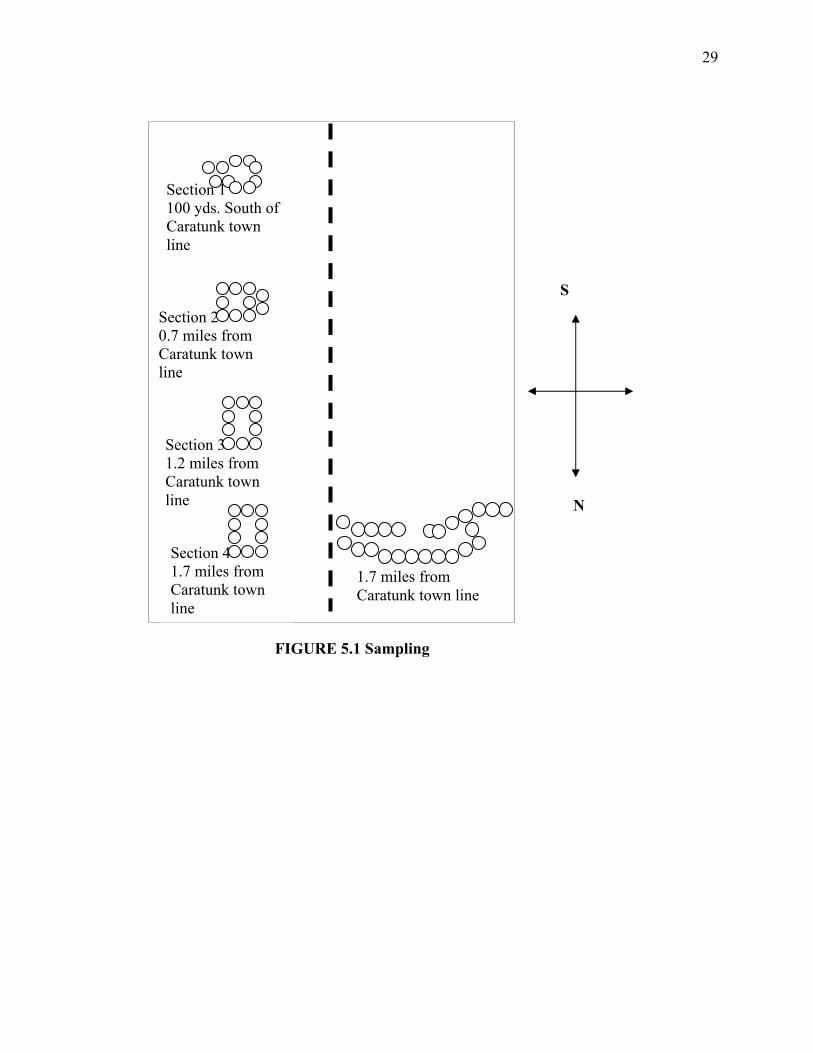
In order to evaluate the pavement condition across the mat, cores were taken in a line
from the centerline to the shoulder in two rows, and after removing the remaining pavement to
make a crude trench in the lane. No test pit was excavated at this site. The sampling plan is
shown in Figure 5.1
A search of records for the existing pavement indicated that prior to 1964 there was
approximately 300 mm of gravel with 25-50 mm surface treatment (tar). In 1964 the section of
roadway was rebuilt using 625 inches gravel base and 75 mm HMA. In 1991 a 19 mm
maintenance mulch was applied.
29
Section 4 1.7 miles from Caratunk town line
FIGURE 5.1 Sampling
Section 3 1.2 miles from Caratunk town line
Section 2 0.7 miles from Caratunk town line
Section 1 100 yds. South of Caratunk town line
S
N
1.7 miles from Caratunk town line
30
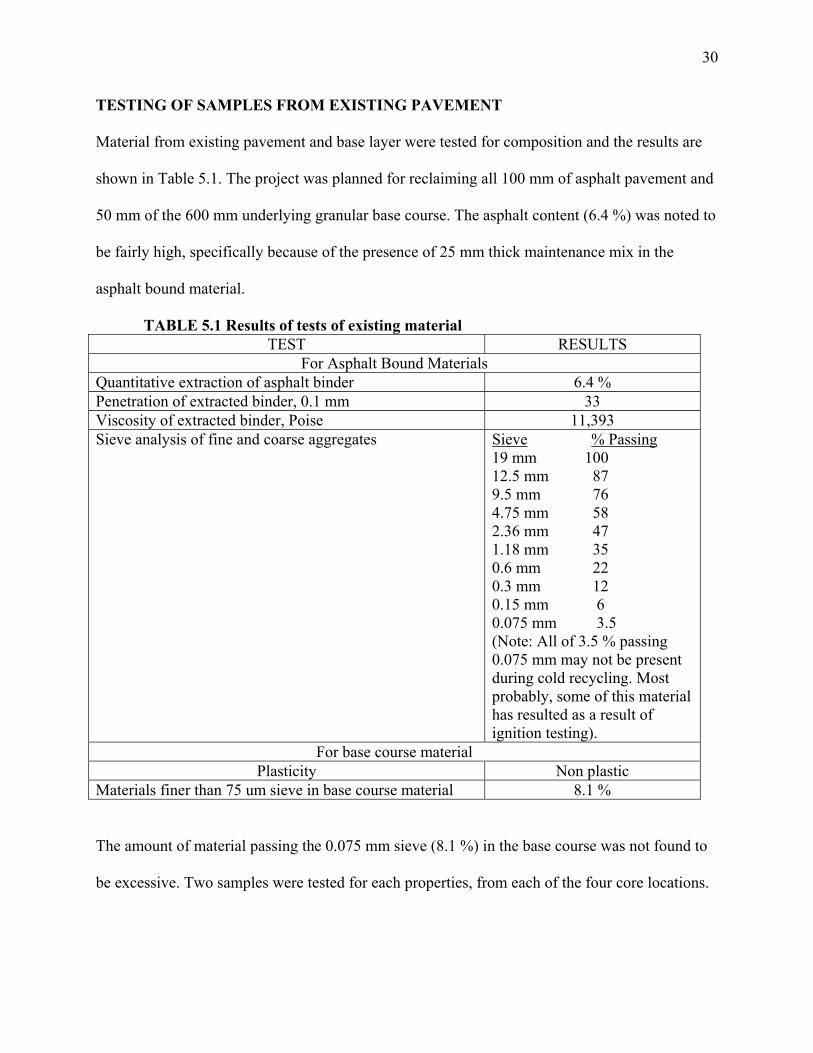
TESTING OF SAMPLES FROM EXISTING PAVEMENT
Material from existing pavement and base layer were tested for composition and the results are
shown in Table 5.1. The project was planned for reclaiming all 100 mm of asphalt pavement and
50 mm of the 600 mm underlying granular base course. The asphalt content (6.4 %) was noted to
be fairly high, specifically because of the presence of 25 mm thick maintenance mix in the
asphalt bound material.
TABLE 5.1 Results of tests of existing material TEST RESULTS
For Asphalt Bound Materials Quantitative extraction of asphalt binder 6.4 % Penetration of extracted binder, 0.1 mm 33 Viscosity of extracted binder, Poise 11,393 Sieve analysis of fine and coarse aggregates Sieve % Passing
19 mm 100 12.5 mm 87 9.5 mm 76 4.75 mm 58 2.36 mm 47 1.18 mm 35 0.6 mm 22 0.3 mm 12 0.15 mm 6 0.075 mm 3.5 (Note: All of 3.5 % passing 0.075 mm may not be present during cold recycling. Most probably, some of this material has resulted as a result of ignition testing).
For base course material Plasticity Non plastic
Materials finer than 75 um sieve in base course material 8.1 %
The amount of material passing the 0.075 mm sieve (8.1 %) in the base course was not found to
be excessive. Two samples were tested for each properties, from each of the four core locations.

31
The material from both asphalt bound material as well as the base course from the different
sections was found to be essentially identical in composition.
Falling weight deflectometer (FWD) results showed that the structural strength of the
pavement in different existing sections did not differ significantly.
32
SECTION 6: INITIAL MIX DESIGN
Selection of additives
Based on the evaluation of existing materials, specifically, the percentage of material passing the
0.075 mm sieve, a MS2 emulsion was recommended.
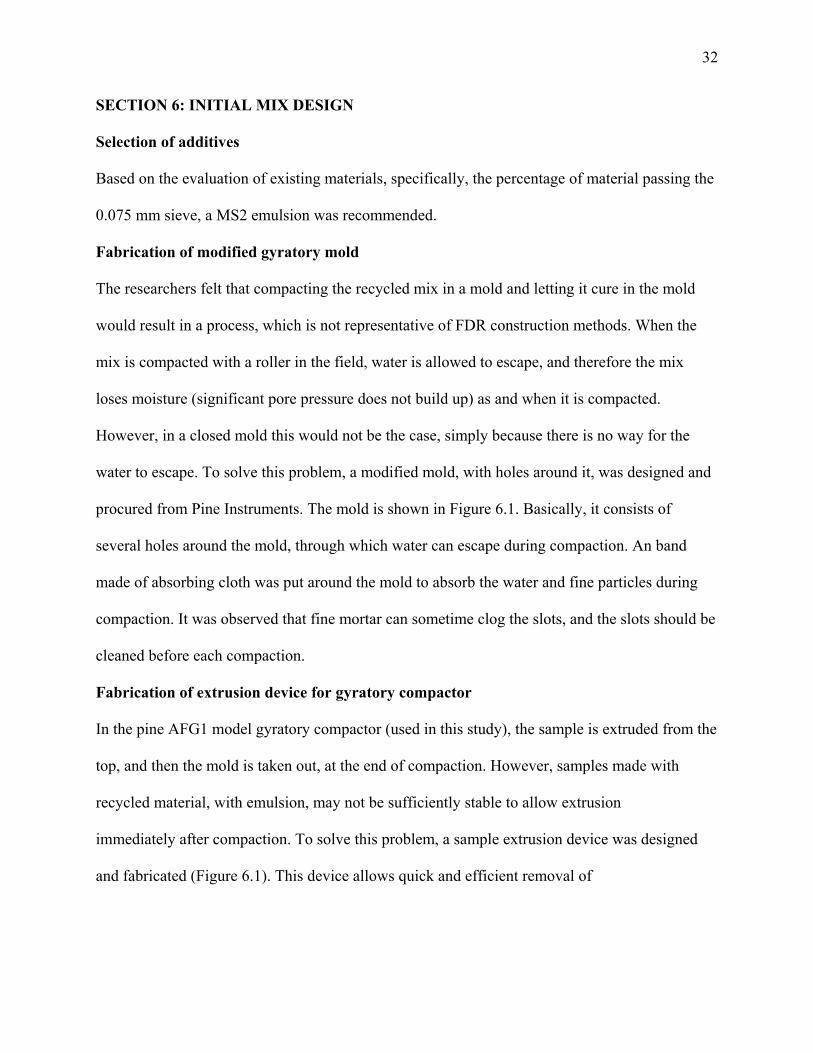
Fabrication of modified gyratory mold
The researchers felt that compacting the recycled mix in a mold and letting it cure in the mold
would result in a process, which is not representative of FDR construction methods. When the
mix is compacted with a roller in the field, water is allowed to escape, and therefore the mix
loses moisture (significant pore pressure does not build up) as and when it is compacted.
However, in a closed mold this would not be the case, simply because there is no way for the
water to escape. To solve this problem, a modified mold, with holes around it, was designed and
procured from Pine Instruments. The mold is shown in Figure 6.1. Basically, it consists of
several holes around the mold, through which water can escape during compaction. An band
made of absorbing cloth was put around the mold to absorb the water and fine particles during
compaction. It was observed that fine mortar can sometime clog the slots, and the slots should be
cleaned before each compaction.
Fabrication of extrusion device for gyratory compactor
In the pine AFG1 model gyratory compactor (used in this study), the sample is extruded from the
top, and then the mold is taken out, at the end of compaction. However, samples made with
recycled material, with emulsion, may not be sufficiently stable to allow extrusion
immediately after compaction. To solve this problem, a sample extrusion device was designed
and fabricated (Figure 6.1). This device allows quick and efficient removal of
33
FIGURE 6.1 a) Slotted mold, b) cloth around slotted mold, c) extrusion device used for taking samples out, d) transferring sample with extrusion device.
(d) (c)
(b) (a)
34
specimen from the compactor immediately after compaction. However, such a device is not
needed for gyratory compactors, which allows removal of the sample inside the mold.
Mix design using the Superpave Gyratory Compactor
Mix design for water and emulsion samples were conducted in the laboratory using a Superpave
gyratory compactor. Since the mix design was intended to follow current construction practice as
closely as possible, and currently in FDR projects in Maine no water is added separately before
reclamation, it was decided that no additional water would be added other than that contained in
the emulsion. However, it was decided that sufficient water must be added to bring the moisture
content up to a level of natural moisture content. The existing moisture content of the base
course material was found to be 6 %. Since base course and asphalt bound materials were used at
1:2 ratio, 2 % water (of the base course-asphalt mix combination) was added to the base course
material, and covered with the asphalt material in gallon cans.
Design of water mixes
For water mix samples, water was added at 4, 6, 8, 10 and 12 percent. At 12 percent level water
was found to be draining out from the mold, and the sample lost a significant amount of water
during compaction. Hence, the 12 percent water mixes were not considered for further testing.
The samples were mixed with hand for two minutes. No precompaction curing was done for
water mix samples. The samples were compacted to 75 gyrations. The compacted samples were
tested for bulk specific gravity and transferred to ovens maintained at 40oC for post compaction
curing.
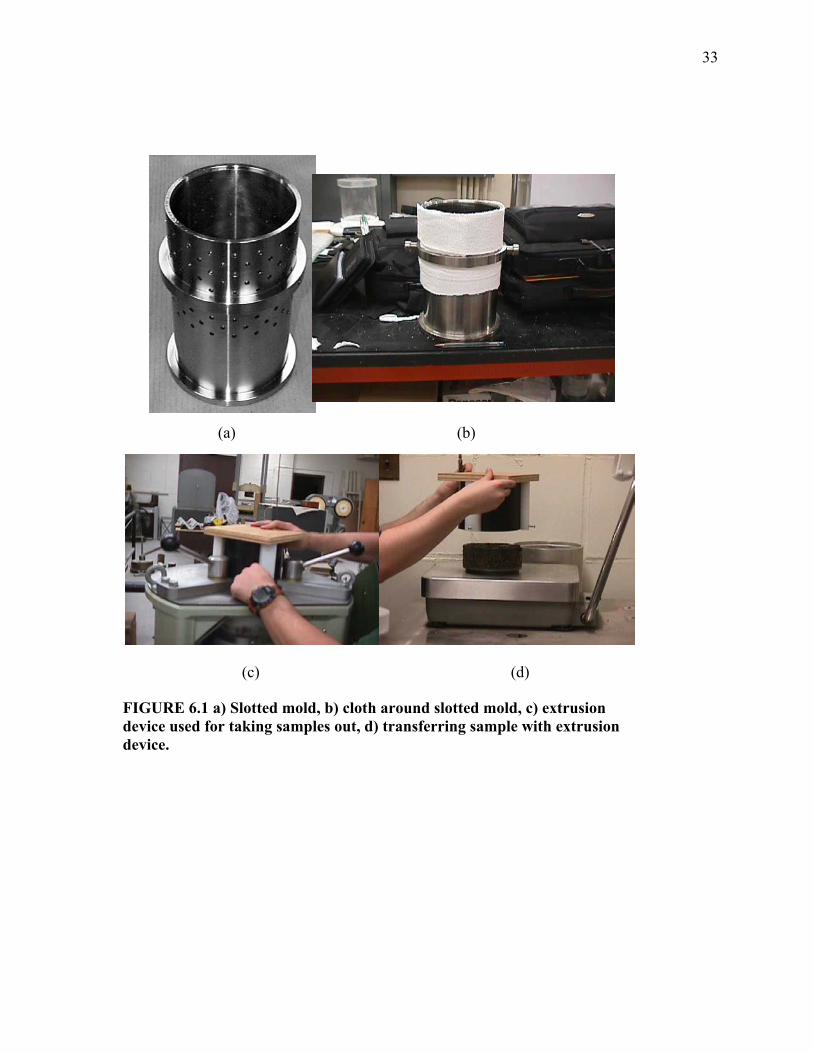
Samples were taken out after every 24 hours for 6 days and tested for mass and resilient
modulus. At the end of 6 days the mass was found to level off. The samples were kept in the
oven for another day to ensure complete removal of moisture, and then taken out on the 7th day
35
for testing for resilient modulus and indirect tensile strength. Figure 6.2 shows the plot of dry
density and resilient modulus of mixes with different percentage of water. It can be observed that
the dry density shows a peak at 2047.7 kg/m3 for approximately 6 % of water. The resilient
modulus values at 7 days peak at 2000 MPa at a water content of approximately 7 %, which is
very close to the optimum water content obtained for dry density.
Water, 75 gyration samples
1.850
1.900
1.950
2.000
2.050
2.100
2.150
0 2 4 6 8 10 12Total Fluid Content, %
Dry
Den
sity
, gm
/cc
0
500
1000
1500
2000
2500
Res
ilien
t Mod
ulus
, MPa
dry density, 75 gyration Modulus, 168 hours
Poly. (Modulus, 168 hours) Poly. (dry density, 75 gyration)
FIGURE 6.2 Plot of dry density and resilient modulus versus total fluid content (water mixes) Note: Multiply densities by 1000 to get densities in Kg/m3
36
Based on the results of this initial mix design, water content of 7 % was recommended. This
percentage was close to what is typically used for reclaiming similar mixes by Maine DOT.
Emulsion mixes
As in the case of the water mix samples, the mix batches were mixed with 2 % water, before
adding emulsion, and then mixes were prepared with 1, 3, 5 and 7 % of a MS-2 emulsion (with
70 percent residual asphalt content). The samples were mixed with hand for two minutes and
visual evaluation of coating was made after every mixing. It was determined during mixing that
with the level of water used in this study, 1 % emulsion was too low, 3 % was on the lower side,
and 5 % gave good coating. The samples were tested for bulk specific gravity and then
transferred to an oven maintained at 40oC for post compaction curing. The samples were taken
out at every 24 hours and tested for mass and resilient modulus. At the end of 10-day curing
period the samples were tested for resilient modulus and indirect tensile strength.
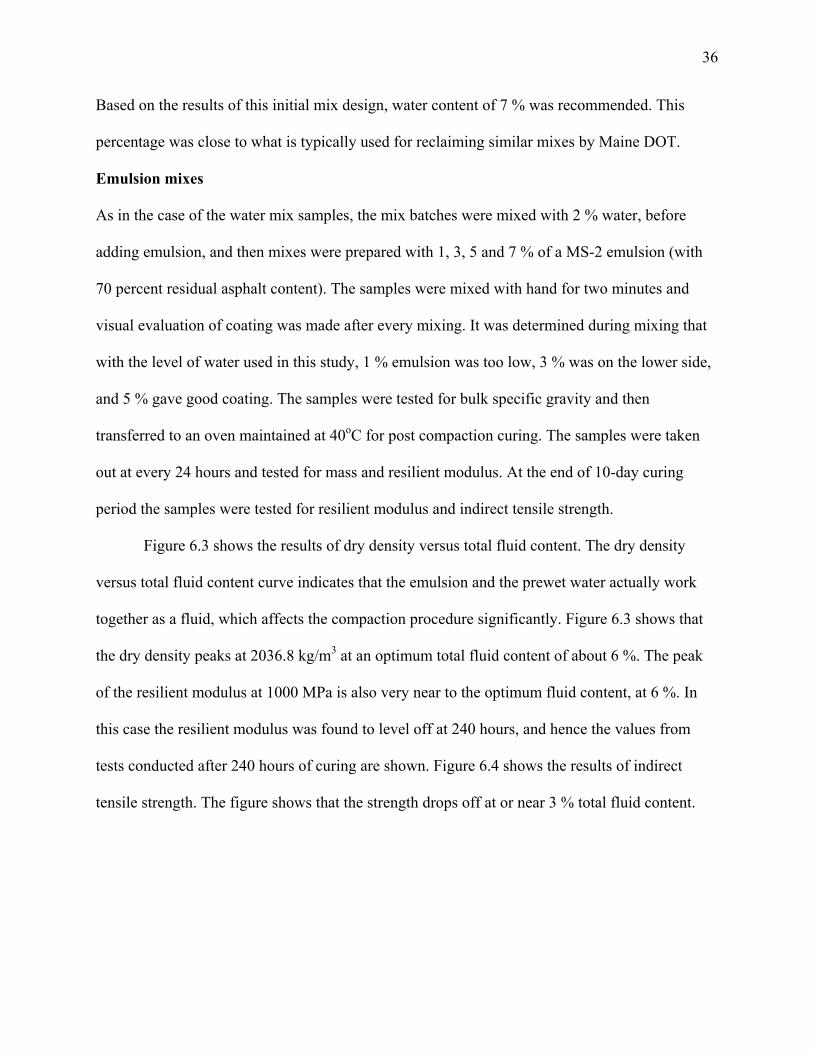
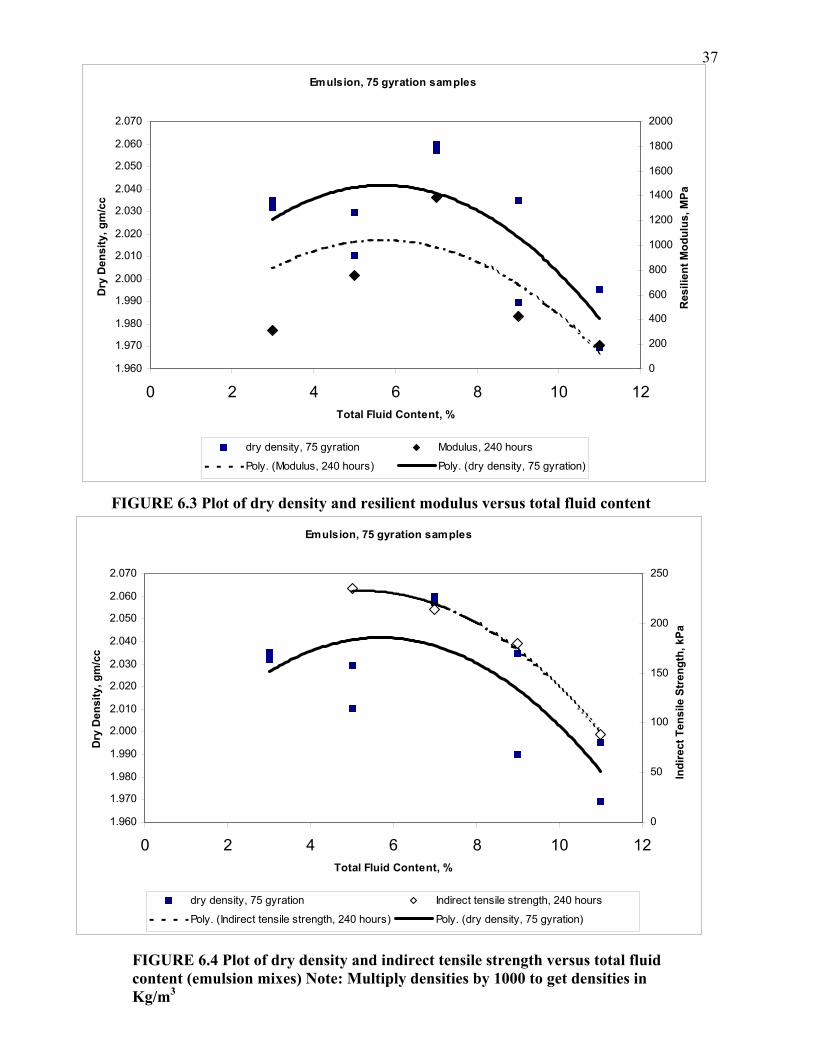
Figure 6.3 shows the results of dry density versus total fluid content. The dry density
versus total fluid content curve indicates that the emulsion and the prewet water actually work
together as a fluid, which affects the compaction procedure significantly. Figure 6.3 shows that
the dry density peaks at 2036.8 kg/m3 at an optimum total fluid content of about 6 %. The peak
of the resilient modulus at 1000 MPa is also very near to the optimum fluid content, at 6 %. In
this case the resilient modulus was found to level off at 240 hours, and hence the values from
tests conducted after 240 hours of curing are shown. Figure 6.4 shows the results of indirect
tensile strength. The figure shows that the strength drops off at or near 3 % total fluid content.
37Emulsion, 75 gyration samples
1.960
1.970
1.980
1.990
2.000
2.010
2.020
2.030
2.040
2.050
2.060
2.070
0 2 4 6 8 10 12Total Fluid Content, %
Dry
Den
sity
, gm
/cc
0
200
400
600
800
1000
1200
1400
1600
1800
2000
Res
ilien
t Mod
ulus
, MPa
dry density, 75 gyration Modulus, 240 hours
Poly. (Modulus, 240 hours) Poly. (dry density, 75 gyration)
Emulsion, 75 gyration samples
1.960
1.970
1.980
1.990
2.000
2.010
2.020
2.030
2.040
2.050
2.060
2.070
0 2 4 6 8 10 12Total Fluid Content, %
Dry
Den
sity
, gm
/cc
0
50
100
150
200
250
Indi
rect
Ten
sile
Str
engt
h, k
Pa
dry density, 75 gyration Indirect tensile strength, 240 hours
Poly. (Indirect tensile strength, 240 hours) Poly. (dry density, 75 gyration)
FIGURE 6.3 Plot of dry density and resilient modulus versus total fluid content
FIGURE 6.4 Plot of dry density and indirect tensile strength versus total fluid content (emulsion mixes) Note: Multiply densities by 1000 to get densities in Kg/m3
38
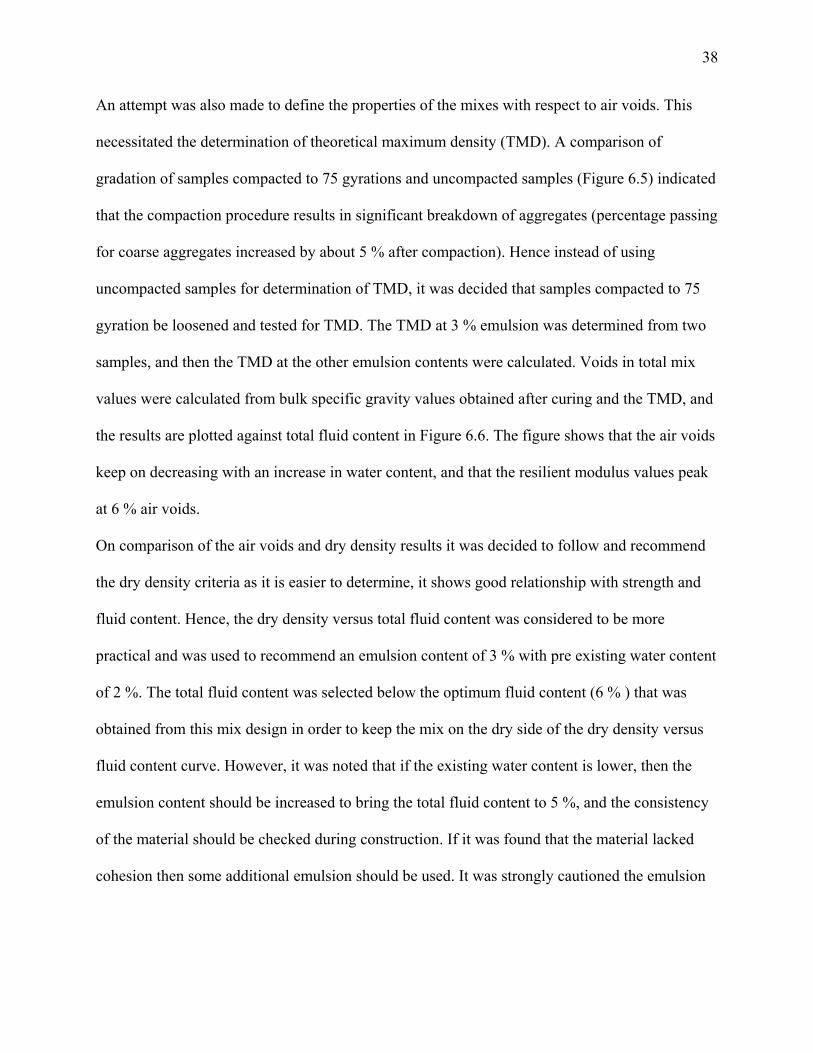
An attempt was also made to define the properties of the mixes with respect to air voids. This
necessitated the determination of theoretical maximum density (TMD). A comparison of
gradation of samples compacted to 75 gyrations and uncompacted samples (Figure 6.5) indicated
that the compaction procedure results in significant breakdown of aggregates (percentage passing
for coarse aggregates increased by about 5 % after compaction). Hence instead of using
uncompacted samples for determination of TMD, it was decided that samples compacted to 75
gyration be loosened and tested for TMD. The TMD at 3 % emulsion was determined from two
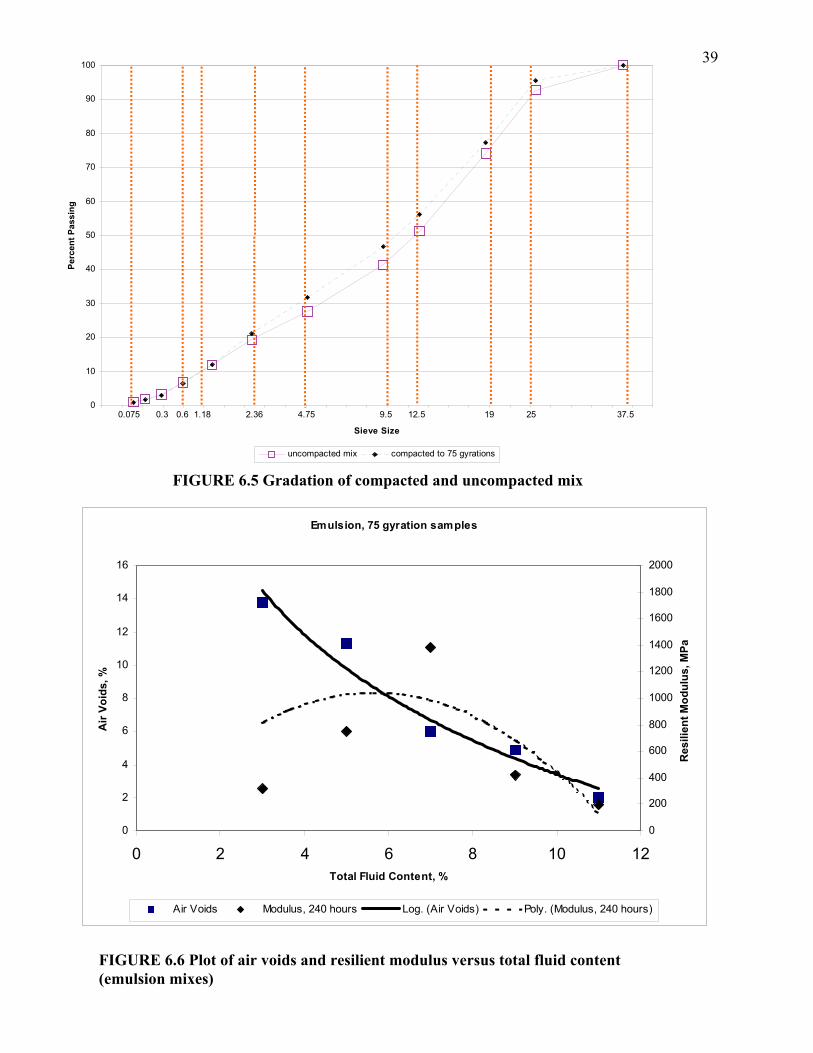
samples, and then the TMD at the other emulsion contents were calculated. Voids in total mix
values were calculated from bulk specific gravity values obtained after curing and the TMD, and
the results are plotted against total fluid content in Figure 6.6. The figure shows that the air voids
keep on decreasing with an increase in water content, and that the resilient modulus values peak
at 6 % air voids.
On comparison of the air voids and dry density results it was decided to follow and recommend
the dry density criteria as it is easier to determine, it shows good relationship with strength and
fluid content. Hence, the dry density versus total fluid content was considered to be more
practical and was used to recommend an emulsion content of 3 % with pre existing water content
of 2 %. The total fluid content was selected below the optimum fluid content (6 % ) that was
obtained from this mix design in order to keep the mix on the dry side of the dry density versus
fluid content curve. However, it was noted that if the existing water content is lower, then the
emulsion content should be increased to bring the total fluid content to 5 %, and the consistency
of the material should be checked during construction. If it was found that the material lacked
cohesion then some additional emulsion should be used. It was strongly cautioned the emulsion
39
Emulsion, 75 gyration samples
0
2
4
6
8
10
12
14
16
0 2 4 6 8 10 12Total Fluid Content, %
Air
Void
s, %
0
200
400
600
800
1000
1200
1400
1600
1800
2000
Res
ilien
t Mod
ulus
, MPa
Air Voids Modulus, 240 hours Log. (Air Voids) Poly. (Modulus, 240 hours)
0
10
20
30
40
50
60
70
80
90
100
0 0.2 0.4 0.6 0.8 1 1.2 1.4 1.6 1.8 2 2.2 2.4 2.6 2.8 3 3.2 3.4 3.6 3.8 4 4.2 4.4 4.6 4.8 5 5.2 5.4
Sieve Size
Perc
ent P
assi
ng
uncompacted mix compacted to 75 gyrations
0.075 0.3 0.6 1.18 2.36 4.75 9.5 12.5 19 25 37.5
FIGURE 6.5 Gradation of compacted and uncompacted mix
FIGURE 6.6 Plot of air voids and resilient modulus versus total fluid content (emulsion mixes)
40
be added carefully and too much emulsion should be avoided, since a higher than needed
emulsion can cause problems during compaction and may result in low mix strength.
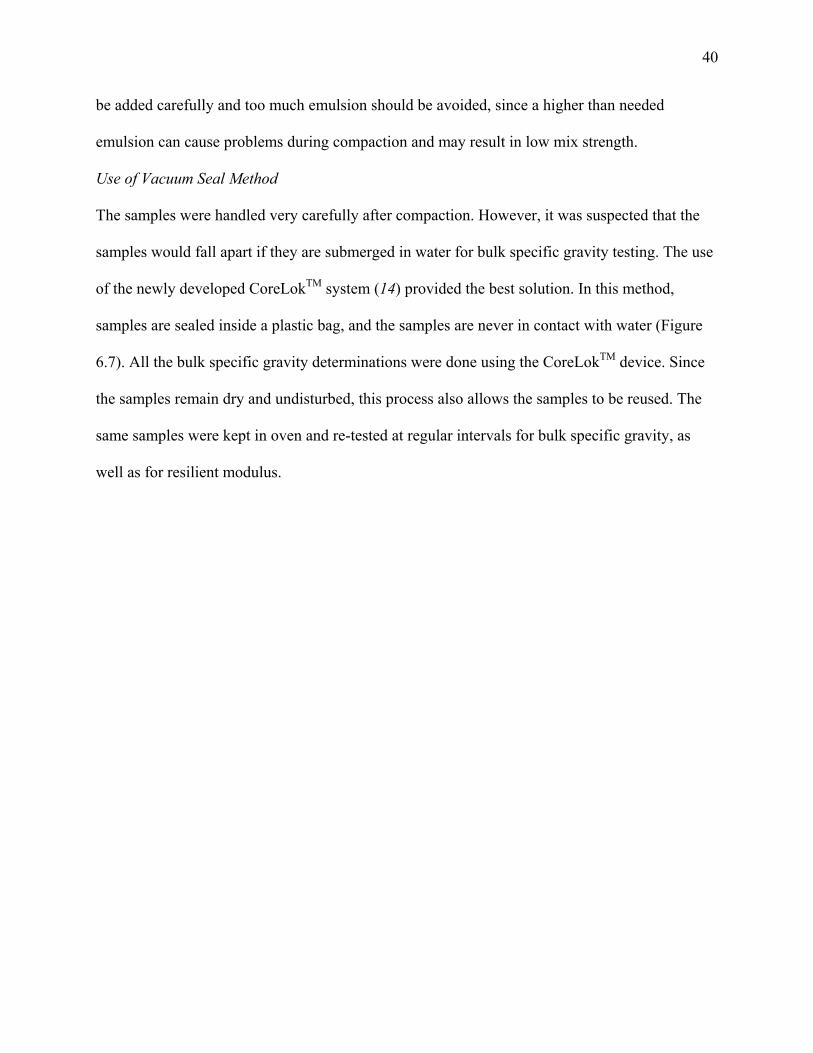
Use of Vacuum Seal Method
The samples were handled very carefully after compaction. However, it was suspected that the
samples would fall apart if they are submerged in water for bulk specific gravity testing. The use
of the newly developed CoreLokTM system (14) provided the best solution. In this method,
samples are sealed inside a plastic bag, and the samples are never in contact with water (Figure
6.7). All the bulk specific gravity determinations were done using the CoreLokTM device. Since
the samples remain dry and undisturbed, this process also allows the samples to be reused. The
same samples were kept in oven and re-tested at regular intervals for bulk specific gravity, as
well as for resilient modulus.
41
FIGURE 6.7 Use of CoreLokTM (a) sample in bag, (b) CoreLokTM device, (c) sample in sealed bag, (d) sample in water inside the sealed bag
(d) (c)
(b) (a)
42
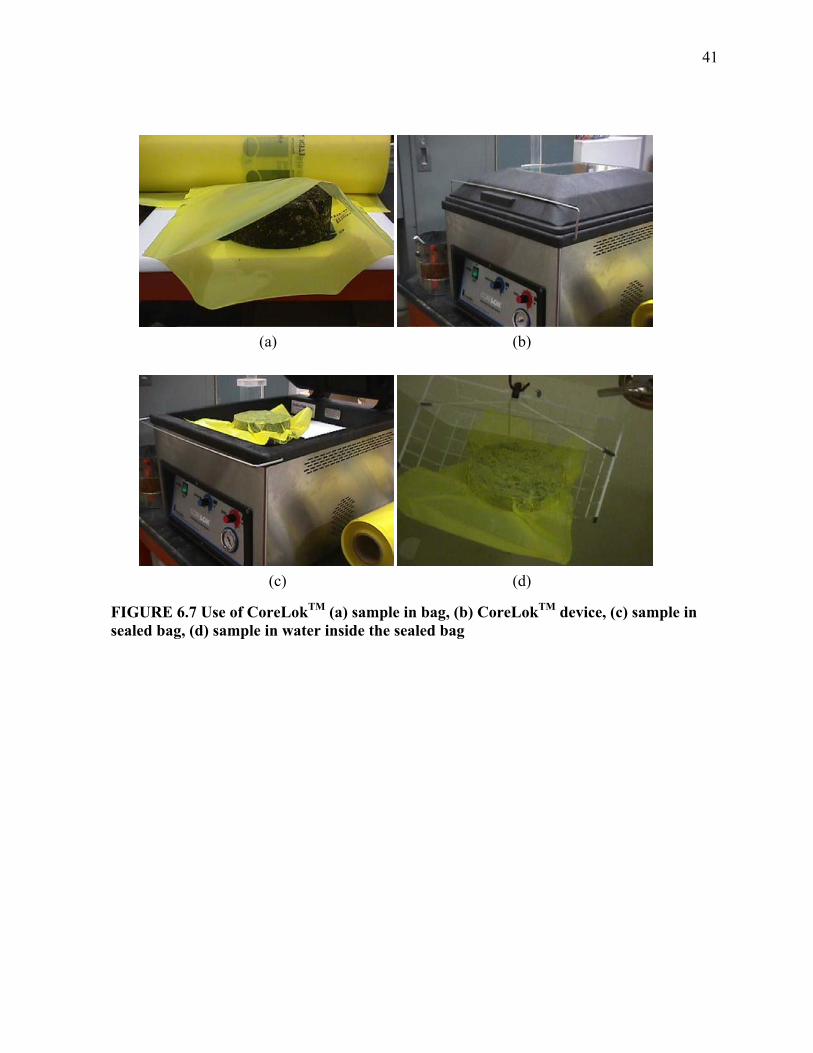
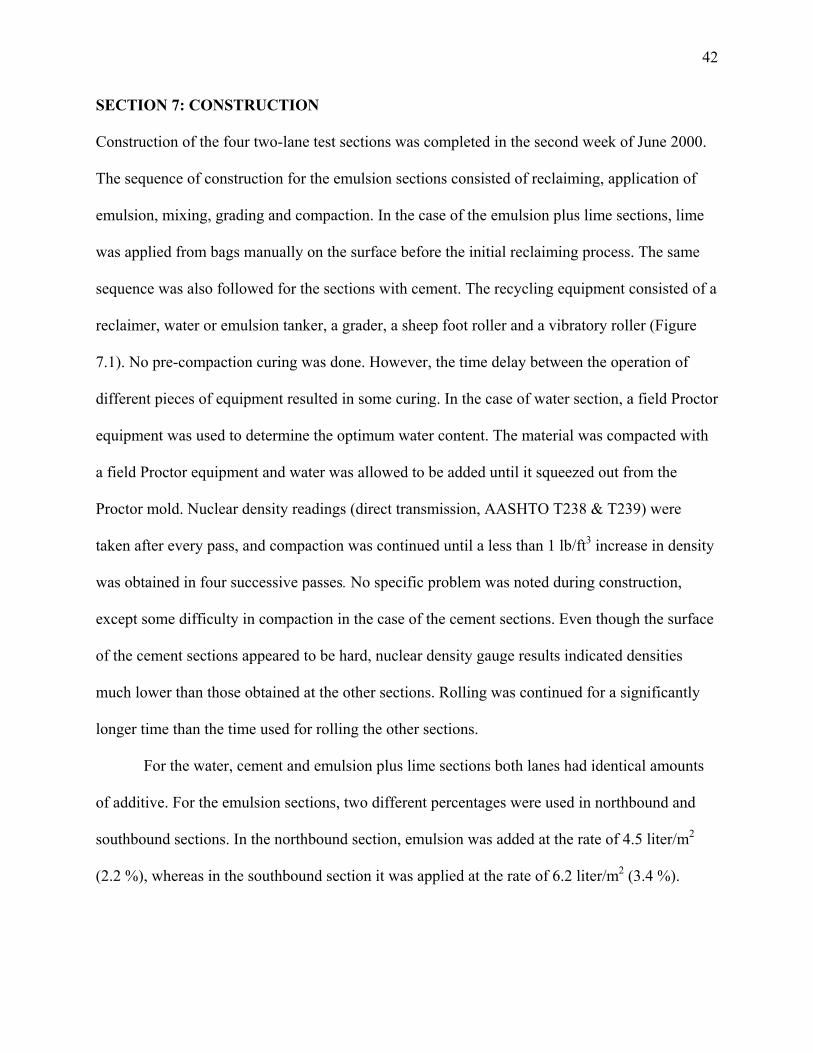
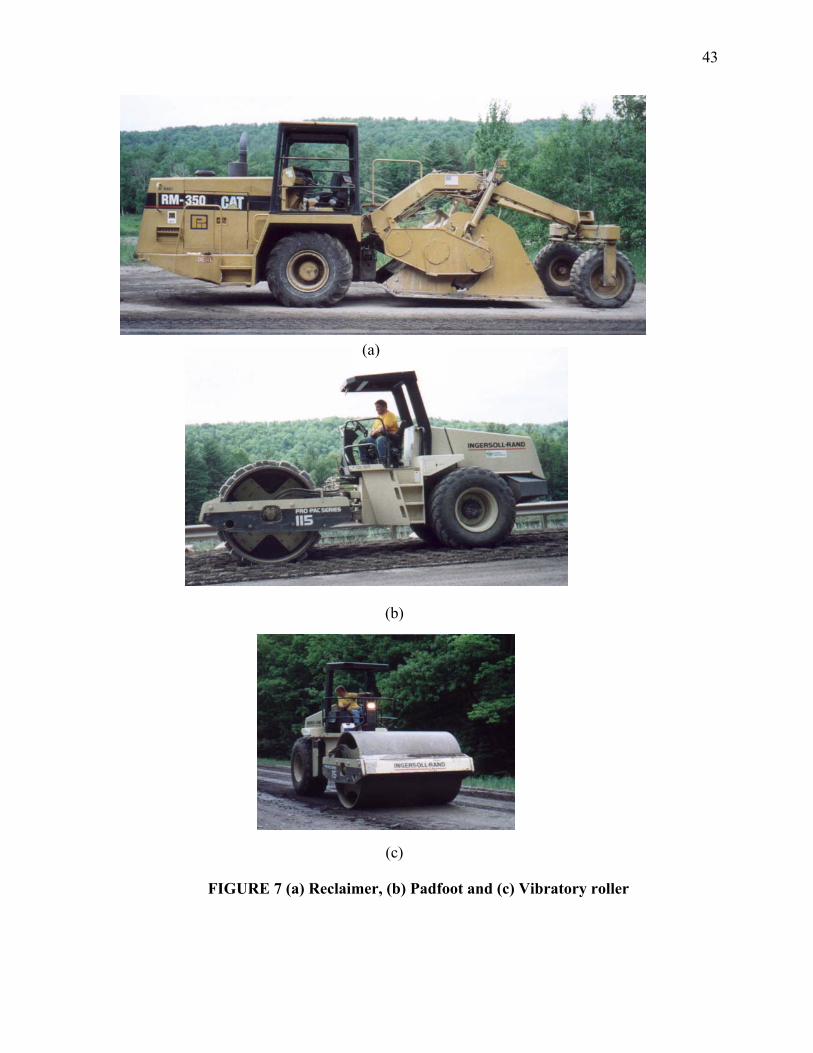
SECTION 7: CONSTRUCTION
Construction of the four two-lane test sections was completed in the second week of June 2000.
The sequence of construction for the emulsion sections consisted of reclaiming, application of
emulsion, mixing, grading and compaction. In the case of the emulsion plus lime sections, lime
was applied from bags manually on the surface before the initial reclaiming process. The same
sequence was also followed for the sections with cement. The recycling equipment consisted of a
reclaimer, water or emulsion tanker, a grader, a sheep foot roller and a vibratory roller (Figure
7.1). No pre-compaction curing was done. However, the time delay between the operation of
different pieces of equipment resulted in some curing. In the case of water section, a field Proctor
equipment was used to determine the optimum water content. The material was compacted with
a field Proctor equipment and water was allowed to be added until it squeezed out from the
Proctor mold. Nuclear density readings (direct transmission, AASHTO T238 & T239) were
taken after every pass, and compaction was continued until a less than 1 lb/ft3 increase in density
was obtained in four successive passes. No specific problem was noted during construction,
except some difficulty in compaction in the case of the cement sections. Even though the surface
of the cement sections appeared to be hard, nuclear density gauge results indicated densities
much lower than those obtained at the other sections. Rolling was continued for a significantly
longer time than the time used for rolling the other sections.
For the water, cement and emulsion plus lime sections both lanes had identical amounts
of additive. For the emulsion sections, two different percentages were used in northbound and
southbound sections. In the northbound section, emulsion was added at the rate of 4.5 liter/m2
(2.2 %), whereas in the southbound section it was applied at the rate of 6.2 liter/m2 (3.4 %).
43
FIGURE 7 (a) Reclaimer, (b) Padfoot and (c) Vibratory roller
(c)
(b)
(a)
44
Since, Maine DOT generally uses an application rate of 4.5 liter/m2 (2.2 %) in similar reclaiming
projects, the northbound section can be considered as a control section. In the Southbound
section, the material was visually evaluated (coating test) after application of emulsion at the rate
of 4.5 liter/m2. On examination it was found that the material lacked sufficient coating and
cohesion. Another liter per square meter was then applied to bring the total percentage up to 3.4
%, which is very close to the recommended percentage of 3 % (3). On examining the material
after the second application, it was found that the material had good coating and cohesion.
At the end of construction, the four test sections were left open to traffic for a period of 7
days before the application of binder (60 mm thick 19 mm nominal maximum aggregate size
Superpave Hot Mix Asphalt) and surface (40 mm thick 12.5 mm nominal maximum aggregate
size Superpave Hot Mix Asphalt) courses.
Before conducting FDR operation, the pavement was tested with a Falling Weight
Deflectometer (FWD) equipment. A JILS 20 Falling Weight Deflectometer equipment was
used. The raw data was used in DarWin 3.01 software to determine subgrade modulus, effective
pavement modulus, and structural number.
45
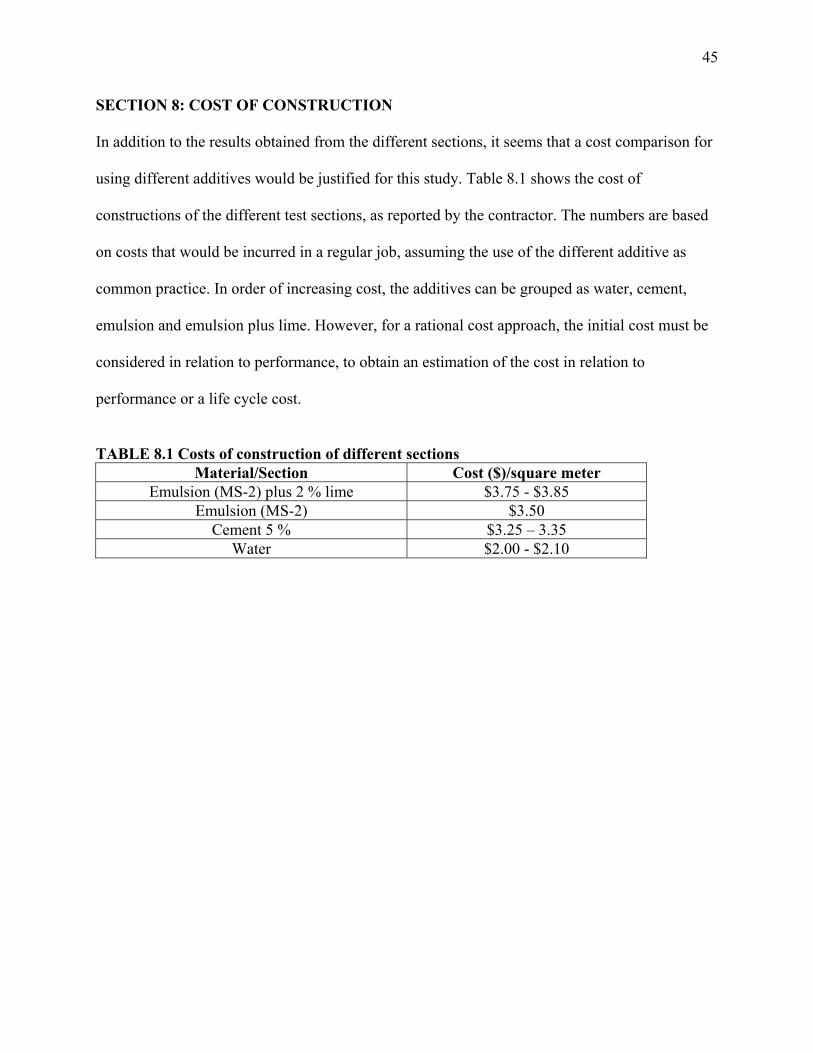
SECTION 8: COST OF CONSTRUCTION
In addition to the results obtained from the different sections, it seems that a cost comparison for
using different additives would be justified for this study. Table 8.1 shows the cost of
constructions of the different test sections, as reported by the contractor. The numbers are based
on costs that would be incurred in a regular job, assuming the use of the different additive as
common practice. In order of increasing cost, the additives can be grouped as water, cement,
emulsion and emulsion plus lime. However, for a rational cost approach, the initial cost must be
considered in relation to performance, to obtain an estimation of the cost in relation to
performance or a life cycle cost.
TABLE 8.1 Costs of construction of different sections
Material/Section Cost ($)/square meter Emulsion (MS-2) plus 2 % lime $3.75 - $3.85
Emulsion (MS-2) $3.50 Cement 5 % $3.25 – 3.35
Water $2.00 - $2.10
46
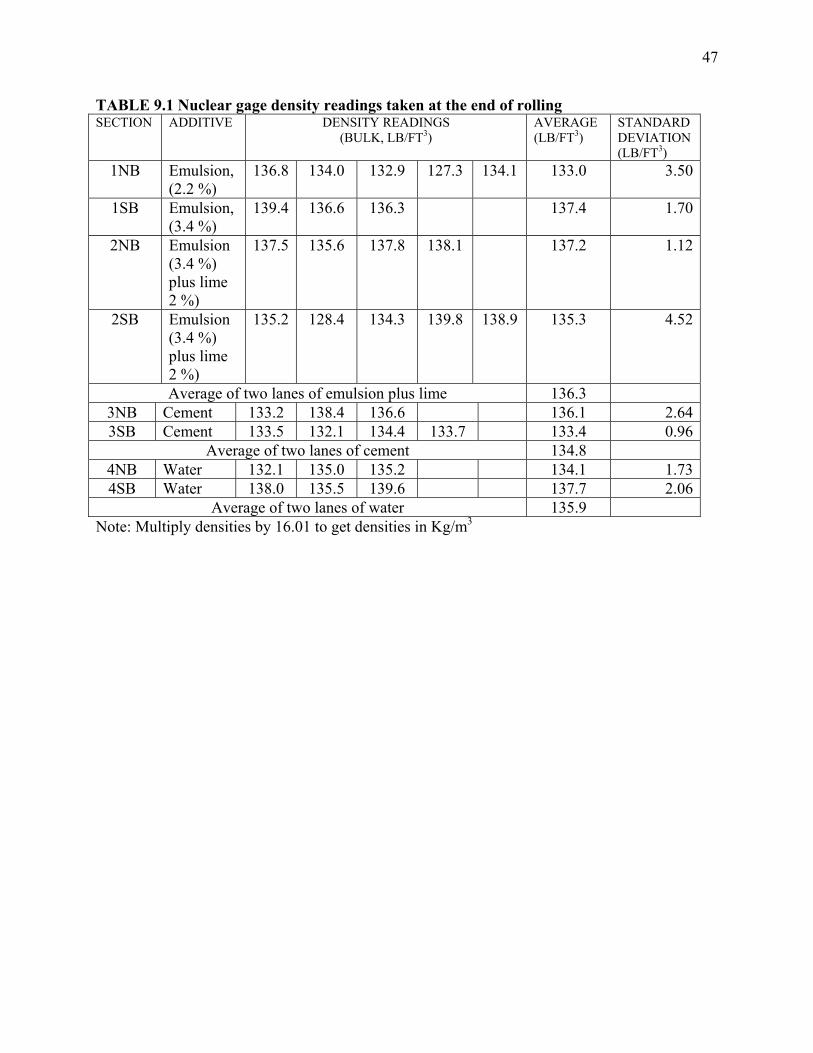
SECTION 9: RESULTS OBTAINED IMMEDIATELY AFTER CONSTRUCTION
During construction of the test sections, a nuclear density gauge was used to record bulk density
of the mat and monitor the increase in density with every pass of the padfoot and the vibratory
roller. A decision to stop compaction was taken when the bulk density leveled off. The level off
densities were noted as the final densities for each test section, at the end of rolling, and are
shown in Table 9.1. The values provide a basis for ranking the different sections according to the
degree of compaction. In order of decreasing average density values, the sections can be ranked
as 3.4 % emulsion, 3.4 % emulsion with lime, water, cement and 2.2 % emulsion. The standard
deviation values ranged from 1.7 in the 3.4 % emulsion section to 3.5 in the 2.2 % emulsion
section. Based on these results it can be concluded that the 3.4 % emulsion section showed a
higher and more uniform density than the section with 2.2 % emulsion.
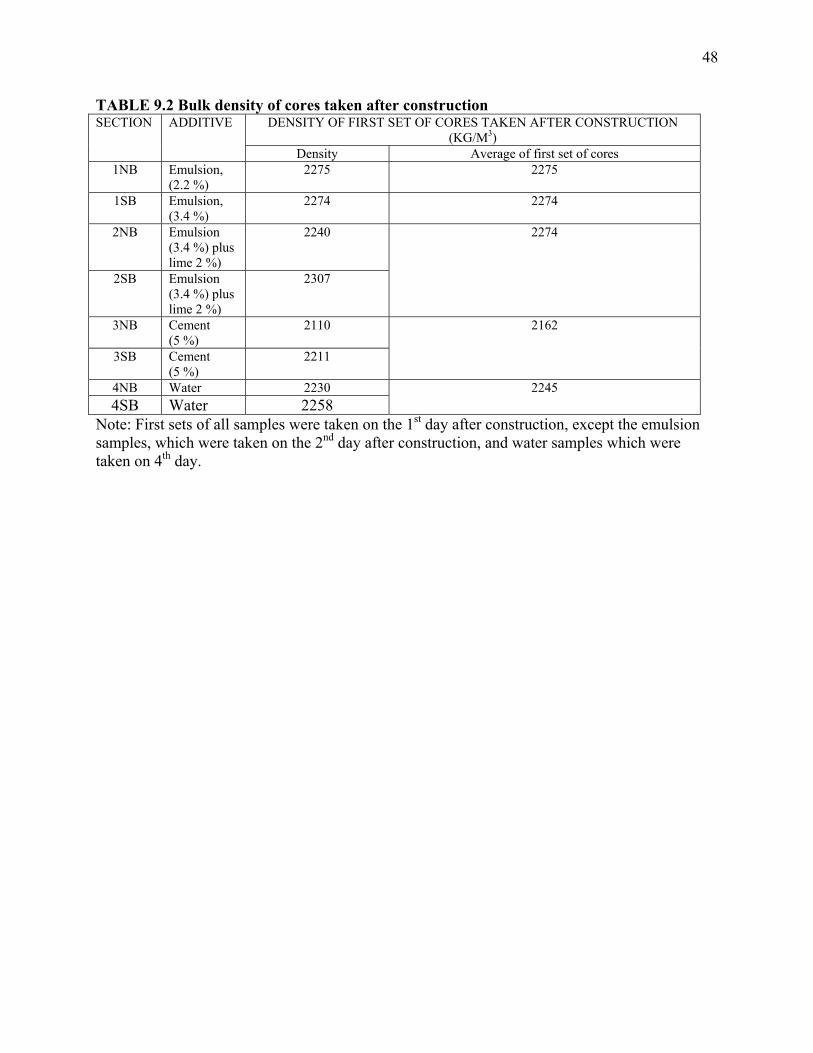
Following construction, cores were obtained from the test sections as soon as it was
possible to obtain intact cores. The first set of cores from the emulsion sections were taken on the
second day after construction, the samples from the emulsion plus lime and cement sections were
taken on the first day, and the samples from the water sections were obtained on the fourth day.
These cores were obtained by dry cutting with a handheld saw. No water was applied at the time
of coring. The cores were kept in sealed plastic bags to prevent any moisture loss. A total of two
cores were taken from each lane. The bulk densities of these cores were determined in the
laboratory, and the average values are shown in Table 9.2. Table 9.2 shows that the emulsion
(both 2.2 and 3.4 %) and the emulsion plus lime samples have similar densities (2275 Kg/m3),
the cement samples have the lowest density (2162 Kg/m3), whereas the water samples have
density in between (2245, Kg/m3).
47
TABLE 9.1 Nuclear gage density readings taken at the end of rolling SECTION ADDITIVE DENSITY READINGS
(BULK, LB/FT3) AVERAGE (LB/FT3)
STANDARD DEVIATION (LB/FT3)
1NB Emulsion, (2.2 %)
136.8 134.0 132.9 127.3 134.1 133.0 3.50
1SB Emulsion, (3.4 %)
139.4 136.6 136.3 137.4 1.70
2NB Emulsion (3.4 %) plus lime 2 %)
137.5 135.6 137.8 138.1 137.2 1.12
2SB Emulsion (3.4 %) plus lime 2 %)
135.2 128.4 134.3 139.8 138.9 135.3 4.52
Average of two lanes of emulsion plus lime 136.3 3NB Cement 133.2 138.4 136.6 136.1 2.643SB Cement 133.5 132.1 134.4 133.7 133.4 0.96
Average of two lanes of cement 134.8 4NB Water 132.1 135.0 135.2 134.1 1.734SB Water 138.0 135.5 139.6 137.7 2.06
Average of two lanes of water 135.9 Note: Multiply densities by 16.01 to get densities in Kg/m3
48
TABLE 9.2 Bulk density of cores taken after construction DENSITY OF FIRST SET OF CORES TAKEN AFTER CONSTRUCTION
(KG/M3) SECTION ADDITIVE
Density Average of first set of cores 1NB Emulsion,
(2.2 %) 2275 2275
1SB Emulsion, (3.4 %)
2274 2274
2NB Emulsion (3.4 %) plus lime 2 %)
2240
2SB Emulsion (3.4 %) plus lime 2 %)
2307
2274
3NB Cement (5 %)
2110
3SB Cement (5 %)
2211
2162
4NB Water 2230 4SB Water 2258
2245
Note: First sets of all samples were taken on the 1st day after construction, except the emulsion samples, which were taken on the 2nd day after construction, and water samples which were taken on 4th day.
49
SECTION 10: DETERMINATION OF APPROPRIATE GYRATION NUMBER AND
CONSTRUCTION DENSITY
Samples of recycled mix must be compacted in the laboratory, using appropriate number of
gyrations (Ndesign) in the laboratory during mix design. In order to determine the appropriate
Ndesign, it is necessary to know the in-place density after sufficient construction and traffic
compaction and how many gyrations produce a similar density. However, at the same time, it is
necessary to fix a compactive effort (Ncomp) in the laboratory - determine a density and then
specify a certain percentage of the density as the required density after compaction. Since for
base course material (for which the FDR is being used) most of the compaction takes place
during compaction rolling and a negligible amount of densification occurs under traffic, the
Ndesign and Ncompaction are the same.
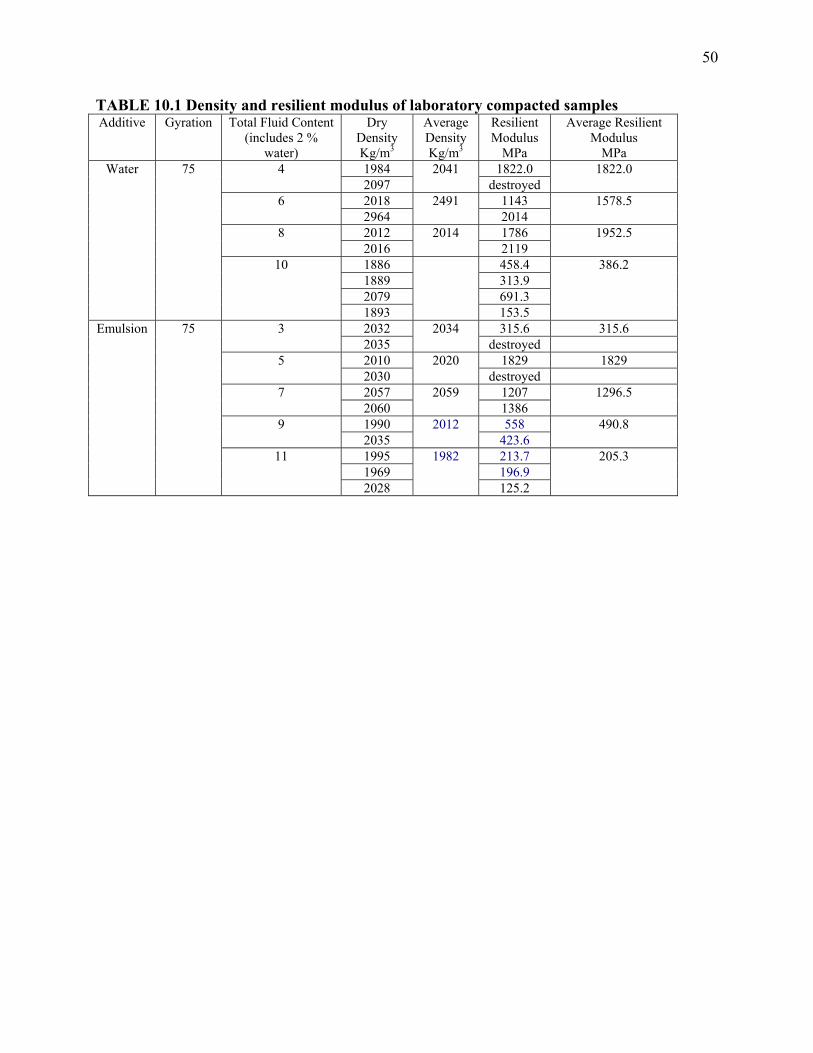
To determine Ndesign/ Ncompaction, two approaches were used. First, mixes were compacted
to 75 gyrations, and optimum fluid contents (for water and emulsion) were determined. Table
10.1 shows the results of this mix design. Dry density values (immediately after compaction) and
resilient modulus (after curing) were evaluated for mixes with different total fluid content, and
the total fluid content that produced the peak density and resilient modulus values were
considered as optimum total fluid contents, as shown earlier (in Initial Mix Design section). The
optimum total fluid content for water was noted to be 7 % and that for the emulsion, between 5
and 6.5 %. Based on these observations, a 7 % water content for water mixes and a 5 % total
fluid content for emulsion mixes (with 3 % emulsion), was recommended for constructing the
test sections.
50
TABLE 10.1 Density and resilient modulus of laboratory compacted samples Additive Gyration Total Fluid Content
(includes 2 % water)
Dry Density Kg/m3
Average Density Kg/m3
Resilient Modulus
MPa
Average Resilient Modulus
MPa 1984 1822.0 4
2097 2041
destroyed 1822.0
2018 1143 6 2964
2491 2014
1578.5
2012 1786 8 2016
2014 2119
1952.5
1886 458.4 1889 313.9 2079 691.3
Water 75
10
1893
153.5
386.2
2032 315.6 315.6 3 2035
2034 destroyed
2010 1829 1829 5 2030
2020 destroyed
2057 1207 7 2060
2059 1386
1296.5
1990 558 9 2035
2012 423.6
490.8
1995 213.7 1969 196.9
Emulsion 75
11
2028
1982
125.2
205.3
51
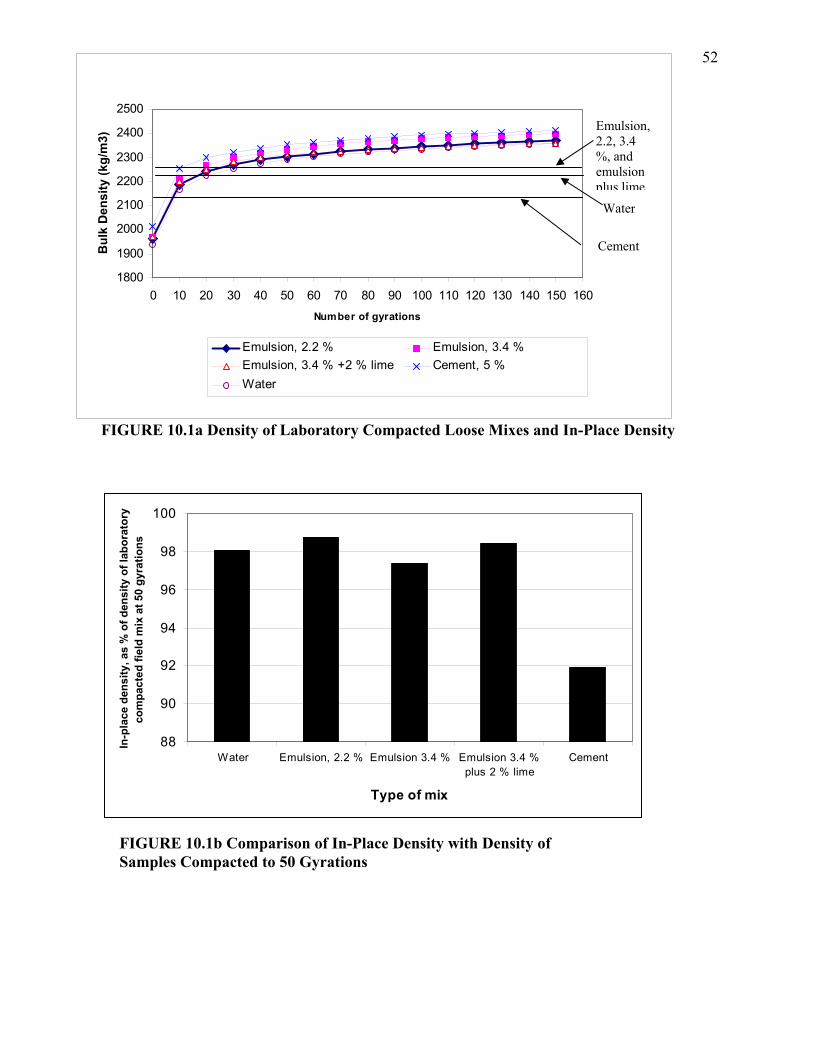
After FDR was conducted using the recommended optimum fluid contents, in-place densities
after compaction rolling was determined from in-place cores (Table 9.2 of RESULTS
OBTAINED IMMEDIATELY AFTER CONSTRUCTION Section). Samples of loose mix were
also obtained during recycling operations. These samples were compacted to 150 gyrations and
the density at each gyration was back calculated from the density of samples obtained at the end
of 150 gyration. The in-place densities (obtained from in-place cores at the end of FDR) were
compared to densities obtained at different gyrations and the gyration that produced similar
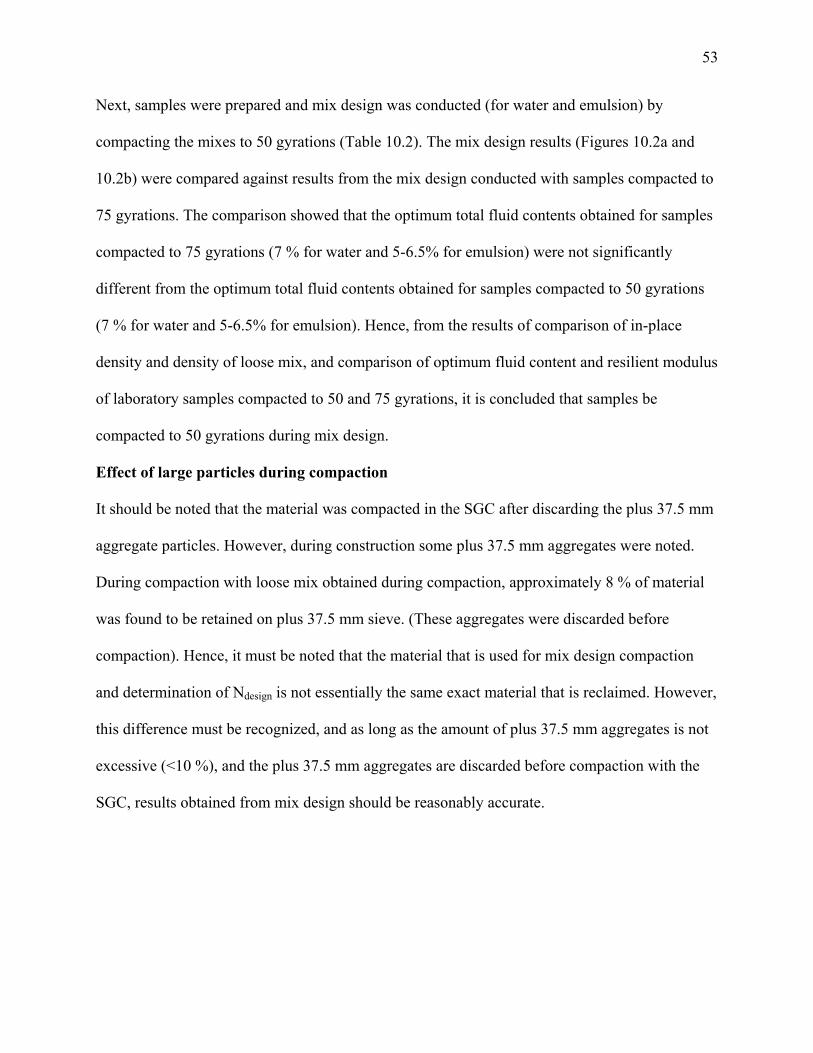
densities were noted (Figure 10.1 a). It was noted that in all the cases the in-place densities were
closer to densities at 50 or lower gyration. For all cases except cement, the in-place densities
were 96-98 % of densities at 50 gyrations. The in-place density for the cement section was at 92
% of the density at 50 gyrations (Figure 10.1b).
52
88
90
92
94
96
98
100
Water Emulsion, 2.2 % Emulsion 3.4 % Emulsion 3.4 %plus 2 % lime
Cement
Type of mix
In-p
lace
den
sity
, as
% o
f den
sity
of l
abor
ator
y co
mpa
cted
fiel
d m
ix a
t 50
gyra
tions
1800
1900
2000
2100
2200
2300
2400
2500
0 10 20 30 40 50 60 70 80 90 100 110 120 130 140 150 160Number of gyrations
Bul
k D
ensi
ty (k
g/m
3)
Emulsion, 2.2 % Emulsion, 3.4 %Emulsion, 3.4 % +2 % lime Cement, 5 %Water
FIGURE 10.1a Density of Laboratory Compacted Loose Mixes and In-Place Density
Cement
Water
Emulsion, 2.2, 3.4 %, and emulsion plus lime
FIGURE 10.1b Comparison of In-Place Density with Density of Samples Compacted to 50 Gyrations
53
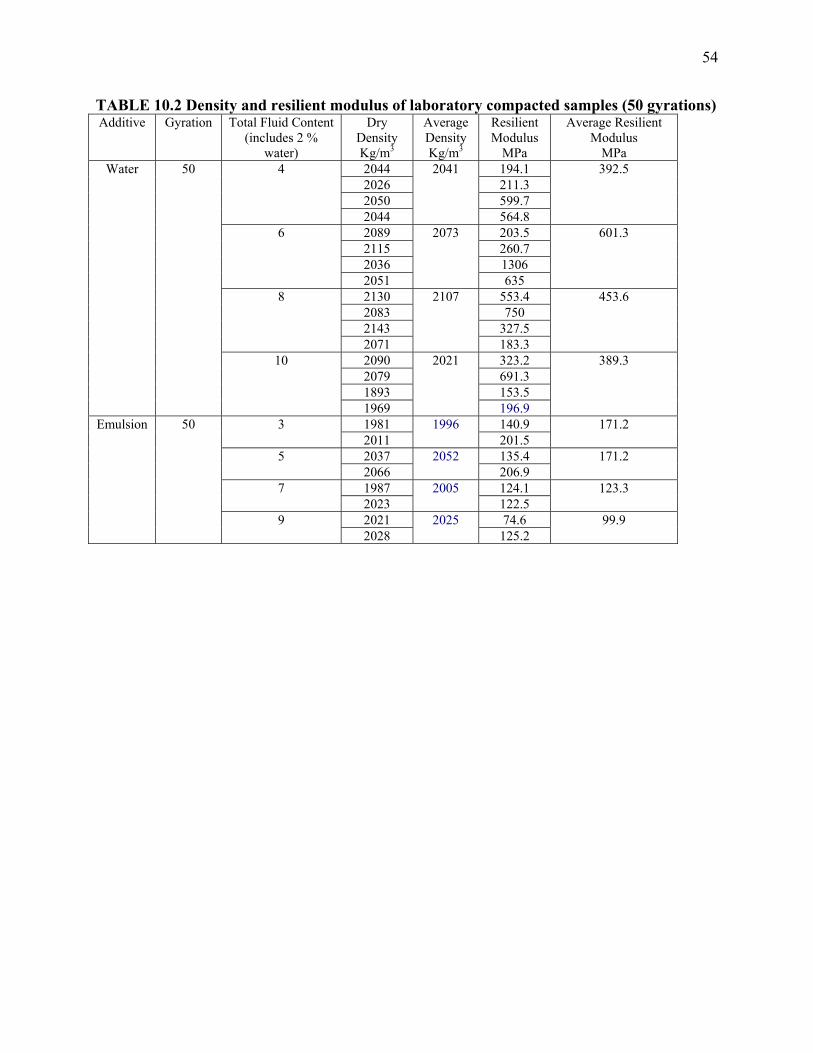
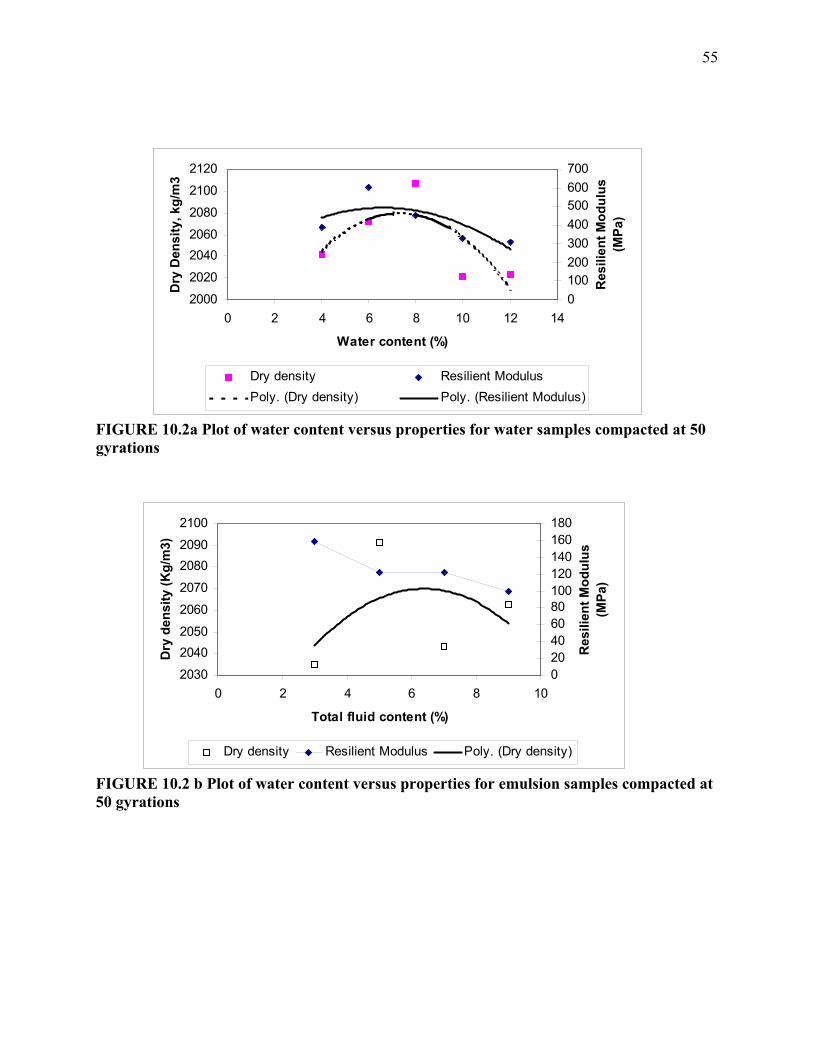
Next, samples were prepared and mix design was conducted (for water and emulsion) by
compacting the mixes to 50 gyrations (Table 10.2). The mix design results (Figures 10.2a and
10.2b) were compared against results from the mix design conducted with samples compacted to
75 gyrations. The comparison showed that the optimum total fluid contents obtained for samples
compacted to 75 gyrations (7 % for water and 5-6.5% for emulsion) were not significantly
different from the optimum total fluid contents obtained for samples compacted to 50 gyrations
(7 % for water and 5-6.5% for emulsion). Hence, from the results of comparison of in-place
density and density of loose mix, and comparison of optimum fluid content and resilient modulus
of laboratory samples compacted to 50 and 75 gyrations, it is concluded that samples be
compacted to 50 gyrations during mix design.
Effect of large particles during compaction
It should be noted that the material was compacted in the SGC after discarding the plus 37.5 mm
aggregate particles. However, during construction some plus 37.5 mm aggregates were noted.
During compaction with loose mix obtained during compaction, approximately 8 % of material
was found to be retained on plus 37.5 mm sieve. (These aggregates were discarded before
compaction). Hence, it must be noted that the material that is used for mix design compaction
and determination of Ndesign is not essentially the same exact material that is reclaimed. However,
this difference must be recognized, and as long as the amount of plus 37.5 mm aggregates is not
excessive (<10 %), and the plus 37.5 mm aggregates are discarded before compaction with the
SGC, results obtained from mix design should be reasonably accurate.
54
TABLE 10.2 Density and resilient modulus of laboratory compacted samples (50 gyrations) Additive Gyration Total Fluid Content
(includes 2 % water)
Dry Density Kg/m3
Average Density Kg/m3
Resilient Modulus
MPa
Average Resilient Modulus
MPa 2044 194.1 2026 211.3 2050 599.7
4
2044
2041
564.8
392.5
2089 203.5 2115 260.7 2036 1306
6
2051
2073
635
601.3
2130 553.4 2083 750 2143 327.5
8
2071
2107
183.3
453.6
2090 323.2 2079 691.3 1893 153.5
Water 50
10
1969
2021
196.9
389.3
1981 140.9 3 2011
1996 201.5
171.2
2037 135.4 5 2066
2052 206.9
171.2
1987 124.1 7 2023
2005 122.5
123.3
2021 74.6
Emulsion 50
9 2028
2025 125.2
99.9
55
2000
2020
20402060
2080
2100
2120
0 2 4 6 8 10 12 14
Water content (%)
Dry
Den
sity
, kg/
m3
0100200300400500600700
Res
ilien
t Mod
ulus
(M
Pa)
Dry density Resilient ModulusPoly. (Dry density) Poly. (Resilient Modulus)
FIGURE 10.2a Plot of water content versus properties for water samples compacted at 50 gyrations
2030
20402050
2060
2070
20802090
2100
0 2 4 6 8 10
Total fluid content (%)
Dry
den
sity
(Kg/
m3)
020406080100120140160180
Res
ilien
t Mod
ulus
(M
Pa)
Dry density Resilient Modulus Poly. (Dry density)
FIGURE 10.2 b Plot of water content versus properties for emulsion samples compacted at 50 gyrations
56
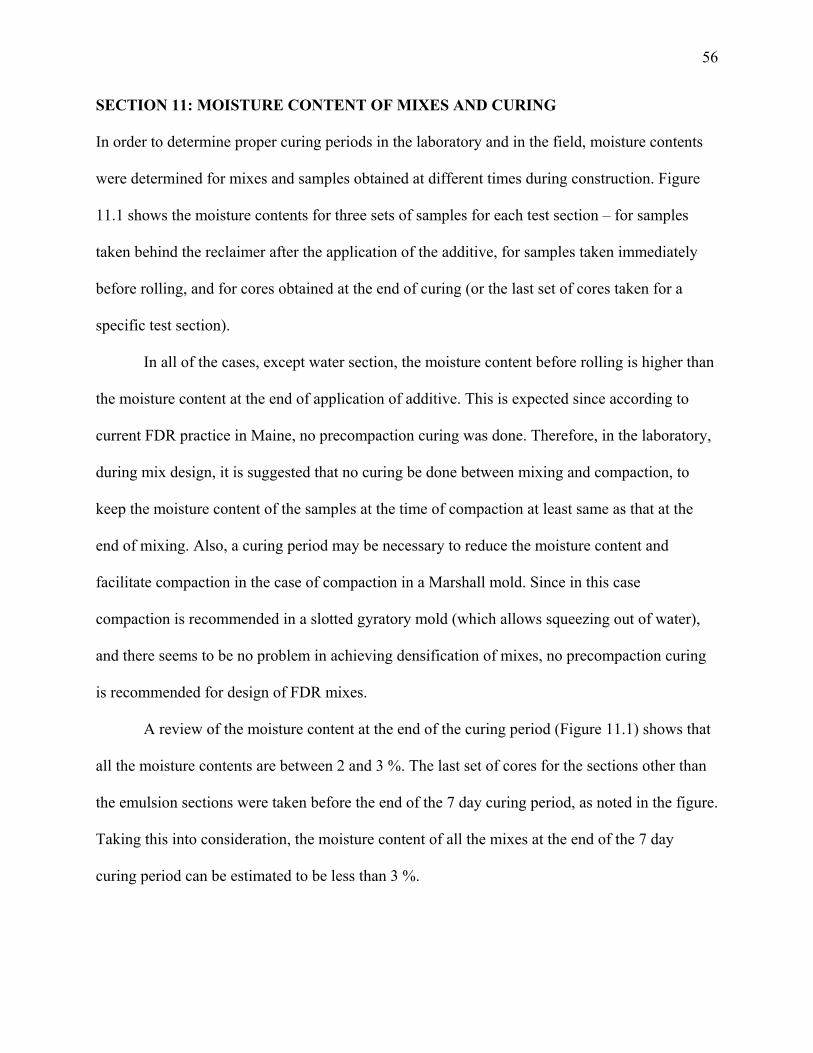
SECTION 11: MOISTURE CONTENT OF MIXES AND CURING
In order to determine proper curing periods in the laboratory and in the field, moisture contents
were determined for mixes and samples obtained at different times during construction. Figure
11.1 shows the moisture contents for three sets of samples for each test section – for samples
taken behind the reclaimer after the application of the additive, for samples taken immediately
before rolling, and for cores obtained at the end of curing (or the last set of cores taken for a
specific test section).
In all of the cases, except water section, the moisture content before rolling is higher than
the moisture content at the end of application of additive. This is expected since according to
current FDR practice in Maine, no precompaction curing was done. Therefore, in the laboratory,
during mix design, it is suggested that no curing be done between mixing and compaction, to
keep the moisture content of the samples at the time of compaction at least same as that at the
end of mixing. Also, a curing period may be necessary to reduce the moisture content and
facilitate compaction in the case of compaction in a Marshall mold. Since in this case
compaction is recommended in a slotted gyratory mold (which allows squeezing out of water),
and there seems to be no problem in achieving densification of mixes, no precompaction curing
is recommended for design of FDR mixes.
A review of the moisture content at the end of the curing period (Figure 11.1) shows that
all the moisture contents are between 2 and 3 %. The last set of cores for the sections other than
the emulsion sections were taken before the end of the 7 day curing period, as noted in the figure.
Taking this into consideration, the moisture content of all the mixes at the end of the 7 day
curing period can be estimated to be less than 3 %.
57
0
1
2
3
4
5
6
7
Emulsion, 2.2%
Emulsion, 3.4%
Emulsion, 3.4% plus lime, 2
%
Cement, 5 % Water
Mix
Moi
stur
e co
nten
t (%
)
First pass of reclaimer Before rolling End of curing
FIGURE 11.1 Moisture content of mixes Note: The last set of cores for emulsion samples were taken on the 7th day after construction, 6th day for the emulsion plus lime samples, 5th day for the cement samples and 4th day after construction for the water samples
58
Therefore, maximum water content of 3 %, rather than a number of days, can be specified as
criteria for curing in the field prior to placement of overlay. However, for practical purposes, a
minimum of 10 curing days or a moisture content less than or equal to 3 % moisture content is
recommended for field curing.
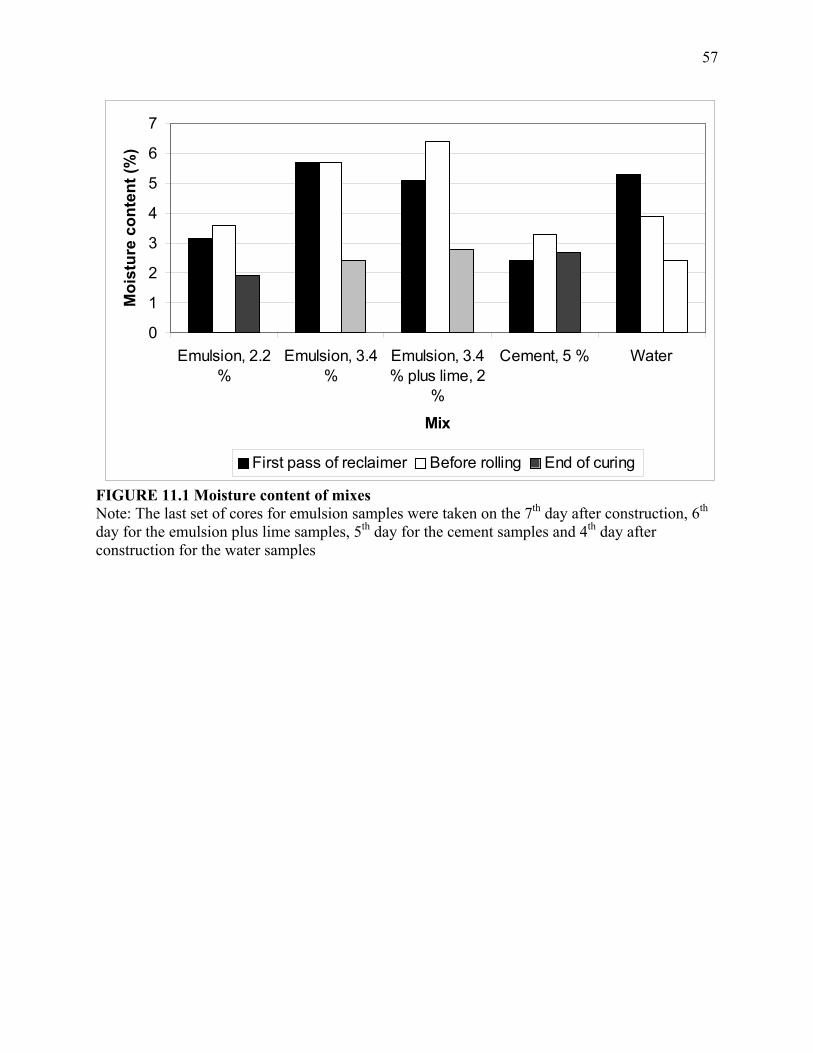
Similarly, in the laboratory, post compaction curing should be continued until the
samples have water content equal to or less than 3 %. If a number of days for curing, which can
reduce the moisture content to 3 %, can be determined, then the samples can be cured for that
many days, during mix design. During the initial mix deign conducted as part of this study, loss
in moisture content was noted for the different mixes, through the 6 day curing periods. From the
dry mass, the moisture content at different times was back-calculated. Figure 11.2 shows the
moisture content of two different mixes, one with initial moisture content of 7 % and the other
with initial moisture content of 10 %. In both cases it can be seen that the moisture content is
reduced significantly less than 3 % within a day of curing at 40oC. Based on this observation, it
seems to be justified to recommend that postcompaction curing be conducted in the laboratory
for one day at 40oC. However, it should be noted that this is a general recommendation and may
not be strictly valid for mixes with a wide range in material composition, particularly gradation,
since finer mixes should take more time to cure than coarser mixes.
59
0
2
4
6
8
10
12
0 1 2 3 4 5 6
Days after mixing (days of curing)
Moi
stur
e co
nten
t of s
ampl
es
7 % moisture 10 % moisture
FIGURE 11.2 Moisture content of water mix samples from initial mix design
60
SECTION 12: EVALUATION OF MOISTURE SUSCEPTIBILITY OF FDR MIXES
WITH DIFFERENT ADDITIVES
Moisture induced damage is a significant factor in deterioration of base mixes. Hence, any
additive that is recommended for use in FDR, must be evaluated in terms of its effect on
moisture susceptibility of the resultant FDR mix. In this study, samples of FDR mixes with
water, emulsion, emulsion and lime, cement and emulsion and cement were tested for indirect
tensile strength, under dry and wet conditions, and tensile strength ratios (between wet and dry)
were determined.
The conditioning process was done in accordance with AASHTO T283. The samples
were vacuum saturated to 50-80% saturation. They were then wrapped and placed in a self
sealing bag with 10 ml of water, and put into a -18°C freezer. After approximately 16 hours in
the freezer, the samples were placed in a 60°C water bath. They were then transferred into a
25°C water bath and kept for a period of 2 hours before testing.
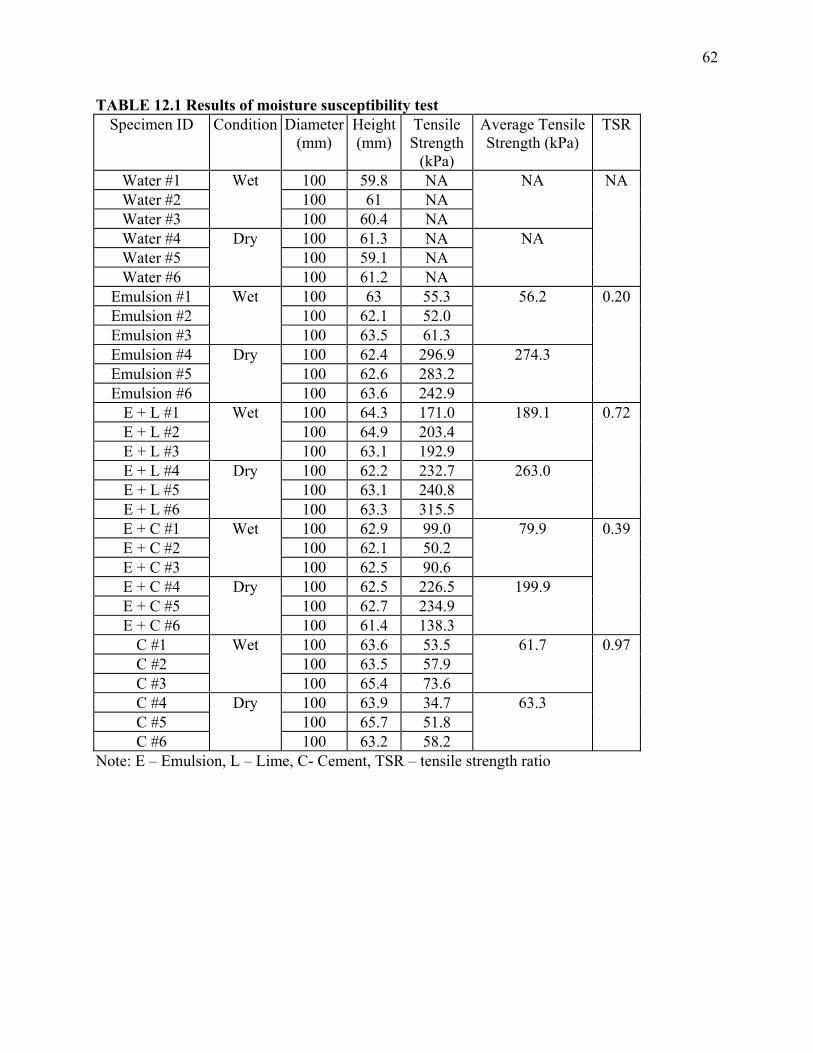
The results of the strength tests are shown in Table 12.1. It is noted that the cement
samples show the highest tensile strength ratio (0.9), followed by the emulsion plus lime samples
(0.7), emulsion plus cement (0.4) and emulsion (0.2). The water samples crumbled during
vacuum saturation. A consideration of wet strength only, however, shows that the cement
samples have very low wet tensile strength (62 kPa), compared to the emulsion, emulsion plus
lime or emulsion plus cement samples. The emulsion plus lime samples actually show the
highest wet tensile strength (189 kPa).
The samples of water only mixes were not suitable for testing for indirect tensile strength
in wet as well as dry condition. Compared to the water mixes, samples of all other mixes were

61
better, since they could be tested in the wet and dry conditions, even though the wet conditions
strengths were much lower than the dry condition strength.
Based on the results, it can be concluded that any one of the additives considered in this
study improves resistance of FDR against moisture damage. Cement and emulsion plus lime
mixes show very high resistance to moisture damage compared to the other mixes. On the basis
of wet tensile strength, emulsion plus lime is the most desirable additive.
62
TABLE 12.1 Results of moisture susceptibility test Specimen ID Condition Diameter
(mm) Height (mm)
Tensile Strength
(kPa)
Average Tensile Strength (kPa)
TSR
Water #1 100 59.8 NA NA Water #2 100 61 NA Water #3
Wet
100 60.4 NA Water #4 100 61.3 NA NA Water #5 100 59.1 NA Water #6
Dry
100 61.2 NA
NA
Emulsion #1 100 63 55.3 56.2 Emulsion #2 100 62.1 52.0 Emulsion #3
Wet
100 63.5 61.3 Emulsion #4 100 62.4 296.9 274.3 Emulsion #5 100 62.6 283.2 Emulsion #6
Dry
100 63.6 242.9
0.20
E + L #1 100 64.3 171.0 189.1 E + L #2 100 64.9 203.4 E + L #3
Wet
100 63.1 192.9 E + L #4 100 62.2 232.7 263.0 E + L #5 100 63.1 240.8 E + L #6
Dry
100 63.3 315.5
0.72
E + C #1 100 62.9 99.0 79.9 E + C #2 100 62.1 50.2 E + C #3
Wet
100 62.5 90.6 E + C #4 100 62.5 226.5 199.9 E + C #5 100 62.7 234.9 E + C #6
Dry
100 61.4 138.3
0.39
C #1 100 63.6 53.5 61.7 C #2 100 63.5 57.9 C #3
Wet
100 65.4 73.6 C #4 100 63.9 34.7 63.3 C #5 100 65.7 51.8 C #6
Dry
100 63.2 58.2
0.97
Note: E – Emulsion, L – Lime, C- Cement, TSR – tensile strength ratio
63
SECTION 13: MOISTURE AGGRAVATED DEFORMATION
In the next phase, water and emulsion mixes were prepared and samples were compacted at the
optimum total fluid content. Samples were also compacted with mixes prepared with cement (5
%) plus 2 % premixed water (cement samples) and emulsion (3 %) plus lime (2 %) (emulsion
plus lime samples), emulsion (3 %) plus cement (2 %) (emulsion plus cement samples) and
emulsion (3 %) plus cement (2 %) plus lime (2 %) (emulsion plus cement plus lime samples). All
of these samples, except the emulsion plus cement plus lime samples were then tested with the
Asphalt Pavement Analyzer (APA). The testing was done by running loaded wheels under
690kPa pressure over the samples. The entire testing was done under water. At the end of 8,000
cycles of loading, the rut depths of the samples were compared. Also, the automatic data
acquisition system in the APA obtained rut depths at 500 cycle and at every 1,000 cycles
thereafter, and as a result the rut depth versus cycles data was obtained for each group of
samples. These results are shown in Figure 13.1. Each plot indicates the average values from six
samples. A comparison of the final rut depth (at 8,000 cycles) clearly shows the beneficial effect
of additive in the mixes – the mixes with no additives, that is with water only, shows the highest
amount of rutting. In terms of the final rutting, the mixes can be ranked as (from best to worst) –
emulsion plus cement, emulsion plus lime, cement, emulsion and water.
An Analysis of Variance (ANOVA) was conducted with the rut depths obtained at 8,000 cycles
for the different mixes. The results are shown in Table 13.1. As indicated by a low p value
(0.001) there is significant difference between the rut depths of the different mixes. This
indicates that the additives used in this study have a significant effect on rutting potential of these
mixes. Studen-Newman-Keuls (SNK) test conducted to rank the mixes showed that (Table 13.1)
there is a significant difference between rutting potential of mixes with cement and emulsion,
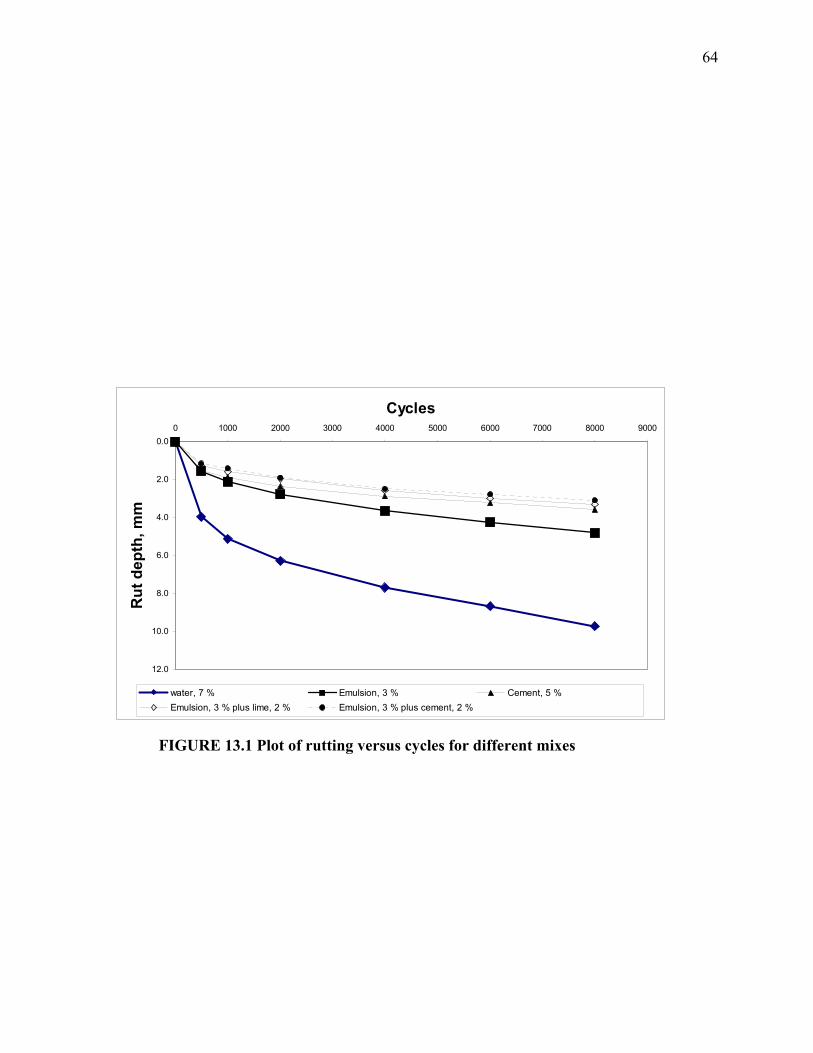
64
0.0
2.0
4.0
6.0
8.0
10.0
12.0
0 1000 2000 3000 4000 5000 6000 7000 8000 9000
Cycles
Rut
dep
th, m
m
water, 7 % Emulsion, 3 % Cement, 5 %Emulsion, 3 % plus lime, 2 % Emulsion, 3 % plus cement, 2 %
FIGURE 13.1 Plot of rutting versus cycles for different mixes
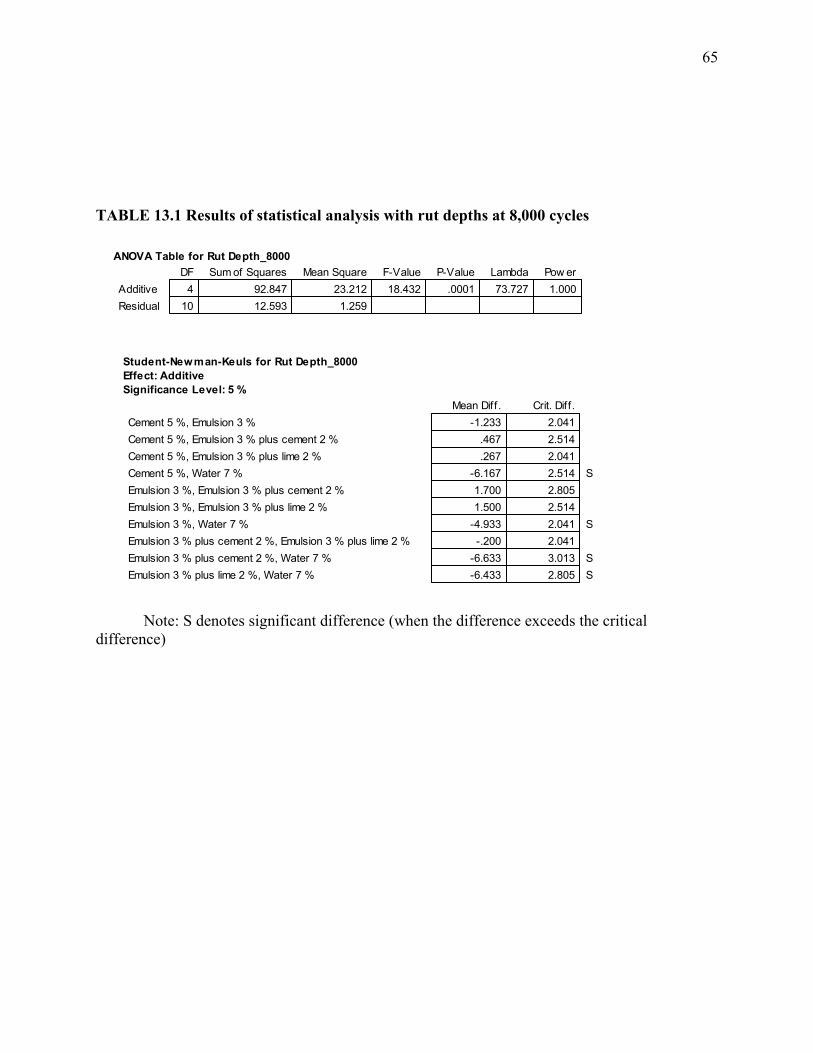
65
TABLE 13.1 Results of statistical analysis with rut depths at 8,000 cycles
4 92.847 23.212 18.432 .0001 73.727 1.00010 12.593 1.259
DF Sum of Squares Mean Square F-Value P-Value Lambda Pow erAdditiveResidual
ANOVA Table for Rut Depth_8000
-1.233 2.041.467 2.514.267 2.041
-6.167 2.514 S1.700 2.8051.500 2.514
-4.933 2.041 S-.200 2.041
-6.633 3.013 S-6.433 2.805 S
Mean Diff. Crit. Diff.Cement 5 %, Emulsion 3 %Cement 5 %, Emulsion 3 % plus cement 2 %Cement 5 %, Emulsion 3 % plus lime 2 %Cement 5 %, Water 7 %Emulsion 3 %, Emulsion 3 % plus cement 2 %Emulsion 3 %, Emulsion 3 % plus lime 2 %Emulsion 3 %, Water 7 %Emulsion 3 % plus cement 2 %, Emulsion 3 % plus lime 2 %Emulsion 3 % plus cement 2 %, Water 7 %Emulsion 3 % plus lime 2 %, Water 7 %
Student-Newman-Keuls for Rut Depth_8000Effect: AdditiveSignificance Level: 5 %
Note: S denotes significant difference (when the difference exceeds the critical
difference)
66
cement and water, emulsion plus lime and emulsion plus cement and water, and emulsion and
water mixes.
Photos of typical rutted samples of different mixes are shown in Figure 13.2. A close
observation showed that initially, with the start of loading, the asphalt and the asphalt rich fine
particles on the surface began to strip off (commonly referred to as stripping) and then the bigger
particles started raveling or pushing out, resulting in ruts (depressions). Hence, the initial
stripping seems to have affected the rut depths significantly – higher the amount of stripping
deeper is the rut. An examination of the plots in Figure 13.1 shows that the slope of the plots,
between 0 and 500 cycles can be used as indicators of final rut depths. The data clearly shows
that the water samples show the highest slope of rutting versus cycles, indicating a high degree
of stripping. In terms of stripping resistance, the mixes can be ranked as (from best to worst) –
emulsion plus lime, cement, emulsion and water. Hence from strength and durability
consideration, an addition of 2 % cement or 2 % lime with 3 % emulsion seems to result in the
best mix.
ANOVA and SNK tests were also conducted with the rut depth at 500 cycles to evaluate
the mixes in terms of their stripping potential. The results are shown in Table 13.2. Again, the rut
depths at 500 cycles are significantly different for the different mixes, and the SNK test shows
essentially the same results as the results shown by the analysis of the rut depth at 8,000 cycles
(as shown in Table 13.1). Hence, the rut depth at 500 cycles can be considered to be an indicator
of rutting and stripping potential in rut tests with the APA.
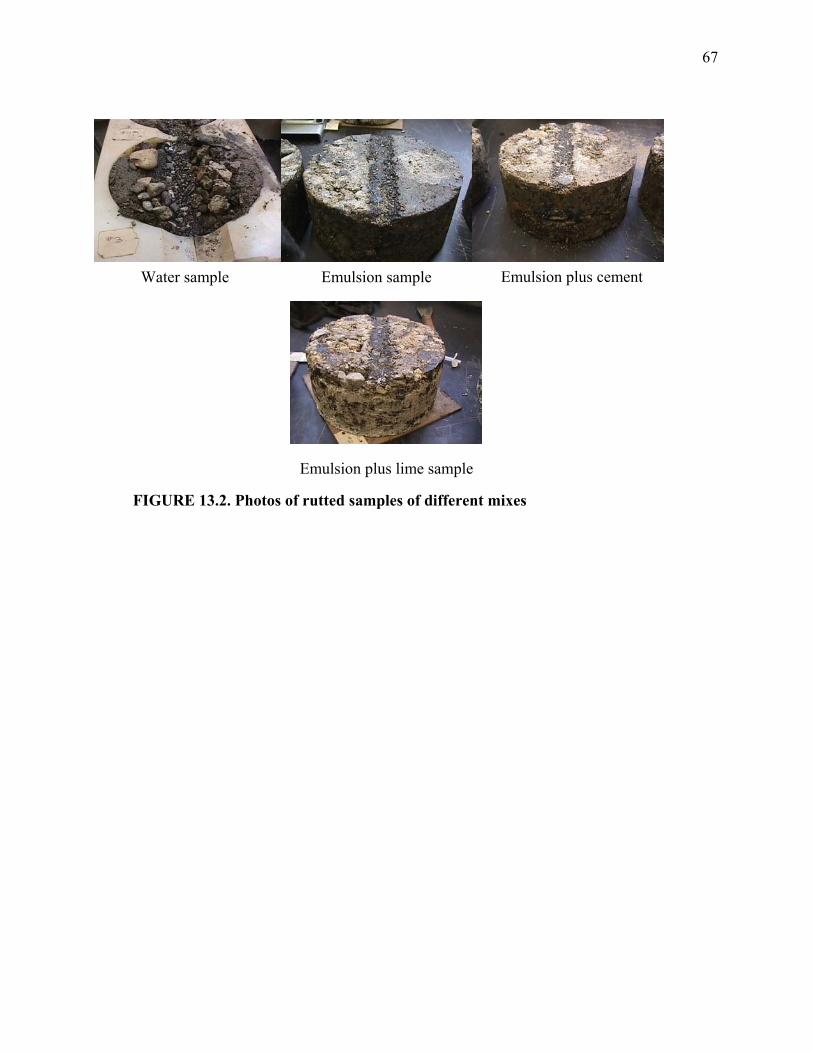
67
Emulsion plus cement Water sample Emulsion sample
Emulsion plus lime sample
FIGURE 13.2. Photos of rutted samples of different mixes
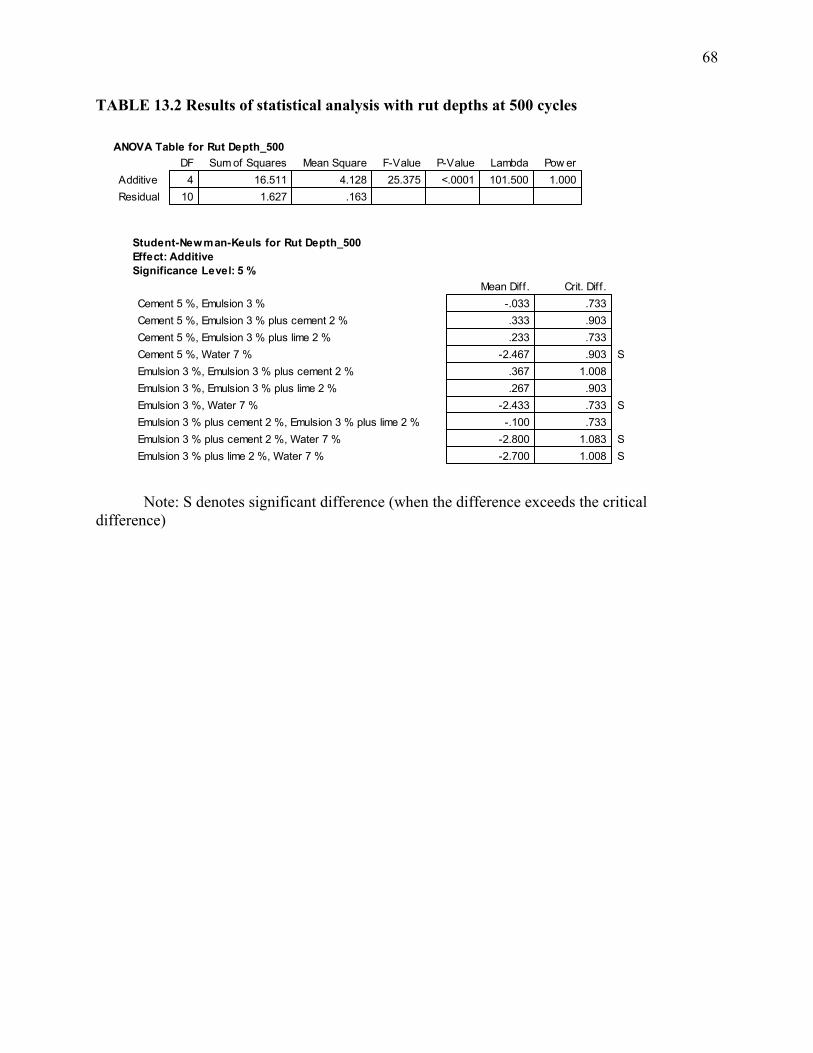
68
TABLE 13.2 Results of statistical analysis with rut depths at 500 cycles
4 16.511 4.128 25.375 <.0001 101.500 1.00010 1.627 .163
DF Sum of Squares Mean Square F-Value P-Value Lambda Pow erAdditiveResidual
ANOVA Table for Rut Depth_500
-.033 .733.333 .903.233 .733
-2.467 .903 S.367 1.008.267 .903
-2.433 .733 S-.100 .733
-2.800 1.083 S-2.700 1.008 S
Mean Diff. Crit. Diff.Cement 5 %, Emulsion 3 %Cement 5 %, Emulsion 3 % plus cement 2 %Cement 5 %, Emulsion 3 % plus lime 2 %Cement 5 %, Water 7 %Emulsion 3 %, Emulsion 3 % plus cement 2 %Emulsion 3 %, Emulsion 3 % plus lime 2 %Emulsion 3 %, Water 7 %Emulsion 3 % plus cement 2 %, Emulsion 3 % plus lime 2 %Emulsion 3 % plus cement 2 %, Water 7 %Emulsion 3 % plus lime 2 %, Water 7 %
Student-Newman-Keuls for Rut Depth_500Effect: AdditiveSignificance Level: 5 %
Note: S denotes significant difference (when the difference exceeds the critical
difference)
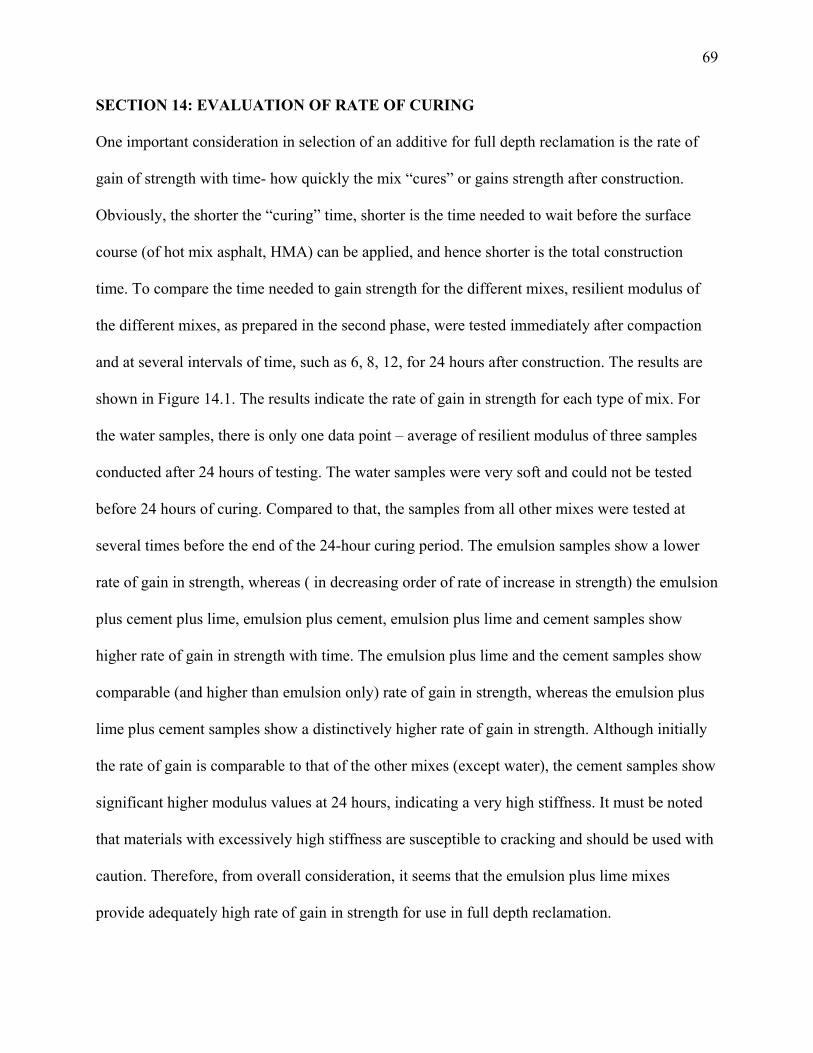
69
SECTION 14: EVALUATION OF RATE OF CURING
One important consideration in selection of an additive for full depth reclamation is the rate of
gain of strength with time- how quickly the mix “cures” or gains strength after construction.
Obviously, the shorter the “curing” time, shorter is the time needed to wait before the surface
course (of hot mix asphalt, HMA) can be applied, and hence shorter is the total construction
time. To compare the time needed to gain strength for the different mixes, resilient modulus of
the different mixes, as prepared in the second phase, were tested immediately after compaction
and at several intervals of time, such as 6, 8, 12, for 24 hours after construction. The results are
shown in Figure 14.1. The results indicate the rate of gain in strength for each type of mix. For
the water samples, there is only one data point – average of resilient modulus of three samples
conducted after 24 hours of testing. The water samples were very soft and could not be tested
before 24 hours of curing. Compared to that, the samples from all other mixes were tested at
several times before the end of the 24-hour curing period. The emulsion samples show a lower
rate of gain in strength, whereas ( in decreasing order of rate of increase in strength) the emulsion
plus cement plus lime, emulsion plus cement, emulsion plus lime and cement samples show
higher rate of gain in strength with time. The emulsion plus lime and the cement samples show
comparable (and higher than emulsion only) rate of gain in strength, whereas the emulsion plus
lime plus cement samples show a distinctively higher rate of gain in strength. Although initially
the rate of gain is comparable to that of the other mixes (except water), the cement samples show
significant higher modulus values at 24 hours, indicating a very high stiffness. It must be noted
that materials with excessively high stiffness are susceptible to cracking and should be used with
caution. Therefore, from overall consideration, it seems that the emulsion plus lime mixes
provide adequately high rate of gain in strength for use in full depth reclamation.
70
0
500
1000
1500
2000
2500
0 5 10 15 20 25 30
Hours after compaction
Res
ilien
t Mod
ulus
(MPa
)
Emulsion CementEmulsion plus cement Emulsion plus limeWater Emulsion plus lime plus cement
FIGURE 14.1 Plot of resilient modulus versus time after compaction for different mixes
71
SECTION 15: DETERMINATION OF STRUCTURAL STRENGTH
Falling Weight Deflectometer (FWD) tests are widely used for structural evaluation of
pavements. For the FDR study, FWD tests were conducted on the existing pavement prior to
reclamation, and again on the reclaimed base material immediately after construction and before
the application of binder and wearing courses. The initial FWD results, in terms of pavement
modulus, are shown in Table 15.1. These results will be compared to results obtained from FWD
that was conducted on the pavement after three months of traffic. However, the data can be
analyzed to determine whether any significant different in strength existed in the different parts
of the pavement, which were treated with different materials during reclamation (and hence
labeled as different sections). An Analysis of Variance (ANOVA) conducted with the data
indicated (Table 15.1) no significant difference in the strength of the existing sections.
The data obtained from FWD tests conducted immediately at the end of curing period,
before the application of binder and wearing courses, are shown in terms of deflections, in Table
15.2. These deflections obtained from the different sections were analyzed for significant
difference, and the results are shown in Table 15.2. Since the deflections were found to be
significantly different, a mean comparison technique (SNK) was used to group the different
additives according to the deflection of the different sections. The results, shown in Table 15.2
show that the different sections can be divided into two groups on the basis of deflection. The
cement and water sections have no significant difference in deflection, but both sections have
significantly less deflection compared to the emulsion and emulsion plus lime sections. The two
emulsion and the emulsion plus lime sections do not have any significant difference in
deflection.
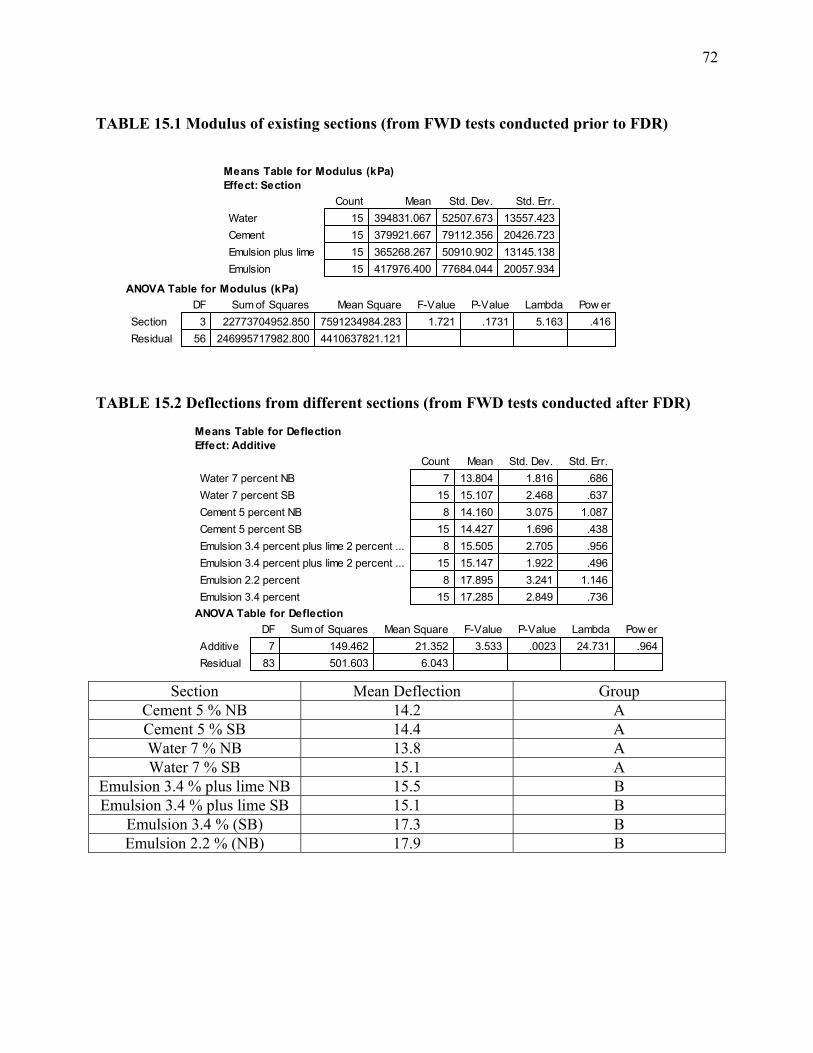
72
TABLE 15.1 Modulus of existing sections (from FWD tests conducted prior to FDR)
3 22773704952.850 7591234984.283 1.721 .1731 5.163 .41656 246995717982.800 4410637821.121
DF Sum of Squares Mean Square F-Value P-Value Lambda Pow erSectionResidual
ANOVA Table for Modulus (kPa)
15 417976.400 77684.044 20057.934Emulsion
15 394831.067 52507.673 13557.42315 379921.667 79112.356 20426.72315 365268.267 50910.902 13145.138
Count Mean Std. Dev. Std. Err.WaterCementEmulsion plus lime
Means Table for Modulus (kPa)Effect: Section
TABLE 15.2 Deflections from different sections (from FWD tests conducted after FDR)
7 13.804 1.816 .68615 15.107 2.468 .6378 14.160 3.075 1.087
15 14.427 1.696 .4388 15.505 2.705 .956
15 15.147 1.922 .4968 17.895 3.241 1.146
15 17.285 2.849 .736
Count Mean Std. Dev. Std. Err.Water 7 percent NBWater 7 percent SBCement 5 percent NBCement 5 percent SBEmulsion 3.4 percent plus lime 2 percent ...Emulsion 3.4 percent plus lime 2 percent ...Emulsion 2.2 percentEmulsion 3.4 percent
Means Table for DeflectionEffect: Additive
7 149.462 21.352 3.533 .0023 24.731 .96483 501.603 6.043
DF Sum of Squares Mean Square F-Value P-Value Lambda Pow erAdditiveResidual
ANOVA Table for Deflection
Section Mean Deflection Group Cement 5 % NB 14.2 A Cement 5 % SB 14.4 A Water 7 % NB 13.8 A Water 7 % SB 15.1 A
Emulsion 3.4 % plus lime NB 15.5 B Emulsion 3.4 % plus lime SB 15.1 B
Emulsion 3.4 % (SB) 17.3 B Emulsion 2.2 % (NB) 17.9 B
73
Determination of structural strength and improvement in life of pavements
In order to design a pavement with different layers, the layer coefficients of different layers must
be known. The layer coefficients can be determined in different ways, such as from the resilient
modulus of samples or from data obtained from non-destructive in-place testing, such as Falling
Weight Deflectometer (FWD). Also, for evaluation of the use of different types of additives for
recycling of pavements, it is necessary to know what kind of improvement in life of the
pavement can be expected by using the different additives, and, if different additives are
considered, the cost of increasing the life of the pavement by a specific amount, for each
additive.
Two approaches were followed for answering these questions. The layer coefficients of
the base layers, recycled with different additives, were determined from resilient modulus of
three-month-old in-place cores from the different sections (recycled with different additives).
The improvement in the life of the pavement was evaluated by comparing the structural numbers
of the pavement sections (considering all three layers – base, binder and surface) before and after
recycling. The cost of increasing the life of pavement for each additive was determined by
considering the life (in terms of design traffic) of the existing pavement, the life of the new
pavement, and the cost of recycling.
Table 15.3 shows the resilient modulus of three-month-old in-place cores from different
sections (recycled with different additives). The mixes can be ranked as (in decreasing order of
modulus) – Cement-5% (10,469.0 MPa), Emulsion-3.4 % plus 2 % lime (3,566.2 MPa),
Emulsion-2.2% (1,317.5 MPa). (Note that the resilient modulus values of the water and
emulsion-3.4 % could not be determined since sufficient number of samples was not available.)
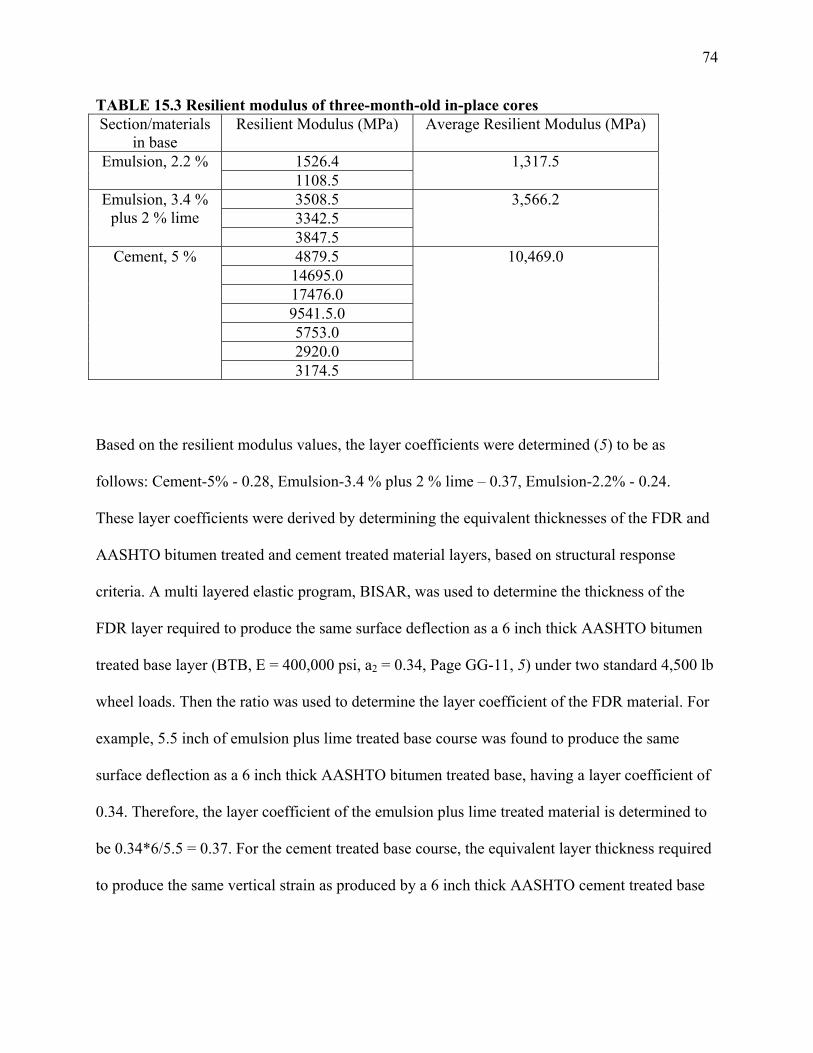
74
TABLE 15.3 Resilient modulus of three-month-old in-place cores Section/materials
in base Resilient Modulus (MPa) Average Resilient Modulus (MPa)
1526.4 Emulsion, 2.2 % 1108.5
1,317.5
3508.5 3342.5
Emulsion, 3.4 % plus 2 % lime
3847.5
3,566.2
4879.5 14695.0 17476.0 9541.5.0 5753.0 2920.0
Cement, 5 %
3174.5
10,469.0
Based on the resilient modulus values, the layer coefficients were determined (5) to be as
follows: Cement-5% - 0.28, Emulsion-3.4 % plus 2 % lime – 0.37, Emulsion-2.2% - 0.24.
These layer coefficients were derived by determining the equivalent thicknesses of the FDR and
AASHTO bitumen treated and cement treated material layers, based on structural response
criteria. A multi layered elastic program, BISAR, was used to determine the thickness of the
FDR layer required to produce the same surface deflection as a 6 inch thick AASHTO bitumen
treated base layer (BTB, E = 400,000 psi, a2 = 0.34, Page GG-11, 5) under two standard 4,500 lb
wheel loads. Then the ratio was used to determine the layer coefficient of the FDR material. For
example, 5.5 inch of emulsion plus lime treated base course was found to produce the same
surface deflection as a 6 inch thick AASHTO bitumen treated base, having a layer coefficient of
0.34. Therefore, the layer coefficient of the emulsion plus lime treated material is determined to
be 0.34*6/5.5 = 0.37. For the cement treated base course, the equivalent layer thickness required
to produce the same vertical strain as produced by a 6 inch thick AASHTO cement treated base
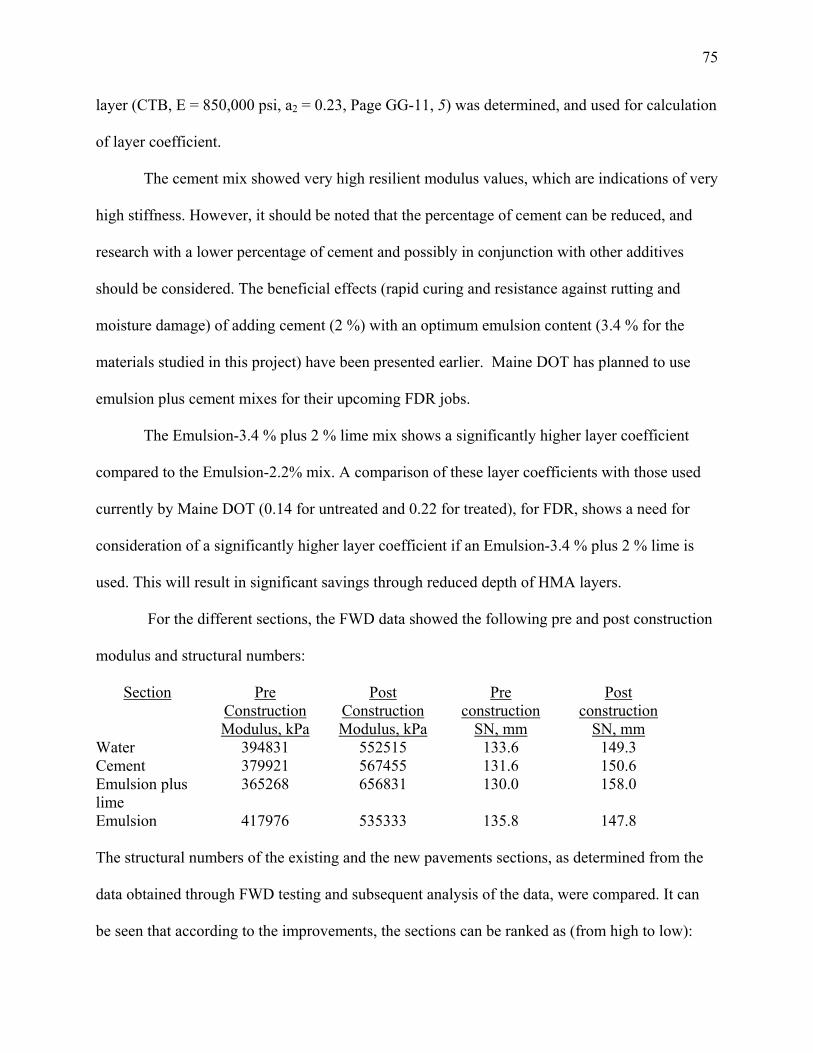
75
layer (CTB, E = 850,000 psi, a2 = 0.23, Page GG-11, 5) was determined, and used for calculation
of layer coefficient.
The cement mix showed very high resilient modulus values, which are indications of very
high stiffness. However, it should be noted that the percentage of cement can be reduced, and
research with a lower percentage of cement and possibly in conjunction with other additives
should be considered. The beneficial effects (rapid curing and resistance against rutting and
moisture damage) of adding cement (2 %) with an optimum emulsion content (3.4 % for the
materials studied in this project) have been presented earlier. Maine DOT has planned to use
emulsion plus cement mixes for their upcoming FDR jobs.
The Emulsion-3.4 % plus 2 % lime mix shows a significantly higher layer coefficient
compared to the Emulsion-2.2% mix. A comparison of these layer coefficients with those used
currently by Maine DOT (0.14 for untreated and 0.22 for treated), for FDR, shows a need for
consideration of a significantly higher layer coefficient if an Emulsion-3.4 % plus 2 % lime is
used. This will result in significant savings through reduced depth of HMA layers.
For the different sections, the FWD data showed the following pre and post construction
modulus and structural numbers:
Section Pre Construction Modulus, kPa
Post Construction Modulus, kPa
Pre construction
SN, mm
Post construction
SN, mm Water 394831 552515 133.6 149.3 Cement 379921 567455 131.6 150.6 Emulsion plus lime
365268 656831 130.0 158.0
Emulsion 417976 535333 135.8 147.8 The structural numbers of the existing and the new pavements sections, as determined from the
data obtained through FWD testing and subsequent analysis of the data, were compared. It can
be seen that according to the improvements, the sections can be ranked as (from high to low):
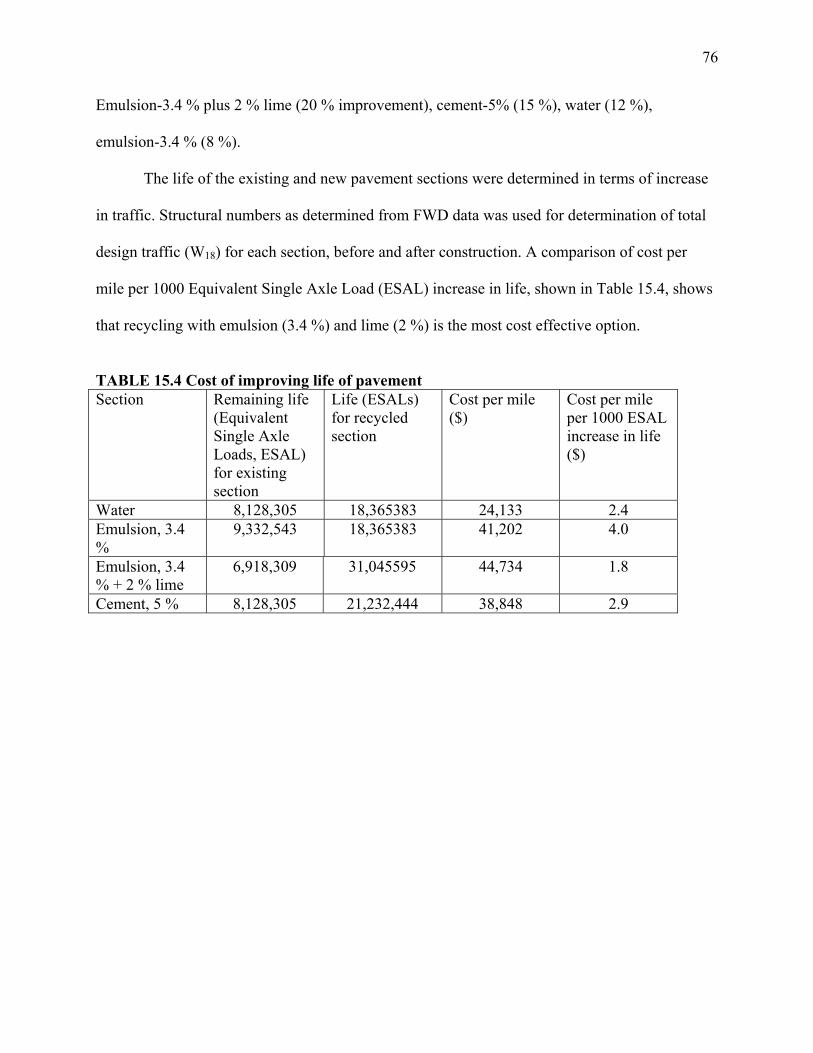
76
Emulsion-3.4 % plus 2 % lime (20 % improvement), cement-5% (15 %), water (12 %),
emulsion-3.4 % (8 %).
The life of the existing and new pavement sections were determined in terms of increase
in traffic. Structural numbers as determined from FWD data was used for determination of total
design traffic (W18) for each section, before and after construction. A comparison of cost per
mile per 1000 Equivalent Single Axle Load (ESAL) increase in life, shown in Table 15.4, shows
that recycling with emulsion (3.4 %) and lime (2 %) is the most cost effective option.
TABLE 15.4 Cost of improving life of pavement Section Remaining life
(Equivalent Single Axle Loads, ESAL) for existing section
Life (ESALs) for recycled section
Cost per mile ($)
Cost per mile per 1000 ESAL increase in life ($)
Water 8,128,305 18,365383 24,133 2.4 Emulsion, 3.4 %
9,332,543 18,365383 41,202 4.0
Emulsion, 3.4 % + 2 % lime
6,918,309 31,045595 44,734 1.8
Cement, 5 % 8,128,305 21,232,444 38,848 2.9

77
SECTION 16: PERFORMANCE EVALUATION
The different FDR sections were inspected in the week of June 4, 2001, approximately one year
after construction. Photos of sections are shown in Figure 16.1. None of the sections showed any
significant distress. However, a significant amount of edge cracking was noted in the water
section. Also, a single crack, extending through both lanes was observed in the 800 m cement
section. However, it must be noted that the cement section was not cured properly in this study,
and that proper curing would have prevented cracking in the section reclaimed with cement.
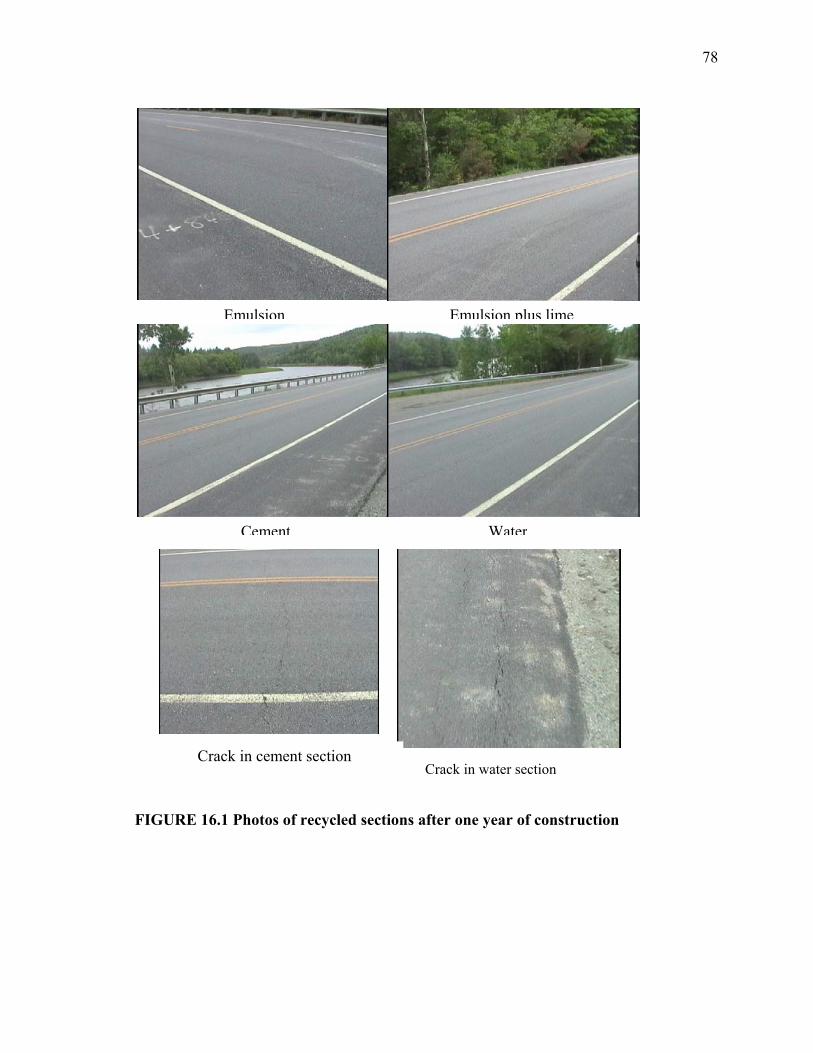
78
Crack in cement section Crack in water section
FIGURE 16.1 Photos of recycled sections after one year of construction
WaterCement
Emulsion plus limeEmulsion

79
SECTION 17: VERIFICATION OF MIX DESIGN WITH NEVADA FDR MATERIAL
In order to verify the mix design system developed in this project, materials from other
states were requested. Nevada Department of Transportation (DOT) sent materials, (mix of RAP
and unbound base materials), from a FDR project on I-80. Four sets of samples were then made
to conduct a mix design. Before conducting the mix design, the materials were tested for relevant
properties. Gradation was checked by sieve analysis and asphalt content was determined with
the National Center for Asphalt Technology (NCAT) ignition oven. A review of these properties
(Table 17.1) indicates that the FDR material was suitable for reclamation with emulsion.
Mix Design
Next, this material was used for designing a suitable FDR mix with asphalt emulsion. Figure
17.1 shows plots of total fluid content versus dry density and resilient modulus values.
Corresponding to the maximum dry density and resilient modulus, an optimum total fluid content
of 5.8 percent, and hence an optimum emulsion content of 2.6 percent (the difference between
the total fluid content and the emulsion consisted of pre mixed water, required for bringing the
moisture content to in-place moisture content) were obtained.
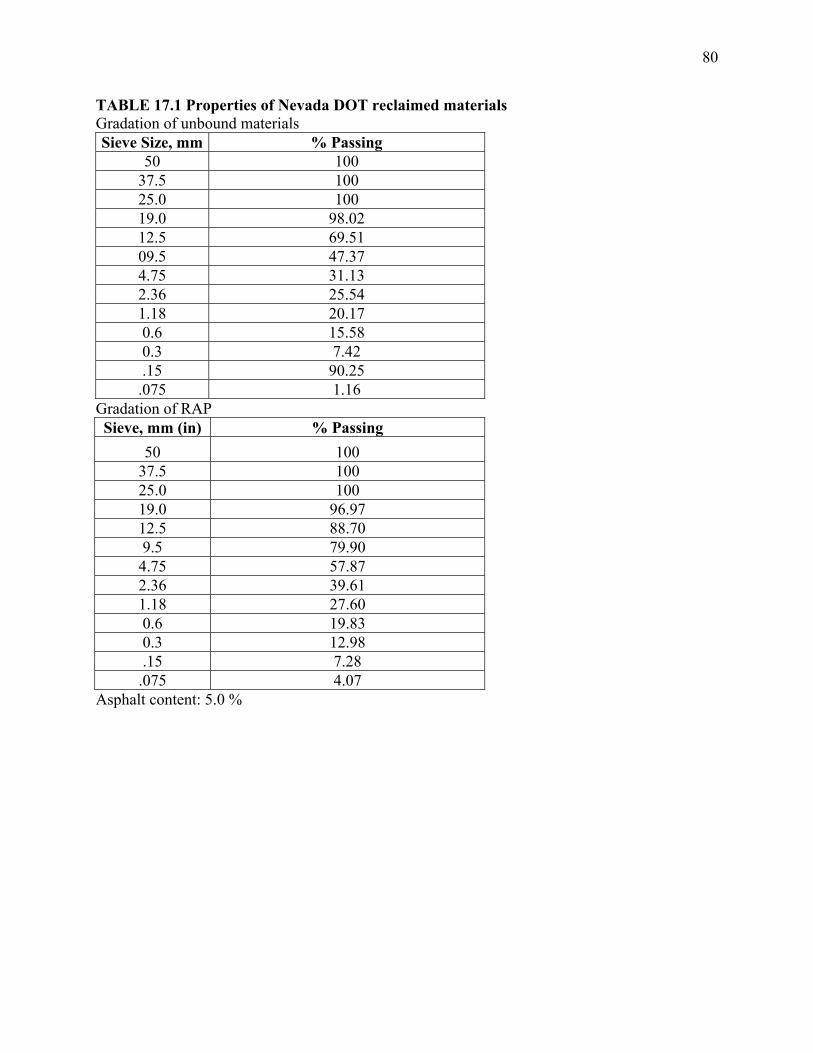
80
TABLE 17.1 Properties of Nevada DOT reclaimed materials Gradation of unbound materials Sieve Size, mm % Passing
50 100 37.5 100 25.0 100 19.0 98.02 12.5 69.51 09.5 47.37 4.75 31.13 2.36 25.54 1.18 20.17 0.6 15.58 0.3 7.42 .15 90.25 .075 1.16
Gradation of RAP Sieve, mm (in) % Passing
50 100 37.5 100 25.0 100 19.0 96.97 12.5 88.70 9.5 79.90 4.75 57.87 2.36 39.61 1.18 27.60 0.6 19.83 0.3 12.98 .15 7.28 .075 4.07
Asphalt content: 5.0 %
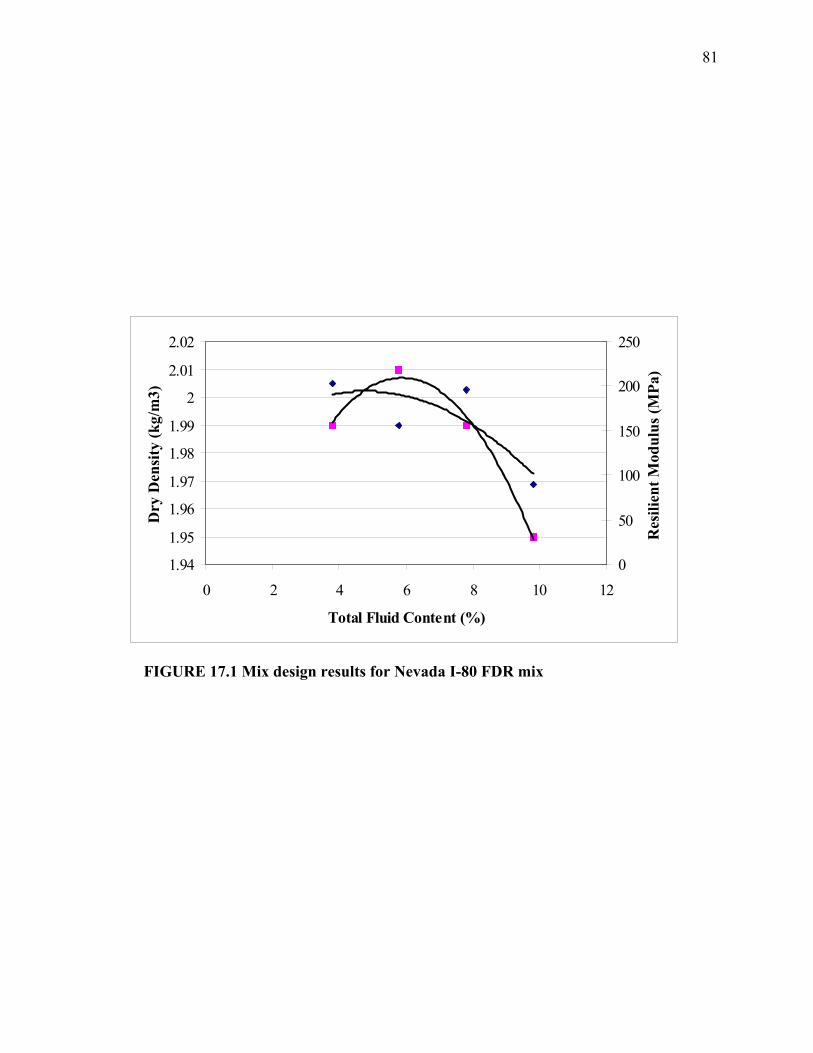
81
1.94
1.95
1.96
1.97
1.98
1.99
2
2.01
2.02
0 2 4 6 8 10 12
Total Fluid Content (%)
Dry
Den
sity
(kg/
m3)
0
50
100
150
200
250
Res
ilien
t Mod
ulus
(MPa
)FIGURE 17.1 Mix design results for Nevada I-80 FDR mix
82
Determination of properties of in-place stiffness
The designed mix, along with mixes with plus 1 percent and minus 1 % (compared to optimum)
emulsion content were put down in three sections in a mold (Figure 17.2). The mixes were
compacted to refusal density with a vibratory roller (Figure 17.3), and left to cure for seven days.
At the end of the curing period, attempts were made to obtain cores for subsequent testing
(density and resilient modulus). However, the mix was not strong enough to allow coring, and an
alternative method for determination of in-place (in-mold) properties was sought.
The Humboldt Stiffness Gauge was used for measuring in-place stiffness. This equipment
operates on the principle of generating a force, measuring the resultant displacement and
determining the stiffness as the ratio of force to displacement. The deflection, as a result of a
small force at frequency of 100-200 Hz, is measured by a geophone. This equipment was
selected because of relative simplicity of operation, non-destructive nature and experience of the
research personnel at WPI. A small amount of sand was spread to even out the reclaimed mixes
at the point of testing, in order to make the stiffness gauge have a flat and smooth contact with
the testing surface.
The results of stiffness test are shown in Table 17.2. All of the readings are greater than
30 MN/m, and in general, all of the three mixes can be categorized as excellent base course (15).
It can be noted that the stiffness of the mix decreases with an increase in emulsion content.
However, in spite of having a high stiffness at optimum minus 1 % emulsion content, the
standard deviation of the stiffness readings at optimum minus 1 % emulsion content (12.9
MN/m) is almost two times the standard deviation of the stiffness readings at the optimum
emulsion content (6.6 MN/m). This indicates that minimum emulsion content is needed for
uniform dispersion of the emulsion and compaction (and resulting density) of FDR mixes.
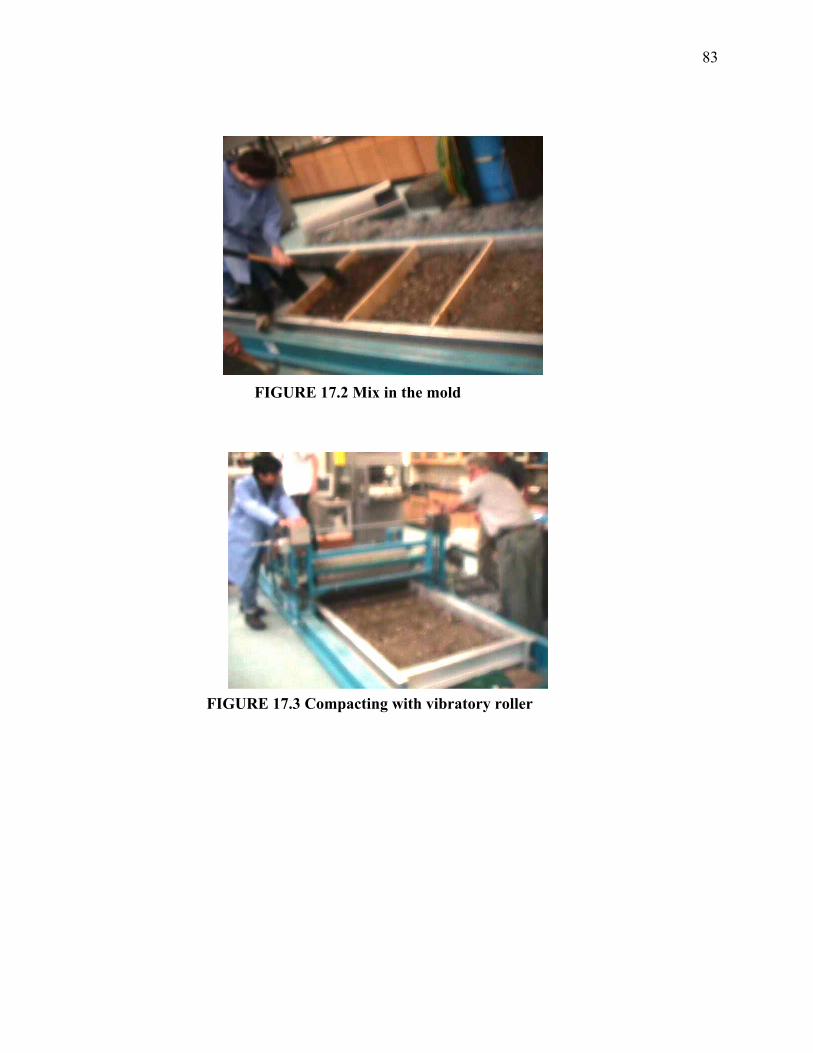
83
FIGURE 17.3 Compacting with vibratory roller
FIGURE 17.2 Mix in the mold
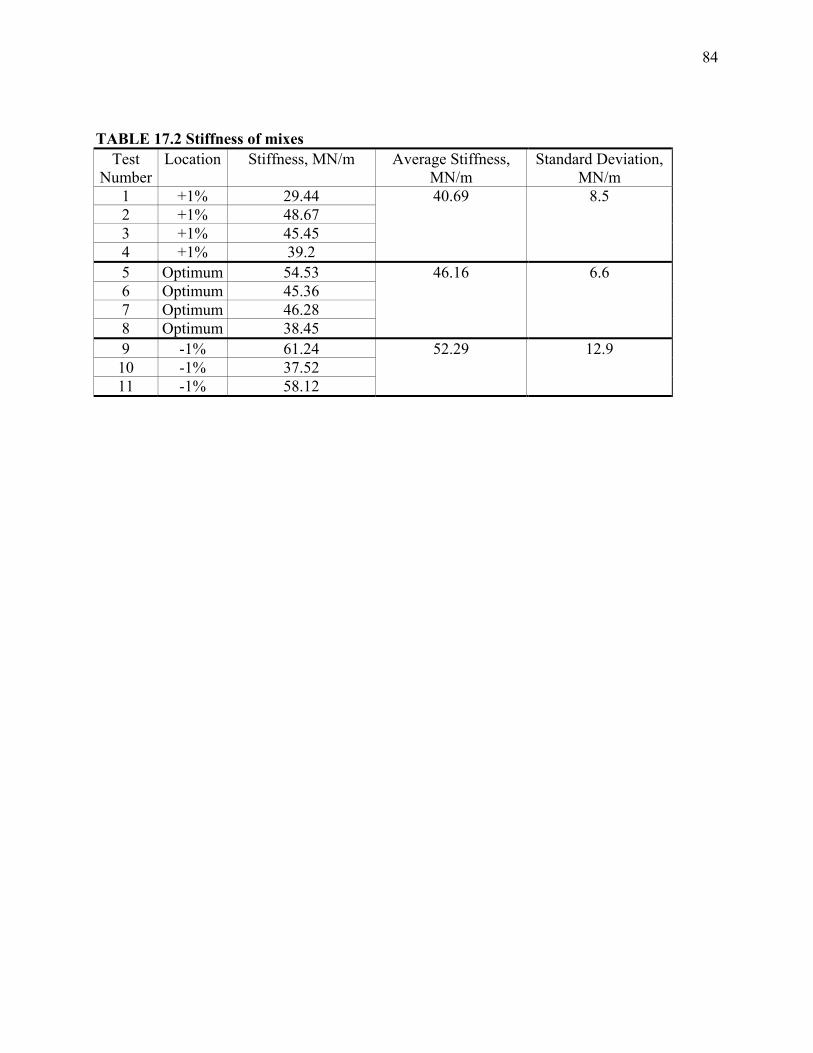
84
TABLE 17.2 Stiffness of mixes
Test Number
Location Stiffness, MN/m Average Stiffness, MN/m
Standard Deviation, MN/m
1 +1% 29.44 40.69 8.5 2 +1% 48.67 3 +1% 45.45 4 +1% 39.2 5 Optimum 54.53 46.16 6.6 6 Optimum 45.36 7 Optimum 46.28 8 Optimum 38.45 9 -1% 61.24 52.29 12.9 10 -1% 37.52 11 -1% 58.12
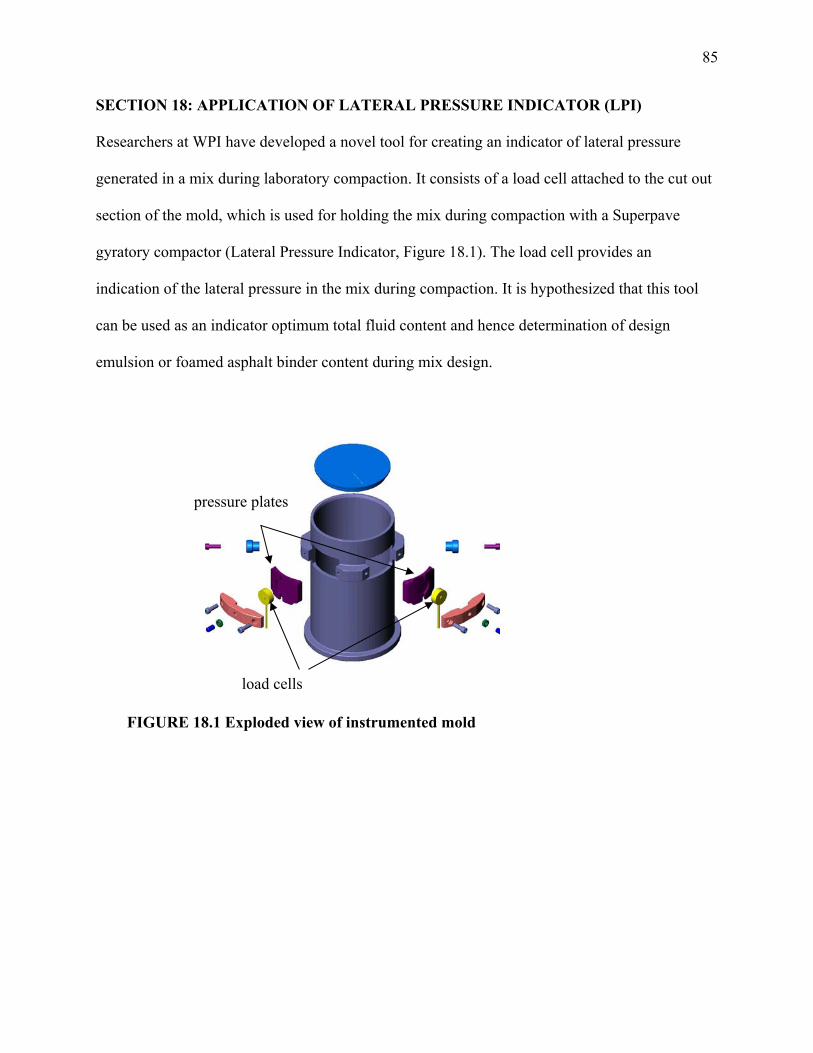
85
SECTION 18: APPLICATION OF LATERAL PRESSURE INDICATOR (LPI)
Researchers at WPI have developed a novel tool for creating an indicator of lateral pressure
generated in a mix during laboratory compaction. It consists of a load cell attached to the cut out
section of the mold, which is used for holding the mix during compaction with a Superpave
gyratory compactor (Lateral Pressure Indicator, Figure 18.1). The load cell provides an
indication of the lateral pressure in the mix during compaction. It is hypothesized that this tool
can be used as an indicator optimum total fluid content and hence determination of design
emulsion or foamed asphalt binder content during mix design.
FIGURE 18.1 Exploded view of instrumented mold
pressure plates
load cells
86
In order to test its applicability, mixes with 3, 5 and 7 percent total fluid content were compacted
with the LPI. During compaction, lateral load, as well as heights, were measured with a modified
Superpave gyratory compactor. The data were analyzed to determine lateral pressure versus
gyration plots for mixes with different total fluid content. Figure 18.2 shows that the lateral
pressure generated in mixes with 1 and 3 percent emulsion content are quite similar, whereas the
pressure generated in mixes with 5 percent emulsion is significantly higher. This indicates that
the mixes with 1 and 3 percent emulsion content are compacted to a more stable state, as
compared to the mix with 5 percent emulsion – since a higher lateral pressure is indicative of
lower angle of internal friction (as shown in Figure 18.3, 16). Therefore, in this example, it is
obvious, that at least from a compaction point of view, the optimum emulsion content lies below
5 percent. In general, since the objective of design is to provide as much emulsion as possible
(for obtaining good coating and durability) without decreasing the strength of the mix
significantly, the results shown in Figure 18.2 would indicate an optimum emulsion content of 3
percent.
The advantage of the use of lateral pressure indicator is that an existing Superpave
gyratory compactor can be used in screening out unstable mixes and getting an idea about
optimum total fluid or emulsion content.
In order to develop guidelines for regular use of this procedure, research with a wide
variety of materials and mixes should be conducted.
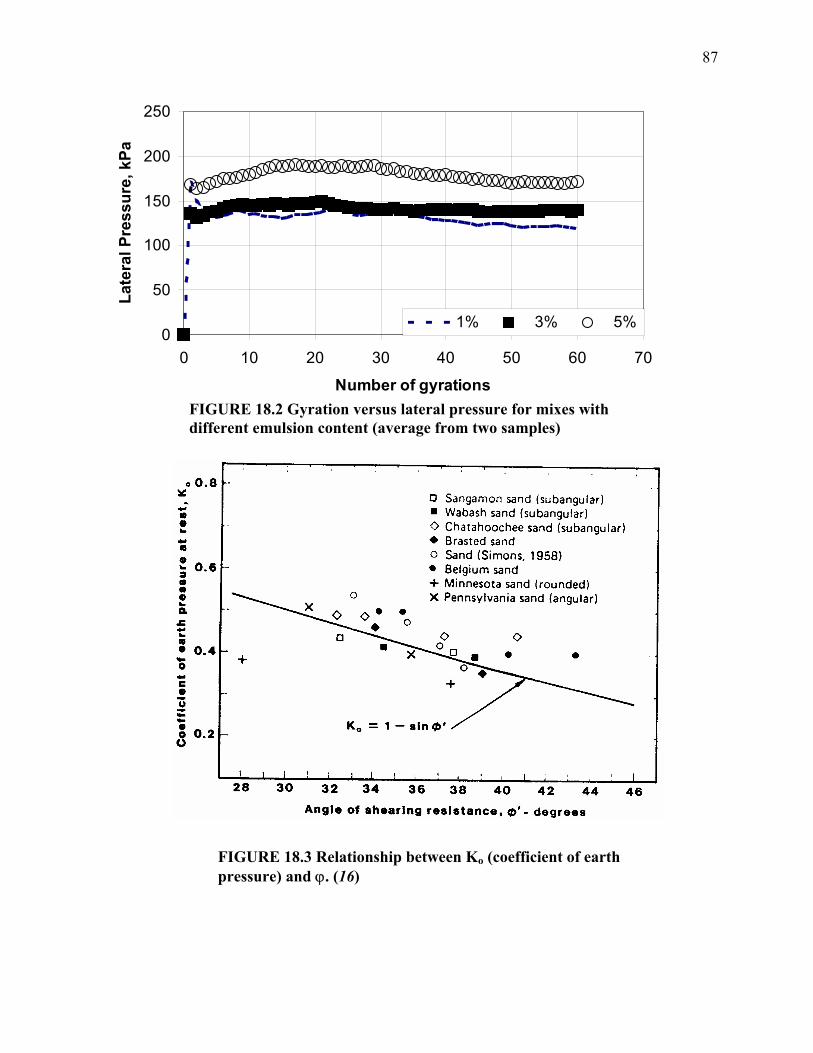
87
0
50
100
150
200
250
0 10 20 30 40 50 60 70
Number of gyrations
Late
ral P
ress
ure,
kPa
1% 3% 5%
FIGURE 18.2 Gyration versus lateral pressure for mixes with different emulsion content (average from two samples)
FIGURE 18.3 Relationship between Ko (coefficient of earth pressure) and ϕ. (16)
88
SECTION 19: DETERMINATION OF LABORATORY RESILIENT MODULUS OF
SUBGRADE SOILS
Introduction
The elastic modulus based on the recoverable strain under repeated loads is called the resilient
modulus; MR. It is defined as the ratio of the amplitude of the repeated axial stress to the
amplitude of the resultant recoverable axial strain.
r
dRM
εσ
=
where, σd – deviator stress, which is the axial stress in an unconfined compression test or the
axial stress in excess of the confining pressure in the triaxial compression test, and εr is the
recoverable axial strain.
As the magnitude of the applied load is very small, the resilient modulus test is a
nondestructive test and the same sample can be used for many tests under different loading and
environmental conditions. A haversine or a triangular stress pulse is applied in order to simulate
the traffic loading on pavements.
Subgrade soils are prepared and compacted before the placement of subbase and/or base
layers. They are classified as Type 1 or Type 2 for the purpose of resilient modulus testing.
Material Type 1 includes all untreated granular base and sub base material and all untreated
subgrade soils which meet the criteria of less than 70% passing the 2.00 mm sieve and less than
20% passing the 75-µm sieve, and which has a plasticity index of 10 or less. Material Type 2
includes all untreated granular base/subbase and untreated subgrade soils not meeting the criteria
for Material Type 1. Thin-walled tube samples of untreated subgrade soils fall in this category.
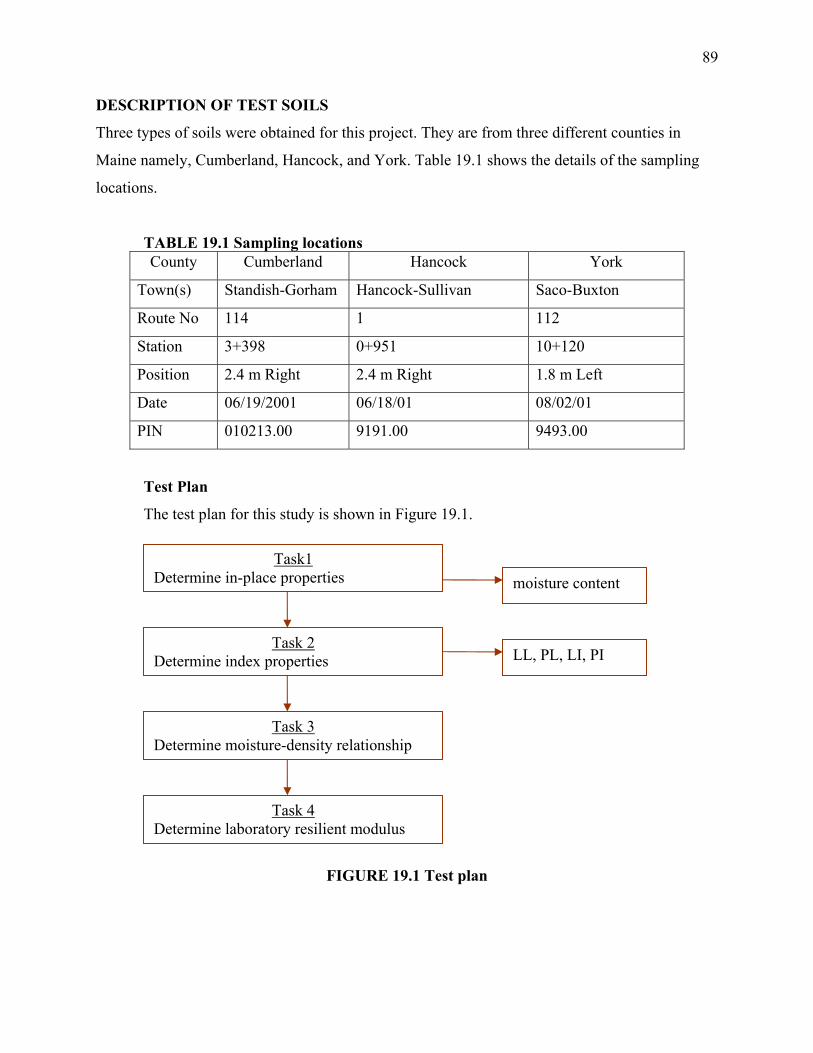
89
DESCRIPTION OF TEST SOILS
Three types of soils were obtained for this project. They are from three different counties in
Maine namely, Cumberland, Hancock, and York. Table 19.1 shows the details of the sampling
locations.
TABLE 19.1 Sampling locations County Cumberland Hancock York
Town(s) Standish-Gorham Hancock-Sullivan Saco-Buxton
Route No 114 1 112
Station 3+398 0+951 10+120
Position 2.4 m Right 2.4 m Right 1.8 m Left
Date 06/19/2001 06/18/01 08/02/01
PIN 010213.00 9191.00 9493.00
Test Plan
The test plan for this study is shown in Figure 19.1.
Task1 Determine in-place properties moisture content
Task 2 LL, PL, LI, PI Determine index properties
Task 3 Determine moisture-density relationship
Task 4 Determine laboratory resilient modulus
FIGURE 19.1 Test plan
90
Task I: In-place Properties
1. Moisture Content
AASHTO T265 (17) procedure was used for the determination of moisture content.
The moisture content w is given by
)()( dCSCW WWWWW +−+=
Ww in terms of its dry weight
100×=d
W
WW
w percent
where w - moisture content
Ww - weight of water present in soil mass
Ws - weight of soil (wet)
Wd - weight of dry soil
Task 2: Index Properties
1. Liquid Limit
2. Plastic Limit
3. Plasticity Index
4. Liquidity Index
1. Determination of Liquid Limit (LL)
Definition: Liquid limit is the moisture content below which the soil behaves as a plastic
material.
Experimental definition: Liquid limit is defined as the water content at which a pat of soil placed
in a brass cup, cut with a standard groove, and then dropped from a height of 1 cm will undergo a
groove closure of 12.7 mm when dropped 25 times.
A nearly linear plot of the water content (%) vs. log of number of blows (N) is prepared. The
moisture content corresponding to 25 blows is the liquid limit.
AASHTO T 89-96 (18) procedure was used for the determination of liquid limit.
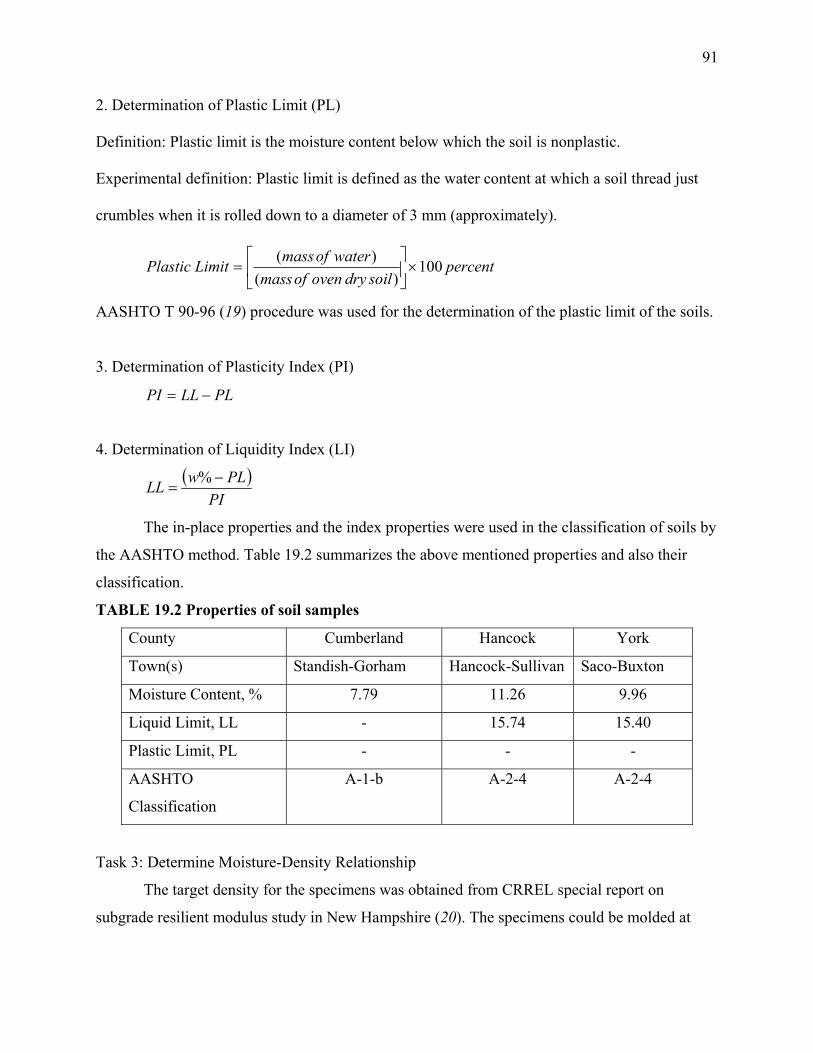
91
2. Determination of Plastic Limit (PL)
Definition: Plastic limit is the moisture content below which the soil is nonplastic.
Experimental definition: Plastic limit is defined as the water content at which a soil thread just
crumbles when it is rolled down to a diameter of 3 mm (approximately).
percentsoildryovenofmass
waterofmassLimitPlastic 100)(
)(×
=
AASHTO T 90-96 (19) procedure was used for the determination of the plastic limit of the soils.
3. Determination of Plasticity Index (PI)
PLLLPI −=
4. Determination of Liquidity Index (LI)
( )PI
PLwLL −=
%
The in-place properties and the index properties were used in the classification of soils by
the AASHTO method. Table 19.2 summarizes the above mentioned properties and also their
classification.
TABLE 19.2 Properties of soil samples
County Cumberland Hancock York
Town(s) Standish-Gorham Hancock-Sullivan Saco-Buxton
Moisture Content, % 7.79 11.26 9.96
Liquid Limit, LL - 15.74 15.40
Plastic Limit, PL - - -
AASHTO
Classification
A-1-b A-2-4 A-2-4
Task 3: Determine Moisture-Density Relationship
The target density for the specimens was obtained from CRREL special report on
subgrade resilient modulus study in New Hampshire (20). The specimens could be molded at
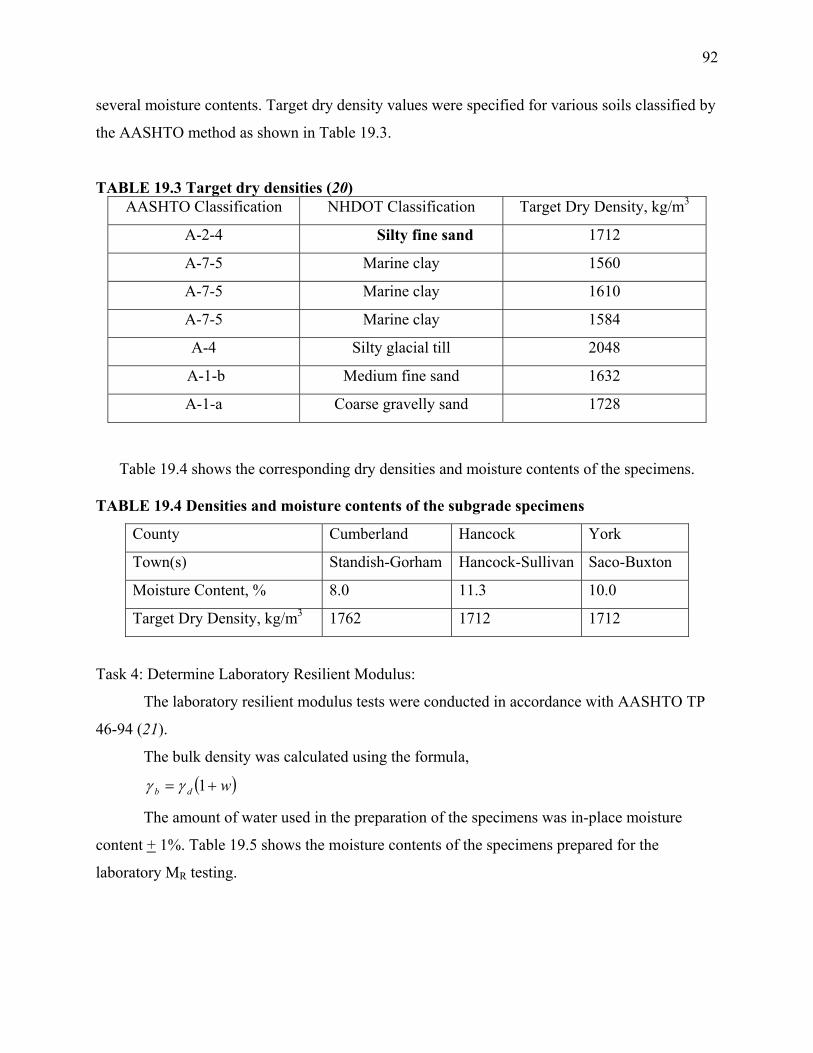
92
several moisture contents. Target dry density values were specified for various soils classified by
the AASHTO method as shown in Table 19.3.
TABLE 19.3 Target dry densities (20) AASHTO Classification NHDOT Classification Target Dry Density, kg/m3
A-2-4 Silty fine sand 1712
A-7-5 Marine clay 1560
A-7-5 Marine clay 1610
A-7-5 Marine clay 1584
A-4 Silty glacial till 2048
A-1-b Medium fine sand 1632
A-1-a Coarse gravelly sand 1728
Table 19.4 shows the corresponding dry densities and moisture contents of the specimens.
TABLE 19.4 Densities and moisture contents of the subgrade specimens
County Cumberland Hancock York
Town(s) Standish-Gorham Hancock-Sullivan Saco-Buxton
Moisture Content, % 8.0 11.3 10.0
Target Dry Density, kg/m3 1762 1712 1712
Task 4: Determine Laboratory Resilient Modulus:
The laboratory resilient modulus tests were conducted in accordance with AASHTO TP
46-94 (21).
The bulk density was calculated using the formula,
( )wdb += 1γγ
The amount of water used in the preparation of the specimens was in-place moisture
content + 1%. Table 19.5 shows the moisture contents of the specimens prepared for the
laboratory MR testing.
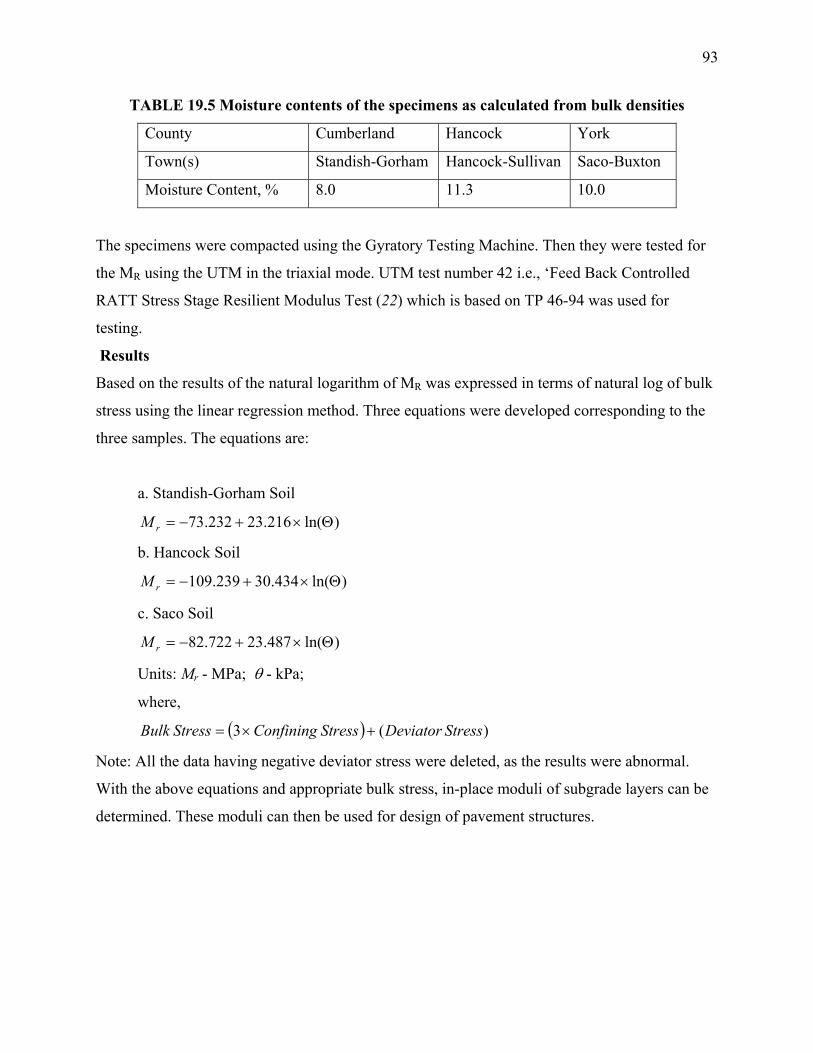
93
TABLE 19.5 Moisture contents of the specimens as calculated from bulk densities
County Cumberland Hancock York
Town(s) Standish-Gorham Hancock-Sullivan Saco-Buxton
Moisture Content, % 8.0 11.3 10.0
The specimens were compacted using the Gyratory Testing Machine. Then they were tested for
the MR using the UTM in the triaxial mode. UTM test number 42 i.e., ‘Feed Back Controlled
RATT Stress Stage Resilient Modulus Test (22) which is based on TP 46-94 was used for
testing.
Results
Based on the results of the natural logarithm of MR was expressed in terms of natural log of bulk
stress using the linear regression method. Three equations were developed corresponding to the
three samples. The equations are:
a. Standish-Gorham Soil
)ln(216.23232.73 Θ×+−=rM
b. Hancock Soil
)ln(434.30239.109 Θ×+−=rM
c. Saco Soil
)ln(487.23722.82 Θ×+−=rM
Units: Mr - MPa; θ - kPa;
where,
( ) )(3 StressDeviatorStressConfiningStressBulk +×=
Note: All the data having negative deviator stress were deleted, as the results were abnormal.
With the above equations and appropriate bulk stress, in-place moduli of subgrade layers can be
determined. These moduli can then be used for design of pavement structures.
94
SECTION 20: DISCUSSION
This research study was conducted primarily to develop a rational and practical mix design
system for Full Depth Reclamation (FDR) using asphalt emulsion. The key findings from this
research are related to the use of a slotted mold and determination of appropriate design number
of gyrations (for using the Superpave gyratory compactor) for compacting design samples,
establishment of a procedure for determination of optimum total fluid content, determination of
post compaction curing time and temperature, and evaluation of different strength and durability
of FDR mixes with different types of additives.
Criteria for mix design
The criteria used for determination of optimum total fluid content are based on the determination
of dry density and resilient modulus. The dry density criterion was selected because of the
experience of use of this parameter in determination of optimum fluid content in compaction of
soils (such as for subgrade), and in general, a good relationship between dry density and strength.
However, because of difference in densities of materials in base course, an increase in dry
density does not necessarily mean a proportional change in stiffness. Therefore, it is important
that in addition to checking dry density, one uses a stiffness criterion to select optimum fluid
content. Hence, the second criterion of resilient modulus was selected.
Generally, both dry density and resilient modulus can be determined by using
conventional testing equipment, commonly available in DOT laboratories. However, FDR mixes,
which are essentially not as “bound” as say Hot Mix Asphalt (HMA), are susceptible to
breakdown, when tested according to the commonly used saturated surface dry bulk specific
gravity testing procedure (for determination of dry density). Quite often therefore, bulk specific
gravities of samples of cold recycled mixes such as FDR mixes, are determined from their mass
95
and volume. The volume is estimated from the dimension of the samples. It seems that a better
procedure is needed to determine the bulk specific gravities more accurately. Hence, the use of
vacuum sealed method has been suggested. The equipment for this procedure is now
commercially available, and an ASTM procedure for using this procedure is also available.
Moisture damage
The philosophy used in the development of the mix design procedure is that one should use as
much additive, such as asphalt emulsion, as it is possible, without causing a significant decrease
in stiffness of the mix. The logic behind this approach is that an optimum emulsion content
would provide adequate coating around the particles and hence provide adequate durability to the
mix. If the criterion of a high stiffness (as measured by resilient modulus test) is followed, then
one also ensures that the mix has adequate stiffness – for adequate structural strength. The
researchers felt that at this time, although several candidate tests are available, a single simple
and adequate test for determination of moisture susceptibility of stabilized mixes is not available.
However, it is noted that adequate resistance to moisture damage is a significant factor in the
obtaining good performance from stabilized base course mixes, and that DOT s should consider
any good test that they are comfortable with, to evaluate resistance of designed FDR mixes to
moisture damage.
Three different tests for evaluation of moisture susceptibility of stabilized base course
materials need to be discussed. The first procedure is based on the determination of retained
tensile strength of mixes. Generally, the ratio of tensile strength of unconditioned and
conditioned samples and/or the tensile strength of conditioned samples (conditioned through a
series of specific number of freezing and thawing or wetting and drying cycles or simply by
soaking for a specific period) is determined and checked against a minimum specified value. For
96
example, the maximum soaked tensile strength is considered for the selection of optimum asphalt
content for mixes reclaimed with foamed asphalt. Low conditioned strength is indicative of a
mix with high moisture damage potential.
The second procedure, the Tube suction Test, (developed by the Texas Transportation
Institute), which has been developed specifically for cement stabilized base course mixes, is
based on the determination capillary rise of moisture within test samples. This test has been
modified from the original test procedure, which was developed for evaluating granular materials
(23, 24). The steps in this test consists of compacting a sample, conditioning the sample for
simulating field conditions, placing the sample in de-ionized water, and monitoring the moisture
condition at the surface with a dielectric probe. Excessive amount of free water within the
sample is indicative of a mix with high potential of moisture damage in freeze-thaw
environments. Appropriate relationships between significant loss in strength and measured
dielectric constant have been developed and work is currently underway for development of a
procedure for using both compression strength and Tube Suction test results for use in
determination of optimum amounts of cementitious stabilizer (23).
The third procedure, a stripping test, which has been developed by IntroTek Inc., is based
on simulating cycles of pore pressure and suction with the use of laboratory equipment.
Basically, the test equipment consists of a system to use a supply of compressed air to load and
apply vacuum to force air out and in (respectively) through a sample, which is keep in water
maintained at a constant temperature. Repeated cycles of pore pressure and suction cause a
stripping of asphalt binder from the mixes. Conditioned samples can be tested for strength, and
appropriate decision regarding the suitability of a mix can be made. One additional feature of the
equipment is its ability to detect stripped materials, by measuring the turbidity of the water

97
through a sensor. Work is underway at Worcester Polytechnic Institute (WPI) for developing a
procedure using this equipment for evaluation of moisture susceptibility of HMA and reclaimed
mixes.
98
SECTION 21: CONCLUSIONS AND RECOMMENDATIONS
Based on the research conducted in this study, the following conclusions are obtained.
1. The Superpave gyratory compactor can be used successfully for compacting full depth
reclamation mixes. Care should be taken to discard plus 37.5 mm material before
compaction.
2. A dry density versus total fluid content criteria can be used to determine the optimum
total fluid content. If an asphalt emulsion is used, then the total fluid consists of
preexisting water in the material plus the emulsion.
3. In all the cases the in-place densities were closer to densities at 50 gyration. For all cases
except cement, the in-place densities were 96-98 % of densities at 50 gyrations. The in-
place density for the cement section was at 92 % of the density at 50 gyrations
4. Comparison of mix design results with samples compacted to 75 and 50 gyrations
showed that the optimum total fluid contents obtained for samples compacted to 75
gyrations (7 % for water and 5-6.5% for emulsion) were not significantly different from
the optimum total fluid contents obtained for samples compacted to 50 gyrations (7 % for
water and 5-6.5% for emulsion).
5. Any one of the additives considered in this study improves resistance of FDR against
moisture damage. Cement and emulsion plus lime mixes show very high resistance to
moisture damage compared to the other mixes. However, on the basis of wet tensile
strength, emulsion plus lime is better than any other additive considered in this study.
6. From consideration of strength gain during curing, 3 % emulsion plus 2 % lime seems to
provide a much better mix compared to a mix with 3 % emulsion only.
7. Based on the resilient modulus values, the layer coefficients were determined to be as
99
follows:
Cement-5% - 0.28
Emulsion-3.4 % plus 2 % lime – 0.37
Emulsion-2.2% - 0.24
8. Comparison of improvement in structural number showed that Emulsion-3.4 %
plus 2 % lime showed the highest increase, followed by cement, water and
emulsion section.
9. A comparison of cost per mile per 1000 ESAL increase in life showed that
recycling with emulsion (3.4 %) and lime (2 %) is the most cost effective option.
10. A visual evaluation of recycled sections after one year showed no significant
distress in any section, except in the water section where a moderate amount of
edge cracking was noted.
Based on the above conclusions the following recommendations are made regarding mix
design and construction of Full Depth Reclamation (FDR).
1. Use of a slotted mold is recommended to allow squeezing out of water during compaction
of full depth reclamation mixes.
2. Use of samples in sealed bags (CoreLokTM method) is recommended for determination of
bulk specific gravity in the laboratory.
3. Use density and resilient modulus versus total fluid content criteria for selecting optimum
additive contents.
4. Use emulsion and lime, and cement in low percentage, for full depth reclamation of
materials similar to the materials studied in this project.
5. FDR samples for mix design should be compacted to 50 gyrations during mix design, and

100
a minimum of 95 % of density of in-place loose mix samples, compacted to 50 gyration,
be achieved in a control strip in the field. Compaction in actual project must achieve at
least 98 percent of the control strip density. These compaction considerations are
suggested on the basis of good experience with the use of similar specifications for Hot
Mix Asphalt (HMA).
6. Increase in structural numbers for FDR layers should be considered for designing binder
and surface layers.
7. Use a suitable test procedure, such as the soaked or conditioned strength or Tube suction
test or stripping test, should be considered for evaluation of moisture susceptibility of
designed mixes.
101
SECTION 22: REFERENCES 1. Kearney, Edward, J. and John E. Huffman. The Full Depth Reclamation Process. Paper
presented at the 78th Annual Meeting of the Transportation Research Board, Washington D.C., 1999.
2. Maine DOT specification on Cold In-Place Recycled Pavement, Special Provision Section 307.
3. An Overview of Recycling and Reclamation Methods for Asphalt Pavement Rehabilitation. Asphalt Recycling and Reclaiming Association, Annapolis, MD, 1992.
4. Epps, Jon, A. Cold-Recycled Bituminous Concrete Using Bituminous Materials, In NCHRP Synthesis of Highway Practice 160, TRB, National Research Council, Washington, DC, 1990
5. The Asphalt Institute. Asphalt Cold Mix Manual, Manual Series No. 14, 3rd edition, Lexington, KY, 1989.
6. Maine DOT specification on Cold In-Place Recycled Pavement, Special Provision Section 307
7. Kandhal, P. S, and Rajib Mallick, Pavement Recycling Guidelines, for State and Local Governments Federal Highway Administration, FHWA-SA-98-042, Washington, D. C, 1998.
8. Ibrahim, Hamdy El-Sayed. Assessment and Design of Emulsion-Aggregate Mixtures for Use in Pavements, Ph.D. dissertation, University of Nottingham, March 1998.
9. Pickett, J. B. Full-Depth Reclamation of Asphalt Roads with Liquid Calcium Chloride, Fifth International Conference on Low-Volume Roads 1991, Transportation Research Record No. 1291, Transportation Research Board, National Research Council, Washington, DC, 1991.
10. Asphalt Emulsion Manufacturers Association and the Asphalt Institute, A Basic Asphalt Emulsion Manual. Manual Series No. 19, 3rd Edition, 1986.
11. Full Depth Reclamation, Publication No. OFCB 9189, Caterpillar, 1995. 12. Finn., F. N., R. G. Hicks, W. J. Kari, and L. D. Coyne. Design of Emulsified Asphalt Treated
Bases. Highway Research Record 239, Transportation Research Board, National Research Council, Washington, DC 1968.
13. Santucci, L. E. Thickness Design Procedure for Asphalt and Emulsified Asphalt Mixes Proceedings of 4th International Conference on the Structural Design of Asphalt Pavements, University of Michigan, Ann Arbor, USA, 1977.
14. CoreLokTM, Instrotek, Incorporated. 3201 Wellington Ct., Suite 101, Raleigh, NC 27615. 15. Chen, Dar-Hao, Wei Wu, Rong He, John Bilyeu and Mike Arrelano. Evaluation of In-Situ
Resilient Modulus Testing techniques. Recent Advances in the Characterization of Transportation Geo-Materials. Geotechnical Special Publication No. 89, Edited by Erol Tutumler and A. T. Papagiannakis, American Society of Civil Engineers, 1999.
16. Al- Hussaini, M. M. and Townsend, F. C., 1975. Investigation of Ko Testing in Cohesionless Soils. Technical Report S-75-11, U.S. Army Engineer Waterways Experiment Station, Vicksburg, Mississippi.
17. AASHTO T265. Laboratory Determination of Moisture Content of Soils. Standard Specifications for Transportation Materials and Method of Sampling and Testing, Eighteenth Edition, Part II, 1997.
18. AASHTO T 89-96. Determining the Liquid Limit of Soils. Standard Specifications for Transportation Materials and Method of Sampling and Testing, Eighteenth Edition, Part II, 1997.
102
19. AASHTO T 90-96. Determining the Plastic Limit and Plasticity Index of Soils. Standard Specifications for Transportation Materials and Method of Sampling and Testing, Eighteenth Edition, Part II, 1997.
20. Janoo V.C., Bayer J.J. Jr, Durell G.D., and Smith C.E. Jr. Resilient Modulus for New Hampshire Subgrade Soils for Use in Mechanistic AASHTO Design. U.S. Army Cold Regions Research and Engineering Laboratory, Hanover, NH 03302, September 1999.
21. AASHTO TP46-94. Standard Test method for Determining the Resilient Modulus of Soils and Aggregate Materials. AASHTO Provisional Standards, June 1998.
22. UTM Test No: 42, Feed Back Controlled RATT Stress Stage Resilient Modulus Test, Universal Testing Machine Reference Manual, February 2000.
23. Syed, Imran, Tom Scullion and J. Pat Harris. Durability of Recycled and Stabilized Pavement Materials. Recent Advances in the Characterization of Transportation Geo-Materials. Geotechnical Special Publication No. 89, Edited by Erol Tutumler and A. T. Papagiannakis, American Society of Civil Engineers, 1999.
24. Scullion, T. and T. Saarenketo. Using Suction and Dielectric Measurement as Performance Indicators for Aggregate Base Materials. Transportation Research Record No. 1577. Transportation Research Board, National Research Council, Washington, D. C, 1997.