Embed Size (px)
Citation preview
DEVELOPMENT OF NEW METHODS TO QUANTIFY
EFFECTIVE IMPERVIOUS AREA IN URBAN WATERSHEDS
Ali Ebrahimian, John Gulliver, Bruce Wilson
Minnesota Water Resources Conference
October 14th , 2014. St. Paul, MN.
http://stormwater.safl.umn.edu/
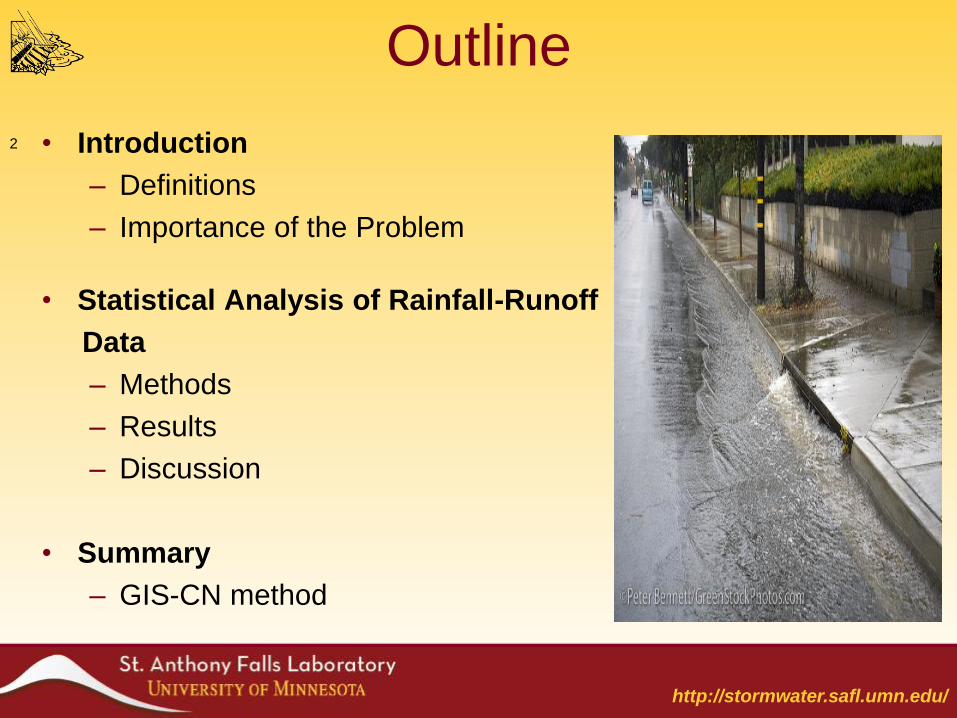
Outline
• Introduction
– Definitions
– Importance of the Problem
• Statistical Analysis of Rainfall-Runoff
Data
– Methods
– Results
– Discussion
• Summary
– GIS-CN method
2
http://stormwater.safl.umn.edu/
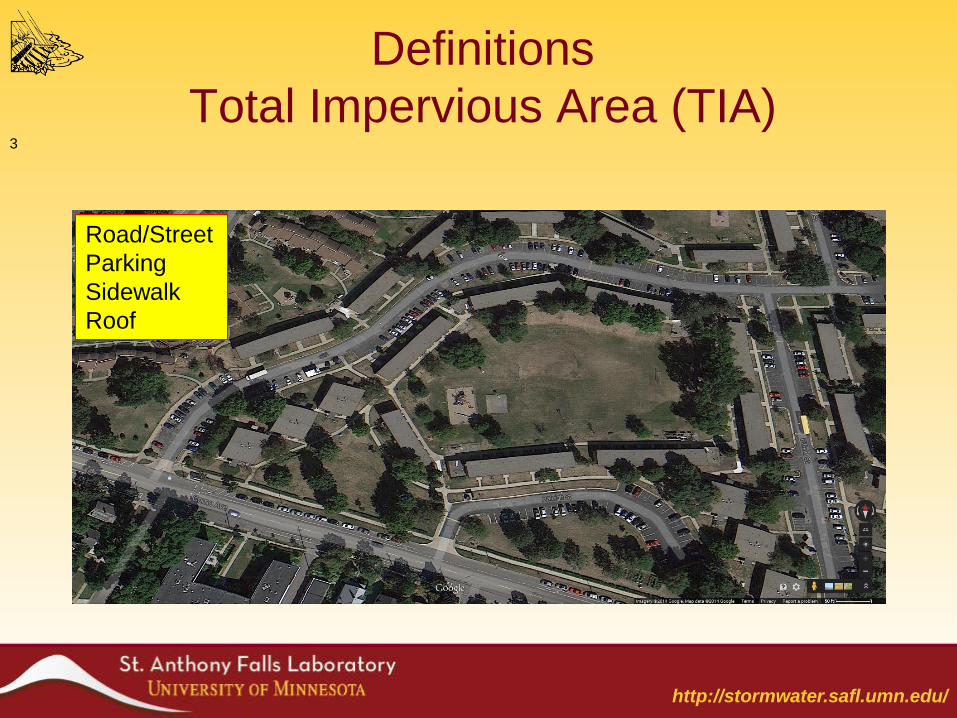
Definitions
Total Impervious Area (TIA)
Road/Street
Parking
Sidewalk
Roof
3
http://stormwater.safl.umn.edu/
Definitions
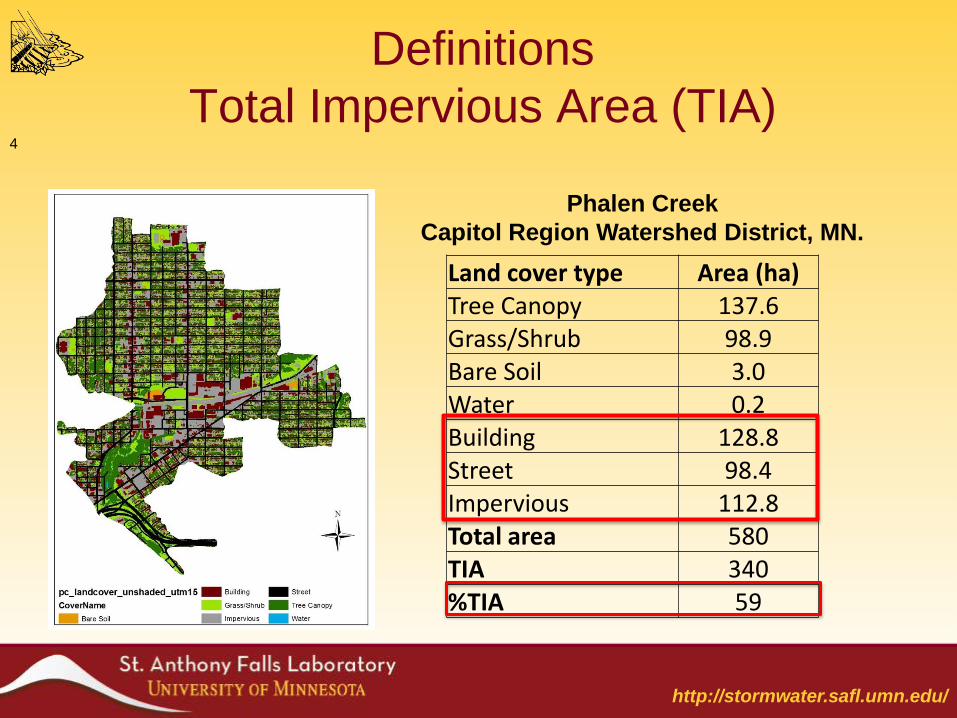
Total Impervious Area (TIA)
Land cover type Area (ha) Tree Canopy 137.6 Grass/Shrub 98.9 Bare Soil 3.0 Water 0.2 Building 128.8 Street 98.4 Impervious 112.8 Total area 580 TIA 340 %TIA 59
Phalen Creek
Capitol Region Watershed District, MN.
4
http://stormwater.safl.umn.edu/
Definitions
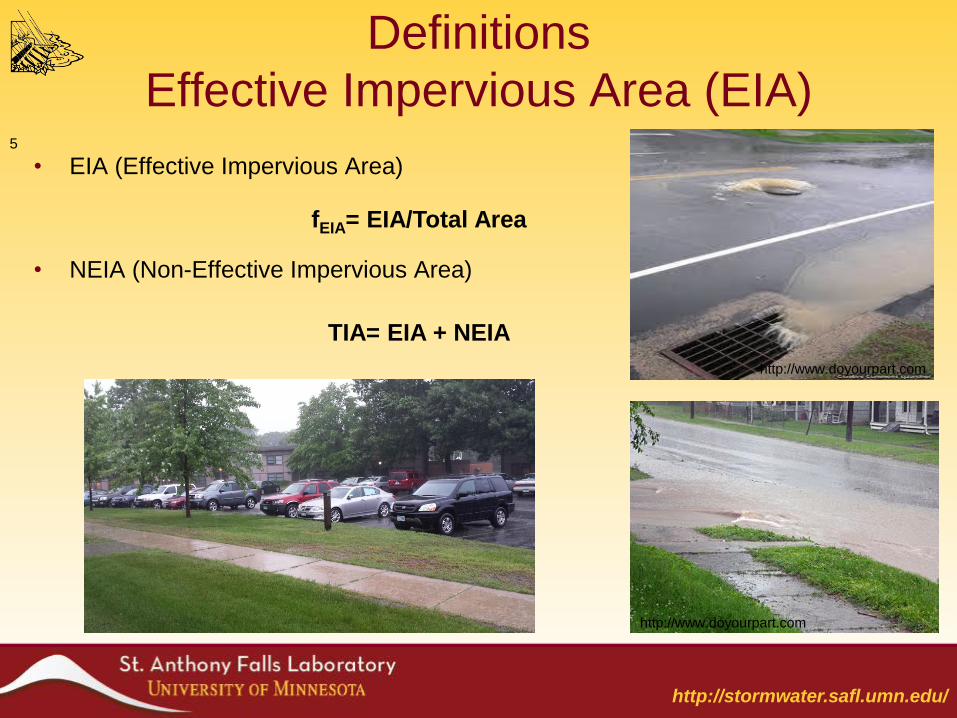
Effective Impervious Area (EIA)
• EIA (Effective Impervious Area)
• NEIA (Non-Effective Impervious Area)
5
http://www.doyourpart.com
http://www.doyourpart.com
TIA= EIA + NEIA
fEIA= EIA/Total Area
http://stormwater.safl.umn.edu/
Why is EIA important?
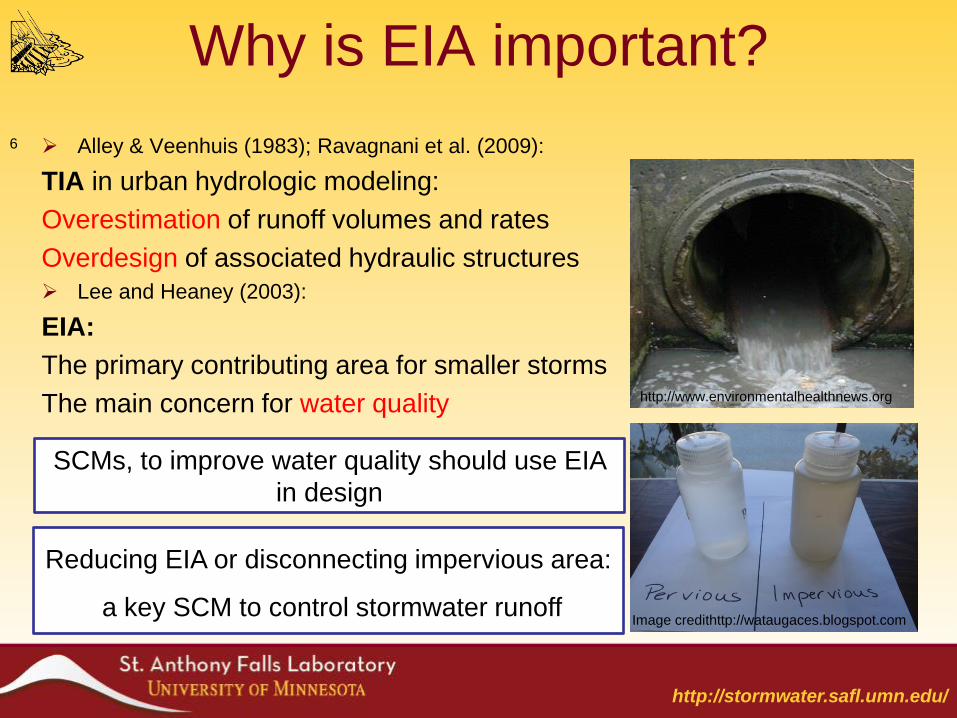
Alley & Veenhuis (1983); Ravagnani et al. (2009):
TIA in urban hydrologic modeling:
Overestimation of runoff volumes and rates
Overdesign of associated hydraulic structures
Lee and Heaney (2003):
EIA:
The primary contributing area for smaller storms
The main concern for water quality
6
Image credithttp://wataugaces.blogspot.com
http://www.environmentalhealthnews.org
SCMs, to improve water quality should use EIA
in design
Reducing EIA or disconnecting impervious area:
a key SCM to control stormwater runoff
http://stormwater.safl.umn.edu/
Why is EIA important?
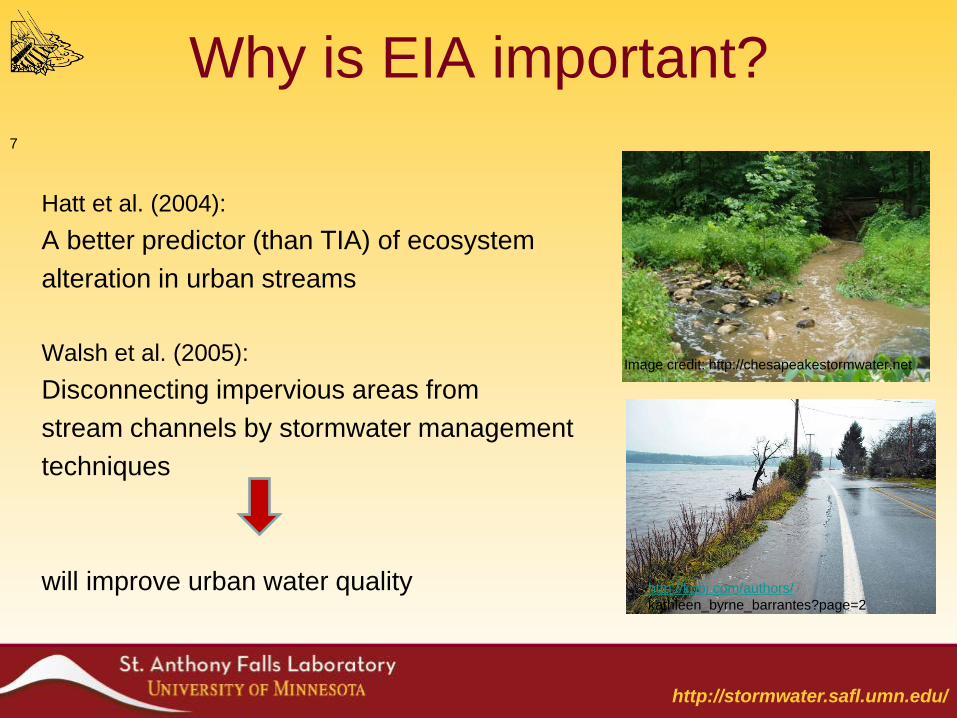
Hatt et al. (2004):
A better predictor (than TIA) of ecosystem
alteration in urban streams
Walsh et al. (2005):
Disconnecting impervious areas from
stream channels by stormwater management
techniques
will improve urban water quality
7
Image credit: http://chesapeakestormwater.net
http://kpbj.com/authors/
kathleen_byrne_barrantes?page=2
http://stormwater.safl.umn.edu/
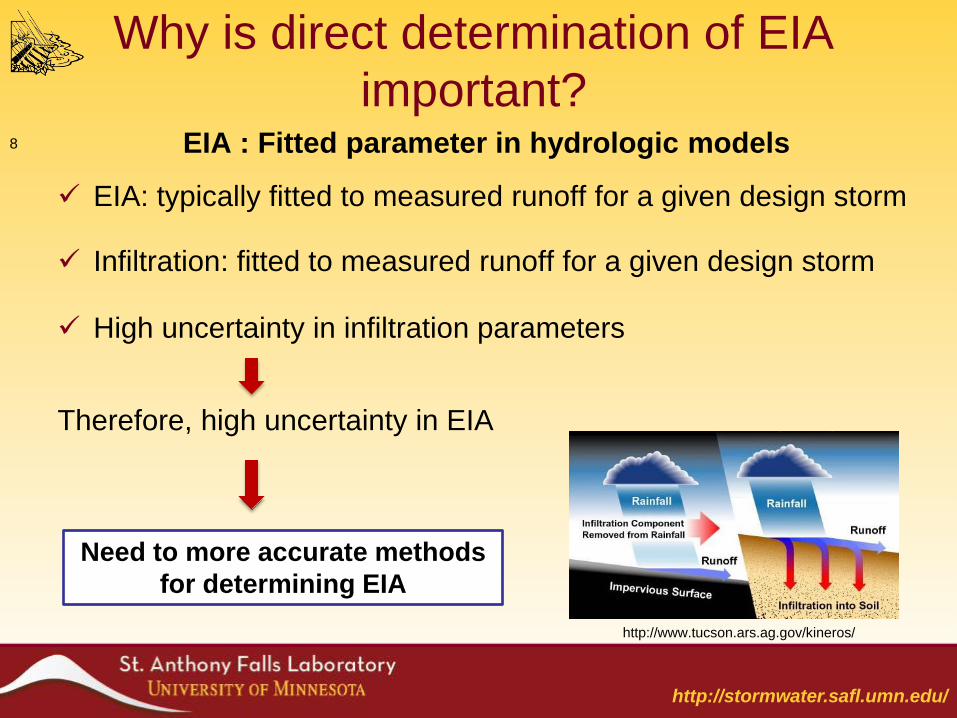
Why is direct determination of EIA
important? EIA : Fitted parameter in hydrologic models
EIA: typically fitted to measured runoff for a given design storm
Infiltration: fitted to measured runoff for a given design storm
High uncertainty in infiltration parameters
Therefore, high uncertainty in EIA
8
http://www.tucson.ars.ag.gov/kineros/
Need to more accurate methods
for determining EIA
http://stormwater.safl.umn.edu/
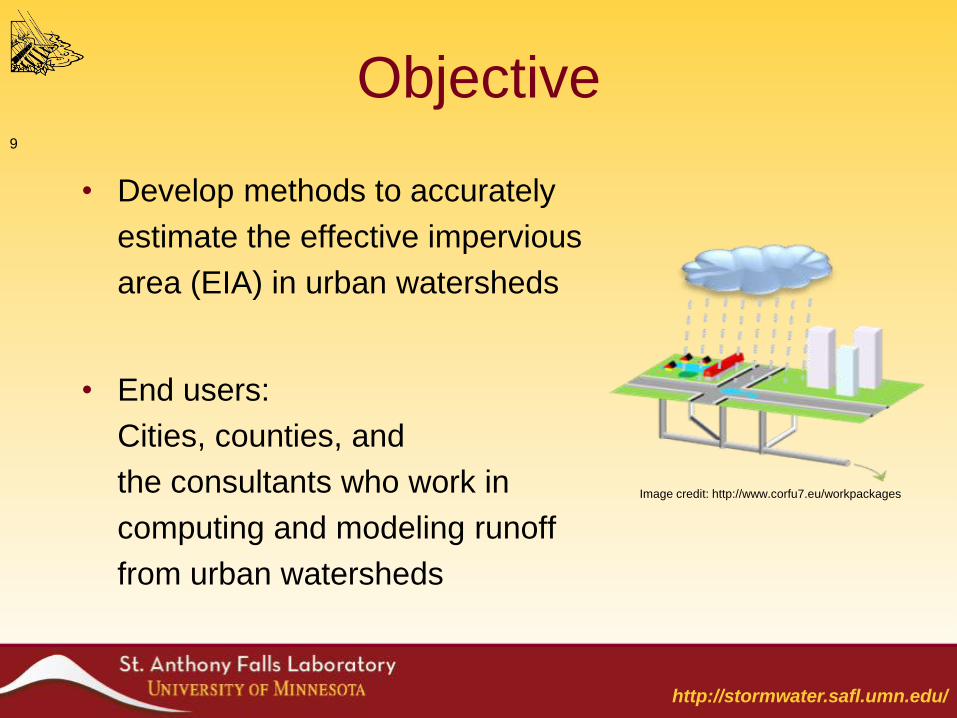
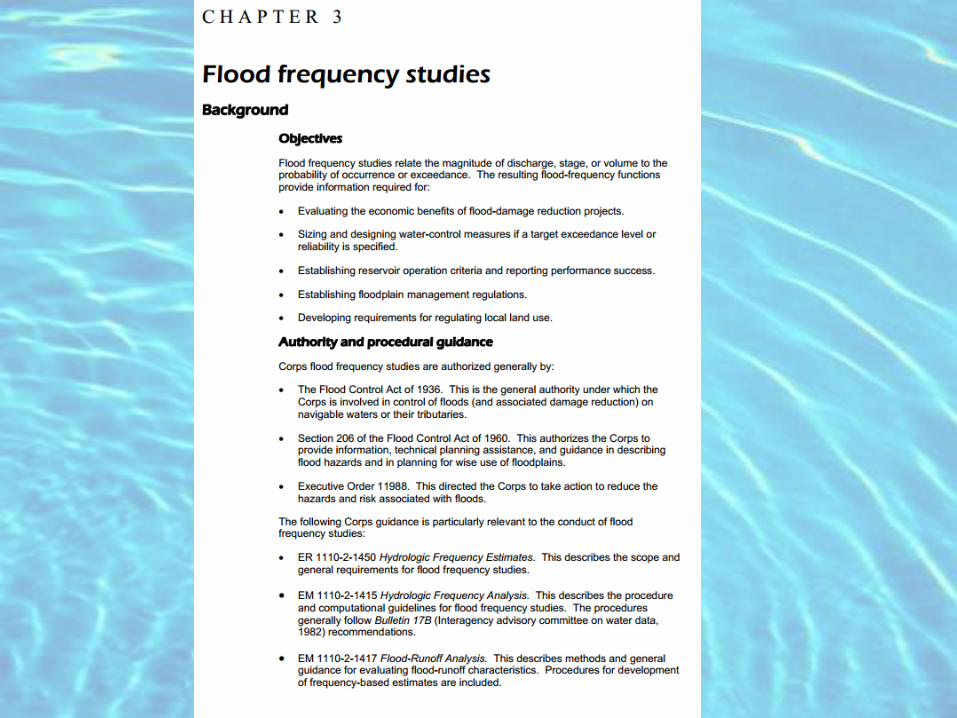
Objective
• Develop methods to accurately
estimate the effective impervious
area (EIA) in urban watersheds
• End users:
Cities, counties, and
the consultants who work in
computing and modeling runoff
from urban watersheds
Image credit: http://www.corfu7.eu/workpackages
9
http://stormwater.safl.umn.edu/
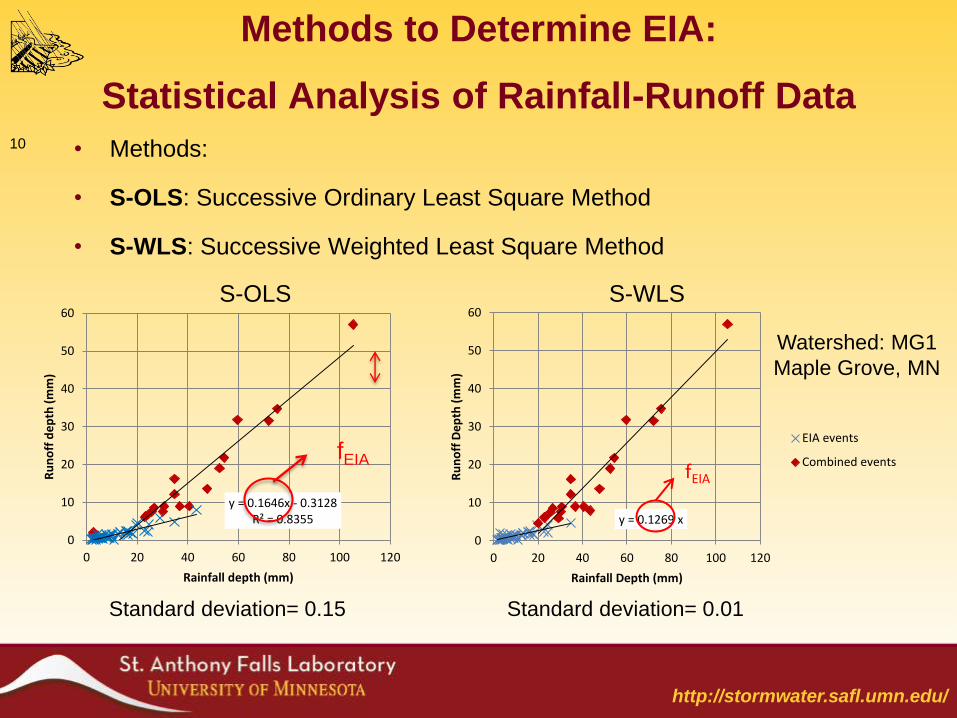
Methods to Determine EIA:
Statistical Analysis of Rainfall-Runoff Data
• Methods:
• S-OLS: Successive Ordinary Least Square Method
• S-WLS: Successive Weighted Least Square Method
10
S-OLS S-WLS
y = 0.1646x - 0.3128 R² = 0.8355
0
10
20
30
40
50
60
0 20 40 60 80 100 120
Ru
no
ff d
ep
th (
mm
)
Rainfall depth (mm)
Watershed: MG1
Maple Grove, MN
fEIA
y = 0.1269 x
0
10
20
30
40
50
60
0 20 40 60 80 100 120
Ru
no
ff D
ep
th (
mm
)
Rainfall Depth (mm)
EIA events
Combined eventsfEIA
Standard deviation= 0.15 Standard deviation= 0.01
http://stormwater.safl.umn.edu/
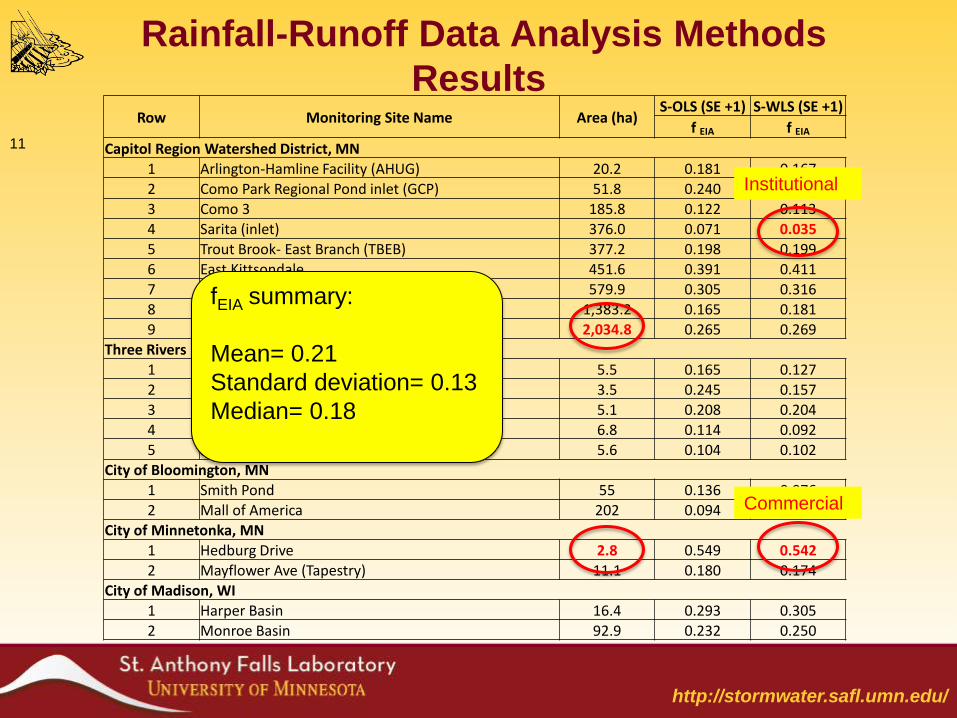
Rainfall-Runoff Data Analysis Methods
Results
11
Row Monitoring Site Name Area (ha) S-OLS (SE +1) S-WLS (SE +1)
f EIA f EIA
Capitol Region Watershed District, MN
1 Arlington-Hamline Facility (AHUG) 20.2 0.181 0.167
2 Como Park Regional Pond inlet (GCP) 51.8 0.240 0.357
3 Como 3 185.8 0.122 0.113
4 Sarita (inlet) 376.0 0.071 0.035
5 Trout Brook- East Branch (TBEB) 377.2 0.198 0.199
6 East Kittsondale 451.6 0.391 0.411
7 Phalen Creek 579.9 0.305 0.316
8 St. Anthony Park 1,383.2 0.165 0.181
9 Trout Brook Outlet 2,034.8 0.265 0.269
Three Rivers Park District, MN
1 MG1 5.5 0.165 0.127
2 MG2 3.5 0.245 0.157
3 P1 5.1 0.208 0.204
4 P2 6.8 0.114 0.092
5 P3 5.6 0.104 0.102
City of Bloomington, MN
1 Smith Pond 55 0.136 0.076
2 Mall of America 202 0.094 0.094
City of Minnetonka, MN
1 Hedburg Drive 2.8 0.549 0.542
2 Mayflower Ave (Tapestry) 11.1 0.180 0.174
City of Madison, WI
1 Harper Basin 16.4 0.293 0.305
2 Monroe Basin 92.9 0.232 0.250
Institutional
Commercial
fEIA summary:
Mean= 0.21
Standard deviation= 0.13
Median= 0.18
http://stormwater.safl.umn.edu/
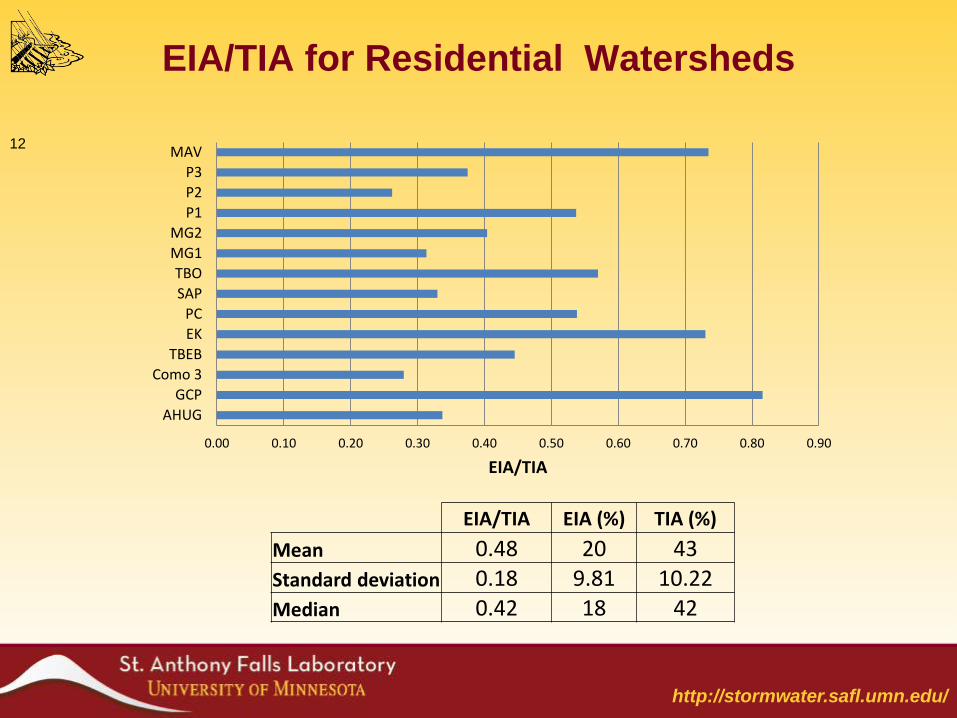
EIA/TIA for Residential Watersheds
12
0.00 0.10 0.20 0.30 0.40 0.50 0.60 0.70 0.80 0.90
AHUG
GCP
Como 3
TBEB
EK
PC
SAP
TBO
MG1
MG2
P1
P2
P3
MAV
EIA/TIA
EIA/TIA EIA (%) TIA (%)
Mean 0.48 20 43
Standard deviation 0.18 9.81 10.22
Median 0.42 18 42
http://stormwater.safl.umn.edu/
Summary
• Incorrect use of TIA in urban hydrologic modeling leads to an
overestimation of runoff volumes.
• SCMs, to improve water quality should use EIA in design.
Rainfall-Runoff Analysis Methods
Produce the most accurate results
Require qualified monitoring data (rainfall and runoff)
Next Step:
Develop new methods for determining EIA in un-gauged
watersheds using the results of the rainfall-runoff method
13
http://stormwater.safl.umn.edu/
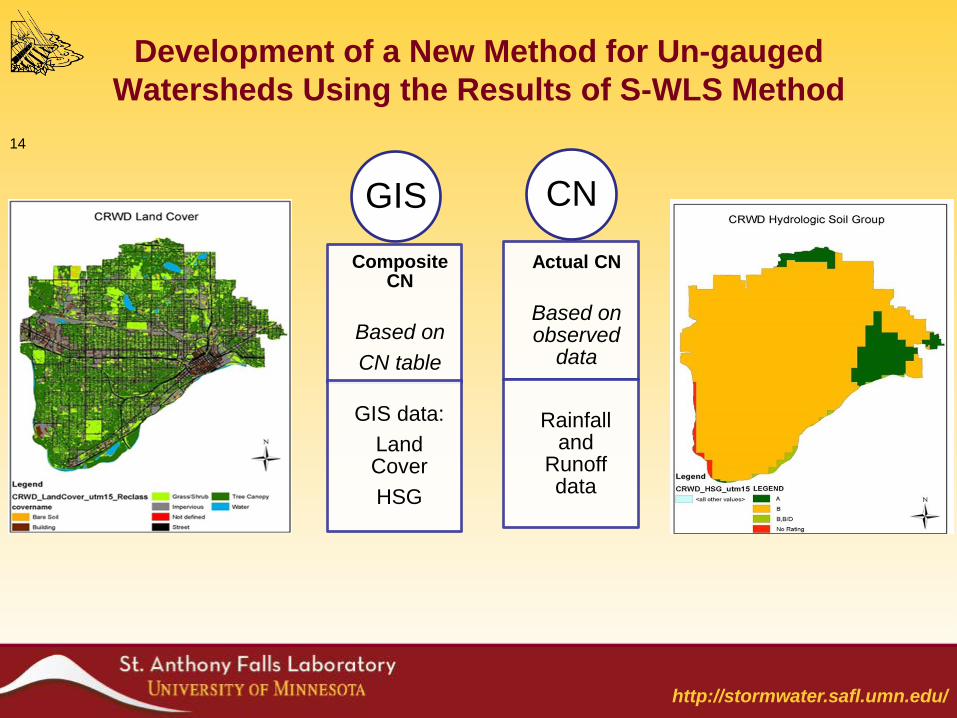
Development of a New Method for Un-gauged
Watersheds Using the Results of S-WLS Method
14
Composite CN
Based on
CN table
GIS data:
Land Cover
HSG
GIS
Actual CN
Based on observed
data
Rainfall and
Runoff data
CN
http://stormwater.safl.umn.edu/
Acknowledgement
• Minnesota Local Road Research Board
• Capitol Region Watershed District
• Three Rivers Park District
• City of St. Paul Public Works Department
• Forestry Department of the University of Minnesota
• City of Minnetonka
15

http://stormwater.safl.umn.edu/
Thank You
EFFECTS OF UPDATING RAINFALL TO ATLAS 14, CASE STUDY OF THE RICE
CREEK WATERSHED DISTRICT
Minnesota Water Resources Conference
October 14, 2014
Phil Belfiori, RCWD
Chris Otterness, HEI
Mike Lawrence, HEI
Presentation Overview
• Why is Atlas 14 important to watershed districts?
• To what magnitude does Atlas 14 affect regulatory flood elevations?
• Will Atlas 14 affect development and redevelopment?
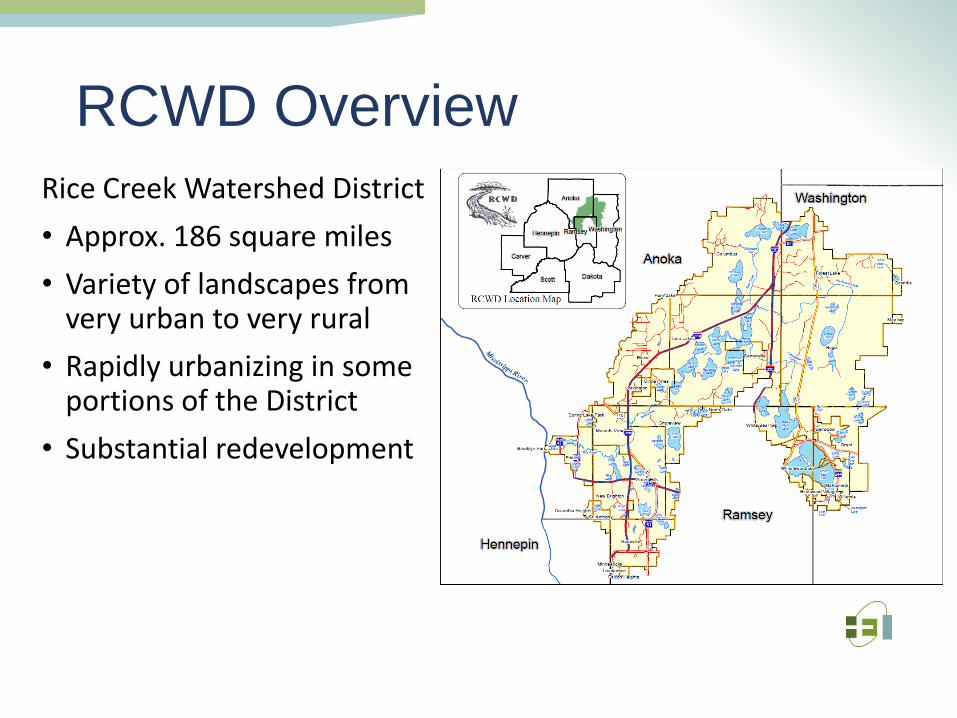
RCWD Overview
Rice Creek Watershed District
• Approx. 186 square miles
• Variety of landscapes from very urban to very rural
• Rapidly urbanizing in some portions of the District
• Substantial redevelopment
DWMP Overview
• District Wide Modeling Program (DWMP) Initiated in 2008 .
• Major goal was to update floodplain mapping and elevations for use in the Regulatory Program
• To achieve this goal the plan was to create detailed modeling of the entire District and make both the results and inputs readily available
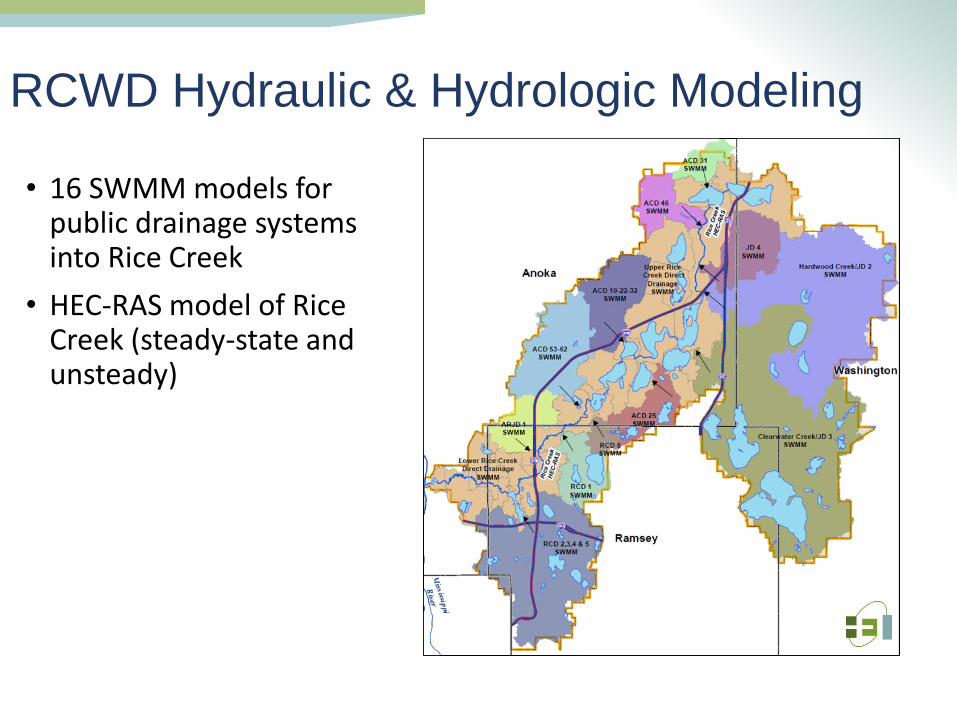
RCWD Hydraulic & Hydrologic Modeling
• 16 SWMM models for public drainage systems into Rice Creek
• HEC-RAS model of Rice Creek (steady-state and unsteady)
Maintenance
• Preserves the investment of the RCWD (>$1M)
• Necessary for regulatory administration
• Models are updated annually as needed
• Mapping updated only with “major” modifications
• Model changes are typically geometric changes (pipe size & inverts, ponds, ditches)
• Special case …. Atlas 14
Atlas 14 Implementation
• RCWD will be using Atlas 14 in place of TP 40 for rainfall depths
• Will be adopted as part of a subsequent rule revision
• Applies to both RCWD permitting and RCWD regulatory floodplain
• Models needed to be updated to understand the Impacts of Atlas 14
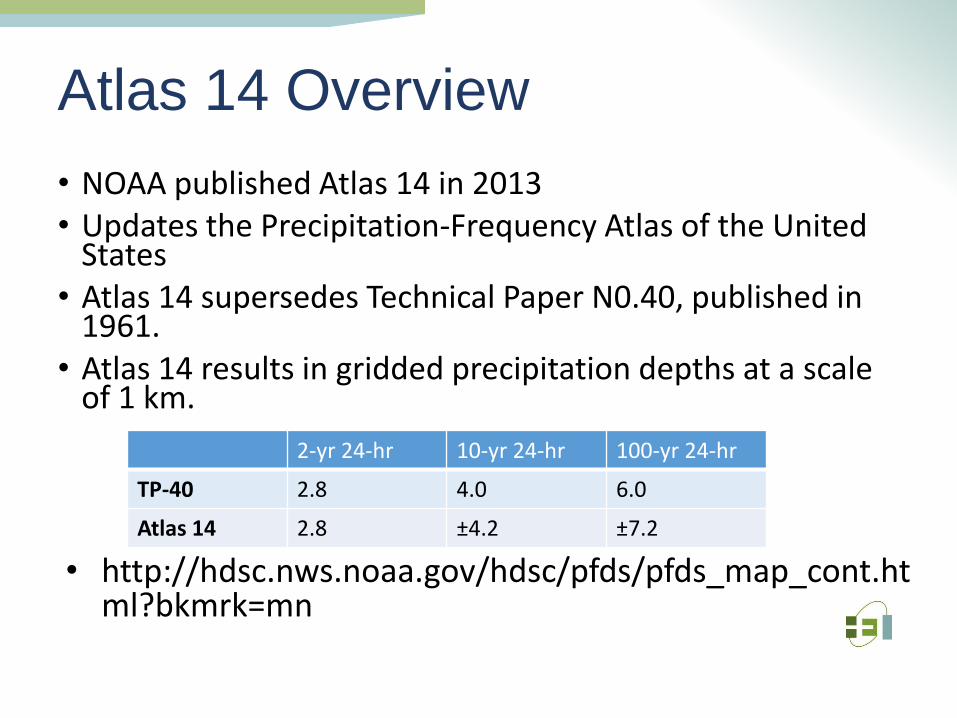
Atlas 14 Overview
• NOAA published Atlas 14 in 2013 • Updates the Precipitation-Frequency Atlas of the United
States • Atlas 14 supersedes Technical Paper N0.40, published in
1961. • Atlas 14 results in gridded precipitation depths at a scale
of 1 km.
2-yr 24-hr 10-yr 24-hr 100-yr 24-hr
TP-40 2.8 4.0 6.0
Atlas 14 2.8 ±4.2 ±7.2
• http://hdsc.nws.noaa.gov/hdsc/pfds/pfds_map_cont.html?bkmrk=mn
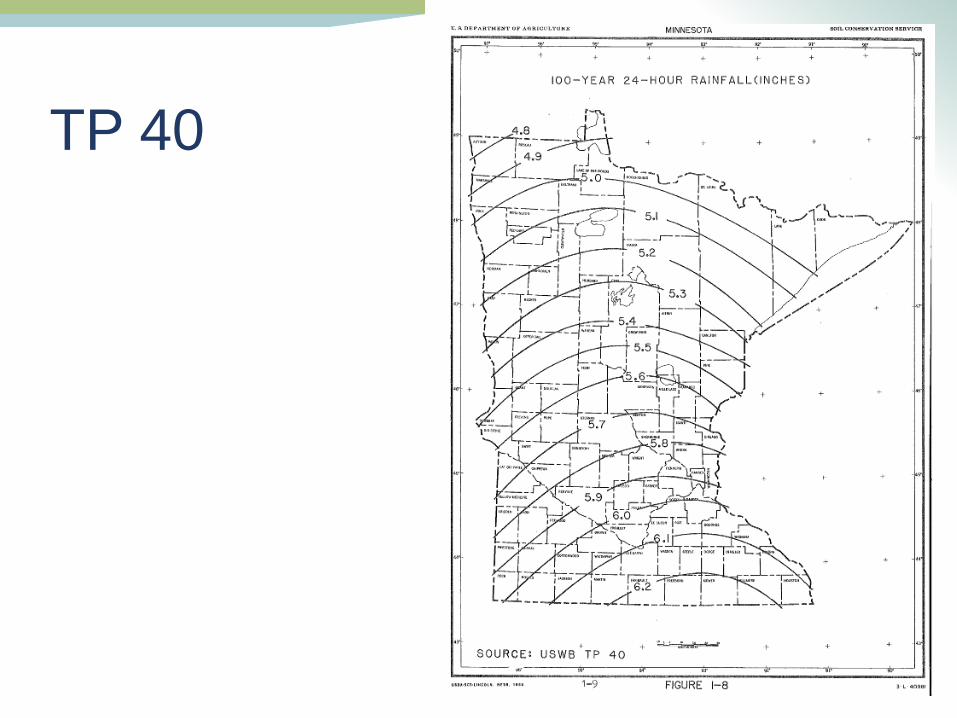
TP 40
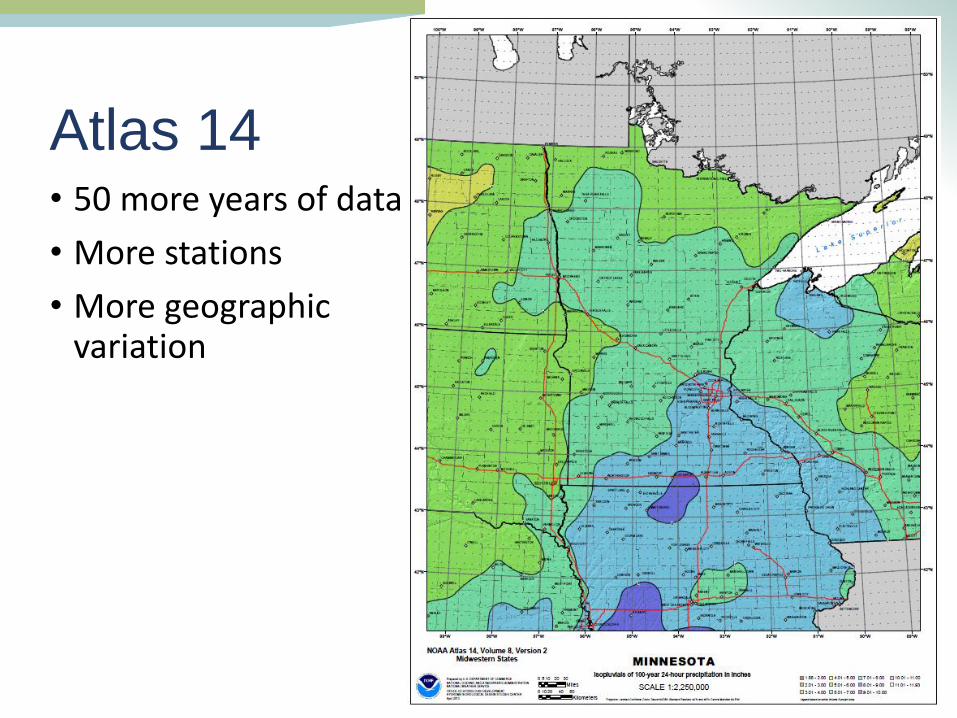
Atlas 14 • 50 more years of data
• More stations
• More geographic variation
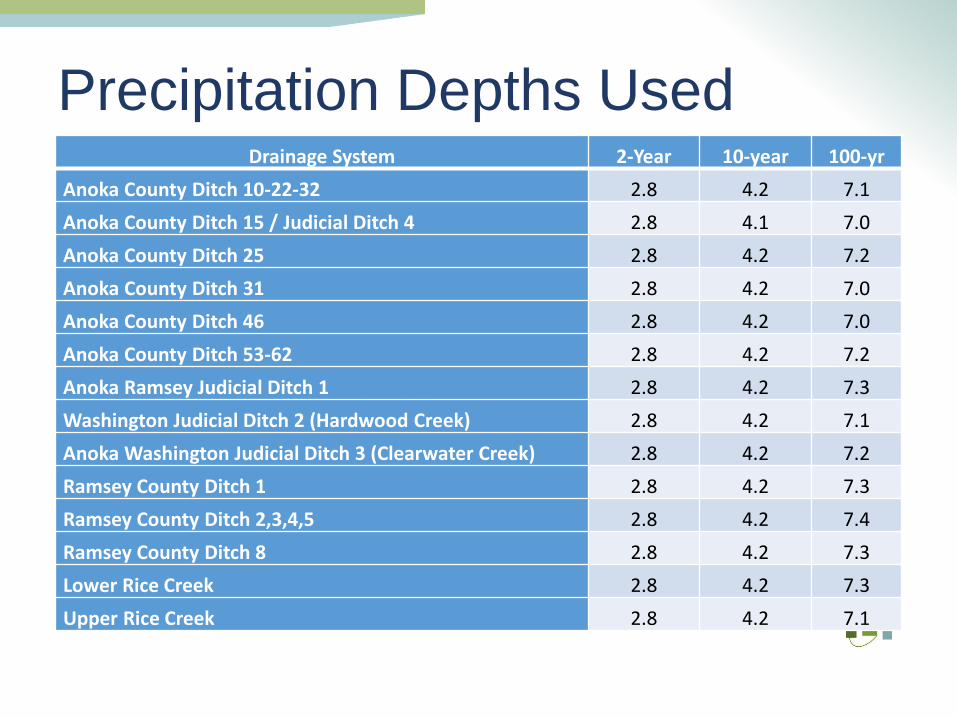
Precipitation Depths Used
Drainage System 2-Year 10-year 100-yr
Anoka County Ditch 10-22-32 2.8 4.2 7.1
Anoka County Ditch 15 / Judicial Ditch 4 2.8 4.1 7.0
Anoka County Ditch 25 2.8 4.2 7.2
Anoka County Ditch 31 2.8 4.2 7.0
Anoka County Ditch 46 2.8 4.2 7.0
Anoka County Ditch 53-62 2.8 4.2 7.2
Anoka Ramsey Judicial Ditch 1 2.8 4.2 7.3
Washington Judicial Ditch 2 (Hardwood Creek) 2.8 4.2 7.1
Anoka Washington Judicial Ditch 3 (Clearwater Creek) 2.8 4.2 7.2
Ramsey County Ditch 1 2.8 4.2 7.3
Ramsey County Ditch 2,3,4,5 2.8 4.2 7.4
Ramsey County Ditch 8 2.8 4.2 7.3
Lower Rice Creek 2.8 4.2 7.3
Upper Rice Creek 2.8 4.2 7.1
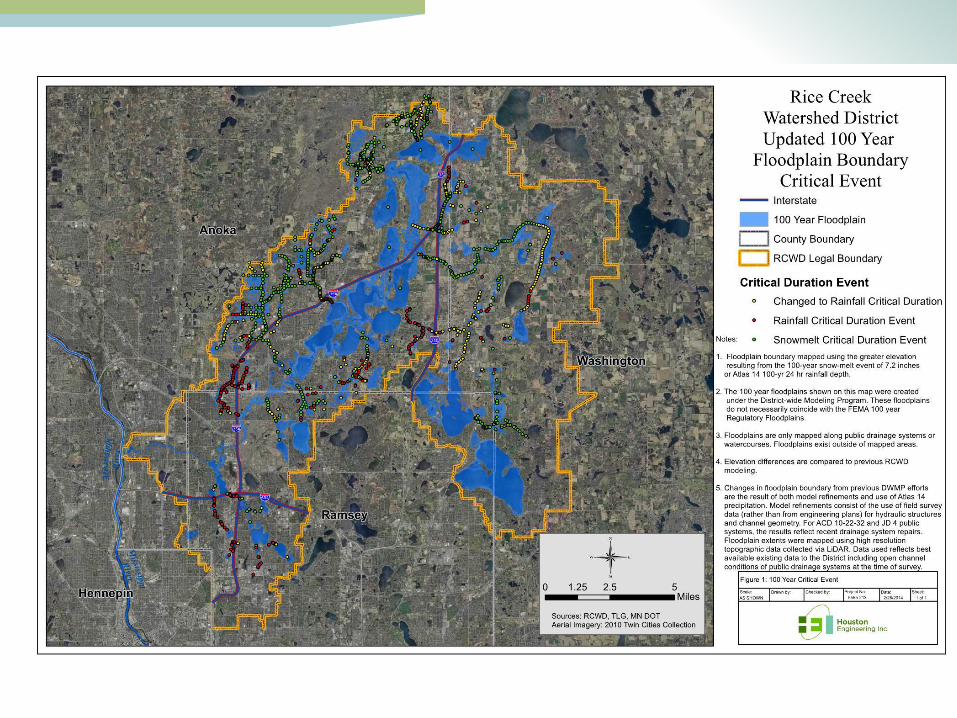
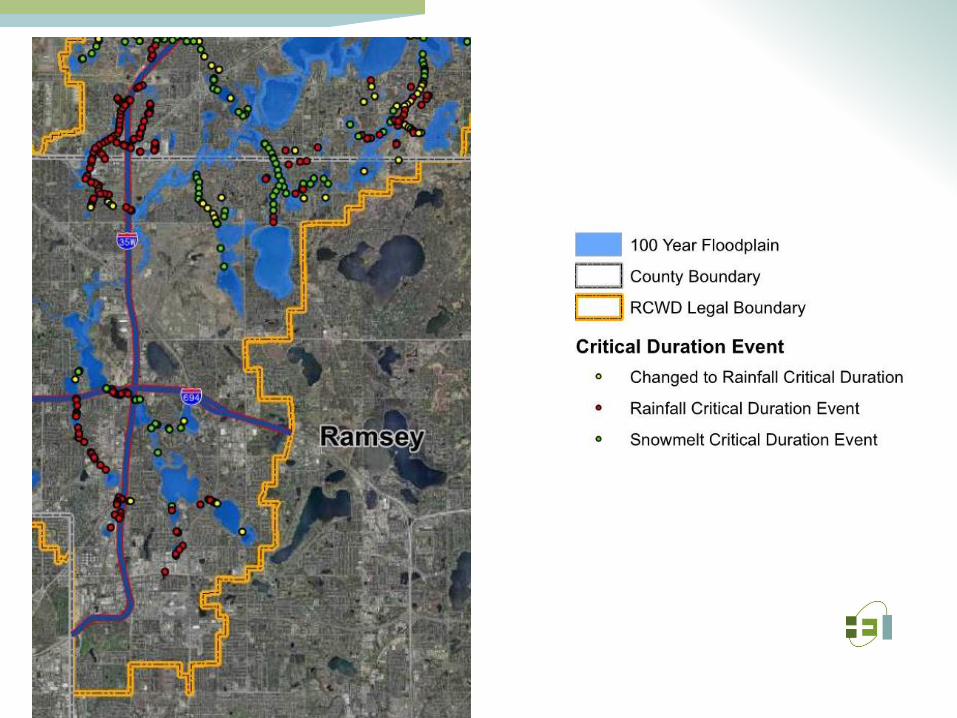
Results: Critical Duration Event
The 100-year critical duration event is the rainfall or snowmelt event that results in the greatest water surface elevation
• 10-day snowmelt remains critical for the majority • along Rice Creek and the rural portions of the District.
• 24-hour rainfall event is the critical • for most urbanized portions of the District:
Curve Number Runoff
• Average Subwatershed CN 69.36
• Spatially weighted Average CN: 71.25
• Average Runoff from each subwatershed increased for the 100 year event from 2.81” to 3.75” - 34% increase (rainfall increase 6” to 7.2”)
• Total Runoff Volume increased from 837,000 ac-ft to 1,123,000 ac-ft
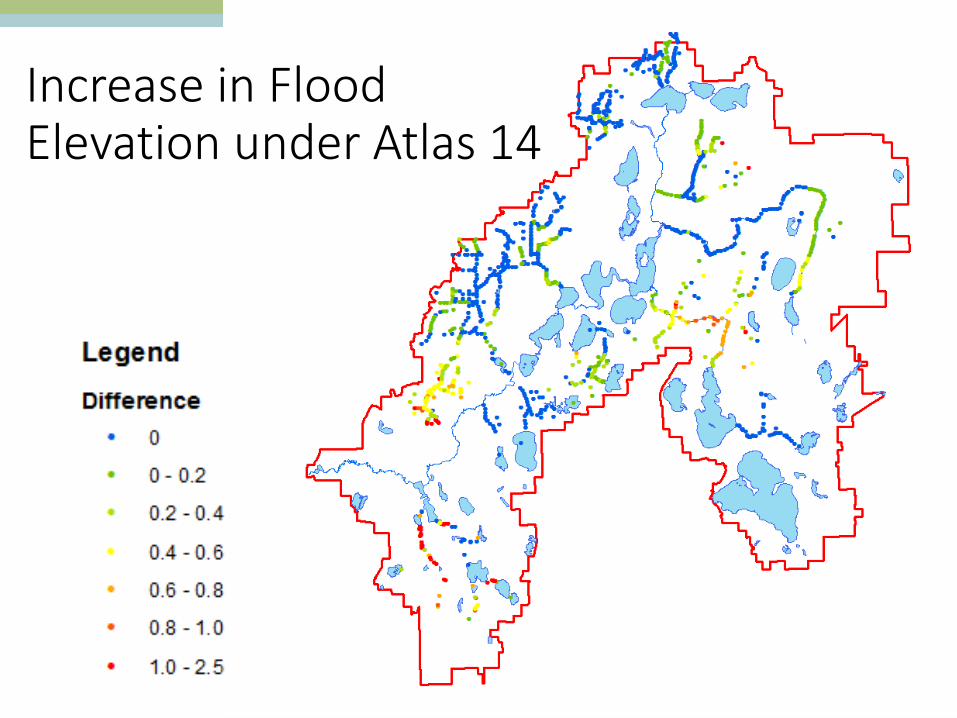
Increase in Flood Elevation under Atlas 14
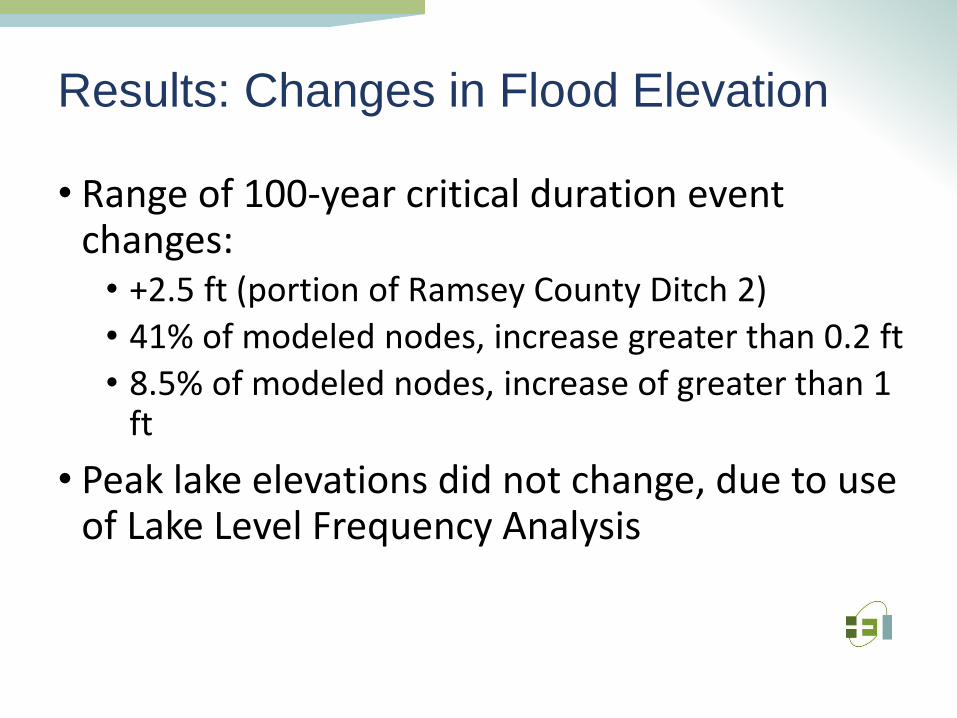
Results: Changes in Flood Elevation
• Range of 100-year critical duration event changes: • +2.5 ft (portion of Ramsey County Ditch 2)
• 41% of modeled nodes, increase greater than 0.2 ft
• 8.5% of modeled nodes, increase of greater than 1 ft
• Peak lake elevations did not change, due to use of Lake Level Frequency Analysis
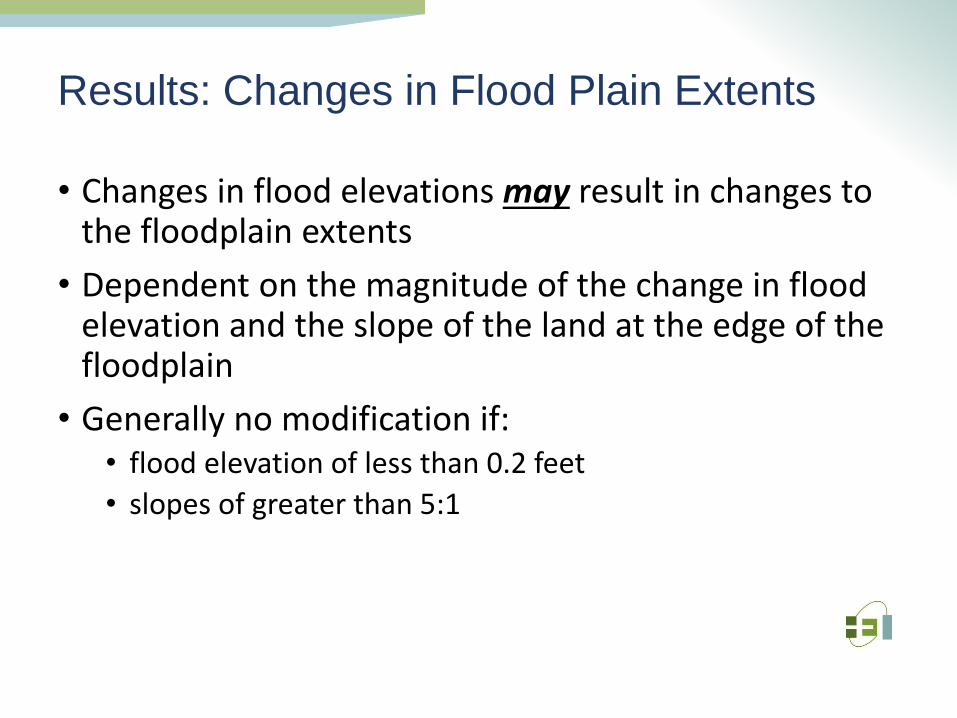
Results: Changes in Flood Plain Extents
• Changes in flood elevations may result in changes to the floodplain extents
• Dependent on the magnitude of the change in flood elevation and the slope of the land at the edge of the floodplain
• Generally no modification if: • flood elevation of less than 0.2 feet
• slopes of greater than 5:1
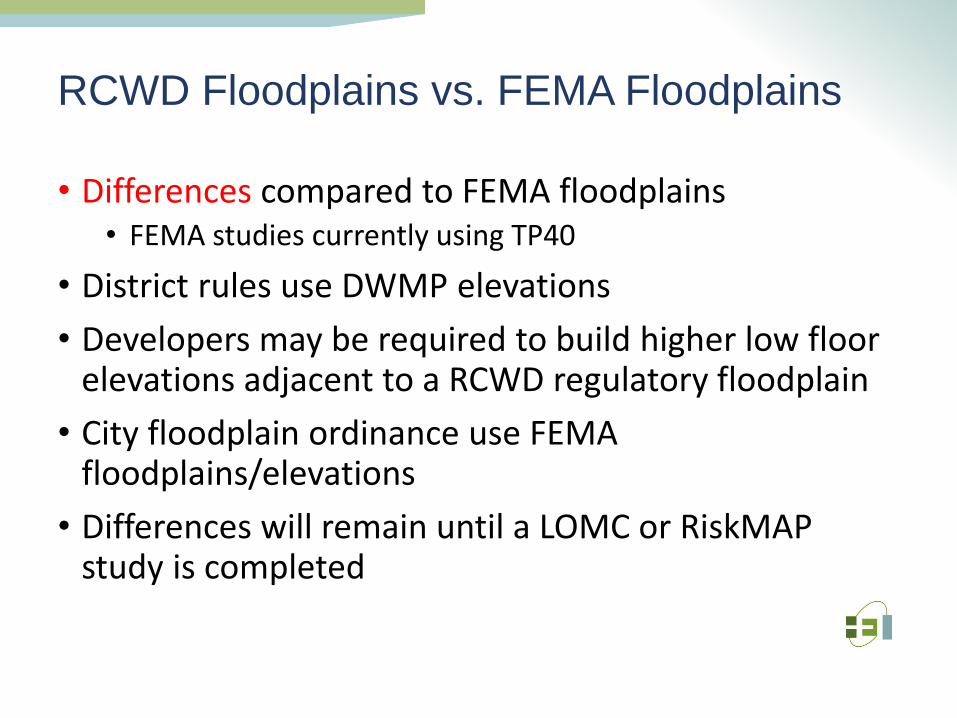
RCWD Floodplains vs. FEMA Floodplains
• Differences compared to FEMA floodplains • FEMA studies currently using TP40
• District rules use DWMP elevations
• Developers may be required to build higher low floor elevations adjacent to a RCWD regulatory floodplain
• City floodplain ordinance use FEMA floodplains/elevations
• Differences will remain until a LOMC or RiskMAP study is completed
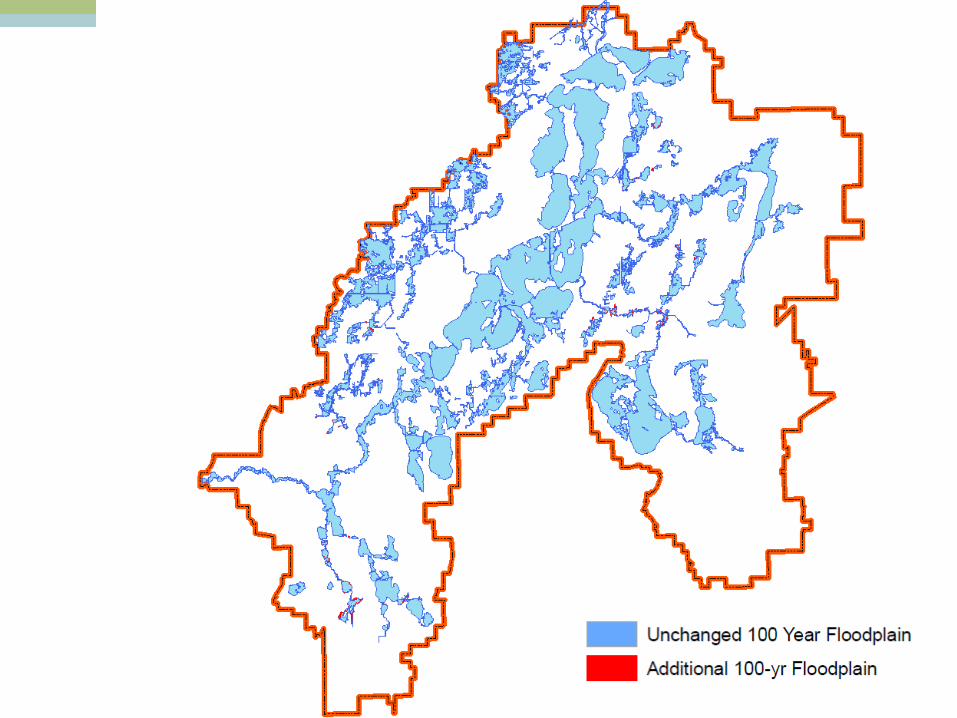
Floodplain Summary
• The more urbanized portions of the District saw the greatest increases
• Utilizing the 10 day snowmelt event previously meant that the changes to the floodplain extents under Atlas 14 were less significant or eliminated
Implications on Permitting
• RCWD rules regulate discharge rates, low floor elevations, and fill in floodplains
• Stakeholder concerns about adopting Atlas 14 and how it could affect development design →$$$$$
• Reviewed affects of Atlas 14 two ways: • Simulated sites
• Historic permits
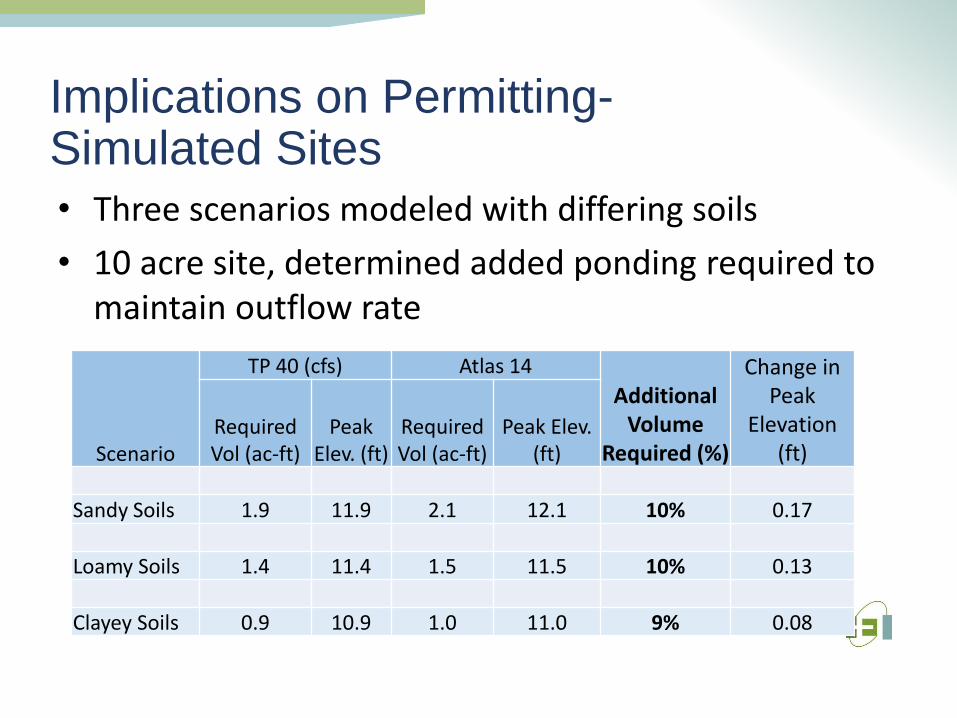
Implications on Permitting- Simulated Sites
Scenario
TP 40 (cfs) Atlas 14
Additional Volume
Required (%)
Change in Peak
Elevation (ft)
Required Vol (ac-ft)
Peak Elev. (ft)
Required Vol (ac-ft)
Peak Elev. (ft)
Sandy Soils 1.9 11.9 2.1 12.1 10% 0.17 Loamy Soils 1.4 11.4 1.5 11.5 10% 0.13 Clayey Soils 0.9 10.9 1.0 11.0 9% 0.08
• Three scenarios modeled with differing soils
• 10 acre site, determined added ponding required to maintain outflow rate
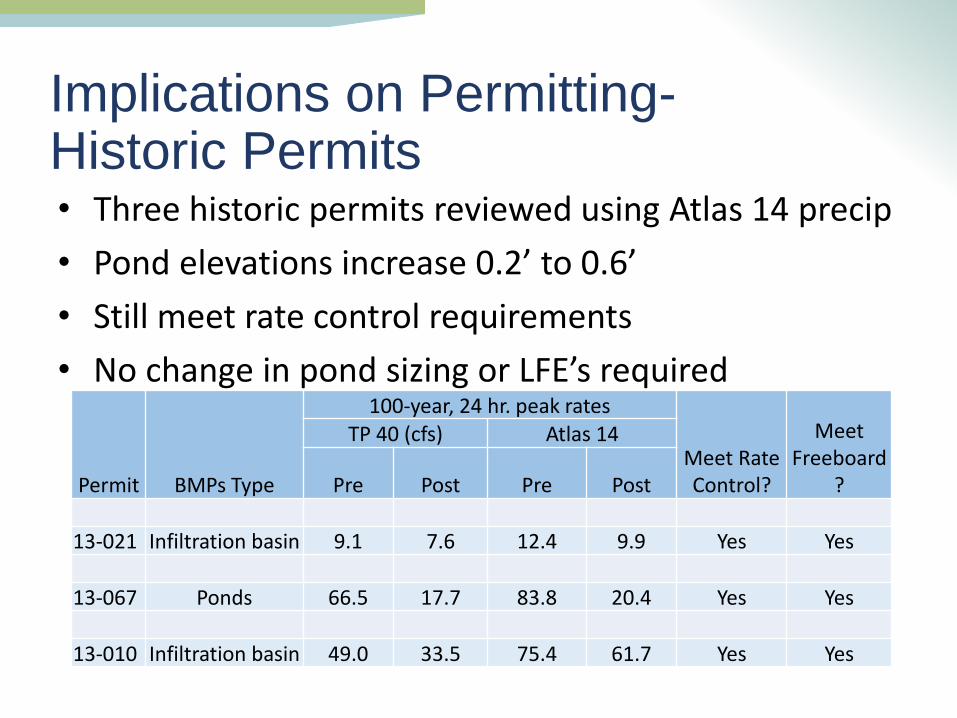
Implications on Permitting- Historic Permits
Permit
BMPs Type
100-year, 24 hr. peak rates
Meet Rate Control?
Meet Freeboard
?
TP 40 (cfs) Atlas 14
Pre Post Pre Post 13-021 Infiltration basin 9.1 7.6 12.4 9.9 Yes Yes 13-067 Ponds 66.5 17.7 83.8 20.4 Yes Yes 13-010 Infiltration basin 49.0 33.5 75.4 61.7 Yes Yes
• Three historic permits reviewed using Atlas 14 precip
• Pond elevations increase 0.2’ to 0.6’
• Still meet rate control requirements
• No change in pond sizing or LFE’s required
Implications on Permitting- Summary
• Will likely not affect rate control requirements
• In some cases, outlet pipes may need to be one-size larger….but not required for most
• Ponds may need to be larger….but most have additional capacity anyway
Implications on Permitting- Summary
• May affect minimum LFE’s in new structures adjacent to BMPs…but likely not a lot
• Will affect LFE’s for some structures near mapped floodplains (only if rainfall is critical event)
• Overall, relatively little change in the cost of development

Thank You.

Potential Pitfalls Regarding Hydrologic Modeling
1. Long Computation Interval
2. Short Design Storm Duration
3. Unrepresentative Unit Hydrograph
4. Uncalibrated Rainfall Runoff Model for Synthetic Events
Potential Pitfalls Regarding Hydrologic Modeling
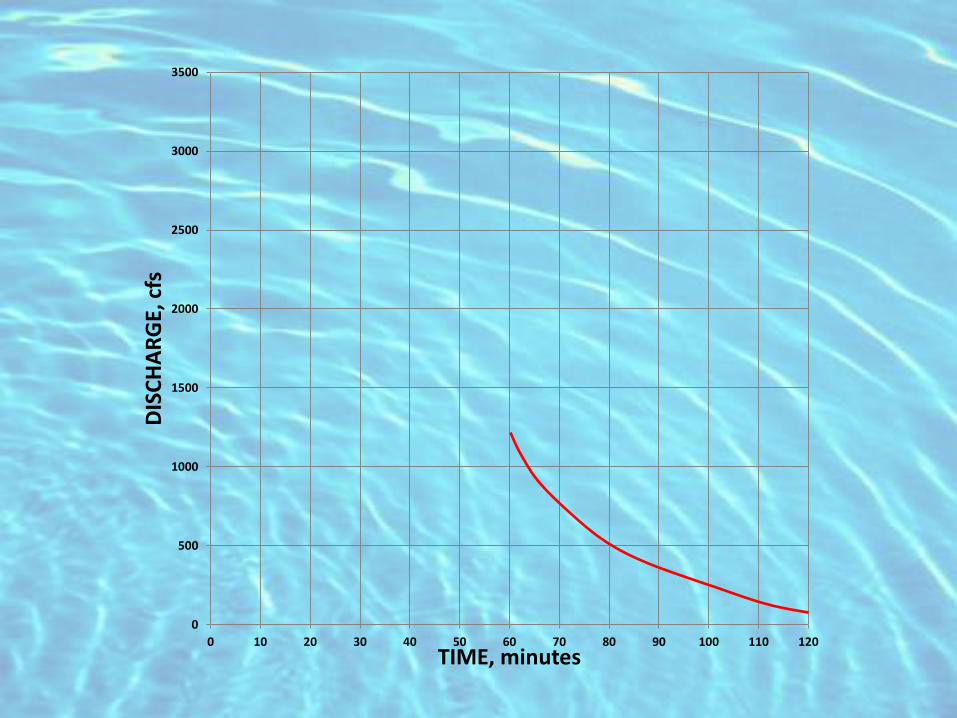
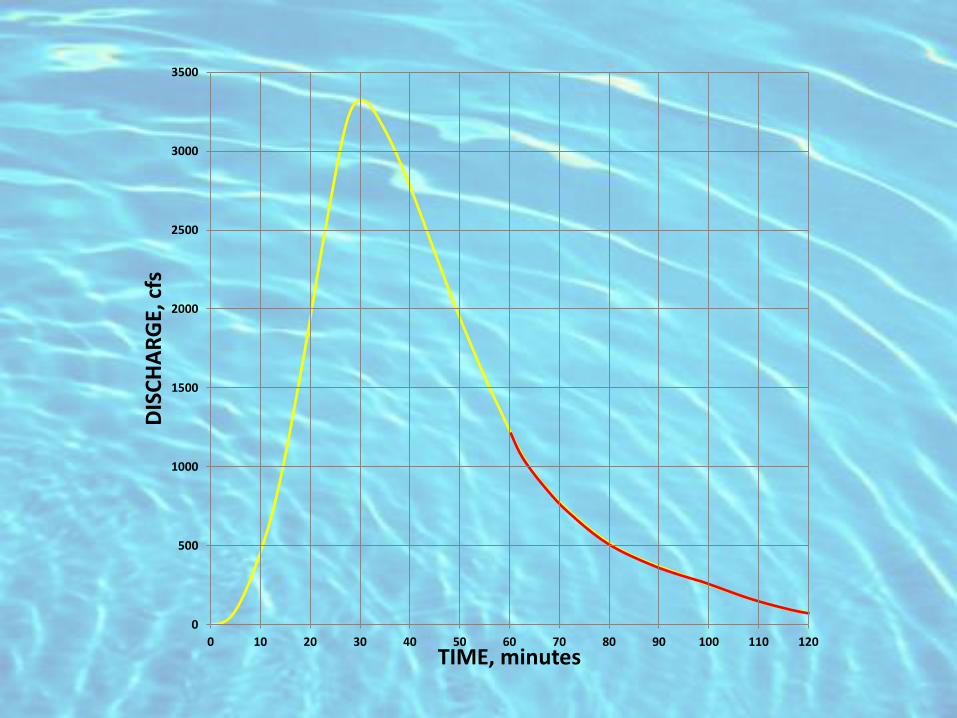
• Must be short enough to depict adequate definition of the peak of the U.H. - from the smallest sub-basin
• This will also determine the duration of UH
• Rule of thumb:
– Δt = 1/3 – 1/7 time of concentration
1. Long Computation Interval
0
500
1000
1500
2000
2500
3000
3500
0 10 20 30 40 50 60 70 80 90 100 110 120
DIS
CH
AR
GE,
cfs
TIME, minutes
0
500
1000
1500
2000
2500
3000
3500
0 10 20 30 40 50 60 70 80 90 100 110 120
DIS
CH
AR
GE,
cfs
TIME, minutes

Convolution

2. Short Design Storm Duration
• Storm Duration must be long enough to contain the “critical
duration”.
• Entire watershed should be contributing runoff to the watershed outlet before the end of storm occurs.
• Larger watersheds may require a duration longer than 24 hr.
• Rule of thumb: ΔD = 2 x watershed tc
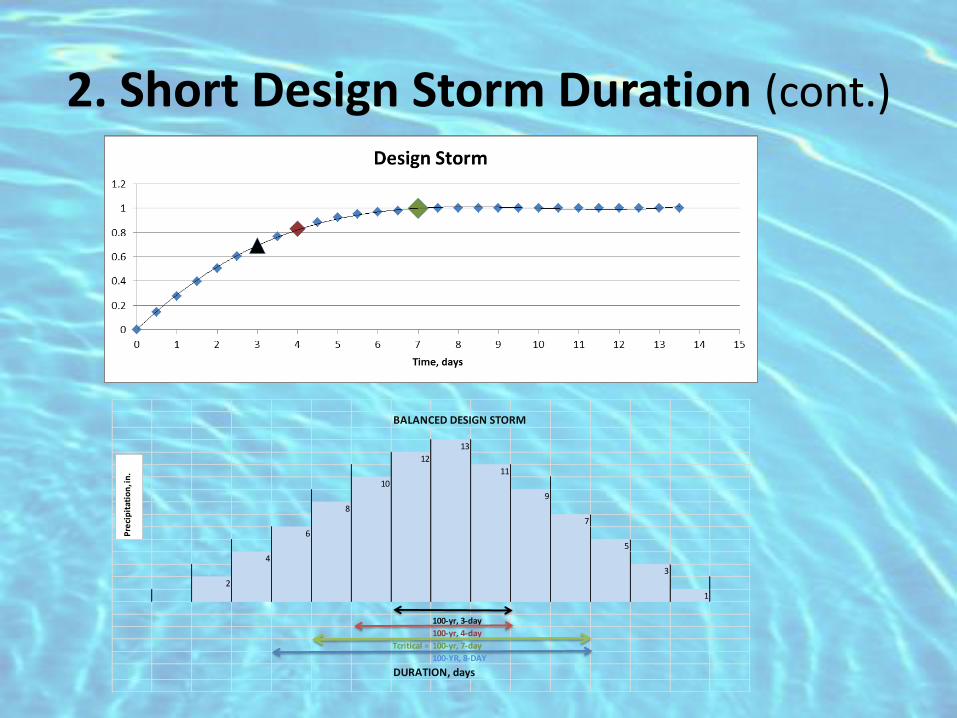
2. Short Design Storm Duration (cont.)
BALANCED DESIGN STORM
13
12
11
10
9
8
7
6
5
4
3
2
1
100-yr, 3-day
100-yr, 4-day
Tcritical = 100-yr, 7-day
100-YR, 8-DAY
DURATION, days
Pre
cip
itat
ion
,in
.
• U.H. should be adopted such that it is representative of that particular watershed and not be a generic or default UH
• An adopted U.H. that is unrepresentative can lead to compound error resulting in confounding error of the total hydrograph at the outlet.
3. Unrepresentative Unit Hydrograph
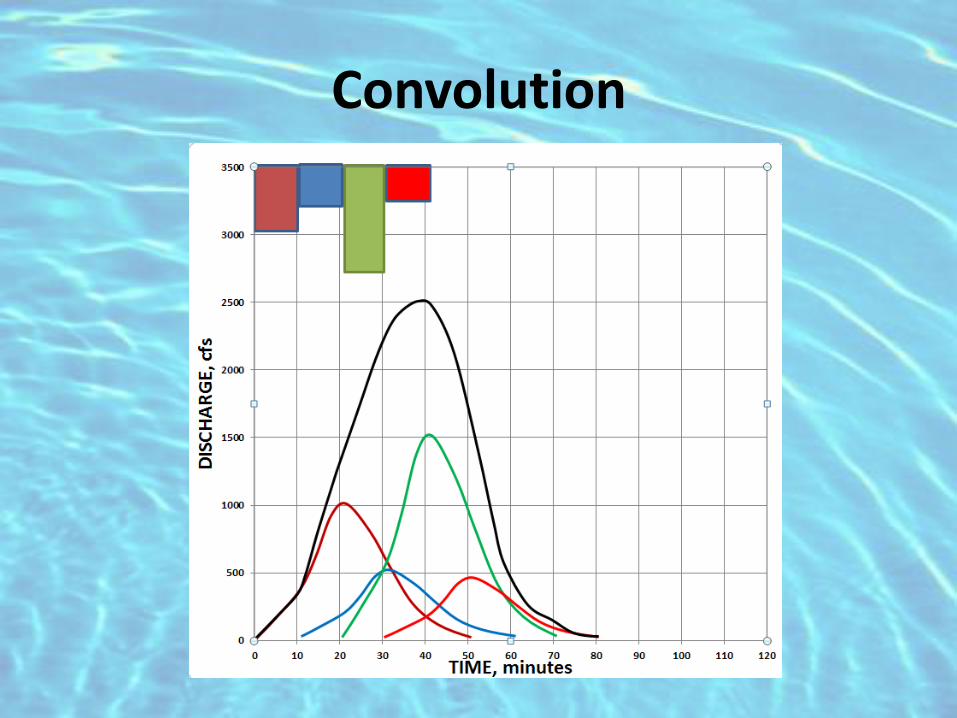
Convolution
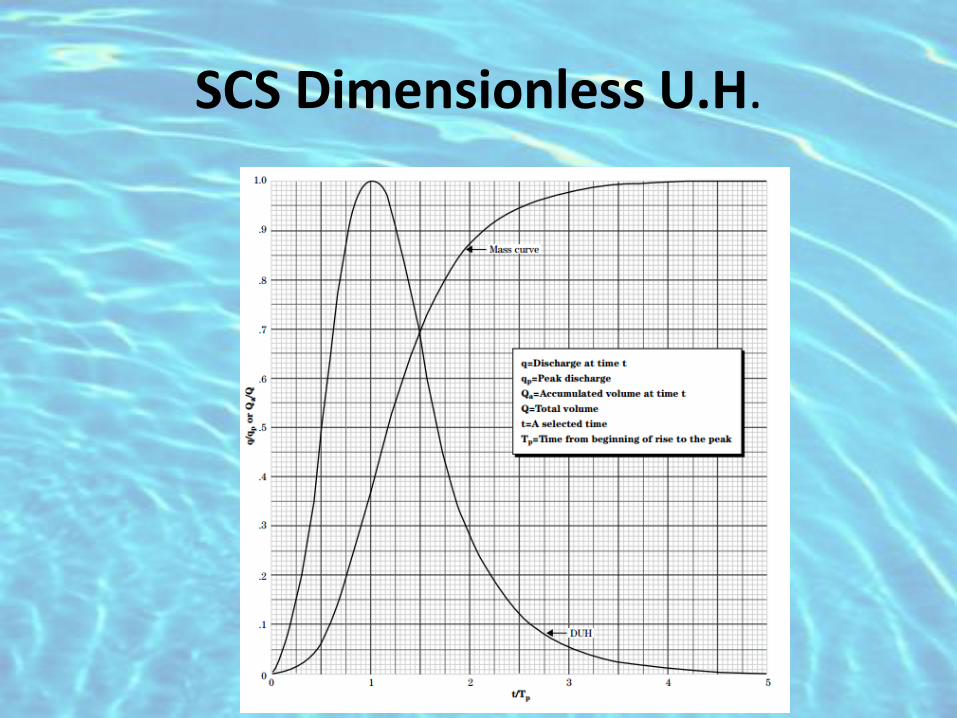
SCS Dimensionless U.H.
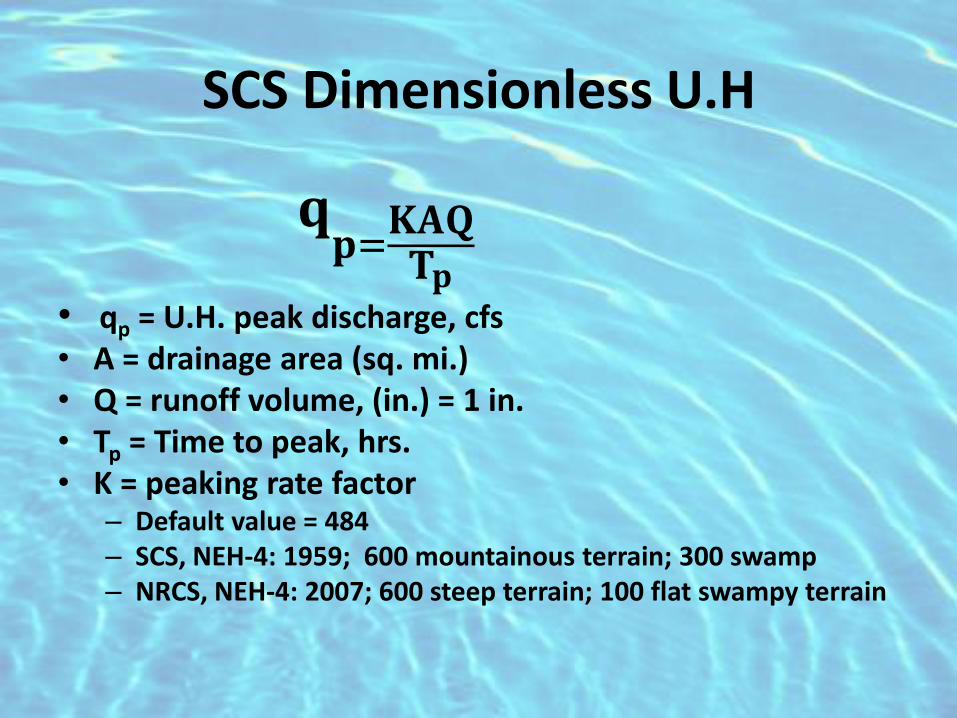
SCS Dimensionless U.H
𝐪𝐩=
𝐊𝐀𝐐𝐓𝐩
• qp = U.H. peak discharge, cfs
• A = drainage area (sq. mi.) • Q = runoff volume, (in.) = 1 in. • Tp = Time to peak, hrs. • K = peaking rate factor
– Default value = 484 – SCS, NEH-4: 1959; 600 mountainous terrain; 300 swamp – NRCS, NEH-4: 2007; 600 steep terrain; 100 flat swampy terrain
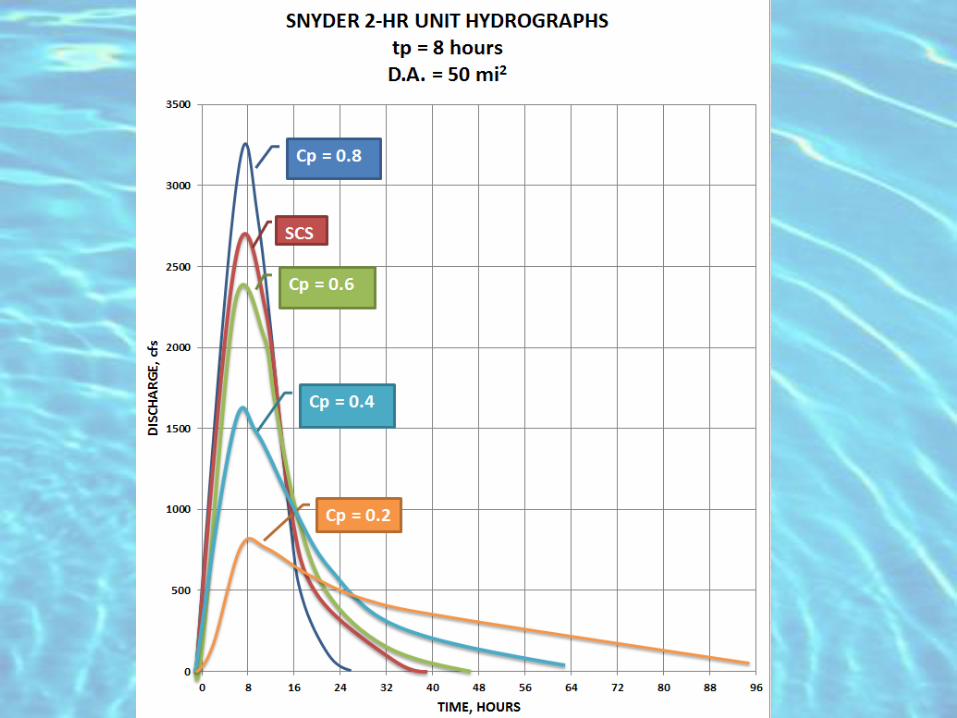
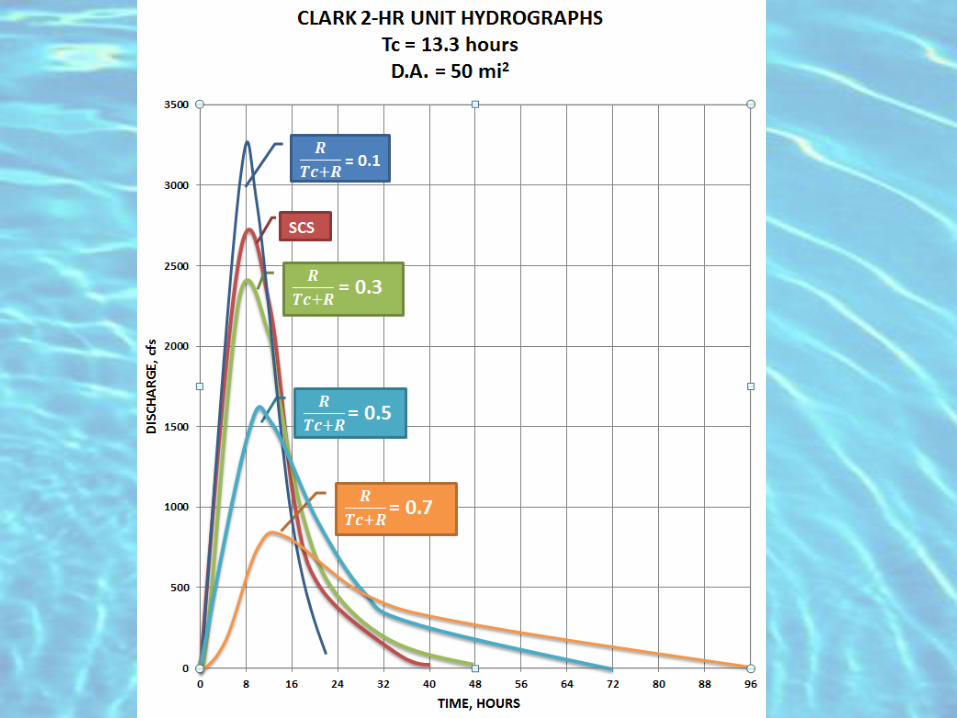
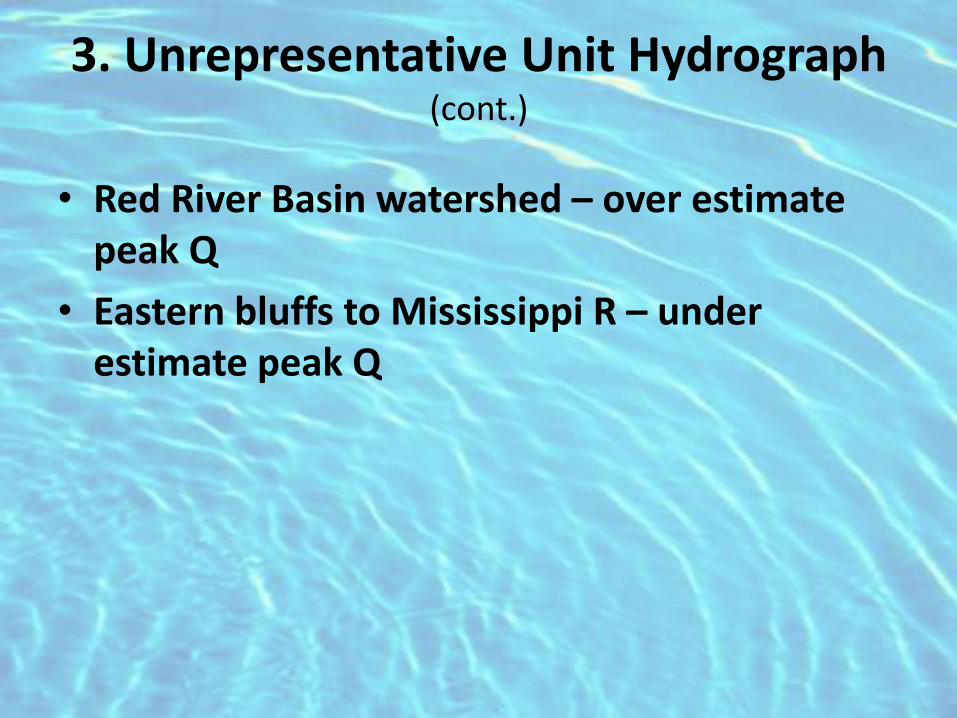
• Red River Basin watershed – over estimate peak Q
• Eastern bluffs to Mississippi R – under estimate peak Q
3. Unrepresentative Unit Hydrograph
(cont.)

Convolution

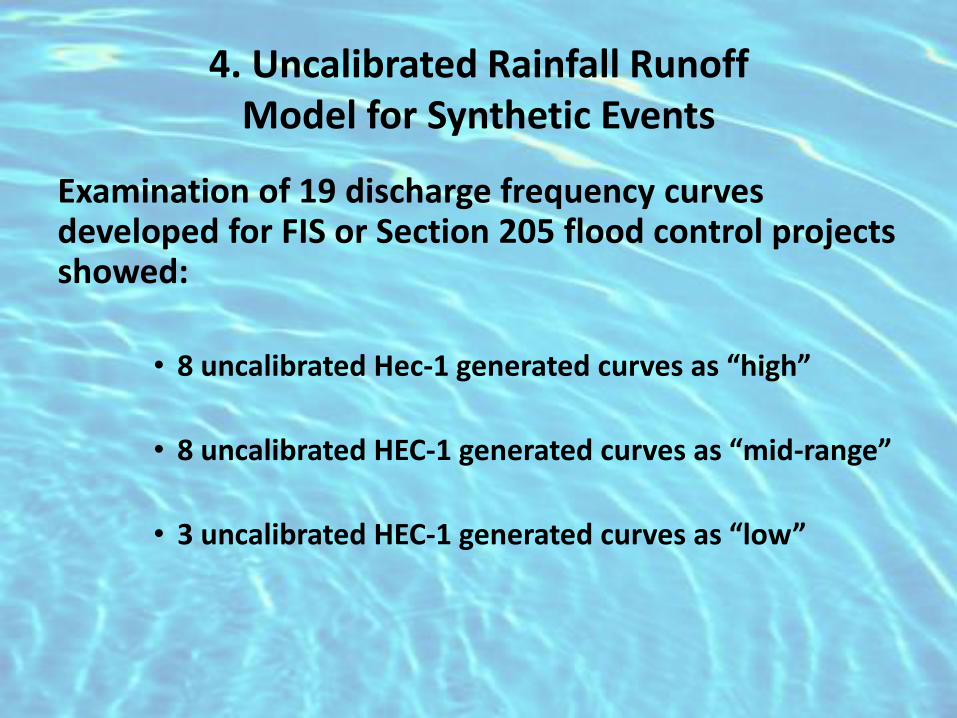
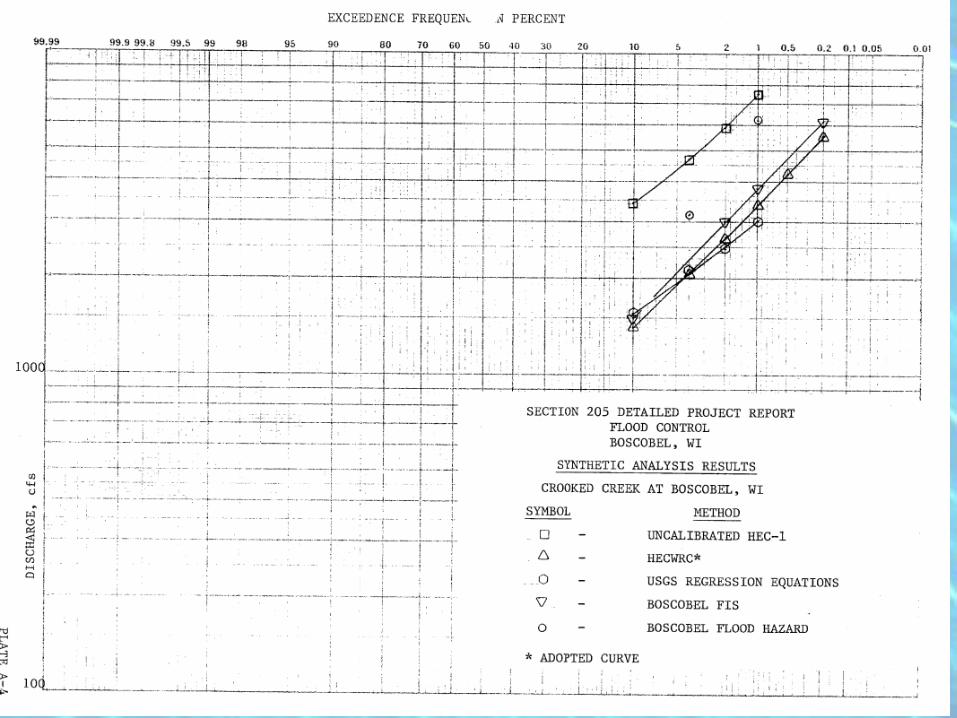
4. Uncalibrated Rainfall Runoff Model for Synthetic Events
Examination of 19 discharge frequency curves developed for FIS or Section 205 flood control projects showed:
• 8 uncalibrated Hec-1 generated curves as “high”
• 8 uncalibrated HEC-1 generated curves as “mid-range”
• 3 uncalibrated HEC-1 generated curves as “low”
4. Uncalibrated Rainfall Runoff Model for Synthetic Events
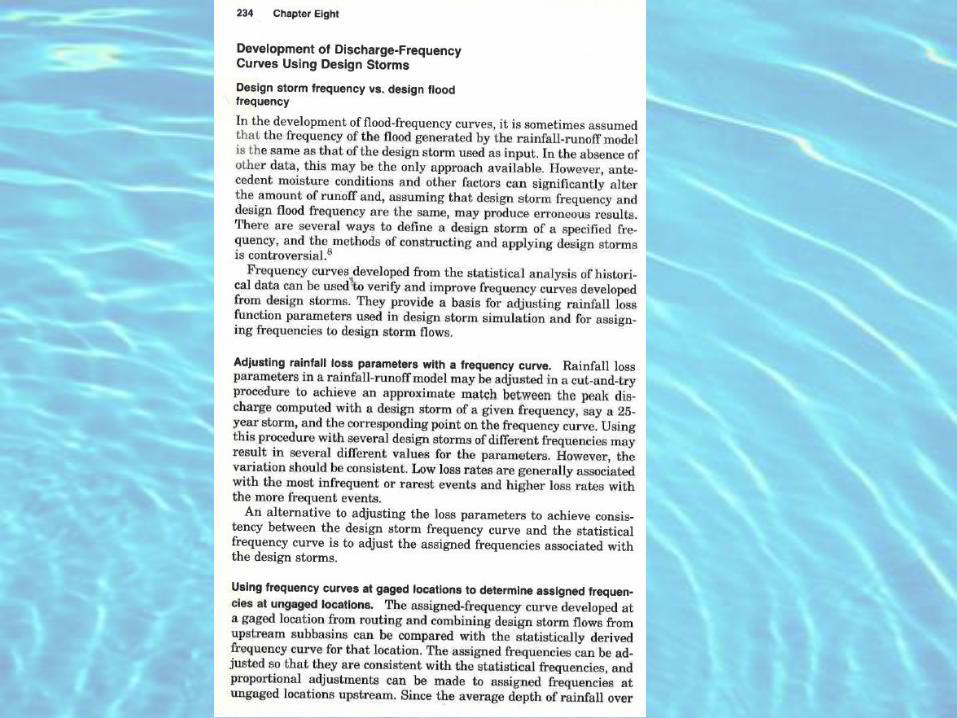
Design Storm Frequency Vs.
Design Flood Frequency
4. Uncalibrated Rainfall Runoff Model for Synthetic Events (CONT.)
• Synthetic storm frequency may not equate to runoff frequency for two main reasons:
Reason #1 Storm Frequency ≠ Flood Frequency
4. Uncalibrated Rainfall Runoff Model for Synthetic Events (CONT.)
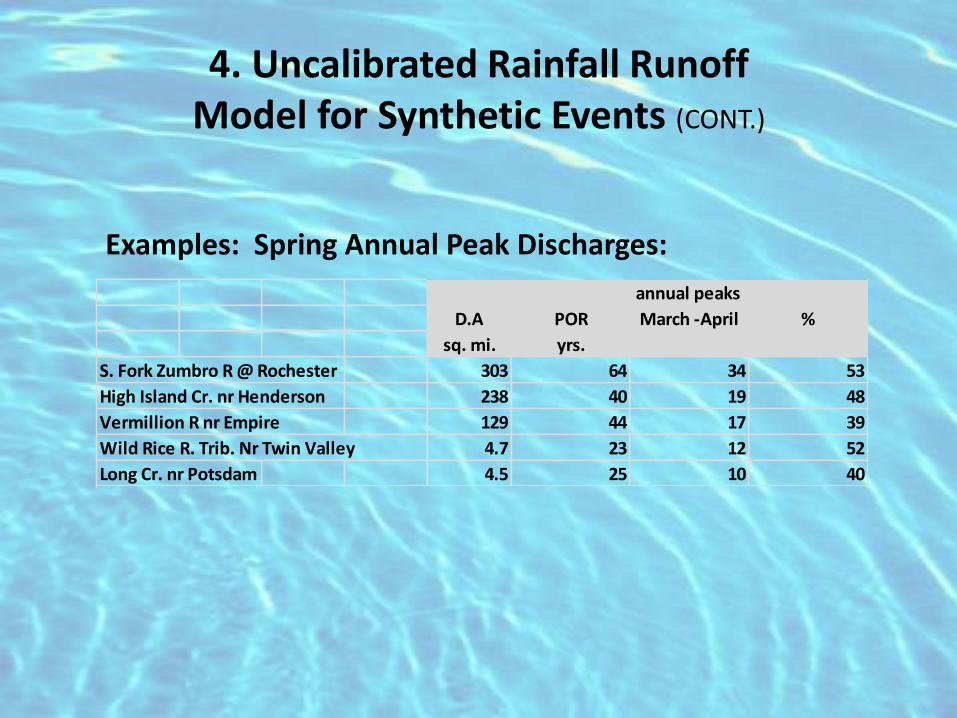
Examples: Spring Annual Peak Discharges:
annual peaks
D.A POR March -April %
sq. mi. yrs.
S. Fork Zumbro R @ Rochester 303 64 34 53
High Island Cr. nr Henderson 238 40 19 48
Vermillion R nr Empire 129 44 17 39
Wild Rice R. Trib. Nr Twin Valley 4.7 23 12 52
Long Cr. nr Potsdam 4.5 25 10 40
Reason #2 Storm Frequency ≠ Flood Frequency
For synthetic or hypothetical events:
Unknown Antecedent Moisture Conditions
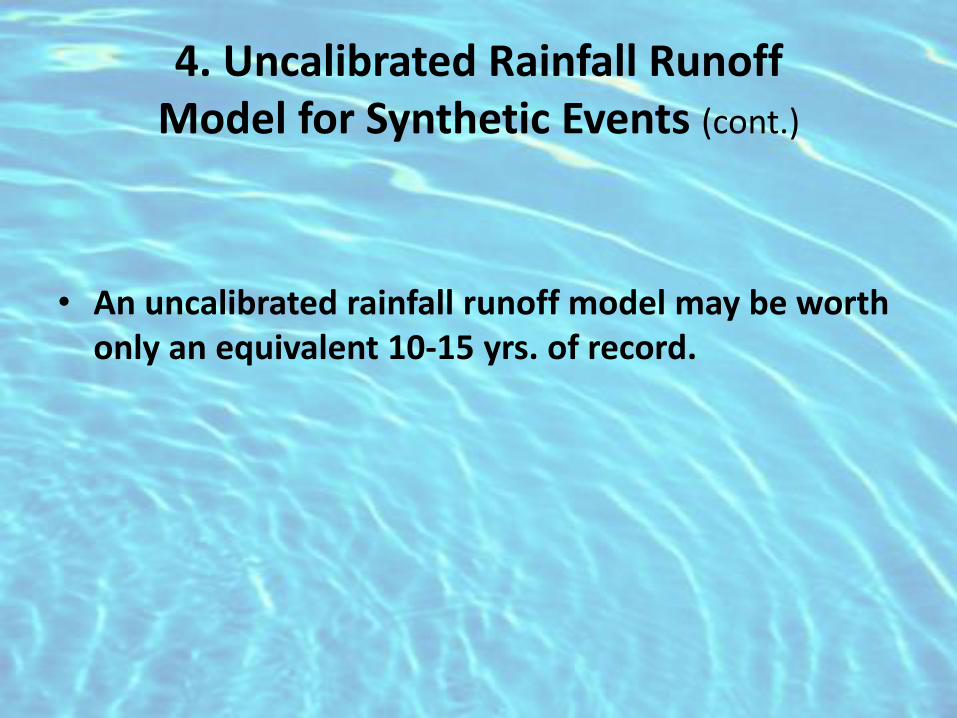
4. Uncalibrated Rainfall Runoff Model for Synthetic Events (cont.)
• An uncalibrated rainfall runoff model may be worth only an equivalent 10-15 yrs. of record.
EM 1110-2-1619 Risk-Based Analysis for Flood
Damage Reduction Studies
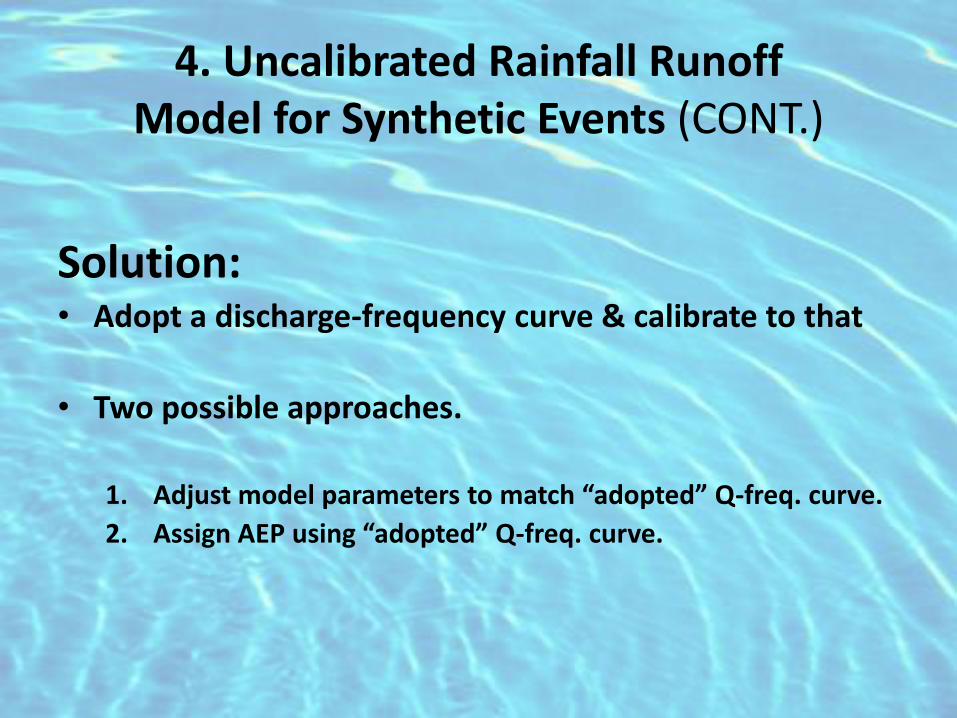
4. Uncalibrated Rainfall Runoff Model for Synthetic Events (CONT.)
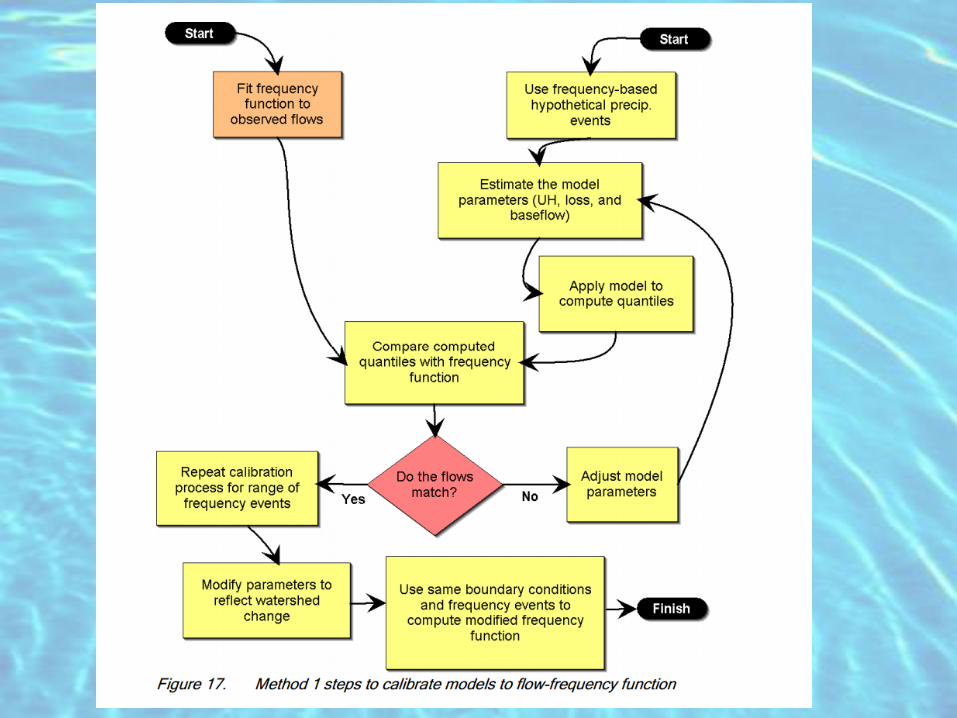
Solution: • Adopt a discharge-frequency curve & calibrate to that
• Two possible approaches.
1. Adjust model parameters to match “adopted” Q-freq. curve.
2. Assign AEP using “adopted” Q-freq. curve.
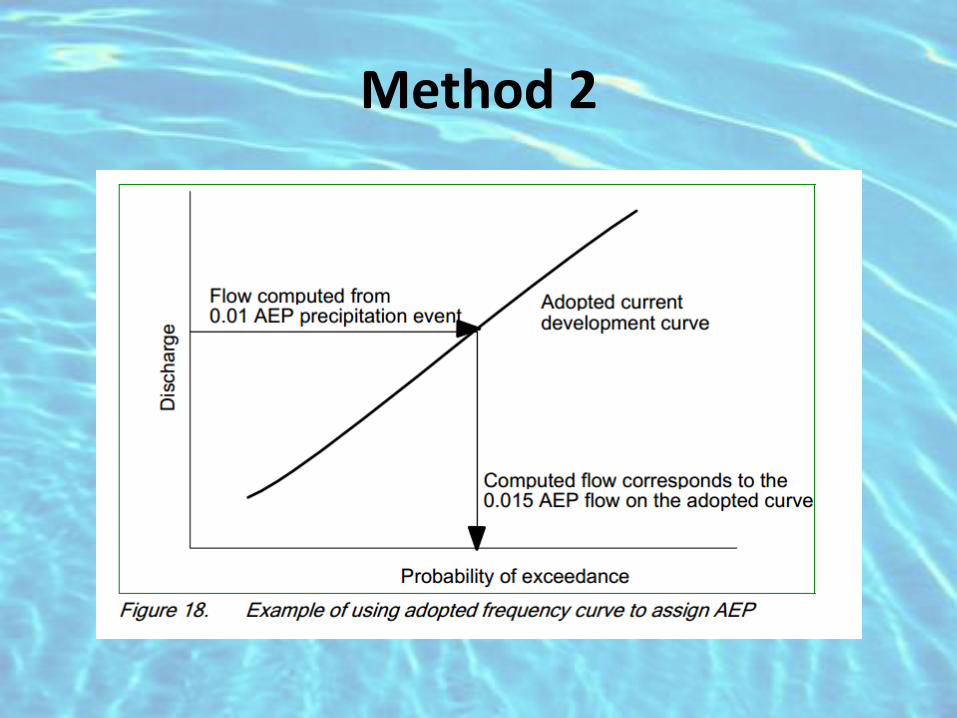
Method 2

TD-15
TD-11
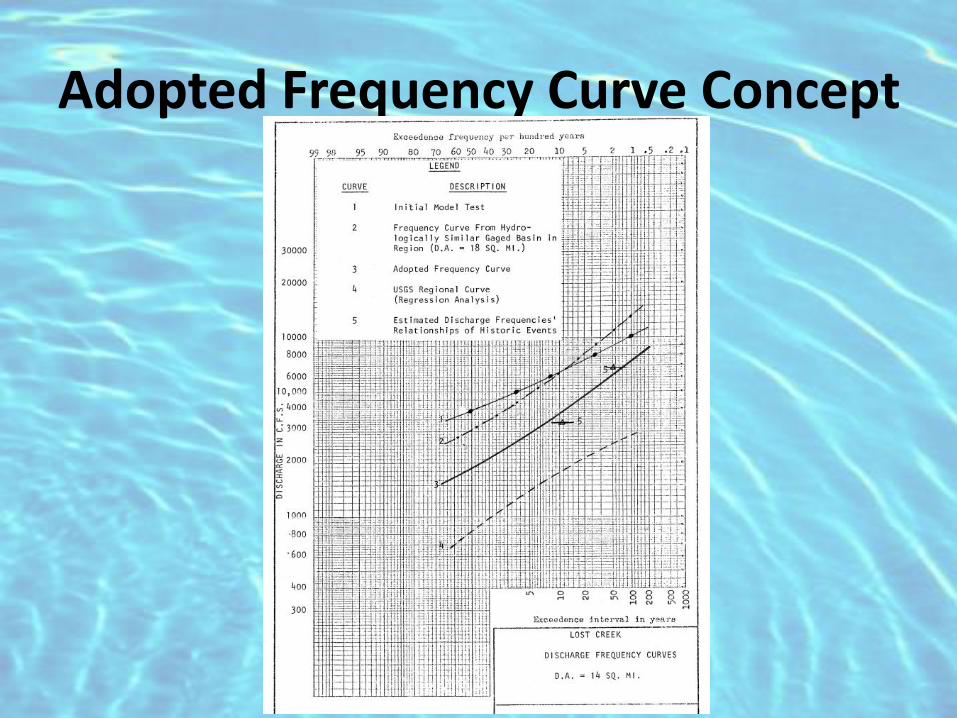
Adopted Frequency Curve Concept


1. Long Computation Interval
2. Short Design Storm Duration
3. Unrepresentative Unit Hydrograph
4. Uncalibrated Rainfall Runoff Model for Synthetic Events
Potential Pitfalls Regarding Hydrologic Modeling
• Extra:
– CST vs. CDT
– End of period
• Rainfall
• storage
Potential Pitfalls Regarding Hydrologic Modeling
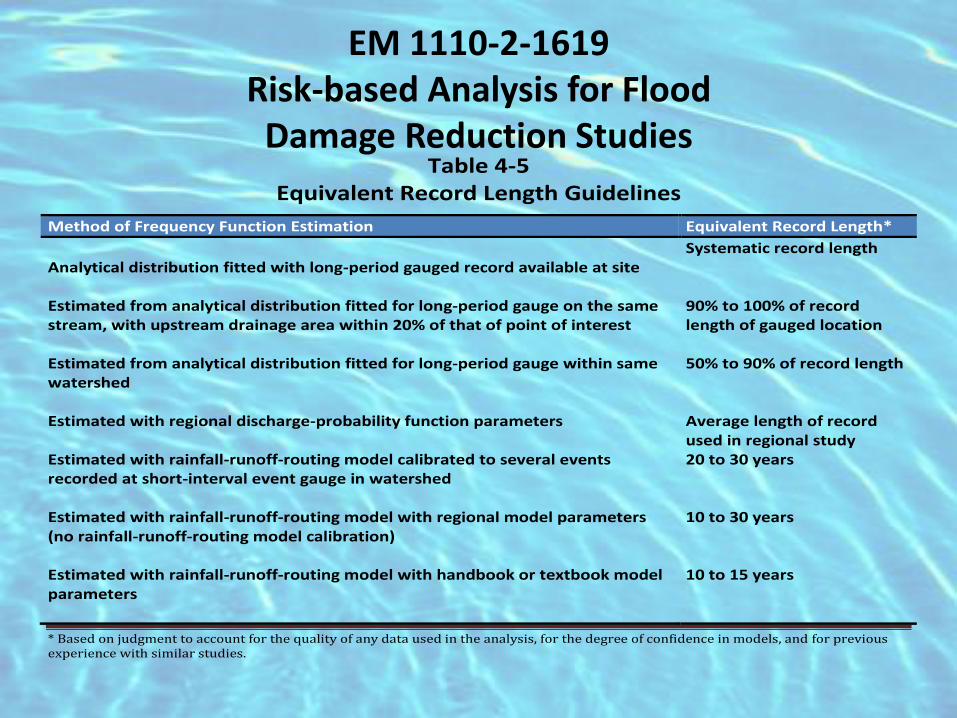
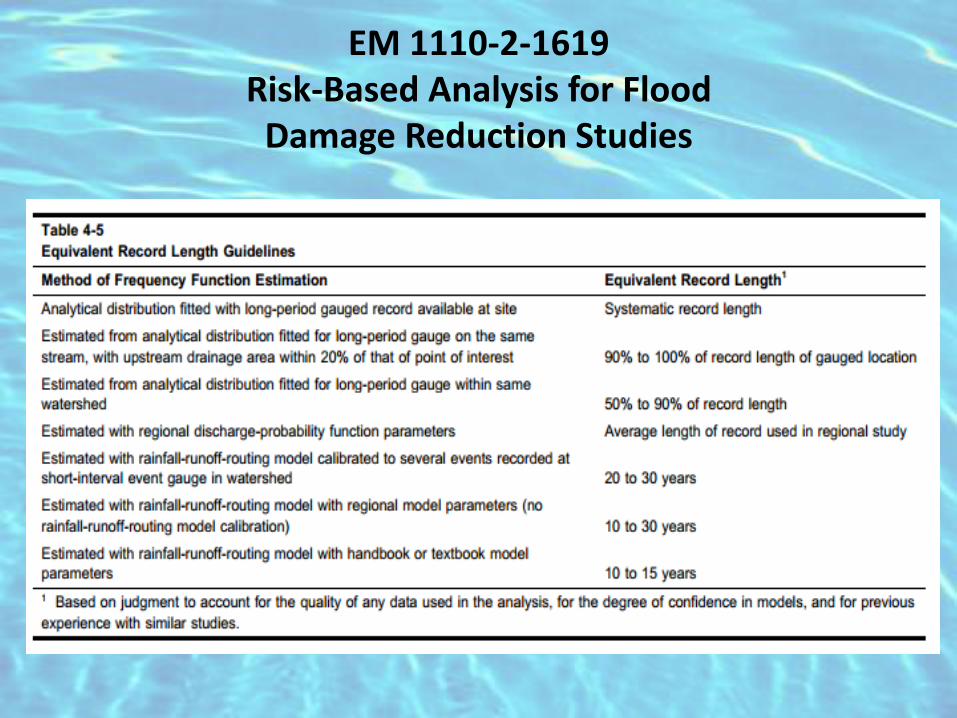
EM 1110-2-1619 Risk-based Analysis for Flood
Damage Reduction Studies
Table 4-5 Equivalent Record Length Guidelines
* Based on judgment to account for the quality of any data used in the analysis, for the degree of confidence in models, and for previous experience with similar studies.
Method of Frequency Function Estimation Equivalent Record Length*
Analytical distribution fitted with long-period gauged record available at site
Systematic record length
Estimated from analytical distribution fitted for long-period gauge on the same stream, with upstream drainage area within 20% of that of point of interest
90% to 100% of record length of gauged location
Estimated from analytical distribution fitted for long-period gauge within same watershed
50% to 90% of record length
Estimated with regional discharge-probability function parameters
Average length of record used in regional study
Estimated with rainfall-runoff-routing model calibrated to several events recorded at short-interval event gauge in watershed
20 to 30 years
Estimated with rainfall-runoff-routing model with regional model parameters (no rainfall-runoff-routing model calibration)
10 to 30 years
Estimated with rainfall-runoff-routing model with handbook or textbook model parameters
10 to 15 years
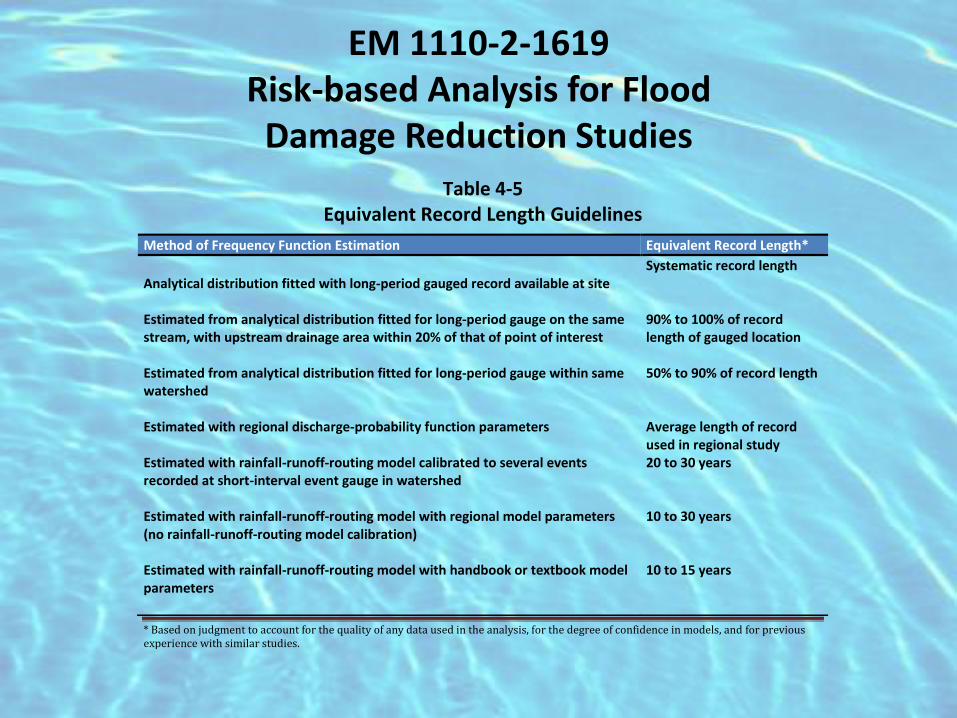
EM 1110-2-1619 Risk-based Analysis for Flood
Damage Reduction Studies Table 4-5
Equivalent Record Length Guidelines
* Based on judgment to account for the quality of any data used in the analysis, for the degree of confidence in models, and for previous experience with similar studies.
Method of Frequency Function Estimation Equivalent Record Length*
Analytical distribution fitted with long-period gauged record available at site
Systematic record length
Estimated from analytical distribution fitted for long-period gauge on the same stream, with upstream drainage area within 20% of that of point of interest
90% to 100% of record length of gauged location
Estimated from analytical distribution fitted for long-period gauge within same watershed
50% to 90% of record length
Estimated with regional discharge-probability function parameters
Average length of record used in regional study
Estimated with rainfall-runoff-routing model calibrated to several events recorded at short-interval event gauge in watershed
20 to 30 years
Estimated with rainfall-runoff-routing model with regional model parameters (no rainfall-runoff-routing model calibration)
10 to 30 years
Estimated with rainfall-runoff-routing model with handbook or textbook model parameters
10 to 15 years